Roadway Geotechnical Engineering Report - … · A direct shear test was performed on an in-situ...
51
Transcript of Roadway Geotechnical Engineering Report - … · A direct shear test was performed on an in-situ...


Roadway Geotechnical Engineering ReportCRAYCROFT RD TI OP STR #594 & #595 ■ Tucson, ArizonaJune 14, 2016 ■ Terracon Project No.: 65155090R1
Resourceful ■ Responsive ■ Reliable
TABLE OF CONTENTS
Page1.0 INTRODUCTION .............................................................................................................12.0 PROJECT INFORMATION .............................................................................................1
2.1 Project Description ...............................................................................................12.2 Site Description ....................................................................................................2
3.0 SUBSURFACE CONDITIONS ........................................................................................23.1 Site Geology ........................................................................................................23.2 Seismic Considerations........................................................................................33.3 Subsurface Soil Conditions ..................................................................................43.4 Field and Laboratory Test Data ............................................................................43.5 Groundwater ........................................................................................................5
4.0 RECOMMENDATIONS FOR DESIGN AND CONSTRUCTION ......................................54.1 Geotechnical Considerations ...............................................................................54.2 Pavement Subgrade Parameters .........................................................................64.3 General Earthwork Considerations.......................................................................74.4 Earthwork Factors and Slopes .............................................................................74.5 Water ...................................................................................................................84.6 Corrosion Potential ..............................................................................................8
5.0 GENERAL COMMENTS .................................................................................................8
Exhibit No.Appendix A – Field Exploration
Site Plan and Boring Locations Diagrams ................................................. A-1 through A-3Field Exploration Description ....................................................................................... A-4General Notes ............................................................................................................. A-5Unified Soil Classification System ................................................................................ A-6Boring Logs ............................................................................................ A-7 through A-18
Appendix B – Laboratory TestingLaboratory Test Description ......................................................................................... B-1Atterberg Limits Results............................................................................................... B-2Grain Size Distribution .................................................................................... B-3 and B-4Moisture-Density Relationship ........................................................................ B-5 and B-6Consolidation Test Results ............................................................................. B-7 and B-8Summary of Laboratory Results .................................................................................. B-9R-Value ................................................................................................ B-10 through B-13Direct Shear ......................................................................................... B-14 through B-19

Resourceful ■ Responsive ■ Reliable 1
ROADWAY GEOTECHNICAL ENGINEERING REPORTCRAYCROFT RD TI OP STR #594 & #595
I-10 Temporary Bridge at Craycroft Road, Tucson, ArizonaADOT TRACS No. 010 PM 267 H8774 01C
Federal Aid Project No.: NHPP-010-E(219)TTerracon Project No. 65155090R1
June 14, 2016
1.0 INTRODUCTION
This report presents the results of our geotechnical engineering services for the proposedInterstate 10 Temporary Bridge at Craycroft Road project in Tucson, Arizona. The purpose ofthese services is to provide information and geotechnical engineering recommendations relativeto the planned improvements. The conclusions and recommendations in this report are basedon the results of field and laboratory testing, experience with similar soil conditions andpavements, and our understanding of the proposed project.
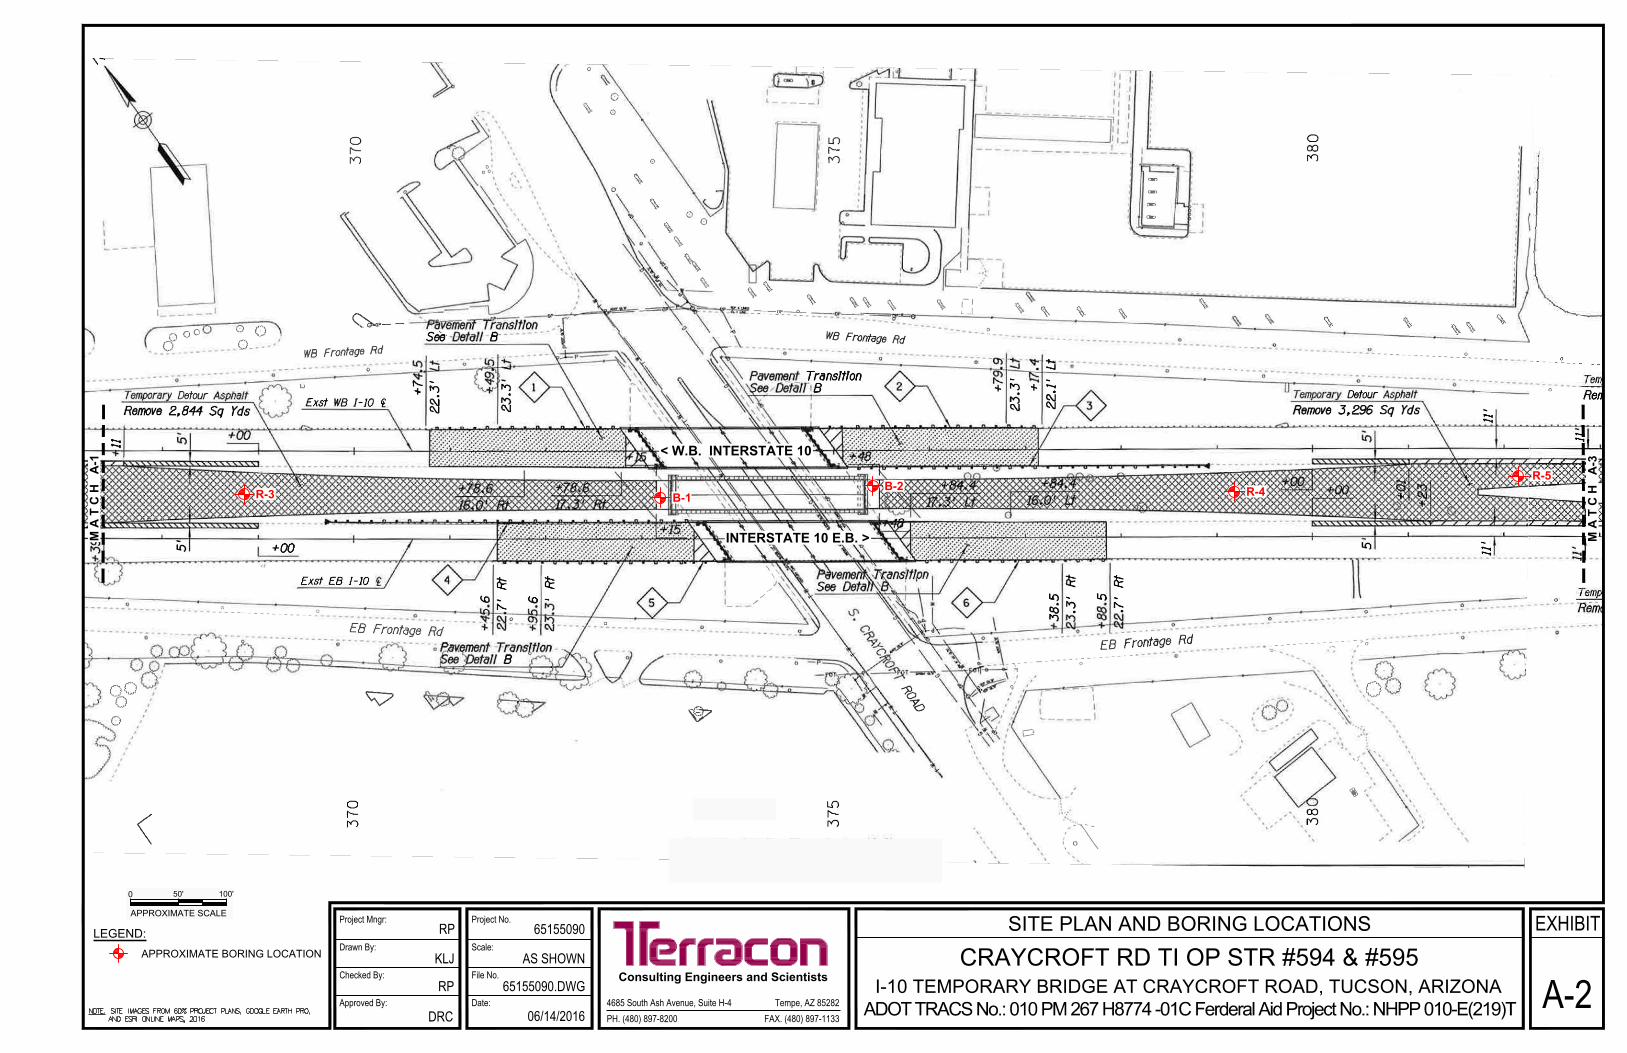
Our geotechnical engineering scope of work for this project included the advancement of eight (8)soil borings, laboratory testing, geotechnical engineering analysis, and preparation of this report.Logs of the borings along with a Site Plan and Boring Locations diagram (Exhibits A-1 through A-3)are included in Appendix A of this report. The results of the laboratory testing performed on soilsamples obtained from the site during the field exploration are included in Appendix B of this report.Descriptions of the field exploration and laboratory testing are included in their respectiveappendices.
2.0 PROJECT INFORMATION
2.1 Project Description
ITEM DESCRIPTION
Project LayoutRefer to the Site Plan and Boring Location Diagrams (Exhibits A-1through A-3, in Appendix A) for the specific locations of each boringwithin the project limits.
Proposed Improvements
The existing I-10 bridges over Craycroft Road will be rehabilitatedand receive new decks. A new single-span temporary bridge will beconstructed in the existing median to facilitate replacement of thebridge decks. Temporary pavement will be placed in the medianleading to the temporary bridge during the construction periodwhich is estimated not to exceed one year in duration.

Roadway Geotechnical Engineering ReportCRAYCROFT RD TI OP STR #594 & #595 ■ Tucson, ArizonaJune 14, 2016 ■ Terracon Project No.: 65155090R1
Resourceful ■ Responsive ■ Reliable 2
ITEM DESCRIPTION
Pavements
Asphalt concrete pavement is anticipated for the temporary detoursin the median. The mainline may be raised up to about 4 inchesand tapered back over a distance of about 150 feet and mayinclude minor widening. It is expected that new mainline wideningpavements will match the existing mainline pavement thickness.
2.2 Site Description
ITEM DESCRIPTION
Location The project site is located at the intersection of I-10 and CraycroftRoad in Tucson, Arizona.
Existing Site Features
The project site includes the existing I-10 Craycroft Road TI OP EB& WB Structures Nos. 594 & 595. Embankment fills elevate the I-10 EB & WB travel lanes to the TI OP bridge structures overCraycroft Road. Based on information provided, we understand theembankment slope between the TI OP bridge structures slopesdown to Craycroft Road at slope of 1.5H:1V (horizontal to vertical).The site is surrounded by existing commercial developments.
Current Ground Cover
At the location of the planned temporary bridge abutments, theground consists of exposed embankment soil with some sparsevegetation; and the slope down to Craycroft had a thin (1- to 2-inchthick) grout or concrete cover for erosion control. A mature treewas observed near the area of proposed Abutment 2.
Existing Topography
At the location of the planned temporary bridge abutments, theembankment ground surface slopes down to Craycroft Roadbetween the existing bridge structures; and as the embankmentground surface extends away from Craycroft Road, the groundsurface is generally sloped down towards the I-10 centerlineforming a v-ditch between the existing travel lanes.
3.0 SUBSURFACE CONDITIONS
3.1 Site Geology
The project area is located in the Basin and Range physiographic province (1Cooley, 1967) ofthe North American Cordillera (2Stern, et al, 1979) of the southwestern United States. Thesouthern portion of the Basin and Range province is situated along the southwestern flank ofthe Colorado Plateau and is bounded by the Sierra Nevada Mountains to the west. Formed
1 Cooley, M.E., 1967, Arizona Highway Geologic Map, Arizona Geological Society.2 Stern, C.W., et al, 1979, Geological Evolution of North America, John Wiley & Sons, Santa Barbara, California.
Roadway Geotechnical Engineering ReportCRAYCROFT RD TI OP STR #594 & #595 ■ Tucson, ArizonaJune 14, 2016 ■ Terracon Project No.: 65155090R1
Resourceful ■ Responsive ■ Reliable 3
during middle and late Tertiary time (100 to 15 million years ago), the Basin and Range provinceis dominated by fault controlled topography. The topography consists of mountain ranges andrelatively flat alluviated valleys. These mountain ranges and valleys have evolved fromgenerally complex movements and associated erosional and depositional processes.
Surficial geologic conditions mapped at the site (3Richard, et al, 2000) consist of Quaternarysurficial deposits. This unit is described as unconsolidated to strongly consolidated alluvial andeolian deposits. This unit includes: coarse, poorly sorted alluvial fan and terrace deposits onmiddle and upper piedmonts and along large drainages; sand, silt and clay on alluvial plains andplayas; and wind-blown sand deposits.
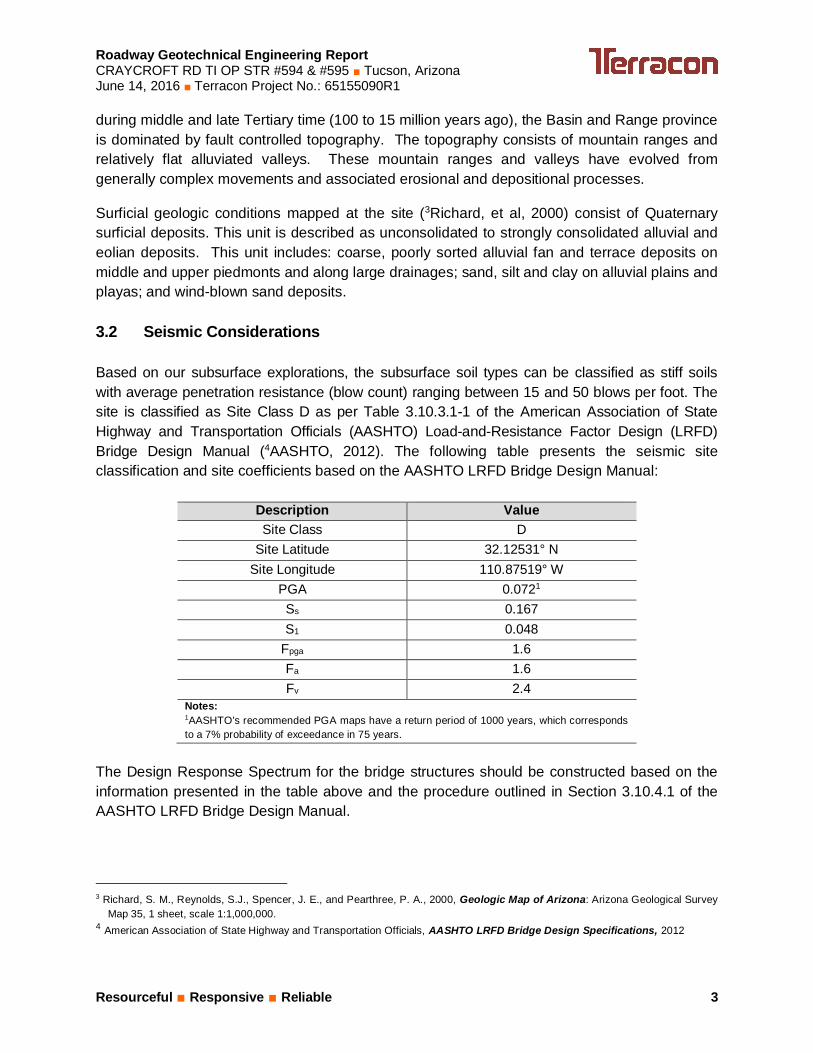
3.2 Seismic Considerations
Based on our subsurface explorations, the subsurface soil types can be classified as stiff soilswith average penetration resistance (blow count) ranging between 15 and 50 blows per foot. Thesite is classified as Site Class D as per Table 3.10.3.1-1 of the American Association of StateHighway and Transportation Officials (AASHTO) Load-and-Resistance Factor Design (LRFD)Bridge Design Manual (4AASHTO, 2012). The following table presents the seismic siteclassification and site coefficients based on the AASHTO LRFD Bridge Design Manual:
Description ValueSite Class D
Site Latitude 32.12531° NSite Longitude 110.87519° W
PGA 0.0721
Ss 0.167S1 0.048
Fpga 1.6Fa 1.6Fv 2.4
Notes:1AASHTO’s recommended PGA maps have a return period of 1000 years, which correspondsto a 7% probability of exceedance in 75 years.
The Design Response Spectrum for the bridge structures should be constructed based on theinformation presented in the table above and the procedure outlined in Section 3.10.4.1 of theAASHTO LRFD Bridge Design Manual.
3 Richard, S. M., Reynolds, S.J., Spencer, J. E., and Pearthree, P. A., 2000, Geologic Map of Arizona: Arizona Geological SurveyMap 35, 1 sheet, scale 1:1,000,000.
4 American Association of State Highway and Transportation Officials, AASHTO LRFD Bridge Design Specifications, 2012

Roadway Geotechnical Engineering ReportCRAYCROFT RD TI OP STR #594 & #595 ■ Tucson, ArizonaJune 14, 2016 ■ Terracon Project No.: 65155090R1
Resourceful ■ Responsive ■ Reliable 4
3.3 Subsurface Soil Conditions
Specific conditions encountered at each boring location are indicated on the individual boring logsincluded in Appendix A of this report. Stratification boundaries on the boring logs represent theapproximate location of changes in soil types; in-situ, the transition between materials may begradual.
The results of the field and laboratory testing indicated similar subsurface conditions and similarengineering characteristics at the boring locations. Therefore, subsurface conditions on theproject site can be generalized as follows:
DescriptionApproximate
Depth to Bottomof Stratum (feet)
Material Encountered Relative Density /Consistency
Stratum 1 3.5 to 24 EMBANKMENT FILL: Clayey Sand Medium Dense to Dense
Stratum 2 27 to 28 Clayey Sand or Sandy Lean Clay Dense / Very Stiff
Stratum 3 42 to 43 Silty Sand Medium Dense to Dense
Stratum 4 55 (Maximumdepth explored) Clayey Sand or Sandy Lean Clay Medium dense to Dense
/ Very Stiff
3.4 Field and Laboratory Test Data
Laboratory tests were conducted on selected soil samples and the test results are presented inAppendix B. The following is a summary of laboratory testing performed for the project.
The Atterberg limits test results of the near surface embankment fill clayey sand soils exhibitmedium plasticity characteristics (with plastic limits of 14 and 25). The gradation test results ofthe near surface embankment fill clayey sand soils indicate these soils contain percent fines(percent passing the sieve No. 200) ranging from approximately 21 to 42 percent, percent sandranged from approximately 47 to 59 percent, and percent gravel ranged from about 5 to 32percent.
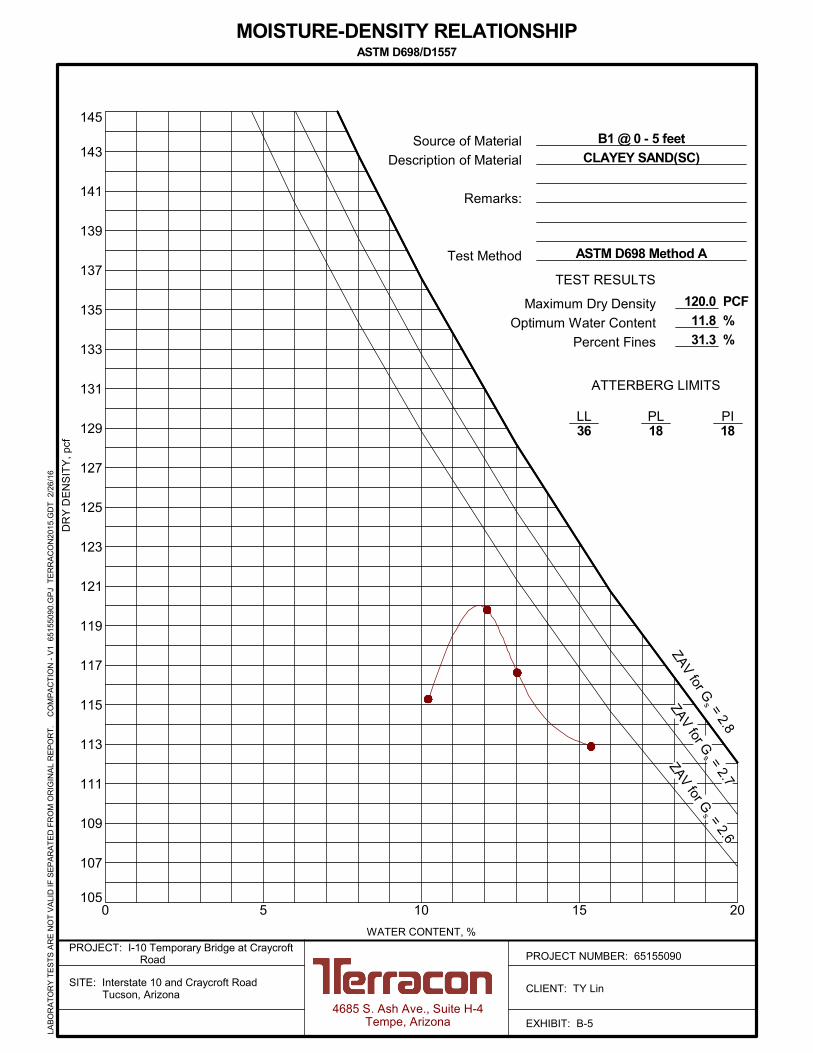
Testing of selected samples obtained from the borings at depths within the embankment fillclayey sand soils (upper 22 to 24 feet) indicated in-situ moisture contents ranging fromapproximately 5 to 9 percent with an average of approximately 7 percent; and in-situ drydensities ranging from approximately 95 to 121 pounds per cubic foot (pcf) with an average ofapproximately 113 pcf. Standard Proctor (ASTM D698) test results indicated maximum drydensities of the site embankment fill clayey sand soils range from approximately 116.9 to 120.0pounds per cubic foot (pcf) at optimum moisture contents ranging from approximately 11.8 to13.5 percent. Testing of selected samples obtained from the borings at depths underlying theembankment fill soils indicated in-situ moisture contents ranging from approximately 2 to 16

Roadway Geotechnical Engineering ReportCRAYCROFT RD TI OP STR #594 & #595 ■ Tucson, ArizonaJune 14, 2016 ■ Terracon Project No.: 65155090R1
Resourceful ■ Responsive ■ Reliable 5
percent with an average of approximately 8 percent; and in-situ dry densities ranging fromapproximately 110 to 115 pounds per cubic foot (pcf) with an average of approximately 112 pcf.
In-situ samples of embankment fill soils tested for consolidation and response to wettingexhibited low hydro-compaction (collapse) potential when wetted while supporting typicalfoundation pressures. The percent collapse on the samples tested was less than 1 percent.
A direct shear test was performed on an in-situ sample obtained from Boring B1 at a depthbetween 9 and 10 feet below the existing ground surface. The direct shear test results of the in-situ sample indicated a soil friction angle of approximately 62 degrees and a cohesion value ofapproximately 216 pounds per square foot (psf). There test results were inconsistent with thetype of soils encountered; therefore, the direct shear test results from the in-situ sample wereexcluded from our analyses. Subsequently, two additional direct shear tests, one for eachabutment, were performed by compositing samples obtained from the embankment soils andremolding the samples to approximately 95 percent compaction at 2 percent below optimum.Both direct shear test results of the remolded samples indicated a soil friction angle ofapproximately 38 degrees and a cohesion value of approximately 1,500 pounds per square foot(psf).
3.5 Groundwater
Groundwater was not observed in any of the test borings at the time of the field exploration norwhen checked immediately upon completion of drilling. These observations representgroundwater conditions at the time of the field exploration and may not be indicative of othertimes, or at other locations. Groundwater conditions can change with varying seasonal andweather conditions, and other factors.
Based on information obtained from the Arizona Department of Water Resources –Groundwater Data website, the depth to groundwater was measured in February 2012 atapproximately 234 feet below the ground surface (approximate elevation of 2,487 feet abovemean sea level) at an Arizona Department of Water Resources (ADWR) monitored well site(Local I.D.: D-15-14 13CBC) located approximately 500 feet southeast of the site.
4.0 RECOMMENDATIONS FOR DESIGN AND CONSTRUCTION
4.1 Geotechnical Considerations
Geotechnical engineering recommendations for design and construction of earth connectedphases of the project are outlined below. The recommendations contained in this report arebased upon the results of the test borings performed by Terracon (which are presented inAppendix A) and laboratory testing (which is presented in Appendix B), engineering analyses,and our current understanding of the proposed project. Geotechnical engineering analyses and

Roadway Geotechnical Engineering ReportCRAYCROFT RD TI OP STR #594 & #595 ■ Tucson, ArizonaJune 14, 2016 ■ Terracon Project No.: 65155090R1
Resourceful ■ Responsive ■ Reliable 6
recommendations specifically for the temporary bridge abutment foundations are provided in ourStructures Geotechnical Engineering Report submitted under separate cover.
The geotechnical issues associated with construction of this project as addressed in this reportinclude:
Subgrade Support: The recommended resilient modulus for use in design ofpavements is presented in Section 4.2.General Earthwork Recommendations: The placement of the embankment materialsshould be comprised of select granular materials and placed in accordance with ADOTrequirements. These recommendations are outlined in Section 4.3.
4.2 Pavement Subgrade Parameters
The laboratory test data was used to establish one mean R-Value for pavement design withinthe project limits. The data indicates the existing subgrade soils at the site have relatively poorsupport characteristics for the planned pavement sections.
For purposes of pavement subgrade evaluation, the results of the laboratory testing, includingcorrelated and tested R-Values, in accordance with the ADOT Preliminary Engineering andDesign Manual (PEDM) are summarized in the following table:
SUMMARY OF TESTED AND CORRELATED R-VALUES
Boring Approx. Station; Offset Depth(ft.) LL PI -#200 R-Value
TestedR-Value
CorrelatedB-1 I-10 EB 373+30;40’L± 0-5 36 18 31 32B-2 I-10 EB 375+30;60’L± 0-5 34 16 33 34R-1 I-10 EB 361+40; 20’L± 0-3.5 34 17 31 16 33R-2 I-10 WB 366+20; 20’R± 0-4 34 17 31 --- 33R-3 I-10 EB 368+90; 45’L± 0-4 38 22 33 15 27R-4 I-10 EB 379+20;45’L± 0-4 42 25 42 13 21R-5 I-10 WB 382+10; 20’R± 0-5 39 22 31 --- 28R-6 I-10 EB 386+20; 20’L± 0-4 34 14 21 28 43
Count 4 8Average 18.0 31.5
Standard Deviation 6.8 6.5Rmean 27.2
The calculated mean R-Value for the project is 27; however, we recommend an R-value of 20be used for design purposes. The corresponding resilient modulus is 8,819 pounds per squareinch (psi) for a seasonal variation factor of 1.7 for Tucson, Arizona.

Roadway Geotechnical Engineering ReportCRAYCROFT RD TI OP STR #594 & #595 ■ Tucson, ArizonaJune 14, 2016 ■ Terracon Project No.: 65155090R1
Resourceful ■ Responsive ■ Reliable 7
4.3 General Earthwork Considerations
The following presents recommendations for excavation and subgrade preparation on theproject. Earthwork on the project should be observed and evaluated by a licensed geotechnicalengineer. The evaluation of earthwork should include observation and testing of engineered fill,subgrade preparation, and other geotechnical conditions exposed during the construction of theproject.
It is anticipated that shallow excavations for much of the proposed temporary pavementconstruction can be accomplished with conventional earthmoving equipment. Based upon thesubsurface conditions determined from the geotechnical exploration, the subgrade soilsexposed during construction are expected to be relatively stable. However, the stability of thesubgrade may be affected by repetitive construction traffic or other factors.
Exposed areas which will receive fill or aggregate base course, once properly cleared andbenched where necessary, should be scarified to a minimum depth of six (6) inches, moistureconditioned, and compacted in accordance with ADOT specifications. Exposed surfaces shouldbe free of mounds and depressions which could prevent uniform compaction.
For purposes of design and new construction, it is assumed that soils placed within 3 feet of thefinished roadway subgrade will exhibit an R-value of 20 or more. The on-site soils to be utilizedwithin the top 3 feet below the proposed pavement base may need improvement if the materialdoes not meet the requirements of the Subgrade Acceptance Chart provided in the MaterialsDesign Report. Improvement may include overexcavation, geogrid reinforcement, or othertechniques approved by the Engineer.
4.4 Earthwork Factors and Slopes
We understand the existing traffic interchange embankments are sloped at approximately1.5H:1V (horizontal : vertical). Recommended fill slopes and shrinkage due to re-compaction ofmaterials is presented in the following table:
Location Earthwork Factor Ground Compaction(feet)
Recommend Slope(horizontal: vertical)
All 5% shrink 0.2 Fill Slopes: 2:1, or flatter
Construction of fill slopes should be in accordance with Section 203-10 of the ADOT StandardSpecifications (ADOT, 2008). Slopes constructed at slope inclinations steeper than 3H:1Vshould have surface erosion measures considered in the design.
Roadway Geotechnical Engineering ReportCRAYCROFT RD TI OP STR #594 & #595 ■ Tucson, ArizonaJune 14, 2016 ■ Terracon Project No.: 65155090R1
Resourceful ■ Responsive ■ Reliable 8
The face of all slopes should be compacted to the minimum specification for fillembankments. Fill slopes can be over-built and trimmed to expose a compacted slope surface.
4.5 Water
For balancing grading plans, approximately 90 gallons of water per cubic yard should beestimated for compaction of base materials. Approximately 90 gallons of water per cubic yardshould be estimated for compaction of subgrade materials.
The application of water estimated for subgrade materials is considerably higher than theamount calculated based upon the difference between in-situ and optimum compaction moisturecontent, and includes a conservative overrun for losses due to seepage, evaporation,inadequate mixing, spillage, etc. Precipitation during and/or before construction, or otherweather conditions may reduce the required amount of water.
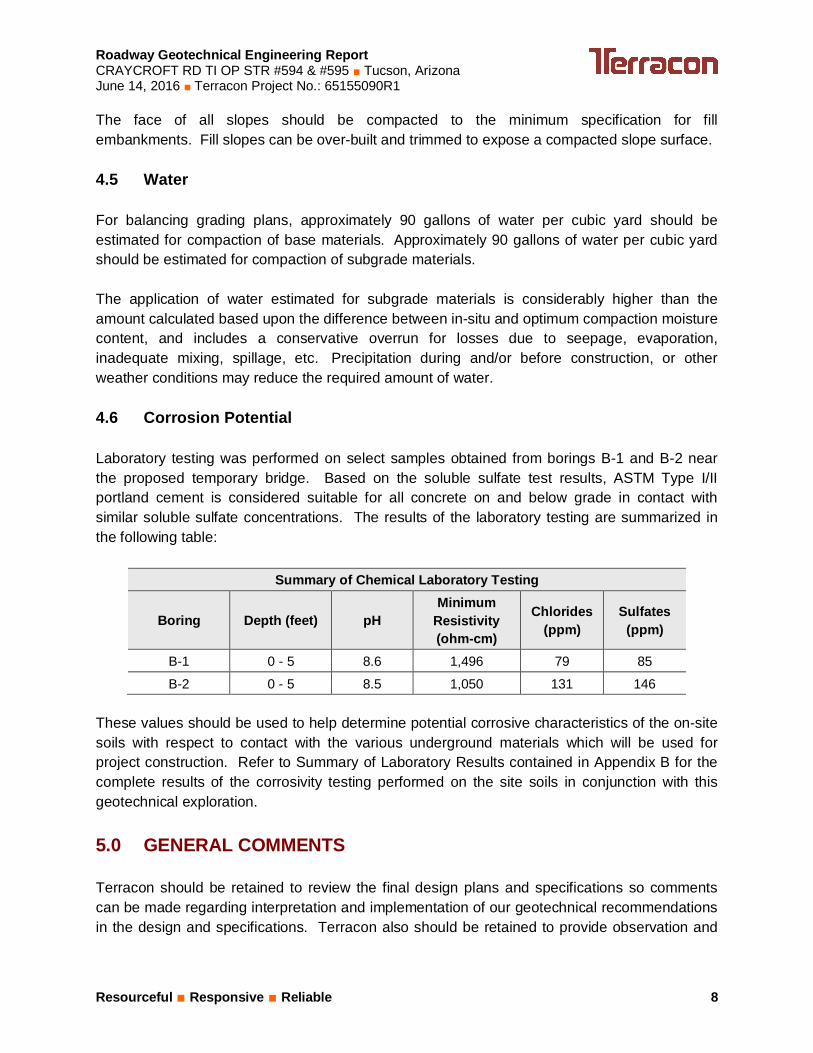
4.6 Corrosion Potential
Laboratory testing was performed on select samples obtained from borings B-1 and B-2 nearthe proposed temporary bridge. Based on the soluble sulfate test results, ASTM Type I/IIportland cement is considered suitable for all concrete on and below grade in contact withsimilar soluble sulfate concentrations. The results of the laboratory testing are summarized inthe following table:
Summary of Chemical Laboratory Testing
Boring Depth (feet) pHMinimum
Resistivity(ohm-cm)
Chlorides(ppm)
Sulfates(ppm)
B-1 0 - 5 8.6 1,496 79 85B-2 0 - 5 8.5 1,050 131 146
These values should be used to help determine potential corrosive characteristics of the on-sitesoils with respect to contact with the various underground materials which will be used forproject construction. Refer to Summary of Laboratory Results contained in Appendix B for thecomplete results of the corrosivity testing performed on the site soils in conjunction with thisgeotechnical exploration.
5.0 GENERAL COMMENTS
Terracon should be retained to review the final design plans and specifications so commentscan be made regarding interpretation and implementation of our geotechnical recommendationsin the design and specifications. Terracon also should be retained to provide observation and

Roadway Geotechnical Engineering ReportCRAYCROFT RD TI OP STR #594 & #595 ■ Tucson, ArizonaJune 14, 2016 ■ Terracon Project No.: 65155090R1
Resourceful ■ Responsive ■ Reliable 9
testing services during grading, excavation, foundation construction and other earth-relatedconstruction phases of the project.
The analysis and recommendations presented in this report are based upon the data obtainedfrom the borings performed at the indicated locations and from other information discussed inthis report. This report does not reflect variations that may occur between boring locations,across the site, or due to the modifying effects of construction or weather. The nature andextent of such variations may not become evident until during or after construction. If variationsappear, we should be immediately notified so that further evaluation and supplementalrecommendations can be provided.
The scope of services for this project does not include either specifically or by implication anyenvironmental or biological (e.g., mold, fungi, bacteria) assessment of the site or identification orprevention of pollutants, hazardous materials or conditions. If the owner is concerned about thepotential for such contamination or pollution, other studies should be undertaken.
This report has been prepared for the exclusive use of our client for specific application to theproject discussed and has been prepared in accordance with generally accepted geotechnicalengineering practices. No warranties, either express or implied, are intended or made. Sitesafety, excavation support, and dewatering requirements are the responsibility of others. In theevent that changes in the nature, design, or location of the project as outlined in this report areplanned, the conclusions and recommendations contained in this report shall not be consideredvalid unless Terracon reviews the changes and either verifies or modifies the conclusions of thisreport in writing.
Roadway Geotechnical Engineering ReportCRAYCROFT RD TI OP STR #594 & #595 ■ Tucson, ArizonaJune 14, 2016 ■ Terracon Project No.: 65155090R1
Resourceful ■ Responsive ■ Reliable
APPENDIX AFIELD EXPLORATION

Project No.
Scale:
Date:
File No.
SITE PLAN AND BORING LOCATIONS
DRC
RP
KLJ
RP
06/14/2016
65155090.DWG
AS SHOWN
65155090Project Mngr:
Approved By:
Checked By:
Drawn By:
EXHIBIT
A-1Consulting Engineers and Scientists
4685 South Ash Avenue, Suite H-4 Tempe, AZ 85282FAX. (480) 897-1133PH. (480) 897-8200
R-1
< W.B. INTERSTATE 10
INTERSTATE 10 E.B. >
LEGEND:
APPROXIMATE BORING LOCATION
M A
T
C
H
A
-2
APPROXIMATE SCALE
050' 100'
R-2
I-10 TEMPORARY BRIDGE AT CRAYCROFT ROAD, TUCSON, ARIZONA
ADOT TRACS No.: 010 PM 267 H8774 -01C Ferderal Aid Project No.: NHPP 010-E(219)T
CRAYCROFT RD TI OP STR #594 & #595
AutoCAD SHX Text
NOTE: SITE IMAGES FROM 60% PROJECT PLANS, GOOGLE EARTH PRO, SITE IMAGES FROM 60% PROJECT PLANS, GOOGLE EARTH PRO, SITE IMAGES FROM 60% PROJECT PLANS, GOOGLE EARTH PRO, IMAGES FROM 60% PROJECT PLANS, GOOGLE EARTH PRO, AND ESRI ONLINE MAPS, 2016
Project No.
Scale:
Date:
File No.
SITE PLAN AND BORING LOCATIONS
DRC
RP
KLJ
RP
06/14/2016
65155090.DWG
AS SHOWN
65155090Project Mngr:
Approved By:
Checked By:
Drawn By:
EXHIBIT
A-2Consulting Engineers and Scientists
4685 South Ash Avenue, Suite H-4 Tempe, AZ 85282FAX. (480) 897-1133PH. (480) 897-8200
R-3
< W.B. INTERSTATE 10
INTERSTATE 10 E.B. >
LEGEND:
APPROXIMATE BORING LOCATION
M A
T
C
H
A
-3
APPROXIMATE SCALE
050' 100'
R-4
R-5
B-1
M A
T
C
H
A
-1
B-2
I-10 TEMPORARY BRIDGE AT CRAYCROFT ROAD, TUCSON, ARIZONA
ADOT TRACS No.: 010 PM 267 H8774 -01C Ferderal Aid Project No.: NHPP 010-E(219)T
CRAYCROFT RD TI OP STR #594 & #595
AutoCAD SHX Text
NOTE: SITE IMAGES FROM 60% PROJECT PLANS, GOOGLE EARTH PRO, SITE IMAGES FROM 60% PROJECT PLANS, GOOGLE EARTH PRO, SITE IMAGES FROM 60% PROJECT PLANS, GOOGLE EARTH PRO, IMAGES FROM 60% PROJECT PLANS, GOOGLE EARTH PRO, AND ESRI ONLINE MAPS, 2016

Project No.
Scale:
Date:
File No.
SITE PLAN AND BORING LOCATIONS
DRC
RP
KLJ
RP
06/14/2016
65155090.DWG
AS SHOWN
65155090Project Mngr:
Approved By:
Checked By:
Drawn By:
EXHIBIT
A-3Consulting Engineers and Scientists
4685 South Ash Avenue, Suite H-4 Tempe, AZ 85282FAX. (480) 897-1133PH. (480) 897-8200
R-6
< W.B. INTERSTATE 10
INTERSTATE 10 E.B. >
LEGEND:
APPROXIMATE BORING LOCATION
APPROXIMATE SCALE
050' 100'
M A
T
C
H
A
-2
I-10 TEMPORARY BRIDGE AT CRAYCROFT ROAD, TUCSON, ARIZONA
ADOT TRACS No.: 010 PM 267 H8774 -01C Ferderal Aid Project No.: NHPP 010-E(219)T
CRAYCROFT RD TI OP STR #594 & #595
AutoCAD SHX Text
NOTE: SITE IMAGES FROM 60% PROJECT PLANS, GOOGLE EARTH PRO, SITE IMAGES FROM 60% PROJECT PLANS, GOOGLE EARTH PRO, SITE IMAGES FROM 60% PROJECT PLANS, GOOGLE EARTH PRO, IMAGES FROM 60% PROJECT PLANS, GOOGLE EARTH PRO, AND ESRI ONLINE MAPS, 2016

Roadway Geotechnical Engineering ReportCRAYCROFT RD TI OP STR #594 & #595 ■ Tucson, ArizonaJune 14, 2016 ■ Terracon Project No.: 65155090R1
Resourceful ■ Reliable ■ Responsive Exhibit A-4
Field Exploration Description
A total of eight (8) test borings were drilled at the site on February 5, 2016. The borings weredrilled to depths of approximately 5 to 55½ feet below the ground surface. The approximateboring locations are shown on the attached Site Plan and Boring Locations diagrams, ExhibitsA-1 through A-3.
The test borings were advanced with a truck-mounted CME-75 drill rig utilizing 8-inch outsidediameter hollow-stem augers. The borings were located in the field utilizing an aerialphotograph and a hand held GPS unit. Latitude and longitude coordinates for each boring wereobtained from Google Earth Pro and should be considered approximate.
A continuous lithologic log of each boring was recorded by the field engineer during the drillingoperations. At selected intervals, samples of the subsurface materials were taken by drivingsplit-spoon (SPT) or ring-lined barrel samplers in general accordance with ASTM Standards.Penetration resistance measurements were obtained by driving the split-spoon and ring-linedbarrel samplers into the subsurface materials with a 140-pound automatic hammer falling 30inches. The penetration resistance value is a useful index in estimating the consistency orrelative density of materials encountered. Bulk samples of subsurface materials were alsoobtained from the auger cuttings.
Groundwater conditions were evaluated in the borings at the time of site exploration.

TraceWithModifier
Water Level Aftera Specified Period of Time
GRAIN SIZE TERMINOLOGYRELATIVE PROPORTIONS OF SAND AND GRAVEL
TraceWithModifier
Standard Penetration orN-Value
Blows/Ft.
Descriptive Term(Consistency)
Loose
Very Stiff
Standard Penetration orN-Value
Blows/Ft.
Ring SamplerBlows/Ft.
Ring SamplerBlows/Ft.
Medium Dense
Dense
Very Dense
0 - 1 < 3
4 - 9 2 - 4 3 - 4
Medium-Stiff 5 - 9
30 - 50
WA
TE
R L
EV
EL
Auger Shelby Tube Split Spoon
RockCore
8 - 15
PLASTICITY DESCRIPTION
Term
< 1515 - 29> 30
Descriptive Term(s)of other constituents
Water InitiallyEncountered
Water Level After aSpecified Period of Time
Major Componentof Sample
Percent ofDry Weight
(More than 50% retained on No. 200 sieve.)Density determined by Standard Penetration Resistance
Includes gravels, sands and silts.
Hard
Very Loose 0 - 3 0 - 6 Very Soft
7 - 18 Soft
10 - 29 19 - 58
59 - 98 Stiff
less than 500
500 to 1,000
1,000 to 2,000
MacroCore
2,000 to 4,000
4,000 to 8,000> 99
LOCATION AND ELEVATION NOTES
SA
MP
LIN
G
FIE
LD
TE
ST
S
DESCRIPTION OF SYMBOLS AND ABBREVIATIONS
Descriptive Term(Density)
Non-plasticLowMediumHigh
BouldersCobblesGravelSandSilt or Clay
10 - 18
> 50 15 - 30 19 - 42
> 30 > 42
_
CONSISTENCY OF FINE-GRAINED SOILS
Hand Penetrometer
Torvane
Standard PenetrationTest (blows per foot)
N value
Photo-Ionization Detector
Organic Vapor Analyzer
(HP)
(T)
(b/f)
N
(PID)
(OVA)
(50% or more passing the No. 200 sieve.)Consistency determined by laboratory shear strength testing, field
visual-manual procedures or standard penetration resistance
DESCRIPTIVE SOIL CLASSIFICATION
> 8,000
Unless otherwise noted, Latitude and Longitude are approximately determined using a hand-held GPS device. The accuracyof such devices is variable. Surface elevation data annotated with +/- indicates that no actual topographical survey wasconducted to confirm the surface elevation. Instead, the surface elevation was approximately determined from topographicmaps of the area.
Soil classification is based on the Unified Soil Classification System. Coarse Grained Soils have more than 50% of their dryweight retained on a #200 sieve; their principal descriptors are: boulders, cobbles, gravel or sand. Fine Grained Soils haveless than 50% of their dry weight retained on a #200 sieve; they are principally described as clays if they are plastic, andsilts if they are slightly plastic or non-plastic. Major constituents may be added as modifiers and minor constituents may beadded according to the relative proportions based on grain size. In addition to gradation, coarse-grained soils are definedon the basis of their in-place relative density and fine-grained soils on the basis of their consistency.
Plasticity Index
01 - 1011 - 30
> 30
RELATIVE PROPORTIONS OF FINES
Descriptive Term(s)of other constituents
Percent ofDry Weight
< 55 - 12> 12
RELATIVE DENSITY OF COARSE-GRAINED SOILS
Particle Size
Over 12 in. (300 mm)12 in. to 3 in. (300mm to 75mm)3 in. to #4 sieve (75mm to 4.75 mm)#4 to #200 sieve (4.75mm to 0.075mmPassing #200 sieve (0.075mm)
ST
RE
NG
TH
TE
RM
S Unconfined CompressiveStrength, Qu, psf
4 - 8
GENERAL NOTES
ModifiedCalifornia
Ring Sampler
GrabSample
ModifiedDames & MooreRing Sampler
NoRecovery
Water levels indicated on the soil boringlogs are the levels measured in theborehole at the times indicated.Groundwater level variations will occurover time. In low permeability soils,accurate determination of groundwaterlevels is not possible with short termwater level observations.
Exhibit A-5

UNIFIED SOIL CLASSIFICATION SYSTEM
Criteria for Assigning Group Symbols and Group Names Using Laboratory Tests A Soil Classification
Group Symbol
Group Name B
Coarse Grained Soils: More than 50% retained on No. 200 sieve
Gravels: More than 50% of coarse fraction retained on No. 4 sieve
Clean Gravels: Less than 5% fines C
Cu 4 and 1 Cc 3 E GW Well-graded gravel F
Cu 4 and/or 1 Cc 3 E GP Poorly graded gravel F
Gravels with Fines: More than 12% fines C
Fines classify as ML or MH GM Silty gravel F,G,H
Fines classify as CL or CH GC Clayey gravel F,G,H
Sands: 50% or more of coarse fraction passes No. 4 sieve
Clean Sands: Less than 5% fines D
Cu 6 and 1 Cc 3 E SW Well-graded sand I
Cu 6 and/or 1 Cc 3 E SP Poorly graded sand I
Sands with Fines: More than 12% fines D
Fines classify as ML or MH SM Silty sand G,H,I
Fines classify as CL or CH SC Clayey sand G,H,I
Fine-Grained Soils: 50% or more passes the No. 200 sieve
Silts and Clays: Liquid limit less than 50
Inorganic: PI 7 and plots on or above “A” line J CL Lean clay K,L,M
PI 4 or plots below “A” line J ML Silt K,L,M
Organic: Liquid limit - oven dried
0.75 OL Organic clay K,L,M,N
Liquid limit - not dried Organic silt K,L,M,O
Silts and Clays: Liquid limit 50 or more
Inorganic: PI plots on or above “A” line CH Fat clay K,L,M
PI plots below “A” line MH Elastic Silt K,L,M
Organic: Liquid limit - oven dried
0.75 OH Organic clay K,L,M,P
Liquid limit - not dried Organic silt K,L,M,Q
Highly organic soils: Primarily organic matter, dark in color, and organic odor PT Peat
A Based on the material passing the 3-inch (75-mm) sieve B If field sample contained cobbles or boulders, or both, add “with cobbles
or boulders, or both” to group name. C Gravels with 5 to 12% fines require dual symbols: GW-GM well-graded
gravel with silt, GW-GC well-graded gravel with clay, GP-GM poorly graded gravel with silt, GP-GC poorly graded gravel with clay.
D Sands with 5 to 12% fines require dual symbols: SW-SM well-graded sand with silt, SW-SC well-graded sand with clay, SP-SM poorly graded sand with silt, SP-SC poorly graded sand with clay
E Cu = D60/D10 Cc =
6010
2
30
DxD
)(D
F If soil contains 15% sand, add “with sand” to group name. G If fines classify as CL-ML, use dual symbol GC-GM, or SC-SM.
H If fines are organic, add “with organic fines” to group name. I If soil contains 15% gravel, add “with gravel” to group name. J If Atterberg limits plot in shaded area, soil is a CL-ML, silty clay. K If soil contains 15 to 29% plus No. 200, add “with sand” or “with gravel,”
whichever is predominant. L If soil contains 30% plus No. 200 predominantly sand, add “sandy” to
group name. M If soil contains 30% plus No. 200, predominantly gravel, add
“gravelly” to group name. N PI 4 and plots on or above “A” line. O PI 4 or plots below “A” line. P PI plots on or above “A” line. Q PI plots below “A” line.
Exhibit A-4
rpadilla
Typewriter
Exhibit: A-6

315
7
9
121
117
95
36-18-18
2712
36-50/5"
14-19-18N=37
21-27
8-13-13N=26
14-20
13-27-29
24.0
FILL - CLAYEY SAND (SC), trace gravel, brown to light brown,dense
medium dense
ring sample disturbed
CLAYEY SAND (SC), brown to light brown, dense, weakcementation
Hammer Type: AutomaticStratification lines are approximate. In-situ, the transition may be gradual.
GR
AP
HIC
LO
G
TH
IS B
OR
ING
LO
G IS
NO
T V
ALI
D IF
SE
PA
RA
TE
D F
RO
M O
RIG
INA
L R
EP
OR
T.
G
EO
SM
AR
T L
OG
-NO
WE
LL 6
515
509
0.G
PJ
TE
RR
AC
ON
2015
.GD
T
3/21
/16
SITE:
Page 1 of 3
Advancement Method:hollow stem auger
Abandonment Method:Borings backfilled with soil cuttings upon completion.
4685 S. Ash Ave. Suite H-4Tempe, AZ
Notes:
Project No.: 65155090
Drill Rig: CME-75
Boring Started: 2/5/2016
BORING LOG NO. B1T.Y. Lin International, Inc.CLIENT:
Driller: Southlands Engineering
Boring Completed: 2/5/2016
Exhibit: A-7
See Exhibit A-4 for description of fieldproceduresSee Appendix B for description of laboratoryprocedures and additional data (if any).
See Appendix A for explanation of symbols andabbreviations.Elevations were interpolated from 60% plans.
Interstate 10 and Craycroft Road Tucson, Arizona
PROJECT: I-10 Temporary Bridge at Craycroft Road
PE
RC
EN
T F
INE
S
WA
TE
RC
ON
TE
NT
(%
)
DR
Y U
NIT
WE
IGH
T (
pcf)
ATTERBERGLIMITS
LL-PL-PISurface Elev.: 2736 (Ft.)
ELEVATION (Ft.)
SA
MP
LE T
YP
E
WA
TE
R L
EV
EL
OB
SE
RV
AT
ION
S
DE
PT
H (
Ft.)
5
10
15
20
25
FIE
LD T
ES
TR
ES
ULT
S
DEPTH
LOCATION See Exhibit A-1
Latitude: 32.125446° Longitude: -110.875434°
Groundwater not encounteredWATER LEVEL OBSERVATIONS

2
2
16
115
111
2708
2694
N=56
14-21
11-13-14N=27
17-34
7-10-15N=25
7-14-16
28.0
42.0
CLAYEY SAND (SC), brown to light brown, dense, weakcementation (continued)
SILTY SAND (SM), trace gravel, brown, medium dense, stratifiedwith poorly graded sand
CLAYEY SAND (SC), brown to dark brown, medium dense to dense,weak cementation, stratified with sandy clay
Hammer Type: AutomaticStratification lines are approximate. In-situ, the transition may be gradual.
GR
AP
HIC
LO
G
TH
IS B
OR
ING
LO
G IS
NO
T V
ALI
D IF
SE
PA
RA
TE
D F
RO
M O
RIG
INA
L R
EP
OR
T.
G
EO
SM
AR
T L
OG
-NO
WE
LL 6
515
509
0.G
PJ
TE
RR
AC
ON
2015
.GD
T
3/21
/16
SITE:
Page 2 of 3
Advancement Method:hollow stem auger
Abandonment Method:Borings backfilled with soil cuttings upon completion.
4685 S. Ash Ave. Suite H-4Tempe, AZ
Notes:
Project No.: 65155090
Drill Rig: CME-75
Boring Started: 2/5/2016
BORING LOG NO. B1T.Y. Lin International, Inc.CLIENT:
Driller: Southlands Engineering
Boring Completed: 2/5/2016
Exhibit: A-8
See Exhibit A-4 for description of fieldproceduresSee Appendix B for description of laboratoryprocedures and additional data (if any).
See Appendix A for explanation of symbols andabbreviations.Elevations were interpolated from 60% plans.
Interstate 10 and Craycroft Road Tucson, Arizona
PROJECT: I-10 Temporary Bridge at Craycroft Road
PE
RC
EN
T F
INE
S
WA
TE
RC
ON
TE
NT
(%
)
DR
Y U
NIT
WE
IGH
T (
pcf)
ATTERBERGLIMITS
LL-PL-PISurface Elev.: 2736 (Ft.)
ELEVATION (Ft.)
SA
MP
LE T
YP
E
WA
TE
R L
EV
EL
OB
SE
RV
AT
ION
S
DE
PT
H (
Ft.)
30
35
40
45
50
FIE
LD T
ES
TR
ES
ULT
S
DEPTH
LOCATION See Exhibit A-1
Latitude: 32.125446° Longitude: -110.875434°
Groundwater not encounteredWATER LEVEL OBSERVATIONS
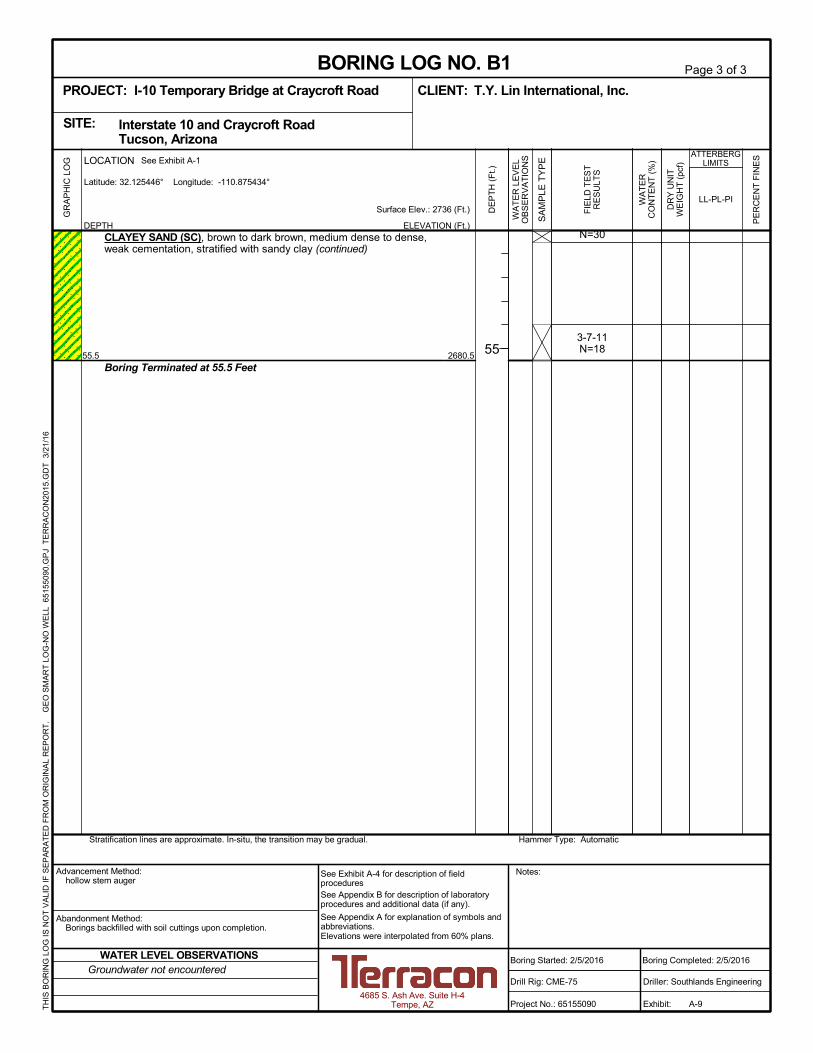
2680.5
N=30
3-7-11N=18
55.5
CLAYEY SAND (SC), brown to dark brown, medium dense to dense,weak cementation, stratified with sandy clay (continued)
Boring Terminated at 55.5 Feet
Hammer Type: AutomaticStratification lines are approximate. In-situ, the transition may be gradual.
GR
AP
HIC
LO
G
TH
IS B
OR
ING
LO
G IS
NO
T V
ALI
D IF
SE
PA
RA
TE
D F
RO
M O
RIG
INA
L R
EP
OR
T.
G
EO
SM
AR
T L
OG
-NO
WE
LL 6
515
509
0.G
PJ
TE
RR
AC
ON
2015
.GD
T
3/21
/16
SITE:
Page 3 of 3
Advancement Method:hollow stem auger
Abandonment Method:Borings backfilled with soil cuttings upon completion.
4685 S. Ash Ave. Suite H-4Tempe, AZ
Notes:
Project No.: 65155090
Drill Rig: CME-75
Boring Started: 2/5/2016
BORING LOG NO. B1T.Y. Lin International, Inc.CLIENT:
Driller: Southlands Engineering
Boring Completed: 2/5/2016
Exhibit: A-9
See Exhibit A-4 for description of fieldproceduresSee Appendix B for description of laboratoryprocedures and additional data (if any).
See Appendix A for explanation of symbols andabbreviations.Elevations were interpolated from 60% plans.
Interstate 10 and Craycroft Road Tucson, Arizona
PROJECT: I-10 Temporary Bridge at Craycroft Road
PE
RC
EN
T F
INE
S
WA
TE
RC
ON
TE
NT
(%
)
DR
Y U
NIT
WE
IGH
T (
pcf)
ATTERBERGLIMITS
LL-PL-PISurface Elev.: 2736 (Ft.)
ELEVATION (Ft.)
SA
MP
LE T
YP
E
WA
TE
R L
EV
EL
OB
SE
RV
AT
ION
S
DE
PT
H (
Ft.)
55
FIE
LD T
ES
TR
ES
ULT
S
DEPTH
LOCATION See Exhibit A-1
Latitude: 32.125446° Longitude: -110.875434°
Groundwater not encounteredWATER LEVEL OBSERVATIONS
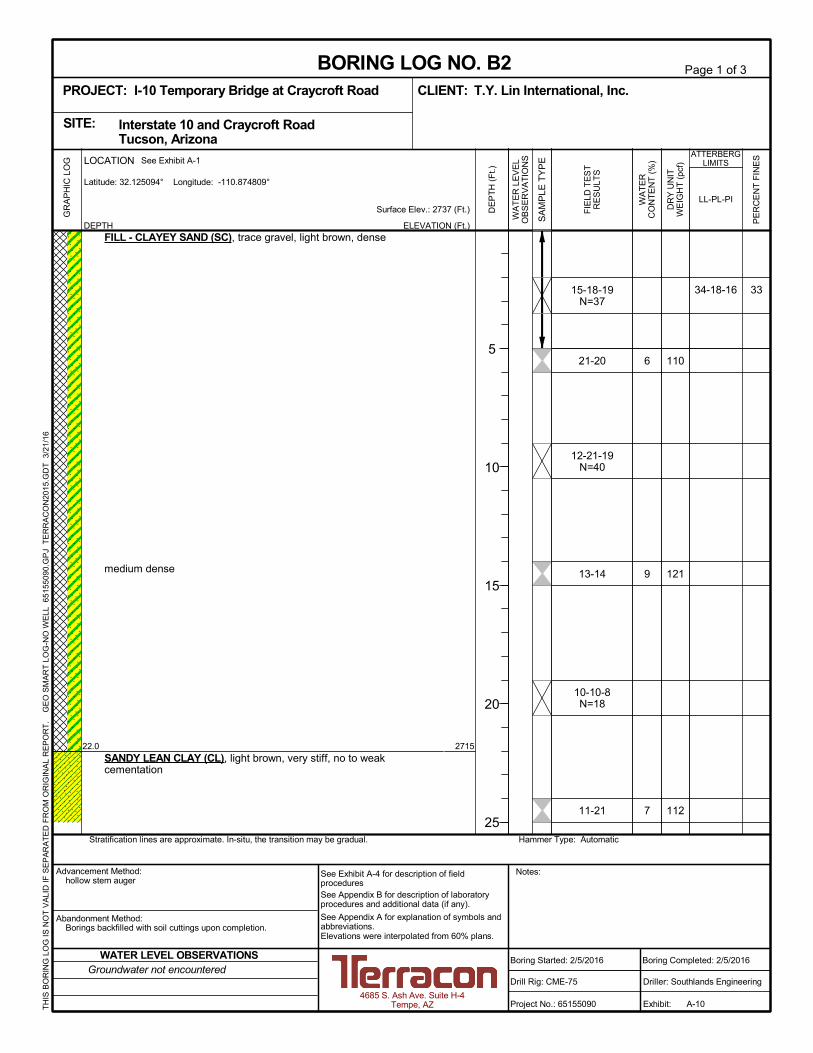
33
6
9
7
110
121
112
34-18-16
2715
15-18-19N=37
21-20
12-21-19N=40
13-14
10-10-8N=18
11-21
22.0
FILL - CLAYEY SAND (SC), trace gravel, light brown, dense
medium dense
SANDY LEAN CLAY (CL), light brown, very stiff, no to weakcementation
Hammer Type: AutomaticStratification lines are approximate. In-situ, the transition may be gradual.
GR
AP
HIC
LO
G
TH
IS B
OR
ING
LO
G IS
NO
T V
ALI
D IF
SE
PA
RA
TE
D F
RO
M O
RIG
INA
L R
EP
OR
T.
G
EO
SM
AR
T L
OG
-NO
WE
LL 6
515
509
0.G
PJ
TE
RR
AC
ON
2015
.GD
T
3/21
/16
SITE:
Page 1 of 3
Advancement Method:hollow stem auger
Abandonment Method:Borings backfilled with soil cuttings upon completion.
4685 S. Ash Ave. Suite H-4Tempe, AZ
Notes:
Project No.: 65155090
Drill Rig: CME-75
Boring Started: 2/5/2016
BORING LOG NO. B2T.Y. Lin International, Inc.CLIENT:
Driller: Southlands Engineering
Boring Completed: 2/5/2016
Exhibit: A-10
See Exhibit A-4 for description of fieldproceduresSee Appendix B for description of laboratoryprocedures and additional data (if any).
See Appendix A for explanation of symbols andabbreviations.Elevations were interpolated from 60% plans.
Interstate 10 and Craycroft Road Tucson, Arizona
PROJECT: I-10 Temporary Bridge at Craycroft Road
PE
RC
EN
T F
INE
S
WA
TE
RC
ON
TE
NT
(%
)
DR
Y U
NIT
WE
IGH
T (
pcf)
ATTERBERGLIMITS
LL-PL-PISurface Elev.: 2737 (Ft.)
ELEVATION (Ft.)
SA
MP
LE T
YP
E
WA
TE
R L
EV
EL
OB
SE
RV
AT
ION
S
DE
PT
H (
Ft.)
5
10
15
20
25
FIE
LD T
ES
TR
ES
ULT
S
DEPTH
LOCATION See Exhibit A-1
Latitude: 32.125094° Longitude: -110.874809°
Groundwater not encounteredWATER LEVEL OBSERVATIONS

4
13
110
110
2710
2694
11-15-16N=31
11-21
13-18-20N=38
13-21
10-16-19
27.0
43.0
SANDY LEAN CLAY (CL), light brown, very stiff, no to weakcementation (continued)
SILTY SAND (SM), trace gravel, brown, dense, stratified with poorlygraded sand
medium dense, stratified with clayey sand
SANDY LEAN CLAY (CL), light brown, very stiff
Hammer Type: AutomaticStratification lines are approximate. In-situ, the transition may be gradual.
GR
AP
HIC
LO
G
TH
IS B
OR
ING
LO
G IS
NO
T V
ALI
D IF
SE
PA
RA
TE
D F
RO
M O
RIG
INA
L R
EP
OR
T.
G
EO
SM
AR
T L
OG
-NO
WE
LL 6
515
509
0.G
PJ
TE
RR
AC
ON
2015
.GD
T
3/21
/16
SITE:
Page 2 of 3
Advancement Method:hollow stem auger
Abandonment Method:Borings backfilled with soil cuttings upon completion.
4685 S. Ash Ave. Suite H-4Tempe, AZ
Notes:
Project No.: 65155090
Drill Rig: CME-75
Boring Started: 2/5/2016
BORING LOG NO. B2T.Y. Lin International, Inc.CLIENT:
Driller: Southlands Engineering
Boring Completed: 2/5/2016
Exhibit: A-11
See Exhibit A-4 for description of fieldproceduresSee Appendix B for description of laboratoryprocedures and additional data (if any).
See Appendix A for explanation of symbols andabbreviations.Elevations were interpolated from 60% plans.
Interstate 10 and Craycroft Road Tucson, Arizona
PROJECT: I-10 Temporary Bridge at Craycroft Road
PE
RC
EN
T F
INE
S
WA
TE
RC
ON
TE
NT
(%
)
DR
Y U
NIT
WE
IGH
T (
pcf)
ATTERBERGLIMITS
LL-PL-PISurface Elev.: 2737 (Ft.)
ELEVATION (Ft.)
SA
MP
LE T
YP
E
WA
TE
R L
EV
EL
OB
SE
RV
AT
ION
S
DE
PT
H (
Ft.)
30
35
40
45
50
FIE
LD T
ES
TR
ES
ULT
S
DEPTH
LOCATION See Exhibit A-1
Latitude: 32.125094° Longitude: -110.874809°
Groundwater not encounteredWATER LEVEL OBSERVATIONS
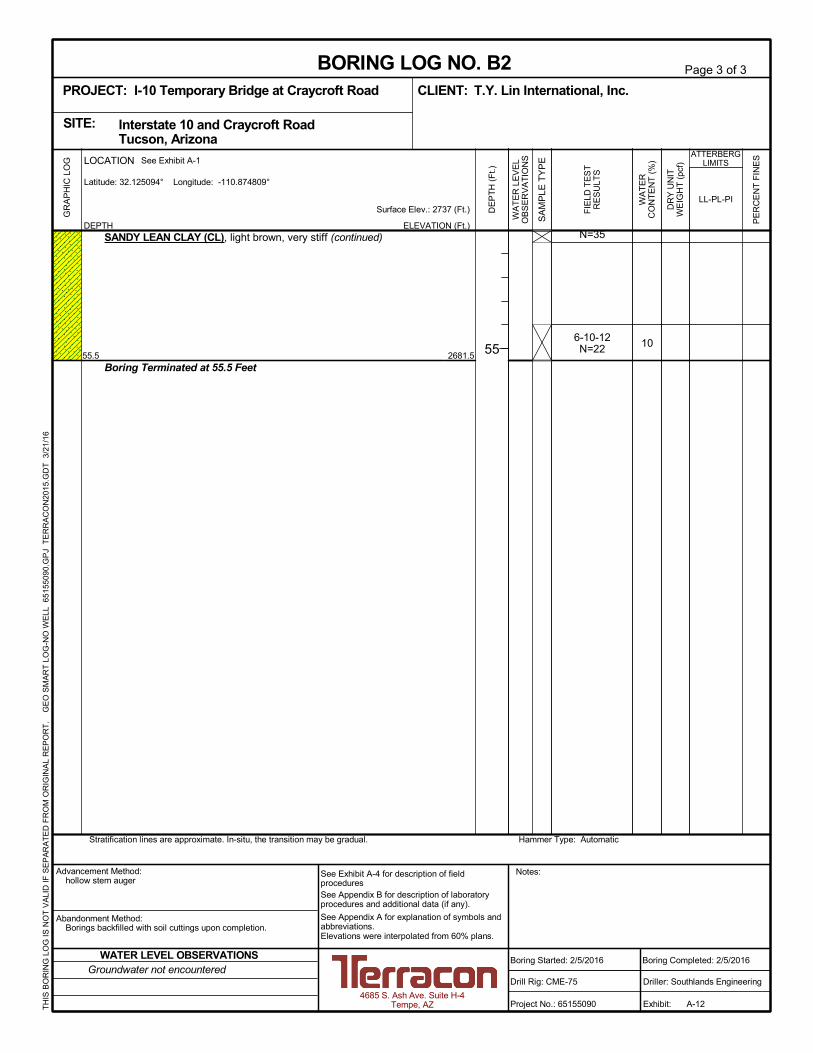
102681.5
N=35
6-10-12N=22
55.5
SANDY LEAN CLAY (CL), light brown, very stiff (continued)
Boring Terminated at 55.5 Feet
Hammer Type: AutomaticStratification lines are approximate. In-situ, the transition may be gradual.
GR
AP
HIC
LO
G
TH
IS B
OR
ING
LO
G IS
NO
T V
ALI
D IF
SE
PA
RA
TE
D F
RO
M O
RIG
INA
L R
EP
OR
T.
G
EO
SM
AR
T L
OG
-NO
WE
LL 6
515
509
0.G
PJ
TE
RR
AC
ON
2015
.GD
T
3/21
/16
SITE:
Page 3 of 3
Advancement Method:hollow stem auger
Abandonment Method:Borings backfilled with soil cuttings upon completion.
4685 S. Ash Ave. Suite H-4Tempe, AZ
Notes:
Project No.: 65155090
Drill Rig: CME-75
Boring Started: 2/5/2016
BORING LOG NO. B2T.Y. Lin International, Inc.CLIENT:
Driller: Southlands Engineering
Boring Completed: 2/5/2016
Exhibit: A-12
See Exhibit A-4 for description of fieldproceduresSee Appendix B for description of laboratoryprocedures and additional data (if any).
See Appendix A for explanation of symbols andabbreviations.Elevations were interpolated from 60% plans.
Interstate 10 and Craycroft Road Tucson, Arizona
PROJECT: I-10 Temporary Bridge at Craycroft Road
PE
RC
EN
T F
INE
S
WA
TE
RC
ON
TE
NT
(%
)
DR
Y U
NIT
WE
IGH
T (
pcf)
ATTERBERGLIMITS
LL-PL-PISurface Elev.: 2737 (Ft.)
ELEVATION (Ft.)
SA
MP
LE T
YP
E
WA
TE
R L
EV
EL
OB
SE
RV
AT
ION
S
DE
PT
H (
Ft.)
55
FIE
LD T
ES
TR
ES
ULT
S
DEPTH
LOCATION See Exhibit A-1
Latitude: 32.125094° Longitude: -110.874809°
Groundwater not encounteredWATER LEVEL OBSERVATIONS
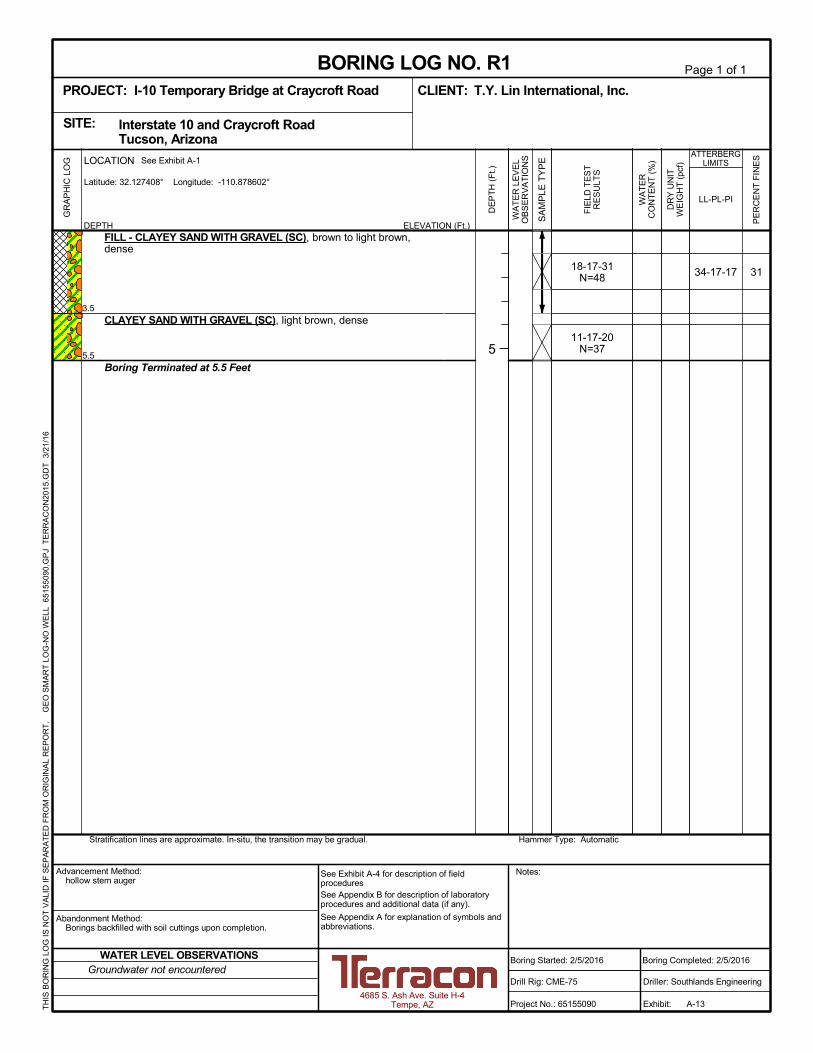
3134-17-1718-17-31N=48
11-17-20N=37
3.5
5.5
FILL - CLAYEY SAND WITH GRAVEL (SC), brown to light brown,dense
CLAYEY SAND WITH GRAVEL (SC), light brown, dense
Boring Terminated at 5.5 Feet
Hammer Type: AutomaticStratification lines are approximate. In-situ, the transition may be gradual.
GR
AP
HIC
LO
G
TH
IS B
OR
ING
LO
G IS
NO
T V
ALI
D IF
SE
PA
RA
TE
D F
RO
M O
RIG
INA
L R
EP
OR
T.
G
EO
SM
AR
T L
OG
-NO
WE
LL 6
515
509
0.G
PJ
TE
RR
AC
ON
2015
.GD
T
3/21
/16
SITE:
Page 1 of 1
Advancement Method:hollow stem auger
Abandonment Method:Borings backfilled with soil cuttings upon completion.
4685 S. Ash Ave. Suite H-4Tempe, AZ
Notes:
Project No.: 65155090
Drill Rig: CME-75
Boring Started: 2/5/2016
BORING LOG NO. R1T.Y. Lin International, Inc.CLIENT:
Driller: Southlands Engineering
Boring Completed: 2/5/2016
Exhibit: A-13
See Exhibit A-4 for description of fieldproceduresSee Appendix B for description of laboratoryprocedures and additional data (if any).
See Appendix A for explanation of symbols andabbreviations.
Interstate 10 and Craycroft Road Tucson, Arizona
PROJECT: I-10 Temporary Bridge at Craycroft Road
PE
RC
EN
T F
INE
S
WA
TE
RC
ON
TE
NT
(%
)
DR
Y U
NIT
WE
IGH
T (
pcf)
ATTERBERGLIMITS
LL-PL-PI
ELEVATION (Ft.)
SA
MP
LE T
YP
E
WA
TE
R L
EV
EL
OB
SE
RV
AT
ION
S
DE
PT
H (
Ft.)
5
FIE
LD T
ES
TR
ES
ULT
S
DEPTH
LOCATION See Exhibit A-1
Latitude: 32.127408° Longitude: -110.878602°
Groundwater not encounteredWATER LEVEL OBSERVATIONS

3134-17-176-8-8N=16
9-12-14N=26
5.5
FILL - CLAYEY SAND (SC), trace gravel, light brown, mediumdense
Boring Terminated at 5.5 Feet
Hammer Type: AutomaticStratification lines are approximate. In-situ, the transition may be gradual.
GR
AP
HIC
LO
G
TH
IS B
OR
ING
LO
G IS
NO
T V
ALI
D IF
SE
PA
RA
TE
D F
RO
M O
RIG
INA
L R
EP
OR
T.
G
EO
SM
AR
T L
OG
-NO
WE
LL 6
515
509
0.G
PJ
TE
RR
AC
ON
2015
.GD
T
3/21
/16
SITE:
Page 1 of 1
Advancement Method:hollow stem auger
Abandonment Method:Borings backfilled with soil cuttings upon completion.
4685 S. Ash Ave. Suite H-4Tempe, AZ
Notes:
Project No.: 65155090
Drill Rig: CME-75
Boring Started: 2/5/2016
BORING LOG NO. R2T.Y. Lin International, Inc.CLIENT:
Driller: Southlands Engineering
Boring Completed: 2/5/2016
Exhibit: A-14
See Exhibit A-4 for description of fieldproceduresSee Appendix B for description of laboratoryprocedures and additional data (if any).
See Appendix A for explanation of symbols andabbreviations.
Interstate 10 and Craycroft Road Tucson, Arizona
PROJECT: I-10 Temporary Bridge at Craycroft Road
PE
RC
EN
T F
INE
S
WA
TE
RC
ON
TE
NT
(%
)
DR
Y U
NIT
WE
IGH
T (
pcf)
ATTERBERGLIMITS
LL-PL-PI
ELEVATION (Ft.)
SA
MP
LE T
YP
E
WA
TE
R L
EV
EL
OB
SE
RV
AT
ION
S
DE
PT
H (
Ft.)
5
FIE
LD T
ES
TR
ES
ULT
S
DEPTH
LOCATION See Exhibit A-1
Latitude: 32.126863° Longitude: -110.87748°
Groundwater not encounteredWATER LEVEL OBSERVATIONS

3338-16-226-5-10N=15
8-14-14N=28
5.5
FILL - CLAYEY SAND WITH GRAVEL (SC), brown to light brown,medium dense
Boring Terminated at 5.5 Feet
Hammer Type: AutomaticStratification lines are approximate. In-situ, the transition may be gradual.
GR
AP
HIC
LO
G
TH
IS B
OR
ING
LO
G IS
NO
T V
ALI
D IF
SE
PA
RA
TE
D F
RO
M O
RIG
INA
L R
EP
OR
T.
G
EO
SM
AR
T L
OG
-NO
WE
LL 6
515
509
0.G
PJ
TE
RR
AC
ON
2015
.GD
T
3/21
/16
SITE:
Page 1 of 1
Advancement Method:hollow stem auger
Abandonment Method:Borings backfilled with soil cuttings upon completion.
4685 S. Ash Ave. Suite H-4Tempe, AZ
Notes:
Project No.: 65155090
Drill Rig: CME-75
Boring Started: 2/5/2016
BORING LOG NO. R3T.Y. Lin International, Inc.CLIENT:
Driller: Southlands Engineering
Boring Completed: 2/5/2016
Exhibit: A-15
See Exhibit A-4 for description of fieldproceduresSee Appendix B for description of laboratoryprocedures and additional data (if any).
See Appendix A for explanation of symbols andabbreviations.
Interstate 10 and Craycroft Road Tucson, Arizona
PROJECT: I-10 Temporary Bridge at Craycroft Road
PE
RC
EN
T F
INE
S
WA
TE
RC
ON
TE
NT
(%
)
DR
Y U
NIT
WE
IGH
T (
pcf)
ATTERBERGLIMITS
LL-PL-PI
ELEVATION (Ft.)
SA
MP
LE T
YP
E
WA
TE
R L
EV
EL
OB
SE
RV
AT
ION
S
DE
PT
H (
Ft.)
5
FIE
LD T
ES
TR
ES
ULT
S
DEPTH
LOCATION See Exhibit A-1
Latitude: 32.126031° Longitude: -110.876387°
Groundwater not encounteredWATER LEVEL OBSERVATIONS

4242-17-256-7-7N=14
8-18-19N=37
5.5
FILL - CLAYEY SAND (SC), trace gravel, brown, medium dense
dense
Boring Terminated at 5.5 Feet
Hammer Type: AutomaticStratification lines are approximate. In-situ, the transition may be gradual.
GR
AP
HIC
LO
G
TH
IS B
OR
ING
LO
G IS
NO
T V
ALI
D IF
SE
PA
RA
TE
D F
RO
M O
RIG
INA
L R
EP
OR
T.
G
EO
SM
AR
T L
OG
-NO
WE
LL 6
515
509
0.G
PJ
TE
RR
AC
ON
2015
.GD
T
3/28
/16
SITE:
Page 1 of 1
Advancement Method:hollow stem auger
Abandonment Method:Borings backfilled with soil cuttings upon completion.
4685 S Ash Ave Ste H-4Tempe, AZ
Notes:
Project No.: 65155090
Drill Rig: CME-75
Boring Started: 2/5/2016
BORING LOG NO. R4T.Y. Lin International, Inc.CLIENT:
Driller: Southlands Engineering
Boring Completed: 2/5/2016
Exhibit: A-16
See Exhibit A-4 for description of fieldproceduresSee Appendix B for description of laboratoryprocedures and additional data (if any).
See Appendix A for explanation of symbols andabbreviations.
Interstate 10 and Craycroft Road Tucson, Arizona
PROJECT: I-10 Temporary Bridge at Craycroft Road
PE
RC
EN
T F
INE
S
WA
TE
RC
ON
TE
NT
(%
)
DR
Y U
NIT
WE
IGH
T (
pcf)
ATTERBERGLIMITS
LL-PL-PI
ELEVATION (Ft.)
SA
MP
LE T
YP
E
WA
TE
R L
EV
EL
OB
SE
RV
AT
ION
S
DE
PT
H (
Ft.)
5
FIE
LD T
ES
TR
ES
ULT
S
DEPTH
LOCATION See Exhibit A-1
Latitude: 32.124503° Longitude: -110.873906°
Groundwater not encounteredWATER LEVEL OBSERVATIONS
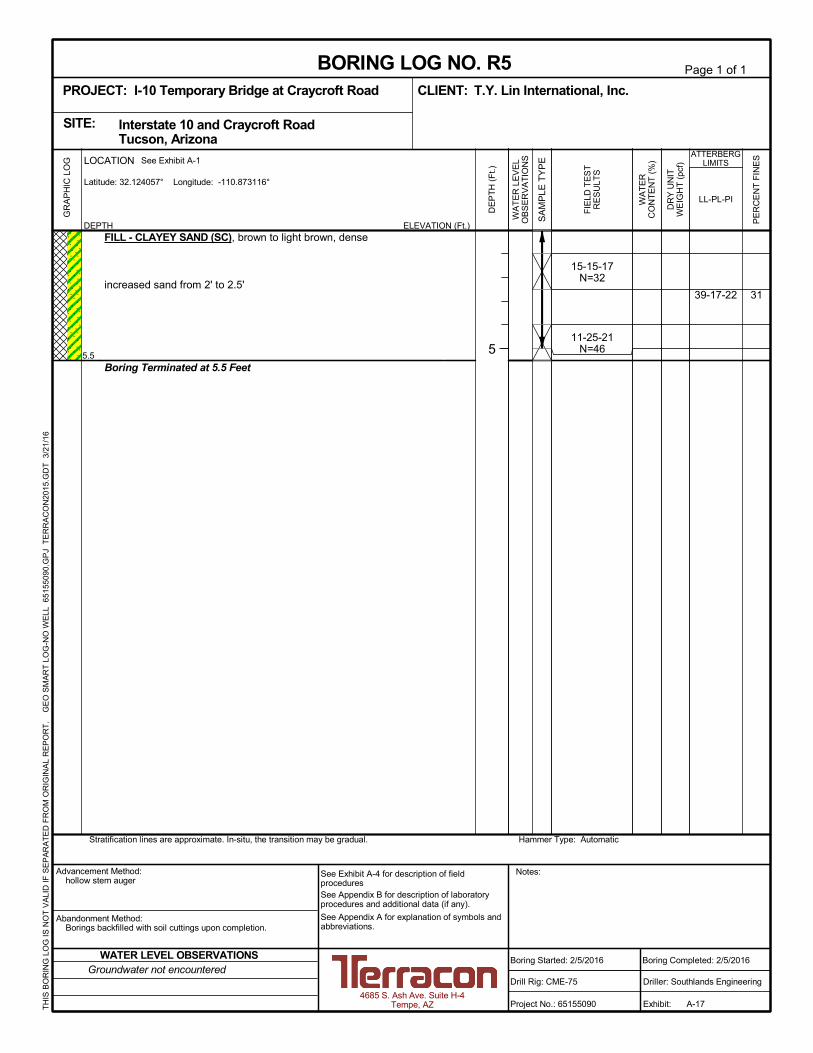
3139-17-22
15-15-17N=32
11-25-21N=46
5.5
FILL - CLAYEY SAND (SC), brown to light brown, dense
increased sand from 2' to 2.5'
Boring Terminated at 5.5 Feet
Hammer Type: AutomaticStratification lines are approximate. In-situ, the transition may be gradual.
GR
AP
HIC
LO
G
TH
IS B
OR
ING
LO
G IS
NO
T V
ALI
D IF
SE
PA
RA
TE
D F
RO
M O
RIG
INA
L R
EP
OR
T.
G
EO
SM
AR
T L
OG
-NO
WE
LL 6
515
509
0.G
PJ
TE
RR
AC
ON
2015
.GD
T
3/21
/16
SITE:
Page 1 of 1
Advancement Method:hollow stem auger
Abandonment Method:Borings backfilled with soil cuttings upon completion.
4685 S. Ash Ave. Suite H-4Tempe, AZ
Notes:
Project No.: 65155090
Drill Rig: CME-75
Boring Started: 2/5/2016
BORING LOG NO. R5T.Y. Lin International, Inc.CLIENT:
Driller: Southlands Engineering
Boring Completed: 2/5/2016
Exhibit: A-17
See Exhibit A-4 for description of fieldproceduresSee Appendix B for description of laboratoryprocedures and additional data (if any).
See Appendix A for explanation of symbols andabbreviations.
Interstate 10 and Craycroft Road Tucson, Arizona
PROJECT: I-10 Temporary Bridge at Craycroft Road
PE
RC
EN
T F
INE
S
WA
TE
RC
ON
TE
NT
(%
)
DR
Y U
NIT
WE
IGH
T (
pcf)
ATTERBERGLIMITS
LL-PL-PI
ELEVATION (Ft.)
SA
MP
LE T
YP
E
WA
TE
R L
EV
EL
OB
SE
RV
AT
ION
S
DE
PT
H (
Ft.)
5
FIE
LD T
ES
TR
ES
ULT
S
DEPTH
LOCATION See Exhibit A-1
Latitude: 32.124057° Longitude: -110.873116°
Groundwater not encounteredWATER LEVEL OBSERVATIONS

2134-20-142-4-8N=12
5-9-12N=21
5.5
FILL - CLAYEY SAND WITH GRAVEL (SC), brown to light brown,medium dense
Boring Terminated at 5.5 Feet
Hammer Type: AutomaticStratification lines are approximate. In-situ, the transition may be gradual.
GR
AP
HIC
LO
G
TH
IS B
OR
ING
LO
G IS
NO
T V
ALI
D IF
SE
PA
RA
TE
D F
RO
M O
RIG
INA
L R
EP
OR
T.
G
EO
SM
AR
T L
OG
-NO
WE
LL 6
515
509
0.G
PJ
TE
RR
AC
ON
2015
.GD
T
3/21
/16
SITE:
Page 1 of 1
Advancement Method:hollow stem auger
Abandonment Method:Borings backfilled with soil cuttings upon completion.
4685 S. Ash Ave. Suite H-4Tempe, AZ
Notes:
Project No.: 65155090
Drill Rig: CME-75
Boring Started: 2/5/2016
BORING LOG NO. R6T.Y. Lin International, Inc.CLIENT:
Driller: Southlands Engineering
Boring Completed: 2/5/2016
Exhibit: A-18
See Exhibit A-4 for description of fieldproceduresSee Appendix B for description of laboratoryprocedures and additional data (if any).
See Appendix A for explanation of symbols andabbreviations.
Interstate 10 and Craycroft Road Tucson, Arizona
PROJECT: I-10 Temporary Bridge at Craycroft Road
PE
RC
EN
T F
INE
S
WA
TE
RC
ON
TE
NT
(%
)
DR
Y U
NIT
WE
IGH
T (
pcf)
ATTERBERGLIMITS
LL-PL-PI
ELEVATION (Ft.)
SA
MP
LE T
YP
E
WA
TE
R L
EV
EL
OB
SE
RV
AT
ION
S
DE
PT
H (
Ft.)
5
FIE
LD T
ES
TR
ES
ULT
S
DEPTH
LOCATION See Exhibit A-1
Latitude: 32.123333° Longitude: -110.872114°
Groundwater not encounteredWATER LEVEL OBSERVATIONS
Roadway Geotechnical Engineering ReportCRAYCROFT RD TI OP STR #594 & #595 ■ Tucson, ArizonaJune 14, 2016 ■ Terracon Project No.: 65155090R1
Resourceful ■ Responsive ■ Reliable
APPENDIX BLABORATORY TESTING

Roadway Geotechnical Engineering ReportCRAYCROFT RD TI OP STR #594 & #595 ■ Tucson, ArizonaJune 14, 2016 ■ Terracon Project No.: 65155090R1
Resourceful ■ Responsive ■ Reliable Exhibit B-1
Laboratory Testing
Samples retrieved during the field exploration were taken to the laboratory for furtherobservation by the project geotechnical engineer and were classified in accordance with theUnified Soil Classification System (USCS) described in Appendix A. At that time, the fielddescriptions were confirmed or modified as necessary and an applicable laboratory testingprogram was formulated to determine engineering properties of the subsurface materials.
Laboratory tests were conducted on selected soil samples and the test results are presented inthis appendix. The laboratory test results were used for the geotechnical engineering analyses,and the development of recommendations. Laboratory tests were performed in generalaccordance with the applicable ASTM, local or other accepted standards.
Selected soil samples obtained from the site were tested for the following engineeringproperties:
n Sieve Analysis n Atterberg Limitsn Moisture Content n Consolidation Testn Direct Shearn Minimum Resistivityn Soluble Sulfates
n R-Valuen pHn Soluble Chlorides

0
10
20
30
40
50
60
0 20 40 60 80 100
CH o
r
OH
CL o
r
OL
ML or OL
MH or OH
PL PIBoring ID Depth Description
CLAYEY SAND
CLAYEY SAND
CLAYEY SAND with GRAVEL
CLAYEY SAND
CLAYEY SAND with GRAVEL
CLAYEY SAND
CLAYEY SAND
CLAYEY SAND with GRAVEL
SC
SC
SC
SC
SC
SC
SC
SC
Fines
PLASTICITY
INDEX
LIQUID LIMIT
"U" L
ine
"A" L
ine
36
34
34
34
38
42
39
34
18
18
17
17
16
17
17
20
18
16
17
17
22
25
22
14
31
33
31
31
33
42
31
21
LL USCS
B1
B2
R1
R2
R3
R4
R5
R6
ATTERBERG LIMITS RESULTSASTM D4318
0 - 5
0 - 5
0 - 3.5
0 - 4
0 - 4
0 - 4
0 - 5
0 - 4
4685 S. Ash Ave., Suite H-4Tempe, Arizona
PROJECT NUMBER: 65155090PROJECT: I-10 Temporary Bridge at Craycroft
Road
SITE: Interstate 10 and Craycroft Road Tucson, Arizona
CLIENT: TY Lin
EXHIBIT: B-2
LAB
OR
AT
OR
Y T
ES
TS
AR
E N
OT
VA
LID
IF S
EP
AR
AT
ED
FR
OM
OR
IGIN
AL
RE
PO
RT
.
AT
TE
RB
ER
G L
IMIT
S 6
5155
090.
GP
J T
ER
RA
CO
N20
15.G
DT
2/
26/1
6
CL-ML

0
5
10
15
20
25
30
35
40
45
50
55
60
65
70
75
80
85
90
95
100
0.0010.010.1110100
B1
B2
R1
R2
R3
36
34
34
34
38
0.645
0.537
1.052
0.778
0.878
31.5
50
37.5
25
50
6 16 20 30 40 501.5 2006 810
9.9
11.0
18.4
11.9
15.9
14
31.3
32.6
30.6
30.7
33.1
%Fines
LL PL PI
41 3/4 1/2 60
fine
B1
B2
R1
R2
R3
GRAIN SIZE IN MILLIMETERS
PE
RC
EN
T F
INE
R B
Y W
EIG
HT
coarse fine
HYDROMETERU.S. SIEVE OPENING IN INCHES U.S. SIEVE NUMBERS
18
18
17
17
16
18
16
17
17
22
D100
Cc Cu
SILT OR CLAY
4
%Sand%GravelD30 D10
0 - 5
0 - 5
0 - 3.5
0 - 4
0 - 4
3/8 3 100 1403 2
COBBLESGRAVEL SAND
USCS Classification
58.8
56.4
51.0
57.5
50.9
D60
coarse medium
Boring ID Depth
Boring ID Depth
GRAIN SIZE DISTRIBUTIONASTM D422
CLAYEY SAND (SC)
CLAYEY SAND (SC)
CLAYEY SAND with GRAVEL (SC)
CLAYEY SAND (SC)
CLAYEY SAND with GRAVEL (SC)
0 - 5
0 - 5
0 - 3.5
0 - 4
0 - 4
4685 S. Ash Ave., Suite H-4Tempe, Arizona
PROJECT NUMBER: 65155090PROJECT: I-10 Temporary Bridge at Craycroft
Road
SITE: Interstate 10 and Craycroft Road Tucson, Arizona
CLIENT: TY Lin
EXHIBIT: B-3
LAB
OR
AT
OR
Y T
ES
TS
AR
E N
OT
VA
LID
IF S
EP
AR
AT
ED
FR
OM
OR
IGIN
AL
RE
PO
RT
.
GR
AIN
SIZ
E: U
SC
S-2
651
550
90.G
PJ
351
5909
7 -
AT
TE
RB
ER
G IS
SU
E.G
PJ
2/2
6/16

0
5
10
15
20
25
30
35
40
45
50
55
60
65
70
75
80
85
90
95
100
0.0010.010.1110100
R4
R5
R6
42
39
34
0.239
0.405
0.831
3.002
31.5
37.5
37.5
6 16 20 30 40 501.5 2006 810
5.4
12.9
32.3
14
42.1
30.7
20.8
%Fines
LL PL PI
41 3/4 1/2 60
fine
R4
R5
R6
GRAIN SIZE IN MILLIMETERS
PE
RC
EN
T F
INE
R B
Y W
EIG
HT
coarse fine
HYDROMETERU.S. SIEVE OPENING IN INCHES U.S. SIEVE NUMBERS
17
17
20
25
22
14
D100
Cc Cu
SILT OR CLAY
4
%Sand%GravelD30 D10
0 - 4
0 - 5
0 - 4
3/8 3 100 1403 2
COBBLESGRAVEL SAND
USCS Classification
52.5
56.4
46.9
D60
coarse medium
Boring ID Depth
Boring ID Depth
GRAIN SIZE DISTRIBUTIONASTM D422
CLAYEY SAND (SC)
CLAYEY SAND (SC)
CLAYEY SAND with GRAVEL (SC)
0 - 4
0 - 5
0 - 4
4685 S. Ash Ave., Suite H-4Tempe, Arizona
PROJECT NUMBER: 65155090PROJECT: I-10 Temporary Bridge at Craycroft
Road
SITE: Interstate 10 and Craycroft Road Tucson, Arizona
CLIENT: TY Lin
EXHIBIT: B-4
LAB
OR
AT
OR
Y T
ES
TS
AR
E N
OT
VA
LID
IF S
EP
AR
AT
ED
FR
OM
OR
IGIN
AL
RE
PO
RT
.
GR
AIN
SIZ
E: U
SC
S-2
651
550
90.G
PJ
351
5909
7 -
AT
TE
RB
ER
G IS
SU
E.G
PJ
2/2
6/16
105
107
109
111
113
115
117
119
121
123
125
127
129
131
133
135
137
139
141
143
145
0 5 10 15 20
DR
Y D
EN
SIT
Y,
pcf
WATER CONTENT, %
ZAV for Gs = 2.8
PCF
%
36
TEST RESULTS
PIPLLL18 18
CLAYEY SAND(SC)
MOISTURE-DENSITY RELATIONSHIPASTM D698/D1557
120.0
11.8 Maximum Dry Density
Source of Material
Description of Material
Remarks:
%31.3 Optimum Water Content
ATTERBERG LIMITS
Percent Fines
Test Method
B1 @ 0 - 5 feet
ASTM D698 Method A
4685 S. Ash Ave., Suite H-4Tempe, Arizona
PROJECT NUMBER: 65155090PROJECT: I-10 Temporary Bridge at Craycroft
Road
SITE: Interstate 10 and Craycroft Road Tucson, Arizona
CLIENT: TY Lin
EXHIBIT: B-5
LAB
OR
AT
OR
Y T
ES
TS
AR
E N
OT
VA
LID
IF S
EP
AR
AT
ED
FR
OM
OR
IGIN
AL
RE
PO
RT
.
CO
MP
AC
TIO
N -
V1
651
5509
0.G
PJ
TE
RR
AC
ON
2015
.GD
T
2/26
/16
ZAV for Gs = 2.7
ZAV for Gs = 2.6

105
107
109
111
113
115
117
119
121
123
125
127
129
131
133
135
137
139
141
143
145
0 5 10 15 20
DR
Y D
EN
SIT
Y,
pcf
WATER CONTENT, %
ZAV for Gs = 2.8
PCF
%
34
TEST RESULTS
PIPLLL18 16
CLAYEY SAND(SC)
MOISTURE-DENSITY RELATIONSHIPASTM D698/D1557
116.9
13.5 Maximum Dry Density
Source of Material
Description of Material
Remarks:
%32.6 Optimum Water Content
ATTERBERG LIMITS
Percent Fines
Test Method
B2 @ 0 - 5 feet
ASTM D698 Method A
4685 S. Ash Ave., Suite H-4Tempe, Arizona
PROJECT NUMBER: 65155090PROJECT: I-10 Temporary Bridge at Craycroft
Road
SITE: Interstate 10 and Craycroft Road Tucson, Arizona
CLIENT: TY Lin
EXHIBIT: B-6
LAB
OR
AT
OR
Y T
ES
TS
AR
E N
OT
VA
LID
IF S
EP
AR
AT
ED
FR
OM
OR
IGIN
AL
RE
PO
RT
.
CO
MP
AC
TIO
N -
V1
651
5509
0.G
PJ
TE
RR
AC
ON
2015
.GD
T
2/26
/16
ZAV for Gs = 2.7
ZAV for Gs = 2.6

-10
-9
-8
-7
-6
-5
-4
-3
-2
-1
0
100 1,000 10,000
AX
IAL
ST
RA
IN,
%
PRESSURE, psf
NOTES: water added at 4,000 psf
SWELL CONSOLIDATION TESTASTM D2435
Specimen Identification Classification , pcf
120B2 10
WC, %
CLAYEY SAND (SC)14.0 - 15.0 ft
4685 S. Ash Ave., Suite H-4Tempe, Arizona
PROJECT NUMBER: 65155090PROJECT: I-10 Temporary Bridge at Craycroft
Road
SITE: Interstate 10 and Craycroft Road Tucson, Arizona
CLIENT: TY Lin
EXHIBIT: B-7
LAB
OR
AT
OR
Y T
ES
TS
AR
E N
OT
VA
LID
IF S
EP
AR
AT
ED
FR
OM
OR
IGIN
AL
RE
PO
RT
.
TC
_CO
NS
OL_
ST
RA
IN-U
SC
S 6
515
5090
.GP
J T
ER
RA
CO
N20
15.G
DT
2/2
6/1
6

-10
-9
-8
-7
-6
-5
-4
-3
-2
-1
0
100 1,000 10,000
AX
IAL
ST
RA
IN,
%
PRESSURE, psf
NOTES: water added at 4,000 psf
SWELL CONSOLIDATION TESTASTM D2435
Specimen Identification Classification , pcf
121B2 6
WC, %
SANDY LEAN CLAY (CL)24.0 - 25.0 ft
4685 S. Ash Ave., Suite H-4Tempe, Arizona
PROJECT NUMBER: 65155090PROJECT: I-10 Temporary Bridge at Craycroft
Road
SITE: Interstate 10 and Craycroft Road Tucson, Arizona
CLIENT: TY Lin
EXHIBIT: B-8
LAB
OR
AT
OR
Y T
ES
TS
AR
E N
OT
VA
LID
IF S
EP
AR
AT
ED
FR
OM
OR
IGIN
AL
RE
PO
RT
.
TC
_CO
NS
OL_
ST
RA
IN-U
SC
S 6
515
5090
.GP
J T
ER
RA
CO
N20
15.G
DT
2/2
6/1
6

B1 0.0 - 5.0 SC 31 36 18 18 114 9.8 100 1.9 8.6 1496 85 79B1 2.0 - 2.9 SC 121 5 1, 2
B1 9.0 - 10.0 SC 117 7 1, 2
B1 19.0 - 20.0 SC 95 9 1, 2B1 29.0 - 30.0 SP 115 2 1, 2
B1 39.0 - 40.0 SP-SC 111 2 1, 2B1 49.0 - 50.5 CL 16 2
B2 0.0 - 5.0 SC 33 34 18 16 111 11.5 100 1.9 8.5 1050 146 131
B2 5.0 - 6.0 SC 110 6 1, 2B2 14.0 - 15.0 SC 121 9 1, 2
B2 24.0 - 25.0 CL 112 7 1, 2B2 34.0 - 35.0 SP-SC 110 4 1, 2
B2 44.0 - 45.0 CL 110 13 1, 2
B2 54.0 - 55.5 CL 10 2R1 0.0 - 3.5 SC 31 34 17 17
R2 0.0 - 4.0 SC 31 34 17 17R3 0.0 - 4.0 SC 33 38 16 22
R4 0.0 - 4.0 SC 42 42 17 25
R5 0.0 - 5.0 SC 31 39 17 22R6 0.0 - 4.0 SC 21 34 20 14
50pH Resistivity
(ohm-cm)Sulfates(ppm)
Chlorides(ppm)
DryDensity
(pcf)
Expansion(%)
Corrosivity
Dry Density(pcf)
Atterberg Limits
In-Situ Properties
Passing#200
Sieve (%)
Classification
PL PI
WaterContent
(%)
Remarks
Expansion Testing
Surcharge(psf)
WaterContent (%) LL
USCSSoil
Class.Expansion
IndexEI
REMARKS1. Dry Density and/or moisture determined from one or more rings of a multi-ring sample.2. Visual Classification.3. Submerged to approximate saturation.4. Expansion Index in accordance with ASTM D4829-95.5. Air-Dried Sample
BoreholeNo.
Depth(ft.)
SUMMARY OF LABORATORY RESULTS
PROJECT: I-10 Temporary Bridge at Craycroft Road PROJECT NUMBER: 65155090
CLIENT: TY LinSITE: Interstate 10 and Craycroft Road Tucson, Arizona
PH. 480-897-8200 FAX. 480-897-1133
4685 S. Ash Ave., Suite H-4Tempe, Arizona
EXHIBIT: B-9
TH
IS B
OR
ING
LO
G IS
NO
T V
ALI
D IF
SE
PA
RA
TE
D F
RO
M O
RIG
INA
L R
EP
OR
T.
S
OIL
PR
OP
ER
TIE
S 2
651
5509
0.G
PJ
TE
RR
AC
ON
2012
.GD
T 2
/26/
16

PROJECT: I-10 Temporary Bridge at Craycroft Road JOB NO: 65155090LOCATION: Tucson, Arizona WORK ORDER NO: 1MATERIAL: Fill: Clayey Sand with Gravel LAB NO: 27SAMPLE SOURCE: R1 @ 0.0'-3.5' DATE SAMPLED: 02/09/16
SPECIMEN I. D. A B C
Moisture Content 22.8% 20.9% 19.2%Compaction Pressure (psi) 130 190 230Specimen Height (inches) 2.58 2.53 2.52Dry Density (pcf) 109.2 114.5 117.7Horiz. Pres. @ 1000lbs (psi) 55.0 44.0 39.0Horiz. Pres. @ 2000lbs (psi) 129.0 109.0 86.0Displacement 4.14 4.08 3.91Expansion Pressure (psi) 0.0 0.0 0.3Exudation Pressure (psi) 261 379 503R Value 14 22 35
R Value at 300 PSI = 16.0
RESISTANCE R-VALUE AND EXPANSION PRESSURE OF COMPACTED SOILS (ASTM D2844)
0
10
20
30
40
50
60
70
80
90
100
050100150200250300350400450500550600650700750800
R-V
alue
Exudation Pressure (psi)
klporter
Text Box
Exhibit B-10

PROJECT: I-10 Temporary Bridge at Craycroft Road JOB NO: 65155090LOCATION: Tucson, Arizona WORK ORDER NO: 1MATERIAL: Fill: Clayey Sand with Gravel LAB NO: 33SAMPLE SOURCE: R3 @ 0.0'-4.0' DATE SAMPLED: 02/09/16
SPECIMEN I. D. A B C
Moisture Content 13.4% 13.0% 11.3%Compaction Pressure (psi) 85 115 190Specimen Height (inches) 2.57 2.58 2.49Dry Density (pcf) 120.8 120.1 124.5Horiz. Pres. @ 1000lbs (psi) 57.0 54.5 45.0Horiz. Pres. @ 2000lbs (psi) 134.0 128.0 112.0Displacement 4.11 3.97 3.67Expansion Pressure (psi) 0.0 0.0 0.0Exudation Pressure (psi) 240 296 457R Value 11 15 23
R Value at 300 PSI = 14.8
RESISTANCE R-VALUE AND EXPANSION PRESSURE OF COMPACTED SOILS (ASTM D2844)
0
10
20
30
40
50
60
70
80
90
100
050100150200250300350400450500550600650700750800
R-V
alue
Exudation Pressure (psi)
klporter
Text Box
Exhibit B-11

PROJECT: I-10 Temporary Bridge at Craycroft Road JOB NO: 65155090LOCATION: Tucson, Arizona WORK ORDER NO: 1MATERIAL: Fill: Clayey Sand LAB NO: 36SAMPLE SOURCE: R4 @ 0.0'-4.0' DATE SAMPLED: 02/09/16
SPECIMEN I. D. A B C
Moisture Content 26.6% 24.7% 22.5%Compaction Pressure (psi) 95 130 155Specimen Height (inches) 2.57 2.58 2.49Dry Density (pcf) 103.8 106.6 122.0Horiz. Pres. @ 1000lbs (psi) 59.0 55.0 49.0Horiz. Pres. @ 2000lbs (psi) 135.0 130.0 122.0Displacement 4.06 3.78 3.54Expansion Pressure (psi) 0.0 0.0 0.0Exudation Pressure (psi) 277 309 348R Value 11 14 18
R Value at 300 PSI = 13.2
RESISTANCE R-VALUE AND EXPANSION PRESSURE OF COMPACTED SOILS (ASTM D2844)
0
10
20
30
40
50
60
70
80
90
100
050100150200250300350400450500550600650700750800
R-V
alue
Exudation Pressure (psi)
klporter
Text Box
Exhibit B-12

PROJECT: I-10 Temporary Bridge at Craycroft Road JOB NO: 65155090LOCATION: Tucson, Arizona WORK ORDER NO: 1MATERIAL: Fill: Clayey Sand with Gravel LAB NO: 42SAMPLE SOURCE: R6 @ 0.0'-4.0' DATE SAMPLED: 02/09/16
SPECIMEN I. D. A B C
Moisture Content 14.3% 13.3% 12.4%Compaction Pressure (psi) 220 310 350Specimen Height (inches) 2.58 2.50 2.54Dry Density (pcf) 120.2 122.3 123.2Horiz. Pres. @ 1000lbs (psi) 43.0 32.5 22.0Horiz. Pres. @ 2000lbs (psi) 103.5 78.5 50.0Displacement 3.96 3.65 3.61Expansion Pressure (psi) 0.0 0.4 0.5Exudation Pressure (psi) 237 435 531R Value 27 42 60
R Value at 300 PSI = 28.2
RESISTANCE R-VALUE AND EXPANSION PRESSURE OF COMPACTED SOILS (ASTM D2844)
0
10
20
30
40
50
60
70
80
90
100
050100150200250300350400450500550600650700750800
R-V
alue
Exudation Pressure (psi)
klporter
Text Box
Exhibit B-13

PROJECT: I-10 Temporary Bridge at Craycroft Road JOB NO: 65155090LOCATION: Tucson, Arizona WORK ORDER NO: 65155090MATERIAL: Clayey Sand LAB NO: 4SAMPLE SOURCE: B1 @ 9.0'-10.0' DATE SAMPLED: 2/9/2016
Sample Preparation: Insitu density and moistureUnsaturated Shear
Point 1 Point 2 Point 3 Point 1 Point 2 Point 3500 1000 2000 500 1000 2000
118.33 129.96 123.87 118.33 129.96 123.871.0000 1.0000 1.0000 0.9948 0.9904 0.98212.416 2.416 2.416 2.416 2.416 2.4167.1 7.0 7.0 7.0 6.8 6.798.3 108.0 102.9 98.9 109.1 104.828 35 31 28 35 31
0.67 0.52 0.60 0.66 0.51 0.57
500 1000 2000 FRICTION840 2520 3768 ANGLE COHESION
0.101 0.157 0.215 61.6 216672 1056 2160 Specs:
0.451 0.451 0.4510.0160 0.0160 0.0160 45.2 120
Geomatic model 8914, Dead Weight load force Specs:
Note: The friction angle presented is applicable only to theload ranges and sample conditions tested
AT MAX SHEAR STRESS
height (in):Diameter (in):Moisture, %:
Dry Density (pcf):Saturation, %:
Maximum Shear Stress, (psf):
DIRECT SHEAR TEST OF SOILS UNDER CONSOLIDATEDDRAINED CONDITIONS ASTM D3080
Initial Parameters of specimen:
Shear Stress at Max Displacement, (psf)Maximum Displacement, (in):
Rate of Deformation, in/min AT MAX DISPLACEMENT
Normal Stress (psf):
Void Ratio: Void Ratio:
Displacement at Maximum Shear, (in):
Height (in):
SHEAR DEVICE:
Normal Stress (psf):
Final Parameters of specimen:
Diameter (in):Moisture, %:
Dry Density (pcf):Saturation, %:
Dry mass (g): Dry mass (g):
Normal Stress (psf):
0
1000
2000
3000
4000
5000
0 1000 2000 3000 4000 5000 6000 7000 8000
SHEA
RST
RES
S,ps
f
NORMAL STRESS, psf
SHEAR STRENGTH AT MAX DISPLACEMENT AT MAX SHEAR STRESS
klporter
Text Box
Exhibit B-14

PROJECT: I-10 Temporary Bridge at Craycroft Road JOB NO: 65155090LOCATION: Tucson, Arizona WORK ORDER NO: 65155090MATERIAL: Clayey Sand LAB NO: 4SAMPLE SOURCE: B1 @ 9.0'-10.0' DATE SAMPLED: 2/9/2016
DIRECT SHEAR TEST OF SOILS UNDER CONSOLIDATEDDRAINED CONDITIONS ASTM D3080
0
500
1000
1500
2000
2500
3000
3500
4000
0.000 0.050 0.100 0.150 0.200 0.250 0.300 0.350 0.400 0.450 0.500
SHEA
RST
RES
S,ps
f
HORIZONTAL DISPLACEMENT, inch
SHEAR STRESS Result 1
Result 2
Result 3
-0.020
0.000
0.020
0.040
0.060
0.080
0.100
0.120
0.140
0.160
0.180
0.000 0.050 0.100 0.150 0.200 0.250 0.300 0.350 0.400 0.450 0.500
VER
TIC
ALD
ISPL
ACEM
ENT,
in
HORIZONTAL DISPLACEMENT, in
DISPLACEMENT Result 1
Result 2
Result 3Dilation
Contraction
klporter
Text Box
Exhibit B-15
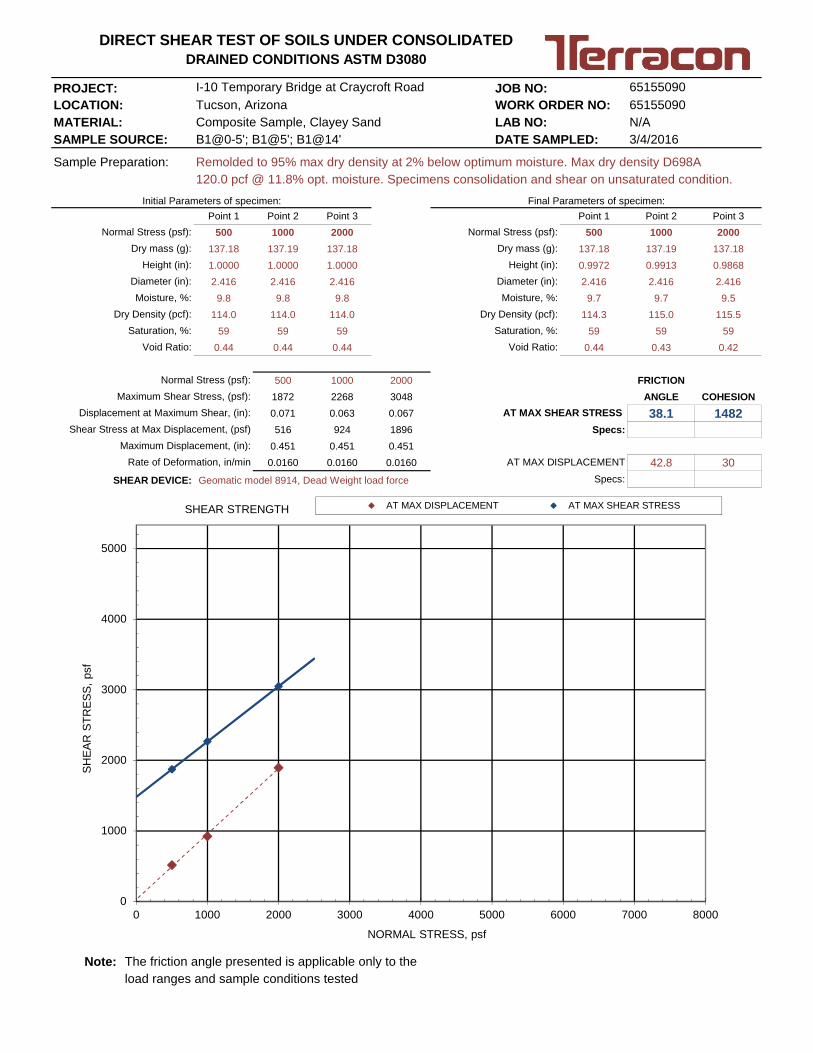
PROJECT: I-10 Temporary Bridge at Craycroft Road JOB NO: 65155090LOCATION: Tucson, Arizona WORK ORDER NO: 65155090MATERIAL: Composite Sample, Clayey Sand LAB NO: N/ASAMPLE SOURCE: B1@0-5'; B1@5'; B1@14' DATE SAMPLED: 3/4/2016
Sample Preparation: Remolded to 95% max dry density at 2% below optimum moisture. Max dry density D698A120.0 pcf @ 11.8% opt. moisture. Specimens consolidation and shear on unsaturated condition.
Point 1 Point 2 Point 3 Point 1 Point 2 Point 3500 1000 2000 500 1000 2000
137.18 137.19 137.18 137.18 137.19 137.181.0000 1.0000 1.0000 0.9972 0.9913 0.98682.416 2.416 2.416 2.416 2.416 2.4169.8 9.8 9.8 9.7 9.7 9.5
114.0 114.0 114.0 114.3 115.0 115.559 59 59 59 59 59
0.44 0.44 0.44 0.44 0.43 0.42
500 1000 2000 FRICTION1872 2268 3048 ANGLE COHESION0.071 0.063 0.067 38.1 1482516 924 1896 Specs:
0.451 0.451 0.4510.0160 0.0160 0.0160 42.8 30
Geomatic model 8914, Dead Weight load force Specs:
Note: The friction angle presented is applicable only to theload ranges and sample conditions tested
AT MAX SHEAR STRESS
Height (in):Diameter (in):Moisture, %:
Dry Density (pcf):Saturation, %:
Maximum Shear Stress, (psf):
DIRECT SHEAR TEST OF SOILS UNDER CONSOLIDATEDDRAINED CONDITIONS ASTM D3080
Initial Parameters of specimen:
Shear Stress at Max Displacement, (psf)Maximum Displacement, (in):
Rate of Deformation, in/min AT MAX DISPLACEMENT
Normal Stress (psf):
Void Ratio: Void Ratio:
Displacement at Maximum Shear, (in):
Height (in):
SHEAR DEVICE:
Normal Stress (psf):
Final Parameters of specimen:
Diameter (in):Moisture, %:
Dry Density (pcf):Saturation, %:
Dry mass (g): Dry mass (g):
Normal Stress (psf):
0
1000
2000
3000
4000
5000
0 1000 2000 3000 4000 5000 6000 7000 8000
SHEA
RST
RES
S,ps
f
NORMAL STRESS, psf
SHEAR STRENGTH AT MAX DISPLACEMENT AT MAX SHEAR STRESS
klporter
Text Box
Exhibit B-16

PROJECT: I-10 Temporary Bridge at Craycroft Road JOB NO: 65155090LOCATION: Tucson, Arizona WORK ORDER NO: 65155090MATERIAL: Composite Sample, Clayey Sand LAB NO: N/ASAMPLE SOURCE: B1@0-5'; B1@5'; B1@14' DATE SAMPLED: 3/4/2016
DIRECT SHEAR TEST OF SOILS UNDER CONSOLIDATEDDRAINED CONDITIONS ASTM D3080
0
500
1000
1500
2000
2500
3000
3500
0.000 0.050 0.100 0.150 0.200 0.250 0.300 0.350 0.400 0.450 0.500
SHEA
RST
RES
S,ps
f
HORIZONTAL DISPLACEMENT, inch
SHEAR STRESS Result 1
Result 2
Result 3
-0.020
0.000
0.020
0.040
0.060
0.080
0.100
0.000 0.050 0.100 0.150 0.200 0.250 0.300 0.350 0.400 0.450 0.500
VER
TIC
ALD
ISPL
ACEM
ENT,
in
HORIZONTAL DISPLACEMENT, in
DISPLACEMENT Result 1
Result 2
Result 3Dilation
Contraction
klporter
Text Box
Exhibit B-17

PROJECT: I-10 Temporary Bridge at Craycroft Road JOB NO: 65155090LOCATION: Tucson, Arizona WORK ORDER NO: 65155090MATERIAL: Composite Sample, Clayey Sand LAB NO: N/ASAMPLE SOURCE: B2@0-5': B2@9'; B2@14'-15' DATE SAMPLED: 3/4/2016
Sample Preparation: Remolded to 95% max dry density at 2% below optimum moisture. Max dry density D698A116.9 pcf @ 13.5% opt. moisture. Specimens consolidation and shear on unsaturated condition.
Point 1 Point 2 Point 3 Point 1 Point 2 Point 3500 1000 2000 500 1000 2000
133.64 133.63 133.63 133.64 133.63 133.631.0000 1.0000 1.0000 0.9961 0.9945 0.98182.416 2.416 2.416 2.416 2.416 2.41611.5 11.5 11.5 11.4 11.4 11.2
111.1 111.0 111.0 111.5 111.7 113.163 63 63 64 63 65
0.48 0.48 0.48 0.47 0.47 0.45
500 1000 2000 FRICTION1824 2400 3024 ANGLE COHESION0.101 0.077 0.087 37.8 1512684 1008 1992 Specs:
0.451 0.451 0.4490.0160 0.0160 0.0160 41.6 192
Geomatic model 8914, Dead Weight load force Specs:
Note: The friction angle presented is applicable only to theload ranges and sample conditions tested
AT MAX SHEAR STRESS
Height (in):Diameter (in):Moisture, %:
Dry Density (pcf):Saturation, %:
Maximum Shear Stress, (psf):
DIRECT SHEAR TEST OF SOILS UNDER CONSOLIDATEDDRAINED CONDITIONS ASTM D3080
Initial Parameters of specimen:
Shear Stress at Max Displacement, (psf)Maximum Displacement, (in):
Rate of Deformation, in/min AT MAX DISPLACEMENT
Normal Stress (psf):
Void Ratio: Void Ratio:
Displacement at Maximum Shear, (in):
Height (in):
SHEAR DEVICE:
Normal Stress (psf):
Final Parameters of specimen:
Diameter (in):Moisture, %:
Dry Density (pcf):Saturation, %:
Dry mass (g): Dry mass (g):
Normal Stress (psf):
0
1000
2000
3000
4000
5000
0 1000 2000 3000 4000 5000 6000 7000 8000
SHEA
RST
RES
S,ps
f
NORMAL STRESS, psf
SHEAR STRENGTH AT MAX DISPLACEMENT AT MAX SHEAR STRESS
klporter
Text Box
Exhibit B-18

PROJECT: I-10 Temporary Bridge at Craycroft Road JOB NO: 65155090LOCATION: Tucson, Arizona WORK ORDER NO: 65155090MATERIAL: Composite Sample, Clayey Sand LAB NO: N/ASAMPLE SOURCE: B2@0-5': B2@9'; B2@14'-15' DATE SAMPLED: 3/4/2016
DIRECT SHEAR TEST OF SOILS UNDER CONSOLIDATEDDRAINED CONDITIONS ASTM D3080
0
500
1000
1500
2000
2500
3000
3500
0.000 0.050 0.100 0.150 0.200 0.250 0.300 0.350 0.400 0.450 0.500
SHEA
RST
RES
S,ps
f
HORIZONTAL DISPLACEMENT, inch
SHEAR STRESS Result 1
Result 2
Result 3
-0.020
0.000
0.020
0.040
0.060
0.080
0.100
0.120
0.000 0.050 0.100 0.150 0.200 0.250 0.300 0.350 0.400 0.450 0.500
VER
TIC
ALD
ISPL
ACEM
ENT,
in
HORIZONTAL DISPLACEMENT, in
DISPLACEMENT Result 1
Result 2
Result 3Dilation
Contraction
klporter
Text Box
Exhibit B-19