ROADSIDE GRADING GUIDANCE - PHASE I
402
Research Project Number TPF-5(193) Supplement #13 ROADSIDE GRADING GUIDANCE - PHASE I Submitted by Kevin D. Schrum, M.S.C.E, E.I.T Graduate Research Assistant Dean L. Sicking, Ph.D., P.E. Professor and MwRSF Director Francisco D. B. Albuquerque, Ph.D. Post-Doctoral Research Assistant Ronald K. Faller, Ph.D., P.E. Research Assistant Professor John D. Reid, Ph.D. Professor MIDWEST ROADSIDE SAFETY FACILITY Nebraska Transportation Center University of Nebraska-Lincoln 2200 Vine Street 130 Whittier Building Lincoln, Nebraska 68583-0853 (402) 472-0965 Submitted to WISCONSIN DEPARTMENT OF TRANSPORTATION 4802 Sheboygan Avenue Madison, Wisconsin 53707 MwRSF Research Report No. TRP-03-251-11 December 19, 2011
Transcript of ROADSIDE GRADING GUIDANCE - PHASE I
Research Project Number TPF-5(193) Supplement #13
ROADSIDE GRADING GUIDANCE -
PHASE I
Submitted by
Kevin D. Schrum, M.S.C.E, E.I.T Graduate Research Assistant
Dean L. Sicking, Ph.D., P.E.
Professor and MwRSF Director
Francisco D. B. Albuquerque, Ph.D. Post-Doctoral Research Assistant
Ronald K. Faller, Ph.D., P.E. Research Assistant Professor
John D. Reid, Ph.D.
Professor
MIDWEST ROADSIDE SAFETY FACILITY Nebraska Transportation Center University of Nebraska-Lincoln
2200 Vine Street 130 Whittier Building
Lincoln, Nebraska 68583-0853 (402) 472-0965
Submitted to
WISCONSIN DEPARTMENT OF TRANSPORTATION 4802 Sheboygan Avenue
Madison, Wisconsin 53707
MwRSF Research Report No. TRP-03-251-11
December 19, 2011
December 19, 2011 MwRSF Report No. TRP-03-251-11
i
1. Report No. 2. 3. Recipient’s Accession No. TRP-03-251-11 4. Title and Subtitle 5. Report Date Roadside Grading Guidance – Phase I December 19, 2011
6.
7. Author(s) 8. Performing Organization Report No. Schrum, K.D., Albuquerque, F.B.D., Sicking, D.L., Faller, R.K., Reid, J.D.
TRP-03-251-11
9. Performing Organization Name and Address 10. Project/Task/Work Unit No. Midwest Roadside Safety Facility (MwRSF) Nebraska Transportation Center University of Nebraska-Lincoln 130 Whittier Research Center 2200 Vine Street Lincoln, Nebraska 68583-0853
11. Contract © or Grant (G) No.
12. Sponsoring Organization Name and Address 13. Type of Report and Period Covered Wisconsin Department of Transportation 4802 Sheboygan Avenue Madison, Wisconsin 53707
Final Report: 2010 – 2011 14. Sponsoring Agency Code TPF-5(193) Supplement #13
15. Supplementary Notes Prepared in cooperation with U.S. Department of Transportation, Federal Highway Administration.
16. Abstract (Limit: 200 words) Provisions for the design of roadside foreslopes are not readily available. As a result, engineering judgment is often employed. Unfortunately, this can lead to inconsistent designs, where, inevitably, some designs will be too costly and other designs will be too dangerous. Therefore guidance has been compiled to lend consistency to the design of these foreslopes while maintaining the most economical and safe design. This guidance was prepared after conducting a benefit-cost analysis using the Roadside Safety Analysis Program (RSAP). A large test matrix was developed in an attempt to simulate the most possible scenarios, leaving interpolation to a minimum. However, before the analysis could be run, the severity indices associated with foreslopes needed to be updated to accurately reflect vehicle damage and injury levels caused during an encroachment occurring at an average impact speed. Current indices are overestimated because they were based on a survey given out to highway safety officials who were most likely biased toward high-speed accidents. More data is being collected and will be added to the results of this report in phase two. To update the severity indices, accident data from the State of Ohio was analyzed using a program called Global Mapper, which allowed the user to measure topographical features, such as foreslopes, heights, and offsets. A method to account for underreported accidents on flat slopes is presented as well. Finally, equations for determining accident cost as a function of the traffic volume are given in conjunction with examples that demonstrate the use of these equations.
17. Document Analysis/Descriptors 18. Availability Statement Highway Safety, Roadside Geometries, RSAP, Severity Index, Foreslope
No restrictions. Document available from: National Technical Information Services, Springfield, Virginia 22161
19. Security Class (this report) 20. Security Class (this page) 21. No. of Pages 22. Price
Unclassified Unclassified 393
December 19, 2011 MwRSF Report No. TRP-03-251-11
ii
DISCLAIMER STATEMENT
This report was partly funded by the Federal Highway Administration, U.S. Department
of Transportation. The contents of this report reflect the views and opinions of the authors who
are responsible for the facts and the accuracy of the data presented herein. The contents do not
necessarily reflect the official views or policies of the Wisconsin Department of Transportation
or the Federal Highway Administration, U.S. Department of Transportation. This report does not
constitute a standard, specification, regulation, product endorsement, or an endorsement of
manufacturers.
December 19, 2011 MwRSF Report No. TRP-03-251-11
iii
ACKNOWLEDGEMENTS
The authors wish to acknowledge the sources that contributed to this project: (1) the
Wisconsin Department of Transportation for sponsoring this project; (2) the Ohio Department of
Transportation for providing accident report data; and (3) Mr. Yusuf Mohamedshah for helping
obtain the vehicle crash data contained in the Highway Safety Information System.
Acknowledgement is also given to the following individuals who made a contribution to
the completion of this research project.
Midwest Roadside Safety Facility R.K. Faller, Ph.D., P.E., Research Assistant Professor K.A. Lechtenberg, M.S.M.E., E.I.T., Research Associate Engineer Undergraduate and Graduate Research Assistants Ohio Department of Transportation Dean Focke, P.E., Road Safety Engineer (Retired) Michael Bline, P.E., Standards and Geometrics Engineer Wisconsin Department of Transportation Jerry Zogg, P.E., Chief Roadway Standards Engineer John Bridwell, P.E., Standards Development Engineer Erik Emerson, P.E., Standards Development Engineer Bill Bremer, Safety and Traffic Operations Engineer, FHWA Wisconsin Division Office
December 19, 2011 MwRSF Report No. TRP-03-251-11
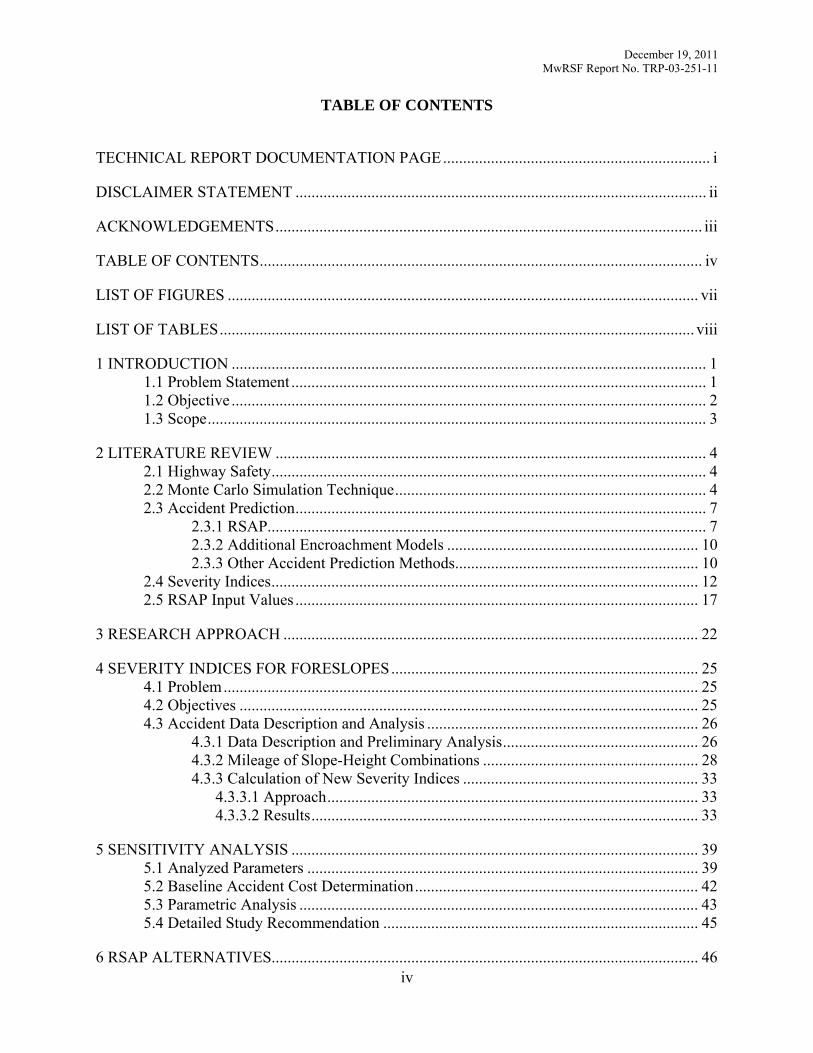
iv
TABLE OF CONTENTS
TECHNICAL REPORT DOCUMENTATION PAGE ................................................................... i
DISCLAIMER STATEMENT ....................................................................................................... ii
ACKNOWLEDGEMENTS ........................................................................................................... iii
TABLE OF CONTENTS ............................................................................................................... iv
LIST OF FIGURES ...................................................................................................................... vii
LIST OF TABLES ....................................................................................................................... viii
1 INTRODUCTION ....................................................................................................................... 1 1.1 Problem Statement ........................................................................................................ 1 1.2 Objective ....................................................................................................................... 2 1.3 Scope ............................................................................................................................. 3
2 LITERATURE REVIEW ............................................................................................................ 4 2.1 Highway Safety ............................................................................................................. 4 2.2 Monte Carlo Simulation Technique .............................................................................. 4 2.3 Accident Prediction ....................................................................................................... 7
2.3.1 RSAP.............................................................................................................. 7 2.3.2 Additional Encroachment Models ............................................................... 10 2.3.3 Other Accident Prediction Methods ............................................................. 10
2.4 Severity Indices ........................................................................................................... 12 2.5 RSAP Input Values ..................................................................................................... 17
3 RESEARCH APPROACH ........................................................................................................ 22
4 SEVERITY INDICES FOR FORESLOPES ............................................................................. 25 4.1 Problem ....................................................................................................................... 25 4.2 Objectives ................................................................................................................... 25 4.3 Accident Data Description and Analysis .................................................................... 26
4.3.1 Data Description and Preliminary Analysis ................................................. 26 4.3.2 Mileage of Slope-Height Combinations ...................................................... 28 4.3.3 Calculation of New Severity Indices ........................................................... 33
4.3.3.1 Approach ............................................................................................. 33 4.3.3.2 Results ................................................................................................. 33
5 SENSITIVITY ANALYSIS ...................................................................................................... 39 5.1 Analyzed Parameters .................................................................................................. 39 5.2 Baseline Accident Cost Determination ....................................................................... 42 5.3 Parametric Analysis .................................................................................................... 43 5.4 Detailed Study Recommendation ............................................................................... 45
6 RSAP ALTERNATIVES........................................................................................................... 46
December 19, 2011 MwRSF Report No. TRP-03-251-11
v
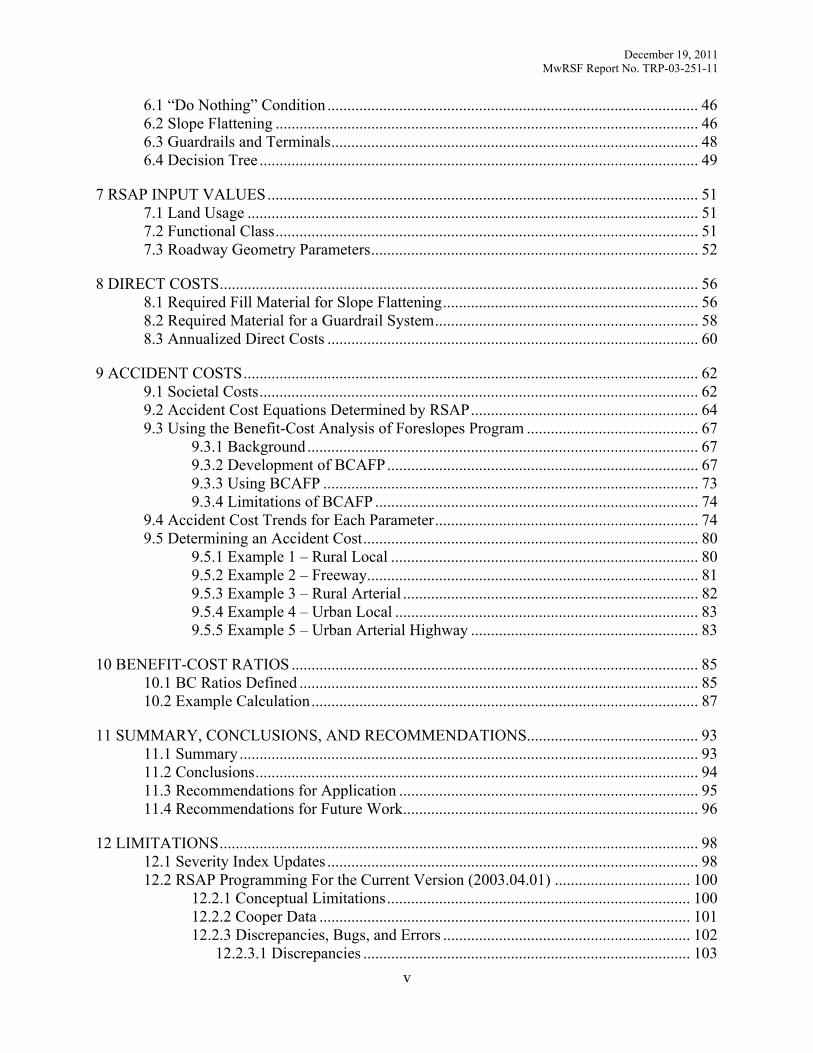
6.1 “Do Nothing” Condition ............................................................................................. 46 6.2 Slope Flattening .......................................................................................................... 46 6.3 Guardrails and Terminals ............................................................................................ 48 6.4 Decision Tree .............................................................................................................. 49
7 RSAP INPUT VALUES ............................................................................................................ 51 7.1 Land Usage ................................................................................................................. 51 7.2 Functional Class .......................................................................................................... 51 7.3 Roadway Geometry Parameters .................................................................................. 52
8 DIRECT COSTS ........................................................................................................................ 56 8.1 Required Fill Material for Slope Flattening ................................................................ 56 8.2 Required Material for a Guardrail System .................................................................. 58 8.3 Annualized Direct Costs ............................................................................................. 60
9 ACCIDENT COSTS .................................................................................................................. 62 9.1 Societal Costs .............................................................................................................. 62 9.2 Accident Cost Equations Determined by RSAP ......................................................... 64 9.3 Using the Benefit-Cost Analysis of Foreslopes Program ........................................... 67
9.3.1 Background .................................................................................................. 67 9.3.2 Development of BCAFP .............................................................................. 67 9.3.3 Using BCAFP .............................................................................................. 73 9.3.4 Limitations of BCAFP ................................................................................. 74
9.4 Accident Cost Trends for Each Parameter .................................................................. 74 9.5 Determining an Accident Cost .................................................................................... 80
9.5.1 Example 1 – Rural Local ............................................................................. 80 9.5.2 Example 2 – Freeway ................................................................................... 81 9.5.3 Example 3 – Rural Arterial .......................................................................... 82 9.5.4 Example 4 – Urban Local ............................................................................ 83 9.5.5 Example 5 – Urban Arterial Highway ......................................................... 83
10 BENEFIT-COST RATIOS ...................................................................................................... 85 10.1 BC Ratios Defined .................................................................................................... 85 10.2 Example Calculation ................................................................................................. 87
11 SUMMARY, CONCLUSIONS, AND RECOMMENDATIONS........................................... 93 11.1 Summary ................................................................................................................... 93 11.2 Conclusions ............................................................................................................... 94 11.3 Recommendations for Application ........................................................................... 95 11.4 Recommendations for Future Work .......................................................................... 96
12 LIMITATIONS ........................................................................................................................ 98 12.1 Severity Index Updates ............................................................................................. 98 12.2 RSAP Programming For the Current Version (2003.04.01) .................................. 100
12.2.1 Conceptual Limitations ............................................................................ 100 12.2.2 Cooper Data ............................................................................................. 101 12.2.3 Discrepancies, Bugs, and Errors .............................................................. 102
12.2.3.1 Discrepancies .................................................................................. 103
December 19, 2011 MwRSF Report No. TRP-03-251-11
vi
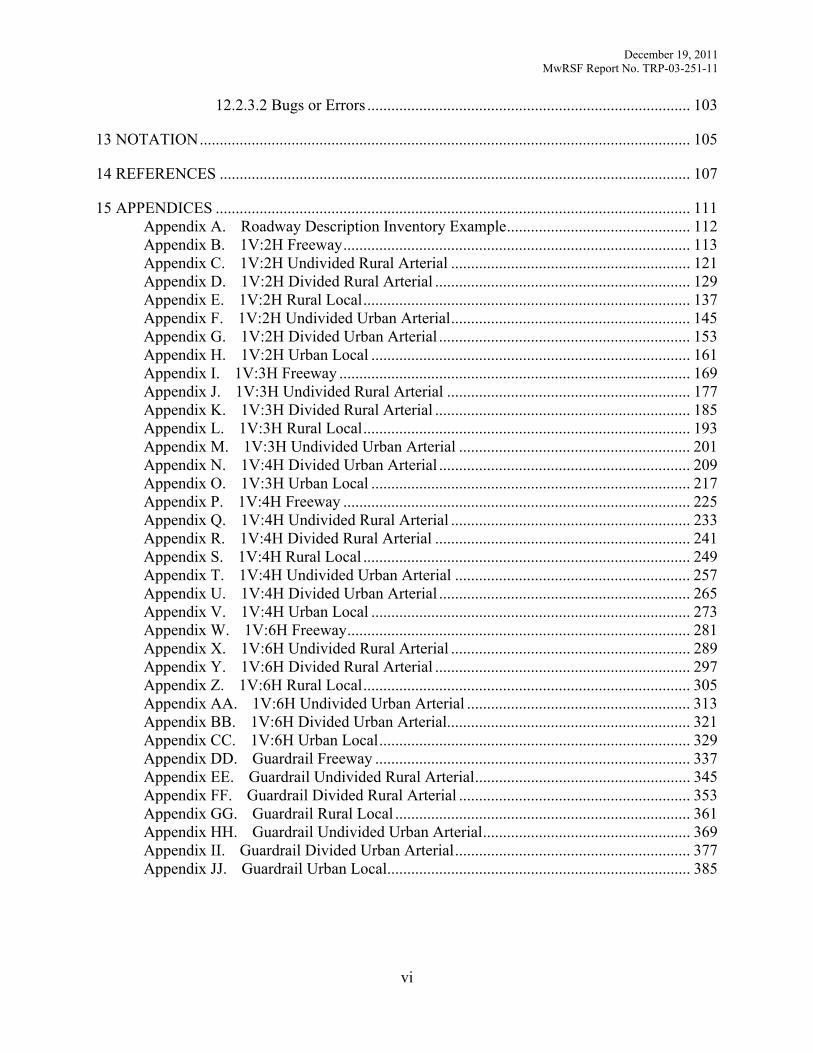
12.2.3.2 Bugs or Errors ................................................................................. 103
13 NOTATION ........................................................................................................................... 105
14 REFERENCES ...................................................................................................................... 107
15 APPENDICES ....................................................................................................................... 111 Appendix A. Roadway Description Inventory Example .............................................. 112 Appendix B. 1V:2H Freeway ....................................................................................... 113 Appendix C. 1V:2H Undivided Rural Arterial ............................................................ 121 Appendix D. 1V:2H Divided Rural Arterial ................................................................ 129 Appendix E. 1V:2H Rural Local .................................................................................. 137 Appendix F. 1V:2H Undivided Urban Arterial ............................................................ 145 Appendix G. 1V:2H Divided Urban Arterial ............................................................... 153 Appendix H. 1V:2H Urban Local ................................................................................ 161 Appendix I. 1V:3H Freeway ........................................................................................ 169 Appendix J. 1V:3H Undivided Rural Arterial ............................................................. 177 Appendix K. 1V:3H Divided Rural Arterial ................................................................ 185 Appendix L. 1V:3H Rural Local .................................................................................. 193 Appendix M. 1V:3H Undivided Urban Arterial .......................................................... 201 Appendix N. 1V:4H Divided Urban Arterial ............................................................... 209 Appendix O. 1V:3H Urban Local ................................................................................ 217 Appendix P. 1V:4H Freeway ....................................................................................... 225 Appendix Q. 1V:4H Undivided Rural Arterial ............................................................ 233 Appendix R. 1V:4H Divided Rural Arterial ................................................................ 241 Appendix S. 1V:4H Rural Local .................................................................................. 249 Appendix T. 1V:4H Undivided Urban Arterial ........................................................... 257 Appendix U. 1V:4H Divided Urban Arterial ............................................................... 265 Appendix V. 1V:4H Urban Local ................................................................................ 273 Appendix W. 1V:6H Freeway ...................................................................................... 281 Appendix X. 1V:6H Undivided Rural Arterial ............................................................ 289 Appendix Y. 1V:6H Divided Rural Arterial ................................................................ 297 Appendix Z. 1V:6H Rural Local .................................................................................. 305 Appendix AA. 1V:6H Undivided Urban Arterial ........................................................ 313 Appendix BB. 1V:6H Divided Urban Arterial............................................................. 321 Appendix CC. 1V:6H Urban Local .............................................................................. 329 Appendix DD. Guardrail Freeway ............................................................................... 337 Appendix EE. Guardrail Undivided Rural Arterial ...................................................... 345 Appendix FF. Guardrail Divided Rural Arterial .......................................................... 353 Appendix GG. Guardrail Rural Local .......................................................................... 361 Appendix HH. Guardrail Undivided Urban Arterial .................................................... 369 Appendix II. Guardrail Divided Urban Arterial ........................................................... 377 Appendix JJ. Guardrail Urban Local ............................................................................ 385
December 19, 2011 MwRSF Report No. TRP-03-251-11
vii
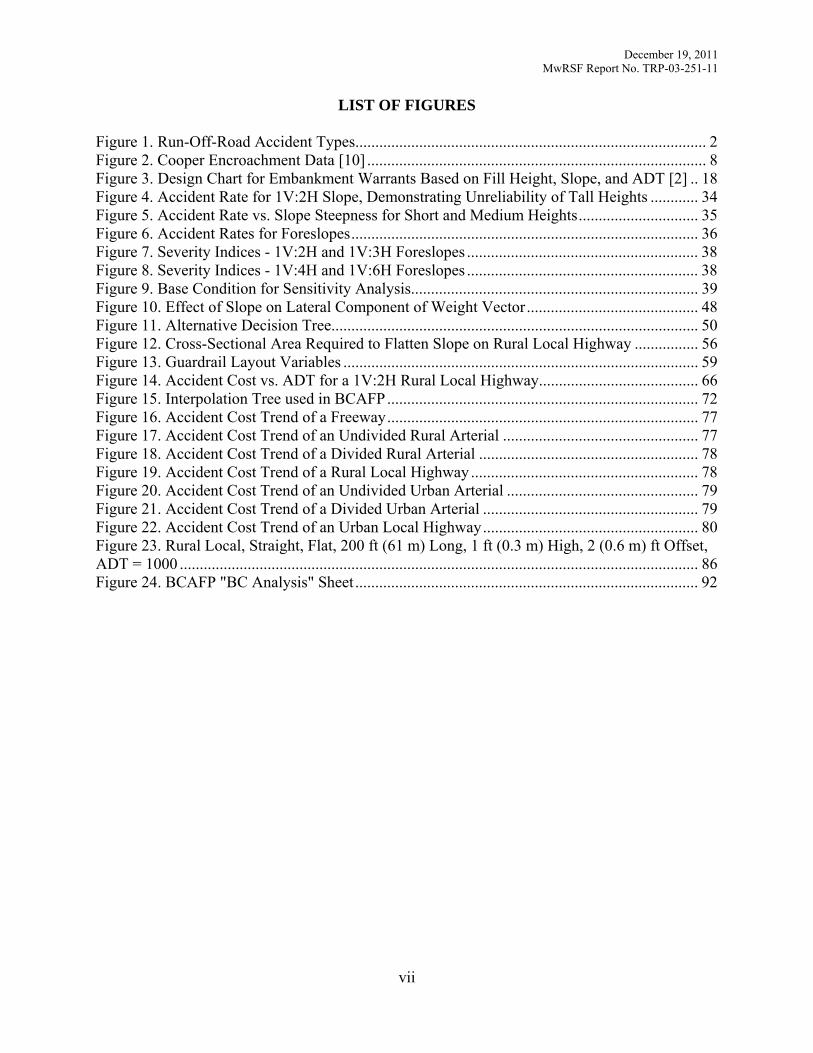
LIST OF FIGURES
Figure 1. Run-Off-Road Accident Types........................................................................................ 2 Figure 2. Cooper Encroachment Data [10] ..................................................................................... 8 Figure 3. Design Chart for Embankment Warrants Based on Fill Height, Slope, and ADT [2] .. 18 Figure 4. Accident Rate for 1V:2H Slope, Demonstrating Unreliability of Tall Heights ............ 34 Figure 5. Accident Rate vs. Slope Steepness for Short and Medium Heights .............................. 35 Figure 6. Accident Rates for Foreslopes ....................................................................................... 36 Figure 7. Severity Indices - 1V:2H and 1V:3H Foreslopes .......................................................... 38 Figure 8. Severity Indices - 1V:4H and 1V:6H Foreslopes .......................................................... 38 Figure 9. Base Condition for Sensitivity Analysis........................................................................ 39 Figure 10. Effect of Slope on Lateral Component of Weight Vector ........................................... 48 Figure 11. Alternative Decision Tree............................................................................................ 50 Figure 12. Cross-Sectional Area Required to Flatten Slope on Rural Local Highway ................ 56 Figure 13. Guardrail Layout Variables ......................................................................................... 59 Figure 14. Accident Cost vs. ADT for a 1V:2H Rural Local Highway ........................................ 66 Figure 15. Interpolation Tree used in BCAFP .............................................................................. 72 Figure 16. Accident Cost Trend of a Freeway .............................................................................. 77 Figure 17. Accident Cost Trend of an Undivided Rural Arterial ................................................. 77 Figure 18. Accident Cost Trend of a Divided Rural Arterial ....................................................... 78 Figure 19. Accident Cost Trend of a Rural Local Highway ......................................................... 78 Figure 20. Accident Cost Trend of an Undivided Urban Arterial ................................................ 79 Figure 21. Accident Cost Trend of a Divided Urban Arterial ...................................................... 79 Figure 22. Accident Cost Trend of an Urban Local Highway ...................................................... 80 Figure 23. Rural Local, Straight, Flat, 200 ft (61 m) Long, 1 ft (0.3 m) High, 2 (0.6 m) ft Offset, ADT = 1000 .................................................................................................................................. 86 Figure 24. BCAFP "BC Analysis" Sheet ...................................................................................... 92
December 19, 2011 MwRSF Report No. TRP-03-251-11
viii
LIST OF TABLES
Table 1. CMFs as Appeared in the Highway Safety Manual [19] ................................................ 12 Table 2. Injury Level Percentages for Each Severity Index [2]. ................................................... 15 Table 3. Minimum Design Standards [30] .................................................................................... 21 Table 4. Slope-Height Combinations ............................................................................................ 27 Table 5. Severity Calculations Based Only on Accident Data ..................................................... 28 Table 6. Severity Calculations Based on Estimated Mileage ....................................................... 32 Table 7. #(K+A) per Mile for Each Slope-Height Combination .................................................. 32 Table 8. #(K+A) per Kilometer for Each Slope-Height Combination.......................................... 33 Table 9. SI Values and Modification Factors with #(K+A) Results ............................................. 37 Table 10. Baseline and Parameter Values ..................................................................................... 42 Table 11. Accident Costs and Percent Differences for Each Parameter ....................................... 43 Table 12. RSAP Input Values ....................................................................................................... 53 Table 13. FHWA Comprehensive Accident Costs ....................................................................... 63 Table 14. Cost of each SI .............................................................................................................. 63 Table 15. Accident Cost Data for a 1V:2H Rural Local Highway ............................................... 65 Table 16. Coefficients of Equation 22 for the Year 2010 ............................................................. 66 Table 17. Trend Analysis Parameters and Their Values ............................................................... 75 Table 18. Direct Cost Calculations ............................................................................................... 89 Table 19. Severity Index Equations Based on Impact Speed ....................................................... 95
December 19, 2011 MwRSF Report No. TRP-03-251-11
1
1 INTRODUCTION
1.1 Problem Statement
Engineering judgment is used to design foreslopes. As a result, very little consistency
exists amongst engineers. Because of this inconsistency, an engineer may call for a slope that is
flatter than is required or call for a guardrail when one is not needed. To determine the best
course of action, a benefit-cost analysis would be required. Tools to conduct benefit-cost
analyses exist, such as the Roadside Safety Analysis Program (RSAP), but it can be cumbersome
to apply to every possible highway scenario and difficult to implement amongst engineers
statewide. With shrinking budgets, it has become expedient to develop a systematic approach to
designing roadside geometries and safety appurtenances that economically create a safe
environment.
A previous study was conducted that estimated the severity of crashes involving roadside
embankments, but the accuracy of that study is questionable [1]. The Roadside Design Guide
(RDG) associated these encroachments with a severity index. However, these severity indices
appear to be overestimated since they were determined from engineering judgment alone and
were primarily based on high-speed impacts [2, 3]. More accurate severity indices need to be
incorporated into RSAP to establish correct accident costs associated with a crash that involves
roadside slopes.
In addition, many run-off-road accident types are possible and include collisions with
fixed objects, embankments, and ditches with a single vehicle of multiple vehicles. This research
applies to single-vehicle run-off-road accidents only, which comprise approximately 5 percent of
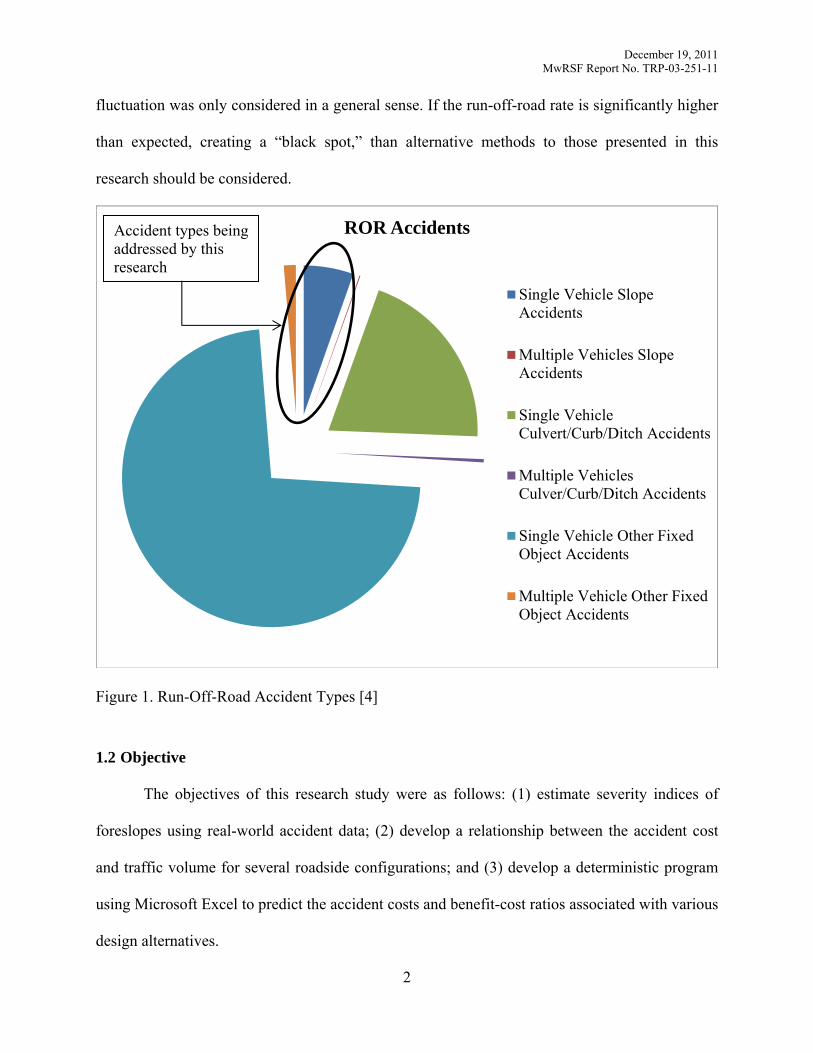
all run-off-road accidents types, according to accident data from 2008 [4]. This is demonstrated
graphically in Figure 1. The remaining accident types were considered to be outside the scope of
this project and should be analyzed using alternative methods. In addition, the run-off-road rate
December 19, 2011 MwRSF Report No. TRP-03-251-11
2
fluctuation was only considered in a general sense. If the run-off-road rate is significantly higher
than expected, creating a “black spot,” than alternative methods to those presented in this
research should be considered.
Figure 1. Run-Off-Road Accident Types [4]
1.2 Objective
The objectives of this research study were as follows: (1) estimate severity indices of
foreslopes using real-world accident data; (2) develop a relationship between the accident cost
and traffic volume for several roadside configurations; and (3) develop a deterministic program
using Microsoft Excel to predict the accident costs and benefit-cost ratios associated with various
design alternatives.
ROR Accidents
Single Vehicle SlopeAccidents
Multiple Vehicles SlopeAccidents
Single VehicleCulvert/Curb/Ditch Accidents
Multiple VehiclesCulver/Curb/Ditch Accidents
Single Vehicle Other FixedObject Accidents
Multiple Vehicle Other FixedObject Accidents
Accident types being addressed by this research
December 19, 2011 MwRSF Report No. TRP-03-251-11
3
1.3 Scope
The research objectives were achieved through the completion of several tasks. First, the
severity indices associated with roadside embankments were updated to accurately predict
accident costs. Next, an extensive test matrix was constructed for use in RSAP by varying
parameters that were most likely to influence accident costs. Next, the results from the RSAP
analyses were used to create equations for any scenario that could predict the accident cost,
which in turn could be used in a benefit-cost analysis. Finally, a Microsoft Excel program was
created to facilitate a quick and simple way to calculate accident costs associated with a
particular roadside slope crash scenario.
December 19, 2011 MwRSF Report No. TRP-03-251-11
4
2 LITERATURE REVIEW
2.1 Highway Safety
Vehicular fatalities in the United States have historically remained relatively constant,
despite an ever-growing number of vehicular miles traveled. However, in 2009, the number of
fatalities was 30,797 which was nearly 7,000 less than in 2007, and more than 3,000 less than in
2008 [5]. This decrease marks the largest of its kind over the past 15 years. This decrease was the
result of several factors including safer vehicle designs, safer roadside designs, and potentially
fewer recreational motorists due to rising fuel prices. However, the total number of vehicle miles
traveled increased by 5 billion, resulting in a decrease in the number of fatalities per 100 million
vehicle miles traveled (1.26 in 2008 to 1.13 in 2009) [5]. Of the 30,797 fatalities in 2009, 18,745
involved a single vehicle, and 9,891 of those fatalities were off the roadway [6]. The number of
fatal crashes in which the first harmful event was a collision on an embankment was 1,018 which
was 3.3 percent of all fatalities, but the total number of crashes in which the first harmful event
was a collision with an embankment was 52,000, which represented only 0.9 percent of all
accidents [6]. From this data, embankments were shown to be disproportionately high for fatal
accidents. However, the percent of fatalities has decreased slightly from 2008, which had a 3.4
percent fatality rate when a collision with an embankment was the first harmful event [4].
Although the general trend of fatal accidents from year to year is one of improvement, the
number of fatalities is still too high, indicating a need for more embankment design guidance
based on actual accident data.
2.2 Monte Carlo Simulation Technique
The Monte Carlo method generates data from known probability distributions of
important parameters, like encroachment location, speed and angle, vehicle type, and vehicle
December 19, 2011 MwRSF Report No. TRP-03-251-11
5
orientation. This technique allows its user to generate as much data as is required without ever
running physical tests. As a result, thousands of simulations can be run in only seconds,
generating the average number of impacts, the average speed and angle of the impact, and
ultimately, the average accident cost, as determined from the foreslope type and the severity of
the impact. However, the actual number of simulations required to produce an indicative result is
impossible to estimate beforehand. Instead, a block of simulations (for example 20,000
encroachments) is tested, and the accident cost is determined. Then another block is added, and
the accident cost is checked for any changes from the first block. If that change is less than 1
percent (high convergence), the simulation ceases. Otherwise, the process is repeated until the
convergence criterion is met. In addition to the end result (accident costs), the randomly
generated parameters (encroachment location, speed and angle, vehicle type, and vehicle
orientation) are checked for uniformity from one block to the next. This check ensures that the
average accident costs are correct and that the simulation does not end too soon [3].
The Monte Carlo simulation technique was used because it is capable of simulating
parameters that need to be combined. This combination creates an unpredictable probability
distribution. However, the probability distribution of combined parameters is not needed in this
technique. Only the distributions of the individual parameters are required. The Monte Carlo
method is also very capable of simulating independent parameters. These parameters, vehicle
type and vehicle orientation, were selected based on separate random processes. These
parameters were considered independent because no conclusive data linked these parameters to
other parameters. Dependent parameters must be combined into a common random number
generation process. Speed and angle are connected by physical limitations while cornering.
Similarly, the location of the encroachment depends on the segment in which the encroachment
December 19, 2011 MwRSF Report No. TRP-03-251-11
6
occurs, the location within the segment, the direction of travel, the lane in which the
encroachment originates, and the direction of the encroachment [3].
Each parameter was scaled to be uniformly distributed (except encroachment location).
Without this scaling, the probability of some of the severe impact conditions would likely
eliminate some fatal or severe accidents from the scenario. Because these events have the largest
effect on accident costs, they need to be included. Therefore, a scaling factor was applied to each
cell that was assigned to a probability of occurrence for each parameter. Later, the average crash
cost was divided by this scale factor to determine an average encroachment cost. This process
had no effect on the actual average costs, but it dramatically reduced the effect of over- and
under-sampling of the extreme events. The distribution for encroachment location was not scaled
because the encroachment may occur at any location along a segment (continuous parameter).
Hence, the probability of each location was zero, and the scale factor approached infinity.
However, the probability distribution was still uniform since the segment was broken up into
equal sub-segments, and each one had the same chance of producing an encroachment.
Random numbers were generated from a linear congruent generator and were used to
create encroachment samples. A pseudo-code was created to generate numbers from a start point
or seed number [7, 8]. If the same seed number was used, the same random numbers were
generated. RSAP uses a dual generator, thus increasing the period of randomness; after which,
the numbers were no longer random. Additionally, a shuffling process was used to increase the
randomness of the output [9].
A drawback to this random process was that no two runs would be the same, in theory.
Output was allowed to vary within the convergence criteria set by the user. Therefore, results
cannot be viewed as deterministic. For example, if a benefit-cost (BC) ratio between alternatives
December 19, 2011 MwRSF Report No. TRP-03-251-11
7
1 and 2, with 1 being the do-nothing alternative, was 2.01, the engineer cannot conclude that it
was always better to select alternative 2. The next attempted analysis may yield a BC ratio of
1.99 without changing any parameters.
2.3 Accident Prediction
2.3.1 RSAP
RSAP uses two modules to predict accident events. First, the program must simulate an
encroachment based on encroachment frequency data. Second, for each encroachment, RSAP
determines if the vehicle will strike any fixed object or slope using the crash prediction module.
Once a crash is predicted, it determines the severity of the impact using the crash severity
module. From the severity, an average accident cost is determined, which in turn, is used to
calculate the BC ratio in the BC analysis.
First, an encroachment must be simulated. A study done by Cooper in the late 1970s was
the basis for the encroachment module used in RSAP [10]. However, limitations to this study
have forced researchers to modify the results. First, encroachments of less than 13.1 ft (4.0 m)
were undetectable due to paved shoulders. The results were reanalyzed after excluding
encroachments that extended less than 13.1 ft (4.0 m) laterally. It was estimated that
encroachments were underreported by a ratio of 2.466 and 1.878 on two-lane undivided and
multi-lane divided highways respectively, and the encroachment frequencies were adjusted
upward accordingly [3]. In addition, controlled and uncontrolled encroachments could not be
distinguished. Examples of a controlled encroachment include implements of husbandry driving
off the pavement or a vehicle pulled over to the side of the road to switch drivers. It was believed
that these controlled encroachments were less in number than the uncontrolled encroachments. In
fact, a study was done that examined the number of impacts on longitudinal barriers and the
December 19, 2011 MwRSF Report No. TRP-03-251-11
8
number of actual reported accidents. From that study, 60 percent of the accidents were reported
to the police [11]. Therefore, the encroachment frequencies were again modified by multiplying
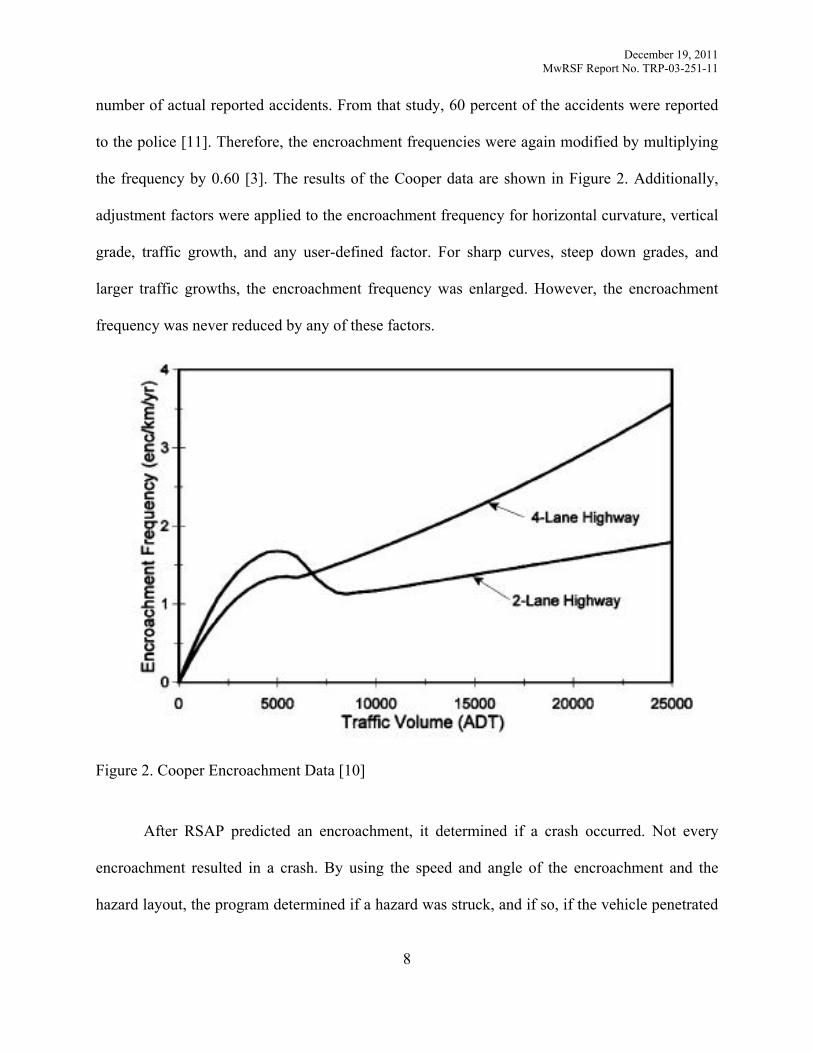
the frequency by 0.60 [3]. The results of the Cooper data are shown in Figure 2. Additionally,
adjustment factors were applied to the encroachment frequency for horizontal curvature, vertical
grade, traffic growth, and any user-defined factor. For sharp curves, steep down grades, and
larger traffic growths, the encroachment frequency was enlarged. However, the encroachment
frequency was never reduced by any of these factors.
Figure 2. Cooper Encroachment Data [10]
After RSAP predicted an encroachment, it determined if a crash occurred. Not every
encroachment resulted in a crash. By using the speed and angle of the encroachment and the
hazard layout, the program determined if a hazard was struck, and if so, if the vehicle penetrated
December 19, 2011 MwRSF Report No. TRP-03-251-11
9
through the hazard and struck another hazard. Hazards programmed by the user were sorted by
their longitudinal position relative to the beginning of the segment. They were placed on the
correct side of the road or in the median and were moved laterally to the specified offset from the
edge of the traveled way. Finally, the vehicle swath was determined. Based on the encroachment
module, the vehicle speed, direction, and orientation were all simulated using the Monte Carlo
method. If any object was in the vehicle swath, a crash was predicted. These objects were
equipped with penetration data, such that, if the vehicle had enough energy, it could penetrate
through the object and continue on, possibly striking another object. However, this study focused
on foreslopes, where no penetration could occur. Therefore, a crash was predicted if the extent of
lateral encroachment exceeded the offset to the top edge of the slope.
This module assumed the vehicle maintained a constant angle throughout the event (i.e., a
straight line) and a constant orientation. In addition, the vehicle speed did not change as a result
of braking. These three assumptions combined into one basic assumption, driver behavior was
ignored. This means the driver’s attempt to maneuver away from the foreslope or to slow down
before reaching the bottom was not considered. In addition, RSAP currently does not modify
severity indices based on vehicle orientation, but it would be possible to modify the program to
change the severities once it is known how different orientations can affect the severity. In
addition to using a straight-line encroachment, RSAP also does not attempt to predict a rollover
on foreslopes. This is concerning because as much only 14 percent of all rollovers are caused by
striking a fixed object [15]. Currently, RSAP generates a random number that selects the speed
and angle of the encroachment, but that angle remains constant throughout the simulation. Under
the National Cooperative Highway Research Program (NCHRP) Project 22-27, RSAP is being
December 19, 2011 MwRSF Report No. TRP-03-251-11
10
updated using Visual Basic and Excel [16]. In this updated version, curvi-linear encroachments
will be included by randomly selecting one possible encroachment path.
2.3.2 Additional Encroachment Models
Other competing encroachment models exist. First, Hutchinson and Kennedy conducted a
study on a stretch of an interstate in Illinois in the 1960s [12]. Their data indicated the same
approximate relationship between the traffic volume and the encroachment frequency as
Cooper’s results. However, new statistical tools had been developed and used by Davis to show
that the Hutchinson and Kennedy results were influenced by the weather and by the sampling
technique more than the traffic volume [13]. Because the Cooper data and the Hutchinson and
Kennedy data show a similar trend, the statistical analysis that Davis used should be applied to
Cooper’s data as well to see if the encroachment frequency held a dependence on weather or
sampling techniques. Miaou proposed another method of predicting encroachment frequencies
from accident data taken from single-vehicle, run-off-road (SVROR) accidents in Alabama,
Michigan, and Washington [14]. From those accidents, the probability of a SVROR accident
occurring for a given roadside could be estimated. By multiplying that probability by the traffic
volume, the expected number of accidents for that roadside configuration could be estimated.
From this accident model, and by using the traffic volume and length of the roadway segment,
the encroachment frequency model was created. These results indicated a monotonic relationship
between traffic volume and the encroachment frequency per year per mile, as opposed to the
results presented by both Cooper and Hutchinson and Kennedy.
2.3.3 Other Accident Prediction Methods
Zegeer approached accident prediction in a different way by determining a percent
reduction in the number of crashes for several roadside features [17]. Of particular note, the

December 19, 2011 MwRSF Report No. TRP-03-251-11
11
effect of sideslopes on single-vehicle accidents and on rollovers was investigated. He concluded
that steeper slopes had higher accident rates and that slopes steeper than 1 Vertical: 4 Horizontal
(1V:4H), had significantly higher rollover rates than slopes that were 1V:5H or flatter. Even
more importantly, slopes that were 1V:3H or steeper had significantly higher single-vehicle
accident rates than foreslopes that were 1V:4H or flatter. This trend was also shown in the results
outlined in the research contained herein.
Using the same data that Miaou used (Alabama, Michigan, and Washington), Zegeer
analyzed 595 accidents and developed an equation that accounted for the steepness of the slope,
the lane width, the roadside recovery distance, the traffic volume, and the shoulder width. Using
this equation, he developed a table of percent reductions in the number of single-vehicle
accidents. These reductions were used to reduce the number of known accidents on one slope to
the number of expected accidents on another slope. Zegeer’s work was later modified slightly to
create crash modification factors (CMF). These factors were first published in the NCHRP
Report No. 617 and again in the Highway Safety Manual [18, 19]. Instead of reducing the
number of known accidents by 10 percent, the number of known accidents was multiplied by
0.90. The tabulated CMFs that were determined from Zegeer’s work and applied to single-
vehicle accidents are shown in Table 1.
December 19, 2011 MwRSF Report No. TRP-03-251-11
12
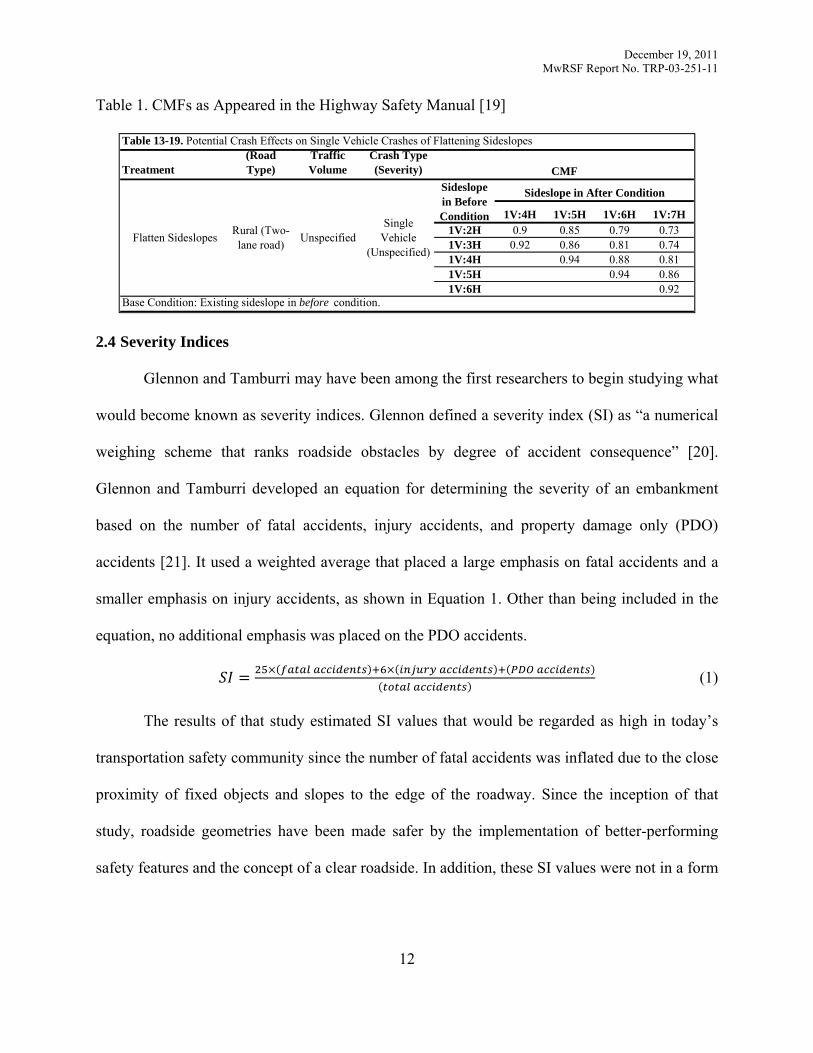
Table 1. CMFs as Appeared in the Highway Safety Manual [19]
2.4 Severity Indices
Glennon and Tamburri may have been among the first researchers to begin studying what
would become known as severity indices. Glennon defined a severity index (SI) as “a numerical
weighing scheme that ranks roadside obstacles by degree of accident consequence” [20].
Glennon and Tamburri developed an equation for determining the severity of an embankment
based on the number of fatal accidents, injury accidents, and property damage only (PDO)
accidents [21]. It used a weighted average that placed a large emphasis on fatal accidents and a
smaller emphasis on injury accidents, as shown in Equation 1. Other than being included in the
equation, no additional emphasis was placed on the PDO accidents.
(1)
The results of that study estimated SI values that would be regarded as high in today’s
transportation safety community since the number of fatal accidents was inflated due to the close
proximity of fixed objects and slopes to the edge of the roadway. Since the inception of that
study, roadside geometries have been made safer by the implementation of better-performing
safety features and the concept of a clear roadside. In addition, these SI values were not in a form
Table 13-19. Potential Crash Effects on Single Vehicle Crashes of Flattening Sideslopes
Treatment(Road Type)
Traffic Volume
Crash Type (Severity)
1V:4H 1V:5H 1V:6H 1V:7H1V:2H 0.9 0.85 0.79 0.731V:3H 0.92 0.86 0.81 0.741V:4H 0.94 0.88 0.811V:5H 0.94 0.861V:6H 0.92
Base Condition: Existing sideslope in before condition.
CMF
Sideslope in After ConditionSideslope in Before Condition
Rural (Two-lane road)Flatten Sideslopes Unspecified
Single Vehicle
(Unspecified)
December 19, 2011 MwRSF Report No. TRP-03-251-11
13
commonly used today, which is a scale of 1 to 10, with 10 being fatal. Instead, Glennon’s results
could exceed 10 if the percentage of fatalities and severe injuries was high.
Weaver, Post, and French began work on severity index estimation in 1975 [1]. Their
approach would define severity indices on a set scale from 0 to 10, with 10 representing a 100
percent fatality rate. They also recommended a definition for each severity on the scale that
included the percent of PDO accidents, injury accidents, and fatal accidents. These definitions
were based primarily on survey response in which participants were asked to rank objects by
their severity. This allowed them to estimate severity indices by examining accident reports for
various roadside features. They estimated the severity index to be 3.0 on a roadside slope that
was, as they described, built up of “sod.” No distinction was made between slope steepnesses.
Zegeer and Parker worked to estimate the severity of utility poles [22]. Their work was
significant in that it looked at fatal and injury accidents to indicate the severity of the object. In
addition to this adjusted approach, they were able to conclude the variability in the number of
these extreme accidents was high from state to state.
McFarland and Rollins wanted to validate the definitions set forth by Weaver et al. [23].
To do so, they examined 136,000 accidents between 1978 and 1979 in Texas. From their results,
Weaver’s recommendations were too high in most cases. However, for trees in particular,
Weaver’s recommendation was too low. Either way, it was shown that relying on survey
responses is not a suitable way to determine accurate and reliable severity indices.
Brogan and Hall conducted a study on fixed objects in New Mexico from 1980 to 1982
[24]. Their primary observation was that the magnitude of the severity index alone was not
enough to describe the consequence of striking the object. The exposure of that object was also
required. This would allow the researcher to estimate average annual accident costs by
December 19, 2011 MwRSF Report No. TRP-03-251-11
14
multiplying the cost of one accident, according to the severity scale and the associated severity
costs, by the accident frequency for any given year.
In 1985, Mak began estimating the relative severity of object impacts based on the
percent of fatal (K) and incapacitating injury (A) accidents ((K+A) accidents) [25]. The SI value
was relative because the percent of (K+A) accidents at the target site was divided by the percent
of (K+A) accidents at all sites. For the purposes of embankments, accident data taken from the
National Accident Sampling System (NASS) was used, but no distinction between slope
steepness was made.
The 1996 RDG makes use of a set of SI values for many slope and height combinations,
as well as for several design speeds [26]. Subsequent editions of the RDG did not publish all
severity indices but rather referred to the 1996 edition. Those values were believed to be
inaccurate in part because they were based on the design speed and not the impact speed.
Because design speed was used, it was possible to get a positive value for an SI when the speed
was zero, which is erroneous for any foreslope with a definable slope. RSAP utilizes these
severity indices, but the values were modified by passing a line through the origin and the SI
values at each speed [3]. The square of the distance between that line and the SI values was
minimized, resulting in a linear relationship between impact speed and the severity index. This
impact speed was randomly chosen from a speed distribution associated with the functional
class; therefore, the engineer does not need to know the impact speed.
The first step in determining new severity indices based on real-world accident data
would be to analyze accident reports filed by police officers. Police reports use a 5-level rating
scale to describe accidents. This rating system is known as the KABCO scale, and its description
is as follows:
December 19, 2011 MwRSF Report No. TRP-03-251-11
15
• K – Fatal injury
• A – Severe or incapacitating injury
• B – Moderate or non-incapacitating injury
• C – Minor or possible injury, and
• O – Property Damage Only (PDO)
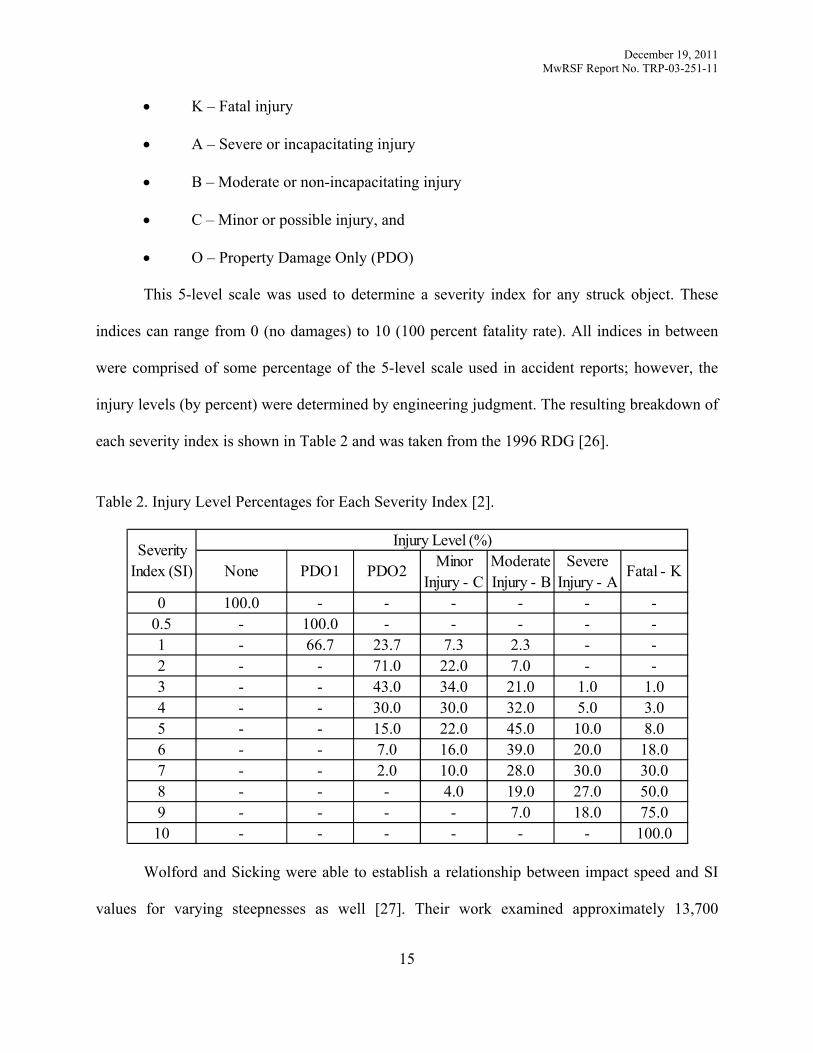
This 5-level scale was used to determine a severity index for any struck object. These
indices can range from 0 (no damages) to 10 (100 percent fatality rate). All indices in between
were comprised of some percentage of the 5-level scale used in accident reports; however, the
injury levels (by percent) were determined by engineering judgment. The resulting breakdown of
each severity index is shown in Table 2 and was taken from the 1996 RDG [26].
Table 2. Injury Level Percentages for Each Severity Index [2].
Wolford and Sicking were able to establish a relationship between impact speed and SI
values for varying steepnesses as well [27]. Their work examined approximately 13,700
None PDO1 PDO2 Minor Injury - C
Moderate Injury - B
Severe Injury - A
Fatal - K
0 100.0 - - - - - -0.5 - 100.0 - - - - -1 - 66.7 23.7 7.3 2.3 - -2 - - 71.0 22.0 7.0 - -3 - - 43.0 34.0 21.0 1.0 1.04 - - 30.0 30.0 32.0 5.0 3.05 - - 15.0 22.0 45.0 10.0 8.06 - - 7.0 16.0 39.0 20.0 18.07 - - 2.0 10.0 28.0 30.0 30.08 - - - 4.0 19.0 27.0 50.09 - - - - 7.0 18.0 75.010 - - - - - - 100.0
Injury Level (%)Severity Index (SI)
December 19, 2011 MwRSF Report No. TRP-03-251-11
16
accidents on embankments alone in the State of Michigan and even more in Utah between the
years 1985 and 1992. They established representative foreslopes for rural interstates, rural
arterials, and rural collectors, which had foreslopes of 1V:4H, 1V:3.5H, and 1V:2.5H,
respectively. In addition, the average depth of these foreslopes was 6.6 ft (2.0 m). Using the
percentage of each accident type on the KABCO scale, an average severity was calculated for
each foreslope. From the results, additional severity relationships were extrapolated from the
three known slope severities for depths of 6.6 ft (2.0 m).
The default version of RSAP (version 2003.04.01) used the severity indices contained in
the 1996 RDG, but those values were modified [3]. The modification was imposed to derive the
severity index as a function of impact speed. The values listed in the RDG were based on the
design speed. To adjust the SI values, a line was passed through the origin and through the SI
values at each speed. The square of the distance between the line and each of the points was
minimized. The result was a linear relationship between the impact speed and the SI, where an
impact speed of zero would produce an SI of zero.
Unfortunately, the validity of the severity indices determined using Table 2 were
questionable because they were also determined by survey responses. Recall, McFarland and
Rollins showed that Weaver’s results were incorrect, and Weaver’s results used an injury
percentage table very similar to that shown in Table 2. A possible reason for potential errors in
these values was most of the accidents included in the survey were biased toward higher speeds.
As a result, the average severity indices tend to be overestimated. This means that average
accident costs will be over-estimated as well. For use in RSAP, the severity index for each
feature is defined as a linear line between 0 and 60 mph (96.6 km/h). This gives a unit of
increase in the SI per unit of increase in impact speed. The values below are the values used in
December 19, 2011 MwRSF Report No. TRP-03-251-11
17
RSAP version released with the 1996 RDG. They were taken from the RSAP User’s Manual
[28].
SI at Rate of SI at Type No. Description 0 mph Slope 60 mph Category 1 = Foreslopes 7 1V:6H, H >=0.3 m (1 ft) 0.0 0.0286 1.72 9 1V:4H, H 0.3 m (1 ft) 0.0 0.0378 2.27 10 1V:4H, H >=2.0 m (7 ft) 0.0 0.0430 2.58 12 1V:3H, H 0.3 m (1 ft) 0.0 0.0458 2.75 13 1V:3H, H 2.0 m (7 ft) 0.0 0.0578 3.47 14 1V:3H, H 4.0 m (13 ft) 0.0 0.0597 3.58 19 1V:2H, H 0.3 m (1 ft) 0.0 0.0562 3.37 20 1V:2H, H 2.0 m (7 ft) 0.0 0.0778 4.67 21 1V:2H, H 4.0 m (13 ft) 0.0 0.0841 5.05 2.5 RSAP Input Values
Three categories of foreslopes have been defined by the American Association of State
Highway Transportation Officials (AASHTO) in the 2006 RDG [2]. They are recoverable, non-
recoverable, and critical. A recoverable slope was as a 1V:4H slope or flatter. A motorist can
safely and easily traverse a recoverable slope by slowing down or coming to a stop.
A non-recoverable slope can be traversed. When vehicles encroach on non-recoverable
slopes, the vehicle will most likely reach the toe of the slope and extend beyond that point. When
a barn roof configuration is used, and the non-traversable slope is within the extent of lateral
encroachment, clear zone widths must extend beyond the toe of the non-recoverable slope far
enough to provide the driver with room to come to a safe stop. The RDG defines slopes between
December 19, 2011 MwRSF Report No. TRP-03-251-11
18
1V:3H and 1V:4H as non-recoverable [2]. A flat run-out area would be required at the base of
non-recoverable slopes even if a barn-roof cross-section was not used.
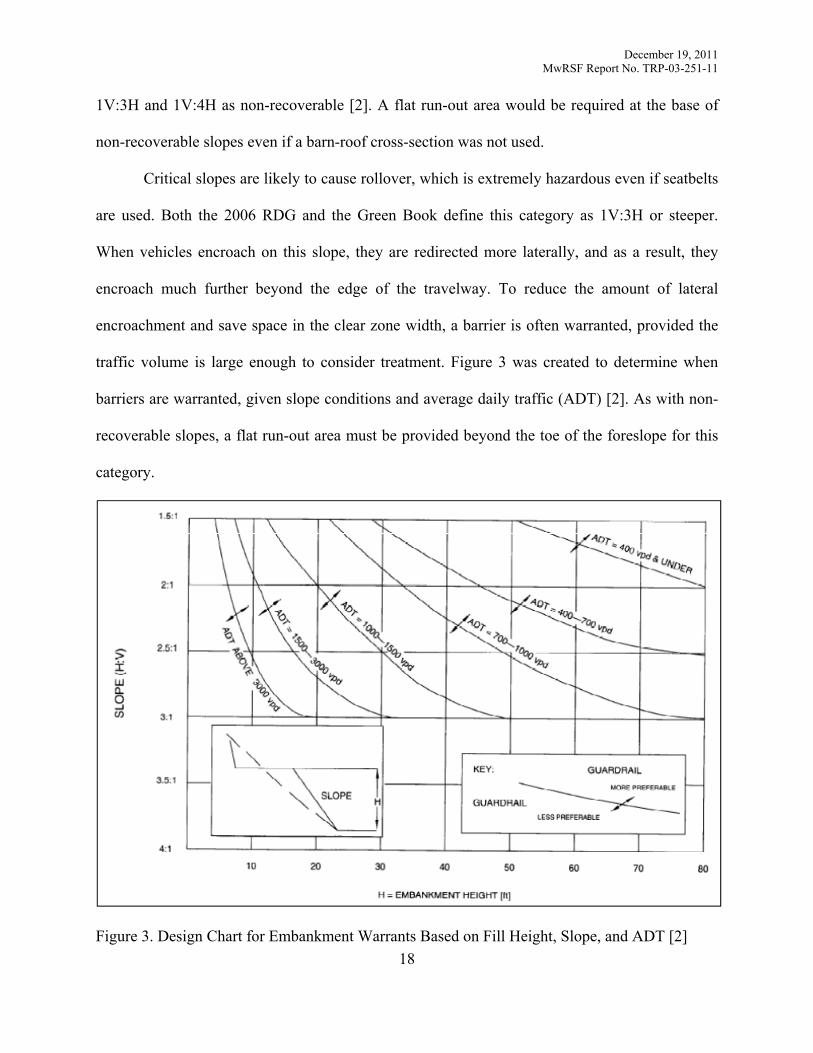
Critical slopes are likely to cause rollover, which is extremely hazardous even if seatbelts
are used. Both the 2006 RDG and the Green Book define this category as 1V:3H or steeper.
When vehicles encroach on this slope, they are redirected more laterally, and as a result, they
encroach much further beyond the edge of the travelway. To reduce the amount of lateral
encroachment and save space in the clear zone width, a barrier is often warranted, provided the
traffic volume is large enough to consider treatment. Figure 3 was created to determine when
barriers are warranted, given slope conditions and average daily traffic (ADT) [2]. As with non-
recoverable slopes, a flat run-out area must be provided beyond the toe of the foreslope for this
category.
Figure 3. Design Chart for Embankment Warrants Based on Fill Height, Slope, and ADT [2]
December 19, 2011 MwRSF Report No. TRP-03-251-11
19
Foreslopes are typically given in the form of 1V:4H or 1V:3H, but these values actually
represent a range of slopes. In this report, the boundary for a slope was represented by the middle
value between adjacent slopes. For example, a 1V:3H slope represents all slopes between
1V:2.5H and 1V:3.5H. Additionally, because a 1V:5H slope was not used, a 1V:4H slope
represented slopes between 1V:3.5H and 1V:5H because the next flattest slope was a 1V:6H
slope.
In addition to foreslopes, a guardrail system was examined. Two prevailing methods for
determining the length-of-need of a guardrail system exist. The first, presented in the 2006 RDG,
was based on an encroachment frequency study conducted by Hutchinson and Kennedy [12].
However, this study was likely affected by the unfamiliarity of the motorists to the interstate
because the study began when the interstate was just opened. This was supported by the fact that
the number of low-angle encroachments was much larger in the study than in similar studies,
which indicated the willingness of the motorist to pull over and would be classified as a
controlled encroachment, and not relevant to encroachment frequencies used in BC analyses. The
large number of the low-angle encroachments erroneously increased the travel length of the
vehicle, which in turn erroneously increased the required length-of-need of the guardrail. In
addition to the low-angle, controlled encroachments, evidence has recently been presented that
shows Hutchinson’s and Kennedy’s data was affected by time trends and seasonal weather
conditions [13]. Instead of a direct link between encroachment frequency and only ADT, the
authors of the new study concluded that encroachment frequency was also a function of the
weather conditions, with a higher frequency expected in the winter months.
The second method is presented in the NCHRP Report No. 638: Guidelines for Guardrail
Implementation [30]. Like the 2006 RDG method, this method relies on encroachment frequency
December 19, 2011 MwRSF Report No. TRP-03-251-11
20
data to conduct a BC analysis. Unlike the 2006 RDG method, this method uses the Cooper
encroachment frequency study [10]. This data indicated the same trend in the traffic volume as
the Hutchinson and Kennedy data; however, this study was not influenced by driver
unfamiliarity. The length of low-angle encroachments was not as long as the corresponding
length in the Hutchinson and Kennedy data. Because this length was shorter, the required runout
length was shorter, as confirmed in studies conducted by Sicking, Wolford, and Coon [31, 32].
In addition to providing an alternative method for calculating the length-of-need of a
guardrail system, NCHRP Report No. 638 can be helpful in determining values for other
parameters, such as minimum slopes, maximum degrees of curvature, and maximum grades [30].
In addition, offsets were determined from the minimum shoulder widths, assuming the worst-
case scenario would place the slope at minimum distances from the edge of the shoulder.
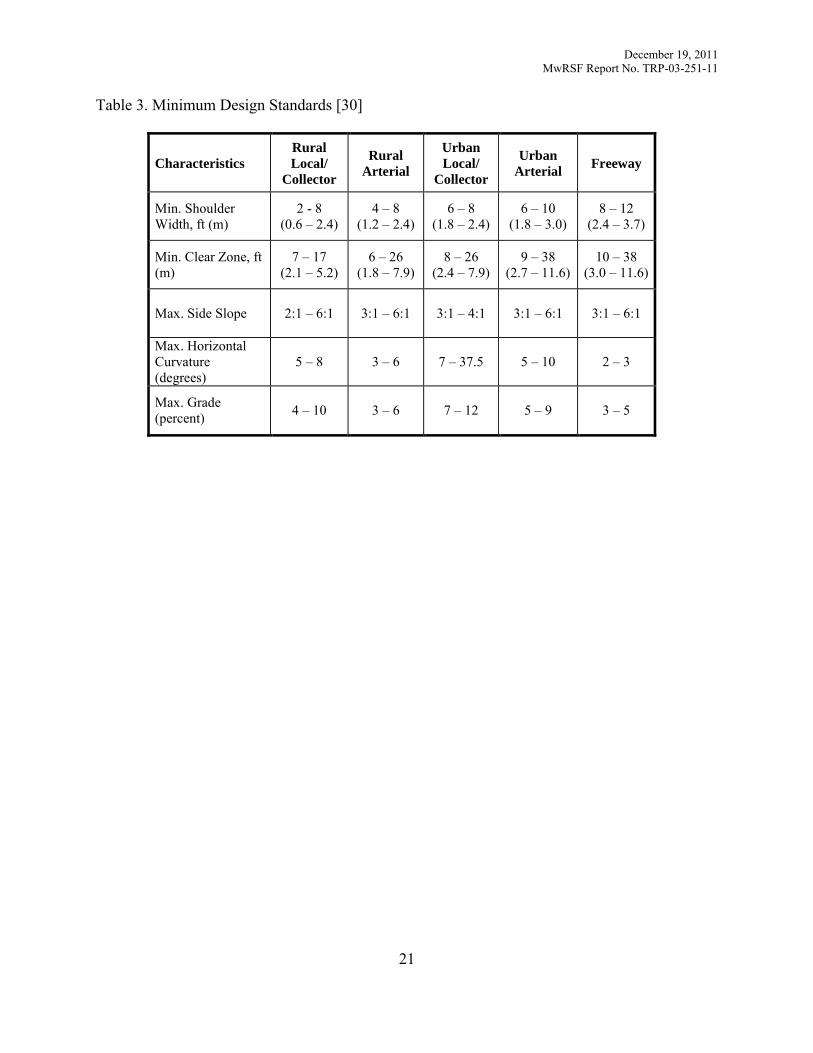
NCHRP Report No. 638 surveyed four states (Iowa, Louisiana, New York, and Oregon) to
determine minimum design standards for different functional classes. The results of that survey
are shown in Table 3.
December 19, 2011 MwRSF Report No. TRP-03-251-11
21
Table 3. Minimum Design Standards [30]
Characteristics Rural Local/
Collector
Rural Arterial
Urban Local/
Collector
Urban Arterial Freeway
Min. Shoulder Width, ft (m)
2 - 8 (0.6 – 2.4)
4 – 8 (1.2 – 2.4)
6 – 8 (1.8 – 2.4)
6 – 10 (1.8 – 3.0)
8 – 12 (2.4 – 3.7)
Min. Clear Zone, ft (m)
7 – 17 (2.1 – 5.2)
6 – 26 (1.8 – 7.9)
8 – 26 (2.4 – 7.9)
9 – 38 (2.7 – 11.6)
10 – 38 (3.0 – 11.6)
Max. Side Slope 2:1 – 6:1 3:1 – 6:1 3:1 – 4:1 3:1 – 6:1 3:1 – 6:1
Max. Horizontal Curvature (degrees)
5 – 8 3 – 6 7 – 37.5 5 – 10 2 – 3
Max. Grade (percent) 4 – 10 3 – 6 7 – 12 5 – 9 3 – 5
December 19, 2011 MwRSF Report No. TRP-03-251-11
22
3 RESEARCH APPROACH
An accident report database from the State of Ohio in the year 2000 was used in an
attempt to understand the correlation between roadside geometries and accident severities. From
this data, a more accurate subset of severity indices was created and integrated into RSAP. A test
matrix was constructed to adequately cover possible roadway configurations, and these
configurations were analyzed by RSAP. The results from this analysis were used to determine
the coefficients of linear equations that could be used to calculate the accident cost as a function
of the ADT. The first step was to determine accurate severity indices for foreslopes. A severity
index is a number from zero to ten used to estimate the societal cost in the form of property
damages, injuries, and fatalities or a combination of the three.
Current severity indices are overestimated because the surveys that were used to
determine them were representative of high-speed impacts [3]. As a result, the benefit of
improved safety features would be underestimated. This benefit would be observed in the form
of reduced societal costs. Therefore, the severity indices must be updated to accurately reflect
damages associated with impacts with roadside slopes. This was completed using data taken
from the Highway Safety Information System (HSIS) for Ohio. This data included accident
locations, highway names and classifications (such as State Route, U.S. Route, or Interstate),
county name, number of vehicles involved in the accident, accident location (on or off the road),
number of passengers, accident severities (on a 1-5 scale, with 1 being fatal), first harmful event,
and most harmful event. From this database, the accidents were sorted to include SVROR
accidents where no fixed objects were struck, and the most harmful event was an impact with a
slope or embankment. To do so, the HSIS Guidebook for the Ohio State Data Files was used
[37].
December 19, 2011 MwRSF Report No. TRP-03-251-11
23
In addition to the accident data provided in the HSIS files, cross-sectional measures were
taken using the Ohio Geographically Referenced Information Program (OGRIP) and a
topographical tool called Global Mapper [38]. The State of Ohio provided data pertaining to the
location of highways and county lines in the form of graphical layers. The OGRIP included Light
Detection and Ranging (LiDAR) files for 25,000 square foot (2,322.6 square-meter) tiles. These
tiles and the state layers for highways and county lines could be read by Global Mapper and were
used to locate and measure three-dimensional features, such as the slope and height of the
embankment. These measurements were recorded to the nearest tenth (e.g., 1V:3.4H). This was
done because Global Mapper records the slope as a percentage to the nearest tenth. For example,
the measurement may read 29.4 percent. By dividing 100 by this measurement, the run-to-rise
ratio becomes 100:29.4, or 1V:3.4H. The results of these measurements were combined with the
HSIS database of accidents to establish a link between accident severities and the roadside
geometries.
Slopes can be classified by their steepness. They are described in terms of the ratio of the
vertical distance to the horizontal distance. Flat slopes typically have one unit of vertical distance
to every six units of horizontal distance (1V:6H), whereas steep slopes are typically steeper than
1V:3H. The results of a preliminary analysis indicated that the severity of the flatter slopes was
the same as the severity of the steeper slopes; however, intuition would suggest otherwise. This
can be explained by the fact that less severe accidents (which occur mostly on flatter slopes)
were not reported. If they had been, the average severity of the flatter slopes would have been
reduced. To account for the missing accidents, the number of severe or fatal accidents in each
slope category was used to adjust the severity calculations in RSAP by assuming a linear
relationship between the number of these extreme accidents and the mileage of each slope
December 19, 2011 MwRSF Report No. TRP-03-251-11
24
category. These slope categories were ranges of slopes derived from the slope classifications of
recoverable, nonrecoverable, and critical, as defined in the 2006 RDG [2].
Using trial-and-error, the severity index modification factor used by RSAP was modified
until the number of severe or fatal accidents predicted by RSAP matched the accident data found
in the HSIS files. Once the severity indices were corrected, roadside configurations were
developed and programmed into RSAP. A test matrix was established representing a wide
spectrum of possible scenarios. RSAP was allowed to run continuously until all the scenarios
were simulated. The results were tabulated and used to develop models that could be used to
predict the accident cost directly from the applicable ADT value. The coefficients for these
equations are presented in this report. In addition, a Microsoft Excel program was created that
automatically calculates an accident cost for any ADT and scenario. This calculation included
linear interpolation between two known accident costs at known parameter inputs and linear
extrapolation beyond the range of known values.
December 19, 2011 MwRSF Report No. TRP-03-251-11
25
4 SEVERITY INDICES FOR FORESLOPES
4.1 Problem
Attempts to estimate severity indices (SIs) have been made for many different roadside
features, including foreslopes. One prevailing method used to estimate these indices was to
survey highway safety officials about accidents in which those officials were asked to rank the
severity of accidents on a scale of 1 to 10. Those responses are believed to have been biased
towards high-speed accidents, and as a result, the average severity indices were overestimated
[3]. In order to conduct an accurate BC analysis on the effect of flattening slopes, these SI values
needed to be updated because they have the single largest influence on the accident cost of a
given scenario. For example, a severity-index change from 2.52 to 3.23 (a 28.2 percent increase)
resulted in an accident-cost change from $38,644.50 to $84,383.90 (a 118.4 percent increase).
This problem gave rise to a set of objectives that were partially separate from the original
objectives of the research.
4.2 Objectives
First, new SI values were developed based on actual accident data, as opposed to the
opinions of safety officials. This objective would not only be necessary for the completion of this
research, but it may also be useful in other BC analyses involving roadside foreslopes.
Second, the new SI values were implemented into the BC analysis tool, RSAP, to
produce more accurate accident costs, which can be used to determine the cost-effectiveness of
flattening a slope.
December 19, 2011 MwRSF Report No. TRP-03-251-11
26
4.3 Accident Data Description and Analysis
4.3.1 Data Description and Preliminary Analysis
Accident data collected by law enforcement officials in the State of Ohio in the year
2000, recorded in the HSIS, was used to estimate new severity indices for foreslopes. The
original data population included 17,948 accidents. These accidents were then filtered to include
only SVROR accidents where no fixed object was struck and an embankment or ditch impact
was included in at least one impact event, reducing the number of accidents to 1,294. Each
accident was assigned a severity value on a scale of 1 to 5 with 1 being fatal and 5 being a PDO
accident. The location of the accident was also included in the HSIS and was used to find the site
on Global Mapper, at which point, the slopes and heights at each accident location were
measured and recorded.
When combining the results of the accident data severities and the cross-sectional
measurements, the number of (K+A) accidents per mile per slope-height category could be
estimated. To do this, each accident was sorted into one of nine categories. Those categories
were developed by combining the slope with the height. Four slopes were chosen to be consistent
with RSAP: (1) 1V:2H for critical slopes; (2) 1V:3H for non-recoverable slopes; (3) 1V:4H for
recoverable slopes; and (4) 1V:6H, also for recoverable slopes. Three height categories were
chosen as well. Short heights were considered less than 4 ft (1.2 m) tall. Medium heights were
considered greater than or equal to 4 ft (1.2 m) but less than 10 ft (3.0 m) tall, and tall slopes
were considered greater than or equal to 10 ft (3.0 m) tall. The 1V:2H and 1V:3H slopes utilized
all three height categories, creating six combinations. The medium and tall heights were
combined into one category and used with the short height category for the 1V:4H slope,
creating two combinations. Finally, all three height combinations were combined into one
December 19, 2011 MwRSF Report No. TRP-03-251-11
27
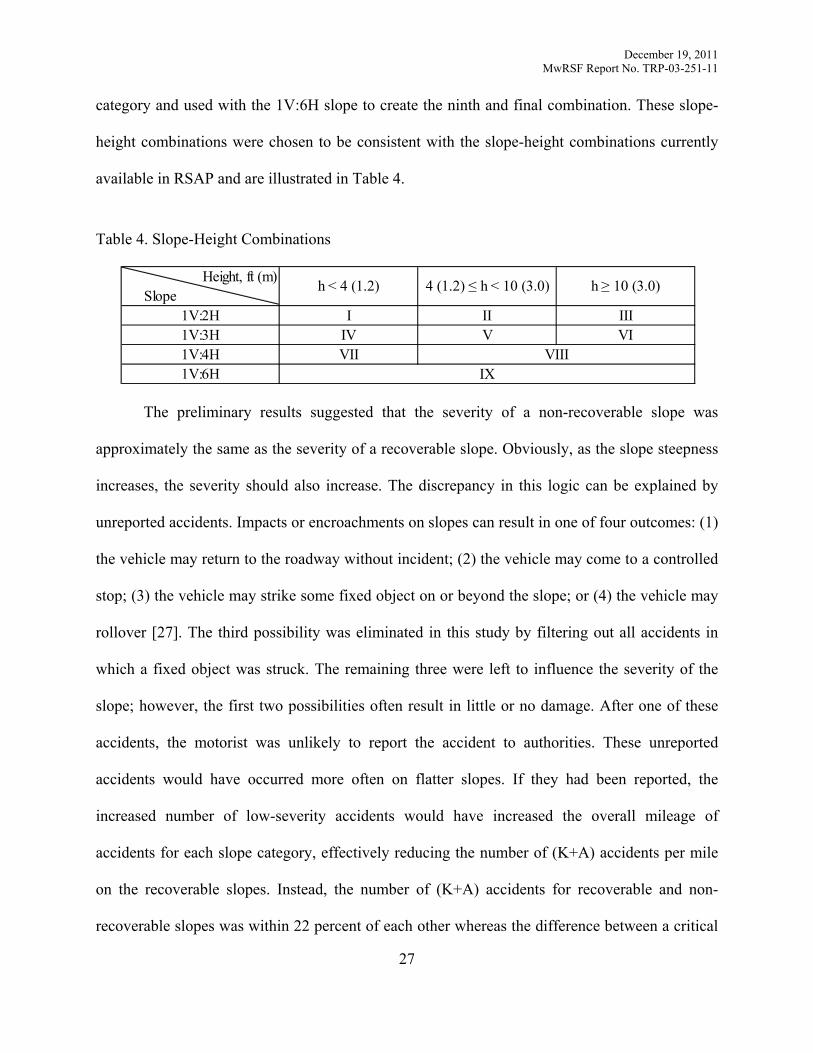
category and used with the 1V:6H slope to create the ninth and final combination. These slope-
height combinations were chosen to be consistent with the slope-height combinations currently
available in RSAP and are illustrated in Table 4.
Table 4. Slope-Height Combinations
The preliminary results suggested that the severity of a non-recoverable slope was
approximately the same as the severity of a recoverable slope. Obviously, as the slope steepness
increases, the severity should also increase. The discrepancy in this logic can be explained by
unreported accidents. Impacts or encroachments on slopes can result in one of four outcomes: (1)
the vehicle may return to the roadway without incident; (2) the vehicle may come to a controlled
stop; (3) the vehicle may strike some fixed object on or beyond the slope; or (4) the vehicle may
rollover [27]. The third possibility was eliminated in this study by filtering out all accidents in
which a fixed object was struck. The remaining three were left to influence the severity of the
slope; however, the first two possibilities often result in little or no damage. After one of these
accidents, the motorist was unlikely to report the accident to authorities. These unreported
accidents would have occurred more often on flatter slopes. If they had been reported, the
increased number of low-severity accidents would have increased the overall mileage of
accidents for each slope category, effectively reducing the number of (K+A) accidents per mile
on the recoverable slopes. Instead, the number of (K+A) accidents for recoverable and non-
recoverable slopes was within 22 percent of each other whereas the difference between a critical
Height, ft (m)Slope
I II IIIIV V VIVII
1V:6H1V:4H1V:3H1V:2H
h ≥ 10 (3.0)4 (1.2) ≤ h < 10 (3.0)h < 4 (1.2)
VIIIIX
December 19, 2011 MwRSF Report No. TRP-03-251-11
28
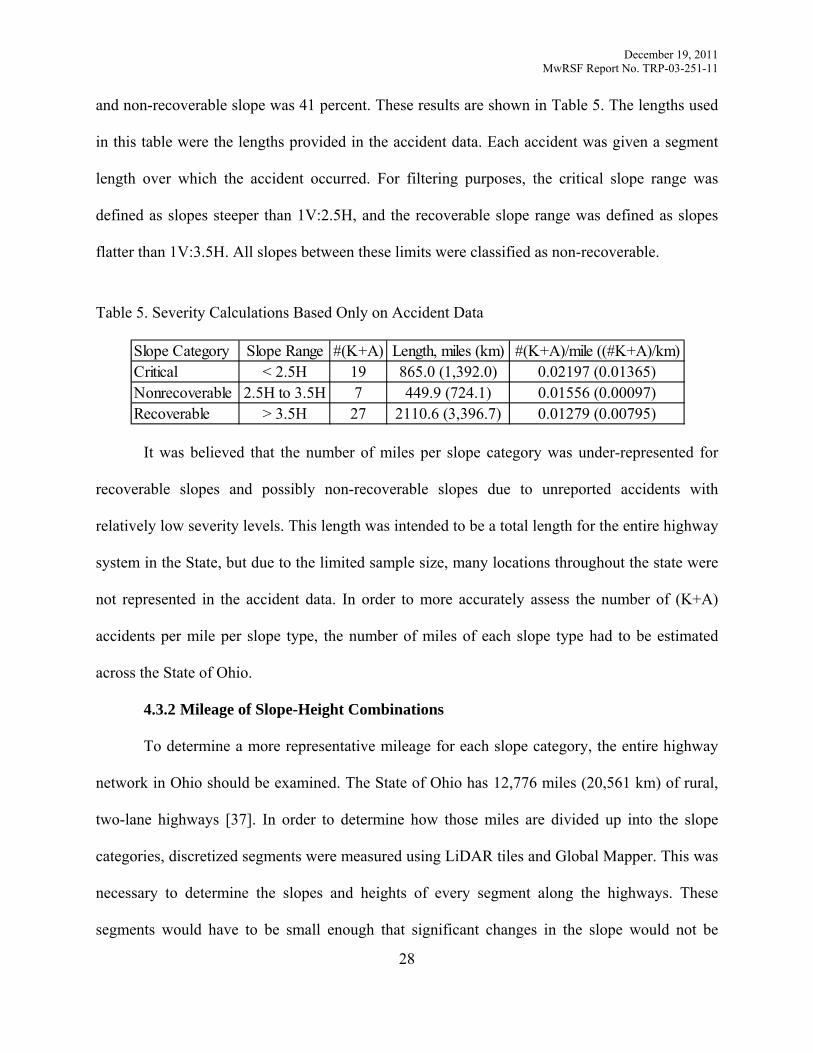
and non-recoverable slope was 41 percent. These results are shown in Table 5. The lengths used
in this table were the lengths provided in the accident data. Each accident was given a segment
length over which the accident occurred. For filtering purposes, the critical slope range was
defined as slopes steeper than 1V:2.5H, and the recoverable slope range was defined as slopes
flatter than 1V:3.5H. All slopes between these limits were classified as non-recoverable.
Table 5. Severity Calculations Based Only on Accident Data
It was believed that the number of miles per slope category was under-represented for
recoverable slopes and possibly non-recoverable slopes due to unreported accidents with
relatively low severity levels. This length was intended to be a total length for the entire highway
system in the State, but due to the limited sample size, many locations throughout the state were
not represented in the accident data. In order to more accurately assess the number of (K+A)
accidents per mile per slope type, the number of miles of each slope type had to be estimated
across the State of Ohio.
4.3.2 Mileage of Slope-Height Combinations
To determine a more representative mileage for each slope category, the entire highway
network in Ohio should be examined. The State of Ohio has 12,776 miles (20,561 km) of rural,
two-lane highways [37]. In order to determine how those miles are divided up into the slope
categories, discretized segments were measured using LiDAR tiles and Global Mapper. This was
necessary to determine the slopes and heights of every segment along the highways. These
segments would have to be small enough that significant changes in the slope would not be
Slope Category Slope Range #(K+A) Length, miles (km) #(K+A)/mile ((#K+A)/km)Critical < 2.5H 19 865.0 (1,392.0) 0.02197 (0.01365)Nonrecoverable 2.5H to 3.5H 7 449.9 (724.1) 0.01556 (0.00097)Recoverable > 3.5H 27 2110.6 (3,396.7) 0.01279 (0.00795)
December 19, 2011 MwRSF Report No. TRP-03-251-11
29
prevalent in one segment. For this research, 100-ft (30.5-m) long segments were used. This
would require approximately 677,128 measurements to determine exactly how many miles of
each slope type there are on rural, two-lane highways. By assuming optimistically that each
measurement takes one minute, it should be obvious that the time demand would be too
enormous to consider this approach. Instead, highway segments were taken at random and were
assumed to represent the total highway network. From these random samples, the percentage of
each slope type could be determined and applied to the total highway length to estimate the
mileage for each slope type in Ohio.
In order to model the statewide highway network, 150 segments of rural highways were
randomly selected. This was accomplished by using roadway description inventory reports, such
as the one shown in Appendix A. These tables were imported into Microsoft Excel, where filters
were applied to the data to eliminate urban segments. In addition, interstate highways were
filtered out, leaving behind U.S. and State Routes. These highway types were considered because
they are similar to typical rural, two-lane highways, which make up the vast majority of the total
mileage in Ohio. Once the data was filtered, the total length was 11,393 miles (18,335 km). The
difference in this value and the total number of rural, two-lane highway miles was due to the
overlapping of some highways. The longer length included some stretches of highways twice
because they had two names. The filtered data eliminated repeated data, leaving behind the total
number of actual miles. However, some of the highways began and ended within city limits;
therefore, these small highways were not filtered out. In addition, no distinction is made between
divided and undivided highways. As a result, 150 locations were randomly selected and
examined using Google Maps to determine if the highway was acceptable (undivided, rural, two-
lane). Of those 150 locations, 130 were acceptable.
December 19, 2011 MwRSF Report No. TRP-03-251-11
30
Once the filtered data was prepared, the highways were placed end-on-end by summing a
cumulative length from the first highway segment to the last. Then a random number was
generated between 0 and 11,393. This number was used to select a highway. This process
allowed the longer highways to be selected at a greater probability, which allowed the random
samples to more accurately model the actual highway distribution. This was imperative because
accidents were more likely to occur on long highways than short highways due to the increased
exposure, provided the only difference between those highways was their length. Each data entry
from the inventory report broke the highway into segments, using landmarks or some other
distinguishing features to describe each of those segments. The previously generated random
number was also used to select a segment within the highway. However, once the segment was
chosen, a new random number had to be generated to determine the starting point for
measurements in Global Mapper. As previously mentioned, 100-ft (30.5-m) sub-segments were
used for each segment. Those segments measured just over 1 mile ( 1.61 km) in length or 5,300
ft (1615 m). As a result, a random number was generated between the beginning milepost of the
segment and 1 mile (1.61 km) less than the ending milepost for that segment to determine a
starting milepost. This ensured that the entire 1-mile (1.61-km) segment would be located in the
selected highway. Once those 150 segments were chosen, they were investigated using Google
Maps to see if they were in fact rural, two-lane highways. If they did not meet these criteria, they
were ignored. Of the 150 segments, 127 were used. This ratio was close to the ratio determined
previously (130:150); therefore, the sampling process was considered consistent and
representative of undivided, rural, two-lane highways. The used segments were measured the
same way the accident data were measured.
December 19, 2011 MwRSF Report No. TRP-03-251-11
31
Using Global Mapper and the OGRIP database, slope and height measurements were
taken along both sides of the highway. This was done because the location of the accidents was
unknown. The side of the road the accident occurred on was given in the accident database, but
the relative direction of the vehicle prior to the accident was not given. As a result, the
encroached side of the roadway could not be ascertained. The side of the road with the steepest
slope was associated with the accident. By doing this, the fatal and severe accidents were
associated with the steepest slope, which was congruent with the assumption that steeper slopes
are more severe than flatter slopes.
To determine if the samples were an adequate model for the entire highway system, the
ratio of State to U.S. Routes was compared for the 11,393 miles (18,335 km) and for the 127
miles (204 km). The two ratios were considered approximately equal if the difference was less
than 10 percent. Those ratios were 3.34 and 3.10, respectively. This constituted a difference of
only 8 percent, and as a result, the samples were considered to be an adequate model.
In addition to determining mileage for each slope category, the mileage for each height
category had to be determined. As previously mentioned, each slope category was broken into
height categories. The critical and non-recoverable slopes used three heights: short or less than 4
ft (1.2 m), medium or greater than or equal to 4 ft (1.2 m) but less than 10 ft (3.0 m), and tall or
greater than or equal to 10 ft (3.0 m). The recoverable slopes were broken into two slope
categories: 1V:4H and 1V:6H. For the 1V:4H slope, two heights were used because the medium
and tall heights were combined. For 1V:6H slope, all height categories were combined. Finally,
to determine the number of miles in each of these nine combinations, the number of miles for the
slope-height combination was divided by 254 (the total miles of the sample). This fraction was
applied to the total mileage, 11,393 miles (18,335 km), to determine the number of expected
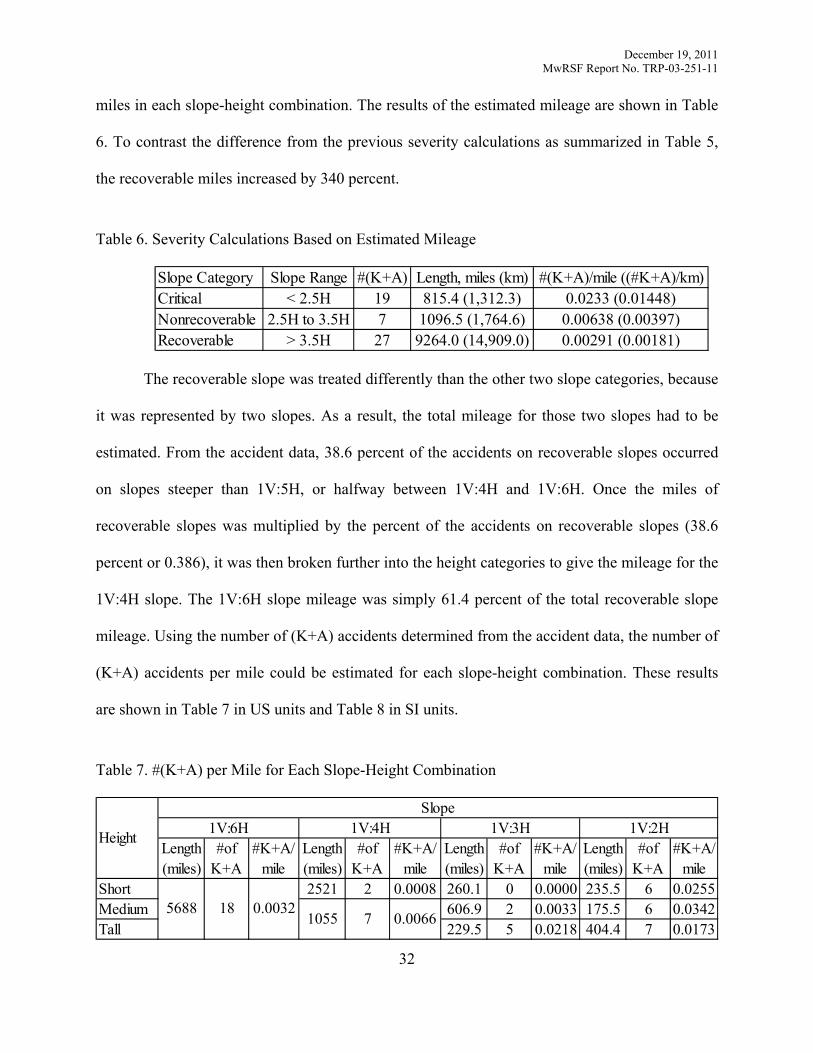
December 19, 2011 MwRSF Report No. TRP-03-251-11
32
miles in each slope-height combination. The results of the estimated mileage are shown in Table
6. To contrast the difference from the previous severity calculations as summarized in Table 5,
the recoverable miles increased by 340 percent.
Table 6. Severity Calculations Based on Estimated Mileage
The recoverable slope was treated differently than the other two slope categories, because
it was represented by two slopes. As a result, the total mileage for those two slopes had to be
estimated. From the accident data, 38.6 percent of the accidents on recoverable slopes occurred
on slopes steeper than 1V:5H, or halfway between 1V:4H and 1V:6H. Once the miles of
recoverable slopes was multiplied by the percent of the accidents on recoverable slopes (38.6
percent or 0.386), it was then broken further into the height categories to give the mileage for the
1V:4H slope. The 1V:6H slope mileage was simply 61.4 percent of the total recoverable slope
mileage. Using the number of (K+A) accidents determined from the accident data, the number of
(K+A) accidents per mile could be estimated for each slope-height combination. These results
are shown in Table 7 in US units and Table 8 in SI units.
Table 7. #(K+A) per Mile for Each Slope-Height Combination
Slope Category Slope Range #(K+A) Length, miles (km) #(K+A)/mile ((#K+A)/km)Critical < 2.5H 19 815.4 (1,312.3) 0.0233 (0.01448)Nonrecoverable 2.5H to 3.5H 7 1096.5 (1,764.6) 0.00638 (0.00397)Recoverable > 3.5H 27 9264.0 (14,909.0) 0.00291 (0.00181)
Length (miles)
#of K+A
#K+A/ mile
Length (miles)
#of K+A
#K+A/ mile
Length (miles)
#of K+A
#K+A/ mile
Length (miles)
#of K+A
#K+A/ mile
Short 2521 2 0.0008 260.1 0 0.0000 235.5 6 0.0255Medium 606.9 2 0.0033 175.5 6 0.0342Tall 229.5 5 0.0218 404.4 7 0.0173
0.00321856880.006671055
1V:6H 1V:4H 1V:2H1V:3HHeight
Slope
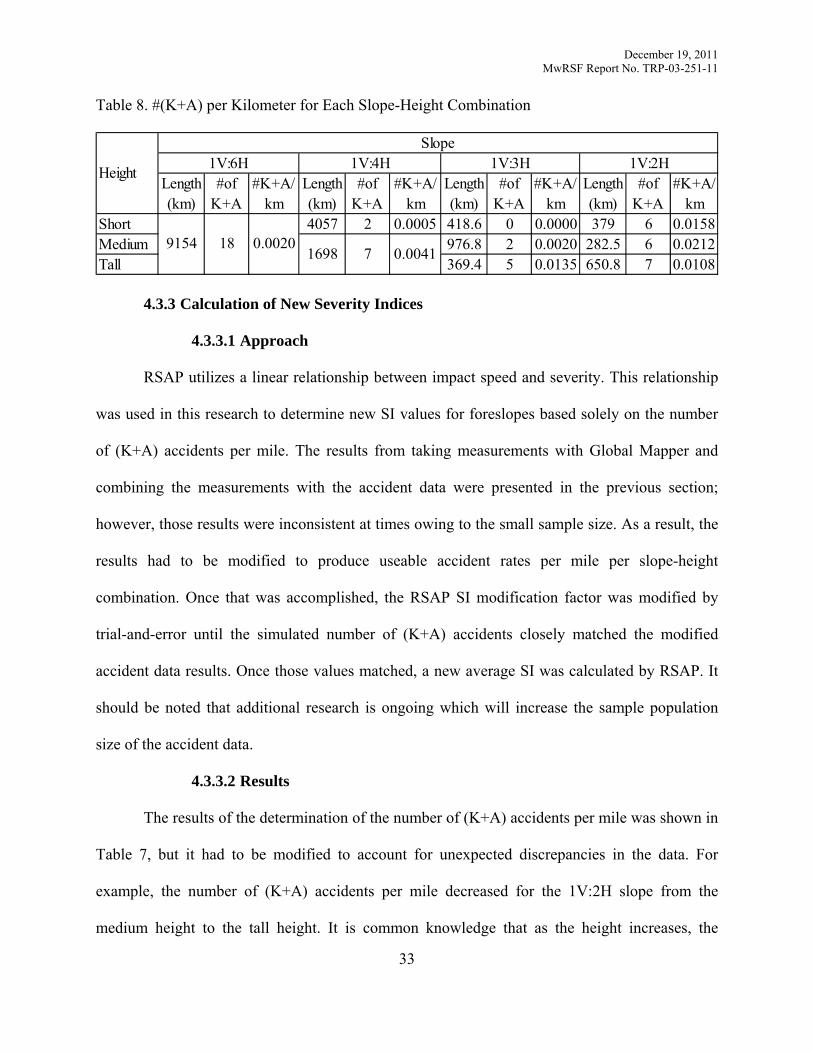
December 19, 2011 MwRSF Report No. TRP-03-251-11
33
Table 8. #(K+A) per Kilometer for Each Slope-Height Combination
4.3.3 Calculation of New Severity Indices
4.3.3.1 Approach
RSAP utilizes a linear relationship between impact speed and severity. This relationship
was used in this research to determine new SI values for foreslopes based solely on the number
of (K+A) accidents per mile. The results from taking measurements with Global Mapper and
combining the measurements with the accident data were presented in the previous section;
however, those results were inconsistent at times owing to the small sample size. As a result, the
results had to be modified to produce useable accident rates per mile per slope-height
combination. Once that was accomplished, the RSAP SI modification factor was modified by
trial-and-error until the simulated number of (K+A) accidents closely matched the modified
accident data results. Once those values matched, a new average SI was calculated by RSAP. It
should be noted that additional research is ongoing which will increase the sample population
size of the accident data.
4.3.3.2 Results
The results of the determination of the number of (K+A) accidents per mile was shown in
Table 7, but it had to be modified to account for unexpected discrepancies in the data. For
example, the number of (K+A) accidents per mile decreased for the 1V:2H slope from the
medium height to the tall height. It is common knowledge that as the height increases, the
Length (km)
#of K+A
#K+A/ km
Length (km)
#of K+A
#K+A/ km
Length (km)
#of K+A
#K+A/ km
Length (km)
#of K+A
#K+A/ km
Short 4057 2 0.0005 418.6 0 0.0000 379 6 0.0158Medium 976.8 2 0.0020 282.5 6 0.0212Tall 369.4 5 0.0135 650.8 7 0.0108
0.00419154 18 0.0020
1698 7
Height
Slope1V:6H 1V:4H 1V:3H 1V:2H
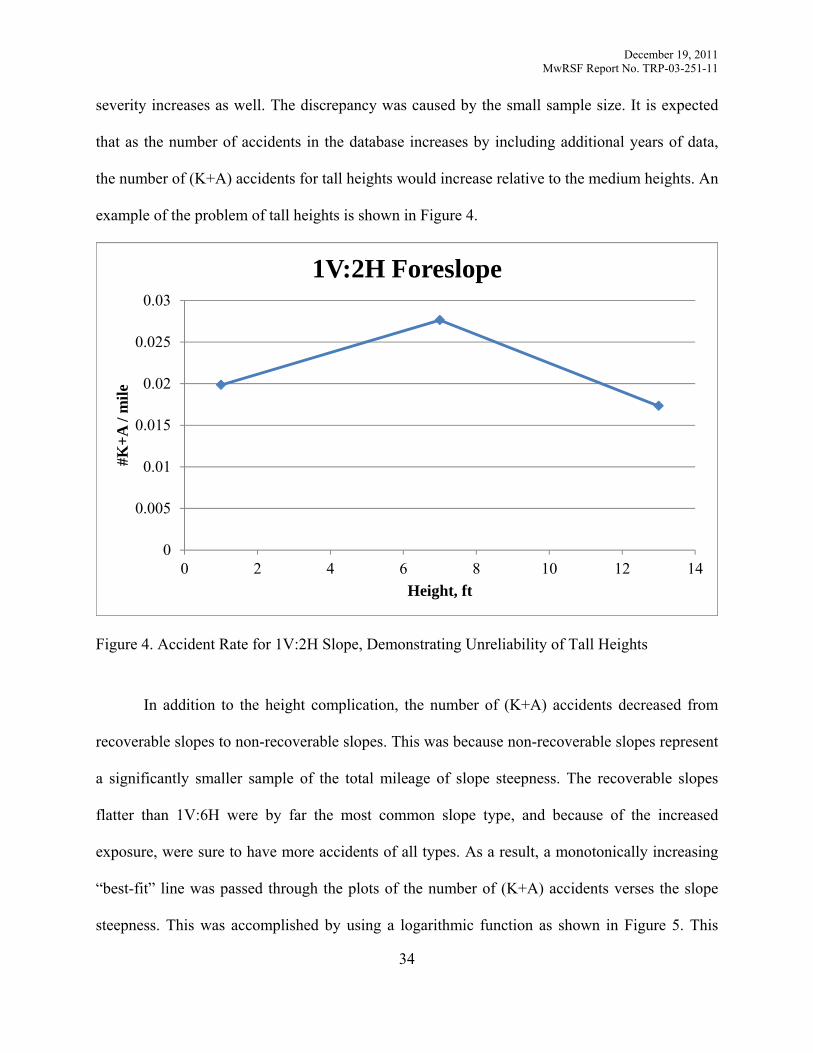
December 19, 2011 MwRSF Report No. TRP-03-251-11
34
severity increases as well. The discrepancy was caused by the small sample size. It is expected
that as the number of accidents in the database increases by including additional years of data,
the number of (K+A) accidents for tall heights would increase relative to the medium heights. An
example of the problem of tall heights is shown in Figure 4.
Figure 4. Accident Rate for 1V:2H Slope, Demonstrating Unreliability of Tall Heights
In addition to the height complication, the number of (K+A) accidents decreased from
recoverable slopes to non-recoverable slopes. This was because non-recoverable slopes represent
a significantly smaller sample of the total mileage of slope steepness. The recoverable slopes
flatter than 1V:6H were by far the most common slope type, and because of the increased
exposure, were sure to have more accidents of all types. As a result, a monotonically increasing
“best-fit” line was passed through the plots of the number of (K+A) accidents verses the slope
steepness. This was accomplished by using a logarithmic function as shown in Figure 5. This
0
0.005
0.01
0.015
0.02
0.025
0.03
0 2 4 6 8 10 12 14
#K+A
/ m
ile
Height, ft
1V:2H Foreslope
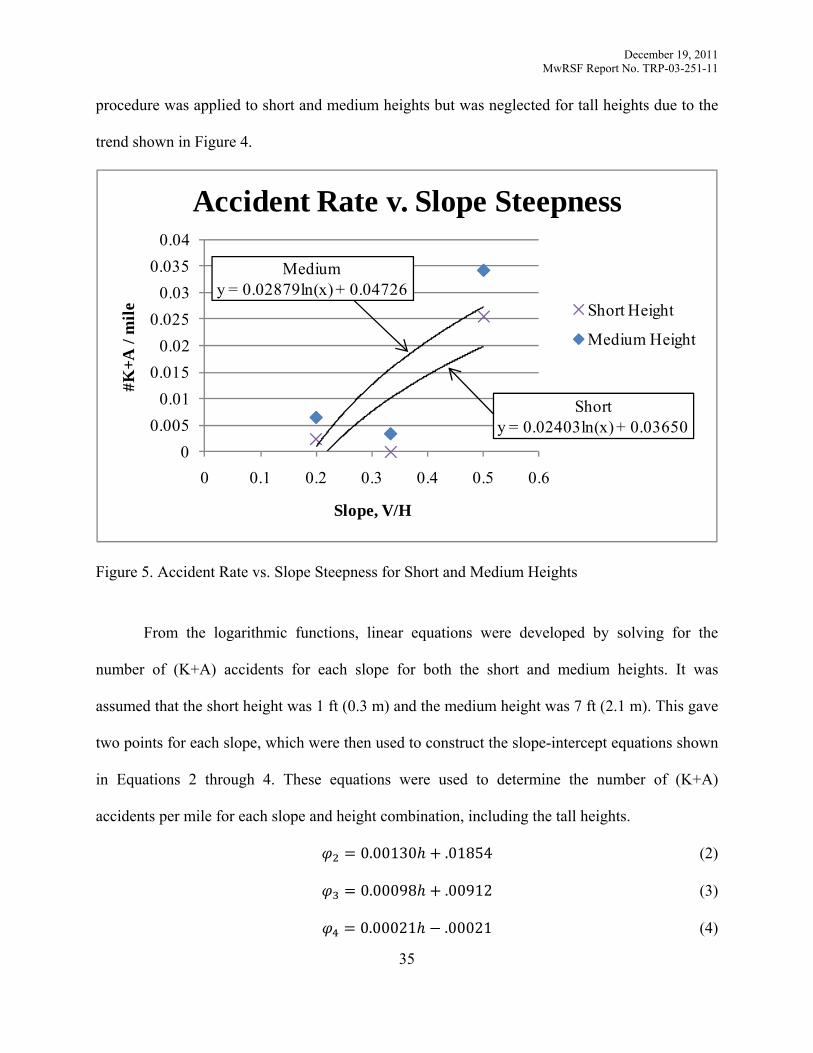
December 19, 2011 MwRSF Report No. TRP-03-251-11
35
procedure was applied to short and medium heights but was neglected for tall heights due to the
trend shown in Figure 4.
Figure 5. Accident Rate vs. Slope Steepness for Short and Medium Heights
From the logarithmic functions, linear equations were developed by solving for the
number of (K+A) accidents for each slope for both the short and medium heights. It was
assumed that the short height was 1 ft (0.3 m) and the medium height was 7 ft (2.1 m). This gave
two points for each slope, which were then used to construct the slope-intercept equations shown
in Equations 2 through 4. These equations were used to determine the number of (K+A)
accidents per mile for each slope and height combination, including the tall heights.
0.00130 .01854 (2)
0.00098 .00912 (3)
0.00021 .00021 (4)
Shorty = 0.02403ln(x) + 0.03650
Mediumy = 0.02879ln(x) + 0.04726
00.005
0.010.015
0.020.025
0.030.035
0.04
0 0.1 0.2 0.3 0.4 0.5 0.6
#K+A
/ m
ile
Slope, V/H
Accident Rate v. Slope Steepness
Short Height
Medium Height
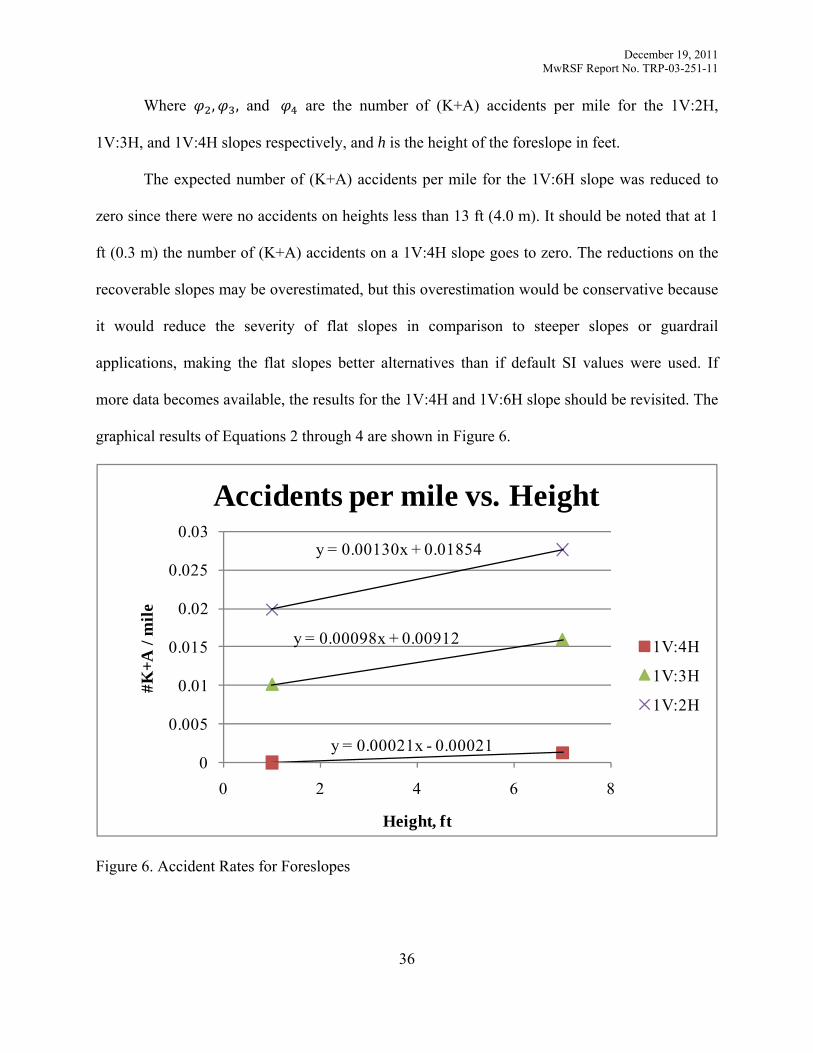
December 19, 2011 MwRSF Report No. TRP-03-251-11
36
Where , , and are the number of (K+A) accidents per mile for the 1V:2H,
1V:3H, and 1V:4H slopes respectively, and h is the height of the foreslope in feet.
The expected number of (K+A) accidents per mile for the 1V:6H slope was reduced to
zero since there were no accidents on heights less than 13 ft (4.0 m). It should be noted that at 1
ft (0.3 m) the number of (K+A) accidents on a 1V:4H slope goes to zero. The reductions on the
recoverable slopes may be overestimated, but this overestimation would be conservative because
it would reduce the severity of flat slopes in comparison to steeper slopes or guardrail
applications, making the flat slopes better alternatives than if default SI values were used. If
more data becomes available, the results for the 1V:4H and 1V:6H slope should be revisited. The
graphical results of Equations 2 through 4 are shown in Figure 6.
Figure 6. Accident Rates for Foreslopes
y = 0.00021x - 0.00021
y = 0.00098x + 0.00912
y = 0.00130x + 0.01854
0
0.005
0.01
0.015
0.02
0.025
0.03
0 2 4 6 8
#K+A
/ m
ile
Height, ft
Accidents per mile vs. Height
1V:4H
1V:3H
1V:2H
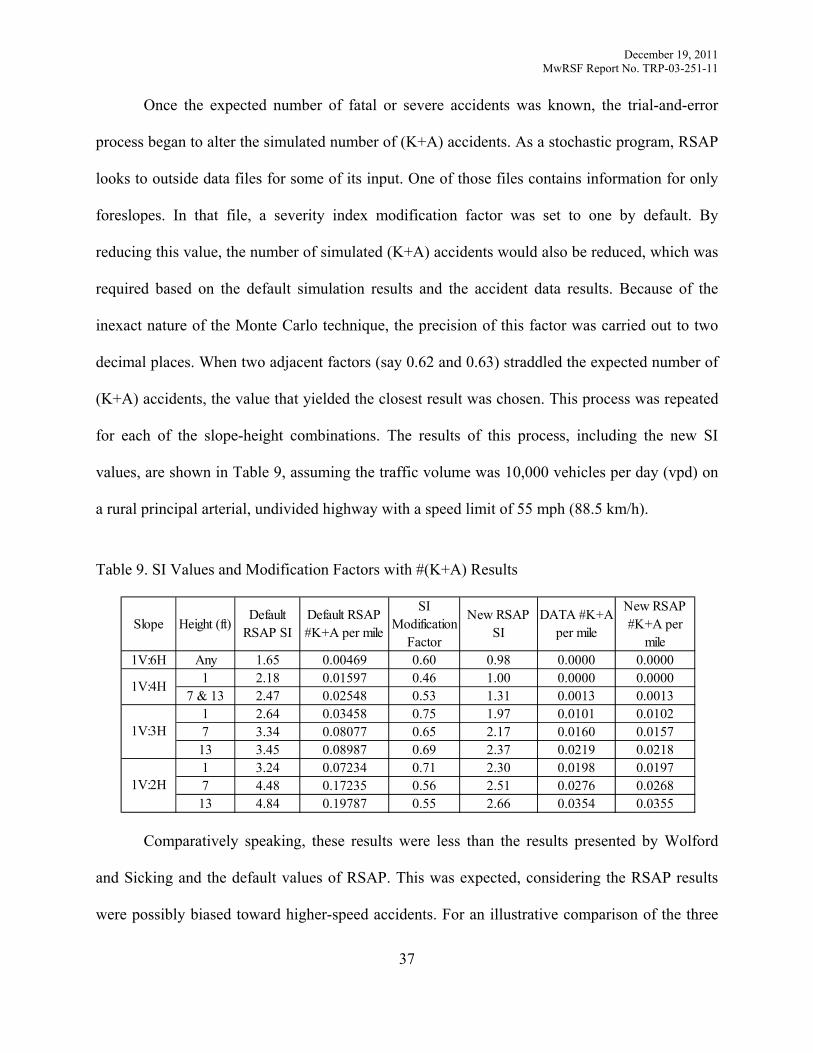
December 19, 2011 MwRSF Report No. TRP-03-251-11
37
Once the expected number of fatal or severe accidents was known, the trial-and-error
process began to alter the simulated number of (K+A) accidents. As a stochastic program, RSAP
looks to outside data files for some of its input. One of those files contains information for only
foreslopes. In that file, a severity index modification factor was set to one by default. By
reducing this value, the number of simulated (K+A) accidents would also be reduced, which was
required based on the default simulation results and the accident data results. Because of the
inexact nature of the Monte Carlo technique, the precision of this factor was carried out to two
decimal places. When two adjacent factors (say 0.62 and 0.63) straddled the expected number of
(K+A) accidents, the value that yielded the closest result was chosen. This process was repeated
for each of the slope-height combinations. The results of this process, including the new SI
values, are shown in Table 9, assuming the traffic volume was 10,000 vehicles per day (vpd) on
a rural principal arterial, undivided highway with a speed limit of 55 mph (88.5 km/h).
Table 9. SI Values and Modification Factors with #(K+A) Results
Comparatively speaking, these results were less than the results presented by Wolford
and Sicking and the default values of RSAP. This was expected, considering the RSAP results
were possibly biased toward higher-speed accidents. For an illustrative comparison of the three
Slope Height (ft)Default
RSAP SIDefault RSAP #K+A per mile
SI Modification
Factor
New RSAP SI
DATA #K+A per mile
New RSAP #K+A per
mile1V:6H Any 1.65 0.00469 0.60 0.98 0.0000 0.0000
1 2.18 0.01597 0.46 1.00 0.0000 0.00007 & 13 2.47 0.02548 0.53 1.31 0.0013 0.0013
1 2.64 0.03458 0.75 1.97 0.0101 0.01027 3.34 0.08077 0.65 2.17 0.0160 0.0157
13 3.45 0.08987 0.69 2.37 0.0219 0.02181 3.24 0.07234 0.71 2.30 0.0198 0.01977 4.48 0.17235 0.56 2.51 0.0276 0.0268
13 4.84 0.19787 0.55 2.66 0.0354 0.0355
1V:4H
1V:3H
1V:2H
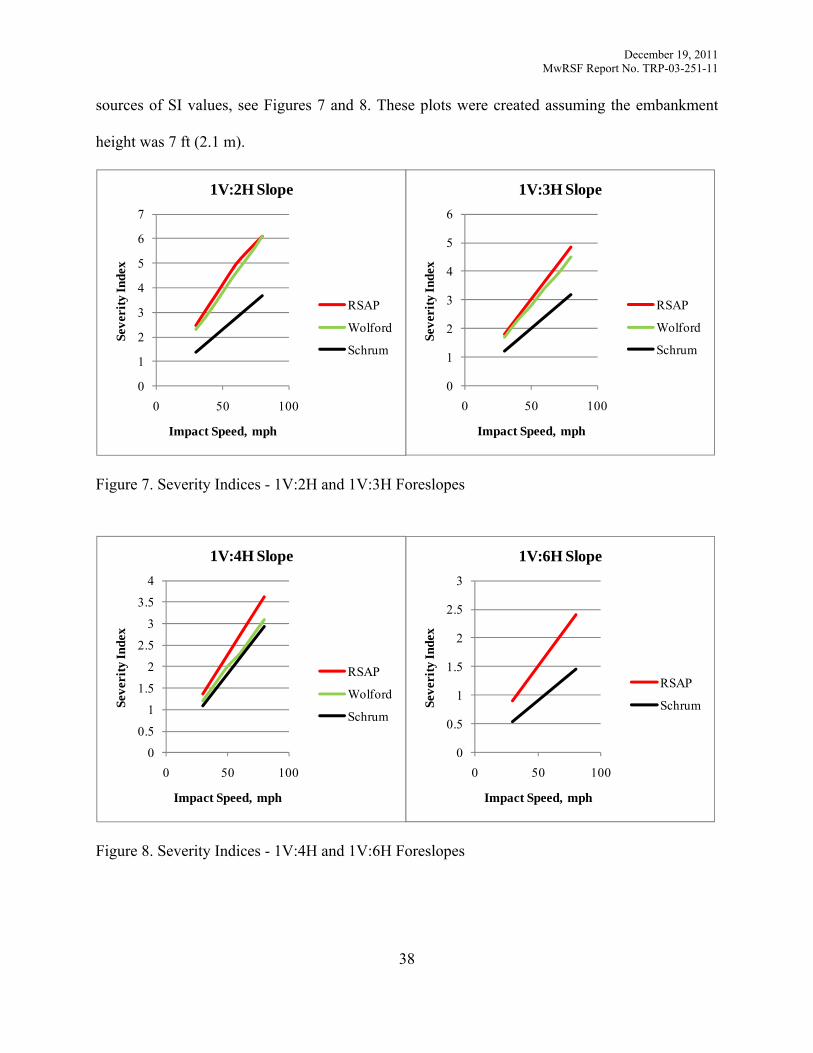
December 19, 2011 MwRSF Report No. TRP-03-251-11
38
0
1
2
3
4
5
6
0 50 100
Seve
rity
Inde
xImpact Speed, mph
1V:3H Slope
RSAP
Wolford
Schrum
0
0.5
1
1.5
2
2.5
3
0 50 100
Seve
rity
Inde
x
Impact Speed, mph
1V:6H Slope
RSAP
Schrum
sources of SI values, see Figures 7 and 8. These plots were created assuming the embankment
height was 7 ft (2.1 m).
Figure 7. Severity Indices - 1V:2H and 1V:3H Foreslopes
Figure 8. Severity Indices - 1V:4H and 1V:6H Foreslopes
0
1
2
3
4
5
6
7
0 50 100
Seve
rity
Inde
x
Impact Speed, mph
1V:2H Slope
RSAP
Wolford
Schrum
0
0.5
1
1.5
2
2.5
3
3.5
4
0 50 100
Seve
rity
Inde
x
Impact Speed, mph
1V:4H Slope
RSAP
Wolford
Schrum
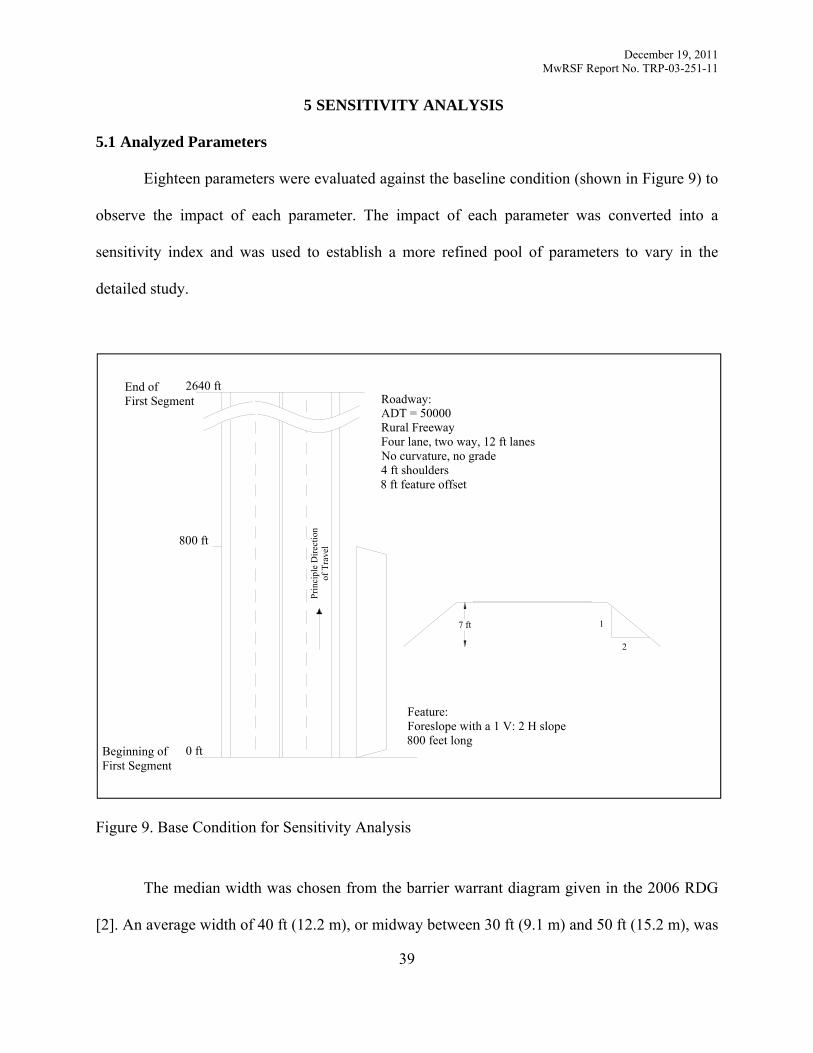
December 19, 2011 MwRSF Report No. TRP-03-251-11
39
5 SENSITIVITY ANALYSIS
5.1 Analyzed Parameters
Eighteen parameters were evaluated against the baseline condition (shown in Figure 9) to
observe the impact of each parameter. The impact of each parameter was converted into a
sensitivity index and was used to establish a more refined pool of parameters to vary in the
detailed study.
Figure 9. Base Condition for Sensitivity Analysis
The median width was chosen from the barrier warrant diagram given in the 2006 RDG
[2]. An average width of 40 ft (12.2 m), or midway between 30 ft (9.1 m) and 50 ft (15.2 m), was
2
17 ft
Roadway:ADT = 50000Rural FreewayFour lane, two way, 12 ft lanesNo curvature, no grade4 ft shoulders8 ft feature offset
Feature:Foreslope with a 1 V: 2 H slope800 feet long
Beginning ofFirst Segment
0 ft
End ofFirst Segment
2640 ft
800 ft
Prin
cipl
e D
irect
ion
of T
rave
l
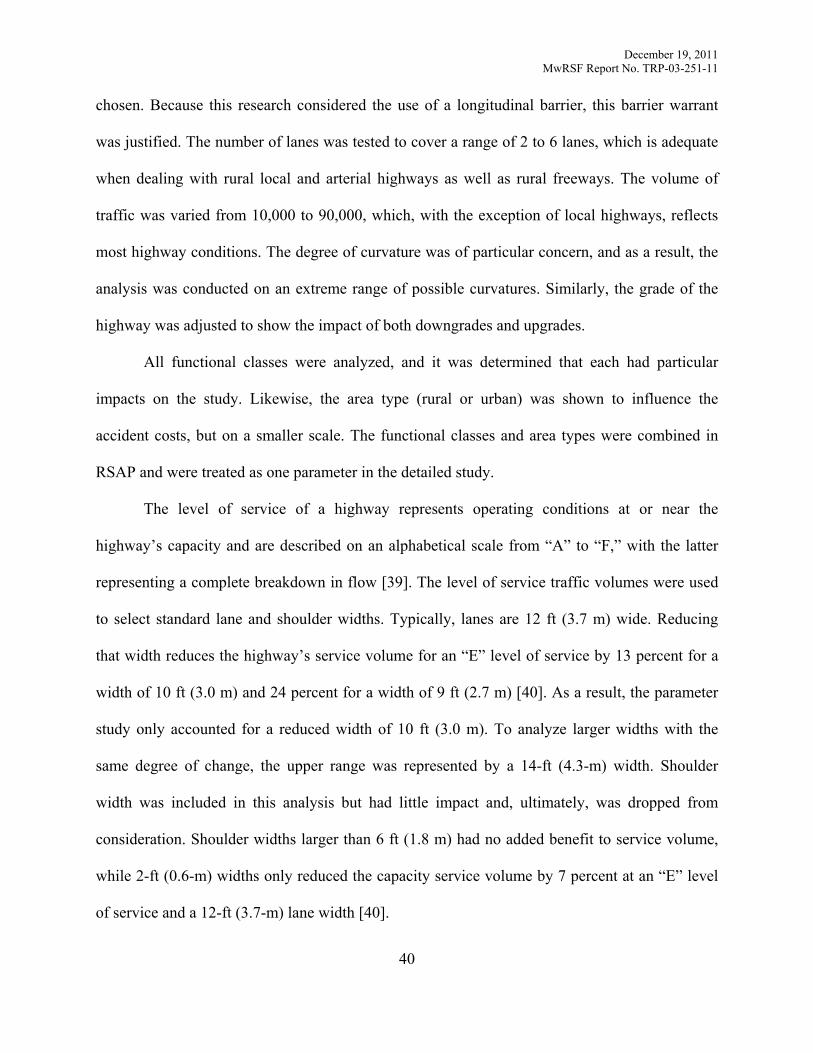
December 19, 2011 MwRSF Report No. TRP-03-251-11
40
chosen. Because this research considered the use of a longitudinal barrier, this barrier warrant
was justified. The number of lanes was tested to cover a range of 2 to 6 lanes, which is adequate
when dealing with rural local and arterial highways as well as rural freeways. The volume of
traffic was varied from 10,000 to 90,000, which, with the exception of local highways, reflects
most highway conditions. The degree of curvature was of particular concern, and as a result, the
analysis was conducted on an extreme range of possible curvatures. Similarly, the grade of the
highway was adjusted to show the impact of both downgrades and upgrades.
All functional classes were analyzed, and it was determined that each had particular
impacts on the study. Likewise, the area type (rural or urban) was shown to influence the
accident costs, but on a smaller scale. The functional classes and area types were combined in
RSAP and were treated as one parameter in the detailed study.
The level of service of a highway represents operating conditions at or near the
highway’s capacity and are described on an alphabetical scale from “A” to “F,” with the latter
representing a complete breakdown in flow [39]. The level of service traffic volumes were used
to select standard lane and shoulder widths. Typically, lanes are 12 ft (3.7 m) wide. Reducing
that width reduces the highway’s service volume for an “E” level of service by 13 percent for a
width of 10 ft (3.0 m) and 24 percent for a width of 9 ft (2.7 m) [40]. As a result, the parameter
study only accounted for a reduced width of 10 ft (3.0 m). To analyze larger widths with the
same degree of change, the upper range was represented by a 14-ft (4.3-m) width. Shoulder
width was included in this analysis but had little impact and, ultimately, was dropped from
consideration. Shoulder widths larger than 6 ft (1.8 m) had no added benefit to service volume,
while 2-ft (0.6-m) widths only reduced the capacity service volume by 7 percent at an “E” level
of service and a 12-ft (3.7-m) lane width [40].
December 19, 2011 MwRSF Report No. TRP-03-251-11
41
The traffic growth rate and percent of trucks were estimated by the Wisconsin
Department of Transportation (WSDOT) to be approximately 2 percent and 16 percent,
respectively [35]. To verify that these parameters could be held as constants, they were analyzed
as part of the sensitivity analysis and were found to be inconsequential.
The distance from the edge of the travel way to the obstruction, or offset, was also
analyzed. Values for this parameter were small by comparison to the 2006 RDG
recommendations for clear zone distances, which can approach 28 ft (8.5 m) on foreslopes [2].
However, in urban areas, no actual requirements are given. A study by the Iowa State University
presented results from a survey that indicated a desirable offset of 12 ft (3.7 m) was common in
many states [41]. As a result, a 12-ft (3.7-m) offset was chosen as the maximum offset, with 4-ft
(1.2-m) increments, making 8 ft (2.4 m) the baseline offset.
For the sake of completeness, the different alternatives and heights were considered in the
sensitivity study. The heights were chosen to represent a range of severities. At 1 ft (0.3 m), the
severity of a 1V:2H foreslope at 62 mph (100 km/h) was 3.1 on smooth and firm conditions,
according to the 1996 RDG. Under the same scenario, the severity indices at 7 ft (2.1 m) and 13
ft (4.0 m) were 4.3 and 4.6, respectively. The change between 1 and 7 ft (0.3 and 2.1 m) was 39
percent while the change between 7 and 13 ft (2.1 and 4.0 m) was only 7 percent. Therefore,
these three values represented a vastly changing section of the severity-height plot from 1 ft (0.3
m) to 7 ft (2.1 m) and a vastly unchanging section from 7 ft (2.1 m) to 13 ft (4.0 m). As with the
functional class and area type, RSAP combines the alternative and height into one parameter. As
expected, the resulting accident costs were significantly different from the baseline accident
costs. The parameters examined in the parametric study are outlined in Table 10.
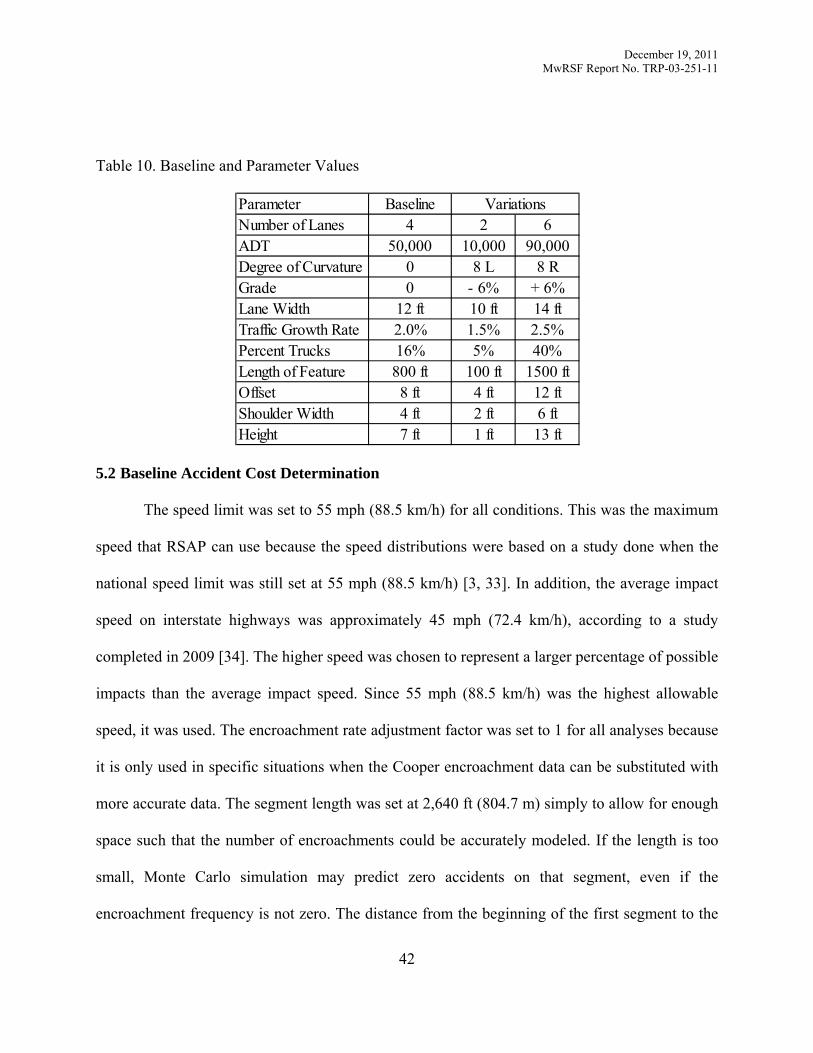
December 19, 2011 MwRSF Report No. TRP-03-251-11
42
Table 10. Baseline and Parameter Values
5.2 Baseline Accident Cost Determination
The speed limit was set to 55 mph (88.5 km/h) for all conditions. This was the maximum
speed that RSAP can use because the speed distributions were based on a study done when the
national speed limit was still set at 55 mph (88.5 km/h) [3, 33]. In addition, the average impact
speed on interstate highways was approximately 45 mph (72.4 km/h), according to a study
completed in 2009 [34]. The higher speed was chosen to represent a larger percentage of possible
impacts than the average impact speed. Since 55 mph (88.5 km/h) was the highest allowable
speed, it was used. The encroachment rate adjustment factor was set to 1 for all analyses because
it is only used in specific situations when the Cooper encroachment data can be substituted with
more accurate data. The segment length was set at 2,640 ft (804.7 m) simply to allow for enough
space such that the number of encroachments could be accurately modeled. If the length is too
small, Monte Carlo simulation may predict zero accidents on that segment, even if the
encroachment frequency is not zero. The distance from the beginning of the first segment to the
Parameter BaselineNumber of Lanes 4 2 6ADT 50,000 10,000 90,000Degree of Curvature 0 8 L 8 RGrade 0 - 6% + 6%Lane Width 12 ft 10 ft 14 ftTraffic Growth Rate 2.0% 1.5% 2.5%Percent Trucks 16% 5% 40%Length of Feature 800 ft 100 ft 1500 ftOffset 8 ft 4 ft 12 ftShoulder Width 4 ft 2 ft 6 ftHeight 7 ft 1 ft 13 ft
Variations
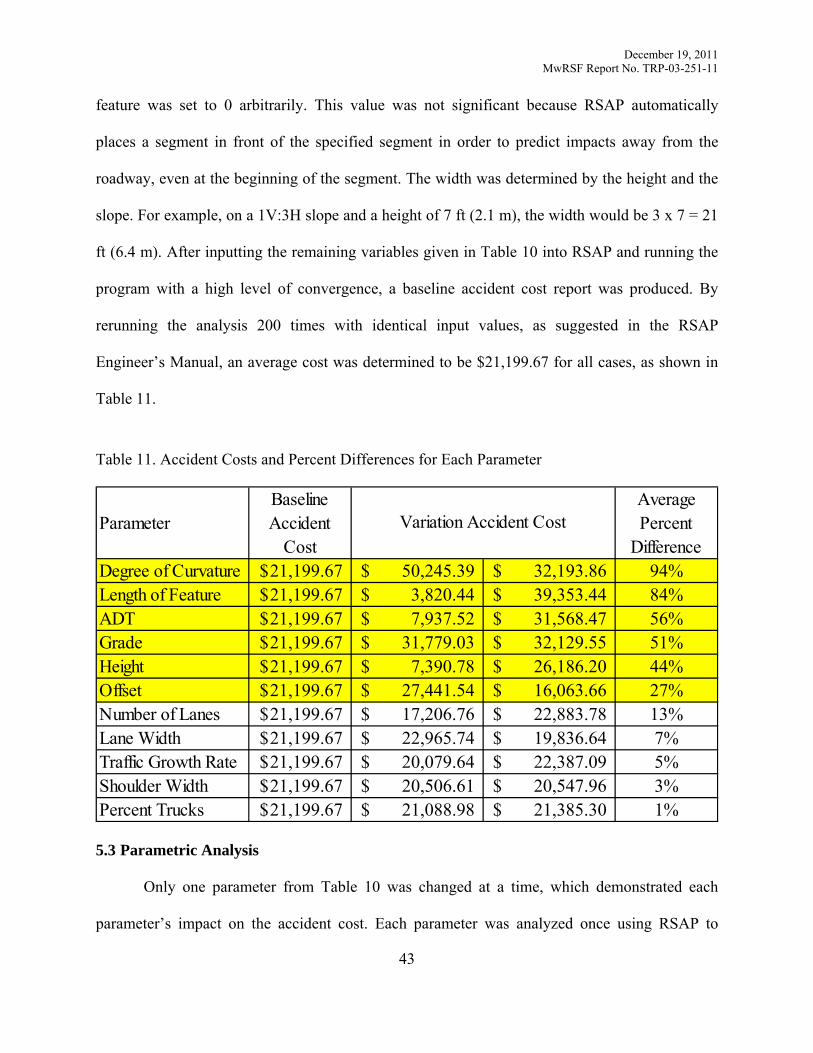
December 19, 2011 MwRSF Report No. TRP-03-251-11
43
feature was set to 0 arbitrarily. This value was not significant because RSAP automatically
places a segment in front of the specified segment in order to predict impacts away from the
roadway, even at the beginning of the segment. The width was determined by the height and the
slope. For example, on a 1V:3H slope and a height of 7 ft (2.1 m), the width would be 3 x 7 = 21
ft (6.4 m). After inputting the remaining variables given in Table 10 into RSAP and running the
program with a high level of convergence, a baseline accident cost report was produced. By
rerunning the analysis 200 times with identical input values, as suggested in the RSAP
Engineer’s Manual, an average cost was determined to be $21,199.67 for all cases, as shown in
Table 11.
Table 11. Accident Costs and Percent Differences for Each Parameter
5.3 Parametric Analysis
Only one parameter from Table 10 was changed at a time, which demonstrated each
parameter’s impact on the accident cost. Each parameter was analyzed once using RSAP to
ParameterBaseline Accident
Cost
Average Percent
DifferenceDegree of Curvature 21,199.67$ 50,245.39$ 32,193.86$ 94%Length of Feature 21,199.67$ 3,820.44$ 39,353.44$ 84%ADT 21,199.67$ 7,937.52$ 31,568.47$ 56%Grade 21,199.67$ 31,779.03$ 32,129.55$ 51%Height 21,199.67$ 7,390.78$ 26,186.20$ 44%Offset 21,199.67$ 27,441.54$ 16,063.66$ 27%Number of Lanes 21,199.67$ 17,206.76$ 22,883.78$ 13%Lane Width 21,199.67$ 22,965.74$ 19,836.64$ 7%Traffic Growth Rate 21,199.67$ 20,079.64$ 22,387.09$ 5%Shoulder Width 21,199.67$ 20,506.61$ 20,547.96$ 3%Percent Trucks 21,199.67$ 21,088.98$ 21,385.30$ 1%
Variation Accident Cost
December 19, 2011 MwRSF Report No. TRP-03-251-11
44
determine its accident cost. In order to refine the parameter pool, engineering judgment was used
to determine which variables were sensitive to change. The sensitivity analysis was conducted to
reduce the number of the variables outlined in Table 10 such that the total number of required
simulated scenarios could be reduced.
To calculate the effect of changing a parameter, the baseline accident cost was first
calculated, as noted in Section 5.2. Then, the accident costs were determined individually for
each parameter as it was changed. Finally, the percent difference was calculated for each
parameter, effectively measuring the influence of that parameter on the accident cost. Most
parameters had two variations to the baseline. As a result, there were two new accident costs and
two new percent differences for those parameters. In order to gage the parameter as a whole, the
percent differences were averaged together for each parameter, where applicable. These average
percent differences are shown in Table 11.
Using engineering judgment, the bottom five parameters shown in Table 11 were
excluded. This cutoff point included offset in the analysis but excluded the number of lanes. This
was partially due to the fact that as the number of lanes was allowed to increase, the percent
difference in accident cost was almost negligible. In addition, some functional classes simply
don’t use four or more lanes, such as a rural local highway. The percent differences for the
remaining parameters indicate a percent difference in accident cost of no more than 7 percent,
making them insensitive to change relative to the offset or any highlighted parameter in Table
11.
December 19, 2011 MwRSF Report No. TRP-03-251-11
45
5.4 Detailed Study Recommendation
The safety treatment alternative and the presence of a median were determined by the
functional class independent of the results of the parameter study. The results indicate that those
two parameters were in fact sensitive to change; however, they were not subject to the same
changes for every functional class. The same alternatives were considered for most highways.
The use of these alternative slopes is explained in more detail in Chapter 7. The presence of a
median in the highway was dependent on the functional class. Freeways were divided only
(median included), and local highways were undivided only (no median). Arterials included both
divided and undivided classifications. Therefore, the parameters left to be altered and used to
create an RSAP simulation matrix were the length of the feature, height of the embankment,
traffic volume, degree of curvature, percent grade, and offset. These parameters are highlighted
in Table 11.
December 19, 2011 MwRSF Report No. TRP-03-251-11
46
6 RSAP ALTERNATIVES
Three safety treatments were considered for this study. They were: (1) do-nothing; (2)
slope flattening; and (3) guardrail installation. Each one of these treatments were modeled using
RSAP and are described in the following sections.
6.1 “Do Nothing” Condition
Alternatives are compared to a baseline condition known as the “do nothing” condition.
The do nothing option consists of applying no safety treatment to the roadside slope. This was
done if the direct costs of flattening the slope were too expensive or if the severity of striking a
guardrail outweighed the severity of striking the existing slope. For all highways, a minimum
slope of 1V:2H was used. However, NCHRP Report No. 638 recommends a minimum slope of
1V:3H on all functional classes except the rural local class [30]. This report used 1V:2H slopes
on all functional classes in the event that an existing design incorporated that cross-section.
6.2 Slope Flattening
Soil must be transported to the site and compacted in place. The slope of the roadside is
defined by a rise-over-run designation, with the rise always equal to 1 unit. For example, a slope
with a rise of 1 unit and a run of 2 units would be designated as 1V:2H. The cost of soil
transportation would depend on the distance between the source of the soil and its destination. In
some cases, there may be an excavation project nearby, and the cost of fill material would be
almost nothing. In contrast, if soil must be transported over a great distance, the cost would have
a large negative effect on this alternative’s viability. The contractor must compact the soil to
meet the specifications set forth by the engineer. This means that the volume of fill to be
transported must be larger than the volume of fill required. This volume difference must be
accounted for when determining the cost of the material.
December 19, 2011 MwRSF Report No. TRP-03-251-11
47
In addition to the cost of the fill, the cost to purchase the land immediately adjacent to the
roadway must be ascertained. Once again, this cost may fluctuate significantly. Perhaps the state
already owns the land, and the cost of the right-of-way (ROW) would be zero; or maybe the
adjacent area includes buildings, cultural importance, or environment concerns, which could be a
significant or impossible purchase. If the time required to obtain the ROW is the main concern, a
cost associated with that time could be added to the total direct costs for used in a benefit-cost
anaylsis. Because of the high uncertainty of the costs of this alternative, BC ratios could not be
estimated. Instead, only the numerator of the BC ratio could be determined. What is certain is as
the slope gets flatter, its safety performance increases.
As a vehicle goes over an embankment, its center of gravity acts through a point outside
of the geometric center of the vehicle. Steeper slopes cause the center of gravity to move farther
out relative to the vehicle than on flatter slopes. Therefore, as the slope gets steeper, the
likelihood of a rollover increases because the lateral component of the weight of the vehicle is
larger. For an illustration of this concept, Figure 10 is given. In this figure, a 1V:2H slope and
1V:6H slope are compared. Visually, the lateral component of the weight of the 1V:2H slope is
significantly larger than the 1V:6H counterpart. Flatter slopes reduce the severity of each
accident because the frequency of a rollover is reduced. As a result, the cost per accident
decreases. However, rollover propensity on slopes was not used by RSAP. Instead, severity
indices were adjusted for slopes when RSAP was created to account for the possibility of a
rollover [3]. For this study, only the slopes that have been pre-programmed into RSAP were
used. Those slopes were 1V:2H, 1V:3H, 1V:4H, and 1V:6H.
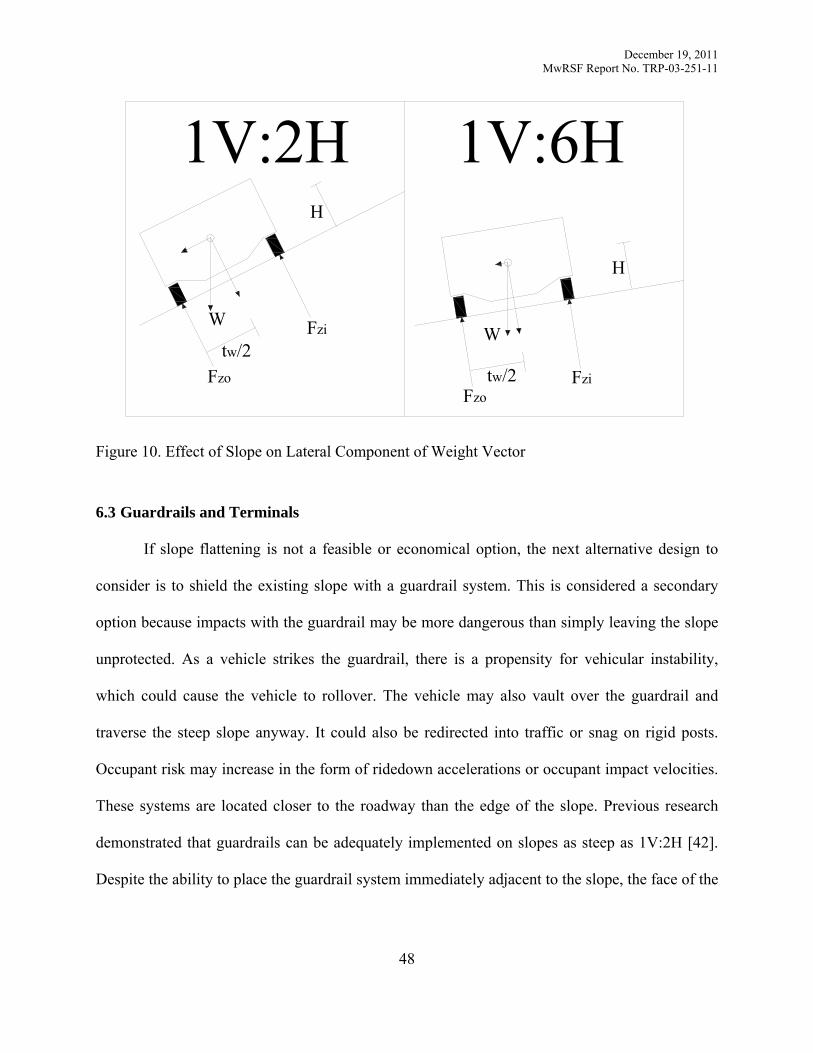
December 19, 2011 MwRSF Report No. TRP-03-251-11
48
Figure 10. Effect of Slope on Lateral Component of Weight Vector
6.3 Guardrails and Terminals
If slope flattening is not a feasible or economical option, the next alternative design to
consider is to shield the existing slope with a guardrail system. This is considered a secondary
option because impacts with the guardrail may be more dangerous than simply leaving the slope
unprotected. As a vehicle strikes the guardrail, there is a propensity for vehicular instability,
which could cause the vehicle to rollover. The vehicle may also vault over the guardrail and
traverse the steep slope anyway. It could also be redirected into traffic or snag on rigid posts.
Occupant risk may increase in the form of ridedown accelerations or occupant impact velocities.
These systems are located closer to the roadway than the edge of the slope. Previous research
demonstrated that guardrails can be adequately implemented on slopes as steep as 1V:2H [42].
Despite the ability to place the guardrail system immediately adjacent to the slope, the face of the
H
W
tw/2Fzo
Fzi
W
tw/2Fzo
Fzi
H
1V:2H 1V:6H
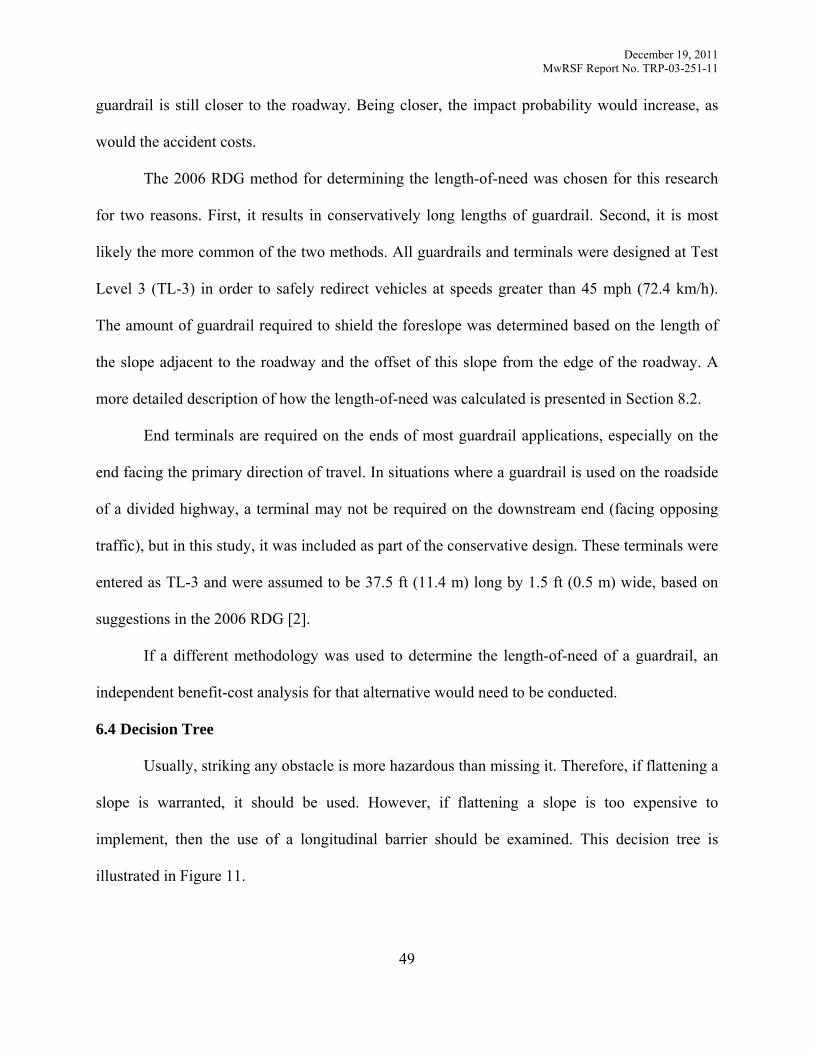
December 19, 2011 MwRSF Report No. TRP-03-251-11
49
guardrail is still closer to the roadway. Being closer, the impact probability would increase, as
would the accident costs.
The 2006 RDG method for determining the length-of-need was chosen for this research
for two reasons. First, it results in conservatively long lengths of guardrail. Second, it is most
likely the more common of the two methods. All guardrails and terminals were designed at Test
Level 3 (TL-3) in order to safely redirect vehicles at speeds greater than 45 mph (72.4 km/h).
The amount of guardrail required to shield the foreslope was determined based on the length of
the slope adjacent to the roadway and the offset of this slope from the edge of the roadway. A
more detailed description of how the length-of-need was calculated is presented in Section 8.2.
End terminals are required on the ends of most guardrail applications, especially on the
end facing the primary direction of travel. In situations where a guardrail is used on the roadside
of a divided highway, a terminal may not be required on the downstream end (facing opposing
traffic), but in this study, it was included as part of the conservative design. These terminals were
entered as TL-3 and were assumed to be 37.5 ft (11.4 m) long by 1.5 ft (0.5 m) wide, based on
suggestions in the 2006 RDG [2].
If a different methodology was used to determine the length-of-need of a guardrail, an
independent benefit-cost analysis for that alternative would need to be conducted.
6.4 Decision Tree
Usually, striking any obstacle is more hazardous than missing it. Therefore, if flattening a
slope is warranted, it should be used. However, if flattening a slope is too expensive to
implement, then the use of a longitudinal barrier should be examined. This decision tree is
illustrated in Figure 11.
December 19, 2011 MwRSF Report No. TRP-03-251-11
50
Figure 11. Alternative Decision Tree
Is slope flattening warranted?
Is slope flattening feasible?
Is installing barrier
warranted?
Is installing barrier feasible?
Is installing delineation feasible?
Flatten slope
Install barrier
Delineate hazard Do nothing
YES
YES YES
YES
YES
NO
NONO
NO
NO
December 19, 2011 MwRSF Report No. TRP-03-251-11
51
7 RSAP INPUT VALUES
7.1 Land Usage
Functional classes are defined differently depending on the land usage (urban or rural) of
the highway of interest. Urban areas are located within city limits where the population exceeds
5,000 people [29]. These limits or boundaries are determined by the State or by local officials.
Rural areas are locations found outside of urban boundaries.
7.2 Functional Class
This research utilized the following three functional classes: (1) Local, (2) Principal
Arterial, and (3) Freeway. Freeways are arterials with full control access. Typically, they support
efficient flow of traffic and high traffic volumes (up to 100,000 vpd in this research). Freeways
were considered as rural highways with volumes greater than 30,000 vpd, but the speed and
angle distribution used by RSAP is identical for rural and urban settings. As a result, the
conclusions made with regard to Freeways can be used in both land usages.
Arterials provide high-speed travel between major points, such as cities. This functional
class typically makes up the largest portion of a State’s highway infrastructure. As a result, many
different types of highways, including freeways, can be included in this class. For this research,
freeways were considered separately. For notational purposes, principal arterial highways were
designated as arterial highways. Volumes on arterials up to 30,000 vpd were used. Principal and
minor arterials are also assigned the same speed and angle distributions; therefore, conclusions
made with regard to arterials apply to both principal and minor arterial highways. However, the
urban arterials and rural arterials utilize differing speed and angle distributions and were
considered separately.
Local highways are all roads that are not considered to be freeways, arterials, or collector
highways. They support traffic over relatively short distances and serve land adjacent to collector
December 19, 2011 MwRSF Report No. TRP-03-251-11
52
networks. In RSAP, the speed and angle distributions differ for a rural and urban local highway.
As a result, they were considered separately. Also, local highways tend to have small traffic
volumes. For this research, rural local highways had volumes up to 1,000 vpd, and urban local
highways had volumes up to 5,000 vpd.
Collector highways fall between arterial and local highways. Their modeling parameters,
such as ADT, are not as clear as the other functional classes. As a result, the engineer is
encouraged to classify the collector highway as an arterial or a local highway, based on the
traffic volume.
For a more detailed description of this functional classes and land usages, including
volume descriptions, the reader should consult with the AASHTO Geometric Design of
Highways and Streets [29].
7.3 Roadway Geometry Parameters
Parameters characterized by a low sensitivity were assigned a constant value throughout
all analyses. The area type was grouped with the functional class (e.g., Rural Freeway) and was
treated with the moderately sensitive parameters. Four lanes were used on freeways and divided
arterials, but two lanes were used on undivided arterials and local roads. A shoulder width of 8 ft
(2.4 m) was also used on all highway types except the freeway. This width was chosen to give
law enforcement enough room to pull over to the side of the road, to give maintenance workers
enough space, and to provide enough room for motorists to avoid accidents [43]. The shoulder
width on a freeway was increased to 12 ft (3.7 m) to account for the increased traffic volume
[44]. The location of the slope or guardrail system under examination was assumed to be on the
right side of the roadway. Default values of 25 years and 4 percent were used for the design life
and discount rate, respectively. The traffic growth rate was estimated to be 2 percent between the
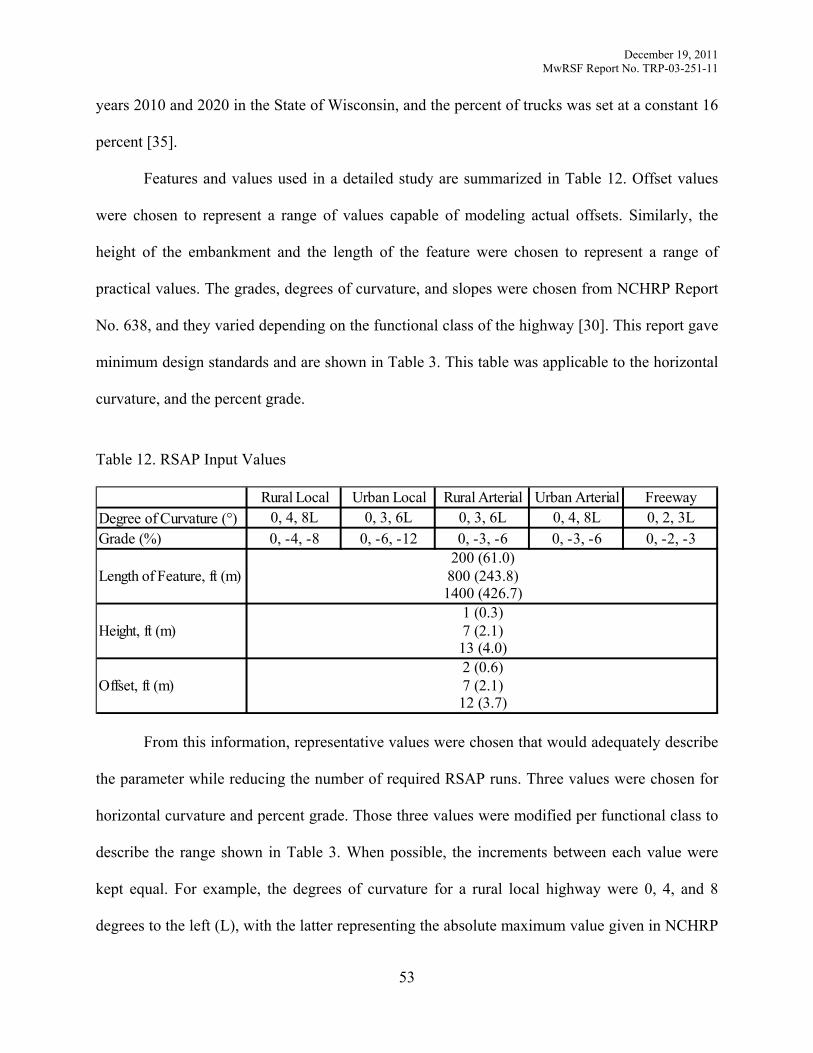
December 19, 2011 MwRSF Report No. TRP-03-251-11
53
years 2010 and 2020 in the State of Wisconsin, and the percent of trucks was set at a constant 16
percent [35].
Features and values used in a detailed study are summarized in Table 12. Offset values
were chosen to represent a range of values capable of modeling actual offsets. Similarly, the
height of the embankment and the length of the feature were chosen to represent a range of
practical values. The grades, degrees of curvature, and slopes were chosen from NCHRP Report
No. 638, and they varied depending on the functional class of the highway [30]. This report gave
minimum design standards and are shown in Table 3. This table was applicable to the horizontal
curvature, and the percent grade.
Table 12. RSAP Input Values
From this information, representative values were chosen that would adequately describe
the parameter while reducing the number of required RSAP runs. Three values were chosen for
horizontal curvature and percent grade. Those three values were modified per functional class to
describe the range shown in Table 3. When possible, the increments between each value were
kept equal. For example, the degrees of curvature for a rural local highway were 0, 4, and 8
degrees to the left (L), with the latter representing the absolute maximum value given in NCHRP
Rural Local Urban Local Rural Arterial Urban Arterial FreewayDegree of Curvature (°) 0, 4, 8L 0, 3, 6L 0, 3, 6L 0, 4, 8L 0, 2, 3LGrade (%) 0, -4, -8 0, -6, -12 0, -3, -6 0, -3, -6 0, -2, -3
Offset, ft (m)
Length of Feature, ft (m)
Height, ft (m)
12 (3.7)7 (2.1)2 (0.6)13 (4.0)7 (2.1)1 (0.3)
1400 (426.7)800 (243.8)200 (61.0)
December 19, 2011 MwRSF Report No. TRP-03-251-11
54
Report No. 638. Left curves and downgrades were selected over their counterparts because they
represented the worst case for those parameters. By using only the worst case, the results were
conservative, and the number of RSAP runs was reduced. The horizontal curvatures and percent
grades are summarized in Table 12.
The final three parameters described in Table 12 were constant for each functional class
and alternative. Again, three values were used to provide enough data to interpolate at any value
while limiting the number of RSAP simulations that were required. Each of the parameters had
equal increments between their values. In general, and when extreme values are avoided, the
values of these parameters are arbitrary because the results will be used in linear interpolation to
determine accident costs at any length, height, or offset. As the length of the feature increased,
the accident frequency would increase linearly as well. As a result, the actual values used in
RSAP were only significant in the interpolation of the results of the study. The height selection
was discussed in the parametric study, and the same values were used in the detailed study.
Recall that the 7-ft (2.1-m) height was close to an inflection point in the SI-height plot. The
lower height was representative of a high-slope portion of that plot, while the upper height was
representative of the low-slope portion of that plot. For the final parameter, offset, values were
chosen at relatively close proximity to the roadway. As the offset increases, the accident
frequency decreases. In order to capture the effect of a more turbulent region of encroachments,
offsets of diminished magnitude were selected.
Backslopes were not considered in this report. Intuitively speaking, at low foreslope
heights and high backslope heights, the effect of the backslope may be more pronounced. In this
scenario, separate consideration should be given to the dangers associated with the backslope.
For reference, the RDG gives preferred cross-sections in a V-ditch. This reference has been
available since the 1970’s, but very little is known about the safety performance of V-ditches via
December 19, 2011 MwRSF Report No. TRP-03-251-11
55
crash testing. The RDG suggests using slopes on either side of the V-ditch that are flatter than
1V:3H at all times. In fact, if one the two slopes is a 1V:3H slope, the other must be flat. As an
illustration, a V-ditch with equal slopes of 1V:4H would not be preferred.
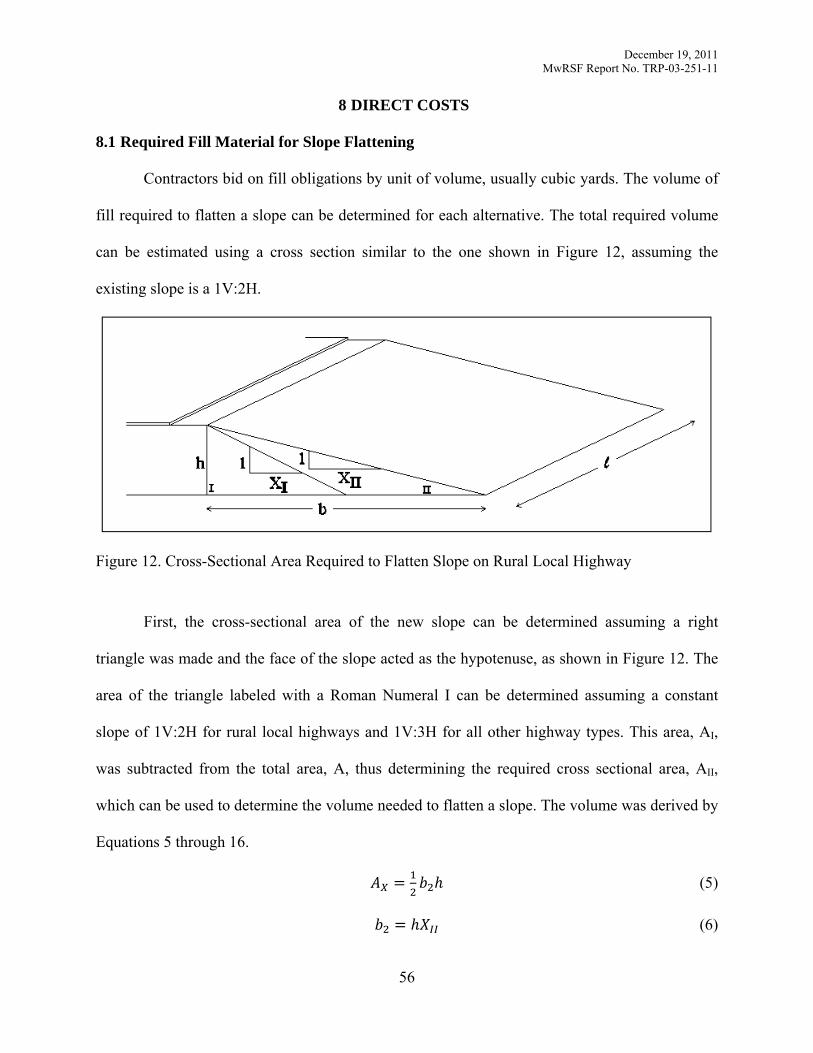
December 19, 2011 MwRSF Report No. TRP-03-251-11
56
8 DIRECT COSTS
8.1 Required Fill Material for Slope Flattening
Contractors bid on fill obligations by unit of volume, usually cubic yards. The volume of
fill required to flatten a slope can be determined for each alternative. The total required volume
can be estimated using a cross section similar to the one shown in Figure 12, assuming the
existing slope is a 1V:2H.
Figure 12. Cross-Sectional Area Required to Flatten Slope on Rural Local Highway
First, the cross-sectional area of the new slope can be determined assuming a right
triangle was made and the face of the slope acted as the hypotenuse, as shown in Figure 12. The
area of the triangle labeled with a Roman Numeral I can be determined assuming a constant
slope of 1V:2H for rural local highways and 1V:3H for all other highway types. This area, AI,
was subtracted from the total area, A, thus determining the required cross sectional area, AII,
which can be used to determine the volume needed to flatten a slope. The volume was derived by
Equations 5 through 16.
(5)
(6)
December 19, 2011 MwRSF Report No. TRP-03-251-11
57
By substituting Equation 6 into Equation 5, the total cross-sectional area of the flattened
slope could be determined. This result is shown as Equation 7.
(7)
Next, the cross-sectional area of the original slope was calculated. In terms of height and
width, this area was given by Equation 8.
(8)
(9)
By substituting Equation 9 into Equation 8, the cross-sectional area of the original slope
could be determined in terms of the height of the slope. This cross-sectional area of the original
slope is shown in Equation 10.
(10)
Next, the cross-sectional area of the fill material needed to create the desired slope was
determined in terms of the height and the flattened slope (1V:XH). This general equation is
shown in Equation 11.
(11)
By substituting Equations 7 and 10 into Equation 11, the final required cross-sectional
area in terms of the height and the difference of the two slopes is shown in Equation 12.
(12)
The volume required to flatten the original slope to the desired slope is calculated by
multiplying the length of the slope parallel to the roadway by the area calculated from Equation
12. This fill volume calculation is shown in Equation 13 in terms of the cross-sectional area and
in Equation 14 in terms of the height and slope differences of the two slopes.
(13)
December 19, 2011 MwRSF Report No. TRP-03-251-11
58
(14)
The volume may need to be adjusted for bulking or shrinking. The shrinkage factor
(ΔV/Vf) of soil is a function of the unit weight of the fill material and the cut material.
∆ 1 (15)
Where is the average dry unit weight of fill, and is the average dry unit
weight of borrow. The volume of borrow required to satisfy the Vfill demand is always at least as
much as the Vfill and is often more. The equation to calculate the total volume required from a
borrow site is shown in Equation 16.
1 ∆ (16)
In addition to the cost of materials, the cost of the right of way may need to be included.
In some areas, this may be extremely expensive and force the engineer to abandon the idea of a
flatter slope.
8.2 Required Material for a Guardrail System
The variables required to determine the guardrail length-of-need are shown in Figure 13.
The tangent length of the barrier immediately upstream of the slope (L1) was assumed to be 25 ft
(7.6 m). This assumption was based on sample designs found in the 2006 RDG [2]. The shy line
was defined as the point from the edge of the travel way at which the motorist would not be
inclined to reduce the speed or direction of the vehicle. For 55 mph (88.5 km/h), the shyline is
located 7.2 ft (2.2 m) from the edge of the travel way [2]. Flared guardrail was used to limit the
reaction of a motorist to the guardrail by starting it further away from the road than the straight
segment of guardrail. In addition, the use of flared guardrail sections reduces the total length-of-
need for the guardrail installation. For scenarios with a guardrail offset of 2 and 7 ft (0.6 and 2.1
m) along the straight segment (inside the shy line), a flare rate of 24:1 was used. Outside the shy
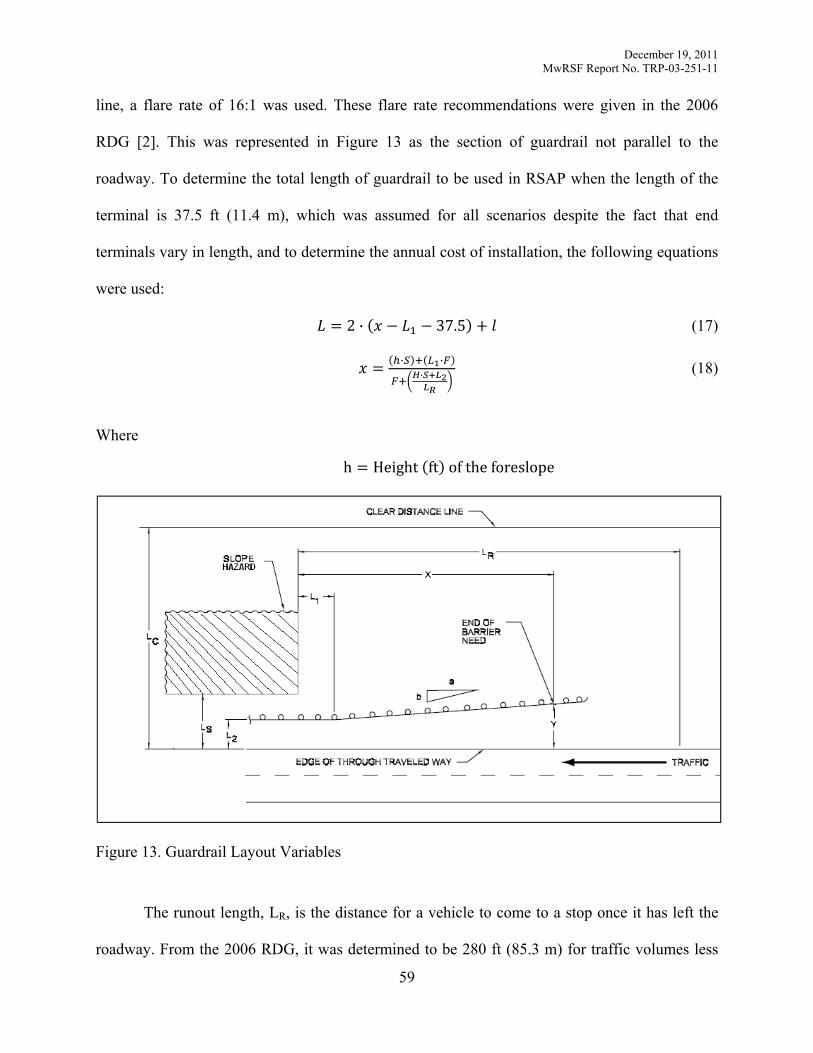
December 19, 2011 MwRSF Report No. TRP-03-251-11
59
line, a flare rate of 16:1 was used. These flare rate recommendations were given in the 2006
RDG [2]. This was represented in Figure 13 as the section of guardrail not parallel to the
roadway. To determine the total length of guardrail to be used in RSAP when the length of the
terminal is 37.5 ft (11.4 m), which was assumed for all scenarios despite the fact that end
terminals vary in length, and to determine the annual cost of installation, the following equations
were used:
2 · 37.5 (17)
· ·· (18)
Where
h Height ft of the foreslope
Figure 13. Guardrail Layout Variables
The runout length, LR, is the distance for a vehicle to come to a stop once it has left the
roadway. From the 2006 RDG, it was determined to be 280 ft (85.3 m) for traffic volumes less
December 19, 2011 MwRSF Report No. TRP-03-251-11
60
than 800 vpd, 315 ft (96.0 m) for traffic volumes between 800 and 2,000 vpd, 345 ft (105.2 m)
for traffic volumes between 2,000 and 6,000 vpd, and 360 ft (109.7 m) for traffic volumes
greater than 6,000 vpd [2]. The run-out length was correlated to the traffic volume because the
Hutchinson and Kennedy encroachment data was used to simulate encroachment events, and, in
that study, the encroachment frequency was dependent on the traffic volume [12]. Based on the
height and slope of the foreslope, the width of the base of the slope was calculated. Given these
parameters, basic geometry derived from the plan view was used to determine the lateral offset
from the edge of the travel way of each point of interest along the system. This included the
beginning of the terminal, the beginning of the guardrail, the end of the first flared section of
guardrail, the end of the straight segment of guardrail, and the beginning of the second terminal.
These lateral offsets were entered into RSAP.
Terminals were placed at both ends of the guardrail. For a TL-3 condition, many
terminals are 37.5 ft (11.4 m) long and 1.5 ft (0.5 m) wide, as suggested by the 2006 RDG [2].
8.3 Annualized Direct Costs
The cost to install a new system or upgrade an existing one needs to be annualized for
each alternative. The total cost per year takes into account the design life of the system as well as
an interest rate. Equation 19 was used to determine the direct cost of each alternative, which can
be used to determine the denominator of the BC ratio.
· (19)
Where
Annualized direct cost to install the system

December 19, 2011 MwRSF Report No. TRP-03-251-11
61
Total cost of material, labor, and right-of-way
Interest rate as a decimal
Design life (years)
December 19, 2011 MwRSF Report No. TRP-03-251-11
62
9 ACCIDENT COSTS
9.1 Societal Costs
Once the severity of an accident is determined, the cost of that accident can be calculated.
The RSAP simulation determines the probability of an accident resulting in a certain injury level
such as death or severe injury. For each level of injury, there is an associated cost.
Accident cost figures can be found from multiple sources including the RDG and the
FHWA. The FHWA gives a data set that includes a person’s willingness to pay to avoid injury or
fatality. Therefore, it is strongly recommended that the FHWA’s comprehensive accident cost
values be used. However, their values are based on the value of the U.S. dollar in 1994. Those
costs were then increased using the Gross Domestic Product (GDP) implicit price deflator for the
year 2010. Therefore, those values were adjusted for the year 2010 using Equation 20. These
values are given in Table 13.
(20)
Where
Accident cost in 2010
Societal cost given by the FHWA in 1994
GDP implicit price deflator for the year, i
The GDP implicit price deflator for 1994 and 2010 were 80.507 and 111.141,
respectively [45]. To determine the accident costs in years other than 2010, the GDP2010 would
be replaced by the deflator value for the desired year.
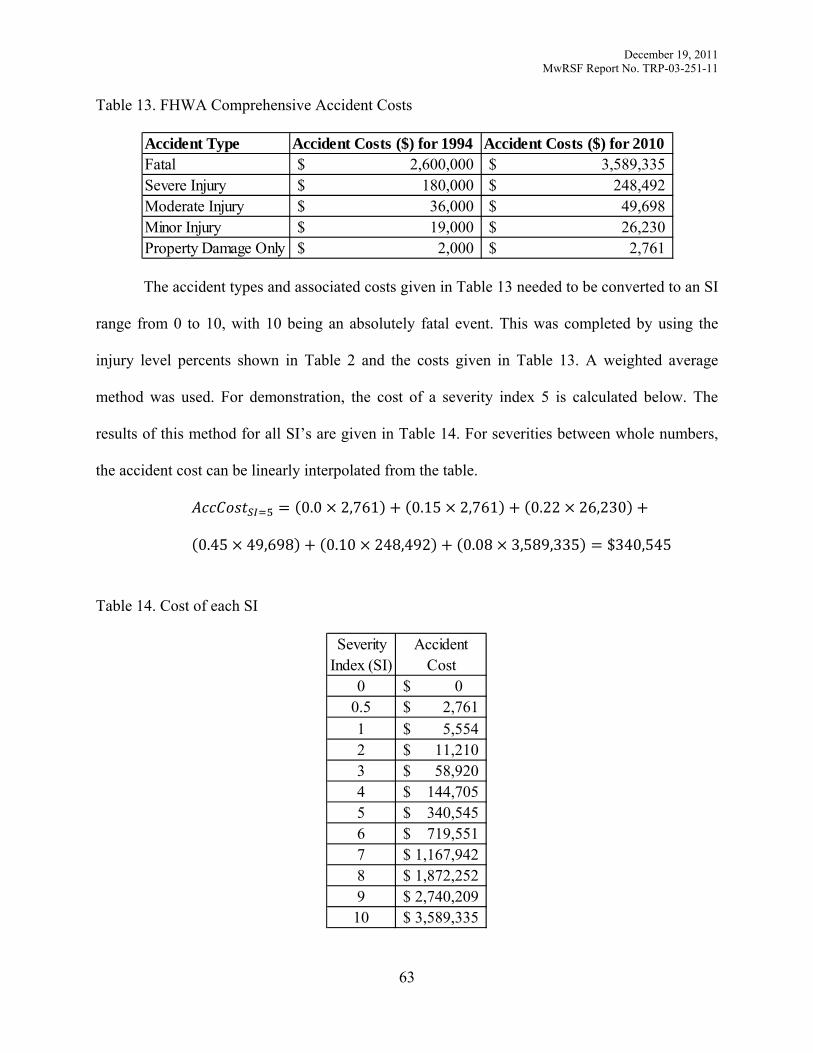
December 19, 2011 MwRSF Report No. TRP-03-251-11
63
Table 13. FHWA Comprehensive Accident Costs
The accident types and associated costs given in Table 13 needed to be converted to an SI
range from 0 to 10, with 10 being an absolutely fatal event. This was completed by using the
injury level percents shown in Table 2 and the costs given in Table 13. A weighted average
method was used. For demonstration, the cost of a severity index 5 is calculated below. The
results of this method for all SI’s are given in Table 14. For severities between whole numbers,
the accident cost can be linearly interpolated from the table.
0.0 2,761 0.15 2,761 0.22 26,230
0.45 49,698 0.10 248,492 0.08 3,589,335 $340,545
Table 14. Cost of each SI
Accident Type Accident Costs ($) for 1994 Accident Costs ($) for 2010Fatal 2,600,000$ 3,589,335$ Severe Injury 180,000$ 248,492$ Moderate Injury 36,000$ 49,698$ Minor Injury 19,000$ 26,230$ Property Damage Only 2,000$ 2,761$
Severity Index (SI)
Accident Cost
0 0$ 0.5 2,761$ 1 5,554$ 2 11,210$ 3 58,920$ 4 144,705$ 5 340,545$ 6 719,551$ 7 1,167,942$ 8 1,872,252$ 9 2,740,209$
10 3,589,335$
December 19, 2011 MwRSF Report No. TRP-03-251-11
64
So far, only the unadjusted accident cost has been determined for any SI. The actual
accident cost was determined using adjustment factors for the encroachment speed and angle,
vehicle orientation, vehicle type, and lane departure/encroachment direction. The adjusted
accident cost was then multiplied by the probability of the vehicle encroaching through a given
lateral offset. Finally, this analysis was repeated until the resulting average encroachment
accident cost converged to within one percent.
9.2 Accident Cost Equations Determined by RSAP
For each considered scenario, there were several traffic volumes simulated to understand
the effect of traffic volume on the accident cost. The relationship was approximately linear.
However, because the accident cost is a function of the current year’s GDP, the impact frequency
was used in combination with the severity index to determine the accident cost. For each
functional class, a linear regression was conducted in which the regression line was forced
through the origin (zero traffic equals zero impact frequency). As a result, a simple y = bx
equation could be generated for all scenarios, were y is the impact frequency, b is the slope of the
regression line, and x is the traffic volume (ADT). The slope, b, is given with each scenario in
the Appendices, and the equation used to determine b is given below as Equation 21. The
simulated severity index for each scenario was then used to determine the cost of a single
accident on that roadway configuration. This was done using a sixth-degree polynomial that
accurately reflects the relationship between severity index and accident cost, as shown in
Equation 22. The coefficients of this polynomial were determined using Microsoft Excel and
Equation 23. Finally, the cost of a single accident was multiplied by the slope and the traffic
volume to determine the accident cost, as shown in Equation 24.
∑∑ (21)
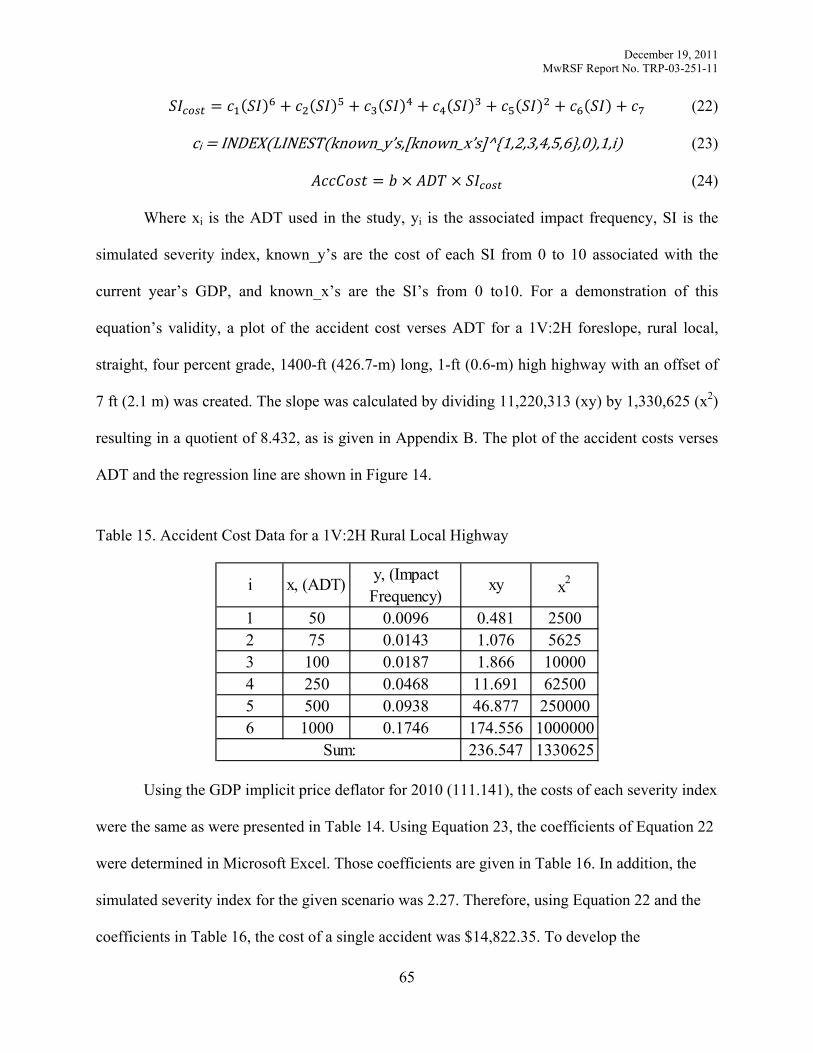
December 19, 2011 MwRSF Report No. TRP-03-251-11
65
(22)
ci INDEX LINEST known_y’s, known_x’s ^ 1,2,3,4,5,6 ,0 ,1,i (23)
(24)
Where xi is the ADT used in the study, yi is the associated impact frequency, SI is the
simulated severity index, known_y’s are the cost of each SI from 0 to 10 associated with the
current year’s GDP, and known_x’s are the SI’s from 0 to10. For a demonstration of this
equation’s validity, a plot of the accident cost verses ADT for a 1V:2H foreslope, rural local,
straight, four percent grade, 1400-ft (426.7-m) long, 1-ft (0.6-m) high highway with an offset of
7 ft (2.1 m) was created. The slope was calculated by dividing 11,220,313 (xy) by 1,330,625 (x2)
resulting in a quotient of 8.432, as is given in Appendix B. The plot of the accident costs verses
ADT and the regression line are shown in Figure 14.
Table 15. Accident Cost Data for a 1V:2H Rural Local Highway
Using the GDP implicit price deflator for 2010 (111.141), the costs of each severity index
were the same as were presented in Table 14. Using Equation 23, the coefficients of Equation 22
were determined in Microsoft Excel. Those coefficients are given in Table 16. In addition, the
simulated severity index for the given scenario was 2.27. Therefore, using Equation 22 and the
coefficients in Table 16, the cost of a single accident was $14,822.35. To develop the
i x, (ADT) y, (Impact Frequency)
xy x2
1 50 0.0096 0.481 25002 75 0.0143 1.076 56253 100 0.0187 1.866 100004 250 0.0468 11.691 625005 500 0.0938 46.877 2500006 1000 0.1746 174.556 1000000
236.547 1330625Sum:
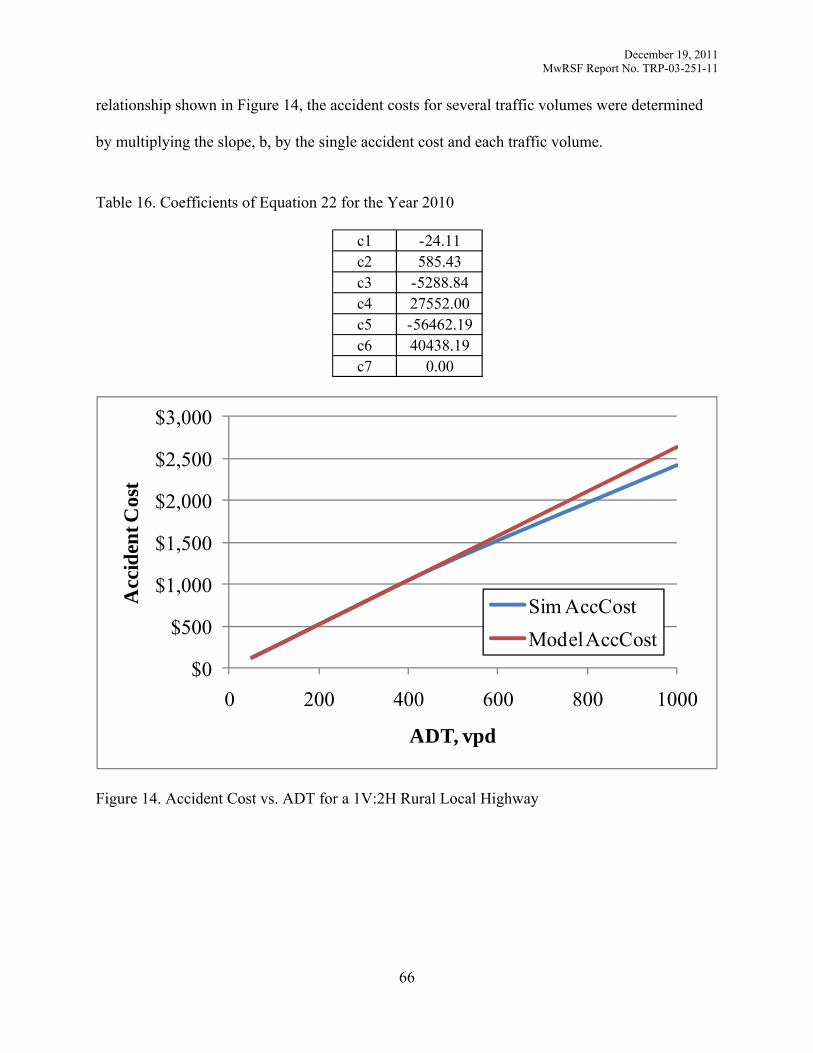
December 19, 2011 MwRSF Report No. TRP-03-251-11
66
relationship shown in Figure 14, the accident costs for several traffic volumes were determined
by multiplying the slope, b, by the single accident cost and each traffic volume.
Table 16. Coefficients of Equation 22 for the Year 2010
Figure 14. Accident Cost vs. ADT for a 1V:2H Rural Local Highway
c1 -24.11c2 585.43c3 -5288.84c4 27552.00c5 -56462.19c6 40438.19c7 0.00
$0
$500
$1,000
$1,500
$2,000
$2,500
$3,000
0 200 400 600 800 1000
Acc
iden
t Cos
t
ADT, vpd
Sim AccCostModel AccCost
December 19, 2011 MwRSF Report No. TRP-03-251-11
67
9.3 Using the Benefit-Cost Analysis of Foreslopes Program
9.3.1 Background
Looking up values in the appendices of this report can be cumbersome and may lead to
errors. In addition, the interpolation between accident costs, when needed, can exponentially
complicate the determination of the accident cost. If none of the parameters (degree of curvature,
grade, length, height, and offset) match the values used in the study, 32 different accident costs
would be required in order to completely interpolate between all of the known values and
calculate one overall accident cost. In addition, the accident costs change each year as the GDP
fluctuates. Clearly, the need exists for a computer program that is capable of looking up the
values presented in this report and using them to calculate an accident cost, using interpolation
where needed. In response to this need, Microsoft Excel was used to create the Benefit-Cost
Analysis of Foreslopes Program (BCAFP), which contains a series of spreadsheets that allow the
user to input the known values of the previously described parameters as well as a traffic volume
and direct cost. Other sheets were included that contained the calculations required for each
functional class. One sheet contained the results for every scenario involving each functional
class and design alternative, which are presented in this report in Appendix B through Appendix
JJ.
9.3.2 Development of BCAFP
The first spreadsheet in the Microsoft Excel workbook is reserved for user input and
contains the design recommendation based on accident and direct costs. This sheet contains drop
down menus to select the functional class and the design alternatives. The user is then allowed to
specify the degree of curvature and the percent grade, as well as the length, height, and offset of
the roadside feature. The curvature of the roadway was always modeled to the left, as this would
provide a higher accident rate. For undivided roadways, the designation of left or right curves
December 19, 2011 MwRSF Report No. TRP-03-251-11
68
was trivial since in one direction the curve is to the right, but in the opposite direction, the curve
is to the left. However, on divided highways, the designation is important. However, to simplify
the input data and to err on the side of safety, left-hand curves only were considered. As a result,
the only input consideration for the degree of curvature is the magnitude of the degree itself. If a
negative value is entered, the program will extrapolate to the negative value and the results will
not be accurate. Similarly, only down grades were considered in the RSAP analyses. Down
grades are considerably more unstable that up grades. RSAP actually treats up grades as flat
ground, meaning the traffic adjustment factor that is used in the encroachment module is set to
one for all up grades. Therefore, if a down grade is present, the user should enter the magnitude
of the down grade as a percent, noting that a negative value would require extrapolation and
would be incorrect. If an up grade is present, the percent grade should be set to zero. When
determining the offset, the defined value using in RSAP was the distance from the edge of the
travel way to the hinge point of the slope. The edge of the travel way includes the shoulder, and
the hinge point is simply the intersection of the flat ground (or nearly flat) and the slope.
In addition, the user must input an ADT, in vpd. This ADT would be representative of a
point in time and would not be effected by the traffic growth factor. Therefore, the engineer must
determine the ADT if some future value were to be used. This can be done by adjusting the
known current ADT by the traffic growth factor for that highway. The analyses using RSAP
utilized a traffic growth factor of 2 percent over a design life of 25 years [35]. If the actual traffic
growth factor for a given highway is unknown, 2 percent may be used. If the future ADT is
expected to be lower than the current ADT, the analysis done by BCAFP would be unaffected, so
long as the ADT of interest were used. The engineer should use judgment in determining if the
current ADT, ADT at the end of the design life, or some other value should be used. It is
December 19, 2011 MwRSF Report No. TRP-03-251-11
69
recommended that the ADT at the mid-life of the design be used as this would yield average
annual accident costs that would be indicative of all years in the design life.
In addition, the user must specify the GDP implicit price deflator for the current year, the
interest rate (4 percent is relatively constant), the design life, and the minimum BC ratio. In
addition, the total direct cost of each alternative must be entered by the engineer. This cost would
include material costs, labor, and ROW considerations. The GDP implicit price deflator for the
current year is determined by the FHWA and is sent out to all field offices. When conducting a
project using BCAFP for the first time in a given year, the local FHWA field office should be
contacted to ascertain the GDP implicit price deflator. Also included is a reminder to use a
traversable run-out area beyond the toe of 1V:3H slopes. It also warns the user when
extrapolation is used to estimate accident cost, prompting the user to use engineering judgment
as to whether or not to use the accident cost.
The second sheet displays the accident costs for each design alternative as determined in
the Functional Class sheets. The third sheet assembles a BC ratio matrix by using Equation 36.
This sheet also interprets the matrix and determines the best overall design alternative, according
to the BC ratios.
The fourth sheet contains a combination of the results shown in Appendix B through
Appendix JJ. Each scenario was assigned an index number, which was later used to lookup
values based on the input parameters. In total, 8,505 index values covered freeways, divided
rural arterials, undivided rural arterials, rural locals, divided urban arterials, undivided urban
arterials, and urban locals. Each of those functional classes contain to four slopes (1V:2H,
1V:3H, 1V:4H, and 1V:6H) and one guardrail system.
The next seven sheets were created for calculation purposes, each one containing
calculations pertinent to one of the seven functional classes mentioned in the preceding
December 19, 2011 MwRSF Report No. TRP-03-251-11
70
paragraph. Each sheet imports data entered in the “BC Analysis” tab. Using these input
parameters, the program determines the two standard values surrounding the user’s input value.
Those standard values were those chosen for the RSAP simulation. These two values were
designated as LOW and HIGH, relative to the input value. For example, if the user specifies a
height of 4 ft (12 m), the low value programmed into RSAP was 1 ft (0.3 m), and the high value
was 7 ft (2.1 m). Once low and high values were determined for each input parameter, the
pertinent coefficients for those low and high values were looked up from the “Coefficients” tab.
Once the coefficients were determined, the program interpolated between the two values to
determine the proper coefficient for the user’s input value. This interpolation process could
become very complex. It was accomplished by first interpolating between offset values. The
process continued next by interpolating between heights, lengths, grades, and finally degrees of
curvature. The interpolation tree has been illustrated in Figure 15. This tree only shows half of
the interpolation process. The top entry represents the low value of the degree of curvature. The
other half of the tree would show the high value. The final coefficient was determined by
interpolating between these two halves, using the input value for the degree of curvature.
The twelfth sheet orders the design alternatives by ascending direct costs for use in the
matrix interpretation. The thirteenth and final sheet calculates the cost of a single accident at the
simulated severity index. This is done by reading in the current year’s GDP implicit price
deflator, adjust the cost of each SI, and determining the coefficients of Equation 22 using
Equation 23. Then, these coefficients are used in the “Coefficients” tab to calculate the accident
cost for every scenario (each of the 8,505), based on the user-defined traffic volume and
simulated impact frequency.
Finally, when a parameter’s value falls outside the range of used values, interpolation
cannot be used. Instead, extrapolation beyond the last known point must be used. This was

December 19, 2011 MwRSF Report No. TRP-03-251-11
71
accomplished by using the slope between the closest two known parameters and applying this
slope to the difference between the values of the out-of-range and in-range parameters.
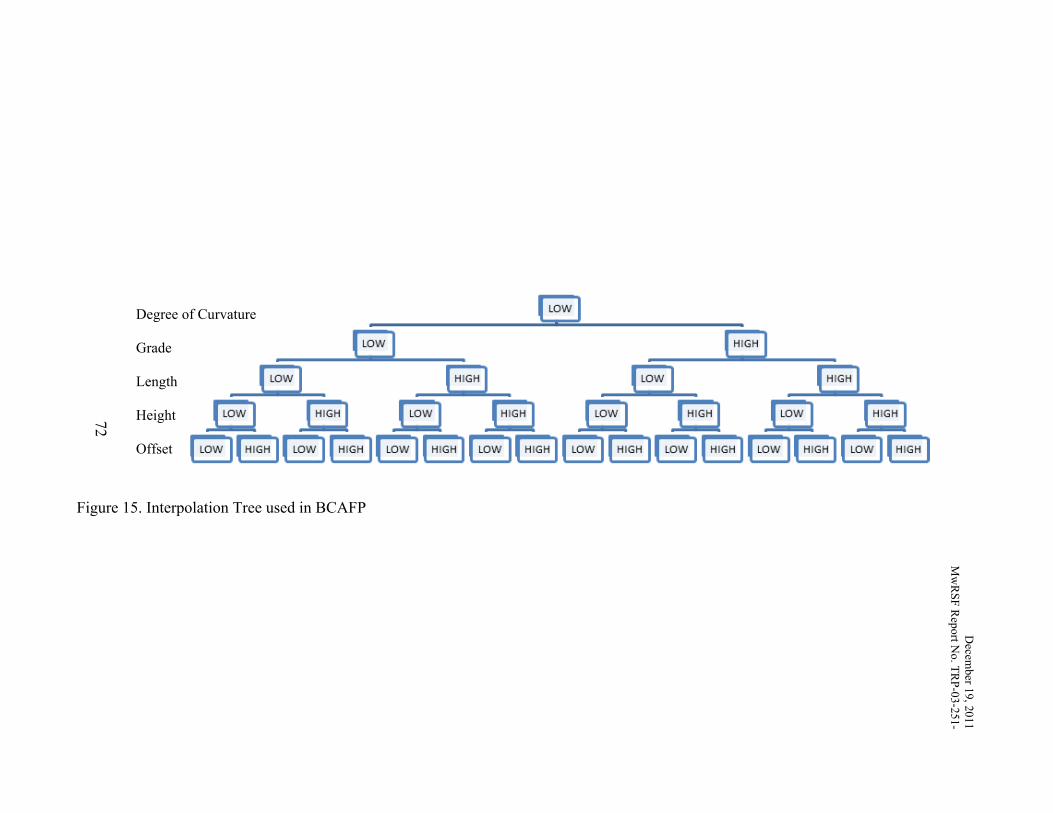
Decem
ber 19, 2011 M
wR
SF Report N
o. TRP-03-251-
72
Figure 15. Interpolation Tree used in BCAFP
Degree of Curvature
Grade
Length
Height
Offset
December 19, 2011 MwRSF Report No. TRP-03-251-11
73
9.3.3 Using BCAFP
On the “BC Analysis” tab, the user may select the functional class from a drop down
menu. The user must then select a design alternative. The options include foreslopes of 1V:2H,
1V:3H, 1V:4H, and 1V:6H in addition to a Guardrail option. Intermediate slopes, such as
1V:3.4H, should be classified as one of the provided slopes. This is done by rounding up or
down as needed. For example, the 3.1V:4H slope would round down to 1V:3H. If the engineer
needs a more precise estimate for an accident cost (but not necessarily more accurate), linear
interpolation may be used between adjacent slopes. In the example, a 1V:3H and a 1V:4H slope
would be used in combination with the given slope. The Guardrail option is only included as a
rough guideline. If a longitudinal barrier is required, some other means of analysis should be
used to determine the best barrier for any given situation.
The remaining parameters are not selected from drop down menus. Instead, the user is
allowed to specify any input value, within limits that will be discussed in the next section, to any
degree of precision. If the input value exceeds the upper value used in the study or is less than
the lowest value, the program will display a warning message that says, “Extrapolation Used,”
since interpolation was used. The warning is intended to prompt the engineer to use judgment in
determining if the accident cost is reasonable for the scenario.
Once the input parameters are completed, BCAFP determines the values that were
determined by interpolation or extrapolation. The equations given in Section 9.2 were used to
calculate the accident cost. Finally, using the user-defined direct costs, a BC ratio was
determined for each alternative comparison, resulting in a BC ratio matrix. BCAFP then
interprets this matrix to recommend the most cost-effective design.
December 19, 2011 MwRSF Report No. TRP-03-251-11
74
9.3.4 Limitations of BCAFP
The coefficients used by BCAFP were determined as outlined in this report. That is, they
were based on results from RSAP. RSAP itself has limitations ranging from the data it uses for
encroachment frequency to programming errors. These limitations are highlighted in Chapter 12
and are detailed more explicitly in the draft interim report for NCHRP Project 22-27 [16].
The known values of the coefficients fall within a specified range of known input
parameters. For example, the range of the length of the feature was 200 to 1,400 ft (61.0 to 426.7
m). As a result, if the accident cost was required for a scenario that falls outside this range,
extrapolation was required. However, this was less certain than interpolation results between
known values. The engineer is encouraged to use judgment to determine if the accident costs
determined by extrapolation are representative of the scenario.
9.4 Accident Cost Trends for Each Parameter
Several parameters contributed to the accident cost. Each contributed in different
magnitudes. Some increased the accident cost while others decreased it. The parameters that
were allowed to vary and can be selected by the engineer were as follows: (1) design alternative;
(2) traffic volume; (3) degree of curvature; (4) grade; (5) length of the feature; (6) height of the
feature; and (7) offset of the feature from the edge of the travel way. To understand and
demonstrate the effect of each of these parameters on the accident cost, bar graphs were created
to show how the accident cost fluctuates when only one of the seven parameters is changed. In
general, four cases were used to study each parameter. For example, the ADT for a freeway
varied from 10,000 vpd (Case 1) to 100,000 vpd (Case 4). In this example, all other parameters
used in Case 4 were the same as used in Case 1 (e.g., Case 4 degree of curvature was 0 degrees
when examining ADT). The case descriptions for each functional class and each parameter are
detailed in Table 17.
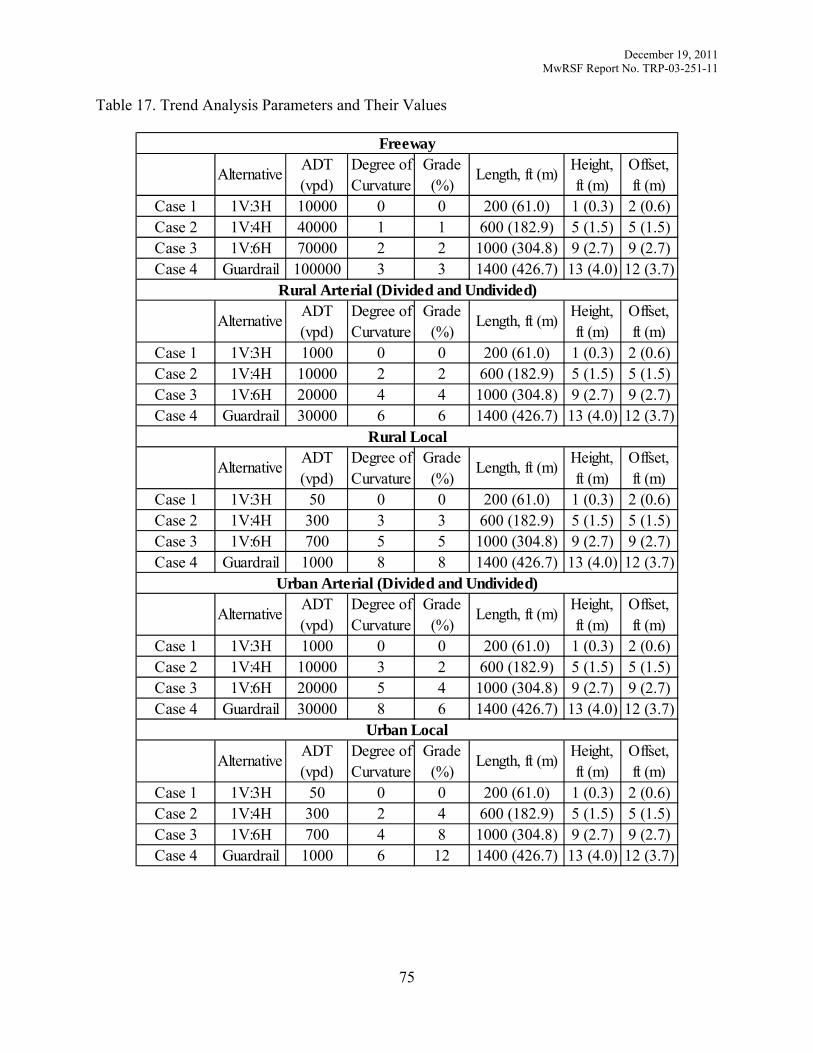
December 19, 2011 MwRSF Report No. TRP-03-251-11
75
Table 17. Trend Analysis Parameters and Their Values
Alternative ADT (vpd)
Degree of Curvature
Grade (%)
Length, ft (m) Height, ft (m)
Offset, ft (m)
Case 1 1V:3H 10000 0 0 200 (61.0) 1 (0.3) 2 (0.6)Case 2 1V:4H 40000 1 1 600 (182.9) 5 (1.5) 5 (1.5)Case 3 1V:6H 70000 2 2 1000 (304.8) 9 (2.7) 9 (2.7)Case 4 Guardrail 100000 3 3 1400 (426.7) 13 (4.0) 12 (3.7)
Alternative ADT (vpd)
Degree of Curvature
Grade (%)
Length, ft (m) Height, ft (m)
Offset, ft (m)
Case 1 1V:3H 1000 0 0 200 (61.0) 1 (0.3) 2 (0.6)Case 2 1V:4H 10000 2 2 600 (182.9) 5 (1.5) 5 (1.5)Case 3 1V:6H 20000 4 4 1000 (304.8) 9 (2.7) 9 (2.7)Case 4 Guardrail 30000 6 6 1400 (426.7) 13 (4.0) 12 (3.7)
Alternative ADT (vpd)
Degree of Curvature
Grade (%)
Length, ft (m) Height, ft (m)
Offset, ft (m)
Case 1 1V:3H 50 0 0 200 (61.0) 1 (0.3) 2 (0.6)Case 2 1V:4H 300 3 3 600 (182.9) 5 (1.5) 5 (1.5)Case 3 1V:6H 700 5 5 1000 (304.8) 9 (2.7) 9 (2.7)Case 4 Guardrail 1000 8 8 1400 (426.7) 13 (4.0) 12 (3.7)
Alternative ADT (vpd)
Degree of Curvature
Grade (%)
Length, ft (m) Height, ft (m)
Offset, ft (m)
Case 1 1V:3H 1000 0 0 200 (61.0) 1 (0.3) 2 (0.6)Case 2 1V:4H 10000 3 2 600 (182.9) 5 (1.5) 5 (1.5)Case 3 1V:6H 20000 5 4 1000 (304.8) 9 (2.7) 9 (2.7)Case 4 Guardrail 30000 8 6 1400 (426.7) 13 (4.0) 12 (3.7)
Alternative ADT (vpd)
Degree of Curvature
Grade (%)
Length, ft (m) Height, ft (m)
Offset, ft (m)
Case 1 1V:3H 50 0 0 200 (61.0) 1 (0.3) 2 (0.6)Case 2 1V:4H 300 2 4 600 (182.9) 5 (1.5) 5 (1.5)Case 3 1V:6H 700 4 8 1000 (304.8) 9 (2.7) 9 (2.7)Case 4 Guardrail 1000 6 12 1400 (426.7) 13 (4.0) 12 (3.7)
Freeway
Rural Arterial (Divided and Undivided)
Rural Local
Urban Arterial (Divided and Undivided)
Urban Local
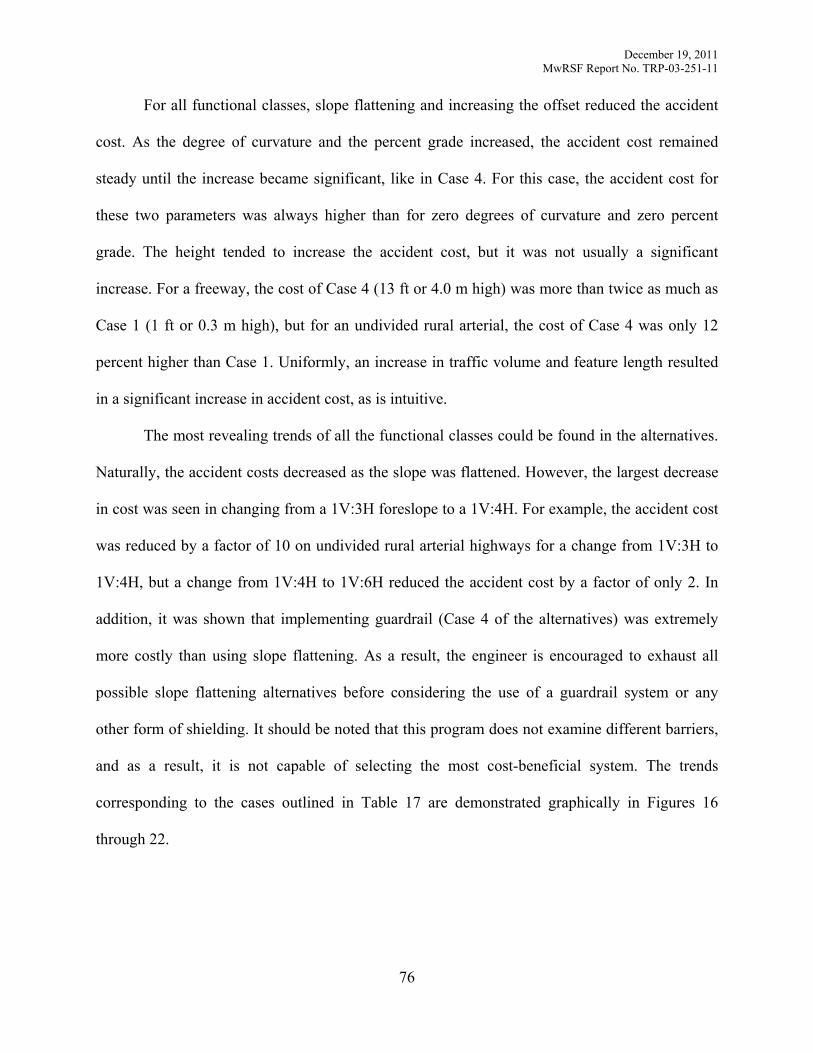
December 19, 2011 MwRSF Report No. TRP-03-251-11
76
For all functional classes, slope flattening and increasing the offset reduced the accident
cost. As the degree of curvature and the percent grade increased, the accident cost remained
steady until the increase became significant, like in Case 4. For this case, the accident cost for
these two parameters was always higher than for zero degrees of curvature and zero percent
grade. The height tended to increase the accident cost, but it was not usually a significant
increase. For a freeway, the cost of Case 4 (13 ft or 4.0 m high) was more than twice as much as
Case 1 (1 ft or 0.3 m high), but for an undivided rural arterial, the cost of Case 4 was only 12
percent higher than Case 1. Uniformly, an increase in traffic volume and feature length resulted
in a significant increase in accident cost, as is intuitive.
The most revealing trends of all the functional classes could be found in the alternatives.
Naturally, the accident costs decreased as the slope was flattened. However, the largest decrease
in cost was seen in changing from a 1V:3H foreslope to a 1V:4H. For example, the accident cost
was reduced by a factor of 10 on undivided rural arterial highways for a change from 1V:3H to
1V:4H, but a change from 1V:4H to 1V:6H reduced the accident cost by a factor of only 2. In
addition, it was shown that implementing guardrail (Case 4 of the alternatives) was extremely
more costly than using slope flattening. As a result, the engineer is encouraged to exhaust all
possible slope flattening alternatives before considering the use of a guardrail system or any
other form of shielding. It should be noted that this program does not examine different barriers,
and as a result, it is not capable of selecting the most cost-beneficial system. The trends
corresponding to the cases outlined in Table 17 are demonstrated graphically in Figures 16
through 22.
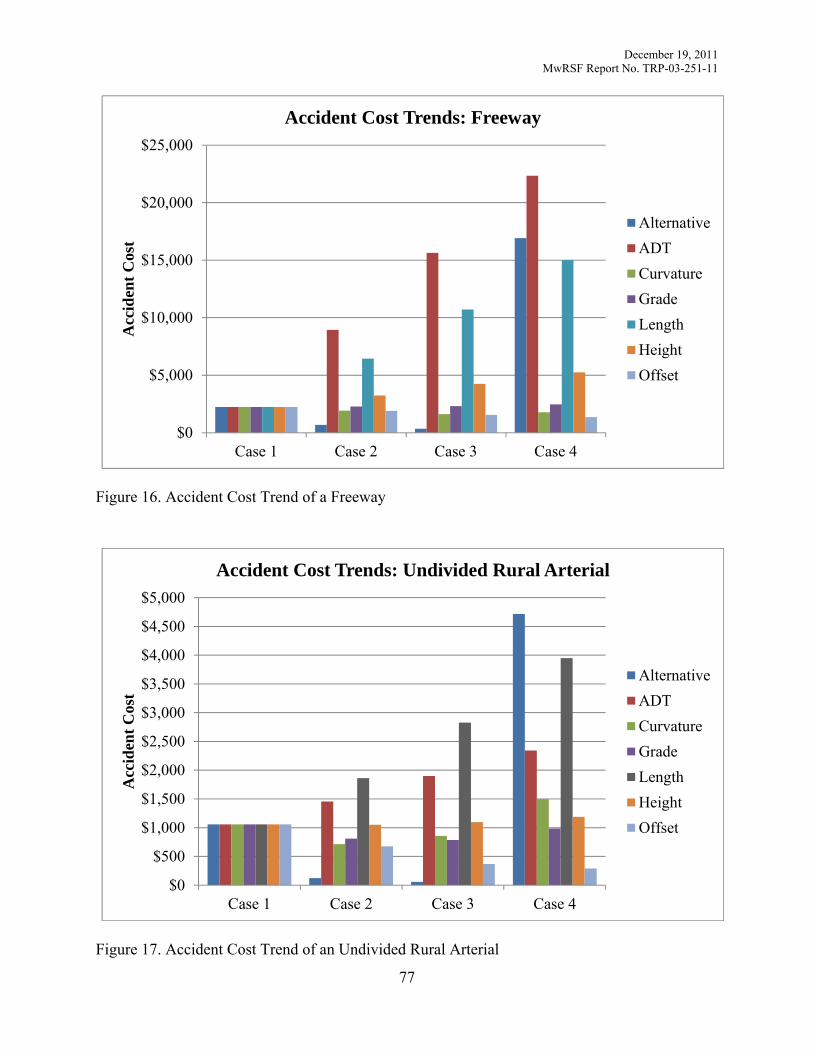
December 19, 2011 MwRSF Report No. TRP-03-251-11
77
Figure 16. Accident Cost Trend of a Freeway
Figure 17. Accident Cost Trend of an Undivided Rural Arterial
$0
$5,000
$10,000
$15,000
$20,000
$25,000
Case 1 Case 2 Case 3 Case 4
Acc
iden
t Cos
tAccident Cost Trends: Freeway
AlternativeADTCurvatureGradeLengthHeightOffset
$0
$500
$1,000
$1,500
$2,000
$2,500
$3,000
$3,500
$4,000
$4,500
$5,000
Case 1 Case 2 Case 3 Case 4
Acc
iden
t Cos
t
Accident Cost Trends: Undivided Rural Arterial
AlternativeADTCurvatureGradeLengthHeightOffset
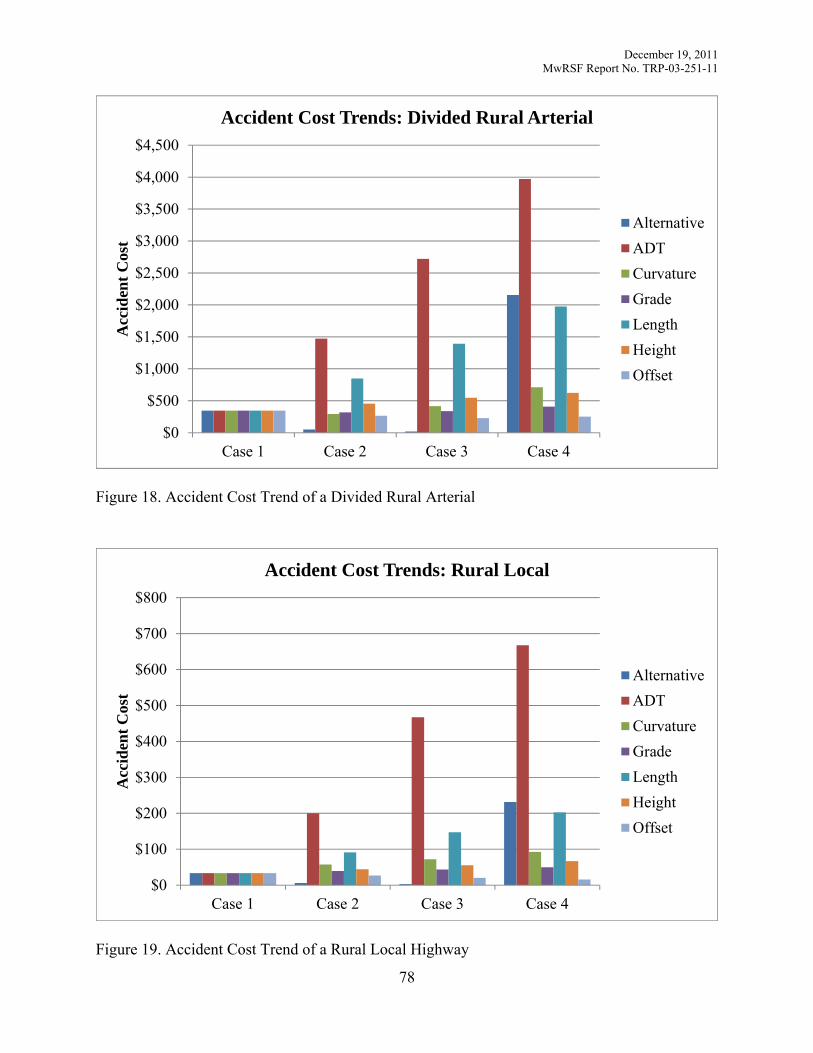
December 19, 2011 MwRSF Report No. TRP-03-251-11
78
Figure 18. Accident Cost Trend of a Divided Rural Arterial
Figure 19. Accident Cost Trend of a Rural Local Highway
$0
$500
$1,000
$1,500
$2,000
$2,500
$3,000
$3,500
$4,000
$4,500
Case 1 Case 2 Case 3 Case 4
Acc
iden
t Cos
tAccident Cost Trends: Divided Rural Arterial
AlternativeADTCurvatureGradeLengthHeightOffset
$0
$100
$200
$300
$400
$500
$600
$700
$800
Case 1 Case 2 Case 3 Case 4
Acc
iden
t Cos
t
Accident Cost Trends: Rural Local
AlternativeADTCurvatureGradeLengthHeightOffset
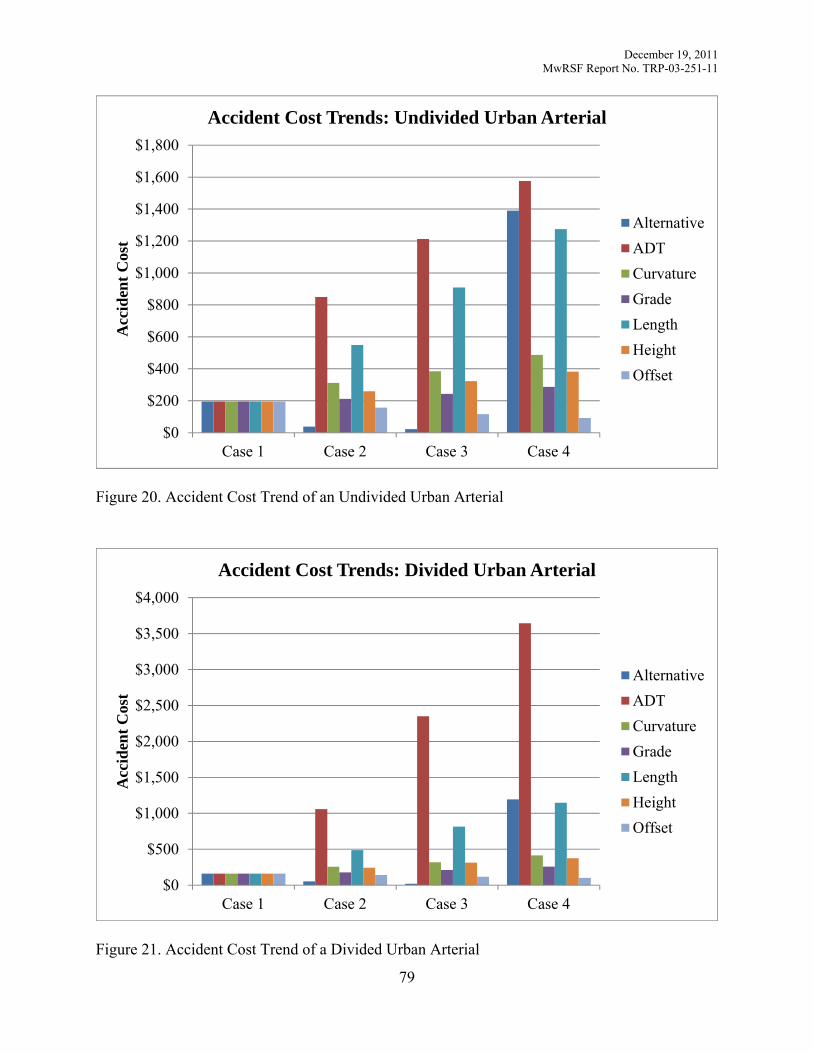
December 19, 2011 MwRSF Report No. TRP-03-251-11
79
Figure 20. Accident Cost Trend of an Undivided Urban Arterial
Figure 21. Accident Cost Trend of a Divided Urban Arterial
$0
$200
$400
$600
$800
$1,000
$1,200
$1,400
$1,600
$1,800
Case 1 Case 2 Case 3 Case 4
Acc
iden
t Cos
tAccident Cost Trends: Undivided Urban Arterial
AlternativeADTCurvatureGradeLengthHeightOffset
$0
$500
$1,000
$1,500
$2,000
$2,500
$3,000
$3,500
$4,000
Case 1 Case 2 Case 3 Case 4
Acc
iden
t Cos
t
Accident Cost Trends: Divided Urban Arterial
AlternativeADTCurvatureGradeLengthHeightOffset
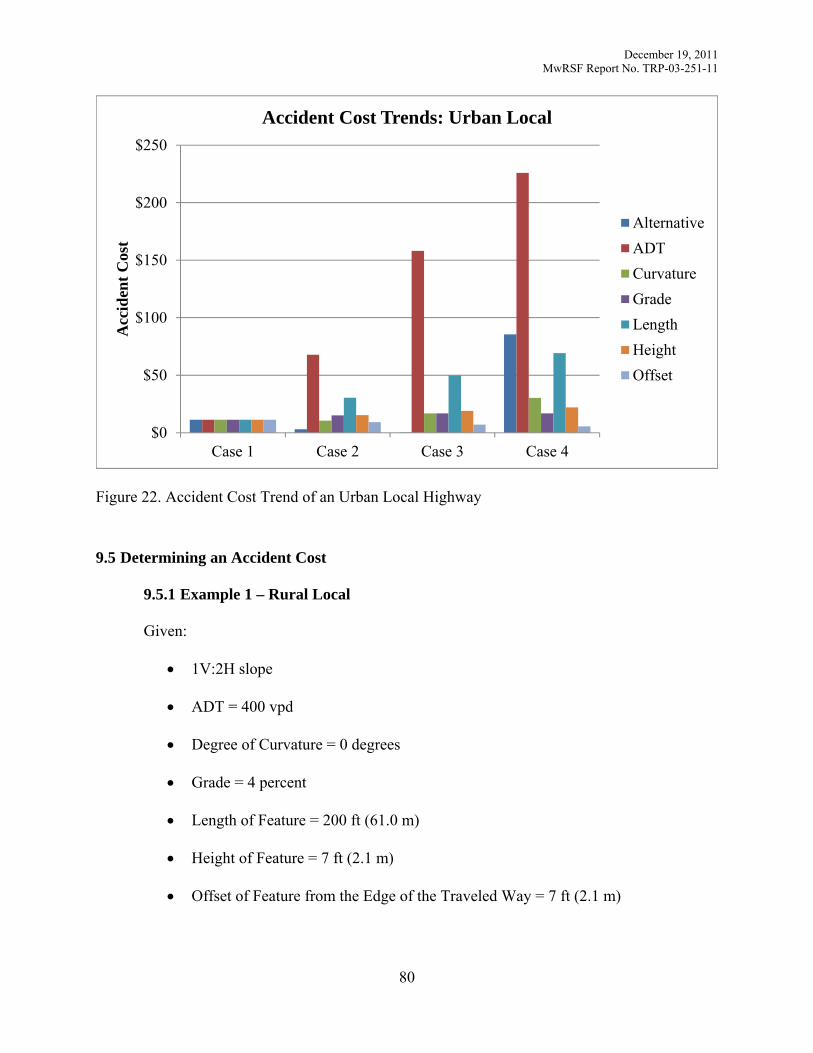
December 19, 2011 MwRSF Report No. TRP-03-251-11
80
Figure 22. Accident Cost Trend of an Urban Local Highway
9.5 Determining an Accident Cost
9.5.1 Example 1 – Rural Local
Given:
• 1V:2H slope
• ADT = 400 vpd
• Degree of Curvature = 0 degrees
• Grade = 4 percent
• Length of Feature = 200 ft (61.0 m)
• Height of Feature = 7 ft (2.1 m)
• Offset of Feature from the Edge of the Traveled Way = 7 ft (2.1 m)
$0
$50
$100
$150
$200
$250
Case 1 Case 2 Case 3 Case 4
Acc
iden
t Cos
tAccident Cost Trends: Urban Local
AlternativeADTCurvatureGradeLengthHeightOffset
December 19, 2011 MwRSF Report No. TRP-03-251-11
81
From Appendix E (1V:2H Slope, Rural Local Highway), b = 0.0000270 and the SI was
2.48. Using the coefficients given in Table 16, the cost per accident could be described by
Equation 22. The accident cost, AccCost, was given by Equation 24:
24.11 2.48 585.43 2.48 5288.84 2.48 27,552.00 2.48
56,462.19 2.48 40,438.19 2.48 0 $22,500.13
2.70 10 400 $22,500.13 $242.91
9.5.2 Example 2 – Freeway
Given:
• 1V:4H slope
• ADT = 63,000 vpd
• Degree of Curvature = 2 degrees
• Grade = 2 percent
• Length of Feature = 400 ft (121.9 m)
• Height of Feature = 6 ft (1.8 m)
• Offset of Feature from the Edge of the Traveled Way = 12 ft (3.7 m)
The height and the length of the feature cannot be directly read from the table. Therefore,
linear interpolation between 1 and 7 ft (0.3 and 2.1 m) was required for the height, and between
200 and 800 ft (61.0 and 243.8 m) for the length. To do this, Appendix P was used. First, the
accident cost for a 200-ft (61.0-m) feature at 1 ft (0.3 m) and 7 ft (2.1 m) heights was
determined. The b-coefficient of a 200-ft (61.0-m) long, 1-ft (0.3-m) high feature was 3.23x10⁻⁶
and the SI was 1.48. Using Equations 22 and 24, the accident cost was $830.26 per year. The b-
coefficient of a 200-ft (61.0-m) long, 7-ft (2.1-m) high feature was 5.02x10⁻⁶ and the SI was
December 19, 2011 MwRSF Report No. TRP-03-251-11
82
1.95. using Equations 22 and 24, the accident cost was $2,272.11 per year. Interpolating at 6 ft
(1.8 m) was done as follows:
6 17 1 $2,272.11 $830.26 $830.26 $2,031.80
Next, the process was repeated for an 800-ft (243.8-m) long feature at 1-ft (0.3-m) and 7-
ft (2.1-m) high. The corresponding b-coefficients were 2.02x10⁻⁵ and 2.58x10⁻⁵, respectively. In
addition, the respective SI values were 1.49 and 1.95. Using Equations 22 and 24, the accident
costs were $5,104.49 and $11,524.72. Interpolating at 6 ft (1.8 m) was done as follows:
6 17 1 $11,524.72 $5,104.49 $5,104.49 $10,454.68
Finally, the accident cost was determined by interpolating between the two preceding
accident costs at a length of 400 ft (121.9 m). The calculation was done as follows:
400 200800 200 $10,454.68 $2,031.80 $2,031.80 $4,839.43
9.5.3 Example 3 – Rural Arterial
Given:
• Divided
• 1V:3H slope
• ADT = 12,000 vpd
• Degree of Curvature = 0 degrees
• Grade = 6 percent
• Length of Feature = 800 ft (243.8 m)
• Height of Feature = 7 ft (2.1 m)
• Offset of Feature from the Edge of the Traveled Way = 2 ft (0.6 m)
December 19, 2011 MwRSF Report No. TRP-03-251-11
83
The accident cost was determined from Appendix K. From that appendix, b was 6.39x10-
5 and the SI was 2.16. No interpolation was required in this example. From Equations 22 and 24
the accident cost was $8,852.35.
9.5.4 Example 4 – Urban Local
Given:
• 1V:3H slope
• ADT = 300 vpd
• Degree of Curvature = 3 degrees
• Grade = 0 percent
• Length of Feature = 1400 ft (426.7 m)
• Height of Feature = 13 ft (4.0 m)
• Offset of Feature from the Edge of the Traveled Way = 2 ft (0.6 m)
The b-coefficient was taken from Appendix O. No interpolation was required in this
example; therefore, the coefficient was b = 2.27x10⁻⁴ and the SI was 2.51. From Equations 22
and 24 the accident cost was $1,631.02.
9.5.5 Example 5 – Urban Arterial Highway
Given:
• Undivided
• Guardrail System
• ADT = 12,000 vpd
• Degree of Curvature = 0 degrees
• Grade = 3 percent
• Length of Feature = 800 ft (243.8 m)
December 19, 2011 MwRSF Report No. TRP-03-251-11
84
• Height of Feature = 7 ft (2.1 m)
• Offset of Feature from the Edge of the Traveled Way = 7 ft (2.1 m)
The accident cost was determined from Appendix HH. No interpolation was required in
this example; therefore, the coefficient was b = 1.42x10⁻⁴ and the SI was 1.86. Using Equations
22 and 24, the accident cost was $10,049.08.
December 19, 2011 MwRSF Report No. TRP-03-251-11
85
10 BENEFIT-COST RATIOS
10.1 BC Ratios Defined
The incremental BC ratio compares one alternative to another. Theoretically, a BC ratio
of 1 means that the cost to install a new design is approximately the same as the accident costs
associated with the original design. It is usually recommended that a BC ratio of at least 1.5 be
used, but most state departments prefer nothing less than 2.0; therefore, the minimum BC ratio
that would suggest a beneficial design is 2.0. This ratio is obtained from the direct costs and
accident costs of each alternative (see Chapters 7 and 8). It is calculated using Equation 23 [3].
⁄ (23)
Where
⁄ Incremental BC ratio of Alternative 2 compared to Alternative 1
Annualized accident cost of Alternative 1
Annualized accident cost of Alternative 2
Annualized direct cost of Alternative 1
Annualized direct cost of Alternative 2
A BC matrix compares the cost-effectiveness of each alternative under review to all the
other alternatives, including the baseline alternative. A sample BC matrix is given in Figure 23.
In general, the alternatives were ordered from left to right and top to bottom based on the direct
costs, with the least expensive (“do nothing”) on the left and at the top. The last term in the top
row, Guardrail, represented the alternative requiring a TL-3 guardrail system be installed in front
of the existing slope. To interpret the results, the engineer can start reading the table in the lower
right corner. If this value was greater than 2.0, then Guardrail was better than 1V:6H. Then, if the
next value from the bottom in the last column is greater than 2.0, Guardrail was better than
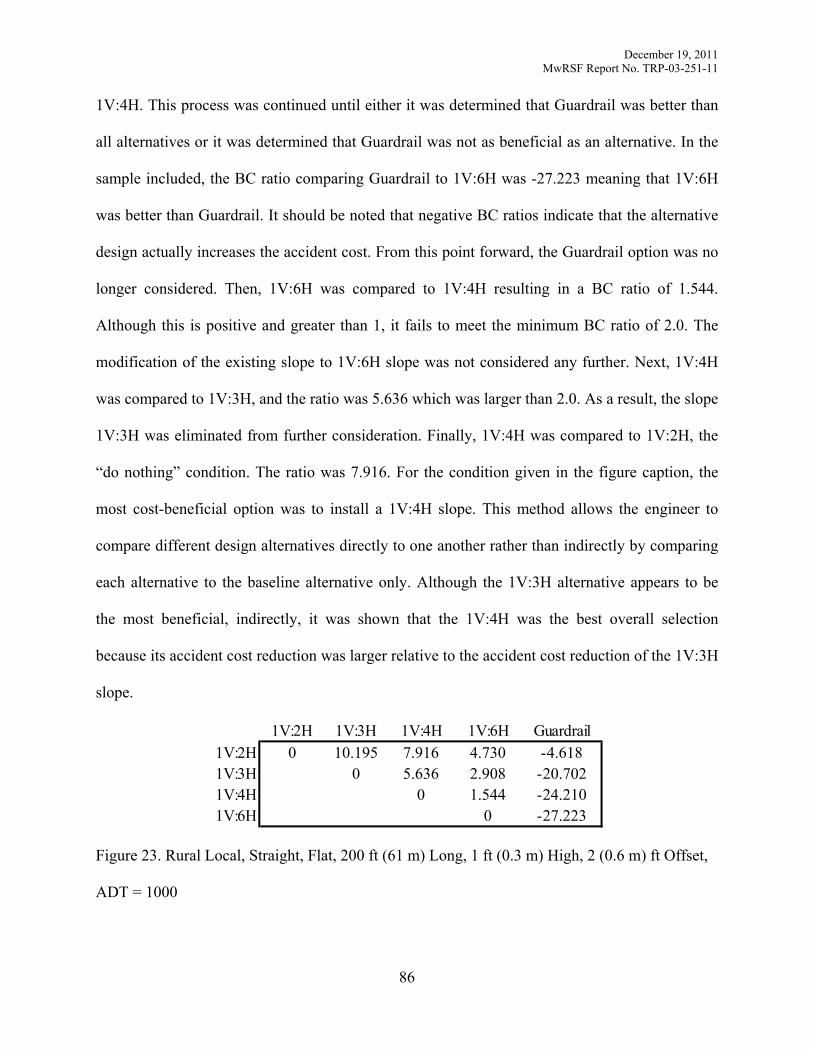
December 19, 2011 MwRSF Report No. TRP-03-251-11
86
1V:4H. This process was continued until either it was determined that Guardrail was better than
all alternatives or it was determined that Guardrail was not as beneficial as an alternative. In the
sample included, the BC ratio comparing Guardrail to 1V:6H was -27.223 meaning that 1V:6H
was better than Guardrail. It should be noted that negative BC ratios indicate that the alternative
design actually increases the accident cost. From this point forward, the Guardrail option was no
longer considered. Then, 1V:6H was compared to 1V:4H resulting in a BC ratio of 1.544.
Although this is positive and greater than 1, it fails to meet the minimum BC ratio of 2.0. The
modification of the existing slope to 1V:6H slope was not considered any further. Next, 1V:4H
was compared to 1V:3H, and the ratio was 5.636 which was larger than 2.0. As a result, the slope
1V:3H was eliminated from further consideration. Finally, 1V:4H was compared to 1V:2H, the
“do nothing” condition. The ratio was 7.916. For the condition given in the figure caption, the
most cost-beneficial option was to install a 1V:4H slope. This method allows the engineer to
compare different design alternatives directly to one another rather than indirectly by comparing
each alternative to the baseline alternative only. Although the 1V:3H alternative appears to be
the most beneficial, indirectly, it was shown that the 1V:4H was the best overall selection
because its accident cost reduction was larger relative to the accident cost reduction of the 1V:3H
slope.
Figure 23. Rural Local, Straight, Flat, 200 ft (61 m) Long, 1 ft (0.3 m) High, 2 (0.6 m) ft Offset,
ADT = 1000
1V:2H 1V:3H 1V:4H 1V:6H Guardrail1V:2H 0 10.195 7.916 4.730 -4.6181V:3H 0 5.636 2.908 -20.7021V:4H 0 1.544 -24.2101V:6H 0 -27.223
December 19, 2011 MwRSF Report No. TRP-03-251-11
87
Although the 1V:3H, 1V:4H, and the 1V:6H slope alternatives are all beneficial relative
to the baseline slope of 1V:2H, the best option is the 1V:4H as determined by interpreting the
full matrix. Whenever possible, as many alternatives as are feasible should be investigated and
compared using the results of this research and contractor bids on materials and labor for the
construction of the alternatives. This will ensure that the selected alternative provides the best
balance between safety performance and cost.
10.2 Example Calculation
Determine the most cost-beneficial design alternative from slope flattening options and a
guardrail option for a freeway with an existing slope of 1V:3H.
Given:
• Freeway
• Design Speed = 55 mph (88.5 km/h)
• Existing slope is a 1V:3H
• ADT = 65,000 vpd
• Degree of Curvature = 0 degrees
• Grade = 2 percent
• Length of Feature = 200 ft (61.0 m)
• Height of Feature = 13 ft (4.0 m)
• Offset of Feature from the Edge of the Traveled Way = 7 ft (2.1 m)
• Assume no additional clear zone is needed for ROW
• Minimum BC Ratio = 4.0
Solution:
December 19, 2011 MwRSF Report No. TRP-03-251-11
88
Determine the direct costs as per Chapter 7. Assume the cost per cubic yard of fill is $30,
and the cost of ROW is $5 per square foot. To conduct an accurate BC analysis, these values
would need to be determined for every scenario as the costs of fill and ROW vary across a wide
range. Assume the shrinkage factor for the volume of borrow soil is zero. Using Equation 14, the
required volume for slopes of 1V:4H and 1V:6H were estimated.
: 13 200 4 3
625.93
: 13 200 6 3
1,877.78
The ROW area was determined using the width of the baseline foreslope and the
alternative foreslope, which was a function of the slope and the height. The width was the height
multiplied by the slope, where the slope was defined by the horizontal component. For example,
the slope of a 1V:4H foreslope is 4. In this example, the height was 13 ft (2.1 m). Therefore, the
widths of the two alternatives were 52 and 78 ft (15.8 and 23.8 m). The width of the baseline
alternative was 39 ft (11.9 m). The net width of the required ROW was the difference between
the width of the alternative slope and the baseline slope. The area was then determined by
multiplying the net width by the length of the foreslope, or in this case, 200 ft (61.0 m).
The direct cost of each alternative was calculated using Equation 19. The resulting
volumes, square footages of ROW, and associated costs are given in Table 18. It should be noted
that the direct cost of the baseline slope was $0.00.
: · 148,777.78 · . ..
$9,521.78
: · 446,333.33 · . ..
$28,565.33
December 19, 2011 MwRSF Report No. TRP-03-251-11
89
Table 18. Direct Cost Calculations
Next, the accident costs associated with the given scenario for all three slopes must be
determined. For the 1V:3H slope, BCAFP calculates the accident cost to be $27,545.28. For the
1V:4H slope, BCAFP calculates the accident cost to be $20,171.21 For the 1V:6H slope, BCAFP
calculates the accident cost to be $2,579.61. The BC ratios were calculated using Equation 23.
⁄ . ..
3.63
⁄ . ..
4.09
⁄ . .. .
4.32
Next, the accident cost and direct cost of the Guardrail option was determined. The total
length of material of the guardrail can be estimated using the 2006 RDG or Section 8.2 of this
report. The total length would be approximately 550 feet (168 m) with two end terminals. The
value was arrived at by using Equations 17 and 18.
2 · 37.5 (17)
· ·· (18)
Where L1 was assumed to be 25 ft (7.6 m) and provided a buffer region between the end
of the tangent section of guardrail and the beginning of the foreslope. The length, l, was 200 ft
(61.0 m), or the length of the foreslope. The height of the foreslope (H) was 13 ft (4.0 m). The
slope of the foreslope (S) was 3. The flare rate, F, was the flare rate of the ends of the guardrail
Slope Volume Fill Cost ROW area ROW Cost Total Cost Direct Cost(1V:XH) (yard3) ($) (ft2) ($) ($) ($)1V:4H 625.93 18777.78 2600 13000 31777.78 2033.781V:6H 1877.78 56333.33 7800 39000 95333.33 6101.33
December 19, 2011 MwRSF Report No. TRP-03-251-11
90
and the terminal. This value was chosen from the RDG to be 24H:1V and was because the shy
line was 7.2 ft (2.2 m) for a 55-mph (88.5 km/h) design speed. This meant that the barrier would
be located within the shy line. For use in Equation 18, F was converted to a decimal and was
0.04167 (1/24). The offset distance to the face of the guardrail, L2, was 7 ft (2.1 m). Finally, the
runout length, LR, was determined by Table 5.8 in the 2006 RDG [2]. This value was 360 ft
(109.7 m). It should be noted that the slope is protected from both directions equally, providing a
conservative length-of-need.
13 · 3 25 · 0.04167
0.04167 13 · 3 7360
236.31
2 · 236.31 25 37.5 200 547.61 550
The cost per foot of guardrail was $15 per foot while the cost per terminal was $2,000
[30]. The total installation cost would be $12,250 but the direct cost (assuming 4 percent interest
and 25-year design life) would be $784.00 per year. For a guardrail system, BCAFP calculates
the accident cost to be $781.86. This value includes the length-of-need of 550 ft (167.6 m) for
the 200-ft (60.1 m) feature length; therefore, the accident cost is $118,499.43 per year.
⁄27545.28 118499.43
781.86 116.33
Therefore, even though the installation cost of the Guardrail option was greatly reduced,
the accident cost was higher than the original unprotected slope. This caused the BC ratio to be
negative. In addition, the 1V:4H and 1V:6H slopes had large BC ratios compared to the
Guardrail option, making any one of the slope flattening options more cost-effective than the
Guardrail option, in this example. The engineer would be justified in recommending that the
existing slope be flattened to 1V:6H. This recommendation is illustrated by the tabulated BC
ratios shown in Figure 24. This figure was taken directly from BCAFP, in which a fifth
December 19, 2011 MwRSF Report No. TRP-03-251-11
91
alternative, “None,” is a placeholder in the event that a fifth alternative is used. Because the
1V:6H to 1V:4H ratio is 8.71, the 1V:4H slope would be dropped from further consideration.
Then, because the 1V:6H to Guardrail ratio is 26.98, the Guardrail option would also be dropped
from further consideration. Finally, because the 1V:6H to 1V:3H (baseline) ratio is 4.92, the
1V:6H slope would be recommended (i.e., BC ≥ 4.0).
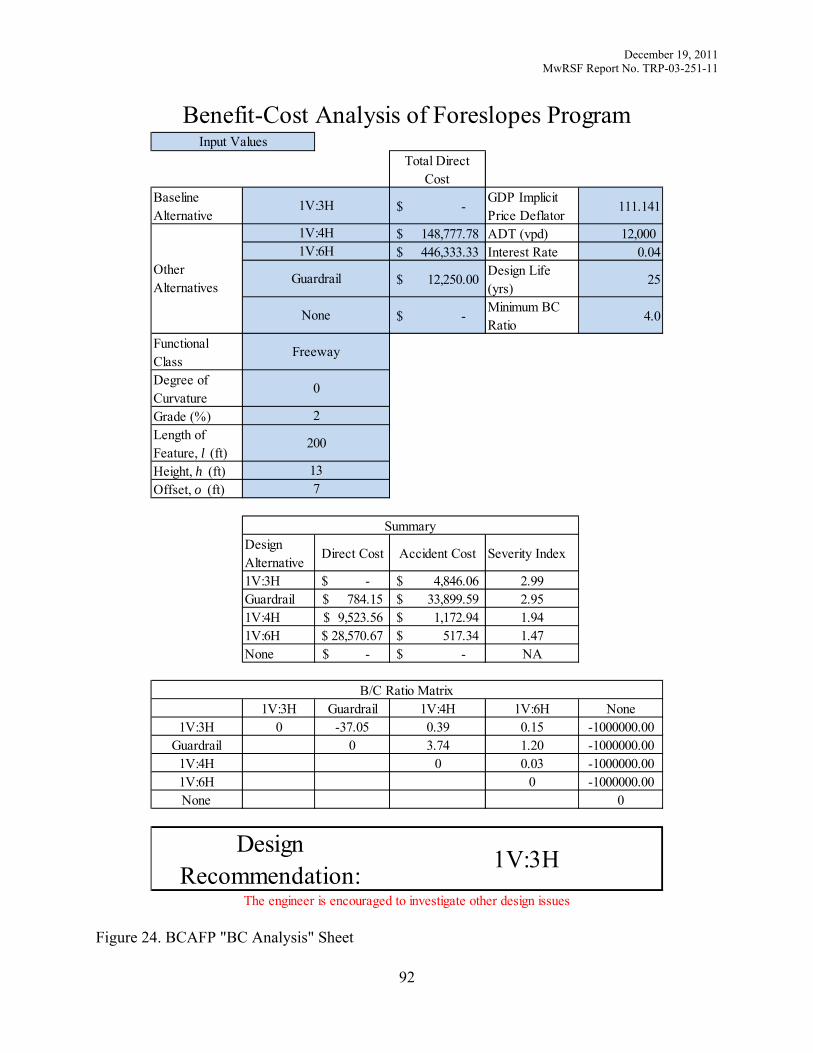
December 19, 2011 MwRSF Report No. TRP-03-251-11
92
Figure 24. BCAFP "BC Analysis" Sheet
Total Direct Cost
Baseline Alternative
-$ GDP Implicit Price Deflator
111.141
148,777.78$ ADT (vpd) 12,000 446,333.33$ Interest Rate 0.04
12,250.00$ Design Life (yrs)
25
-$ Minimum BC Ratio
4.0
Functional ClassDegree of CurvatureGrade (%)Length of Feature, l (ft)Height, h (ft)Offset, o (ft)
Design Alternative
Direct Cost Accident Cost Severity Index
1V:3H -$ 4,846.06$ 2.99Guardrail 784.15$ 33,899.59$ 2.951V:4H 9,523.56$ 1,172.94$ 1.941V:6H 28,570.67$ 517.34$ 1.47None -$ -$ NA
1V:3H Guardrail 1V:4H 1V:6H None1V:3H 0 -37.05 0.39 0.15 -1000000.00
Guardrail 0 3.74 1.20 -1000000.001V:4H 0 0.03 -1000000.001V:6H 0 -1000000.00None 0
Benefit-Cost Analysis of Foreslopes Program
Design Recommendation:
The engineer is encouraged to investigate other design issues
Summary
B/C Ratio Matrix
Input Values
7
1V:3H
13
200
2
0
Other Alternatives
Freeway
None
Guardrail
1V:6H1V:4H
1V:3H
December 19, 2011 MwRSF Report No. TRP-03-251-11
93
11 SUMMARY, CONCLUSIONS, AND RECOMMENDATIONS
11.1 Summary
Based on accident data collected in 2000 in the State of Ohio, the severity indices on
selected foreslopes were estimated, by associating the number of (K+A) accidents with the total
mileage for each slope-height combination. In each combination, the severity index was reduced,
relative to Wolford and Sicking’s results and the default results in RSAP (version 2003.04.01).
This was shown graphically for an embankment height of 7 ft (2.1 m) in Figures 7 and 8. This
reduction was expected based on comments made in the RSAP Engineer’s Manual that stated
severity indices were likely biased towards higher-speed impacts.
Once the new severity indices for foreslopes were determined, they were implemented
into RSAP and used in the simulation of the extensive test matrix. Each scenario in the test
matrix was repeated for several traffic volumes. For each scenario and traffic volume, RSAP
estimated an accident cost. From these accident costs, equations were developed to determine
linear relationships between the traffic volumes and the accident costs. These equations were
described by a series of coefficients and were in the slope-intercept form. For each scenario,
these coefficients are presented in the attached appendices. Based on the functional class and the
traffic volume, an applicable equation could be chosen from Section 9.2. With the coefficients
and the traffic volume, the accident cost for any scenario can be calculated. In addition, a
Microsoft Excel program known as BCAFP was developed to automatically lookup those
coefficients and interpolate or extrapolate when needed. This program greatly reduced the time
and effort needed to determine the accident costs and BC ratios, and it removed the possibility of
human error in both looking up values and in making calculation mistakes during interpolation or
extrapolation.
December 19, 2011 MwRSF Report No. TRP-03-251-11
94
Finally, the benefit-cost application of these accident costs was described. The difference
in accident costs between two competing alternatives represents the numerator of the BC ratio,
which can be used to justify the use of one design alternative over another. In order to
successfully complete the benefit-cost analysis, the engineer must ascertain the material costs of
each alternative under consideration in order to construct the denominator of the BC ratio. An
example of this process was given in Section 10.2.
11.2 Conclusions
Severity indices used in the default version of RSAP were overestimated. This research
has presented new severity indices and used them to determined accident costs on an array of
different foreslopes. Once the results of the RSAP analysis were available, trends appeared in
each of the parameters and for each of the functional classes. Flattening the slope and increasing
the offset decreased the accident costs for all functional classes. Likewise, increasing the traffic
volume and length of the feature increased the accident costs for all functional classes. The
degree of curvature and the percent grade caused initial decreases in accident costs (however
slight they were), but then increased accident costs as those parameters continued to increase. As
the height of the feature increased, the accident cost tended to increase as well. However, this
increase was not as significant as the increase caused by the traffic volume and the length of the
feature. Finally, and of most importance, slope flattening dramatically reduced accident costs. On
short embankment heights, the largest decrease in accident costs on adjacent slopes occurred
when a 1V:3H foreslope was flattened to a 1V:4H foreslope, which reduced the accident cost by
approximately 80 percent, but when the slope was flattened from a 1V:4H foreslope to a 1V:6H
foreslope, the reduction was approximately 50 percent. On medium and tall heights, that trend
was exactly reversed. Therefore, the increased severity on steep, tall embankments may warrant
slope flattening beyond 1V:4H. Additionally, no matter what functional class was considered,
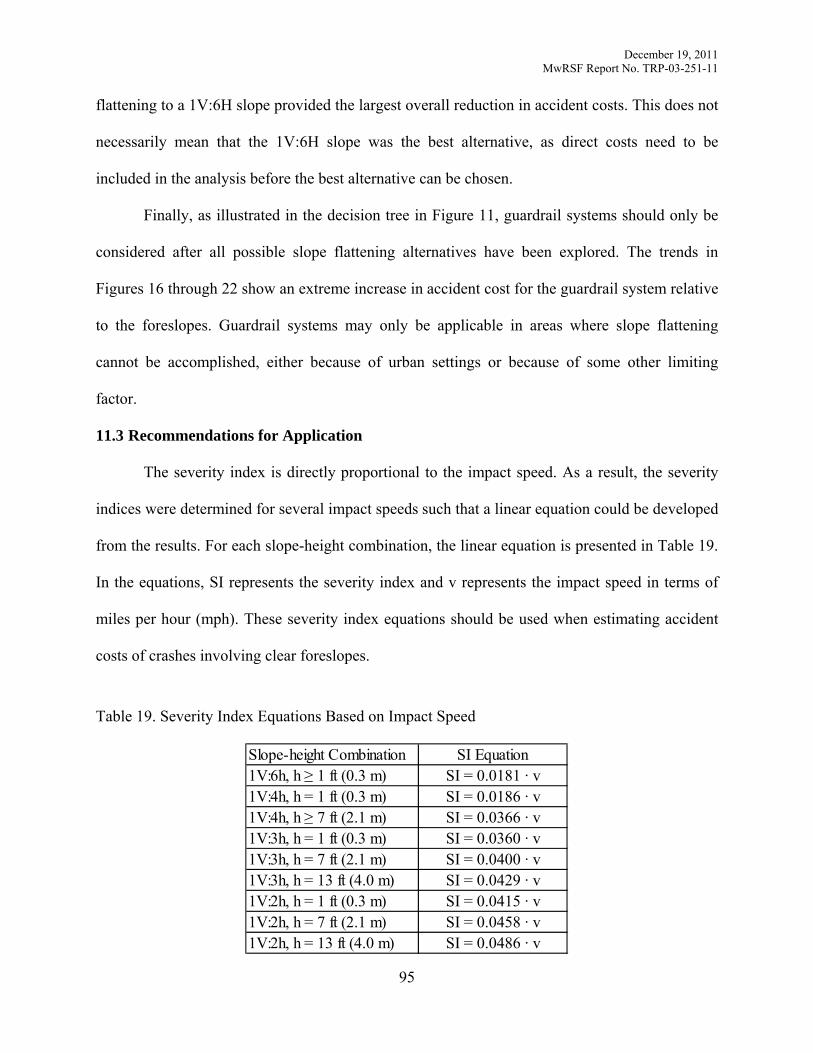
December 19, 2011 MwRSF Report No. TRP-03-251-11
95
flattening to a 1V:6H slope provided the largest overall reduction in accident costs. This does not
necessarily mean that the 1V:6H slope was the best alternative, as direct costs need to be
included in the analysis before the best alternative can be chosen.
Finally, as illustrated in the decision tree in Figure 11, guardrail systems should only be
considered after all possible slope flattening alternatives have been explored. The trends in
Figures 16 through 22 show an extreme increase in accident cost for the guardrail system relative
to the foreslopes. Guardrail systems may only be applicable in areas where slope flattening
cannot be accomplished, either because of urban settings or because of some other limiting
factor.
11.3 Recommendations for Application
The severity index is directly proportional to the impact speed. As a result, the severity
indices were determined for several impact speeds such that a linear equation could be developed
from the results. For each slope-height combination, the linear equation is presented in Table 19.
In the equations, SI represents the severity index and v represents the impact speed in terms of
miles per hour (mph). These severity index equations should be used when estimating accident
costs of crashes involving clear foreslopes.
Table 19. Severity Index Equations Based on Impact Speed
Slope-height Combination SI Equation1V:6h, h ≥ 1 ft (0.3 m) SI = 0.0181 · v1V:4h, h = 1 ft (0.3 m) SI = 0.0186 · v1V:4h, h ≥ 7 ft (2.1 m) SI = 0.0366 · v1V:3h, h = 1 ft (0.3 m) SI = 0.0360 · v1V:3h, h = 7 ft (2.1 m) SI = 0.0400 · v1V:3h, h = 13 ft (4.0 m) SI = 0.0429 · v1V:2h, h = 1 ft (0.3 m) SI = 0.0415 · v1V:2h, h = 7 ft (2.1 m) SI = 0.0458 · v1V:2h, h = 13 ft (4.0 m) SI = 0.0486 · v
December 19, 2011 MwRSF Report No. TRP-03-251-11
96
11.4 Recommendations for Future Work
There is significant room for improvement beyond this research. A larger sample size
would provide more consistent results for both the 1V:6H slope and the tall heights for all slopes.
It would also lend more credibility to the results of the remaining slopes and heights. In addition,
traffic volumes could be included in the analysis to negate the influence of increased exposure on
some highways. With larger volumes, the number of (K+A) accidents would increase over the
same length of highway, which in turn would increase the average severity. The same procedure
outlined in this research would be used on slope-height-volume combinations. Each volume
would then be normalized about some constant traffic volume, which could be programmed into
RSAP. The final result would give the number of (K+A) accidents per mile per unit of traffic
volume.
A more detailed investigation into the effects of barrier warrants on the number of (K+A)
accidents for steep, tall embankments needs to be conducted. The work completed in this study
was partially based on an extrapolation done to estimate the number of (K+A) accidents on tall
embankments, especially for the 1V:2H foreslope. If barrier warrants investigation can
successfully estimate the number of miles of unprotected, steep, tall embankments, then the
number of (K+A) accidents per mile of that foreslope would actually be indicative of the
severity.
Additionally, the current version of RSAP assumes a straight-line encroachment path. As
a result, the driver behavior is not considered. Drivers are more likely to attempt a corrective
maneuver when the vehicle is encroaching on a foreslope than they are to continue in a straight
line. This corrective maneuver would increase the propensity for rollover; however, RSAP does
not incorporate rollover into the calculation of the average severity index of a foreslope. It was
assumed that the effect of rollover on the average accident cost was offset by increasing the SI,

December 19, 2011 MwRSF Report No. TRP-03-251-11
97
but this increase was not based on any data pertaining to accident costs of rollovers, but rather
engineering judgment. RSAP is currently being updated under NCHRP Project No. 22-27 and
will include curvi-linear encroachment paths [16]. Once this update is complete, the number of
(K+A) accidents can be recalibrated against the accident data to estimate severity indices that are
based on encroachments follow more natural paths.
December 19, 2011 MwRSF Report No. TRP-03-251-11
98
12 LIMITATIONS
12.1 Severity Index Updates
Results of this analysis were highly dependent on the severity index used to estimate the
accident cost of each scenario. Therefore, part of this study focused on developing more accurate
severity indices on foreslopes. This part provided the major limitations to this study.
The number of (K+A) accidents can be significantly influenced by the traffic volume.
The average severity is determined only after all possible scenarios have been simulated. That is,
the damage caused by the severe accidents was divided by the total number of impacts to
calculate an average severity for all impacts. If the traffic volume increases, the probability of
severe accidents increases, which ultimately would increase the severity index. This is because
the severity index is non-linear with its associated societal costs. The more severe accidents have
a larger influence than the less severe accidents. Even if the difference in the number of severe
and non-severe accidents does not change, the severity index will either increase or decrease,
depending on how the traffic volume changes. However, this could not be accounted for in this
project because the traffic volume at the accident locations and at the random sample locations
was unknown. If the traffic volume was known over the entire highway network (e.g., at every
100-ft or 30.5-m interval), then slope-height-volume combinations could be constructed and the
mileage for each one could be determined. As before, the number of (K+A) accidents would be
counted for each combination. The results would then be normalized with respect to a unit of
traffic volume, say 10,000 vehicles per day. This traffic volume would be entered into RSAP
much in the same way as the length of the feature was entered (recall the length was set to 1 mile
so that the number of (K+A) accidents was already given in a per-mile format).
Another limitation to this work is the small sample size used to develop the new severity
indices. Only 1,296 accidents were analyzed, which was small compared to Wolford and
December 19, 2011 MwRSF Report No. TRP-03-251-11
99
Sicking’s work, which included more than 20,000 accidents. In addition, only one year was used
in the data collection. It was the first year of data supplied by Ohio. In addition to that year
(2000), data for every year through 2006 was supplied, but time restraints prevented the
complete analysis of all this data. The number of accidents from the year 2000 was significantly
smaller than in each subsequent year. This may be due to a new data entry system or some
change in policy regarding accident reports, however, this is not known.
A limitation related to the small sample size was in the determination of the expected
number of (K+A) accidents on a 1V:6H slope. No severe accidents occurred on heights less than
13 ft (4.0 m). Because the expected number of severe accidents for the other slopes was
determined by the short and medium heights, the number of expected severe accidents on a
1V:6H slope was set to zero. However, severe accidents occurred on 1V:6H slopes, according to
the actual accident data. As a result, the SI values of this slope should be higher than what are
presented in this research. With the addition of more data, this conclusion should be supported
and this limitation should be eliminated.
Impact speed also plays a pivotal role in the determination of the SI value for a given
roadside feature. However, the accident data set could not include exact impact speeds. Only
estimations were given and were most likely based on human judgment. The average impact
speed from the accident data was 53.9 mph (86.7 km/h). Based on research done at the Midwest
Roadside Safety Facility, the average impact speed on a U.S. and State Route is approximately
39 mph (62.8 km/h) [34]. As a result, the impact velocities given in the accident data were too
high and unusable. If actual impact speeds were known, the relationship between the impact
speed and the SI could be checked. Initially, this relationship was assumed to be linear.
However, there may be reason to suspect that this relationship is more parabolic, considering the
December 19, 2011 MwRSF Report No. TRP-03-251-11
100
relationship between kinetic energy and velocity, which is commonly used to describe severities
of impacts with barriers.
12.2 RSAP Programming For the Current Version (2003.04.01)
12.2.1 Conceptual Limitations
Encroachment paths are assumed to be linear in the current version of RSAP. This
disallows the possibility of overcorrection as the motorists reacts to the unexpected
encroachment. An overcorrection could potentially increase the rate of rollover on foreslopes
substantially, which in turn, would increase severity indices. Work is being conducted on a new
version of RSAP that uses set vehicular encroachment paths, which include curved paths, as
opposed to straight-line paths whose angles are determined by Monte Carlo simulation [16]. This
may increase the accuracy associated with foreslopes as they are related to rollover incidents.
RSAP currently employs a rollover prediction algorithm that is applied to fixed objects only.
However, as much as 86 percent of all rollovers occur on roadside features that do not include
fixed objects [15]. Instead, RSAP attempts to account for these rollovers by increasing severity
indices for the associated feature, such as a foreslope [3].
RSAP uses speed distributions for various functional classes that were based on a study
completed before the national speed limit was lifted [33]. In order to predict encroachment
speeds indicative of today’s traffic, a new study should be undertaken following the same
procedures used by Mak, Sicking, and Ross to determine speed distributions without the
influence of the national speed limit.
Cross-median crashes are not simulated explicitly. This approach may have a profound
effect on the results of a BC analysis because these crashes are typically severe. If a vehicle has
encroached that far, a possible reason may be that the driver is already unconscious (for
example). In this event, the impact speed and angle may also be severe. Striking a fixed object
December 19, 2011 MwRSF Report No. TRP-03-251-11
101
under these conditions could be worse than a typical impact with a fixed object, provided the
driver has time to break in the latter event before striking the object. Head-on collisions are also
completely ignored because RSAP assumes one vehicle at a time per simulation. Obviously, the
benefit of a median barrier would be greatly underestimated if one of these head-on collisions
were possible.
Finally, access density is not considered in RSAP. These access points would include on
and off ramps on interstates. These locations experience the greatest crash frequency. This
increased frequency is in part due to the changes in driver interactions, as vehicles are added to
or removed from the roadway (recall that only one vehicle is simulated).
12.2.2 Cooper Data
Cooper used a statistical design that was dependent on the outcome. In other words, bias
was introduced into the data set. This had the tendency to inflate extreme events (e.g., high and
low encroachment rates were made higher and lower). However, the extent of this bias was and
remains unknown.
The results of Cooper’s data showed a similar relationship between ADT and
encroachment frequency as Hutchinson and Kennedy’s data showed. However, the latter study’s
encroachment rate was shown to be influenced by seasonal effects more than the traffic volume
[13]. This reanalysis of the classic study had not been performed on the Cooper data yet but
needs to be done to determine if traffic volume alone can be used to describe the encroachment
frequency.
The data was collected in the late 1970s. Technological and mathematical break throughs
had not yet been achieved that would have allowed the author to collect and analyze the data in a
better way. With a wider network of traffic cameras, perhaps more encroachment data could
have been taken. At the time of the report, Cooper’s statistical approach was based on the
December 19, 2011 MwRSF Report No. TRP-03-251-11
102
relatively new concept of clustering. It was this approach that ultimately led to the bias
previously mentioned. Today’s clustering approach is used in studies like the Census, in which
statistical tools have been developed that can handle clustered data.
No distinction was made in the data set between controlled and uncontrolled
encroachments. This distinction could not be made either because the intent of the driver was
impossible to determine. Controlled encroachments could include pulling over to switch drivers,
among many other possibilities. Attempts have been made to estimate the number of controlled
verses uncontrolled accidents for various roadside features, but applying this ratio to the Cooper
data, as RSAP does, needs investigated further. Unfortunately, due to the enormous cost that
would be associated with a study to ascertain the intent behind each encroachment, the current
practice utilized by RSAP had to be sufficient.
Finally, the small sample size of the Cooper data was a concern. The intent of that study
was to increase the sample size by creating smaller segments of the highway. However, this also
reduced the number of encroachments per segment, which statistically did nothing to improve
the results of the analysis. Only when additional segments are studied and/or the time included in
the data collection is extended will the sample size be increased, which can only lend stability to
the statistical results.
12.2.3 Discrepancies, Bugs, and Errors
Since the completion of the RSAP code, several problems have been discovered. Because
the code is very large, it remains possible that more problems exist. Currently known problems
include discrepancies between what is coded and what is mentioned in the Engineer’s Manual,
bugs, and errors. Bugs are caused by programming errors relative to the language used. Errors
are mistakes in the code that lead to incorrect results. All three of these problems have been
found in the current code. In an ongoing project intended to update RSAP, Dr. Malcolm Ray and
December 19, 2011 MwRSF Report No. TRP-03-251-11
103
his research team have discovered many of these errors. They are outlined in the draft report of
that project (NCHRP Project No. 22-27) [16]. The problems are only listed here. For a more
detailed description of the problems, see the draft report of NCHRP Project No. 22-27.
12.2.3.1 Discrepancies
• Base encroachment rates for two-lane undivided and multi-lane divided highways
do not have the same adjustment factor in the code as are presented in the
Engineer’s Manual.
• Lane encroachment rates are equal for all lanes despite unequal traffic volume
distributions, which should indicate differing encroachment rates as demonstrated
by the Cooper data.
• The probability of the lateral extent of encroachment uses a cubic function instead
of the correct exponential function. As a result, the probability may be negative
for extents greater than 72 ft (22 m). These negative probabilities are then forced
to zero; however, the exponential function would indicate a positive probability.
• The traffic growth factor in the code increases the ADT each year and adjusts the
encroachment frequency accordingly. The Engineer’s Manual says it increases in
only one increment, at the time of the design life. In this discrepancy alone, the
code appears to be more accurate than the Engineer’s Manual.
12.2.3.2 Bugs or Errors
• Base encroachment rates are not reduced to 60 percent for the effect of unreported
accidents on two-lane undivided and one-way highways.
• The traffic growth factor is divided by 100 to get a decimal form of the
percentage. It is then divided by 100 again by mistake when determining the
encroachment frequency.
December 19, 2011 MwRSF Report No. TRP-03-251-11
104
• Highway types are distinguished between undivided, divided, and one-way
highways; however, RSAP appears to change how these categories are referenced.
It is possible that the highway type is incorrectly chosen.
• Curvature adjustments in the vehicle swath equations convert the degrees to a
radius in units of 100-ft (30.5-m) stations; however, that radius is used as if it
were in units of 328-ft (100-m) stations. This problem is only applicable to the
user interface. If the radius of curvature is specified in the data files, the
conversion from radius to degree is correct. The original code was in U.S. units
but was converted to SI units. Due to the large size of the code, it is possible that
more unit conversion errors exist.
• Lane encroachment rates are approximately half of what they should be for two-
lane undivided highways.
December 19, 2011 MwRSF Report No. TRP-03-251-11
105
13 NOTATION
*All notations are given in alphabetical order.
#(K+A) = Number of fatal and severe injury accidents 1V:XH = Slope designation describing a foreslope AX = Area of the cross-section of the new slope A = Severe injury accident AC = Annualized accident cost AccCost = Accident cost ADT = Traffic volume in vehicles per day (vpd) AI = Area of the cross-section of the minimum slope AII = Area of the cross-section of the new minus the original slope B = Moderate injury accident b = Slope of the equation to determine AccCost BC2-1 = Incremental benefit/cost ratio of alternative 2 compared to alternative 1 b1 = Base of the cross-sectional area of the minimum slope b2 = Base of the cross-sectional area of the new slope C = Slight injury accident DC = Annualized direct cost F = Flare rate of the guardrail h = Height of the foreslope H = Horizontal component of the foreslope i = Interest rate K = Fatal accident l = Length of the foreslope L = Total length of guardrail required L1 = Buffer length of guardrail = 25 ft (7.6 m) L2 = Offset of the guardrail LR = Runout length n = Design life O = Property damage only (PDO) accident P = Principal investment required for construction S = Horizontal component of the foreslope designation (S = X in the form 1V:XH) SI = Severity index t = Time between Consumer Price Index readings v = Impact speed in terms of miles per hour V = Vertical component of the foreslope Vborrow = Volume of borrowed soil required to meet Vfill demand Vfill = Volume of fill required to flatten the slope
December 19, 2011 MwRSF Report No. TRP-03-251-11
106
x = Length of guardrail required beyond the 25-ft (7.6-m) buffer XI = Slope of the baseline foreslope (1V:XIH) XII = Slope of the baseline foreslope (1V:XIIH) φ2 = Accident rate equation for 1V:2H slopes φ3 = Accident rate equation for 1V:3H slopes φ4 = Accident rate equation for 1V:4H slopes
= Average dry unit weight of borrow soil = Average dry unit weight of fill soil
∆ = Shrinkage factor applied to borrow soil
December 19, 2011 MwRSF Report No. TRP-03-251-11
107
14 REFERENCES
1. Weaver, G.D., Post, E.R., and French, D.D., “Cost-Effectiveness Program for Roadside Safety Improvements on Texas Highways – Volume 2: Computer Program Documentation Manual,” Research Report 15-1, Texas Transportation Institute and Texas Highway Department, February, 1975.
2. Roadside Design Guide, American Association of State Highway and Transportation Officials (AASHTO), Washington, D.C., 2006.
3. Mak, K.K. and Sicking, D.L., Roadside Safety Analysis Program (RSAP) Engineer’s Manual, National Cooperative Highway Research Program (NCHRP) Report 492, Transportation Research Board, Washington, D.C., 2003.
4. Traffic Safety Facts 2008, National Highway Traffic Safety Administration (NHTSA), 2008.
5. Fatal Accident Reporting System (FARS), National Highway Traffic Safety Administration (NHTSA), 2009.
6. Traffic Safety Facts 2009 Early Edition, National Highway Traffic Safety Administration (NHTSA), 2009.
7. Park, S.K. and Miller, K.W., Random Number Generators: Good Ones Are Hard to Find, Communications of the ACM, Vol. 31, No. 10, Association for Computing Machinery, New York, October 1988.
8. Schage, L., A More Portable FORTRAN Random Number Generator, ACM Transactions on Mathematical Software, Vol. 5, No. 6, Association for Computing Machinery, New York, June 1979.
9. L’Ecuyer, P., Efficient and Portable Combined Random Number Generators, Communications of the ACM, Vol. 31, No. 6, Association for Computing Machinery, New York, June 1988.
10. Cooper, P., Analysis of Roadside Encroachments -- Single Vehicle Run-off-Road Accident Data Analysis for Five Provinces, B. C. Research, Vancouver, British Columbia, Canada, March 1980.
11. Moskowitz, K. and Schaefer, W.E., Barrier Report, California Highways and Public Works, Vol. 40, Nos. 9-10, Sept.-Oct. 1961.
12. Hutchinson, J.W. and Kennedy, T.W., Medians of Divided Highways – Frequency and Nature of Vehicle Encroachments, Engineering Experiment Station Bulletin 487, University of Illinois, 1966.
December 19, 2011 MwRSF Report No. TRP-03-251-11
108
13. Davis, G.A. and Morris, P.M., Reanalysis of Hutchinson and Kennedy’s Encroachment Frequency Data, Transportations Research Record No. 1953, Transportation Research Board, Washington, D.C., 2006.
14. Miaou, S-P., Estimating Vehicle Roadside Encroachment Frequency Using Accident Prediction Models, Transportation Research Board, Washington, D.C., 1997.
15. Miaou, S-P., Rollover Causation and Mitigation Study: Phase I Report, Prepared for the Federal Highway Administration, 2004.
16. Ray, M.H., Miaou, S-P., and Conron, C.E., Roadside Safety Analysis Program (RSAP) Update, Draft Interim Report, NCHRP Project No. 22-27, Washington, D.C., October 2009.
17. Zegeer, C.V., Hummer, J., Reinfurt, D., Herf, L., and Hunter, W., Safety Effects of Cross-Section Design for Two-Lane Roads, Transportation Research Record No. 1195, Transportation Research Board, Washington, D.C., 1988.
18. Harkey, D.L., Raghavan, S., Jongdea, B., Council, F.M., Eccles, K., Lefler, N., Gross, F., Persaud, B., Lyon, C., Hauer, E., and Bonneson, J., NCHRP Report No. 617: Crash Reduction Factors for Traffic Engineering and ITS Improvements, Transportation Research Board, Washington, D.C., 2008.
19. Highway Safety Manual, Volume 3, American Association of State Highway Transportation Officials (AASHTO), Washington, D.C., 2010.
20. Glennon, J.C., Roadside Safety Improvement Programs on Freeways – A Cost-Effectiveness Priority Approach, NCHRP Report No. 148, Transportation Research Board, Washington, D.C., 1974.
21. Glennon, J.C. and Tamburri, T.N., Objective Criteria for Guardrail Installation, Highway Research Record No. 174, Highway Research Board, National Academy of Sciences, Washington, D.C., 1967.
22. Zegeer, C.V. and Parker, M.R., Cost-Effectiveness of Countermeasures for Utility Pole Accidents, Federal Highway Administration Report No. FHWA-RD-83-063, Washington, D.C., 1983.
23. McFarland, W.F. and Rollins, J.B., Accident Costs and Severity Indices for Roadside Objects, Presented at the 64th Annual Meeting of the Transportation Research Board, Washington, D.C., January 1985.
24. Brogan, J.D. and Hall, J.W., Using Accident Records to Prioritize Roadside Obstacle Improvements in New Mexico, Transportation Research Record No. 1047, Transportation Research Board, Washington, D.C., 1985.
25. Mak, K.K., Ross, H.E., Buth, C.E., and Griffin, L.I., Severity Measures for Roadside Objects and Features, Federal Highway Administration Research Project
December 19, 2011 MwRSF Report No. TRP-03-251-11
109
Final Report, U.S. Department of Transportation, Washington, D.C., February 1985.
26. Roadside Design Guide, American Association of State Highway and Transportation Officials (AASHTO), Washington, D.C., 1996.
27. Wolford, D. and Sicking, D.L., Guardrail Need Embankments and Culverts, Transportation Research Record No. 1599, Transportation Research Board, Washington, D.C., 1997.
28. Mak, K.K. and Sicking, D.L., Roadside Safety Analysis Program (RSAP) User’s Manual, NCHRP Project No. 22-9, Transportation Research Board, Washington, D.C., June 2002.
29. Geometric Design of Highways and Streets, American Association of Highway Transportation Officials (AASHTO), Washington, D.C., 2004
30. Sicking, D.L, Lechtenberg, K.A., and Peterson, S.M., Guidelines for Guardrail Implementation, NCHRP Report No. 638, Transportation Research Board, Washington, D.C., 2009.
31. Wolford, D. and Sicking, D.L., Guardrail Runout Lengths Revisited, Transportation Research Record No. 1528, pp. 78-86, Transportation Research Board, Washington, D.C., 1996.
32. Coon, B.A., Sicking, D.L., and Mak, K.K., Guardrail Runout Length Design Procedures – Revisited, Transportation Research Record No. 1984, Transportation Research Board, Washington, D.C., 2006.
33. Mak, K.K., Sicking, and D.L., Ross, H.E., Jr., Real World Impact Conditions for Run-Off-Road Actions, Transportation Research Record No. 1065, Transportation Research Board, Washington, D.C., January 1986.
34. Albuquerque, F.D.B., Sicking, D.L., and Stolle, C.S., Roadway Departure and Impact Conditions, Transportation Research Record No. 2195, Transportation Research Board, Washington, D.C., November 2009.
35. Wisconsin Department of Transportation, Plans and Projects: I-90 Corridor Roadside Facilities Study Need, Available: <http://www.dot.wisconsin. gov/projects/d5/i90study/docs/volumes.pdf> [March 31, 2010].
36. Federal Highway Administration, Motorvehicle Accident Costs, Available: <http://safety.fhwa.dot.gov/facts_stats/t75702.cfm> [June 4, 2011].
37. Council, F.M. and Mohamedshah, Y.M., Highway Safety Information System Guidebook for the Ohio State Data Files, Federal Highway Administration, Washington, D.C., 2007.
December 19, 2011 MwRSF Report No. TRP-03-251-11
110
38. Ohio Geographically Referenced Imagery Program, Ohio State Imagery Program (OSIP), Available: <http://gis4.oit.ohio.gov/osiptiledownloads/default.aspx> [May 31, 2011].
39. Mannering, F.L., Kilareski, W.P., and Washburn, S.S., Principles of Highway Engineering and Traffic Analysis, 3rd ed., John Wiley & Sons, Inc., Hoboken, NJ, 2005.
40. Harwood, D.W., May, A.D., Anderson, I.B., Leiman, L., and Archilla, A.R., Capacity and Quality of Service of Two-Lane Highways, Midwest Research Institute, Project No. 104215, Prepared for the National Cooperative Highway Research Program, Midwest Research Institute, University of California-Berkeley, November 1999.
41. Sax, C.R., Maze, T.H., Souleyrette, R.R., Hawkins, N., and Carriquiry, A.L., Optimum Urban Clear-Zone Distance, Transportation Research Record No. 2195, Transportation Research Board, Washington, D.C., 2010.
42. Polivka, K.A., Sicking, D.L., Faller, R.K., and Bielenberg, R.W., Midwest Guardrail System Adjacent to a 1V:2H Slope, Transportation Research Record No. 2060, Transportation Research Board, Washington, D.C., 2008.
43. Federal Highway Administration, Chapter 3 – The 13 Controlling Criteria, Shoulder Width, Mitigation Strategies for Design Exceptions – July 2007, Available: <http://safety.fhwa.dot.gov/geometric/pubs/mitigationstrategies/chapter3/3_shoulderwidth.htm> [May 26, 2011].
44. A Policy on Design Standards – Interstate System, 5th ed., American Association of State Highway Transportation Officials (AASHTO), Washington, D.C., 2005.
45. US Department of Commerce, Bureau of Economic Analysis, Available: <http://www.bea.gov/national/nipaweb> [August 24, 2011].

December 19, 2011 MwRSF Report No. TRP-03-251-11
111
15 APPENDICES
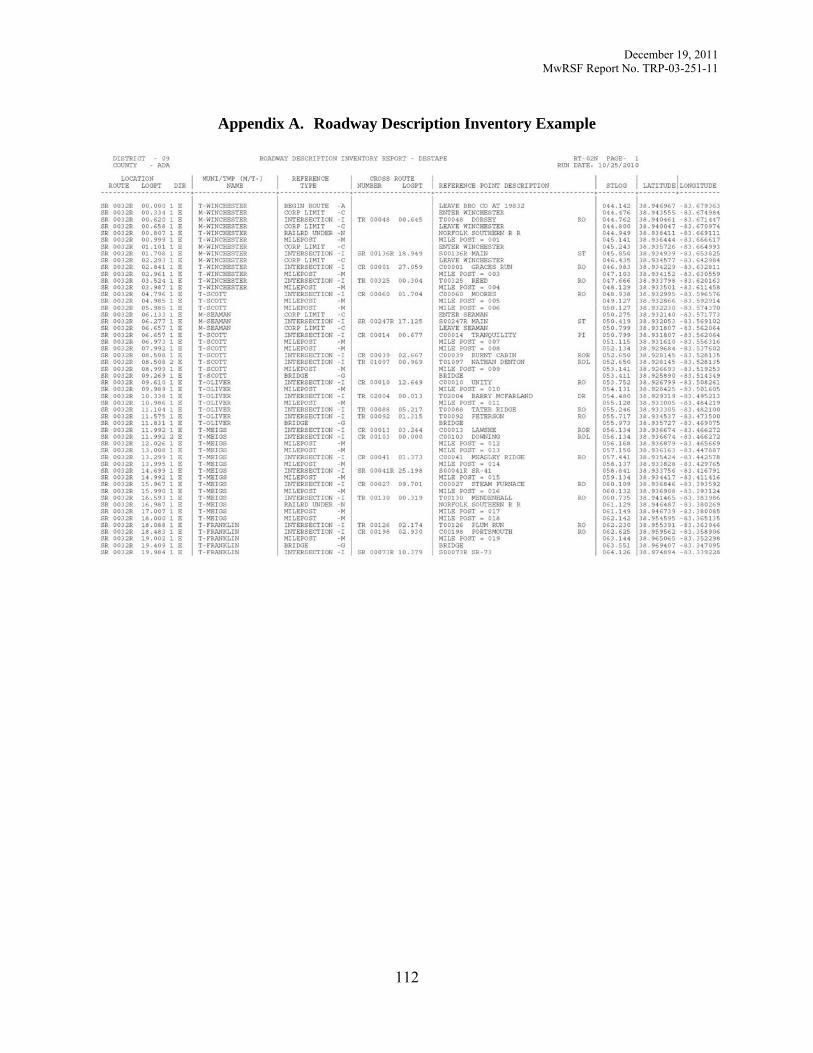
December 19, 2011 MwRSF Report No. TRP-03-251-11
112
Appendix A. Roadway Description Inventory Example

December 19, 2011 MwRSF Report No. TRP-03-251-11
113
Appendix B. 1V:2H Freeway

December 19, 2011 MwRSF Report No. TRP-03-251-11
114
Degree of Curvature
Grade (%)
Length of Feature (ft)
Height of Feature (ft)
Offset (ft)
SI b
2 2.89 7.08E-067 2.88 5.09E-0612 2.89 4.01E-062 3.15 7.25E-067 3.14 5.31E-0612 3.14 4.20E-062 3.34 7.97E-067 3.34 6.05E-0612 3.34 4.82E-062 2.88 2.77E-057 2.89 2.16E-0512 2.89 1.76E-052 3.14 2.63E-057 3.15 2.08E-0512 3.15 1.70E-052 3.34 2.71E-057 3.35 2.12E-0512 3.35 1.71E-052 2.89 4.93E-057 2.89 3.88E-0512 2.88 3.12E-052 3.15 4.48E-057 3.16 3.57E-0512 3.14 2.93E-052 3.34 4.67E-057 3.35 3.66E-0512 3.34 3.01E-052 2.88 6.81E-067 2.88 5.12E-0612 2.88 3.91E-062 3.13 6.91E-067 3.16 5.34E-0612 3.14 4.30E-062 3.33 7.90E-067 3.35 5.73E-0612 3.34 4.90E-062 2.89 2.79E-057 2.89 2.19E-0512 2.88 1.77E-05
0
2
0
1
800
200
1400
800
200
1
13
7
1
13
7
1
13
7
1
13
7

December 19, 2011 MwRSF Report No. TRP-03-251-11
115
Degree of Curvature
Grade (%)
Length of Feature (ft)
Height of Feature (ft)
Offset (ft)
SI b
2 3.16 2.60E-057 3.15 2.07E-0512 3.15 1.67E-052 3.34 2.69E-057 3.35 2.14E-0512 3.35 1.72E-052 2.88 4.92E-057 2.88 3.88E-0512 2.89 3.15E-052 3.15 4.59E-057 3.15 3.56E-0512 3.15 2.91E-052 3.34 4.64E-057 3.35 3.74E-0512 3.34 2.94E-052 2.88 7.91E-067 2.90 5.74E-0612 2.88 4.34E-062 3.16 7.82E-067 3.16 5.91E-0612 3.16 4.61E-062 3.34 8.74E-067 3.36 6.98E-0612 3.34 5.48E-062 2.89 3.14E-057 2.89 2.40E-0512 2.89 1.98E-052 3.15 2.92E-057 3.15 2.34E-0512 3.14 1.87E-052 3.35 3.04E-057 3.35 2.38E-0512 3.34 1.97E-052 2.89 5.51E-057 2.88 4.38E-0512 2.88 3.58E-052 3.15 5.09E-057 3.15 4.05E-0512 3.15 3.31E-05
200
1400
800
2
3
0
7
13
1
7
1400
800
7
13
1
7
13
1
7
13
1

December 19, 2011 MwRSF Report No. TRP-03-251-11
116
Degree of Curvature
Grade (%)
Length of Feature (ft)
Height of Feature (ft)
Offset (ft)
SI b
2 3.34 5.26E-057 3.34 4.16E-0512 3.35 3.35E-052 2.87 5.47E-067 2.90 3.80E-0612 2.87 2.45E-062 3.15 5.06E-067 3.16 3.37E-0612 3.14 2.38E-062 3.34 5.39E-067 3.35 3.64E-0612 3.35 2.54E-062 2.87 2.56E-057 2.88 1.91E-0512 2.88 1.55E-052 3.15 2.32E-057 3.15 1.75E-0512 3.15 1.42E-052 3.35 2.33E-057 3.34 1.77E-0512 3.34 1.42E-052 2.89 4.40E-057 2.89 3.39E-0512 2.88 2.77E-052 3.15 3.98E-057 3.15 3.08E-0512 3.15 2.51E-052 3.35 4.06E-057 3.35 3.15E-0512 3.34 2.53E-052 2.89 5.26E-067 2.88 3.59E-0612 2.88 2.50E-062 3.16 5.31E-067 3.15 3.30E-0612 3.15 2.36E-062 3.34 5.22E-067 3.33 3.59E-0612 3.36 2.60E-06
2
2
0
13
200
1400
800
200
1400
13
1
7
13
1
7
13
1
7
13
1
7
3
0

December 19, 2011 MwRSF Report No. TRP-03-251-11
117
Degree of Curvature
Grade (%)
Length of Feature (ft)
Height of Feature (ft)
Offset (ft)
SI b
2 2.90 2.49E-057 2.88 1.91E-0512 2.88 1.50E-052 3.15 2.26E-057 3.15 1.72E-0512 3.15 1.40E-052 3.35 2.33E-057 3.35 1.80E-0512 3.34 1.40E-052 2.89 4.36E-057 2.89 3.38E-0512 2.88 2.75E-052 3.15 3.98E-057 3.15 3.04E-0512 3.15 2.50E-052 3.34 4.01E-057 3.35 3.15E-0512 3.35 2.53E-052 2.89 6.20E-067 2.89 4.00E-0612 2.88 2.70E-062 3.14 5.25E-067 3.16 3.68E-0612 3.15 2.63E-062 3.33 6.01E-067 3.34 3.90E-0612 3.34 2.96E-062 2.89 2.83E-057 2.88 2.17E-0512 2.89 1.73E-052 3.15 2.56E-057 3.16 1.98E-0512 3.15 1.60E-052 3.35 2.58E-057 3.34 2.02E-0512 3.34 1.61E-052 2.89 4.95E-057 2.88 3.83E-0512 2.89 3.11E-05
1400
800
200
1400
800
2
3
7
13
1
7
13
1
7
13
1
7
13
1
1
2

December 19, 2011 MwRSF Report No. TRP-03-251-11
118
Degree of Curvature
Grade (%)
Length of Feature (ft)
Height of Feature (ft)
Offset (ft)
SI b
2 3.15 4.47E-057 3.15 3.45E-0512 3.15 2.82E-052 3.34 4.46E-057 3.35 3.51E-0512 3.34 2.87E-052 2.87 6.20E-067 2.88 3.95E-0612 2.90 2.78E-062 3.16 5.51E-067 3.15 3.70E-0612 3.16 2.51E-062 3.34 5.77E-067 3.33 3.64E-0612 3.34 2.66E-062 2.88 2.69E-057 2.88 2.05E-0512 2.89 1.59E-052 3.15 2.44E-057 3.15 1.88E-0512 3.16 1.46E-052 3.34 2.42E-057 3.34 1.91E-0512 3.35 1.49E-052 2.89 4.54E-057 2.88 3.62E-0512 2.89 2.86E-052 3.15 4.14E-057 3.15 3.28E-0512 3.15 2.60E-052 3.35 4.18E-057 3.34 3.24E-0512 3.34 2.64E-052 2.89 5.97E-067 2.89 3.98E-0612 2.91 2.87E-062 3.15 5.68E-067 3.15 3.53E-0612 3.15 2.53E-06
3
2
7
13
1
7
13
1
7
13
800
200
14003
0
2
7
13
1
7
200
1400
1

December 19, 2011 MwRSF Report No. TRP-03-251-11
119
Degree of Curvature
Grade (%)
Length of Feature (ft)
Height of Feature (ft)
Offset (ft)
SI b
2 3.33 5.47E-067 3.33 3.70E-0612 3.33 2.63E-062 2.89 2.67E-057 2.89 2.08E-0512 2.88 1.61E-052 3.15 2.43E-057 3.16 1.86E-0512 3.14 1.47E-052 3.35 2.44E-057 3.34 1.83E-0512 3.34 1.46E-052 2.88 4.48E-057 2.88 3.60E-0512 2.89 2.81E-052 3.15 4.14E-057 3.15 3.19E-0512 3.16 2.59E-052 3.34 4.17E-057 3.34 3.19E-0512 3.35 2.63E-052 2.90 6.72E-067 2.87 4.20E-0612 2.88 3.10E-062 3.16 6.17E-067 3.14 3.95E-0612 3.16 2.94E-062 3.34 6.25E-067 3.34 4.12E-0612 3.35 3.04E-062 2.88 3.06E-057 2.90 2.29E-0512 2.88 1.79E-052 3.15 2.73E-057 3.16 2.08E-0512 3.15 1.68E-052 3.35 2.74E-057 3.35 2.16E-0512 3.34 1.67E-05
13
1
13
7
3
13
1
7
13
1
7
13
1
7
800
200
1400
800
200
2
3

December 19, 2011 MwRSF Report No. TRP-03-251-11
120
Degree of Curvature
Grade (%)
Length of Feature (ft)
Height of Feature (ft)
Offset (ft)
SI b
2 2.88 5.10E-057 2.88 4.01E-0512 2.89 3.18E-052 3.15 4.65E-057 3.14 3.64E-0512 3.15 2.86E-052 3.34 4.70E-057 3.34 3.69E-0512 3.35 2.92E-05
13
140033
1
7

December 19, 2011 MwRSF Report No. TRP-03-251-11
121
Appendix C. 1V:2H Undivided Rural Arterial

December 19, 2011 MwRSF Report No. TRP-03-251-11
122
Degree of Curvature
Grade (%)
Length of Feature (ft)
Height of Feature (ft)
Offset (ft)
SI b
2 2.30 4.65E-067 2.30 3.24E-0612 2.29 2.31E-062 2.67 4.47E-067 2.50 3.19E-0612 2.51 2.20E-062 2.68 4.88E-067 2.65 3.30E-0612 2.66 2.31E-062 2.29 1.73E-057 2.31 1.26E-0512 2.30 8.91E-062 2.67 1.53E-057 2.50 1.15E-0512 2.51 8.17E-062 2.66 1.57E-057 2.67 1.12E-0512 2.66 8.08E-062 2.30 3.04E-057 2.29 2.22E-0512 2.30 1.59E-052 2.66 2.66E-057 2.51 1.96E-0512 2.51 1.40E-052 2.66 2.69E-057 2.66 1.93E-0512 2.67 1.37E-052 2.30 5.18E-067 2.29 3.71E-0612 2.31 2.46E-062 2.66 5.16E-067 2.51 3.56E-0612 2.51 2.54E-062 2.67 5.46E-067 2.66 3.79E-0612 2.66 2.63E-062 2.30 1.98E-057 2.30 1.43E-0512 2.30 9.99E-06
0
3
0
800 1
1400
1
7
13
200
1
7
13
200
1
7
13
800
1
7
13

December 19, 2011 MwRSF Report No. TRP-03-251-11
123
Degree of Curvature
Grade (%)
Length of Feature (ft)
Height of Feature (ft)
Offset (ft)
SI b
2 2.66 1.72E-057 2.50 1.31E-0512 2.51 9.12E-062 2.66 1.82E-057 2.66 1.31E-0512 2.67 8.98E-062 2.30 3.42E-057 2.30 2.47E-0512 2.30 1.76E-052 2.67 2.98E-057 2.52 2.22E-0512 2.51 1.59E-052 2.66 2.99E-057 2.66 2.17E-0512 2.67 1.53E-052 2.30 7.24E-067 2.30 4.77E-0612 2.32 3.28E-062 2.65 6.80E-067 2.52 4.91E-0612 2.52 3.33E-062 2.65 7.30E-067 2.67 4.84E-0612 2.67 3.43E-062 2.31 2.60E-057 2.30 1.88E-0512 2.31 1.33E-052 2.66 2.37E-057 2.51 1.71E-0512 2.51 1.20E-052 2.66 2.39E-057 2.67 1.70E-0512 2.66 1.20E-052 2.29 4.60E-057 2.30 3.34E-0512 2.30 2.39E-052 2.66 3.98E-057 2.51 2.97E-0512 2.51 2.05E-05
3
6
0
1400
1
7
200
1
7
13
800
1
7
13
800
7
13
1400
1
7
13

December 19, 2011 MwRSF Report No. TRP-03-251-11
124
Degree of Curvature
Grade (%)
Length of Feature (ft)
Height of Feature (ft)
Offset (ft)
SI b
2 2.67 4.03E-057 2.67 2.92E-0512 2.67 2.04E-052 2.32 3.74E-067 2.30 2.37E-0612 2.32 1.44E-062 2.69 3.34E-067 2.51 2.11E-0612 2.50 1.37E-062 2.65 3.59E-067 2.66 2.08E-0612 2.65 1.31E-062 2.30 1.61E-057 2.30 1.12E-0512 2.29 7.80E-062 2.66 1.37E-057 2.51 9.86E-0612 2.51 6.89E-062 2.66 1.36E-057 2.66 9.73E-0612 2.66 6.84E-062 2.30 2.71E-057 2.30 1.95E-0512 2.30 1.35E-052 2.67 2.32E-057 2.51 1.67E-0512 2.51 1.17E-052 2.66 2.31E-057 2.66 1.65E-0512 2.67 1.15E-052 2.31 4.53E-067 2.28 2.73E-0612 2.29 1.82E-062 2.64 3.93E-067 2.51 2.36E-0612 2.48 1.60E-062 2.67 3.83E-067 2.67 2.26E-0612 2.67 1.42E-06
6
0
3
3
0
200
1
7
13
800
1
7
13
1400
1
7
13
1400 13
200
1
7
13

December 19, 2011 MwRSF Report No. TRP-03-251-11
125
Degree of Curvature
Grade (%)
Length of Feature (ft)
Height of Feature (ft)
Offset (ft)
SI b
2 2.31 1.75E-057 2.30 1.29E-0512 2.30 8.90E-062 2.66 1.53E-057 2.51 1.10E-0512 2.50 7.69E-062 2.67 1.56E-057 2.66 1.09E-0512 2.66 7.39E-062 2.30 3.07E-057 2.30 2.18E-0512 2.29 1.53E-052 2.66 2.61E-057 2.51 1.89E-0512 2.51 1.34E-052 2.66 2.62E-057 2.67 1.87E-0512 2.66 1.30E-052 2.33 5.67E-067 2.29 3.50E-0612 2.32 2.18E-062 2.67 4.93E-067 2.51 3.12E-0612 2.50 1.95E-062 2.68 5.13E-067 2.65 3.15E-0612 2.67 1.95E-062 2.30 2.38E-057 2.30 1.68E-0512 2.30 1.16E-052 2.67 2.00E-057 2.52 1.50E-0512 2.50 1.03E-052 2.66 2.04E-057 2.65 1.49E-0512 2.67 9.93E-062 2.30 4.05E-057 2.30 2.90E-0512 2.29 2.07E-05
6
3
3
800
1
7
13
1400 1
1400
1
7
13
200
1
7
13
800
1
7
13

December 19, 2011 MwRSF Report No. TRP-03-251-11
126
Degree of Curvature
Grade (%)
Length of Feature (ft)
Height of Feature (ft)
Offset (ft)
SI b
2 2.66 3.44E-057 2.51 2.50E-0512 2.50 1.76E-052 2.66 3.47E-057 2.67 2.46E-0512 2.67 1.71E-052 2.32 1.11E-057 2.30 8.05E-0612 2.30 4.84E-062 2.65 1.00E-057 2.50 6.78E-0612 2.53 4.15E-062 2.64 1.01E-057 2.68 6.22E-0612 2.65 4.41E-062 2.30 4.75E-057 2.30 3.32E-0512 2.29 2.36E-052 2.66 4.03E-057 2.50 2.96E-0512 2.51 2.04E-052 2.66 3.97E-057 2.67 2.81E-0512 2.66 2.01E-052 2.30 7.73E-057 2.29 5.48E-0512 2.29 3.89E-052 2.67 6.54E-057 2.51 4.77E-0512 2.51 3.38E-052 2.66 6.52E-057 2.66 4.65E-0512 2.66 3.29E-052 2.29 1.27E-057 2.28 8.89E-0612 2.31 5.21E-062 2.65 1.15E-057 2.51 7.68E-0612 2.50 4.87E-06
6
0
3
6
3
200
1
7
800
1
7
13
1400
1
7
13
1400
7
13
200
1
7
13

December 19, 2011 MwRSF Report No. TRP-03-251-11
127
Degree of Curvature
Grade (%)
Length of Feature (ft)
Height of Feature (ft)
Offset (ft)
SI b
2 2.68 1.10E-057 2.66 7.23E-0612 2.64 4.78E-062 2.30 5.28E-057 2.30 3.84E-0512 2.29 2.62E-052 2.65 4.55E-057 2.51 3.26E-0512 2.51 2.25E-052 2.67 4.37E-057 2.66 3.25E-0512 2.67 2.26E-052 2.30 8.69E-057 2.31 6.16E-0512 2.30 4.43E-052 2.66 7.45E-057 2.51 5.30E-0512 2.51 3.80E-052 2.67 7.34E-057 2.66 5.25E-0512 2.66 3.69E-052 2.30 1.74E-057 2.31 1.13E-0512 2.30 7.29E-062 2.66 1.50E-057 2.50 1.09E-0512 2.50 6.57E-062 2.68 1.57E-057 2.68 9.40E-0612 2.65 6.34E-062 2.30 7.02E-057 2.30 5.05E-0512 2.29 3.62E-052 2.66 6.06E-057 2.51 4.49E-0512 2.50 3.09E-052 2.67 5.97E-057 2.67 4.23E-0512 2.66 2.98E-05
3
6
6
800
1
7
13
1400
1
7
13
200
1
7
13
200 13
800
1
7
13

December 19, 2011 MwRSF Report No. TRP-03-251-11
128
Degree of Curvature
Grade (%)
Length of Feature (ft)
Height of Feature (ft)
Offset (ft)
SI b
2 2.30 1.15E-047 2.29 8.54E-0512 2.29 5.86E-052 2.67 9.77E-057 2.52 7.06E-0512 2.51 5.02E-052 2.67 9.90E-057 2.66 7.06E-0512 2.66 4.88E-05
66 1400
1
7
13

December 19, 2011 MwRSF Report No. TRP-03-251-11
129
Appendix D. 1V:2H Divided Rural Arterial

December 19, 2011 MwRSF Report No. TRP-03-251-11
130
Degree of Curvature
Grade (%)
Length of Feature (ft)
Height of Feature (ft)
Offset (ft)
SI b
2 2.30 9.63E-067 2.30 7.28E-0612 2.30 5.90E-062 2.49 9.42E-067 2.51 7.23E-0612 2.49 6.30E-062 2.66 1.01E-057 2.65 8.36E-0612 2.67 7.08E-062 2.30 3.73E-057 2.30 2.91E-0512 2.30 2.26E-052 2.51 3.35E-057 2.51 2.63E-0512 2.51 2.20E-052 2.66 3.34E-057 2.66 2.67E-0512 2.66 2.18E-052 2.30 6.41E-057 2.30 5.02E-0512 2.29 4.16E-052 2.51 5.69E-057 2.51 4.57E-0512 2.51 3.70E-052 2.67 5.80E-057 2.67 4.55E-0512 2.66 3.71E-052 2.29 1.04E-057 2.28 8.16E-0612 2.32 6.36E-062 2.50 1.10E-057 2.53 8.26E-0612 2.51 6.85E-062 2.66 1.19E-057 2.67 9.10E-0612 2.67 7.84E-062 2.29 4.15E-057 2.30 3.25E-0512 2.30 2.64E-05
0
3
0
800 1
1400
1
7
13
200
1
7
13
200
1
7
13
800
1
7
13

December 19, 2011 MwRSF Report No. TRP-03-251-11
131
Degree of Curvature
Grade (%)
Length of Feature (ft)
Height of Feature (ft)
Offset (ft)
SI b
2 2.51 3.70E-057 2.51 3.01E-0512 2.51 2.43E-052 2.67 3.77E-057 2.66 3.00E-0512 2.67 2.44E-052 2.30 7.33E-057 2.30 5.65E-0512 2.30 4.71E-052 2.51 6.31E-057 2.51 5.14E-0512 2.51 4.18E-052 2.67 6.39E-057 2.67 5.11E-0512 2.67 4.20E-052 2.30 1.42E-057 2.29 1.08E-0512 2.30 9.22E-062 2.52 1.40E-057 2.52 1.12E-0512 2.53 9.08E-062 2.66 1.58E-057 2.67 1.25E-0512 2.67 1.01E-052 2.29 5.62E-057 2.30 4.31E-0512 2.30 3.45E-052 2.51 4.93E-057 2.51 3.95E-0512 2.51 3.17E-052 2.66 5.11E-057 2.66 4.02E-0512 2.67 3.34E-052 2.30 9.64E-057 2.30 7.65E-0512 2.31 6.12E-052 2.51 8.71E-057 2.51 6.91E-0512 2.51 5.58E-05
3
6
0
1400
1
7
200
1
7
13
800
1
7
13
800
7
13
1400
1
7
13

December 19, 2011 MwRSF Report No. TRP-03-251-11
132
Degree of Curvature
Grade (%)
Length of Feature (ft)
Height of Feature (ft)
Offset (ft)
SI b
2 2.67 8.49E-057 2.66 6.93E-0512 2.67 5.58E-052 2.29 7.87E-067 2.29 5.11E-0612 2.29 3.63E-062 2.52 6.70E-067 2.50 4.35E-0612 2.49 3.04E-062 2.66 6.56E-067 2.67 4.26E-0612 2.65 3.22E-062 2.30 3.24E-057 2.30 2.49E-0512 2.30 1.95E-052 2.50 2.85E-057 2.51 2.16E-0512 2.51 1.71E-052 2.66 2.65E-057 2.66 2.09E-0512 2.65 1.71E-052 2.30 5.51E-057 2.29 4.35E-0512 2.30 3.44E-052 2.51 4.66E-057 2.51 3.74E-0512 2.51 3.01E-052 2.66 4.68E-057 2.67 3.70E-0512 2.67 2.93E-052 2.29 8.66E-067 2.29 5.44E-0612 2.30 4.05E-062 2.51 7.46E-067 2.51 4.65E-0612 2.49 3.66E-062 2.67 7.54E-067 2.66 4.66E-0612 2.66 3.43E-06
6
0
3
3
0
200
1
7
13
800
1
7
13
1400
1
7
13
1400 13
200
1
7
13

December 19, 2011 MwRSF Report No. TRP-03-251-11
133
Degree of Curvature
Grade (%)
Length of Feature (ft)
Height of Feature (ft)
Offset (ft)
SI b
2 2.31 3.61E-057 2.30 2.81E-0512 2.30 2.20E-052 2.51 3.15E-057 2.52 2.40E-0512 2.51 1.95E-052 2.68 3.06E-057 2.67 2.41E-0512 2.66 1.86E-052 2.29 6.23E-057 2.29 4.92E-0512 2.30 3.86E-052 2.51 5.29E-057 2.51 4.18E-0512 2.51 3.35E-052 2.66 5.23E-057 2.67 4.16E-0512 2.66 3.32E-052 2.31 1.20E-057 2.30 7.33E-0612 2.30 5.20E-062 2.51 9.81E-067 2.51 6.32E-0612 2.53 4.29E-062 2.65 1.01E-057 2.66 6.32E-0612 2.66 5.04E-062 2.30 4.86E-057 2.30 3.70E-0512 2.30 3.02E-052 2.51 4.18E-057 2.50 3.21E-0512 2.51 2.55E-052 2.67 4.10E-057 2.65 3.18E-0512 2.67 2.53E-052 2.29 8.29E-057 2.30 6.40E-0512 2.31 5.17E-05
6
3
3
800
1
7
13
1400 1
1400
1
7
13
200
1
7
13
800
1
7
13

December 19, 2011 MwRSF Report No. TRP-03-251-11
134
Degree of Curvature
Grade (%)
Length of Feature (ft)
Height of Feature (ft)
Offset (ft)
SI b
2 2.51 7.21E-057 2.50 5.63E-0512 2.51 4.51E-052 2.66 7.01E-057 2.66 5.58E-0512 2.67 4.40E-052 2.30 2.33E-057 2.31 1.55E-0512 2.30 1.09E-052 2.52 2.01E-057 2.51 1.36E-0512 2.52 1.02E-052 2.66 1.88E-057 2.66 1.34E-0512 2.67 9.47E-062 2.30 9.23E-057 2.29 7.32E-0512 2.30 5.90E-052 2.51 8.10E-057 2.52 6.34E-0512 2.51 5.15E-052 2.67 8.14E-057 2.66 6.57E-0512 2.67 4.88E-052 2.30 1.52E-047 2.29 1.22E-0412 2.30 9.78E-052 2.51 1.32E-047 2.51 1.04E-0412 2.50 8.50E-052 2.67 1.31E-047 2.67 1.04E-0412 2.66 8.36E-052 2.29 2.68E-057 2.28 1.82E-0512 2.30 1.30E-052 2.51 2.15E-057 2.52 1.44E-0512 2.51 1.18E-05
6
0
3
6
3
200
1
7
800
1
7
13
1400
1
7
13
1400
7
13
200
1
7
13

December 19, 2011 MwRSF Report No. TRP-03-251-11
135
Degree of Curvature
Grade (%)
Length of Feature (ft)
Height of Feature (ft)
Offset (ft)
SI b
2 2.67 2.12E-057 2.67 1.53E-0512 2.66 1.12E-052 2.30 1.05E-047 2.30 8.19E-0512 2.30 6.66E-052 2.50 9.40E-057 2.51 7.17E-0512 2.50 5.90E-052 2.65 9.18E-057 2.67 6.93E-0512 2.67 5.37E-052 2.30 1.75E-047 2.29 1.39E-0412 2.30 1.10E-042 2.52 1.52E-047 2.50 1.21E-0412 2.51 9.64E-052 2.66 1.47E-047 2.67 1.16E-0412 2.67 9.55E-052 2.29 3.37E-057 2.31 2.45E-0512 2.29 1.62E-052 2.51 2.98E-057 2.50 2.09E-0512 2.51 1.53E-052 2.66 3.06E-057 2.67 2.04E-0512 2.68 1.34E-052 2.30 1.38E-047 2.30 1.09E-0412 2.30 8.77E-052 2.51 1.23E-047 2.52 9.58E-0512 2.51 7.76E-052 2.65 1.20E-047 2.65 9.46E-0512 2.67 7.32E-05
3
6
6
800
1
7
13
1400
1
7
13
200
1
7
13
200 13
800
1
7
13

December 19, 2011 MwRSF Report No. TRP-03-251-11
136
Degree of Curvature
Grade (%)
Length of Feature (ft)
Height of Feature (ft)
Offset (ft)
SI b
2 2.30 2.36E-047 2.29 1.85E-0412 2.30 1.47E-042 2.51 2.02E-047 2.51 1.61E-0412 2.50 1.26E-042 2.66 1.99E-047 2.67 1.52E-0412 2.66 1.25E-04
66 1400
1
7
13

December 19, 2011 MwRSF Report No. TRP-03-251-11
137
Appendix E. 1V:2H Rural Local

December 19, 2011 MwRSF Report No. TRP-03-251-11
138
Degree of Curvature
Grade (%)
Length of Feature (ft)
Height of Feature (ft)
Offset (ft)
SI b
2 2.27 3.12E-057 2.27 2.14E-0512 2.28 1.51E-052 2.49 3.03E-057 2.48 2.18E-0512 2.49 1.55E-052 2.63 3.08E-057 2.65 2.09E-0512 2.64 1.48E-052 2.28 1.14E-047 2.28 8.23E-0512 2.28 5.62E-052 2.49 1.01E-047 2.48 7.36E-0512 2.48 5.22E-052 2.64 9.66E-057 2.63 7.21E-0512 2.64 4.91E-052 2.27 1.90E-047 2.27 1.43E-0412 2.27 1.01E-042 2.48 1.73E-047 2.48 1.26E-0412 2.48 9.02E-052 2.64 1.62E-047 2.63 1.19E-0412 2.64 8.40E-052 2.27 3.91E-057 2.27 2.70E-0512 2.28 1.89E-052 2.48 4.04E-057 2.48 2.70E-0512 2.49 1.97E-052 2.64 3.78E-057 2.63 2.69E-0512 2.64 1.87E-052 2.27 1.43E-047 2.28 1.00E-0412 2.27 7.24E-05
0
4
0
800 1
1400
1
7
13
200
1
7
13
200
1
7
13
800
1
7
13

December 19, 2011 MwRSF Report No. TRP-03-251-11
139
Degree of Curvature
Grade (%)
Length of Feature (ft)
Height of Feature (ft)
Offset (ft)
SI b
2 2.48 1.24E-047 2.49 9.20E-0512 2.48 6.63E-052 2.63 1.21E-047 2.64 8.53E-0512 2.64 6.10E-052 2.27 2.38E-047 2.27 1.78E-0412 2.27 1.26E-042 2.48 2.16E-047 2.48 1.59E-0412 2.48 1.12E-042 2.64 2.02E-047 2.64 1.46E-0412 2.64 1.04E-042 2.28 4.62E-057 2.27 3.33E-0512 2.26 2.26E-052 2.48 4.73E-057 2.48 3.25E-0512 2.49 2.25E-052 2.64 4.42E-057 2.64 3.19E-0512 2.64 2.22E-052 2.28 1.69E-047 2.27 1.22E-0412 2.27 8.62E-052 2.48 1.56E-047 2.49 1.11E-0412 2.48 7.98E-052 2.64 1.46E-047 2.63 1.05E-0412 2.64 7.35E-052 2.28 2.87E-047 2.27 2.13E-0412 2.27 1.51E-042 2.48 2.59E-047 2.48 1.92E-0412 2.48 1.34E-04
4
8
0
1400
1
7
200
1
7
13
800
1
7
13
800
7
13
1400
1
7
13

December 19, 2011 MwRSF Report No. TRP-03-251-11
140
Degree of Curvature
Grade (%)
Length of Feature (ft)
Height of Feature (ft)
Offset (ft)
SI b
2 2.64 2.42E-047 2.63 1.78E-0412 2.64 1.27E-042 2.26 5.56E-057 2.27 3.91E-0512 2.28 2.59E-052 2.48 5.16E-057 2.50 3.58E-0512 2.50 2.34E-052 2.65 4.74E-057 2.64 3.46E-0512 2.63 2.28E-052 2.27 2.26E-047 2.28 1.59E-0412 2.28 1.16E-042 2.48 1.94E-047 2.48 1.43E-0412 2.49 9.99E-052 2.64 1.85E-047 2.64 1.34E-0412 2.64 9.37E-052 2.27 3.88E-047 2.28 2.78E-0412 2.27 1.95E-042 2.49 3.39E-047 2.49 2.45E-0412 2.49 1.73E-042 2.64 3.10E-047 2.63 2.29E-0412 2.64 1.61E-042 2.27 7.10E-057 2.28 4.92E-0512 2.30 3.29E-052 2.48 6.55E-057 2.49 4.32E-0512 2.49 2.95E-052 2.64 6.09E-057 2.64 4.14E-0512 2.64 2.72E-05
0
4
4
80
200
1
7
13
800
1
7
13
1400
1
7
13
1400 13
200
1
7
13

December 19, 2011 MwRSF Report No. TRP-03-251-11
141
Degree of Curvature
Grade (%)
Length of Feature (ft)
Height of Feature (ft)
Offset (ft)
SI b
2 2.27 2.73E-047 2.28 1.99E-0412 2.27 1.39E-042 2.48 2.45E-047 2.48 1.78E-0412 2.49 1.26E-042 2.64 2.31E-047 2.63 1.68E-0412 2.64 1.15E-042 2.28 4.81E-047 2.27 3.48E-0412 2.27 2.50E-042 2.48 4.25E-047 2.48 3.10E-0412 2.48 2.16E-042 2.64 3.94E-047 2.64 2.84E-0412 2.63 2.02E-042 2.26 8.80E-057 2.28 5.79E-0512 2.28 3.78E-052 2.49 7.59E-057 2.48 5.15E-0512 2.49 3.64E-052 2.64 7.03E-057 2.64 5.07E-0512 2.63 3.42E-052 2.27 3.34E-047 2.28 2.41E-0412 2.27 1.71E-042 2.49 2.96E-047 2.48 2.14E-0412 2.49 1.48E-042 2.64 2.73E-047 2.64 2.01E-0412 2.64 1.40E-042 2.27 5.73E-047 2.28 4.12E-0412 2.28 2.90E-04
8
4
4
800
1
7
13
1400 1
1400
1
7
13
200
1
7
13
800
1
7
13

December 19, 2011 MwRSF Report No. TRP-03-251-11
142
Degree of Curvature
Grade (%)
Length of Feature (ft)
Height of Feature (ft)
Offset (ft)
SI b
2 2.48 5.03E-047 2.49 3.67E-0412 2.48 2.61E-042 2.63 4.76E-047 2.64 3.45E-0412 2.63 2.39E-042 2.26 8.97E-057 2.28 5.41E-0512 2.27 3.59E-052 2.49 7.17E-057 2.48 4.99E-0512 2.48 3.07E-052 2.65 6.81E-057 2.63 4.62E-0512 2.63 2.98E-052 2.27 3.04E-047 2.28 2.15E-0412 2.27 1.55E-042 2.48 2.64E-047 2.48 1.92E-0412 2.49 1.34E-042 2.63 2.47E-047 2.64 1.81E-0412 2.64 1.26E-042 2.28 4.82E-047 2.27 3.63E-0412 2.27 2.46E-042 2.49 4.26E-047 2.48 3.12E-0412 2.49 2.20E-042 2.64 4.01E-047 2.64 2.91E-0412 2.64 2.01E-042 2.28 1.02E-047 2.28 6.83E-0512 2.28 4.23E-052 2.48 9.42E-057 2.48 6.03E-0512 2.49 4.04E-05
8
0
4
8
4
200
1
7
800
1
7
13
1400
1
7
13
1400
7
13
200
1
7
13

December 19, 2011 MwRSF Report No. TRP-03-251-11
143
Degree of Curvature
Grade (%)
Length of Feature (ft)
Height of Feature (ft)
Offset (ft)
SI b
2 2.63 9.01E-057 2.64 5.72E-0512 2.63 3.80E-052 2.28 3.85E-047 2.27 2.66E-0412 2.27 1.89E-042 2.48 3.33E-047 2.49 2.37E-0412 2.47 1.73E-042 2.64 3.02E-047 2.64 2.19E-0412 2.64 1.57E-042 2.28 5.96E-047 2.27 4.50E-0412 2.28 3.09E-042 2.48 5.43E-047 2.48 3.88E-0412 2.49 2.73E-042 2.64 4.95E-047 2.63 3.67E-0412 2.64 2.54E-042 2.28 1.02E-047 2.27 6.84E-0512 2.29 4.25E-052 2.49 9.08E-057 2.49 5.91E-0512 2.48 3.85E-052 2.65 8.44E-057 2.65 5.72E-0512 2.64 3.68E-052 2.27 3.71E-047 2.27 2.74E-0412 2.28 1.86E-042 2.48 3.31E-047 2.48 2.38E-0412 2.48 1.71E-042 2.64 3.01E-047 2.64 2.24E-0412 2.63 1.53E-04
4
8
8
800
1
7
13
1400
1
7
13
200
1
7
13
200 13
800
1
7
13

December 19, 2011 MwRSF Report No. TRP-03-251-11
144
Degree of Curvature
Grade (%)
Length of Feature (ft)
Height of Feature (ft)
Offset (ft)
SI b
2 2.28 6.14E-047 2.27 4.41E-0412 2.27 3.11E-042 2.48 5.30E-047 2.48 3.91E-0412 2.48 2.75E-042 2.64 4.96E-047 2.64 3.55E-0412 2.63 2.53E-04
88 1400
1
7
13

December 19, 2011 MwRSF Report No. TRP-03-251-11
145
Appendix F. 1V:2H Undivided Urban Arterial

December 19, 2011 MwRSF Report No. TRP-03-251-11
146
Degree of Curvature
Grade (%)
Length of Feature (ft)
Height of Feature (ft)
Offset (ft)
SI b
2 1.99 5.98E-067 1.98 4.17E-0612 1.97 2.72E-062 2.28 5.45E-067 2.30 3.76E-0612 2.30 2.59E-062 2.29 5.61E-067 2.30 3.88E-0612 2.30 2.77E-062 1.97 2.37E-057 1.98 1.66E-0512 1.97 1.18E-052 2.30 1.92E-057 2.29 1.41E-0512 2.29 1.00E-052 2.29 1.99E-057 2.30 1.41E-0512 2.29 1.02E-052 1.98 4.03E-057 1.98 2.91E-0512 1.98 2.06E-052 2.29 3.40E-057 2.29 2.49E-0512 2.29 1.74E-052 2.29 3.44E-057 2.30 2.48E-0512 2.29 1.76E-052 1.98 6.62E-067 1.98 4.56E-0612 1.98 3.11E-062 2.29 6.15E-067 2.28 4.28E-0612 2.28 2.99E-062 2.29 6.36E-067 2.29 4.43E-0612 2.28 3.09E-062 1.98 2.61E-057 1.98 1.85E-0512 1.97 1.34E-05
0
3
0
800 1
1400
1
7
13
200
1
7
13
200
1
7
13
800
1
7
13

December 19, 2011 MwRSF Report No. TRP-03-251-11
147
Degree of Curvature
Grade (%)
Length of Feature (ft)
Height of Feature (ft)
Offset (ft)
SI b
2 2.30 2.18E-057 2.30 1.57E-0512 2.29 1.13E-052 2.29 2.31E-057 2.29 1.63E-0512 2.29 1.14E-052 1.98 4.55E-057 1.98 3.29E-0512 1.98 2.36E-052 2.29 3.81E-057 2.29 2.80E-0512 2.29 1.98E-052 2.29 3.88E-057 2.29 2.83E-0512 2.30 1.95E-052 1.99 8.88E-067 1.97 6.25E-0612 1.98 4.16E-062 2.30 8.24E-067 2.27 5.88E-0612 2.29 3.98E-062 2.29 8.48E-067 2.29 5.90E-0612 2.29 4.15E-062 1.98 3.44E-057 1.98 2.49E-0512 1.97 1.76E-052 2.29 2.98E-057 2.29 2.14E-0512 2.30 1.50E-052 2.29 3.02E-057 2.30 2.12E-0512 2.29 1.52E-052 1.97 6.07E-057 1.97 4.38E-0512 1.98 3.11E-052 2.29 5.09E-057 2.28 3.76E-0512 2.29 2.64E-05
3
6
0
1400
1
7
200
1
7
13
800
1
7
13
800
7
13
1400
1
7
13

December 19, 2011 MwRSF Report No. TRP-03-251-11
148
Degree of Curvature
Grade (%)
Length of Feature (ft)
Height of Feature (ft)
Offset (ft)
SI b
2 2.30 5.08E-057 2.30 3.72E-0512 2.29 2.64E-052 1.97 1.12E-057 1.99 7.27E-0612 1.97 5.05E-062 2.31 9.16E-067 2.29 6.14E-0612 2.29 3.87E-062 2.28 9.40E-067 2.28 6.24E-0612 2.30 3.99E-062 1.99 4.49E-057 1.98 3.27E-0512 1.97 2.28E-052 2.29 3.84E-057 2.29 2.73E-0512 2.30 1.87E-052 2.29 3.81E-057 2.30 2.66E-0512 2.29 1.91E-052 1.98 7.80E-057 1.97 5.72E-0512 1.98 3.95E-052 2.29 6.50E-057 2.29 4.72E-0512 2.29 3.27E-052 2.29 6.56E-057 2.30 4.71E-0512 2.29 3.31E-052 1.97 1.25E-057 1.97 8.04E-0612 1.98 5.06E-062 2.31 1.01E-057 2.30 6.76E-0612 2.29 4.45E-062 2.29 1.04E-057 2.28 7.00E-0612 2.29 4.52E-06
6
0
3
4
0
200
1
7
13
800
1
7
13
1400
1
7
13
1400 13
200
1
7
13

December 19, 2011 MwRSF Report No. TRP-03-251-11
149
Degree of Curvature
Grade (%)
Length of Feature (ft)
Height of Feature (ft)
Offset (ft)
SI b
2 1.97 5.18E-057 1.97 3.67E-0512 1.98 2.52E-052 2.29 4.29E-057 2.29 3.06E-0512 2.29 2.14E-052 2.28 4.31E-057 2.29 3.08E-0512 2.30 2.14E-052 1.98 8.81E-057 1.98 6.28E-0512 1.97 4.51E-052 2.29 7.41E-057 2.30 5.28E-0512 2.29 3.69E-052 2.29 7.33E-057 2.29 5.29E-0512 2.29 3.69E-052 1.98 1.65E-057 1.98 1.06E-0512 1.98 6.87E-062 2.30 1.35E-057 2.29 9.41E-0612 2.30 5.81E-062 2.29 1.39E-057 2.29 9.29E-0612 2.30 5.95E-062 1.98 6.89E-057 1.98 4.87E-0512 1.98 3.49E-052 2.29 5.71E-057 2.29 4.10E-0512 2.29 2.84E-052 2.29 5.68E-057 2.30 3.99E-0512 2.29 2.86E-052 1.98 1.17E-047 1.98 8.38E-0512 1.98 5.95E-05
6
4
3
800
1
7
13
1400 1
1400
1
7
13
200
1
7
13
800
1
7
13

December 19, 2011 MwRSF Report No. TRP-03-251-11
150
Degree of Curvature
Grade (%)
Length of Feature (ft)
Height of Feature (ft)
Offset (ft)
SI b
2 2.30 9.73E-057 2.29 7.07E-0512 2.29 4.92E-052 2.29 9.89E-057 2.29 7.00E-0512 2.30 4.90E-052 1.97 1.59E-057 1.98 1.04E-0512 1.98 6.12E-062 2.27 1.35E-057 2.30 8.28E-0612 2.27 5.38E-062 2.29 1.33E-057 2.30 8.39E-0612 2.30 5.23E-062 1.98 5.87E-057 1.99 4.17E-0512 1.98 2.95E-052 2.29 5.03E-057 2.29 3.50E-0512 2.29 2.52E-052 2.29 5.06E-057 2.30 3.51E-0512 2.29 2.48E-052 1.98 9.43E-057 1.97 6.82E-0512 1.97 4.81E-052 2.29 7.91E-057 2.29 5.66E-0512 2.29 4.01E-052 2.29 7.96E-057 2.29 5.61E-0512 2.29 3.98E-052 1.98 1.79E-057 1.97 1.15E-0512 1.98 7.07E-062 2.29 1.44E-057 2.30 9.71E-0612 2.30 5.90E-06
6
0
3
8
4
200
1
7
800
1
7
13
1400
1
7
13
1400
7
13
200
1
7
13
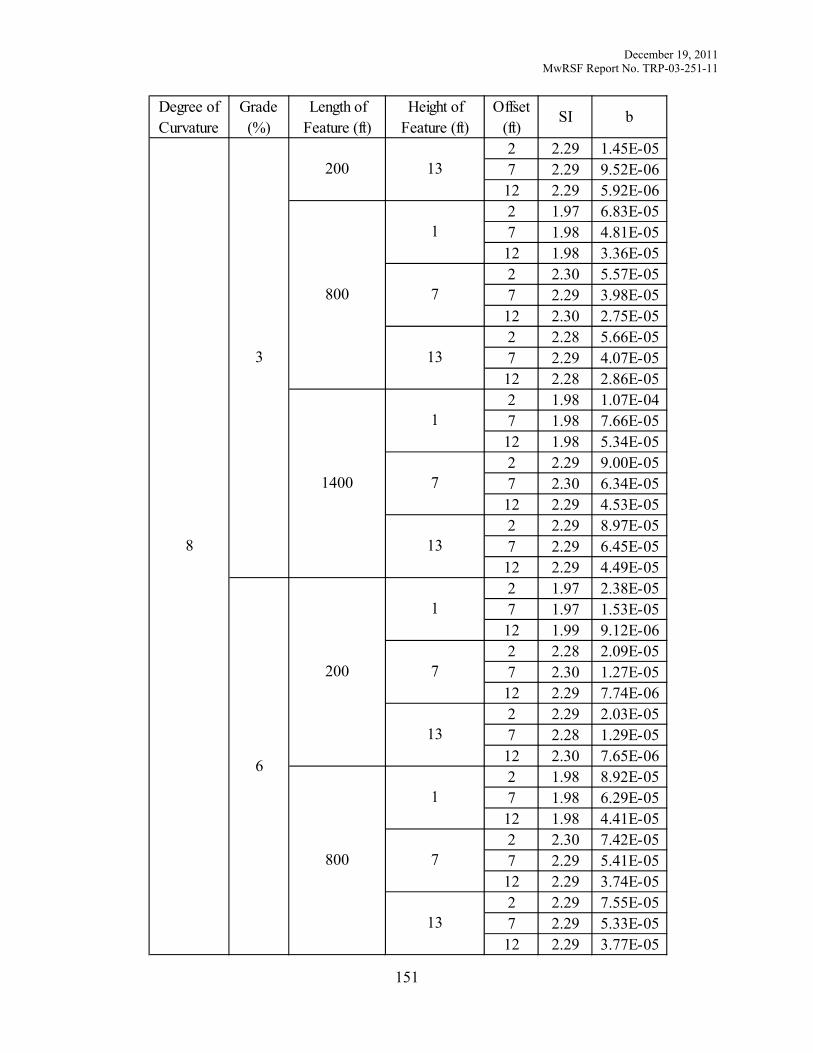
December 19, 2011 MwRSF Report No. TRP-03-251-11
151
Degree of Curvature
Grade (%)
Length of Feature (ft)
Height of Feature (ft)
Offset (ft)
SI b
2 2.29 1.45E-057 2.29 9.52E-0612 2.29 5.92E-062 1.97 6.83E-057 1.98 4.81E-0512 1.98 3.36E-052 2.30 5.57E-057 2.29 3.98E-0512 2.30 2.75E-052 2.28 5.66E-057 2.29 4.07E-0512 2.28 2.86E-052 1.98 1.07E-047 1.98 7.66E-0512 1.98 5.34E-052 2.29 9.00E-057 2.30 6.34E-0512 2.29 4.53E-052 2.29 8.97E-057 2.29 6.45E-0512 2.29 4.49E-052 1.97 2.38E-057 1.97 1.53E-0512 1.99 9.12E-062 2.28 2.09E-057 2.30 1.27E-0512 2.29 7.74E-062 2.29 2.03E-057 2.28 1.29E-0512 2.30 7.65E-062 1.98 8.92E-057 1.98 6.29E-0512 1.98 4.41E-052 2.30 7.42E-057 2.29 5.41E-0512 2.29 3.74E-052 2.29 7.55E-057 2.29 5.33E-0512 2.29 3.77E-05
3
6
8
800
1
7
13
1400
1
7
13
200
1
7
13
200 13
800
1
7
13

December 19, 2011 MwRSF Report No. TRP-03-251-11
152
Degree of Curvature
Grade (%)
Length of Feature (ft)
Height of Feature (ft)
Offset (ft)
SI b
2 1.98 1.42E-047 1.98 1.03E-0412 1.97 7.25E-052 2.29 1.18E-047 2.29 8.51E-0512 2.29 6.00E-052 2.29 1.16E-047 2.29 8.49E-0512 2.30 5.93E-05
68 1400
1
7
13

December 19, 2011 MwRSF Report No. TRP-03-251-11
153
Appendix G. 1V:2H Divided Urban Arterial

December 19, 2011 MwRSF Report No. TRP-03-251-11
154
Degree of Curvature
Grade (%)
Length of Feature (ft)
Height of Feature (ft)
Offset (ft)
SI b
2 1.99 5.98E-067 1.98 4.17E-0612 1.97 2.72E-062 2.28 5.45E-067 2.30 3.76E-0612 2.30 2.59E-062 2.29 5.61E-067 2.30 3.88E-0612 2.30 2.77E-062 1.97 2.37E-057 1.98 1.66E-0512 1.97 1.18E-052 2.30 1.92E-057 2.29 1.41E-0512 2.29 1.00E-052 2.29 1.99E-057 2.30 1.41E-0512 2.29 1.02E-052 1.98 4.03E-057 1.98 2.91E-0512 1.98 2.06E-052 2.29 3.40E-057 2.29 2.49E-0512 2.29 1.74E-052 2.29 3.44E-057 2.30 2.48E-0512 2.29 1.76E-052 1.98 6.62E-067 1.98 4.56E-0612 1.98 3.11E-062 2.29 6.15E-067 2.28 4.28E-0612 2.28 2.99E-062 2.29 6.36E-067 2.29 4.43E-0612 2.28 3.09E-062 1.98 2.61E-057 1.98 1.85E-0512 1.97 1.34E-05
0
3
0
800 1
1400
1
7
13
200
1
7
13
200
1
7
13
800
1
7
13

December 19, 2011 MwRSF Report No. TRP-03-251-11
155
Degree of Curvature
Grade (%)
Length of Feature (ft)
Height of Feature (ft)
Offset (ft)
SI b
2 2.30 2.18E-057 2.30 1.57E-0512 2.29 1.13E-052 2.29 2.31E-057 2.29 1.63E-0512 2.29 1.14E-052 1.98 4.55E-057 1.98 3.29E-0512 1.98 2.36E-052 2.29 3.81E-057 2.29 2.80E-0512 2.29 1.98E-052 2.29 3.88E-057 2.29 2.83E-0512 2.30 1.95E-052 1.99 8.88E-067 1.97 6.25E-0612 1.98 4.16E-062 2.30 8.24E-067 2.27 5.88E-0612 2.29 3.98E-062 2.29 8.48E-067 2.29 5.90E-0612 2.29 4.15E-062 1.98 3.44E-057 1.98 2.49E-0512 1.97 1.76E-052 2.29 2.98E-057 2.29 2.14E-0512 2.30 1.50E-052 2.29 3.02E-057 2.30 2.12E-0512 2.29 1.52E-052 1.97 6.07E-057 1.97 4.38E-0512 1.98 3.11E-052 2.29 5.09E-057 2.28 3.76E-0512 2.29 2.64E-05
3
6
0
1400
1
7
200
1
7
13
800
1
7
13
800
7
13
1400
1
7
13

December 19, 2011 MwRSF Report No. TRP-03-251-11
156
Degree of Curvature
Grade (%)
Length of Feature (ft)
Height of Feature (ft)
Offset (ft)
SI b
2 2.30 5.08E-057 2.30 3.72E-0512 2.29 2.64E-052 1.97 1.12E-057 1.99 7.27E-0612 1.97 5.05E-062 2.31 9.16E-067 2.29 6.14E-0612 2.29 3.87E-062 2.28 9.40E-067 2.28 6.24E-0612 2.30 3.99E-062 1.99 4.49E-057 1.98 3.27E-0512 1.97 2.28E-052 2.29 3.84E-057 2.29 2.73E-0512 2.30 1.87E-052 2.29 3.81E-057 2.30 2.66E-0512 2.29 1.91E-052 1.98 7.80E-057 1.97 5.72E-0512 1.98 3.95E-052 2.29 6.50E-057 2.29 4.72E-0512 2.29 3.27E-052 2.29 6.56E-057 2.30 4.71E-0512 2.29 3.31E-052 1.97 1.25E-057 1.97 8.04E-0612 1.98 5.06E-062 2.31 1.01E-057 2.30 6.76E-0612 2.29 4.45E-062 2.29 1.04E-057 2.28 7.00E-0612 2.29 4.52E-06
6
0
3
4
0
200
1
7
13
800
1
7
13
1400
1
7
13
1400 13
200
1
7
13

December 19, 2011 MwRSF Report No. TRP-03-251-11
157
Degree of Curvature
Grade (%)
Length of Feature (ft)
Height of Feature (ft)
Offset (ft)
SI b
2 1.97 5.18E-057 1.97 3.67E-0512 1.98 2.52E-052 2.29 4.29E-057 2.29 3.06E-0512 2.29 2.14E-052 2.28 4.31E-057 2.29 3.08E-0512 2.30 2.14E-052 1.98 8.81E-057 1.98 6.28E-0512 1.97 4.51E-052 2.29 7.41E-057 2.30 5.28E-0512 2.29 3.69E-052 2.29 7.33E-057 2.29 5.29E-0512 2.29 3.69E-052 1.98 1.65E-057 1.98 1.06E-0512 1.98 6.87E-062 2.30 1.35E-057 2.29 9.41E-0612 2.30 5.81E-062 2.29 1.39E-057 2.29 9.29E-0612 2.30 5.95E-062 1.98 6.89E-057 1.98 4.87E-0512 1.98 3.49E-052 2.29 5.71E-057 2.29 4.10E-0512 2.29 2.84E-052 2.29 5.68E-057 2.30 3.99E-0512 2.29 2.86E-052 1.98 1.17E-047 1.98 8.38E-0512 1.98 5.95E-05
6
4
3
800
1
7
13
1400 1
1400
1
7
13
200
1
7
13
800
1
7
13

December 19, 2011 MwRSF Report No. TRP-03-251-11
158
Degree of Curvature
Grade (%)
Length of Feature (ft)
Height of Feature (ft)
Offset (ft)
SI b
2 2.30 9.73E-057 2.29 7.07E-0512 2.29 4.92E-052 2.29 9.89E-057 2.29 7.00E-0512 2.30 4.90E-052 1.97 1.59E-057 1.98 1.04E-0512 1.98 6.12E-062 2.27 1.35E-057 2.30 8.28E-0612 2.27 5.38E-062 2.29 1.33E-057 2.30 8.39E-0612 2.30 5.23E-062 1.98 5.87E-057 1.99 4.17E-0512 1.98 2.95E-052 2.29 5.03E-057 2.29 3.50E-0512 2.29 2.52E-052 2.29 5.06E-057 2.30 3.51E-0512 2.29 2.48E-052 1.98 9.43E-057 1.97 6.82E-0512 1.97 4.81E-052 2.29 7.91E-057 2.29 5.66E-0512 2.29 4.01E-052 2.29 7.96E-057 2.29 5.61E-0512 2.29 3.98E-052 1.98 1.79E-057 1.97 1.15E-0512 1.98 7.07E-062 2.29 1.44E-057 2.30 9.71E-0612 2.30 5.90E-06
6
0
3
8
4
200
1
7
800
1
7
13
1400
1
7
13
1400
7
13
200
1
7
13

December 19, 2011 MwRSF Report No. TRP-03-251-11
159
Degree of Curvature
Grade (%)
Length of Feature (ft)
Height of Feature (ft)
Offset (ft)
SI b
2 2.29 1.45E-057 2.29 9.52E-0612 2.29 5.92E-062 1.97 6.83E-057 1.98 4.81E-0512 1.98 3.36E-052 2.30 5.57E-057 2.29 3.98E-0512 2.30 2.75E-052 2.28 5.66E-057 2.29 4.07E-0512 2.28 2.86E-052 1.98 1.07E-047 1.98 7.66E-0512 1.98 5.34E-052 2.29 9.00E-057 2.30 6.34E-0512 2.29 4.53E-052 2.29 8.97E-057 2.29 6.45E-0512 2.29 4.49E-052 1.97 2.38E-057 1.97 1.53E-0512 1.99 9.12E-062 2.28 2.09E-057 2.30 1.27E-0512 2.29 7.74E-062 2.29 2.03E-057 2.28 1.29E-0512 2.30 7.65E-062 1.98 8.92E-057 1.98 6.29E-0512 1.98 4.41E-052 2.30 7.42E-057 2.29 5.41E-0512 2.29 3.74E-052 2.29 7.55E-057 2.29 5.33E-0512 2.29 3.77E-05
3
6
8
800
1
7
13
1400
1
7
13
200
1
7
13
200 13
800
1
7
13

December 19, 2011 MwRSF Report No. TRP-03-251-11
160
Degree of Curvature
Grade (%)
Length of Feature (ft)
Height of Feature (ft)
Offset (ft)
SI b
2 1.98 1.42E-047 1.98 1.03E-0412 1.97 7.25E-052 2.29 1.18E-047 2.29 8.51E-0512 2.29 6.00E-052 2.29 1.16E-047 2.29 8.49E-0512 2.30 5.93E-05
68 1400
1
7
13

December 19, 2011 MwRSF Report No. TRP-03-251-11
161
Appendix H. 1V:2H Urban Local

December 19, 2011 MwRSF Report No. TRP-03-251-11
162
Degree of Curvature
Grade (%)
Length of Feature (ft)
Height of Feature (ft)
Offset (ft)
SI b
2 2.43 3.69E-057 2.43 2.49E-0512 2.45 1.61E-052 2.66 3.53E-057 2.67 2.35E-0512 2.66 1.66E-052 2.82 3.51E-057 2.82 2.31E-0512 2.82 1.59E-052 2.43 1.35E-047 2.43 1.01E-0412 2.43 6.68E-052 2.65 1.27E-047 2.67 8.83E-0512 2.65 6.42E-052 2.82 1.16E-047 2.83 8.31E-0512 2.82 5.93E-052 2.44 2.33E-047 2.43 1.75E-0412 2.43 1.22E-042 2.65 2.19E-047 2.65 1.63E-0412 2.66 1.11E-042 2.81 1.99E-047 2.82 1.46E-0412 2.82 1.03E-042 2.44 5.82E-057 2.42 4.08E-0512 2.43 2.46E-052 2.67 5.33E-057 2.65 3.68E-0512 2.67 2.39E-052 2.81 5.08E-057 2.83 3.55E-0512 2.81 2.50E-052 2.43 2.02E-047 2.43 1.45E-0412 2.44 1.03E-04
800 1
1400
1
7
13
200
1
7
13
200
1
7
13
800
1
7
13
0
6
0

December 19, 2011 MwRSF Report No. TRP-03-251-11
163
Degree of Curvature
Grade (%)
Length of Feature (ft)
Height of Feature (ft)
Offset (ft)
SI b
2 2.65 1.90E-047 2.66 1.35E-0412 2.65 9.71E-052 2.82 1.71E-047 2.81 1.26E-0412 2.81 9.14E-052 2.43 3.55E-047 2.44 2.54E-0412 2.43 1.86E-042 2.66 3.22E-047 2.65 2.36E-0412 2.66 1.65E-042 2.82 2.98E-047 2.82 2.19E-0412 2.82 1.59E-042 2.43 5.44E-057 2.43 3.62E-0512 2.43 2.49E-052 2.66 5.12E-057 2.66 3.58E-0512 2.66 2.54E-052 2.82 4.87E-057 2.83 3.56E-0512 2.82 2.41E-052 2.44 2.04E-047 2.43 1.47E-0412 2.44 1.02E-042 2.66 1.82E-047 2.66 1.36E-0412 2.67 9.44E-052 2.83 1.73E-047 2.82 1.28E-0412 2.82 8.97E-052 2.44 3.51E-047 2.43 2.59E-0412 2.43 1.85E-042 2.66 3.21E-047 2.66 2.33E-0412 2.65 1.70E-04
1400
1
7
200
1
7
13
800
1
7
13
800
7
13
1400
1
7
13
6
12
0

December 19, 2011 MwRSF Report No. TRP-03-251-11
164
Degree of Curvature
Grade (%)
Length of Feature (ft)
Height of Feature (ft)
Offset (ft)
SI b
2 2.82 2.97E-047 2.82 2.22E-0412 2.82 1.57E-042 2.43 3.63E-057 2.43 2.36E-0512 2.43 1.59E-052 2.66 3.45E-057 2.65 2.31E-0512 2.65 1.53E-052 2.81 3.19E-057 2.83 2.05E-0512 2.80 1.36E-052 2.42 1.44E-047 2.43 1.00E-0412 2.42 7.13E-052 2.65 1.31E-047 2.66 9.31E-0512 2.66 6.38E-052 2.83 1.24E-047 2.82 8.60E-0512 2.82 6.01E-052 2.43 2.42E-047 2.43 1.77E-0412 2.43 1.28E-042 2.66 2.15E-047 2.65 1.59E-0412 2.66 1.11E-042 2.82 2.03E-047 2.81 1.50E-0412 2.81 1.05E-042 2.42 5.79E-057 2.42 3.58E-0512 2.44 2.42E-052 2.66 5.31E-057 2.65 3.32E-0512 2.68 2.18E-052 2.82 5.02E-057 2.81 3.41E-0512 2.83 2.15E-05
200
1
7
13
800
1
7
13
1400
1
7
13
1400 13
200
1
7
13
12
0
6
3
0
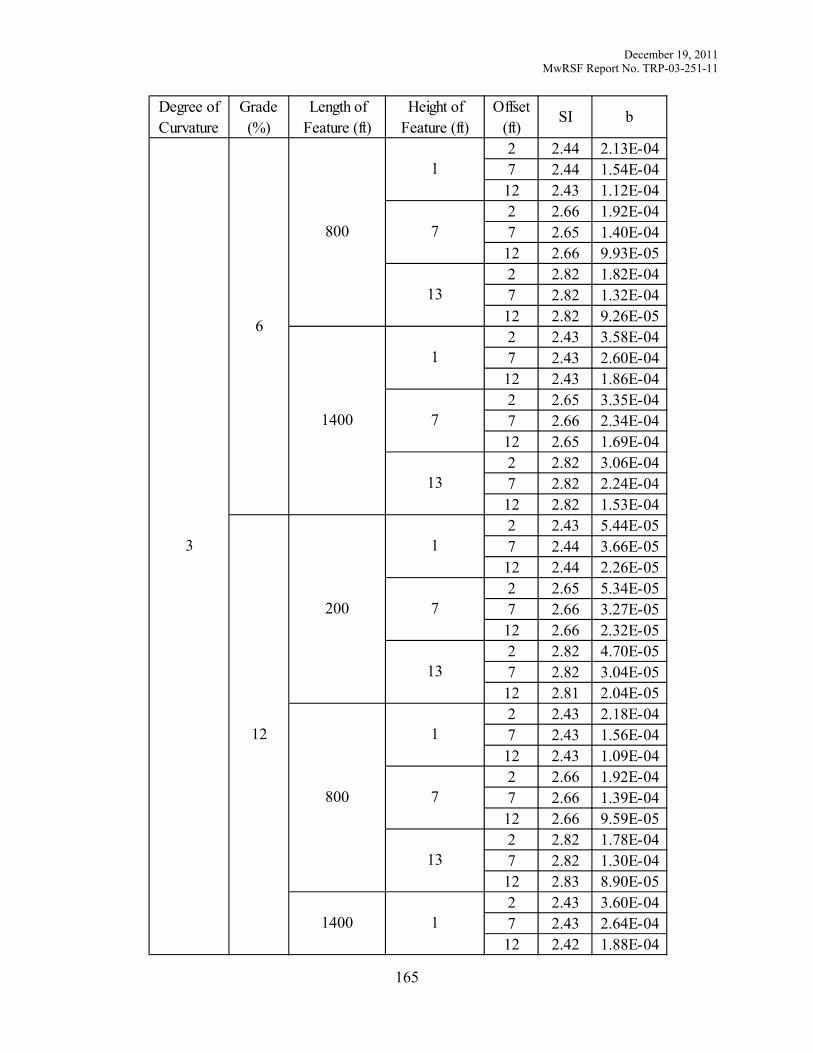
December 19, 2011 MwRSF Report No. TRP-03-251-11
165
Degree of Curvature
Grade (%)
Length of Feature (ft)
Height of Feature (ft)
Offset (ft)
SI b
2 2.44 2.13E-047 2.44 1.54E-0412 2.43 1.12E-042 2.66 1.92E-047 2.65 1.40E-0412 2.66 9.93E-052 2.82 1.82E-047 2.82 1.32E-0412 2.82 9.26E-052 2.43 3.58E-047 2.43 2.60E-0412 2.43 1.86E-042 2.65 3.35E-047 2.66 2.34E-0412 2.65 1.69E-042 2.82 3.06E-047 2.82 2.24E-0412 2.82 1.53E-042 2.43 5.44E-057 2.44 3.66E-0512 2.44 2.26E-052 2.65 5.34E-057 2.66 3.27E-0512 2.66 2.32E-052 2.82 4.70E-057 2.82 3.04E-0512 2.81 2.04E-052 2.43 2.18E-047 2.43 1.56E-0412 2.43 1.09E-042 2.66 1.92E-047 2.66 1.39E-0412 2.66 9.59E-052 2.82 1.78E-047 2.82 1.30E-0412 2.83 8.90E-052 2.43 3.60E-047 2.43 2.64E-0412 2.42 1.88E-04
800
1
7
13
1400 1
1400
1
7
13
200
1
7
13
800
1
7
13
6
12
3

December 19, 2011 MwRSF Report No. TRP-03-251-11
166
Degree of Curvature
Grade (%)
Length of Feature (ft)
Height of Feature (ft)
Offset (ft)
SI b
2 2.65 3.32E-047 2.66 2.37E-0412 2.66 1.69E-042 2.82 3.05E-047 2.82 2.29E-0412 2.81 1.58E-042 2.43 1.11E-047 2.42 7.50E-0512 2.42 5.07E-052 2.65 1.01E-047 2.66 7.14E-0512 2.66 4.89E-052 2.84 9.86E-057 2.81 6.49E-0512 2.84 4.19E-052 2.43 4.23E-047 2.43 3.14E-0412 2.42 2.15E-042 2.66 3.79E-047 2.66 2.80E-0412 2.66 1.96E-042 2.82 3.67E-047 2.82 2.58E-0412 2.83 1.83E-042 2.44 6.90E-047 2.43 5.02E-0412 2.43 3.60E-042 2.65 6.48E-047 2.65 4.69E-0412 2.65 3.32E-042 2.81 5.89E-047 2.82 4.30E-0412 2.81 3.09E-042 2.43 1.74E-047 2.43 1.10E-0412 2.44 7.24E-052 2.66 1.51E-047 2.67 1.04E-0412 2.64 6.63E-05
200
1
7
800
1
7
13
1400
1
7
13
1400
7
13
200
1
7
13
12
0
6
6
3

December 19, 2011 MwRSF Report No. TRP-03-251-11
167
Degree of Curvature
Grade (%)
Length of Feature (ft)
Height of Feature (ft)
Offset (ft)
SI b
2 2.82 1.56E-047 2.82 1.03E-0412 2.81 6.88E-052 2.43 6.52E-047 2.44 4.69E-0412 2.42 3.37E-042 2.66 5.79E-047 2.66 4.21E-0412 2.65 3.01E-042 2.83 5.53E-047 2.82 3.90E-0412 2.82 2.69E-042 2.43 1.03E-037 2.44 7.70E-0412 2.43 5.39E-042 2.66 9.57E-047 2.65 7.00E-0412 2.65 4.87E-042 2.82 8.70E-047 2.82 6.43E-0412 2.82 4.54E-042 2.44 1.61E-047 2.42 1.15E-0412 2.43 7.39E-052 2.65 1.56E-047 2.65 1.08E-0412 2.68 7.00E-052 2.82 1.45E-047 2.80 9.67E-0512 2.81 6.51E-052 2.43 6.49E-047 2.43 4.69E-0412 2.42 3.28E-042 2.65 5.80E-047 2.65 4.21E-0412 2.66 3.01E-042 2.82 5.37E-047 2.81 3.97E-0412 2.81 2.79E-04
800
1
7
13
1400
1
7
13
200
1
7
13
200 13
800
1
7
13
12
6
6

December 19, 2011 MwRSF Report No. TRP-03-251-11
168
Degree of Curvature
Grade (%)
Length of Feature (ft)
Height of Feature (ft)
Offset (ft)
SI b
2 2.43 1.04E-037 2.44 7.45E-0412 2.43 5.42E-042 2.65 9.71E-047 2.65 6.88E-0412 2.66 4.87E-042 2.82 8.80E-047 2.82 6.40E-0412 2.82 4.59E-04
1400
1
7
13
126

December 19, 2011 MwRSF Report No. TRP-03-251-11
169
Appendix I. 1V:3H Freeway

December 19, 2011 MwRSF Report No. TRP-03-251-11
170
Degree of Curvature
Grade (%)
Length of Feature (ft)
Height of Feature (ft)
Offset (ft)
SI b
2 2.48 7.74E-067 2.49 5.68E-0612 2.48 4.38E-062 2.70 8.51E-067 2.72 6.81E-0612 2.71 4.85E-062 2.97 8.66E-067 2.98 6.63E-0612 2.98 5.57E-062 2.48 3.07E-057 2.49 2.48E-0512 2.49 1.96E-052 2.71 3.09E-057 2.72 2.47E-0512 2.72 1.93E-052 2.97 2.99E-057 2.98 2.29E-0512 2.98 1.87E-052 2.48 5.50E-057 2.48 4.33E-0512 2.49 3.51E-052 2.73 5.34E-057 2.72 4.17E-0512 2.72 3.42E-052 2.98 4.98E-057 2.98 3.91E-0512 2.98 3.23E-052 2.48 7.90E-067 2.48 5.87E-0612 2.50 4.29E-062 2.72 8.79E-067 2.71 6.85E-0612 2.72 4.78E-062 2.97 8.53E-067 2.97 6.87E-0612 2.98 5.51E-062 2.48 3.11E-057 2.48 2.47E-0512 2.48 2.03E-05
800 1
1400
1
7
13
200
1
7
13
200
1
7
13
800
1
7
13
0
0
2

December 19, 2011 MwRSF Report No. TRP-03-251-11
171
Degree of Curvature
Grade (%)
Length of Feature (ft)
Height of Feature (ft)
Offset (ft)
SI b
2 2.72 3.15E-057 2.71 2.38E-0512 2.72 1.95E-052 2.98 2.91E-057 2.97 2.29E-0512 2.98 1.88E-052 2.48 5.55E-057 2.48 4.34E-0512 2.48 3.54E-052 2.72 5.35E-057 2.72 4.26E-0512 2.71 3.41E-052 2.98 4.99E-057 2.98 3.94E-0512 2.98 3.19E-052 2.49 8.56E-067 2.49 6.40E-0612 2.49 4.76E-062 2.72 9.71E-067 2.71 7.48E-0612 2.71 5.53E-062 2.98 1.00E-057 2.99 7.69E-0612 2.98 6.15E-062 2.48 3.54E-057 2.48 2.75E-0512 2.48 2.27E-052 2.72 3.52E-057 2.71 2.75E-0512 2.72 2.16E-052 2.98 3.21E-057 2.98 2.63E-0512 2.98 2.12E-052 2.48 6.29E-057 2.49 4.87E-0512 2.48 3.94E-052 2.71 6.10E-057 2.72 4.76E-0512 2.71 3.88E-05
1400
1
7
200
1
7
13
800
1
7
13
800
7
13
1400
1
7
13
0
2
3
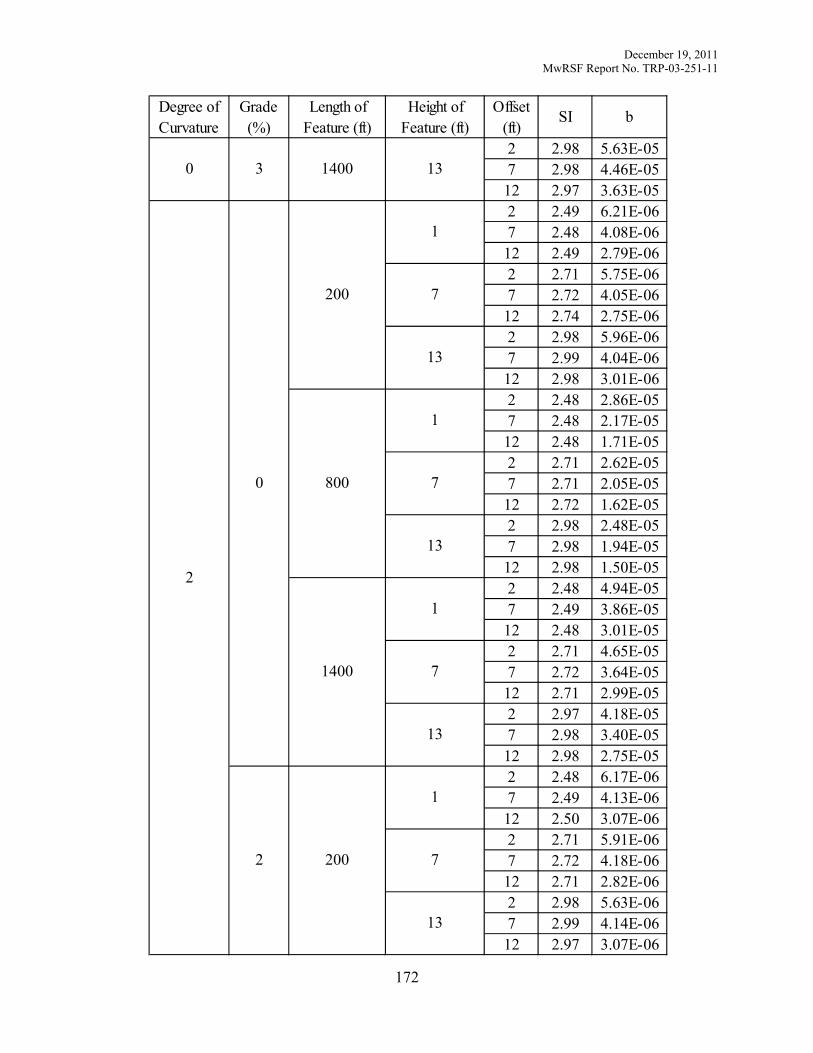
December 19, 2011 MwRSF Report No. TRP-03-251-11
172
Degree of Curvature
Grade (%)
Length of Feature (ft)
Height of Feature (ft)
Offset (ft)
SI b
2 2.98 5.63E-057 2.98 4.46E-0512 2.97 3.63E-052 2.49 6.21E-067 2.48 4.08E-0612 2.49 2.79E-062 2.71 5.75E-067 2.72 4.05E-0612 2.74 2.75E-062 2.98 5.96E-067 2.99 4.04E-0612 2.98 3.01E-062 2.48 2.86E-057 2.48 2.17E-0512 2.48 1.71E-052 2.71 2.62E-057 2.71 2.05E-0512 2.72 1.62E-052 2.98 2.48E-057 2.98 1.94E-0512 2.98 1.50E-052 2.48 4.94E-057 2.49 3.86E-0512 2.48 3.01E-052 2.71 4.65E-057 2.72 3.64E-0512 2.71 2.99E-052 2.97 4.18E-057 2.98 3.40E-0512 2.98 2.75E-052 2.48 6.17E-067 2.49 4.13E-0612 2.50 3.07E-062 2.71 5.91E-067 2.72 4.18E-0612 2.71 2.82E-062 2.98 5.63E-067 2.99 4.14E-0612 2.97 3.07E-06
200
1
7
13
800
1
7
13
1400
1
7
13
1400 13
200
1
7
13
0 3
2
0
2

December 19, 2011 MwRSF Report No. TRP-03-251-11
173
Degree of Curvature
Grade (%)
Length of Feature (ft)
Height of Feature (ft)
Offset (ft)
SI b
2 2.48 2.80E-057 2.49 2.15E-0512 2.50 1.74E-052 2.71 2.66E-057 2.72 2.02E-0512 2.72 1.61E-052 2.98 2.46E-057 2.98 1.93E-0512 2.97 1.53E-052 2.48 4.87E-057 2.48 3.87E-0512 2.48 3.09E-052 2.72 4.66E-057 2.71 3.60E-0512 2.72 2.93E-052 2.98 4.23E-057 2.97 3.33E-0512 2.98 2.69E-052 2.48 6.85E-067 2.50 4.68E-0612 2.48 2.99E-062 2.72 6.49E-067 2.71 4.57E-0612 2.72 3.18E-062 2.97 6.53E-067 2.98 4.56E-0612 2.98 3.32E-062 2.48 3.17E-057 2.48 2.41E-0512 2.48 1.93E-052 2.71 3.00E-057 2.71 2.30E-0512 2.72 1.80E-052 2.98 2.82E-057 2.98 2.15E-0512 2.98 1.68E-052 2.48 5.51E-057 2.49 4.28E-0512 2.48 3.48E-05
800
1
7
13
1400 1
1400
1
7
13
200
1
7
13
800
1
7
13
2
2
3

December 19, 2011 MwRSF Report No. TRP-03-251-11
174
Degree of Curvature
Grade (%)
Length of Feature (ft)
Height of Feature (ft)
Offset (ft)
SI b
2 2.72 5.16E-057 2.72 4.12E-0512 2.71 3.34E-052 2.98 4.80E-057 2.98 3.75E-0512 2.98 3.00E-052 2.48 6.92E-067 2.49 4.40E-0612 2.50 3.32E-062 2.73 6.56E-067 2.71 4.19E-0612 2.72 2.94E-062 2.98 6.07E-067 3.00 4.07E-0612 2.98 2.81E-062 2.49 2.97E-057 2.48 2.29E-0512 2.48 1.81E-052 2.71 2.87E-057 2.73 2.21E-0512 2.71 1.70E-052 2.98 2.57E-057 2.97 2.04E-0512 2.98 1.58E-052 2.48 5.08E-057 2.48 3.95E-0512 2.48 3.23E-052 2.72 4.84E-057 2.72 3.70E-0512 2.72 3.04E-052 2.98 4.44E-057 2.97 3.46E-0512 2.98 2.82E-052 2.49 6.74E-067 2.48 4.79E-0612 2.49 3.14E-062 2.73 6.45E-067 2.71 4.19E-0612 2.71 3.07E-06
200
1
7
800
1
7
13
1400
1
7
13
1400
7
13
200
1
7
13
2 3
3
0
2

December 19, 2011 MwRSF Report No. TRP-03-251-11
175
Degree of Curvature
Grade (%)
Length of Feature (ft)
Height of Feature (ft)
Offset (ft)
SI b
2 2.98 6.32E-067 2.97 4.08E-0612 2.96 3.13E-062 2.48 3.02E-057 2.48 2.28E-0512 2.48 1.79E-052 2.71 2.87E-057 2.72 2.18E-0512 2.72 1.73E-052 2.98 2.62E-057 2.97 1.99E-0512 2.99 1.58E-052 2.49 5.12E-057 2.48 4.02E-0512 2.49 3.22E-052 2.72 4.86E-057 2.72 3.82E-0512 2.72 3.06E-052 2.98 4.45E-057 2.97 3.45E-0512 2.97 2.79E-052 2.49 7.69E-067 2.48 4.92E-0612 2.48 3.53E-062 2.72 7.59E-067 2.72 4.64E-0612 2.71 3.32E-062 2.97 6.48E-067 2.99 4.55E-0612 2.97 3.45E-062 2.49 3.38E-057 2.48 2.60E-0512 2.48 2.02E-052 2.72 3.15E-057 2.72 2.42E-0512 2.71 1.91E-052 2.97 2.97E-057 2.98 2.26E-0512 2.99 1.75E-05
800
1
7
13
1400
1
7
13
200
1
7
13
200 13
800
1
7
13
3
2
3

December 19, 2011 MwRSF Report No. TRP-03-251-11
176
Degree of Curvature
Grade (%)
Length of Feature (ft)
Height of Feature (ft)
Offset (ft)
SI b
2 2.49 5.74E-057 2.49 4.49E-0512 2.49 3.61E-052 2.72 5.43E-057 2.72 4.20E-0512 2.72 3.39E-052 2.98 4.94E-057 2.98 3.84E-0512 2.98 3.20E-05
1400
1
7
13
3 3

December 19, 2011 MwRSF Report No. TRP-03-251-11
177
Appendix J. 1V:3H Undivided Rural Arterial

December 19, 2011 MwRSF Report No. TRP-03-251-11
178
Degree of Curvature
Grade (%)
Length of Feature (ft)
Height of Feature (ft)
Offset (ft)
SI b
2 1.97 5.41E-067 1.96 3.81E-0612 1.97 2.66E-062 2.17 5.94E-067 2.17 4.20E-0612 2.15 2.89E-062 2.37 5.46E-067 2.37 3.79E-0612 2.37 2.66E-062 1.98 1.99E-057 1.98 1.42E-0512 1.97 1.02E-052 2.16 2.00E-057 2.16 1.42E-0512 2.16 1.02E-052 2.38 1.75E-057 2.37 1.28E-0512 2.37 9.14E-062 1.98 3.49E-057 1.98 2.54E-0512 1.98 1.78E-052 2.17 3.35E-057 2.16 2.48E-0512 2.16 1.73E-052 2.37 3.03E-057 2.37 2.20E-0512 2.38 1.54E-052 1.98 6.13E-067 1.98 4.22E-0612 1.98 3.14E-062 2.17 6.47E-067 2.16 4.72E-0612 2.17 3.20E-062 2.37 6.13E-067 2.38 4.11E-0612 2.37 3.13E-062 1.98 2.27E-057 1.98 1.61E-0512 1.98 1.15E-05
800 1
1400
1
7
13
200
1
7
13
200
1
7
13
800
1
7
13
0
0
3

December 19, 2011 MwRSF Report No. TRP-03-251-11
179
Degree of Curvature
Grade (%)
Length of Feature (ft)
Height of Feature (ft)
Offset (ft)
SI b
2 2.16 2.22E-057 2.15 1.63E-0512 2.16 1.14E-052 2.38 1.97E-057 2.38 1.42E-0512 2.38 1.02E-052 1.97 3.86E-057 1.97 2.83E-0512 1.98 1.98E-052 2.17 3.85E-057 2.17 2.79E-0512 2.16 1.98E-052 2.37 3.36E-057 2.38 2.46E-0512 2.37 1.72E-052 1.97 8.04E-067 1.98 5.43E-0612 1.98 3.97E-062 2.17 8.87E-067 2.16 6.33E-0612 2.17 4.35E-062 2.38 7.99E-067 2.38 5.50E-0612 2.37 4.02E-062 1.98 3.01E-057 1.99 2.15E-0512 1.98 1.51E-052 2.16 2.99E-057 2.16 2.16E-0512 2.16 1.51E-052 2.37 2.66E-057 2.37 1.92E-0512 2.36 1.37E-052 1.98 5.20E-057 1.98 3.74E-0512 1.98 2.68E-052 2.16 5.07E-057 2.16 3.69E-0512 2.17 2.60E-05
1400
1
7
200
1
7
13
800
1
7
13
800
7
13
1400
1
7
13
0
3
6

December 19, 2011 MwRSF Report No. TRP-03-251-11
180
Degree of Curvature
Grade (%)
Length of Feature (ft)
Height of Feature (ft)
Offset (ft)
SI b
2 2.37 4.49E-057 2.37 3.28E-0512 2.37 2.35E-052 1.98 4.44E-067 1.98 2.79E-0612 1.96 1.71E-062 2.19 4.20E-067 2.17 2.60E-0612 2.17 1.72E-062 2.38 3.88E-067 2.35 2.38E-0612 2.39 1.48E-062 1.97 1.81E-057 1.98 1.27E-0512 1.98 8.80E-062 2.16 1.74E-057 2.16 1.23E-0512 2.17 8.31E-062 2.38 1.53E-057 2.37 1.06E-0512 2.38 7.38E-062 1.98 3.06E-057 1.98 2.16E-0512 1.97 1.54E-052 2.16 2.93E-057 2.16 2.11E-0512 2.17 1.44E-052 2.37 2.57E-057 2.37 1.87E-0512 2.37 1.28E-052 1.98 5.06E-067 1.99 2.95E-0612 1.99 1.94E-062 2.16 4.83E-067 2.15 3.10E-0612 2.17 1.87E-062 2.37 4.40E-067 2.36 2.52E-0612 2.38 1.69E-06
200
1
7
13
800
1
7
13
1400
1
7
13
1400 13
200
1
7
13
0 6
3
0
3

December 19, 2011 MwRSF Report No. TRP-03-251-11
181
Degree of Curvature
Grade (%)
Length of Feature (ft)
Height of Feature (ft)
Offset (ft)
SI b
2 1.97 2.03E-057 1.98 1.46E-0512 1.98 9.81E-062 2.17 1.90E-057 2.17 1.37E-0512 2.16 9.84E-062 2.37 1.70E-057 2.37 1.21E-0512 2.37 8.34E-062 1.98 3.42E-057 1.99 2.41E-0512 1.97 1.71E-052 2.17 3.29E-057 2.16 2.32E-0512 2.16 1.66E-052 2.38 2.85E-057 2.37 2.07E-0512 2.38 1.44E-052 1.98 6.78E-067 1.98 3.86E-0612 1.97 2.65E-062 2.15 6.67E-067 2.16 3.93E-0612 2.16 2.49E-062 2.37 5.89E-067 2.35 3.51E-0612 2.38 2.21E-062 1.98 2.75E-057 1.98 1.91E-0512 1.97 1.32E-052 2.17 2.58E-057 2.17 1.77E-0512 2.17 1.26E-052 2.37 2.27E-057 2.37 1.60E-0512 2.38 1.10E-052 1.98 4.56E-057 1.98 3.32E-0512 1.98 2.26E-05
800
1
7
13
1400 1
1400
1
7
13
200
1
7
13
800
1
7
13
3
3
6

December 19, 2011 MwRSF Report No. TRP-03-251-11
182
Degree of Curvature
Grade (%)
Length of Feature (ft)
Height of Feature (ft)
Offset (ft)
SI b
2 2.16 4.33E-057 2.17 3.09E-0512 2.17 2.18E-052 2.37 3.86E-057 2.37 2.74E-0512 2.38 1.91E-052 1.98 1.31E-057 1.98 8.58E-0612 1.97 5.30E-062 2.17 1.28E-057 2.16 9.08E-0612 2.17 5.18E-062 2.38 1.08E-057 2.36 7.38E-0612 2.36 4.77E-062 1.98 5.30E-057 1.97 3.91E-0512 1.98 2.66E-052 2.17 5.05E-057 2.16 3.78E-0512 2.16 2.57E-052 2.37 4.51E-057 2.37 3.17E-0512 2.36 2.31E-052 1.98 8.72E-057 1.98 6.21E-0512 1.98 4.44E-052 2.16 8.25E-057 2.16 5.83E-0512 2.18 4.17E-052 2.38 7.22E-057 2.37 5.17E-0512 2.37 3.75E-052 1.98 1.52E-057 1.97 9.99E-0612 1.98 6.18E-062 2.17 1.47E-057 2.15 9.75E-0612 2.16 6.19E-06
200
1
7
800
1
7
13
1400
1
7
13
1400
7
13
200
1
7
13
3 6
6
0
3

December 19, 2011 MwRSF Report No. TRP-03-251-11
183
Degree of Curvature
Grade (%)
Length of Feature (ft)
Height of Feature (ft)
Offset (ft)
SI b
2 2.38 1.26E-057 2.39 8.00E-0612 2.37 5.15E-062 1.98 5.95E-057 1.98 4.25E-0512 1.98 2.96E-052 2.16 5.85E-057 2.17 4.04E-0512 2.16 2.94E-052 2.37 5.00E-057 2.38 3.56E-0512 2.38 2.54E-052 1.98 1.00E-047 1.98 7.02E-0512 1.98 4.94E-052 2.16 9.35E-057 2.16 6.69E-0512 2.16 4.72E-052 2.38 8.33E-057 2.38 5.80E-0512 2.36 4.23E-052 1.97 2.10E-057 1.98 1.28E-0512 1.96 8.06E-062 2.17 1.89E-057 2.16 1.25E-0512 2.16 7.89E-062 2.37 1.69E-057 2.39 1.11E-0512 2.37 7.01E-062 1.97 8.10E-057 1.98 5.68E-0512 1.98 3.92E-052 2.17 7.46E-057 2.17 5.48E-0512 2.16 3.84E-052 2.37 6.76E-057 2.37 4.86E-0512 2.38 3.40E-05
800
1
7
13
1400
1
7
13
200
1
7
13
200 13
800
1
7
13
6
3
6

December 19, 2011 MwRSF Report No. TRP-03-251-11
184
Degree of Curvature
Grade (%)
Length of Feature (ft)
Height of Feature (ft)
Offset (ft)
SI b
2 1.98 1.31E-047 1.98 9.35E-0512 1.98 6.53E-052 2.16 1.26E-047 2.17 8.97E-0512 2.17 6.34E-052 2.37 1.11E-047 2.38 7.83E-0512 2.37 5.58E-05
1400
1
7
13
6 6

December 19, 2011 MwRSF Report No. TRP-03-251-11
185
Appendix K. 1V:3H Divided Rural Arterial

December 19, 2011 MwRSF Report No. TRP-03-251-11
186
Degree of Curvature
Grade (%)
Length of Feature (ft)
Height of Feature (ft)
Offset (ft)
SI b
2 1.99 1.09E-057 1.98 8.11E-0612 1.98 8.09E-062 2.16 1.31E-057 2.16 9.86E-0612 2.16 9.80E-062 2.38 1.28E-057 2.37 1.02E-0512 2.36 1.04E-052 1.98 4.08E-057 1.98 3.26E-0512 1.98 3.24E-052 2.17 4.26E-057 2.17 3.29E-0512 2.17 3.35E-052 2.37 3.92E-057 2.37 3.12E-0512 2.38 3.16E-052 1.98 7.24E-057 1.98 5.84E-0512 1.98 5.74E-052 2.16 7.25E-057 2.16 5.77E-0512 2.17 5.69E-052 2.37 6.56E-057 2.37 5.13E-0512 2.38 5.15E-052 1.98 1.21E-057 1.98 9.49E-0612 1.99 8.53E-062 2.16 1.48E-057 2.18 1.09E-0512 2.16 1.15E-052 2.38 1.39E-057 2.39 1.13E-0512 2.37 1.15E-052 1.98 4.69E-057 1.98 3.72E-0512 1.98 3.65E-05
800 1
1400
1
7
13
200
1
7
13
200
1
7
13
800
1
7
13
0
0
3

December 19, 2011 MwRSF Report No. TRP-03-251-11
187
Degree of Curvature
Grade (%)
Length of Feature (ft)
Height of Feature (ft)
Offset (ft)
SI b
2 2.17 4.73E-057 2.17 3.72E-0512 2.17 3.75E-052 2.37 4.37E-057 2.37 3.50E-0512 2.37 3.43E-052 1.98 8.25E-057 1.98 6.54E-0512 1.98 6.48E-052 2.16 8.03E-057 2.16 6.43E-0512 2.17 6.42E-052 2.37 7.33E-057 2.37 5.89E-0512 2.37 5.80E-052 1.99 1.60E-057 1.98 1.22E-0512 1.98 1.21E-052 2.16 2.00E-057 2.16 1.51E-0512 2.16 1.52E-052 2.36 1.95E-057 2.37 1.53E-0512 2.37 1.53E-052 1.98 6.17E-057 1.98 4.91E-0512 1.98 4.78E-052 2.16 6.39E-057 2.17 4.91E-0512 2.17 5.09E-052 2.36 5.88E-057 2.37 4.56E-0512 2.38 4.64E-052 1.98 1.08E-047 1.98 8.68E-0512 1.98 8.60E-052 2.17 1.06E-047 2.16 8.74E-0512 2.17 8.58E-05
1400
1
7
200
1
7
13
800
1
7
13
800
7
13
1400
1
7
13
0
3
6
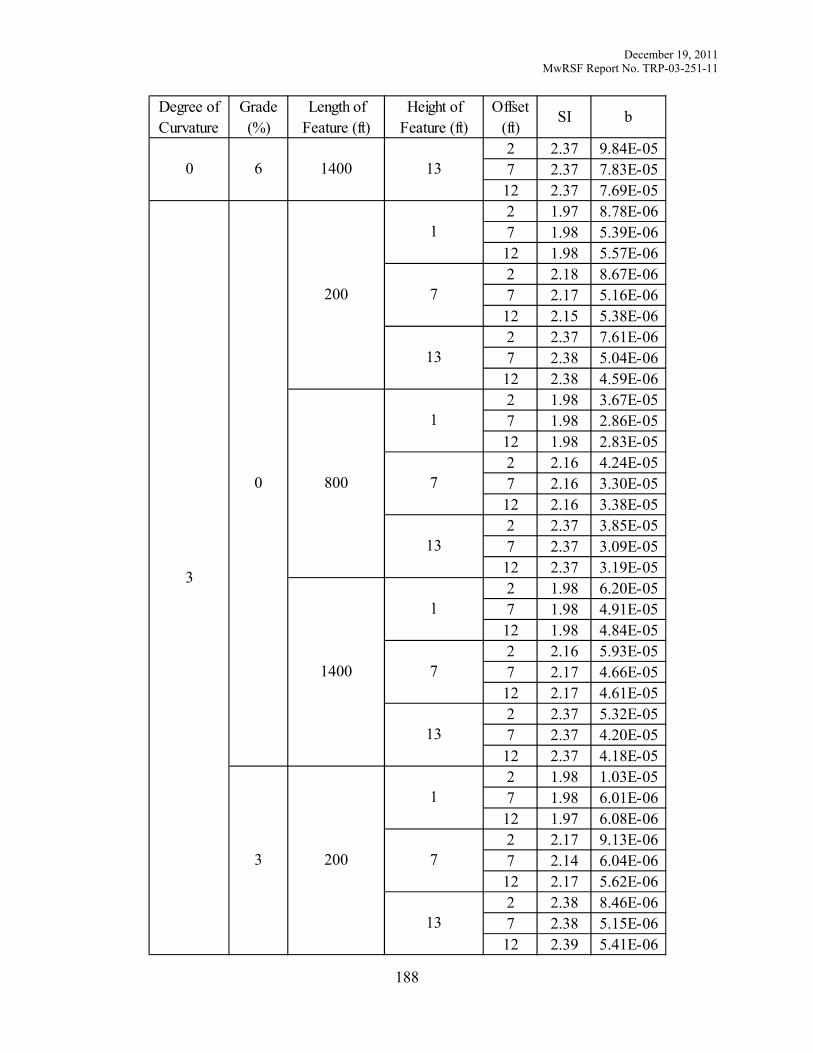
December 19, 2011 MwRSF Report No. TRP-03-251-11
188
Degree of Curvature
Grade (%)
Length of Feature (ft)
Height of Feature (ft)
Offset (ft)
SI b
2 2.37 9.84E-057 2.37 7.83E-0512 2.37 7.69E-052 1.97 8.78E-067 1.98 5.39E-0612 1.98 5.57E-062 2.18 8.67E-067 2.17 5.16E-0612 2.15 5.38E-062 2.37 7.61E-067 2.38 5.04E-0612 2.38 4.59E-062 1.98 3.67E-057 1.98 2.86E-0512 1.98 2.83E-052 2.16 4.24E-057 2.16 3.30E-0512 2.16 3.38E-052 2.37 3.85E-057 2.37 3.09E-0512 2.37 3.19E-052 1.98 6.20E-057 1.98 4.91E-0512 1.98 4.84E-052 2.16 5.93E-057 2.17 4.66E-0512 2.17 4.61E-052 2.37 5.32E-057 2.37 4.20E-0512 2.37 4.18E-052 1.98 1.03E-057 1.98 6.01E-0612 1.97 6.08E-062 2.17 9.13E-067 2.14 6.04E-0612 2.17 5.62E-062 2.38 8.46E-067 2.38 5.15E-0612 2.39 5.41E-06
200
1
7
13
800
1
7
13
1400
1
7
13
1400 13
200
1
7
13
0 6
3
0
3

December 19, 2011 MwRSF Report No. TRP-03-251-11
189
Degree of Curvature
Grade (%)
Length of Feature (ft)
Height of Feature (ft)
Offset (ft)
SI b
2 1.98 4.13E-057 1.98 3.22E-0512 1.98 3.18E-052 2.17 3.95E-057 2.17 3.04E-0512 2.16 3.04E-052 2.38 3.49E-057 2.38 2.68E-0512 2.37 2.73E-052 1.98 6.91E-057 1.98 5.50E-0512 1.98 5.40E-052 2.17 6.56E-057 2.16 5.19E-0512 2.16 5.18E-052 2.37 5.86E-057 2.38 4.57E-0512 2.37 4.66E-052 1.98 1.35E-057 1.99 7.85E-0612 1.99 7.89E-062 2.17 1.21E-057 2.15 7.55E-0612 2.19 7.21E-062 2.36 1.15E-057 2.38 7.18E-0612 2.38 7.00E-062 1.97 5.49E-057 1.98 4.23E-0512 1.97 4.33E-052 2.17 5.13E-057 2.16 4.00E-0512 2.16 4.10E-052 2.37 4.73E-057 2.38 3.54E-0512 2.37 3.65E-052 1.98 9.42E-057 1.98 7.22E-0512 1.98 7.27E-05
800
1
7
13
1400 1
1400
1
7
13
200
1
7
13
800
1
7
13
3
3
6

December 19, 2011 MwRSF Report No. TRP-03-251-11
190
Degree of Curvature
Grade (%)
Length of Feature (ft)
Height of Feature (ft)
Offset (ft)
SI b
2 2.17 8.88E-057 2.16 6.88E-0512 2.16 6.98E-052 2.36 7.91E-057 2.37 6.18E-0512 2.38 6.24E-052 1.98 2.62E-057 1.98 1.82E-0512 1.97 1.80E-052 2.16 2.38E-057 2.16 1.70E-0512 2.16 1.71E-052 2.37 2.22E-057 2.38 1.52E-0512 2.38 1.61E-052 1.98 1.05E-047 1.98 8.34E-0512 1.98 8.44E-052 2.17 1.01E-047 2.17 7.92E-0512 2.16 7.95E-052 2.36 8.98E-057 2.37 7.09E-0512 2.38 7.02E-052 1.98 1.76E-047 1.98 1.38E-0412 1.98 1.36E-042 2.16 1.65E-047 2.17 1.32E-0412 2.16 1.33E-042 2.37 1.48E-047 2.37 1.14E-0412 2.37 1.20E-042 1.99 2.85E-057 1.99 2.03E-0512 1.99 1.97E-052 2.18 2.74E-057 2.17 1.93E-0512 2.16 1.93E-05
200
1
7
800
1
7
13
1400
1
7
13
1400
7
13
200
1
7
13
3 6
6
0
3
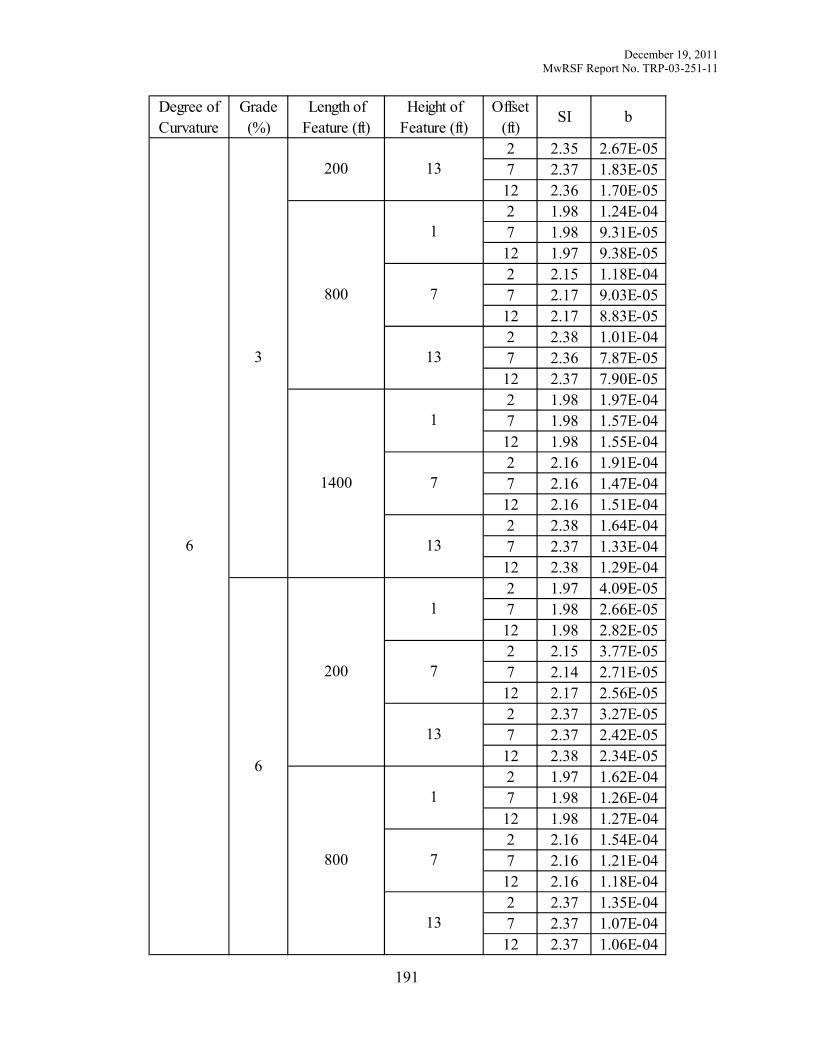
December 19, 2011 MwRSF Report No. TRP-03-251-11
191
Degree of Curvature
Grade (%)
Length of Feature (ft)
Height of Feature (ft)
Offset (ft)
SI b
2 2.35 2.67E-057 2.37 1.83E-0512 2.36 1.70E-052 1.98 1.24E-047 1.98 9.31E-0512 1.97 9.38E-052 2.15 1.18E-047 2.17 9.03E-0512 2.17 8.83E-052 2.38 1.01E-047 2.36 7.87E-0512 2.37 7.90E-052 1.98 1.97E-047 1.98 1.57E-0412 1.98 1.55E-042 2.16 1.91E-047 2.16 1.47E-0412 2.16 1.51E-042 2.38 1.64E-047 2.37 1.33E-0412 2.38 1.29E-042 1.97 4.09E-057 1.98 2.66E-0512 1.98 2.82E-052 2.15 3.77E-057 2.14 2.71E-0512 2.17 2.56E-052 2.37 3.27E-057 2.37 2.42E-0512 2.38 2.34E-052 1.97 1.62E-047 1.98 1.26E-0412 1.98 1.27E-042 2.16 1.54E-047 2.16 1.21E-0412 2.16 1.18E-042 2.37 1.35E-047 2.37 1.07E-0412 2.37 1.06E-04
800
1
7
13
1400
1
7
13
200
1
7
13
200 13
800
1
7
13
6
3
6

December 19, 2011 MwRSF Report No. TRP-03-251-11
192
Degree of Curvature
Grade (%)
Length of Feature (ft)
Height of Feature (ft)
Offset (ft)
SI b
2 1.98 2.63E-047 1.98 2.09E-0412 1.98 2.06E-042 2.17 2.54E-047 2.17 1.97E-0412 2.17 1.96E-042 2.38 2.15E-047 2.37 1.76E-0412 2.36 1.76E-04
1400
1
7
13
6 6

December 19, 2011 MwRSF Report No. TRP-03-251-11
193
Appendix L. 1V:3H Rural Local

December 19, 2011 MwRSF Report No. TRP-03-251-11
194
Degree of Curvature
Grade (%)
Length of Feature (ft)
Height of Feature (ft)
Offset (ft)
SI b
2 1.96 3.77E-057 1.95 2.70E-0512 1.96 1.87E-052 2.14 3.84E-057 2.15 2.80E-0512 2.15 1.89E-052 2.35 3.66E-057 2.35 2.52E-0512 2.35 1.81E-052 1.96 1.33E-047 1.96 9.72E-0512 1.96 6.75E-052 2.14 1.28E-047 2.14 9.17E-0512 2.14 6.43E-052 2.35 1.15E-047 2.35 8.20E-0512 2.35 5.85E-052 1.96 2.26E-047 1.96 1.71E-0412 1.96 1.20E-042 2.14 2.13E-047 2.14 1.55E-0412 2.14 1.12E-042 2.35 1.90E-047 2.35 1.39E-0412 2.35 9.88E-052 1.96 4.72E-057 1.96 3.35E-0512 1.96 2.24E-052 2.14 4.91E-057 2.14 3.41E-0512 2.14 2.42E-052 2.35 4.61E-057 2.36 3.06E-0512 2.35 2.31E-052 1.96 1.65E-047 1.96 1.20E-0412 1.96 8.61E-05
800 1
1400
1
7
13
200
1
7
13
200
1
7
13
800
1
7
13
0
0
4

December 19, 2011 MwRSF Report No. TRP-03-251-11
195
Degree of Curvature
Grade (%)
Length of Feature (ft)
Height of Feature (ft)
Offset (ft)
SI b
2 2.14 1.60E-047 2.14 1.16E-0412 2.14 8.19E-052 2.35 1.39E-047 2.35 1.05E-0412 2.35 7.34E-052 1.96 2.86E-047 1.96 2.07E-0412 1.96 1.51E-042 2.14 2.64E-047 2.14 1.97E-0412 2.14 1.39E-042 2.35 2.35E-047 2.35 1.74E-0412 2.34 1.25E-042 1.95 5.61E-057 1.96 3.99E-0512 1.96 2.72E-052 2.14 6.02E-057 2.14 4.19E-0512 2.14 3.02E-052 2.34 5.44E-057 2.36 3.79E-0512 2.35 2.60E-052 1.96 1.99E-047 1.96 1.47E-0412 1.95 1.05E-042 2.14 1.88E-047 2.14 1.37E-0412 2.14 9.80E-052 2.35 1.68E-047 2.35 1.25E-0412 2.35 8.76E-052 1.96 3.40E-047 1.96 2.50E-0412 1.96 1.78E-042 2.14 3.21E-047 2.14 2.35E-0412 2.14 1.65E-04
1400
1
7
200
1
7
13
800
1
7
13
800
7
13
1400
1
7
13
0
4
8

December 19, 2011 MwRSF Report No. TRP-03-251-11
196
Degree of Curvature
Grade (%)
Length of Feature (ft)
Height of Feature (ft)
Offset (ft)
SI b
2 2.35 2.88E-047 2.35 2.10E-0412 2.35 1.49E-042 1.96 7.19E-057 1.95 4.74E-0512 1.97 3.05E-052 2.13 6.47E-057 2.15 4.29E-0512 2.14 2.98E-052 2.35 5.64E-057 2.35 3.96E-0512 2.34 2.70E-052 1.95 2.63E-047 1.95 1.96E-0412 1.95 1.37E-042 2.15 2.43E-047 2.15 1.78E-0412 2.14 1.25E-042 2.35 2.15E-047 2.35 1.54E-0412 2.35 1.08E-042 1.96 4.52E-047 1.96 3.27E-0412 1.96 2.34E-042 2.14 4.13E-047 2.14 3.04E-0412 2.14 2.12E-042 2.35 3.76E-047 2.35 2.67E-0412 2.35 1.88E-042 1.96 8.70E-057 1.94 6.08E-0512 1.96 4.01E-052 2.14 7.67E-057 2.14 5.42E-0512 2.15 3.70E-052 2.35 6.97E-057 2.34 5.21E-0512 2.35 3.37E-05
200
1
7
13
800
1
7
13
1400
1
7
13
1400 13
200
1
7
13
0 8
4
0
4

December 19, 2011 MwRSF Report No. TRP-03-251-11
197
Degree of Curvature
Grade (%)
Length of Feature (ft)
Height of Feature (ft)
Offset (ft)
SI b
2 1.96 3.34E-047 1.96 2.42E-0412 1.96 1.69E-042 2.15 3.07E-047 2.15 2.17E-0412 2.15 1.53E-042 2.35 2.74E-047 2.35 1.95E-0412 2.35 1.36E-042 1.96 5.70E-047 1.96 4.11E-0412 1.96 2.92E-042 2.14 5.14E-047 2.14 3.80E-0412 2.14 2.64E-042 2.35 4.65E-047 2.35 3.31E-0412 2.34 2.38E-042 1.95 8.58E-057 1.97 5.97E-0512 1.95 3.92E-052 2.14 7.75E-057 2.14 5.25E-0512 2.14 3.89E-052 2.35 7.14E-057 2.35 5.01E-0512 2.35 3.29E-052 1.96 3.36E-047 1.96 2.40E-0412 1.96 1.72E-042 2.14 3.10E-047 2.14 2.25E-0412 2.14 1.51E-042 2.35 2.68E-047 2.35 1.92E-0412 2.35 1.37E-042 1.96 5.66E-047 1.96 4.11E-0412 1.96 2.91E-04
800
1
7
13
1400 1
1400
1
7
13
200
1
7
13
800
1
7
13
4
4
8

December 19, 2011 MwRSF Report No. TRP-03-251-11
198
Degree of Curvature
Grade (%)
Length of Feature (ft)
Height of Feature (ft)
Offset (ft)
SI b
2 2.13 5.24E-047 2.14 3.71E-0412 2.14 2.65E-042 2.34 4.56E-047 2.35 3.38E-0412 2.35 2.35E-042 1.96 9.75E-057 1.96 6.49E-0512 1.97 4.09E-052 2.14 9.02E-057 2.15 5.98E-0512 2.15 3.86E-052 2.34 8.34E-057 2.35 5.38E-0512 2.35 3.34E-052 1.96 3.55E-047 1.95 2.59E-0412 1.96 1.82E-042 2.14 3.27E-047 2.14 2.41E-0412 2.14 1.64E-042 2.35 2.87E-047 2.36 2.07E-0412 2.35 1.48E-042 1.96 5.76E-047 1.96 4.19E-0412 1.96 2.98E-042 2.14 5.22E-047 2.15 3.72E-0412 2.14 2.68E-042 2.35 4.69E-047 2.35 3.38E-0412 2.35 2.40E-042 1.97 9.85E-057 1.96 6.23E-0512 1.96 4.08E-052 2.14 9.03E-057 2.14 6.23E-0512 2.14 3.76E-05
200
1
7
800
1
7
13
1400
1
7
13
1400
7
13
200
1
7
13
4 8
8
0
4

December 19, 2011 MwRSF Report No. TRP-03-251-11
199
Degree of Curvature
Grade (%)
Length of Feature (ft)
Height of Feature (ft)
Offset (ft)
SI b
2 2.35 8.13E-057 2.35 5.35E-0512 2.35 3.49E-052 1.96 3.52E-047 1.96 2.61E-0412 1.96 1.79E-042 2.14 3.14E-047 2.14 2.37E-0412 2.14 1.67E-042 2.35 2.85E-047 2.35 2.05E-0412 2.35 1.49E-042 1.96 5.81E-047 1.96 4.17E-0412 1.96 2.97E-042 2.14 5.30E-047 2.14 3.91E-0412 2.14 2.71E-042 2.34 4.73E-047 2.35 3.37E-0412 2.34 2.38E-042 1.97 1.41E-047 1.95 9.64E-0512 1.97 5.95E-052 2.15 1.40E-047 2.15 9.09E-0512 2.14 5.83E-052 2.34 1.21E-047 2.34 8.04E-0512 2.36 5.02E-052 1.96 5.37E-047 1.96 3.77E-0412 1.96 2.72E-042 2.14 4.80E-047 2.14 3.47E-0412 2.14 2.55E-042 2.35 4.33E-047 2.35 3.12E-0412 2.35 2.22E-04
800
1
7
13
1400
1
7
13
200
1
7
13
200 13
800
1
7
13
8
4
8

December 19, 2011 MwRSF Report No. TRP-03-251-11
200
Degree of Curvature
Grade (%)
Length of Feature (ft)
Height of Feature (ft)
Offset (ft)
SI b
2 1.96 8.71E-047 1.96 6.23E-0412 1.96 4.42E-042 2.14 7.99E-047 2.14 5.69E-0412 2.15 3.99E-042 2.35 7.01E-047 2.35 5.07E-0412 2.35 3.55E-04
1400
1
7
13
8 8

December 19, 2011 MwRSF Report No. TRP-03-251-11
201
Appendix M. 1V:3H Undivided Urban Arterial

December 19, 2011 MwRSF Report No. TRP-03-251-11
202
Degree of Curvature
Grade (%)
Length of Feature (ft)
Height of Feature (ft)
Offset (ft)
SI b
2 1.70 5.89E-067 1.71 3.98E-0612 1.70 2.80E-062 1.87 6.99E-067 1.87 4.78E-0612 1.87 3.30E-062 2.04 6.77E-067 2.04 4.66E-0612 2.04 3.32E-062 1.70 2.25E-057 1.70 1.64E-0512 1.70 1.16E-052 1.86 2.45E-057 1.86 1.76E-0512 1.86 1.24E-052 2.04 2.38E-057 2.04 1.69E-0512 2.04 1.18E-052 1.70 3.95E-057 1.70 2.89E-0512 1.70 2.04E-052 1.86 4.19E-057 1.87 3.05E-0512 1.86 2.18E-052 2.05 3.99E-057 2.04 2.90E-0512 2.04 2.06E-052 1.70 6.66E-067 1.70 4.57E-0612 1.70 3.18E-062 1.86 8.03E-067 1.85 5.61E-0612 1.86 3.85E-062 2.04 7.80E-067 2.04 5.29E-0612 2.04 3.65E-062 1.70 2.58E-057 1.70 1.83E-0512 1.70 1.31E-05
800 1
1400
1
7
13
200
1
7
13
200
1
7
13
800
1
7
13
0
0
3

December 19, 2011 MwRSF Report No. TRP-03-251-11
203
Degree of Curvature
Grade (%)
Length of Feature (ft)
Height of Feature (ft)
Offset (ft)
SI b
2 1.86 2.77E-057 1.86 2.01E-0512 1.86 1.41E-052 2.04 2.63E-057 2.04 1.88E-0512 2.04 1.32E-052 1.70 4.46E-057 1.71 3.21E-0512 1.70 2.30E-052 1.86 4.78E-057 1.86 3.47E-0512 1.86 2.46E-052 2.04 4.49E-057 2.04 3.26E-0512 2.04 2.30E-052 1.71 8.85E-067 1.71 6.19E-0612 1.71 4.14E-062 1.86 1.05E-057 1.86 7.20E-0612 1.86 4.98E-062 2.04 1.02E-057 2.04 7.04E-0612 2.05 4.73E-062 1.70 3.39E-057 1.70 2.47E-0512 1.70 1.73E-052 1.86 3.69E-057 1.87 2.64E-0512 1.86 1.88E-052 2.04 3.52E-057 2.04 2.51E-0512 2.04 1.77E-052 1.70 5.99E-057 1.70 4.29E-0512 1.70 3.07E-052 1.87 6.37E-057 1.86 4.63E-0512 1.86 3.31E-05
1400
1
7
200
1
7
13
800
1
7
13
800
7
13
1400
1
7
13
0
3
6
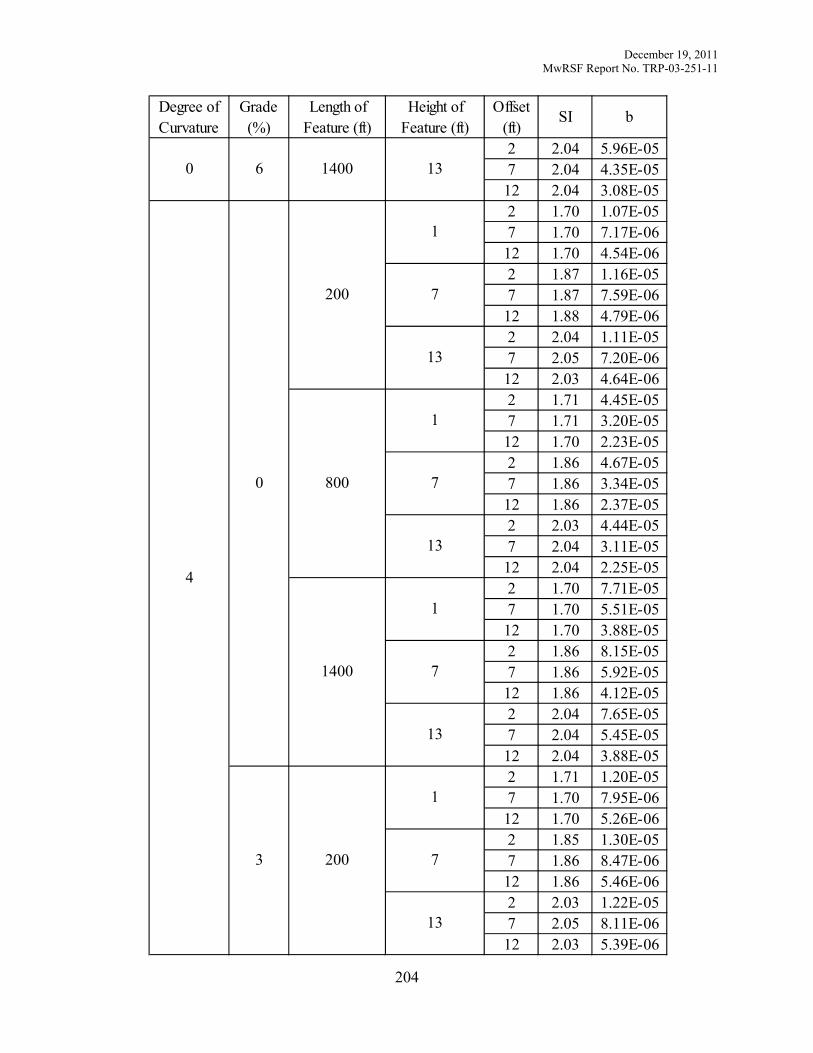
December 19, 2011 MwRSF Report No. TRP-03-251-11
204
Degree of Curvature
Grade (%)
Length of Feature (ft)
Height of Feature (ft)
Offset (ft)
SI b
2 2.04 5.96E-057 2.04 4.35E-0512 2.04 3.08E-052 1.70 1.07E-057 1.70 7.17E-0612 1.70 4.54E-062 1.87 1.16E-057 1.87 7.59E-0612 1.88 4.79E-062 2.04 1.11E-057 2.05 7.20E-0612 2.03 4.64E-062 1.71 4.45E-057 1.71 3.20E-0512 1.70 2.23E-052 1.86 4.67E-057 1.86 3.34E-0512 1.86 2.37E-052 2.03 4.44E-057 2.04 3.11E-0512 2.04 2.25E-052 1.70 7.71E-057 1.70 5.51E-0512 1.70 3.88E-052 1.86 8.15E-057 1.86 5.92E-0512 1.86 4.12E-052 2.04 7.65E-057 2.04 5.45E-0512 2.04 3.88E-052 1.71 1.20E-057 1.70 7.95E-0612 1.70 5.26E-062 1.85 1.30E-057 1.86 8.47E-0612 1.86 5.46E-062 2.03 1.22E-057 2.05 8.11E-0612 2.03 5.39E-06
200
1
7
13
800
1
7
13
1400
1
7
13
1400 13
200
1
7
13
0 6
4
0
3

December 19, 2011 MwRSF Report No. TRP-03-251-11
205
Degree of Curvature
Grade (%)
Length of Feature (ft)
Height of Feature (ft)
Offset (ft)
SI b
2 1.71 5.00E-057 1.70 3.61E-0512 1.70 2.48E-052 1.87 5.25E-057 1.86 3.77E-0512 1.86 2.62E-052 2.04 4.97E-057 2.04 3.58E-0512 2.04 2.50E-052 1.70 8.62E-057 1.70 6.24E-0512 1.71 4.36E-052 1.86 9.20E-057 1.86 6.63E-0512 1.86 4.63E-052 2.04 8.72E-057 2.04 6.13E-0512 2.05 4.30E-052 1.70 1.61E-057 1.72 1.06E-0512 1.70 6.85E-062 1.86 1.69E-057 1.86 1.13E-0512 1.86 7.42E-062 2.05 1.57E-057 2.04 1.08E-0512 2.03 7.13E-062 1.70 6.67E-057 1.70 4.74E-0512 1.70 3.37E-052 1.86 7.14E-057 1.86 5.05E-0512 1.86 3.55E-052 2.04 6.63E-057 2.05 4.67E-0512 2.04 3.31E-052 1.70 1.15E-047 1.70 8.22E-0512 1.71 5.81E-05
800
1
7
13
1400 1
1400
1
7
13
200
1
7
13
800
1
7
13
4
3
6

December 19, 2011 MwRSF Report No. TRP-03-251-11
206
Degree of Curvature
Grade (%)
Length of Feature (ft)
Height of Feature (ft)
Offset (ft)
SI b
2 1.86 1.22E-047 1.86 8.67E-0512 1.86 6.09E-052 2.04 1.14E-047 2.04 8.12E-0512 2.04 5.87E-052 1.71 1.56E-057 1.70 9.91E-0612 1.71 6.03E-062 1.86 1.67E-057 1.88 1.05E-0512 1.86 6.37E-062 2.04 1.58E-057 2.03 1.00E-0512 2.03 6.04E-062 1.70 5.78E-057 1.71 4.14E-0512 1.70 2.93E-052 1.86 6.19E-057 1.86 4.43E-0512 1.86 3.11E-052 2.04 5.77E-057 2.05 4.13E-0512 2.03 2.91E-052 1.70 9.27E-057 1.70 6.65E-0512 1.70 4.64E-052 1.86 9.79E-057 1.86 6.99E-0512 1.86 4.89E-052 2.05 9.07E-057 2.04 6.67E-0512 2.04 4.57E-052 1.70 1.75E-057 1.70 1.12E-0512 1.71 6.79E-062 1.86 1.87E-057 1.86 1.19E-0512 1.87 7.17E-06
200
1
7
800
1
7
13
1400
1
7
13
1400
7
13
200
1
7
13
4 6
8
0
3

December 19, 2011 MwRSF Report No. TRP-03-251-11
207
Degree of Curvature
Grade (%)
Length of Feature (ft)
Height of Feature (ft)
Offset (ft)
SI b
2 2.05 1.68E-057 2.05 1.09E-0512 2.04 6.85E-062 1.71 6.47E-057 1.70 4.74E-0512 1.71 3.26E-052 1.86 7.02E-057 1.86 4.86E-0512 1.86 3.44E-052 2.04 6.55E-057 2.04 4.72E-0512 2.04 3.25E-052 1.71 1.05E-047 1.70 7.61E-0512 1.70 5.30E-052 1.86 1.11E-047 1.86 7.95E-0512 1.86 5.62E-052 2.03 1.05E-047 2.04 7.48E-0512 2.04 5.24E-052 1.70 2.27E-057 1.70 1.50E-0512 1.70 9.05E-062 1.87 2.50E-057 1.85 1.60E-0512 1.87 9.69E-062 2.02 2.44E-057 2.02 1.57E-0512 2.03 9.45E-062 1.70 8.75E-057 1.70 6.26E-0512 1.70 4.41E-052 1.86 9.45E-057 1.86 6.60E-0512 1.86 4.64E-052 2.04 8.59E-057 2.03 6.26E-0512 2.04 4.36E-05
800
1
7
13
1400
1
7
13
200
1
7
13
200 13
800
1
7
13
8
3
6

December 19, 2011 MwRSF Report No. TRP-03-251-11
208
Degree of Curvature
Grade (%)
Length of Feature (ft)
Height of Feature (ft)
Offset (ft)
SI b
2 1.70 1.41E-047 1.70 1.00E-0412 1.70 7.03E-052 1.86 1.47E-047 1.86 1.05E-0412 1.86 7.35E-052 2.04 1.38E-047 2.04 9.79E-0512 2.04 6.85E-05
1400
1
7
13
8 6

December 19, 2011 MwRSF Report No. TRP-03-251-11
209
Appendix N. 1V:4H Divided Urban Arterial

December 19, 2011 MwRSF Report No. TRP-03-251-11
210
Degree of Curvature
Grade (%)
Length of Feature (ft)
Height of Feature (ft)
Offset (ft)
SI b
2 1.71 1.18E-057 1.70 8.74E-0612 1.70 6.88E-062 1.86 1.49E-057 1.85 1.14E-0512 1.85 9.34E-062 2.04 1.54E-057 2.05 1.16E-0512 2.04 9.82E-062 1.70 4.62E-057 1.70 3.65E-0512 1.70 2.97E-052 1.86 5.09E-057 1.86 4.09E-0512 1.86 3.34E-052 2.04 4.93E-057 2.04 3.93E-0512 1.86 3.31E-052 1.70 8.07E-057 1.70 6.43E-0512 1.71 5.23E-052 1.86 8.79E-057 1.86 7.00E-0512 1.86 5.67E-052 2.04 8.37E-057 2.04 6.83E-0512 1.86 5.77E-052 1.69 1.32E-057 1.70 9.71E-0612 1.71 7.57E-062 1.86 1.64E-057 1.86 1.25E-0512 1.86 1.01E-052 2.04 1.68E-057 2.05 1.32E-0512 1.87 1.03E-052 1.70 5.20E-057 1.70 4.06E-0512 1.70 3.27E-05
800 1
1400
1
7
13
200
1
7
13
200
1
7
13
800
1
7
13
0
0
3

December 19, 2011 MwRSF Report No. TRP-03-251-11
211
Degree of Curvature
Grade (%)
Length of Feature (ft)
Height of Feature (ft)
Offset (ft)
SI b
2 1.86 5.76E-057 1.86 4.56E-0512 1.86 3.70E-052 2.05 5.45E-057 2.04 4.38E-0512 1.86 3.74E-052 1.70 9.16E-057 1.70 7.27E-0512 1.70 5.92E-052 1.86 9.90E-057 1.86 7.88E-0512 1.86 6.50E-052 2.04 9.42E-057 2.04 7.54E-0512 1.86 6.42E-052 1.70 1.75E-057 1.70 1.27E-0512 1.70 1.02E-052 1.86 2.18E-057 1.86 1.72E-0512 1.86 1.37E-052 2.04 2.36E-057 2.04 1.81E-0512 1.86 1.39E-052 1.70 6.93E-057 1.70 5.54E-0512 1.71 4.46E-052 1.86 7.74E-057 1.86 6.03E-0512 1.86 4.93E-052 2.04 7.43E-057 2.04 5.85E-0512 1.87 4.95E-052 1.70 1.23E-047 1.70 9.69E-0512 1.70 7.82E-052 1.86 1.32E-047 1.86 1.05E-0412 1.86 8.57E-05
1400
1
7
200
1
7
13
800
1
7
13
800
7
13
1400
1
7
13
0
3
6

December 19, 2011 MwRSF Report No. TRP-03-251-11
212
Degree of Curvature
Grade (%)
Length of Feature (ft)
Height of Feature (ft)
Offset (ft)
SI b
2 2.04 1.26E-047 2.04 1.00E-0412 1.86 8.65E-052 1.70 2.03E-057 1.70 1.43E-0512 1.70 1.09E-052 1.87 2.25E-057 1.86 1.53E-0512 1.86 1.13E-052 2.06 2.00E-057 2.05 1.45E-0512 2.05 1.07E-052 1.70 8.85E-057 1.70 7.04E-0512 1.71 5.52E-052 1.86 9.47E-057 1.86 7.40E-0512 1.86 5.85E-052 2.04 8.62E-057 2.05 6.81E-0512 1.86 5.79E-052 1.70 1.54E-047 1.70 1.21E-0412 1.70 9.91E-052 1.86 1.64E-047 1.86 1.27E-0412 1.86 1.03E-042 2.04 1.55E-047 2.04 1.18E-0412 1.86 1.04E-042 1.70 2.28E-057 1.70 1.63E-0512 1.71 1.19E-052 1.86 2.45E-057 1.84 1.81E-0512 1.86 1.28E-052 2.04 2.28E-057 2.04 1.66E-0512 1.87 1.25E-05
200
1
7
13
800
1
7
13
1400
1
7
13
1400 13
200
1
7
13
0 6
4
0
3

December 19, 2011 MwRSF Report No. TRP-03-251-11
213
Degree of Curvature
Grade (%)
Length of Feature (ft)
Height of Feature (ft)
Offset (ft)
SI b
2 1.70 1.01E-047 1.70 7.78E-0512 1.70 6.34E-052 1.86 1.05E-047 1.86 8.21E-0512 1.86 6.47E-052 2.04 9.93E-057 2.04 7.72E-0512 1.86 6.58E-052 1.70 1.75E-047 1.70 1.37E-0412 1.71 1.11E-042 1.86 1.85E-047 1.86 1.43E-0412 1.86 1.16E-042 2.04 1.70E-047 2.04 1.36E-0412 1.86 1.15E-042 1.71 3.15E-057 1.71 2.16E-0512 1.69 1.58E-052 1.85 3.25E-057 1.86 2.32E-0512 1.86 1.70E-052 2.04 3.15E-057 2.04 2.30E-0512 1.86 1.71E-052 1.70 1.34E-047 1.71 1.03E-0412 1.70 8.27E-052 1.86 1.40E-047 1.86 1.09E-0412 1.86 8.79E-052 2.03 1.34E-047 2.03 1.04E-0412 1.86 8.73E-052 1.70 2.33E-047 1.70 1.80E-0412 1.70 1.47E-04
800
1
7
13
1400 1
1400
1
7
13
200
1
7
13
800
1
7
13
4
3
6

December 19, 2011 MwRSF Report No. TRP-03-251-11
214
Degree of Curvature
Grade (%)
Length of Feature (ft)
Height of Feature (ft)
Offset (ft)
SI b
2 1.86 2.46E-047 1.86 1.92E-0412 1.86 1.54E-042 2.04 2.30E-047 2.04 1.78E-0412 1.86 1.56E-042 1.71 2.97E-057 1.71 1.98E-0512 1.71 1.34E-052 1.86 3.17E-057 1.87 2.17E-0512 1.86 1.44E-052 2.03 2.94E-057 2.03 2.13E-0512 2.05 1.37E-052 1.70 1.16E-047 1.70 9.08E-0512 1.71 7.19E-052 1.86 1.21E-047 1.87 9.48E-0512 1.86 7.53E-052 2.04 1.12E-047 2.04 8.86E-0512 1.85 7.66E-052 1.70 1.80E-047 1.70 1.41E-0412 1.70 1.14E-042 1.86 1.92E-047 1.86 1.51E-0412 1.86 1.21E-042 2.04 1.79E-047 2.04 1.43E-0412 1.86 1.20E-042 1.70 3.40E-057 1.71 2.28E-0512 1.70 1.56E-052 1.86 3.58E-057 1.87 2.39E-0512 1.86 1.62E-05
200
1
7
800
1
7
13
1400
1
7
13
1400
7
13
200
1
7
13
4 6
8
0
3

December 19, 2011 MwRSF Report No. TRP-03-251-11
215
Degree of Curvature
Grade (%)
Length of Feature (ft)
Height of Feature (ft)
Offset (ft)
SI b
2 2.05 3.30E-057 2.06 2.18E-0512 1.86 1.62E-052 1.71 1.30E-047 1.70 1.03E-0412 1.70 7.95E-052 1.86 1.38E-047 1.87 1.05E-0412 1.87 8.55E-052 2.04 1.29E-047 2.04 1.02E-0412 1.86 8.52E-052 1.70 2.07E-047 1.71 1.59E-0412 1.70 1.30E-042 1.86 2.16E-047 1.86 1.70E-0412 1.86 1.36E-042 2.04 2.06E-047 2.04 1.60E-0412 1.86 1.36E-042 1.70 4.58E-057 1.69 3.19E-0512 1.70 2.09E-052 1.87 4.69E-057 1.87 3.26E-0512 1.86 2.22E-052 2.04 4.51E-057 2.04 2.92E-0512 1.87 2.15E-052 1.70 1.73E-047 1.71 1.33E-0412 1.70 1.08E-042 1.86 1.81E-047 1.86 1.42E-0412 1.86 1.13E-042 2.04 1.73E-047 2.05 1.31E-0412 1.86 1.14E-04
800
1
7
13
1400
1
7
13
200
1
7
13
200 13
800
1
7
13
8
3
6

December 19, 2011 MwRSF Report No. TRP-03-251-11
216
Degree of Curvature
Grade (%)
Length of Feature (ft)
Height of Feature (ft)
Offset (ft)
SI b
2 1.71 2.74E-047 1.70 2.17E-0412 1.70 1.71E-042 1.86 2.88E-047 1.86 2.26E-0412 1.87 1.79E-042 2.04 2.70E-047 2.04 2.12E-0412 1.86 1.82E-04
1400
1
7
13
8 6

December 19, 2011 MwRSF Report No. TRP-03-251-11
217
Appendix O. 1V:3H Urban Local

December 19, 2011 MwRSF Report No. TRP-03-251-11
218
Degree of Curvature
Grade (%)
Length of Feature (ft)
Height of Feature (ft)
Offset (ft)
SI b
2 2.10 4.51E-057 2.10 3.24E-0512 2.10 2.13E-052 2.29 4.45E-057 2.29 3.08E-0512 2.29 2.09E-052 2.52 3.76E-057 2.51 2.74E-0512 2.51 1.87E-052 2.10 1.69E-047 2.09 1.25E-0412 2.09 8.92E-052 2.29 1.50E-047 2.28 1.10E-0412 2.29 7.83E-052 2.51 1.33E-047 2.52 9.72E-0512 2.51 7.03E-052 2.09 2.96E-047 2.09 2.16E-0412 2.09 1.54E-042 2.29 2.56E-047 2.29 1.89E-0412 2.29 1.33E-042 2.51 2.32E-047 2.51 1.69E-0412 2.52 1.21E-042 2.09 7.07E-057 2.10 4.72E-0512 2.10 3.22E-052 2.28 6.82E-057 2.30 4.37E-0512 2.30 2.99E-052 2.51 5.94E-057 2.52 4.11E-0512 2.53 2.76E-052 2.09 2.56E-047 2.10 1.83E-0412 2.10 1.26E-04
800 1
1400
1
7
13
200
1
7
13
200
1
7
13
800
1
7
13
0
0
6

December 19, 2011 MwRSF Report No. TRP-03-251-11
219
Degree of Curvature
Grade (%)
Length of Feature (ft)
Height of Feature (ft)
Offset (ft)
SI b
2 2.29 2.24E-047 2.30 1.62E-0412 2.29 1.15E-042 2.52 2.01E-047 2.51 1.48E-0412 2.51 1.04E-042 2.09 4.42E-047 2.10 3.22E-0412 2.09 2.31E-042 2.29 3.86E-047 2.29 2.82E-0412 2.29 2.04E-042 2.51 3.50E-047 2.51 2.52E-0412 2.51 1.81E-042 2.09 6.81E-057 2.10 4.78E-0512 2.08 3.25E-052 2.29 6.46E-057 2.30 4.49E-0512 2.29 3.16E-052 2.51 5.86E-057 2.50 4.27E-0512 2.50 2.86E-052 2.10 2.57E-047 2.09 1.84E-0412 2.09 1.32E-042 2.29 2.27E-047 2.29 1.62E-0412 2.29 1.19E-042 2.51 1.99E-047 2.51 1.44E-0412 2.51 1.04E-042 2.09 4.36E-047 2.10 3.16E-0412 2.09 2.31E-042 2.29 3.89E-047 2.29 2.81E-0412 2.29 2.01E-04
1400
1
7
200
1
7
13
800
1
7
13
800
7
13
1400
1
7
13
0
6
12

December 19, 2011 MwRSF Report No. TRP-03-251-11
220
Degree of Curvature
Grade (%)
Length of Feature (ft)
Height of Feature (ft)
Offset (ft)
SI b
2 2.51 3.52E-047 2.51 2.52E-0412 2.51 1.80E-042 2.09 4.51E-057 2.08 3.15E-0512 2.09 2.04E-052 2.29 4.37E-057 2.29 2.79E-0512 2.29 1.79E-052 2.50 3.94E-057 2.52 2.37E-0512 2.50 1.70E-052 2.10 1.80E-047 2.09 1.29E-0412 2.09 8.96E-052 2.29 1.52E-047 2.29 1.12E-0412 2.29 7.85E-052 2.51 1.40E-047 2.51 9.98E-0512 2.51 7.14E-052 2.09 3.01E-047 2.09 2.19E-0412 2.09 1.59E-042 2.29 2.66E-047 2.29 1.88E-0412 2.29 1.35E-042 2.51 2.28E-047 2.51 1.72E-0412 2.51 1.20E-042 2.10 7.21E-057 2.10 4.66E-0512 2.11 3.00E-052 2.29 6.20E-057 2.28 4.03E-0512 2.29 2.77E-052 2.50 5.86E-057 2.52 3.74E-0512 2.51 2.43E-05
200
1
7
13
800
1
7
13
1400
1
7
13
1400 13
200
1
7
13
0 12
3
0
6

December 19, 2011 MwRSF Report No. TRP-03-251-11
221
Degree of Curvature
Grade (%)
Length of Feature (ft)
Height of Feature (ft)
Offset (ft)
SI b
2 2.09 2.66E-047 2.10 1.92E-0412 2.09 1.38E-042 2.28 2.34E-047 2.28 1.67E-0412 2.30 1.15E-042 2.51 2.02E-047 2.52 1.50E-0412 2.51 1.05E-042 2.09 4.55E-047 2.09 3.39E-0412 2.09 2.30E-042 2.29 3.88E-047 2.29 2.84E-0412 2.29 1.97E-042 2.52 3.42E-047 2.51 2.51E-0412 2.51 1.84E-042 2.09 7.28E-057 2.09 4.50E-0512 2.08 3.11E-052 2.28 6.58E-057 2.30 3.98E-0512 2.29 2.87E-052 2.52 6.07E-057 2.52 3.71E-0512 2.51 2.36E-052 2.10 2.62E-047 2.09 1.89E-0412 2.09 1.37E-042 2.30 2.33E-047 2.30 1.65E-0412 2.29 1.18E-042 2.51 2.06E-047 2.51 1.54E-0412 2.52 1.06E-042 2.10 4.56E-047 2.09 3.29E-0412 2.10 2.29E-04
800
1
7
13
1400 1
1400
1
7
13
200
1
7
13
800
1
7
13
3
6
12

December 19, 2011 MwRSF Report No. TRP-03-251-11
222
Degree of Curvature
Grade (%)
Length of Feature (ft)
Height of Feature (ft)
Offset (ft)
SI b
2 2.29 3.89E-047 2.29 2.84E-0412 2.29 2.04E-042 2.51 3.55E-047 2.51 2.53E-0412 2.51 1.82E-042 2.08 1.40E-047 2.10 9.60E-0512 2.09 6.25E-052 2.29 1.19E-047 2.29 8.50E-0512 2.28 5.56E-052 2.50 1.15E-047 2.51 7.86E-0512 2.49 5.14E-052 2.09 5.42E-047 2.09 3.89E-0412 2.10 2.75E-042 2.29 4.61E-047 2.29 3.34E-0412 2.29 2.39E-042 2.51 4.18E-047 2.51 2.97E-0412 2.51 2.16E-042 2.09 8.98E-047 2.10 6.49E-0412 2.09 4.49E-042 2.29 7.74E-047 2.29 5.63E-0412 2.29 3.87E-042 2.52 6.82E-047 2.50 4.95E-0412 2.51 3.47E-042 2.10 2.02E-047 2.09 1.48E-0412 2.09 9.66E-052 2.29 1.86E-047 2.28 1.25E-0412 2.29 8.13E-05
200
1
7
800
1
7
13
1400
1
7
13
1400
7
13
200
1
7
13
3 12
6
0
6

December 19, 2011 MwRSF Report No. TRP-03-251-11
223
Degree of Curvature
Grade (%)
Length of Feature (ft)
Height of Feature (ft)
Offset (ft)
SI b
2 2.53 1.64E-047 2.50 1.18E-0412 2.51 7.89E-052 2.09 8.18E-047 2.10 5.98E-0412 2.08 4.16E-042 2.30 7.10E-047 2.30 4.94E-0412 2.30 3.54E-042 2.51 6.29E-047 2.51 4.50E-0412 2.50 3.24E-042 2.09 1.33E-037 2.09 9.59E-0412 2.09 6.78E-042 2.30 1.16E-037 2.30 8.15E-0412 2.29 5.99E-042 2.51 1.01E-037 2.51 7.43E-0412 2.51 5.23E-042 2.09 2.18E-047 2.08 1.48E-0412 2.09 9.51E-052 2.29 1.91E-047 2.30 1.28E-0412 2.28 8.72E-052 2.50 1.78E-047 2.51 1.23E-0412 2.49 7.52E-052 2.09 8.35E-047 2.09 5.83E-0412 2.10 3.96E-042 2.29 7.13E-047 2.29 4.97E-0412 2.28 3.63E-042 2.51 6.16E-047 2.51 4.60E-0412 2.51 3.15E-04
800
1
7
13
1400
1
7
13
200
1
7
13
200 13
800
1
7
13
6
6
12

December 19, 2011 MwRSF Report No. TRP-03-251-11
224
Degree of Curvature
Grade (%)
Length of Feature (ft)
Height of Feature (ft)
Offset (ft)
SI b
2 2.09 1.36E-037 2.10 9.60E-0412 2.09 6.71E-042 2.29 1.15E-037 2.29 8.33E-0412 2.29 5.93E-042 2.52 1.01E-037 2.51 7.44E-0412 2.51 5.15E-04
1400
1
7
13
6 12

December 19, 2011 MwRSF Report No. TRP-03-251-11
225
Appendix P. 1V:4H Freeway
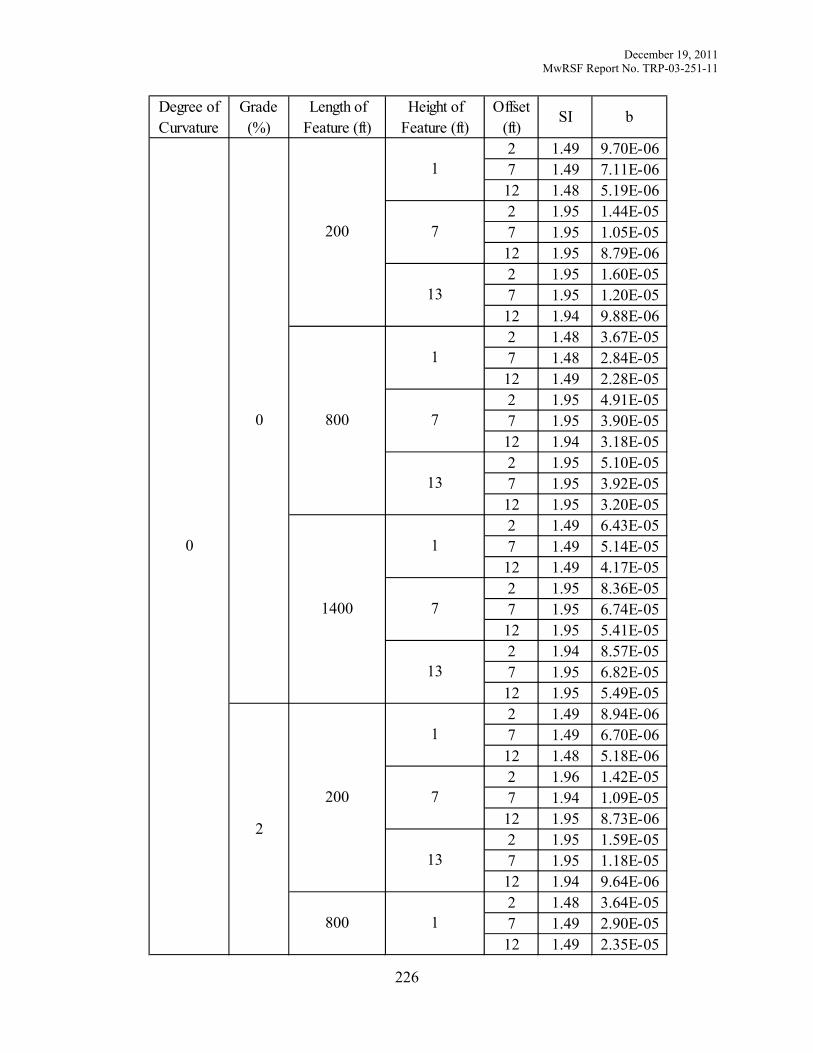
December 19, 2011 MwRSF Report No. TRP-03-251-11
226
Degree of Curvature
Grade (%)
Length of Feature (ft)
Height of Feature (ft)
Offset (ft)
SI b
2 1.49 9.70E-067 1.49 7.11E-0612 1.48 5.19E-062 1.95 1.44E-057 1.95 1.05E-0512 1.95 8.79E-062 1.95 1.60E-057 1.95 1.20E-0512 1.94 9.88E-062 1.48 3.67E-057 1.48 2.84E-0512 1.49 2.28E-052 1.95 4.91E-057 1.95 3.90E-0512 1.94 3.18E-052 1.95 5.10E-057 1.95 3.92E-0512 1.95 3.20E-052 1.49 6.43E-057 1.49 5.14E-0512 1.49 4.17E-052 1.95 8.36E-057 1.95 6.74E-0512 1.95 5.41E-052 1.94 8.57E-057 1.95 6.82E-0512 1.95 5.49E-052 1.49 8.94E-067 1.49 6.70E-0612 1.48 5.18E-062 1.96 1.42E-057 1.94 1.09E-0512 1.95 8.73E-062 1.95 1.59E-057 1.95 1.18E-0512 1.94 9.64E-062 1.48 3.64E-057 1.49 2.90E-0512 1.49 2.35E-05
800 1
1400
1
7
13
200
1
7
13
200
1
7
13
800
1
7
13
0
0
2

December 19, 2011 MwRSF Report No. TRP-03-251-11
227
Degree of Curvature
Grade (%)
Length of Feature (ft)
Height of Feature (ft)
Offset (ft)
SI b
2 1.95 4.89E-057 1.95 3.80E-0512 1.94 3.13E-052 1.95 5.09E-057 1.95 3.95E-0512 1.95 3.26E-052 1.49 6.53E-057 1.48 5.09E-0512 1.49 4.08E-052 1.94 8.38E-057 1.95 6.70E-0512 1.95 5.54E-052 1.95 8.58E-057 1.95 6.69E-0512 1.95 5.52E-052 1.48 1.04E-057 1.48 7.72E-0612 1.49 5.83E-062 1.94 1.59E-057 1.95 1.24E-0512 1.94 1.02E-052 1.95 1.76E-057 1.94 1.38E-0512 1.94 1.07E-052 1.48 4.14E-057 1.49 3.22E-0512 1.48 2.57E-052 1.95 5.38E-057 1.95 4.34E-0512 1.95 3.57E-052 1.95 5.63E-057 1.95 4.50E-0512 1.95 3.70E-052 1.48 7.08E-057 1.49 5.74E-0512 1.49 4.69E-052 1.95 9.46E-057 1.94 7.42E-0512 1.95 6.14E-05
1400
1
7
200
1
7
13
800
1
7
13
800
7
13
1400
1
7
13
0
2
3

December 19, 2011 MwRSF Report No. TRP-03-251-11
228
Degree of Curvature
Grade (%)
Length of Feature (ft)
Height of Feature (ft)
Offset (ft)
SI b
2 1.95 9.65E-057 1.95 7.48E-0512 1.95 6.26E-052 1.49 7.08E-067 1.49 4.87E-0612 1.49 3.26E-062 1.94 9.28E-067 1.94 6.33E-0612 1.95 4.71E-062 1.95 1.01E-057 1.95 7.22E-0612 1.95 5.33E-062 1.49 3.30E-057 1.49 2.50E-0512 1.49 2.03E-052 1.95 4.17E-057 1.94 3.16E-0512 1.95 2.55E-052 1.95 4.25E-057 1.95 3.27E-0512 1.95 2.59E-052 1.49 5.76E-057 1.49 4.44E-0512 1.49 3.62E-052 1.95 7.25E-057 1.95 5.68E-0512 1.95 4.51E-052 1.95 7.39E-057 1.95 5.74E-0512 1.95 4.66E-052 1.49 7.39E-067 1.48 4.79E-0612 1.48 3.28E-062 1.94 9.72E-067 1.94 6.37E-0612 1.95 5.02E-062 1.95 1.04E-057 1.95 7.24E-0612 1.95 5.31E-06
200
1
7
13
800
1
7
13
1400
1
7
13
1400 13
200
1
7
13
0 3
2
0
2

December 19, 2011 MwRSF Report No. TRP-03-251-11
229
Degree of Curvature
Grade (%)
Length of Feature (ft)
Height of Feature (ft)
Offset (ft)
SI b
2 1.49 3.31E-057 1.49 2.52E-0512 1.49 2.02E-052 1.95 4.14E-057 1.95 3.21E-0512 1.95 2.58E-052 1.95 4.28E-057 1.94 3.32E-0512 1.95 2.61E-052 1.49 5.78E-057 1.49 4.46E-0512 1.49 3.62E-052 1.95 7.26E-057 1.95 5.70E-0512 1.95 4.60E-052 1.95 7.42E-057 1.94 5.68E-0512 1.95 4.67E-052 1.49 7.06E-067 1.48 4.91E-0612 1.48 3.39E-062 1.95 9.35E-067 1.94 6.46E-0612 1.94 4.61E-062 1.95 1.02E-057 1.94 7.47E-0612 1.95 5.33E-062 1.48 3.31E-057 1.49 2.48E-0512 1.48 2.03E-052 1.95 4.28E-057 1.95 3.22E-0512 1.94 2.55E-052 1.95 4.24E-057 1.94 3.36E-0512 1.95 2.66E-052 1.49 5.79E-057 1.48 4.45E-0512 1.48 3.63E-05
800
1
7
13
1400 1
1400
1
7
13
200
1
7
13
800
1
7
13
2
2
3

December 19, 2011 MwRSF Report No. TRP-03-251-11
230
Degree of Curvature
Grade (%)
Length of Feature (ft)
Height of Feature (ft)
Offset (ft)
SI b
2 1.94 7.25E-057 1.95 5.63E-0512 1.95 4.57E-052 1.95 7.33E-057 1.95 5.79E-0512 1.95 4.64E-052 1.48 8.30E-067 1.49 5.15E-0612 1.47 3.80E-062 1.95 1.04E-057 1.94 6.56E-0612 1.95 4.89E-062 1.95 1.08E-057 1.94 7.34E-0612 1.94 5.35E-062 1.49 3.56E-057 1.48 2.65E-0512 1.49 2.11E-052 1.95 4.42E-057 1.94 3.41E-0512 1.95 2.69E-052 1.95 4.45E-057 1.95 3.44E-0512 1.95 2.72E-052 1.49 5.95E-057 1.49 4.64E-0512 1.49 3.73E-052 1.95 7.51E-057 1.94 6.63E-0512 1.95 4.69E-052 1.95 7.66E-057 1.95 5.92E-0512 1.95 4.83E-052 1.47 8.03E-067 1.49 5.43E-0612 1.48 3.61E-062 1.95 1.04E-057 1.94 6.75E-0612 1.94 4.92E-06
200
1
7
800
1
7
13
1400
1
7
13
1400
7
13
200
1
7
13
2 3
3
0
2

December 19, 2011 MwRSF Report No. TRP-03-251-11
231
Degree of Curvature
Grade (%)
Length of Feature (ft)
Height of Feature (ft)
Offset (ft)
SI b
2 1.95 1.12E-057 1.95 6.79E-0612 1.95 5.27E-062 1.49 3.55E-057 1.49 2.75E-0512 1.49 2.12E-052 1.95 4.47E-057 1.95 3.41E-0512 1.95 2.63E-052 1.95 4.50E-057 1.95 3.43E-0512 1.95 2.69E-052 1.49 5.90E-057 1.49 4.70E-0512 1.49 3.76E-052 1.95 7.52E-057 1.95 5.89E-0512 1.95 4.76E-052 1.95 7.57E-057 1.95 5.88E-0512 1.95 4.71E-052 1.48 9.00E-067 1.49 5.77E-0612 1.49 4.11E-062 1.94 1.17E-057 1.94 7.09E-0612 1.95 5.42E-062 1.95 1.24E-057 1.94 8.39E-0612 1.95 5.96E-062 1.49 3.91E-057 1.48 3.00E-0512 1.49 2.41E-052 1.95 4.94E-057 1.95 3.81E-0512 1.95 2.92E-052 1.95 4.97E-057 1.95 3.93E-0512 1.95 2.97E-05
800
1
7
13
1400
1
7
13
200
1
7
13
200 13
800
1
7
13
3
2
3

December 19, 2011 MwRSF Report No. TRP-03-251-11
232
Degree of Curvature
Grade (%)
Length of Feature (ft)
Height of Feature (ft)
Offset (ft)
SI b
2 1.48 6.80E-057 1.49 5.29E-0512 1.49 4.26E-052 1.95 8.41E-057 1.95 6.61E-0512 1.95 5.30E-052 1.95 8.40E-057 1.95 6.61E-0512 1.95 5.45E-05
1400
1
7
13
3 3

December 19, 2011 MwRSF Report No. TRP-03-251-11
233
Appendix Q. 1V:4H Undivided Rural Arterial

December 19, 2011 MwRSF Report No. TRP-03-251-11
234
Degree of Curvature
Grade (%)
Length of Feature (ft)
Height of Feature (ft)
Offset (ft)
SI b
2 1.01 9.03E-077 1.00 6.48E-0712 1.00 4.55E-072 1.31 3.10E-067 1.31 2.16E-0612 1.31 1.56E-062 1.31 3.21E-067 1.31 2.20E-0612 1.31 1.52E-062 1.00 3.36E-067 1.00 2.44E-0612 1.00 1.73E-062 1.31 1.03E-057 1.31 7.38E-0612 1.31 5.27E-062 1.32 1.07E-057 1.31 7.64E-0612 1.31 5.25E-062 1.00 5.85E-067 1.00 4.27E-0612 1.00 2.99E-062 1.31 1.79E-057 1.31 1.28E-0512 1.31 8.98E-062 1.31 1.76E-057 1.31 1.28E-0512 1.31 9.08E-062 0.99 1.00E-067 1.00 6.91E-0712 1.00 5.00E-072 1.31 3.48E-067 1.32 2.52E-0612 1.31 1.74E-062 1.31 3.61E-067 1.31 2.44E-0612 1.31 1.75E-062 1.00 3.77E-067 1.00 2.72E-0612 1.00 1.94E-06
800 1
1400
1
7
13
200
1
7
13
200
1
7
13
800
1
7
13
0
0
3

December 19, 2011 MwRSF Report No. TRP-03-251-11
235
Degree of Curvature
Grade (%)
Length of Feature (ft)
Height of Feature (ft)
Offset (ft)
SI b
2 1.31 1.18E-057 1.31 8.49E-0612 1.31 5.95E-062 1.32 1.19E-057 1.31 8.32E-0612 1.32 6.03E-062 1.00 6.54E-067 1.00 4.77E-0612 1.00 3.40E-062 1.31 1.99E-057 1.31 1.42E-0512 1.31 1.02E-052 1.31 1.97E-057 1.31 1.43E-0512 1.31 1.01E-052 1.00 1.38E-067 1.01 9.46E-0712 1.00 6.68E-072 1.32 4.73E-067 1.31 3.20E-0612 1.31 2.26E-062 1.31 4.78E-067 1.32 3.46E-0612 1.31 2.28E-062 1.00 5.08E-067 1.00 3.61E-0612 1.00 2.56E-062 1.31 1.56E-057 1.31 1.13E-0512 1.31 7.83E-062 1.31 1.54E-057 1.31 1.12E-0512 1.31 7.87E-062 1.00 8.75E-067 1.00 6.33E-0612 1.00 4.54E-062 1.31 2.65E-057 1.31 1.89E-0512 1.32 1.38E-05
1400
1
7
200
1
7
13
800
1
7
13
800
7
13
1400
1
7
13
0
3
6

December 19, 2011 MwRSF Report No. TRP-03-251-11
236
Degree of Curvature
Grade (%)
Length of Feature (ft)
Height of Feature (ft)
Offset (ft)
SI b
2 1.31 2.66E-057 1.31 1.90E-0512 1.31 1.38E-052 1.00 7.64E-077 1.00 4.44E-0712 1.00 2.95E-072 1.33 2.38E-067 1.30 1.31E-0612 1.31 8.68E-072 1.32 2.26E-067 1.32 1.38E-0612 1.31 8.74E-072 1.00 3.05E-067 1.00 2.16E-0612 1.00 1.49E-062 1.31 8.98E-067 1.32 6.42E-0612 1.31 4.38E-062 1.31 9.03E-067 1.31 6.26E-0612 1.32 4.39E-062 1.00 5.12E-067 1.00 3.65E-0612 1.00 2.60E-062 1.31 1.54E-057 1.32 1.08E-0512 1.31 7.71E-062 1.31 1.51E-057 1.32 1.11E-0512 1.32 7.57E-062 1.00 8.58E-077 1.00 5.08E-0712 1.00 3.35E-072 1.31 2.55E-067 1.31 1.49E-0612 1.31 9.64E-072 1.31 2.64E-067 1.31 1.52E-0612 1.31 1.01E-06
200
1
7
13
800
1
7
13
1400
1
7
13
1400 13
200
1
7
13
0 6
3
0
3

December 19, 2011 MwRSF Report No. TRP-03-251-11
237
Degree of Curvature
Grade (%)
Length of Feature (ft)
Height of Feature (ft)
Offset (ft)
SI b
2 1.00 3.47E-067 1.00 2.47E-0612 1.00 1.67E-062 1.31 1.00E-057 1.31 7.06E-0612 1.31 4.98E-062 1.31 9.98E-067 1.31 7.11E-0612 1.31 4.95E-062 1.00 5.75E-067 1.00 4.16E-0612 1.00 2.88E-062 1.31 1.70E-057 1.31 1.22E-0512 1.31 8.56E-062 1.31 1.67E-057 1.31 1.22E-0512 1.32 8.52E-062 1.00 1.12E-067 1.00 6.70E-0712 1.00 4.47E-072 1.31 3.40E-067 1.31 1.99E-0612 1.31 1.28E-062 1.32 3.36E-067 1.32 1.98E-0612 1.32 1.32E-062 1.00 4.57E-067 1.00 3.23E-0612 1.00 2.23E-062 1.32 1.32E-057 1.32 9.71E-0612 1.31 6.52E-062 1.31 1.34E-057 1.31 9.49E-0612 1.31 6.53E-062 1.00 7.70E-067 1.00 5.52E-0612 1.00 3.88E-06
800
1
7
13
1400 1
1400
1
7
13
200
1
7
13
800
1
7
13
3
3
6

December 19, 2011 MwRSF Report No. TRP-03-251-11
238
Degree of Curvature
Grade (%)
Length of Feature (ft)
Height of Feature (ft)
Offset (ft)
SI b
2 1.31 2.25E-057 1.31 1.62E-0512 1.31 1.13E-052 1.31 2.26E-057 1.31 1.62E-0512 1.31 1.15E-052 1.00 2.23E-067 1.00 1.47E-0612 1.00 9.36E-072 1.31 6.72E-067 1.30 4.48E-0612 1.31 2.80E-062 1.32 6.66E-067 1.31 4.25E-0612 1.31 2.71E-062 1.00 8.99E-067 1.00 6.42E-0612 1.00 4.40E-062 1.31 2.64E-057 1.31 1.85E-0512 1.31 1.29E-052 1.31 2.61E-057 1.32 1.87E-0512 1.31 1.30E-052 1.00 1.47E-057 1.00 1.06E-0512 1.00 7.39E-062 1.31 4.30E-057 1.31 3.08E-0512 1.31 2.17E-052 1.31 4.32E-057 1.31 3.08E-0512 1.31 2.14E-052 1.01 2.59E-067 1.00 1.73E-0612 1.00 1.06E-062 1.31 7.42E-067 1.32 4.75E-0612 1.31 3.01E-06
200
1
7
800
1
7
13
1400
1
7
13
1400
7
13
200
1
7
13
3 6
6
0
3

December 19, 2011 MwRSF Report No. TRP-03-251-11
239
Degree of Curvature
Grade (%)
Length of Feature (ft)
Height of Feature (ft)
Offset (ft)
SI b
2 1.32 7.38E-067 1.31 4.68E-0612 1.32 3.07E-062 1.00 1.02E-057 1.00 7.20E-0612 1.00 4.96E-062 1.31 2.96E-057 1.32 2.12E-0512 1.32 1.49E-052 1.32 3.04E-057 1.31 2.08E-0512 1.31 1.50E-052 1.00 1.64E-057 1.00 1.18E-0512 1.00 8.29E-062 1.31 4.78E-057 1.31 3.42E-0512 1.31 2.44E-052 1.31 4.78E-057 1.31 3.44E-0512 1.31 2.45E-052 1.00 3.32E-067 1.01 2.24E-0612 1.00 1.45E-062 1.32 9.89E-067 1.31 6.57E-0612 1.31 3.74E-062 1.31 9.84E-067 1.31 6.40E-0612 1.31 4.09E-062 1.00 1.35E-057 1.01 9.66E-0612 1.00 6.72E-062 1.31 3.94E-057 1.31 2.79E-0512 1.32 1.98E-052 1.31 3.89E-057 1.32 2.82E-0512 1.31 1.91E-05
800
1
7
13
1400
1
7
13
200
1
7
13
200 13
800
1
7
13
6
3
6

December 19, 2011 MwRSF Report No. TRP-03-251-11
240
Degree of Curvature
Grade (%)
Length of Feature (ft)
Height of Feature (ft)
Offset (ft)
SI b
2 1.00 2.21E-057 1.00 1.57E-0512 1.01 1.12E-052 1.31 6.44E-057 1.32 4.63E-0512 1.31 3.24E-052 1.32 6.41E-057 1.32 4.59E-0512 1.31 3.22E-05
1400
1
7
13
6 6

December 19, 2011 MwRSF Report No. TRP-03-251-11
241
Appendix R. 1V:4H Divided Rural Arterial

December 19, 2011 MwRSF Report No. TRP-03-251-11
242
Degree of Curvature
Grade (%)
Length of Feature (ft)
Height of Feature (ft)
Offset (ft)
SI b
2 1.00 1.87E-067 1.00 1.46E-0612 1.00 1.13E-062 1.32 7.10E-067 1.31 5.38E-0612 1.31 4.62E-062 1.31 7.85E-067 1.32 6.34E-0612 1.31 5.17E-062 1.00 7.04E-067 1.00 5.49E-0612 1.00 4.49E-062 1.31 2.23E-057 1.32 1.77E-0512 1.31 1.44E-052 1.31 2.28E-057 1.31 1.83E-0512 1.31 1.49E-052 1.00 1.22E-057 1.00 9.74E-0612 1.00 8.03E-062 1.31 3.75E-057 1.31 2.97E-0512 1.31 2.47E-052 1.31 3.77E-057 1.31 3.05E-0512 1.32 2.52E-052 1.01 2.11E-067 1.00 1.51E-0612 1.00 1.23E-062 1.32 8.16E-067 1.31 6.36E-0612 1.30 5.28E-062 1.32 9.14E-067 1.31 7.03E-0612 1.32 5.86E-062 1.00 7.89E-067 1.00 6.22E-0612 1.00 5.11E-06
800 1
1400
1
7
13
200
1
7
13
200
1
7
13
800
1
7
13
0
0
3

December 19, 2011 MwRSF Report No. TRP-03-251-11
243
Degree of Curvature
Grade (%)
Length of Feature (ft)
Height of Feature (ft)
Offset (ft)
SI b
2 1.31 2.49E-057 1.31 1.99E-0512 1.32 1.64E-052 1.31 2.54E-057 1.32 2.15E-0512 1.31 1.70E-052 1.00 1.37E-057 1.00 1.09E-0512 1.00 8.93E-062 1.32 4.25E-057 1.31 3.39E-0512 1.31 2.75E-052 1.31 4.31E-057 1.31 3.39E-0512 1.31 2.81E-052 1.01 2.90E-067 1.00 2.10E-0612 1.00 1.69E-062 1.31 1.08E-057 1.31 8.11E-0612 1.31 6.90E-062 1.31 1.17E-057 1.31 9.18E-0612 1.31 7.84E-062 1.00 1.05E-057 1.00 8.39E-0612 1.00 6.69E-062 1.31 3.32E-057 1.31 2.64E-0512 1.31 2.18E-052 1.31 3.46E-057 1.31 2.77E-0512 1.31 2.22E-052 1.01 1.85E-057 1.00 1.46E-0512 1.00 1.21E-052 1.31 5.57E-057 1.31 4.44E-0512 1.31 3.72E-05
1400
1
7
200
1
7
13
800
1
7
13
800
7
13
1400
1
7
13
0
3
6

December 19, 2011 MwRSF Report No. TRP-03-251-11
244
Degree of Curvature
Grade (%)
Length of Feature (ft)
Height of Feature (ft)
Offset (ft)
SI b
2 1.31 5.71E-057 1.31 4.54E-0512 1.31 3.75E-052 1.00 1.52E-067 1.01 9.42E-0712 1.00 6.72E-072 1.32 4.26E-067 1.32 2.86E-0612 1.31 1.97E-062 1.32 4.51E-067 1.31 2.85E-0612 1.32 2.34E-062 1.00 6.14E-067 1.00 4.76E-0612 1.00 3.77E-062 1.31 1.81E-057 1.32 1.41E-0512 1.31 1.08E-052 1.32 1.83E-057 1.31 1.39E-0512 1.31 1.09E-052 1.00 1.05E-057 1.00 8.27E-0612 1.00 6.59E-062 1.31 3.03E-057 1.31 2.40E-0512 1.32 1.94E-052 1.31 3.05E-057 1.31 2.43E-0512 1.31 1.98E-052 1.00 1.64E-067 1.01 1.06E-0612 1.01 7.73E-072 1.31 4.75E-067 1.31 3.10E-0612 1.31 2.19E-062 1.31 5.17E-067 1.31 3.39E-0612 1.30 2.51E-06
200
1
7
13
800
1
7
13
1400
1
7
13
1400 13
200
1
7
13
0 6
3
0
3

December 19, 2011 MwRSF Report No. TRP-03-251-11
245
Degree of Curvature
Grade (%)
Length of Feature (ft)
Height of Feature (ft)
Offset (ft)
SI b
2 1.00 6.94E-067 1.00 5.38E-0612 1.00 4.28E-062 1.31 2.04E-057 1.32 1.57E-0512 1.32 1.26E-052 1.31 2.05E-057 1.31 1.59E-0512 1.31 1.26E-052 1.00 1.17E-057 1.00 9.26E-0612 1.00 7.41E-062 1.31 3.45E-057 1.31 2.69E-0512 1.31 2.17E-052 1.32 3.52E-057 1.32 2.73E-0512 1.31 2.22E-052 1.00 2.19E-067 1.01 1.40E-0612 1.00 9.88E-072 1.31 6.49E-067 1.31 4.21E-0612 1.31 3.06E-062 1.31 7.10E-067 1.31 4.27E-0612 1.31 3.22E-062 1.00 9.37E-067 1.00 7.21E-0612 1.00 5.67E-062 1.31 2.75E-057 1.31 2.07E-0512 1.31 1.66E-052 1.31 2.71E-057 1.31 2.13E-0512 1.31 1.67E-052 1.00 1.57E-057 1.00 1.20E-0512 1.00 9.89E-06
800
1
7
13
1400 1
1400
1
7
13
200
1
7
13
800
1
7
13
3
3
6

December 19, 2011 MwRSF Report No. TRP-03-251-11
246
Degree of Curvature
Grade (%)
Length of Feature (ft)
Height of Feature (ft)
Offset (ft)
SI b
2 1.31 4.62E-057 1.31 3.58E-0512 1.31 2.84E-052 1.31 4.56E-057 1.31 3.67E-0512 1.32 2.93E-052 0.99 4.26E-067 1.01 3.06E-0612 1.00 2.18E-062 1.31 1.23E-057 1.32 8.73E-0612 1.31 6.23E-062 1.31 1.27E-057 1.31 8.93E-0612 1.32 6.61E-062 1.00 1.83E-057 1.00 1.40E-0512 1.00 1.13E-052 1.31 5.23E-057 1.31 4.10E-0512 1.31 3.32E-052 1.31 5.30E-057 1.32 4.15E-0512 1.31 3.31E-052 1.00 2.96E-057 1.00 2.37E-0512 1.00 1.87E-052 1.31 8.44E-057 1.31 6.74E-0512 1.31 5.48E-052 1.31 8.69E-057 1.31 6.85E-0512 1.31 5.37E-052 1.00 4.75E-067 1.00 3.23E-0612 1.00 2.45E-062 1.31 1.42E-057 1.32 1.00E-0512 1.32 7.35E-06
200
1
7
800
1
7
13
1400
1
7
13
1400
7
13
200
1
7
13
3 6
6
0
3

December 19, 2011 MwRSF Report No. TRP-03-251-11
247
Degree of Curvature
Grade (%)
Length of Feature (ft)
Height of Feature (ft)
Offset (ft)
SI b
2 1.31 1.49E-057 1.31 9.86E-0612 1.31 7.40E-062 1.00 2.03E-057 1.00 1.58E-0512 1.00 1.27E-052 1.31 5.87E-057 1.32 4.63E-0512 1.31 3.76E-052 1.31 5.94E-057 1.31 4.61E-0512 1.31 3.60E-052 1.00 3.31E-057 1.00 2.61E-0512 1.00 2.09E-052 1.31 9.67E-057 1.31 7.54E-0512 1.32 6.15E-052 1.32 9.64E-057 1.31 7.68E-0512 1.31 6.05E-052 1.00 6.77E-067 1.01 4.52E-0612 1.00 3.24E-062 1.31 1.84E-057 1.32 1.37E-0512 1.32 9.98E-062 1.31 1.83E-057 1.31 1.32E-0512 1.31 1.06E-052 1.00 2.70E-057 1.00 2.10E-0512 1.00 1.72E-052 1.31 7.96E-057 1.31 6.09E-0512 1.31 4.85E-052 1.31 8.08E-057 1.32 6.25E-0512 1.32 4.99E-05
800
1
7
13
1400
1
7
13
200
1
7
13
200 13
800
1
7
13
6
3
6
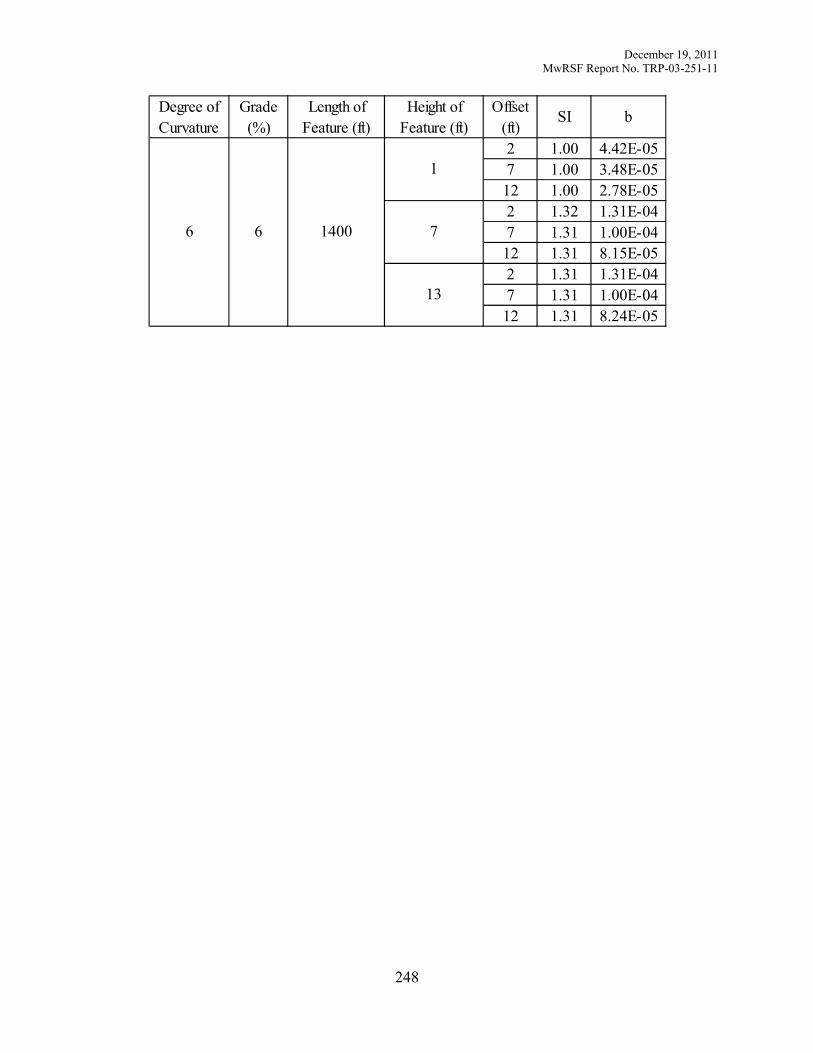
December 19, 2011 MwRSF Report No. TRP-03-251-11
248
Degree of Curvature
Grade (%)
Length of Feature (ft)
Height of Feature (ft)
Offset (ft)
SI b
2 1.00 4.42E-057 1.00 3.48E-0512 1.00 2.78E-052 1.32 1.31E-047 1.31 1.00E-0412 1.31 8.15E-052 1.31 1.31E-047 1.31 1.00E-0412 1.31 8.24E-05
1400
1
7
13
6 6

December 19, 2011 MwRSF Report No. TRP-03-251-11
249
Appendix S. 1V:4H Rural Local

December 19, 2011 MwRSF Report No. TRP-03-251-11
250
Degree of Curvature
Grade (%)
Length of Feature (ft)
Height of Feature (ft)
Offset (ft)
SI b
2 0.99 7.37E-067 0.99 4.99E-0612 0.99 3.66E-062 1.30 1.99E-057 1.30 1.39E-0512 1.30 9.91E-062 1.30 2.05E-057 1.30 1.44E-0512 1.30 1.01E-052 0.99 2.56E-057 0.99 1.87E-0512 0.99 1.31E-052 1.30 6.13E-057 1.30 4.58E-0512 1.30 3.24E-052 1.30 6.26E-057 1.30 4.58E-0512 1.30 3.18E-052 0.99 4.44E-057 0.99 3.18E-0512 0.99 2.28E-052 1.30 1.05E-047 1.30 7.69E-0512 1.30 5.49E-052 1.30 1.06E-047 1.30 7.67E-0512 1.30 5.51E-052 0.99 8.93E-067 0.99 6.34E-0612 0.99 4.46E-062 1.30 2.50E-057 1.30 1.72E-0512 1.30 1.23E-052 1.30 2.51E-057 1.30 1.77E-0512 1.29 1.22E-052 0.99 3.16E-057 0.99 2.29E-0512 0.99 1.65E-05
800 1
1400
1
7
13
200
1
7
13
200
1
7
13
800
1
7
13
0
0
4

December 19, 2011 MwRSF Report No. TRP-03-251-11
251
Degree of Curvature
Grade (%)
Length of Feature (ft)
Height of Feature (ft)
Offset (ft)
SI b
2 1.30 7.95E-057 1.30 5.70E-0512 1.30 4.00E-052 1.30 7.93E-057 1.30 5.69E-0512 1.30 4.05E-052 0.99 5.47E-057 0.99 3.95E-0512 0.99 2.84E-052 1.30 1.31E-047 1.30 9.56E-0512 1.30 6.85E-052 1.30 1.33E-047 1.30 9.60E-0512 1.30 6.90E-052 0.99 1.10E-057 0.99 7.55E-0612 0.99 5.35E-062 1.30 3.03E-057 1.30 2.04E-0512 1.30 1.47E-052 1.30 2.99E-057 1.30 2.13E-0512 1.30 1.49E-052 0.99 3.77E-057 0.99 2.74E-0512 0.99 1.98E-052 1.30 9.34E-057 1.30 6.77E-0512 1.30 4.87E-052 1.30 9.44E-057 1.30 6.88E-0512 1.30 4.82E-052 0.99 6.61E-057 0.99 4.76E-0512 0.99 3.38E-052 1.30 1.58E-047 1.30 1.17E-0412 1.30 8.20E-05
1400
1
7
200
1
7
13
800
1
7
13
800
7
13
1400
1
7
13
0
4
8

December 19, 2011 MwRSF Report No. TRP-03-251-11
252
Degree of Curvature
Grade (%)
Length of Feature (ft)
Height of Feature (ft)
Offset (ft)
SI b
2 1.30 1.59E-047 1.30 1.16E-0412 1.30 8.29E-052 0.99 1.33E-057 0.99 8.66E-0612 0.99 6.00E-062 1.30 3.04E-057 1.30 2.20E-0512 1.30 1.49E-052 1.30 3.22E-057 1.30 2.23E-0512 1.30 1.45E-052 0.99 5.03E-057 0.99 3.64E-0512 0.99 2.59E-052 1.30 1.19E-047 1.30 8.65E-0512 1.30 6.12E-052 1.30 1.20E-047 1.30 8.77E-0512 1.30 6.11E-052 0.99 8.61E-057 0.99 6.31E-0512 0.99 4.42E-052 1.30 2.01E-047 1.30 1.48E-0412 1.30 1.05E-042 1.30 2.02E-047 1.30 1.47E-0412 1.30 1.03E-042 1.00 1.62E-057 0.99 1.12E-0512 0.99 7.31E-062 1.30 3.88E-057 1.30 2.75E-0512 1.29 1.79E-052 1.29 3.82E-057 1.30 2.71E-0512 1.30 1.80E-05
200
1
7
13
800
1
7
13
1400
1
7
13
1400 13
200
1
7
13
0 8
4
0
4

December 19, 2011 MwRSF Report No. TRP-03-251-11
253
Degree of Curvature
Grade (%)
Length of Feature (ft)
Height of Feature (ft)
Offset (ft)
SI b
2 0.99 6.31E-057 0.99 4.51E-0512 0.99 3.23E-052 1.30 1.47E-047 1.30 1.09E-0412 1.30 7.68E-052 1.30 1.49E-047 1.30 1.10E-0412 1.30 7.62E-052 0.99 1.08E-047 0.99 7.82E-0512 0.99 5.56E-052 1.30 2.53E-047 1.30 1.88E-0412 1.30 1.30E-042 1.30 2.58E-047 1.30 1.85E-0412 1.30 1.31E-042 0.99 1.89E-057 0.99 1.34E-0512 0.99 9.03E-062 1.30 4.78E-057 1.30 3.14E-0512 1.30 2.15E-052 1.30 4.75E-057 1.30 3.30E-0512 1.30 2.22E-052 0.99 7.52E-057 0.99 5.44E-0512 0.99 3.88E-052 1.30 1.75E-047 1.30 1.31E-0412 1.30 9.24E-052 1.30 1.81E-047 1.30 1.29E-0412 1.30 9.15E-052 0.99 1.30E-047 0.99 9.46E-0512 0.99 6.56E-05
800
1
7
13
1400 1
1400
1
7
13
200
1
7
13
800
1
7
13
4
4
8

December 19, 2011 MwRSF Report No. TRP-03-251-11
254
Degree of Curvature
Grade (%)
Length of Feature (ft)
Height of Feature (ft)
Offset (ft)
SI b
2 1.30 3.06E-047 1.30 2.20E-0412 1.30 1.55E-042 1.30 3.03E-047 1.30 2.21E-0412 1.30 1.57E-042 0.99 1.92E-057 1.00 1.24E-0512 0.99 7.96E-062 1.29 4.51E-057 1.30 3.09E-0512 1.30 1.92E-052 1.30 4.57E-057 1.29 2.98E-0512 1.30 1.95E-052 0.99 6.74E-057 0.99 4.92E-0512 0.99 3.39E-052 1.30 1.60E-047 1.30 1.15E-0412 1.30 8.26E-052 1.30 1.59E-047 1.30 1.16E-0412 1.30 8.09E-052 0.99 1.11E-047 0.99 8.01E-0512 0.99 5.61E-052 1.30 2.59E-047 1.30 1.87E-0412 1.30 1.31E-042 1.30 2.60E-047 1.30 1.86E-0412 1.30 1.34E-042 0.99 2.33E-057 0.99 1.57E-0512 0.99 9.83E-062 1.29 5.54E-057 1.30 3.72E-0512 1.31 2.42E-05
200
1
7
800
1
7
13
1400
1
7
13
1400
7
13
200
1
7
13
4 8
8
0
4

December 19, 2011 MwRSF Report No. TRP-03-251-11
255
Degree of Curvature
Grade (%)
Length of Feature (ft)
Height of Feature (ft)
Offset (ft)
SI b
2 1.29 5.38E-057 1.30 3.86E-0512 1.30 2.32E-052 0.99 8.53E-057 0.99 6.03E-0512 0.99 4.32E-052 1.30 1.99E-047 1.30 1.44E-0412 1.30 1.01E-042 1.30 1.99E-047 1.30 1.47E-0412 1.30 1.01E-042 0.99 1.38E-047 0.99 1.01E-0412 0.99 6.98E-052 1.30 3.23E-047 1.30 2.33E-0412 1.30 1.66E-042 1.30 3.23E-047 1.30 2.37E-0412 1.30 1.64E-042 0.99 2.81E-057 0.99 1.83E-0512 0.99 1.18E-052 1.29 6.67E-057 1.30 4.45E-0512 1.30 2.89E-052 1.30 6.75E-057 1.30 4.34E-0512 1.30 2.94E-052 0.99 1.01E-047 0.99 7.38E-0512 0.99 5.16E-052 1.30 2.39E-047 1.30 1.74E-0412 1.30 1.24E-042 1.30 2.39E-047 1.30 1.72E-0412 1.30 1.23E-04
800
1
7
13
1400
1
7
13
200
1
7
13
200 13
800
1
7
13
8
4
8

December 19, 2011 MwRSF Report No. TRP-03-251-11
256
Degree of Curvature
Grade (%)
Length of Feature (ft)
Height of Feature (ft)
Offset (ft)
SI b
2 0.99 1.66E-047 0.99 1.20E-0412 0.99 8.47E-052 1.30 3.89E-047 1.30 2.84E-0412 1.30 1.97E-042 1.30 3.88E-047 1.30 2.82E-0412 1.30 1.97E-04
1400
1
7
13
8 8

December 19, 2011 MwRSF Report No. TRP-03-251-11
257
Appendix T. 1V:4H Undivided Urban Arterial
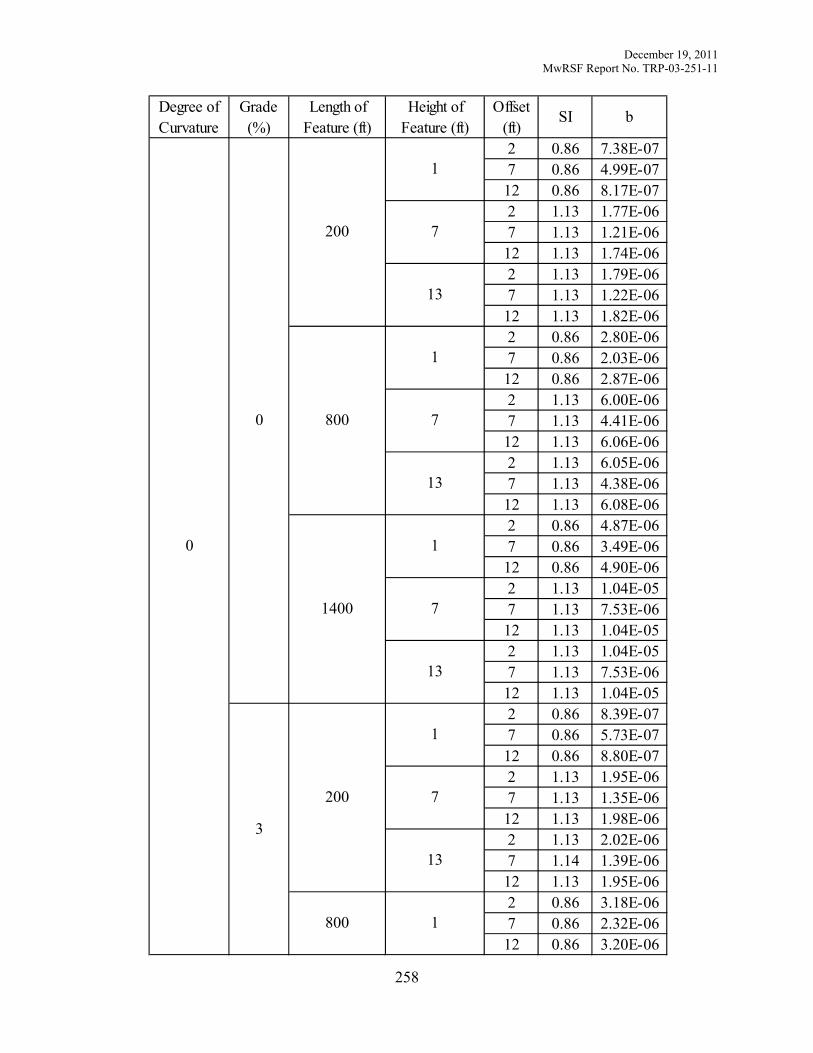
December 19, 2011 MwRSF Report No. TRP-03-251-11
258
Degree of Curvature
Grade (%)
Length of Feature (ft)
Height of Feature (ft)
Offset (ft)
SI b
2 0.86 7.38E-077 0.86 4.99E-0712 0.86 8.17E-072 1.13 1.77E-067 1.13 1.21E-0612 1.13 1.74E-062 1.13 1.79E-067 1.13 1.22E-0612 1.13 1.82E-062 0.86 2.80E-067 0.86 2.03E-0612 0.86 2.87E-062 1.13 6.00E-067 1.13 4.41E-0612 1.13 6.06E-062 1.13 6.05E-067 1.13 4.38E-0612 1.13 6.08E-062 0.86 4.87E-067 0.86 3.49E-0612 0.86 4.90E-062 1.13 1.04E-057 1.13 7.53E-0612 1.13 1.04E-052 1.13 1.04E-057 1.13 7.53E-0612 1.13 1.04E-052 0.86 8.39E-077 0.86 5.73E-0712 0.86 8.80E-072 1.13 1.95E-067 1.13 1.35E-0612 1.13 1.98E-062 1.13 2.02E-067 1.14 1.39E-0612 1.13 1.95E-062 0.86 3.18E-067 0.86 2.32E-0612 0.86 3.20E-06
800 1
1400
1
7
13
200
1
7
13
200
1
7
13
800
1
7
13
0
0
3

December 19, 2011 MwRSF Report No. TRP-03-251-11
259
Degree of Curvature
Grade (%)
Length of Feature (ft)
Height of Feature (ft)
Offset (ft)
SI b
2 1.13 6.76E-067 1.13 4.92E-0612 1.13 6.89E-062 1.13 6.81E-067 1.13 4.91E-0612 1.13 6.79E-062 0.86 5.52E-067 0.86 3.94E-0612 0.86 5.47E-062 1.13 1.18E-057 1.13 8.52E-0612 1.13 1.17E-052 1.13 1.17E-057 1.13 8.51E-0612 1.13 1.16E-052 0.86 1.12E-067 0.86 7.40E-0712 0.86 1.17E-062 1.13 2.59E-067 1.13 1.82E-0612 1.13 2.64E-062 1.13 2.66E-067 1.13 1.85E-0612 1.13 2.66E-062 0.86 4.21E-067 0.86 3.02E-0612 0.86 4.30E-062 1.13 9.11E-067 1.13 6.55E-0612 1.13 9.04E-062 1.13 9.21E-067 1.13 6.54E-0612 1.13 9.14E-062 0.86 7.43E-067 0.86 5.28E-0612 0.86 7.38E-062 1.13 1.54E-057 1.13 1.13E-0512 1.13 1.56E-05
1400
1
7
200
1
7
13
800
1
7
13
800
7
13
1400
1
7
13
0
3
6

December 19, 2011 MwRSF Report No. TRP-03-251-11
260
Degree of Curvature
Grade (%)
Length of Feature (ft)
Height of Feature (ft)
Offset (ft)
SI b
2 1.13 1.55E-057 1.13 1.13E-0512 1.13 1.56E-052 0.86 1.29E-067 0.86 8.92E-0712 0.86 1.35E-062 1.12 2.79E-067 1.13 1.87E-0612 1.13 2.84E-062 1.13 2.83E-067 1.13 1.87E-0612 1.13 2.82E-062 0.86 5.45E-067 0.86 3.91E-0612 0.86 5.47E-062 1.13 1.15E-057 1.13 8.17E-0612 1.13 1.14E-052 1.13 1.15E-057 1.13 8.15E-0612 1.13 1.15E-052 0.86 9.51E-067 0.86 6.82E-0612 0.86 9.56E-062 1.13 1.99E-057 1.13 1.42E-0512 1.13 1.98E-052 1.13 1.98E-057 1.13 1.41E-0512 1.13 1.98E-052 0.86 1.48E-067 0.86 9.99E-0712 0.86 1.46E-062 1.12 3.16E-067 1.13 2.11E-0612 1.13 3.18E-062 1.13 3.20E-067 1.13 2.07E-0612 1.13 3.10E-06
200
1
7
13
800
1
7
13
1400
1
7
13
1400 13
200
1
7
13
0 6
4
0
3

December 19, 2011 MwRSF Report No. TRP-03-251-11
261
Degree of Curvature
Grade (%)
Length of Feature (ft)
Height of Feature (ft)
Offset (ft)
SI b
2 0.86 6.14E-067 0.86 4.47E-0612 0.86 6.18E-062 1.13 1.29E-057 1.13 9.14E-0612 1.13 1.31E-052 1.13 1.30E-057 1.13 9.31E-0612 1.13 1.28E-052 0.86 1.06E-057 0.86 7.63E-0612 0.86 1.06E-052 1.13 2.25E-057 1.13 1.61E-0512 1.13 2.23E-052 1.13 2.22E-057 1.13 1.60E-0512 1.13 2.20E-052 0.86 1.99E-067 0.86 1.31E-0612 0.86 2.00E-062 1.13 4.19E-067 1.13 2.73E-0612 1.13 4.23E-062 1.13 4.27E-067 1.13 2.86E-0612 1.13 4.34E-062 0.86 8.17E-067 0.86 5.86E-0612 0.86 8.15E-062 1.13 1.75E-057 1.13 1.22E-0512 1.13 1.71E-052 1.13 1.72E-057 1.13 1.23E-0512 1.13 1.70E-052 0.86 1.44E-057 0.86 1.02E-0512 0.86 1.40E-05
800
1
7
13
1400 1
1400
1
7
13
200
1
7
13
800
1
7
13
4
3
6

December 19, 2011 MwRSF Report No. TRP-03-251-11
262
Degree of Curvature
Grade (%)
Length of Feature (ft)
Height of Feature (ft)
Offset (ft)
SI b
2 1.13 2.95E-057 1.13 2.15E-0512 1.13 2.95E-052 1.13 2.96E-057 1.13 2.16E-0512 1.13 3.01E-052 0.86 1.91E-067 0.86 1.21E-0612 0.85 1.90E-062 1.13 3.98E-067 1.13 2.54E-0612 1.13 4.00E-062 1.13 3.94E-067 1.13 2.61E-0612 1.13 4.07E-062 0.86 7.19E-067 0.86 5.15E-0612 0.86 7.25E-062 1.13 1.50E-057 1.13 1.08E-0512 1.13 1.50E-052 1.13 1.51E-057 1.13 1.09E-0512 1.13 1.53E-052 0.86 1.15E-057 0.86 8.19E-0612 0.86 1.15E-052 1.13 2.39E-057 1.13 1.72E-0512 1.13 2.39E-052 1.13 2.40E-057 1.13 1.71E-0512 1.13 2.40E-052 0.86 2.13E-067 0.86 1.34E-0612 0.86 2.18E-062 1.13 4.36E-067 1.13 2.88E-0612 1.12 4.50E-06
200
1
7
800
1
7
13
1400
1
7
13
1400
7
13
200
1
7
13
4 6
8
0
3

December 19, 2011 MwRSF Report No. TRP-03-251-11
263
Degree of Curvature
Grade (%)
Length of Feature (ft)
Height of Feature (ft)
Offset (ft)
SI b
2 1.13 4.37E-067 1.13 2.88E-0612 1.13 4.51E-062 0.86 8.03E-067 0.86 5.81E-0612 0.86 8.18E-062 1.13 1.68E-057 1.13 1.20E-0512 1.13 1.67E-052 1.13 1.71E-057 1.13 1.22E-0512 1.13 1.69E-052 0.86 1.29E-057 0.86 9.21E-0612 0.86 1.28E-052 1.13 2.71E-057 1.13 1.94E-0512 1.13 2.68E-052 1.13 2.70E-057 1.13 1.94E-0512 1.13 2.73E-052 0.86 2.85E-067 0.86 1.81E-0612 0.86 2.90E-062 1.12 5.98E-067 1.14 3.84E-0612 1.13 6.01E-062 1.13 6.09E-067 1.13 3.75E-0612 1.13 6.29E-062 0.86 1.09E-057 0.86 7.68E-0612 0.86 1.10E-052 1.13 2.27E-057 1.13 1.62E-0512 1.13 2.26E-052 1.13 2.27E-057 1.13 1.62E-0512 1.13 2.27E-05
800
1
7
13
1400
1
7
13
200
1
7
13
200 13
800
1
7
13
8
3
6

December 19, 2011 MwRSF Report No. TRP-03-251-11
264
Degree of Curvature
Grade (%)
Length of Feature (ft)
Height of Feature (ft)
Offset (ft)
SI b
2 0.86 1.72E-057 0.86 1.22E-0512 0.86 1.75E-052 1.13 3.58E-057 1.13 2.57E-0512 1.13 3.57E-052 1.13 3.61E-057 1.13 2.58E-0512 1.12 3.58E-05
1400
1
7
13
8 6

December 19, 2011 MwRSF Report No. TRP-03-251-11
265
Appendix U. 1V:4H Divided Urban Arterial

December 19, 2011 MwRSF Report No. TRP-03-251-11
266
Degree of Curvature
Grade (%)
Length of Feature (ft)
Height of Feature (ft)
Offset (ft)
SI b
2 1.02 2.25E-067 1.02 1.66E-0612 1.02 1.27E-062 1.33 7.17E-067 1.33 5.51E-0612 1.34 4.45E-062 1.34 7.80E-067 1.34 6.15E-0612 1.33 5.05E-062 1.02 8.74E-067 1.02 6.88E-0612 1.02 5.55E-062 1.34 2.38E-057 1.33 1.90E-0512 1.33 1.54E-052 1.34 2.43E-057 1.34 1.97E-0512 1.34 1.58E-052 1.01 1.51E-057 1.02 1.20E-0512 1.02 9.83E-062 1.34 4.06E-057 1.33 3.25E-0512 1.33 2.66E-052 1.34 4.14E-057 1.34 3.32E-0512 1.33 2.73E-052 1.02 2.52E-067 1.02 1.85E-0612 1.02 1.48E-062 1.33 7.88E-067 1.33 6.22E-0612 1.33 5.06E-062 1.34 8.80E-067 1.33 6.87E-0612 1.34 5.73E-062 1.02 9.80E-067 1.02 7.67E-0612 1.02 6.15E-06
800 1
1400
1
7
13
200
1
7
13
200
1
7
13
800
1
7
13
0
0
3

December 19, 2011 MwRSF Report No. TRP-03-251-11
267
Degree of Curvature
Grade (%)
Length of Feature (ft)
Height of Feature (ft)
Offset (ft)
SI b
2 1.33 2.68E-057 1.34 2.13E-0512 1.34 1.76E-052 1.34 2.77E-057 1.34 2.22E-0512 1.33 1.79E-052 1.02 1.70E-057 1.02 1.34E-0512 1.02 1.11E-052 1.33 4.56E-057 1.33 3.66E-0512 1.34 3.01E-052 1.33 4.66E-057 1.33 3.75E-0512 1.33 3.00E-052 1.02 3.30E-067 1.01 2.46E-0612 1.02 1.91E-062 1.34 1.07E-057 1.33 8.25E-0612 1.33 6.56E-062 1.33 1.18E-057 1.33 9.35E-0612 1.33 7.47E-062 1.02 1.29E-057 1.02 1.02E-0512 1.01 8.31E-062 1.34 3.62E-057 1.33 2.82E-0512 1.34 2.31E-052 1.33 3.70E-057 1.33 2.93E-0512 1.33 2.37E-052 1.02 2.29E-057 1.02 1.81E-0512 1.02 1.48E-052 1.33 6.10E-057 1.33 4.85E-0512 1.33 3.96E-05
1400
1
7
200
1
7
13
800
1
7
13
800
7
13
1400
1
7
13
0
3
6

December 19, 2011 MwRSF Report No. TRP-03-251-11
268
Degree of Curvature
Grade (%)
Length of Feature (ft)
Height of Feature (ft)
Offset (ft)
SI b
2 1.33 6.25E-057 1.34 4.96E-0512 1.33 4.05E-052 1.01 3.77E-067 1.01 2.68E-0612 1.02 2.01E-062 1.34 9.99E-067 1.34 7.13E-0612 1.34 5.22E-062 1.34 1.02E-057 1.34 7.28E-0612 1.33 5.26E-062 1.02 1.64E-057 1.02 1.29E-0512 1.02 1.04E-052 1.33 4.31E-057 1.33 3.38E-0512 1.33 2.64E-052 1.33 4.30E-057 1.34 3.40E-0512 1.33 2.77E-052 1.02 2.87E-057 1.02 2.29E-0512 1.02 1.82E-052 1.34 7.54E-057 1.33 5.86E-0512 1.33 4.80E-052 1.33 7.41E-057 1.33 5.78E-0512 1.33 4.77E-052 1.01 4.28E-067 1.02 3.17E-0612 1.02 2.20E-062 1.34 1.15E-057 1.33 7.93E-0612 1.33 5.76E-062 1.34 1.14E-057 1.34 8.44E-0612 1.33 5.95E-06
200
1
7
13
800
1
7
13
1400
1
7
13
1400 13
200
1
7
13
0 6
4
0
3

December 19, 2011 MwRSF Report No. TRP-03-251-11
269
Degree of Curvature
Grade (%)
Length of Feature (ft)
Height of Feature (ft)
Offset (ft)
SI b
2 1.02 1.86E-057 1.02 1.46E-0512 1.02 1.17E-052 1.33 4.86E-057 1.33 3.74E-0512 1.34 3.07E-052 1.33 4.82E-057 1.33 3.83E-0512 1.33 3.07E-052 1.02 3.25E-057 1.02 2.54E-0512 1.02 2.05E-052 1.33 8.47E-057 1.34 6.67E-0512 1.33 5.41E-052 1.33 8.40E-057 1.33 6.68E-0512 1.33 5.33E-052 1.01 5.76E-067 1.01 4.16E-0612 1.02 2.95E-062 1.34 1.51E-057 1.35 1.05E-0512 1.33 7.73E-062 1.34 1.55E-057 1.33 1.11E-0512 1.33 7.80E-062 1.02 2.46E-057 1.02 1.96E-0512 1.02 1.55E-052 1.34 6.49E-057 1.33 4.98E-0512 1.34 4.05E-052 1.33 6.47E-057 1.33 5.03E-0512 1.33 4.04E-052 1.02 4.33E-057 1.02 3.38E-0512 1.02 2.76E-05
800
1
7
13
1400 1
1400
1
7
13
200
1
7
13
800
1
7
13
4
3
6

December 19, 2011 MwRSF Report No. TRP-03-251-11
270
Degree of Curvature
Grade (%)
Length of Feature (ft)
Height of Feature (ft)
Offset (ft)
SI b
2 1.33 1.12E-047 1.33 8.82E-0512 1.33 7.09E-052 1.33 1.11E-047 1.33 8.76E-0512 1.33 7.11E-052 1.02 5.70E-067 1.02 3.75E-0612 1.02 2.57E-062 1.33 1.45E-057 1.33 1.00E-0512 1.34 6.87E-062 1.35 1.47E-057 1.34 9.71E-0612 1.33 6.77E-062 1.01 2.14E-057 1.02 1.70E-0512 1.02 1.35E-052 1.33 5.54E-057 1.33 4.47E-0512 1.33 3.44E-052 1.33 5.55E-057 1.34 4.33E-0512 1.34 3.48E-052 1.02 3.37E-057 1.02 2.67E-0512 1.02 2.16E-052 1.34 8.97E-057 1.33 6.91E-0512 1.34 5.54E-052 1.33 8.75E-057 1.34 6.89E-0512 1.34 5.56E-052 1.02 6.11E-067 1.02 4.25E-0612 1.01 2.83E-062 1.33 1.63E-057 1.34 1.15E-0512 1.33 7.61E-06
200
1
7
800
1
7
13
1400
1
7
13
1400
7
13
200
1
7
13
4 6
8
0
3

December 19, 2011 MwRSF Report No. TRP-03-251-11
271
Degree of Curvature
Grade (%)
Length of Feature (ft)
Height of Feature (ft)
Offset (ft)
SI b
2 1.34 1.66E-057 1.33 1.09E-0512 1.33 7.65E-062 1.02 2.44E-057 1.02 1.86E-0512 1.02 1.51E-052 1.33 6.27E-057 1.34 4.92E-0512 1.34 3.90E-052 1.34 6.29E-057 1.34 4.89E-0512 1.33 3.85E-052 1.02 3.84E-057 1.02 2.99E-0512 1.02 2.42E-052 1.34 9.96E-057 1.33 7.77E-0512 1.34 6.31E-052 1.34 1.00E-047 1.33 7.75E-0512 1.33 6.25E-052 1.02 8.66E-067 1.02 5.62E-0612 1.02 3.87E-062 1.33 2.27E-057 1.33 1.49E-0512 1.33 1.00E-052 1.34 2.15E-057 1.33 1.43E-0512 1.33 9.93E-062 1.02 3.19E-057 1.02 2.51E-0512 1.02 2.01E-052 1.34 8.28E-057 1.34 6.63E-0512 1.33 5.12E-052 1.33 8.26E-057 1.33 6.54E-0512 1.34 5.20E-05
800
1
7
13
1400
1
7
13
200
1
7
13
200 13
800
1
7
13
8
3
6

December 19, 2011 MwRSF Report No. TRP-03-251-11
272
Degree of Curvature
Grade (%)
Length of Feature (ft)
Height of Feature (ft)
Offset (ft)
SI b
2 1.01 5.18E-057 1.02 4.02E-0512 1.02 3.25E-052 1.34 1.32E-047 1.34 1.03E-0412 1.33 8.31E-052 1.34 1.35E-047 1.33 1.04E-0412 1.33 8.30E-05
1400
1
7
13
8 6

December 19, 2011 MwRSF Report No. TRP-03-251-11
273
Appendix V. 1V:4H Urban Local

December 19, 2011 MwRSF Report No. TRP-03-251-11
274
Degree of Curvature
Grade (%)
Length of Feature (ft)
Height of Feature (ft)
Offset (ft)
SI b
2 1.06 9.29E-067 1.06 6.30E-0612 1.06 4.41E-062 1.39 2.89E-057 1.39 2.00E-0512 1.39 1.37E-052 1.39 3.01E-057 1.40 2.07E-0512 1.38 1.37E-052 1.06 3.49E-057 1.06 2.53E-0512 1.06 1.77E-052 1.39 9.93E-057 1.39 7.25E-0512 1.39 5.10E-052 1.39 1.00E-047 1.39 7.30E-0512 1.39 5.05E-052 1.06 6.05E-057 1.06 4.39E-0512 1.06 3.09E-052 1.39 1.72E-047 1.39 1.26E-0412 1.39 8.77E-052 1.39 1.72E-047 1.39 1.26E-0412 1.39 8.88E-052 1.06 1.38E-057 1.06 1.01E-0512 1.06 6.47E-062 1.39 4.33E-057 1.40 3.06E-0512 1.39 2.10E-052 1.38 4.36E-057 1.38 3.14E-0512 1.40 2.10E-052 1.06 5.17E-057 1.06 3.80E-0512 1.06 2.65E-05
800 1
1400
1
7
13
200
1
7
13
200
1
7
13
800
1
7
13
0
0
6

December 19, 2011 MwRSF Report No. TRP-03-251-11
275
Degree of Curvature
Grade (%)
Length of Feature (ft)
Height of Feature (ft)
Offset (ft)
SI b
2 1.39 1.51E-047 1.39 1.08E-0412 1.38 7.64E-052 1.40 1.53E-047 1.39 1.08E-0412 1.39 7.72E-052 1.06 9.02E-057 1.06 6.63E-0512 1.06 4.70E-052 1.39 2.55E-047 1.38 1.85E-0412 1.39 1.34E-042 1.39 2.56E-047 1.39 1.88E-0412 1.39 1.33E-042 1.06 1.45E-057 1.06 9.70E-0612 1.06 6.65E-062 1.39 4.30E-057 1.39 3.00E-0512 1.40 2.19E-052 1.39 4.38E-057 1.38 3.00E-0512 1.39 2.11E-052 1.06 5.17E-057 1.06 3.73E-0512 1.06 2.64E-052 1.39 1.48E-047 1.39 1.08E-0412 1.39 7.67E-052 1.39 1.52E-047 1.38 1.08E-0412 1.39 7.66E-052 1.06 8.85E-057 1.06 6.59E-0512 1.06 4.70E-052 1.39 2.56E-047 1.39 1.88E-0412 1.39 1.34E-04
1400
1
7
200
1
7
13
800
1
7
13
800
7
13
1400
1
7
13
0
6
12

December 19, 2011 MwRSF Report No. TRP-03-251-11
276
Degree of Curvature
Grade (%)
Length of Feature (ft)
Height of Feature (ft)
Offset (ft)
SI b
2 1.39 2.58E-047 1.39 1.88E-0412 1.39 1.33E-042 1.07 9.81E-067 1.05 6.07E-0612 1.06 4.04E-062 1.39 2.71E-057 1.39 1.81E-0512 1.39 1.22E-052 1.39 2.81E-057 1.39 1.77E-0512 1.40 1.19E-052 1.06 3.68E-057 1.07 2.62E-0512 1.06 1.84E-052 1.39 1.03E-047 1.39 7.19E-0512 1.39 5.17E-052 1.39 1.04E-047 1.39 7.49E-0512 1.39 5.18E-052 1.06 6.13E-057 1.06 4.44E-0512 1.06 3.17E-052 1.39 1.73E-047 1.39 1.24E-0412 1.39 8.94E-052 1.39 1.74E-047 1.39 1.24E-0412 1.39 8.91E-052 1.06 1.47E-057 1.06 9.07E-0612 1.06 6.12E-062 1.39 4.17E-057 1.38 2.64E-0512 1.38 1.82E-052 1.39 4.22E-057 1.40 2.73E-0512 1.39 1.76E-05
200
1
7
13
800
1
7
13
1400
1
7
13
1400 13
200
1
7
13
0 12
3
0
6

December 19, 2011 MwRSF Report No. TRP-03-251-11
277
Degree of Curvature
Grade (%)
Length of Feature (ft)
Height of Feature (ft)
Offset (ft)
SI b
2 1.06 5.45E-057 1.06 3.88E-0512 1.06 2.74E-052 1.39 1.57E-047 1.39 1.12E-0412 1.38 7.72E-052 1.39 1.56E-047 1.39 1.11E-0412 1.39 7.76E-052 1.06 9.30E-057 1.06 6.83E-0512 1.06 4.69E-052 1.39 2.61E-047 1.39 1.90E-0412 1.39 1.35E-042 1.39 2.60E-047 1.39 1.89E-0412 1.38 1.34E-042 1.06 1.42E-057 1.06 9.10E-0612 1.05 5.91E-062 1.39 4.01E-057 1.39 2.70E-0512 1.39 1.82E-052 1.39 4.12E-057 1.40 2.75E-0512 1.39 1.80E-052 1.06 5.45E-057 1.06 3.94E-0512 1.06 2.76E-052 1.40 1.55E-047 1.39 1.11E-0412 1.39 7.73E-052 1.39 1.54E-047 1.39 1.11E-0412 1.39 7.82E-052 1.06 9.15E-057 1.06 6.64E-0512 1.06 4.74E-05
800
1
7
13
1400 1
1400
1
7
13
200
1
7
13
800
1
7
13
3
6
12

December 19, 2011 MwRSF Report No. TRP-03-251-11
278
Degree of Curvature
Grade (%)
Length of Feature (ft)
Height of Feature (ft)
Offset (ft)
SI b
2 1.39 2.63E-047 1.39 1.87E-0412 1.39 1.33E-042 1.39 2.61E-047 1.39 1.89E-0412 1.38 1.33E-042 1.05 2.74E-057 1.06 1.92E-0512 1.06 1.31E-052 1.39 8.55E-057 1.38 5.63E-0512 1.39 3.63E-052 1.39 8.54E-057 1.39 5.75E-0512 1.39 3.67E-052 1.06 1.08E-047 1.06 8.05E-0512 1.06 5.47E-052 1.39 3.10E-047 1.39 2.21E-0412 1.39 1.58E-042 1.39 3.07E-047 1.39 2.23E-0412 1.39 1.55E-042 1.06 1.80E-047 1.06 1.31E-0412 1.06 9.24E-052 1.39 5.05E-047 1.39 3.61E-0412 1.39 2.61E-042 1.39 5.12E-047 1.39 3.58E-0412 1.39 2.56E-042 1.06 4.19E-057 1.07 2.88E-0512 1.06 1.93E-052 1.39 1.26E-047 1.39 8.25E-0512 1.39 5.57E-05
200
1
7
800
1
7
13
1400
1
7
13
1400
7
13
200
1
7
13
3 12
6
0
6

December 19, 2011 MwRSF Report No. TRP-03-251-11
279
Degree of Curvature
Grade (%)
Length of Feature (ft)
Height of Feature (ft)
Offset (ft)
SI b
2 1.40 1.23E-047 1.39 8.35E-0512 1.38 5.51E-052 1.06 1.61E-047 1.06 1.18E-0412 1.06 8.34E-052 1.39 4.60E-047 1.39 3.38E-0412 1.39 2.31E-042 1.38 4.59E-047 1.39 3.39E-0412 1.39 2.32E-042 1.06 2.69E-047 1.06 1.95E-0412 1.06 1.37E-042 1.39 7.69E-047 1.39 5.43E-0412 1.39 3.89E-042 1.39 7.59E-047 1.39 5.49E-0412 1.39 3.86E-042 1.06 4.26E-057 1.06 2.98E-0512 1.05 1.84E-052 1.39 1.24E-047 1.38 8.36E-0512 1.38 5.41E-052 1.39 1.25E-047 1.39 8.45E-0512 1.38 5.46E-052 1.06 1.64E-047 1.06 1.21E-0412 1.06 8.32E-052 1.39 4.63E-047 1.39 3.36E-0412 1.39 2.36E-042 1.39 4.64E-047 1.39 3.35E-0412 1.40 2.38E-04
800
1
7
13
1400
1
7
13
200
1
7
13
200 13
800
1
7
13
6
6
12
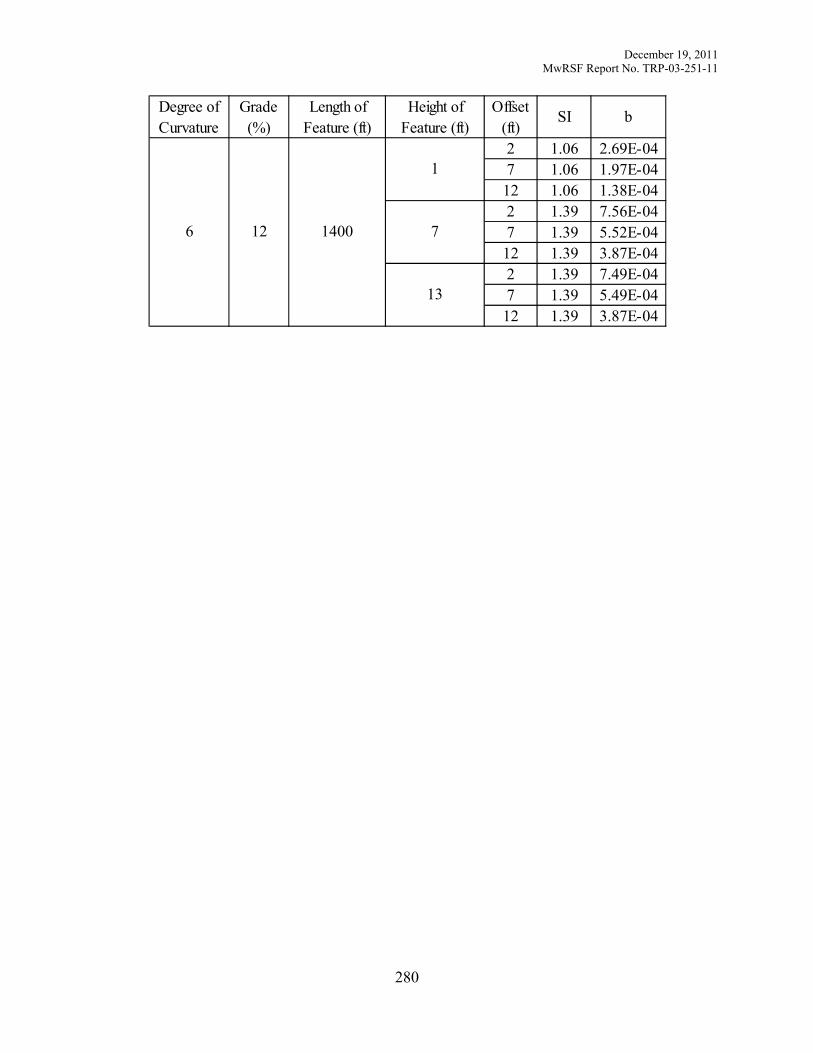
December 19, 2011 MwRSF Report No. TRP-03-251-11
280
Degree of Curvature
Grade (%)
Length of Feature (ft)
Height of Feature (ft)
Offset (ft)
SI b
2 1.06 2.69E-047 1.06 1.97E-0412 1.06 1.38E-042 1.39 7.56E-047 1.39 5.52E-0412 1.39 3.87E-042 1.39 7.49E-047 1.39 5.49E-0412 1.39 3.87E-04
1400
1
7
13
6 12

December 19, 2011 MwRSF Report No. TRP-03-251-11
281
Appendix W. 1V:6H Freeway

December 19, 2011 MwRSF Report No. TRP-03-251-11
282
Degree of Curvature
Grade (%)
Length of Feature (ft)
Height of Feature (ft)
Offset (ft)
SI b
2 1.47 9.15E-067 1.47 6.74E-0612 1.46 5.31E-062 1.47 1.17E-057 1.46 8.91E-0612 1.46 7.22E-062 1.46 1.22E-057 1.46 9.17E-0612 1.47 7.40E-062 1.47 3.58E-057 1.47 2.81E-0512 1.47 2.25E-052 1.47 3.83E-057 1.47 3.01E-0512 1.47 2.50E-052 1.47 3.84E-057 1.47 3.05E-0512 1.47 2.48E-052 1.47 6.31E-057 1.46 4.90E-0512 1.47 3.99E-052 1.47 6.47E-057 1.47 5.10E-0512 1.47 4.27E-052 1.47 6.54E-057 1.47 5.16E-0512 1.47 4.25E-052 1.47 9.14E-067 1.46 6.42E-0612 1.46 5.08E-062 1.47 1.20E-057 1.46 9.30E-0612 1.46 7.28E-062 1.46 1.22E-057 1.47 9.53E-0612 1.47 7.53E-062 1.47 3.55E-057 1.47 2.79E-0512 1.47 2.32E-05
800 1
1400
1
7
13
200
1
7
13
200
1
7
13
800
1
7
13
0
0
2

December 19, 2011 MwRSF Report No. TRP-03-251-11
283
Degree of Curvature
Grade (%)
Length of Feature (ft)
Height of Feature (ft)
Offset (ft)
SI b
2 1.47 3.79E-057 1.47 3.01E-0512 1.47 2.47E-052 1.46 3.87E-057 1.47 3.03E-0512 1.47 2.50E-052 1.46 6.16E-057 1.47 4.94E-0512 1.47 4.05E-052 1.47 6.54E-057 1.47 5.21E-0512 1.47 4.18E-052 1.47 6.54E-057 1.47 5.20E-0512 1.47 4.24E-052 1.46 1.06E-057 1.47 7.62E-0612 1.47 5.86E-062 1.47 1.31E-057 1.47 1.04E-0512 1.46 8.12E-062 1.47 1.38E-057 1.47 1.07E-0512 1.47 8.46E-062 1.47 3.98E-057 1.47 3.19E-0512 1.47 2.49E-052 1.47 4.27E-057 1.46 3.37E-0512 1.47 2.76E-052 1.47 4.42E-057 1.47 3.43E-0512 1.47 2.83E-052 1.47 7.09E-057 1.47 5.55E-0512 1.46 4.44E-052 1.47 7.27E-057 1.47 5.81E-0512 1.47 4.72E-05
1400
1
7
200
1
7
13
800
1
7
13
800
7
13
1400
1
7
13
0
2
3
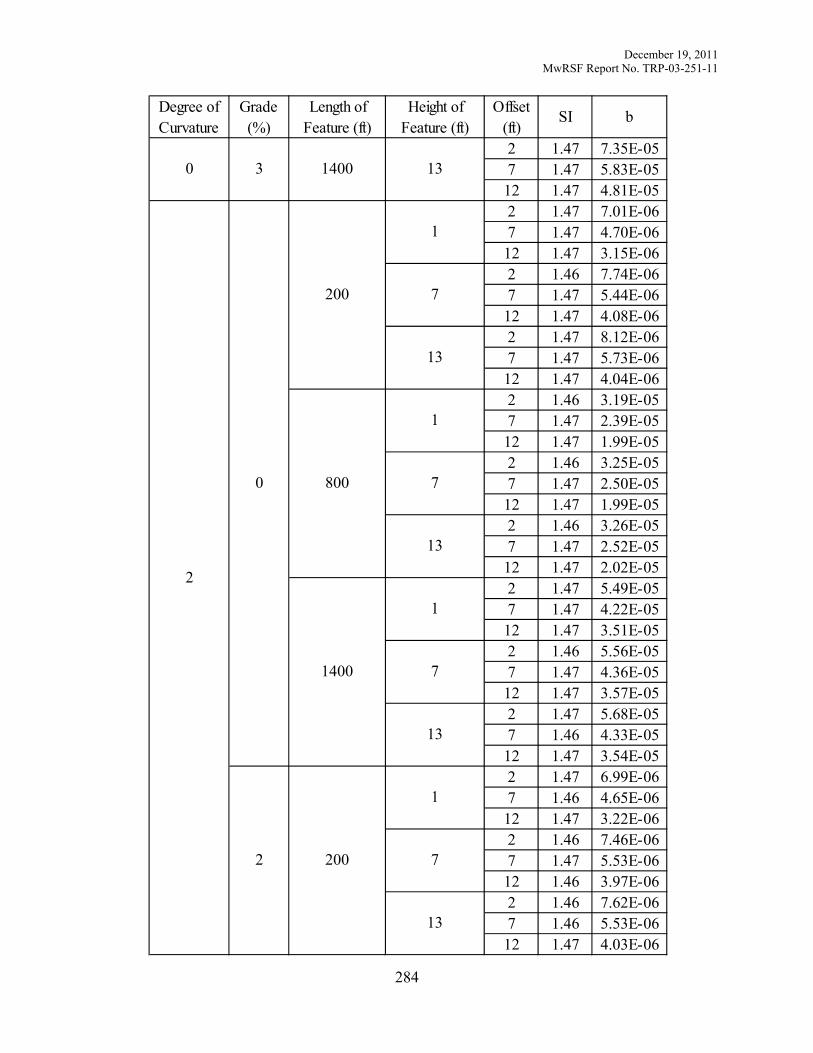
December 19, 2011 MwRSF Report No. TRP-03-251-11
284
Degree of Curvature
Grade (%)
Length of Feature (ft)
Height of Feature (ft)
Offset (ft)
SI b
2 1.47 7.35E-057 1.47 5.83E-0512 1.47 4.81E-052 1.47 7.01E-067 1.47 4.70E-0612 1.47 3.15E-062 1.46 7.74E-067 1.47 5.44E-0612 1.47 4.08E-062 1.47 8.12E-067 1.47 5.73E-0612 1.47 4.04E-062 1.46 3.19E-057 1.47 2.39E-0512 1.47 1.99E-052 1.46 3.25E-057 1.47 2.50E-0512 1.47 1.99E-052 1.46 3.26E-057 1.47 2.52E-0512 1.47 2.02E-052 1.47 5.49E-057 1.47 4.22E-0512 1.47 3.51E-052 1.46 5.56E-057 1.47 4.36E-0512 1.47 3.57E-052 1.47 5.68E-057 1.46 4.33E-0512 1.47 3.54E-052 1.47 6.99E-067 1.46 4.65E-0612 1.47 3.22E-062 1.46 7.46E-067 1.47 5.53E-0612 1.46 3.97E-062 1.46 7.62E-067 1.46 5.53E-0612 1.47 4.03E-06
200
1
7
13
800
1
7
13
1400
1
7
13
1400 13
200
1
7
13
0 3
2
0
2

December 19, 2011 MwRSF Report No. TRP-03-251-11
285
Degree of Curvature
Grade (%)
Length of Feature (ft)
Height of Feature (ft)
Offset (ft)
SI b
2 1.47 3.14E-057 1.46 2.38E-0512 1.46 1.89E-052 1.47 3.23E-057 1.47 2.48E-0512 1.47 2.00E-052 1.46 3.25E-057 1.46 2.49E-0512 1.47 2.00E-052 1.46 5.52E-057 1.46 4.34E-0512 1.47 3.49E-052 1.47 5.59E-057 1.47 4.41E-0512 1.47 3.53E-052 1.47 5.65E-057 1.47 4.37E-0512 1.46 3.56E-052 1.47 7.65E-067 1.47 5.31E-0612 1.47 3.61E-062 1.46 8.51E-067 1.47 6.08E-0612 1.46 4.61E-062 1.47 9.03E-067 1.47 6.38E-0612 1.46 4.49E-062 1.47 3.61E-057 1.47 2.72E-0512 1.47 2.14E-052 1.47 3.67E-057 1.46 2.79E-0512 1.46 2.22E-052 1.46 3.68E-057 1.47 2.80E-0512 1.46 2.22E-052 1.46 6.13E-057 1.47 4.82E-0512 1.47 3.91E-05
800
1
7
13
1400 1
1400
1
7
13
200
1
7
13
800
1
7
13
2
2
3

December 19, 2011 MwRSF Report No. TRP-03-251-11
286
Degree of Curvature
Grade (%)
Length of Feature (ft)
Height of Feature (ft)
Offset (ft)
SI b
2 1.47 6.30E-057 1.46 4.91E-0512 1.47 4.02E-052 1.46 6.22E-057 1.47 4.84E-0512 1.46 3.96E-052 1.46 7.99E-067 1.46 4.80E-0612 1.47 3.69E-062 1.47 7.87E-067 1.47 5.35E-0612 1.47 4.13E-062 1.47 8.38E-067 1.47 5.35E-0612 1.46 3.97E-062 1.47 3.40E-057 1.47 2.60E-0512 1.47 2.01E-052 1.47 3.44E-057 1.47 2.64E-0512 1.47 2.04E-052 1.47 3.51E-057 1.47 2.64E-0512 1.47 2.09E-052 1.47 5.75E-057 1.47 4.41E-0512 1.47 3.59E-052 1.47 5.70E-057 1.47 4.60E-0512 1.47 3.65E-052 1.47 5.84E-057 1.46 4.44E-0512 1.47 3.65E-052 1.47 8.20E-067 1.47 5.03E-0612 1.46 3.50E-062 1.47 8.23E-067 1.47 5.22E-0612 1.47 4.00E-06
200
1
7
800
1
7
13
1400
1
7
13
1400
7
13
200
1
7
13
2 3
3
0
2

December 19, 2011 MwRSF Report No. TRP-03-251-11
287
Degree of Curvature
Grade (%)
Length of Feature (ft)
Height of Feature (ft)
Offset (ft)
SI b
2 1.47 8.53E-067 1.47 5.46E-0612 1.48 4.24E-062 1.46 3.37E-057 1.46 2.51E-0512 1.47 2.04E-052 1.46 3.41E-057 1.47 2.56E-0512 1.47 2.05E-052 1.46 3.36E-057 1.46 2.60E-0512 1.47 2.09E-052 1.46 5.71E-057 1.47 4.46E-0512 1.47 3.61E-052 1.46 5.72E-057 1.46 4.50E-0512 1.46 3.61E-052 1.47 5.74E-057 1.47 4.46E-0512 1.47 3.66E-052 1.46 8.51E-067 1.48 5.70E-0612 1.47 3.98E-062 1.46 9.16E-067 1.47 6.07E-0612 1.47 4.39E-062 1.47 9.66E-067 1.46 5.97E-0612 1.47 4.51E-062 1.47 3.77E-057 1.47 2.91E-0512 1.46 2.24E-052 1.47 3.80E-057 1.47 2.97E-0512 1.46 2.37E-052 1.47 3.92E-057 1.47 3.00E-0512 1.46 2.29E-05
800
1
7
13
1400
1
7
13
200
1
7
13
200 13
800
1
7
13
3
2
3

December 19, 2011 MwRSF Report No. TRP-03-251-11
288
Degree of Curvature
Grade (%)
Length of Feature (ft)
Height of Feature (ft)
Offset (ft)
SI b
2 1.46 6.50E-057 1.46 5.05E-0512 1.47 4.07E-052 1.47 6.43E-057 1.47 5.08E-0512 1.46 4.11E-052 1.46 6.60E-057 1.47 5.10E-0512 1.46 4.06E-05
1400
1
7
13
3 3

December 19, 2011 MwRSF Report No. TRP-03-251-11
289
Appendix X. 1V:6H Undivided Rural Arterial

December 19, 2011 MwRSF Report No. TRP-03-251-11
290
Degree of Curvature
Grade (%)
Length of Feature (ft)
Height of Feature (ft)
Offset (ft)
SI b
2 0.98 9.29E-077 0.99 6.19E-0712 0.99 4.56E-072 0.99 1.07E-067 0.99 7.42E-0712 0.98 5.16E-072 0.99 1.10E-067 0.98 7.53E-0712 0.99 5.24E-072 0.99 3.36E-067 0.99 2.40E-0612 0.99 1.68E-062 0.99 3.46E-067 0.99 2.49E-0612 0.99 1.75E-062 0.99 3.46E-067 0.99 2.49E-0612 0.99 1.74E-062 0.99 5.77E-067 0.99 4.18E-0612 0.99 2.95E-062 0.99 5.82E-067 0.99 4.24E-0612 0.99 3.00E-062 0.99 5.89E-067 0.99 4.26E-0612 0.99 2.99E-062 0.99 1.04E-067 0.99 7.18E-0712 0.99 5.16E-072 0.99 1.20E-067 0.99 8.38E-0712 0.99 5.77E-072 0.99 1.19E-067 0.99 8.43E-0712 0.99 5.83E-072 0.99 3.75E-067 0.99 2.69E-0612 0.99 1.90E-06
800 1
1400
1
7
13
200
1
7
13
200
1
7
13
800
1
7
13
0
0
3

December 19, 2011 MwRSF Report No. TRP-03-251-11
291
Degree of Curvature
Grade (%)
Length of Feature (ft)
Height of Feature (ft)
Offset (ft)
SI b
2 0.99 3.91E-067 0.99 2.80E-0612 0.99 1.97E-062 0.99 3.88E-067 0.99 2.78E-0612 0.99 1.99E-062 0.99 6.43E-067 0.99 4.70E-0612 0.99 3.34E-062 0.99 6.64E-067 0.99 4.77E-0612 0.99 3.41E-062 0.99 6.61E-067 0.99 4.80E-0612 0.99 3.39E-062 0.99 1.41E-067 0.99 9.63E-0712 0.99 6.85E-072 0.98 1.61E-067 0.99 1.12E-0612 0.99 7.83E-072 0.99 1.61E-067 0.99 1.13E-0612 0.99 7.78E-072 0.99 4.99E-067 0.99 3.59E-0612 0.99 2.55E-062 0.99 5.19E-067 0.99 3.75E-0612 0.99 2.66E-062 0.99 5.21E-067 0.99 3.73E-0612 0.99 2.65E-062 0.99 8.69E-067 0.99 6.24E-0612 0.99 4.38E-062 0.99 8.79E-067 0.99 6.41E-0612 0.99 4.53E-06
1400
1
7
200
1
7
13
800
1
7
13
800
7
13
1400
1
7
13
0
3
6

December 19, 2011 MwRSF Report No. TRP-03-251-11
292
Degree of Curvature
Grade (%)
Length of Feature (ft)
Height of Feature (ft)
Offset (ft)
SI b
2 0.99 8.80E-067 0.99 6.44E-0612 0.99 4.52E-062 0.99 7.29E-077 0.99 4.38E-0712 0.98 2.89E-072 0.99 7.45E-077 0.99 4.50E-0712 0.98 2.77E-072 0.99 7.70E-077 0.98 4.45E-0712 0.99 2.90E-072 0.99 2.98E-067 0.99 2.08E-0612 0.99 1.43E-062 0.99 2.98E-067 0.99 2.12E-0612 0.99 1.44E-062 0.99 2.97E-067 0.99 2.14E-0612 0.99 1.45E-062 0.99 4.98E-067 0.99 3.61E-0612 0.99 2.50E-062 0.99 5.02E-067 0.99 3.56E-0612 0.99 2.52E-062 0.99 5.02E-067 0.99 3.57E-0612 0.99 2.54E-062 0.99 8.39E-077 0.99 4.98E-0712 0.99 3.23E-072 0.99 8.60E-077 0.99 5.13E-0712 0.98 3.20E-072 0.99 8.78E-077 0.99 5.07E-0712 0.99 3.22E-07
200
1
7
13
800
1
7
13
1400
1
7
13
1400 13
200
1
7
13
0 6
3
0
3
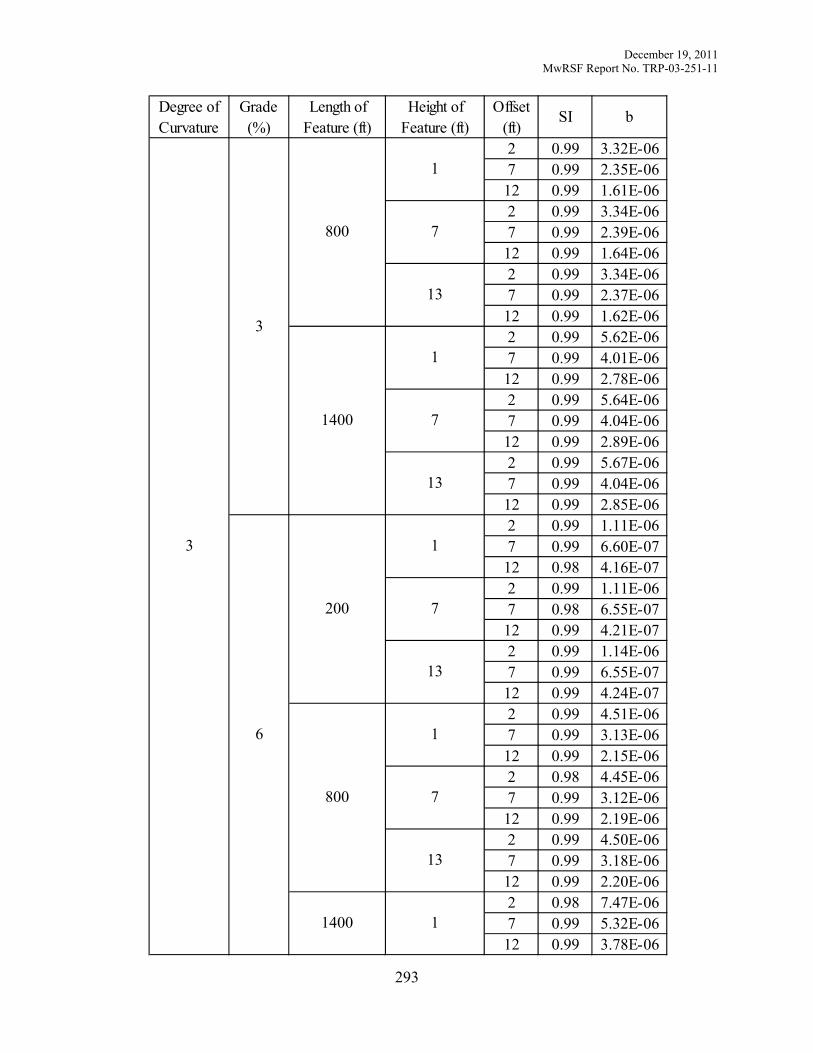
December 19, 2011 MwRSF Report No. TRP-03-251-11
293
Degree of Curvature
Grade (%)
Length of Feature (ft)
Height of Feature (ft)
Offset (ft)
SI b
2 0.99 3.32E-067 0.99 2.35E-0612 0.99 1.61E-062 0.99 3.34E-067 0.99 2.39E-0612 0.99 1.64E-062 0.99 3.34E-067 0.99 2.37E-0612 0.99 1.62E-062 0.99 5.62E-067 0.99 4.01E-0612 0.99 2.78E-062 0.99 5.64E-067 0.99 4.04E-0612 0.99 2.89E-062 0.99 5.67E-067 0.99 4.04E-0612 0.99 2.85E-062 0.99 1.11E-067 0.99 6.60E-0712 0.98 4.16E-072 0.99 1.11E-067 0.98 6.55E-0712 0.99 4.21E-072 0.99 1.14E-067 0.99 6.55E-0712 0.99 4.24E-072 0.99 4.51E-067 0.99 3.13E-0612 0.99 2.15E-062 0.98 4.45E-067 0.99 3.12E-0612 0.99 2.19E-062 0.99 4.50E-067 0.99 3.18E-0612 0.99 2.20E-062 0.98 7.47E-067 0.99 5.32E-0612 0.99 3.78E-06
800
1
7
13
1400 1
1400
1
7
13
200
1
7
13
800
1
7
13
3
3
6

December 19, 2011 MwRSF Report No. TRP-03-251-11
294
Degree of Curvature
Grade (%)
Length of Feature (ft)
Height of Feature (ft)
Offset (ft)
SI b
2 0.99 7.56E-067 0.99 5.36E-0612 0.99 3.80E-062 0.99 7.50E-067 0.99 5.38E-0612 0.99 3.77E-062 0.98 2.21E-067 0.99 1.44E-0612 0.98 9.05E-072 0.98 2.14E-067 0.99 1.46E-0612 0.98 8.89E-072 0.99 2.19E-067 0.99 1.47E-0612 0.99 9.10E-072 0.99 8.75E-067 0.99 6.32E-0612 0.98 4.37E-062 0.99 8.80E-067 0.99 6.30E-0612 0.99 4.39E-062 0.99 9.01E-067 0.99 6.26E-0612 0.99 4.40E-062 0.99 1.44E-057 0.99 1.02E-0512 0.99 7.24E-062 0.99 1.42E-057 0.99 1.03E-0512 0.99 7.21E-062 0.99 1.42E-057 0.99 1.02E-0512 0.99 7.21E-062 0.98 2.40E-067 0.99 1.68E-0612 0.99 1.12E-062 0.99 2.69E-067 0.99 1.71E-0612 0.99 1.13E-06
200
1
7
800
1
7
13
1400
1
7
13
1400
7
13
200
1
7
13
3 6
6
0
3

December 19, 2011 MwRSF Report No. TRP-03-251-11
295
Degree of Curvature
Grade (%)
Length of Feature (ft)
Height of Feature (ft)
Offset (ft)
SI b
2 0.99 2.64E-067 0.99 1.67E-0612 0.99 1.09E-062 0.99 1.07E-057 0.98 7.49E-0612 0.99 5.22E-062 0.99 1.05E-057 0.99 7.50E-0612 0.99 5.30E-062 0.98 1.06E-057 0.99 7.52E-0612 0.99 5.25E-062 0.99 1.73E-057 0.99 1.25E-0512 0.99 8.60E-062 0.99 1.73E-057 0.99 1.24E-0512 0.99 8.63E-062 0.99 1.71E-057 0.99 1.25E-0512 0.99 8.65E-062 0.99 3.45E-067 0.99 2.36E-0612 0.99 1.48E-062 0.99 3.58E-067 0.99 2.35E-0612 0.99 1.49E-062 0.99 3.70E-067 0.99 2.34E-0612 0.99 1.50E-062 0.99 1.41E-057 0.99 1.02E-0512 0.99 6.98E-062 0.99 1.40E-057 0.99 1.01E-0512 0.99 7.04E-062 0.99 1.41E-057 0.99 1.01E-0512 0.99 6.96E-06
800
1
7
13
1400
1
7
13
200
1
7
13
200 13
800
1
7
13
6
3
6

December 19, 2011 MwRSF Report No. TRP-03-251-11
296
Degree of Curvature
Grade (%)
Length of Feature (ft)
Height of Feature (ft)
Offset (ft)
SI b
2 0.99 2.32E-057 0.99 1.64E-0512 0.99 1.16E-052 0.99 2.33E-057 0.99 1.65E-0512 0.99 1.15E-052 0.99 2.29E-057 0.99 1.65E-0512 0.99 1.17E-05
1400
1
7
13
6 6

December 19, 2011 MwRSF Report No. TRP-03-251-11
297
Appendix Y. 1V:6H Divided Rural Arterial

December 19, 2011 MwRSF Report No. TRP-03-251-11
298
Degree of Curvature
Grade (%)
Length of Feature (ft)
Height of Feature (ft)
Offset (ft)
SI b
2 0.98 1.93E-067 0.99 1.40E-0612 0.99 1.15E-062 0.99 2.53E-067 0.99 1.98E-0612 0.98 1.65E-062 0.99 2.66E-067 0.99 2.12E-0612 0.99 1.72E-062 0.99 6.87E-067 0.99 5.50E-0612 0.99 4.38E-062 0.99 7.62E-067 0.99 6.07E-0612 0.98 5.00E-062 0.99 7.75E-067 0.99 6.12E-0612 0.99 4.99E-062 0.99 1.20E-057 0.99 9.58E-0612 0.99 7.85E-062 0.99 1.28E-057 0.99 1.02E-0512 0.99 8.34E-062 0.99 1.30E-057 0.99 1.02E-0512 0.99 8.44E-062 0.99 2.06E-067 0.99 1.57E-0612 0.99 1.27E-062 0.99 2.87E-067 0.99 2.25E-0612 0.99 1.89E-062 0.99 3.00E-067 0.99 2.41E-0612 0.99 2.01E-062 0.99 7.75E-067 0.99 6.04E-0612 0.99 5.02E-06
800 1
1400
1
7
13
200
1
7
13
200
1
7
13
800
1
7
13
0
0
3

December 19, 2011 MwRSF Report No. TRP-03-251-11
299
Degree of Curvature
Grade (%)
Length of Feature (ft)
Height of Feature (ft)
Offset (ft)
SI b
2 0.99 8.39E-067 0.99 6.77E-0612 0.99 5.57E-062 0.99 8.71E-067 0.99 6.90E-0612 0.99 5.57E-062 0.99 1.35E-057 0.99 1.08E-0512 0.99 8.73E-062 0.99 1.41E-057 0.99 1.14E-0512 0.99 9.36E-062 0.99 1.45E-057 0.99 1.14E-0512 0.99 9.39E-062 0.99 2.76E-067 0.98 2.08E-0612 0.99 1.68E-062 0.99 3.78E-067 0.99 2.96E-0612 0.99 2.53E-062 0.99 4.00E-067 0.99 3.19E-0612 0.98 2.55E-062 0.99 1.04E-057 0.99 8.16E-0612 0.99 6.57E-062 0.99 1.13E-057 0.99 9.01E-0612 0.99 7.47E-062 0.99 1.15E-057 0.99 9.22E-0612 0.99 7.49E-062 0.99 1.82E-057 0.99 1.42E-0512 0.99 1.14E-052 0.99 1.89E-057 0.99 1.52E-0512 0.99 1.24E-05
1400
1
7
200
1
7
13
800
1
7
13
800
7
13
1400
1
7
13
0
3
6

December 19, 2011 MwRSF Report No. TRP-03-251-11
300
Degree of Curvature
Grade (%)
Length of Feature (ft)
Height of Feature (ft)
Offset (ft)
SI b
2 0.99 1.91E-057 0.99 1.52E-0512 0.99 1.25E-052 0.99 1.44E-067 1.00 9.28E-0712 0.99 6.73E-072 0.99 1.49E-067 0.99 9.24E-0712 0.98 7.21E-072 0.99 1.53E-067 0.99 9.82E-0712 0.99 7.46E-072 0.99 6.12E-067 0.99 4.66E-0612 0.99 3.60E-062 0.99 6.18E-067 0.99 4.79E-0612 0.99 3.75E-062 0.99 6.13E-067 0.99 4.76E-0612 0.99 3.74E-062 0.99 1.01E-057 0.99 8.08E-0612 0.99 6.51E-062 0.99 1.01E-057 0.99 7.97E-0612 0.98 6.37E-062 0.99 1.00E-057 0.99 8.14E-0612 0.99 6.47E-062 0.99 1.64E-067 0.99 9.98E-0712 0.99 7.34E-072 0.98 1.66E-067 0.99 1.04E-0612 0.99 8.05E-072 0.99 1.75E-067 0.99 1.09E-0612 0.99 8.47E-07
200
1
7
13
800
1
7
13
1400
1
7
13
1400 13
200
1
7
13
0 6
3
0
3

December 19, 2011 MwRSF Report No. TRP-03-251-11
301
Degree of Curvature
Grade (%)
Length of Feature (ft)
Height of Feature (ft)
Offset (ft)
SI b
2 0.99 6.83E-067 0.99 5.27E-0612 0.99 4.21E-062 0.99 6.91E-067 0.99 5.21E-0612 0.99 4.15E-062 0.99 7.01E-067 0.99 5.35E-0612 0.99 4.20E-062 0.99 1.16E-057 0.99 8.85E-0612 0.99 7.26E-062 0.99 1.15E-057 0.99 9.10E-0612 0.99 7.26E-062 0.99 1.15E-057 0.99 9.14E-0612 0.99 7.28E-062 0.99 2.11E-067 0.99 1.31E-0612 0.98 9.56E-072 0.99 2.28E-067 0.99 1.44E-0612 0.99 1.05E-062 0.99 2.34E-067 0.99 1.44E-0612 0.99 1.08E-062 0.99 8.82E-067 0.99 6.88E-0612 0.98 5.50E-062 0.99 9.17E-067 0.99 7.03E-0612 0.99 5.61E-062 0.99 9.13E-067 0.99 7.01E-0612 0.99 5.62E-062 0.99 1.52E-057 0.99 1.21E-0512 0.99 9.59E-06
800
1
7
13
1400 1
1400
1
7
13
200
1
7
13
800
1
7
13
3
3
6
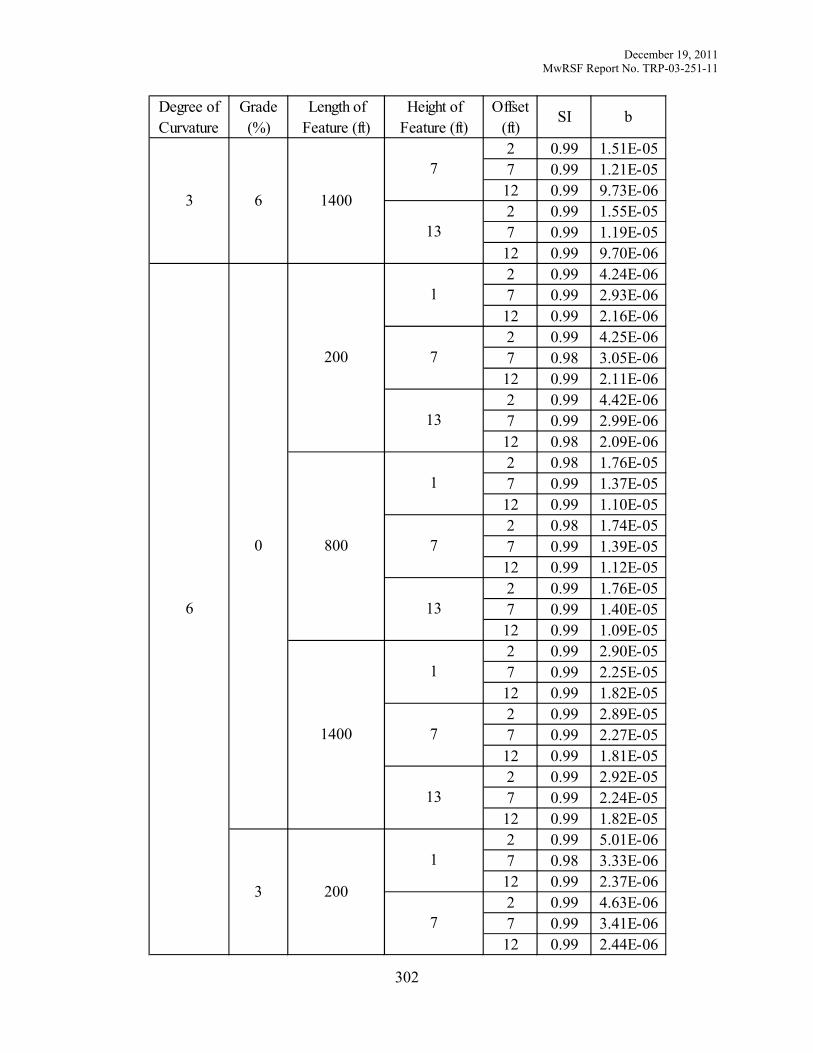
December 19, 2011 MwRSF Report No. TRP-03-251-11
302
Degree of Curvature
Grade (%)
Length of Feature (ft)
Height of Feature (ft)
Offset (ft)
SI b
2 0.99 1.51E-057 0.99 1.21E-0512 0.99 9.73E-062 0.99 1.55E-057 0.99 1.19E-0512 0.99 9.70E-062 0.99 4.24E-067 0.99 2.93E-0612 0.99 2.16E-062 0.99 4.25E-067 0.98 3.05E-0612 0.99 2.11E-062 0.99 4.42E-067 0.99 2.99E-0612 0.98 2.09E-062 0.98 1.76E-057 0.99 1.37E-0512 0.99 1.10E-052 0.98 1.74E-057 0.99 1.39E-0512 0.99 1.12E-052 0.99 1.76E-057 0.99 1.40E-0512 0.99 1.09E-052 0.99 2.90E-057 0.99 2.25E-0512 0.99 1.82E-052 0.99 2.89E-057 0.99 2.27E-0512 0.99 1.81E-052 0.99 2.92E-057 0.99 2.24E-0512 0.99 1.82E-052 0.99 5.01E-067 0.98 3.33E-0612 0.99 2.37E-062 0.99 4.63E-067 0.99 3.41E-0612 0.99 2.44E-06
200
1
7
800
1
7
13
1400
1
7
13
1400
7
13
200
1
7
13
3 6
6
0
3

December 19, 2011 MwRSF Report No. TRP-03-251-11
303
Degree of Curvature
Grade (%)
Length of Feature (ft)
Height of Feature (ft)
Offset (ft)
SI b
2 0.99 4.85E-067 0.99 3.41E-0612 0.99 2.44E-062 0.98 1.97E-057 0.99 1.55E-0512 0.99 1.24E-052 0.99 2.00E-057 0.99 1.55E-0512 0.99 1.22E-052 0.99 2.00E-057 0.99 1.54E-0512 0.98 1.22E-052 0.99 3.25E-057 0.99 2.54E-0512 0.99 2.06E-052 0.99 3.24E-057 0.99 2.53E-0512 0.99 2.03E-052 0.99 3.28E-057 0.99 2.54E-0512 0.99 2.03E-052 0.98 6.45E-067 0.99 4.28E-0612 0.99 3.23E-062 0.99 6.57E-067 1.00 4.55E-0612 0.99 3.23E-062 0.99 6.20E-067 0.99 4.50E-0612 0.98 3.07E-062 0.99 2.65E-057 0.99 2.08E-0512 0.99 1.63E-052 0.99 2.65E-057 0.99 2.04E-0512 0.99 1.62E-052 0.99 2.64E-057 0.99 2.05E-0512 0.99 1.66E-05
800
1
7
13
1400
1
7
13
200
1
7
13
200 13
800
1
7
13
6
3
6

December 19, 2011 MwRSF Report No. TRP-03-251-11
304
Degree of Curvature
Grade (%)
Length of Feature (ft)
Height of Feature (ft)
Offset (ft)
SI b
2 0.99 4.26E-057 0.99 3.39E-0512 0.99 2.73E-052 0.99 4.33E-057 0.99 3.40E-0512 0.99 2.71E-052 0.99 4.34E-057 0.99 3.39E-0512 0.99 2.71E-05
1400
1
7
13
6 6

December 19, 2011 MwRSF Report No. TRP-03-251-11
305
Appendix Z. 1V:6H Rural Local

December 19, 2011 MwRSF Report No. TRP-03-251-11
306
Degree of Curvature
Grade (%)
Length of Feature (ft)
Height of Feature (ft)
Offset (ft)
SI b
2 0.98 7.17E-067 0.98 5.05E-0612 0.98 3.57E-062 0.98 8.33E-067 0.98 5.98E-0612 0.98 4.09E-062 0.98 8.34E-067 0.98 5.72E-0612 0.98 4.05E-062 0.98 2.49E-057 0.98 1.80E-0512 0.98 1.28E-052 0.98 2.56E-057 0.98 1.92E-0512 0.98 1.34E-052 0.98 2.63E-057 0.98 1.86E-0512 0.98 1.33E-052 0.98 4.28E-057 0.98 3.12E-0512 0.98 2.20E-052 0.98 4.34E-057 0.98 3.20E-0512 0.98 2.28E-052 0.98 4.35E-057 0.98 3.19E-0512 0.98 2.28E-052 0.98 9.19E-067 0.98 6.25E-0612 0.98 4.46E-062 0.98 1.03E-057 0.98 7.29E-0612 0.98 5.16E-062 0.98 1.05E-057 0.98 7.40E-0612 0.98 5.24E-062 0.98 3.09E-057 0.98 2.26E-0512 0.98 1.60E-05
800 1
1400
1
7
13
200
1
7
13
200
1
7
13
800
1
7
13
0
0
4

December 19, 2011 MwRSF Report No. TRP-03-251-11
307
Degree of Curvature
Grade (%)
Length of Feature (ft)
Height of Feature (ft)
Offset (ft)
SI b
2 0.98 3.22E-057 0.98 2.34E-0512 0.98 1.69E-052 0.98 3.24E-057 0.98 2.33E-0512 0.98 1.67E-052 0.98 5.29E-057 0.98 3.91E-0512 0.98 2.79E-052 0.98 5.43E-057 0.98 4.01E-0512 0.98 2.82E-052 0.98 5.43E-057 0.98 4.00E-0512 0.98 2.85E-052 0.98 1.09E-057 0.98 7.31E-0612 0.98 5.26E-062 0.98 1.25E-057 0.97 8.87E-0612 0.98 6.07E-062 0.98 1.28E-057 0.98 8.80E-0612 0.98 6.15E-062 0.98 3.70E-057 0.98 2.71E-0512 0.98 1.90E-052 0.98 3.91E-057 0.98 2.84E-0512 0.98 2.01E-052 0.98 3.91E-057 0.98 2.84E-0512 0.98 2.00E-052 0.98 6.34E-057 0.98 4.65E-0512 0.98 3.30E-052 0.98 6.49E-057 0.98 4.78E-0512 0.98 3.40E-05
1400
1
7
200
1
7
13
800
1
7
13
800
7
13
1400
1
7
13
0
4
8
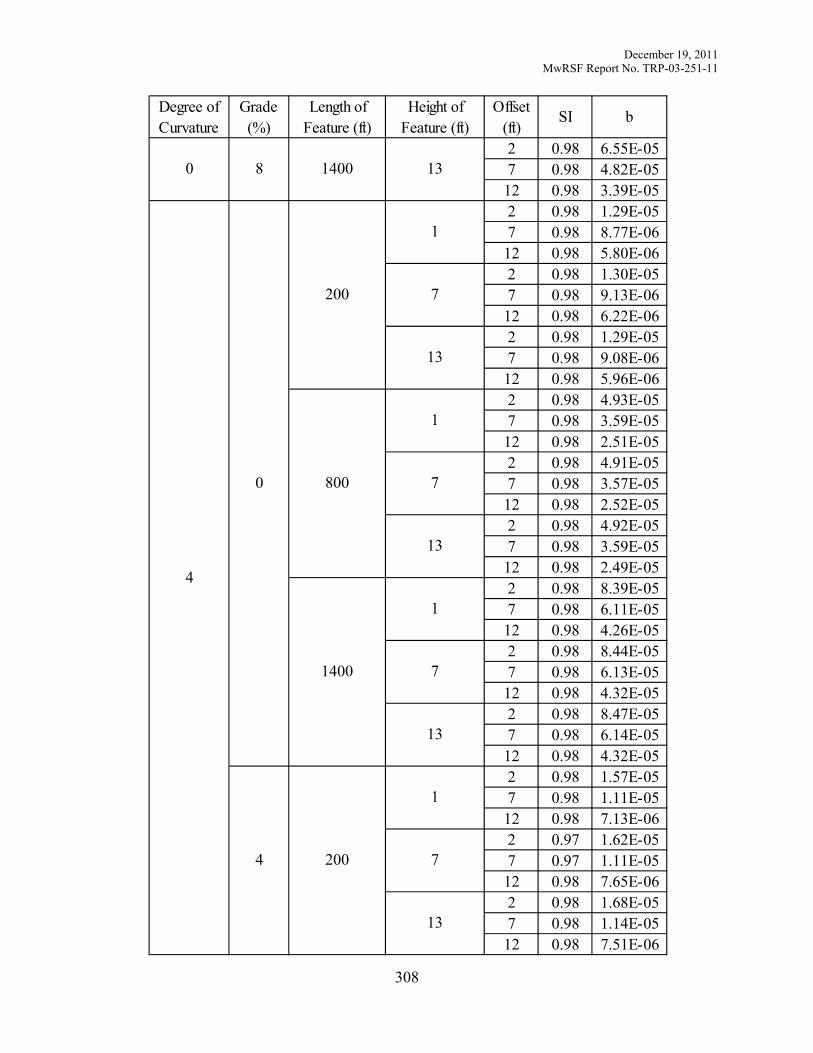
December 19, 2011 MwRSF Report No. TRP-03-251-11
308
Degree of Curvature
Grade (%)
Length of Feature (ft)
Height of Feature (ft)
Offset (ft)
SI b
2 0.98 6.55E-057 0.98 4.82E-0512 0.98 3.39E-052 0.98 1.29E-057 0.98 8.77E-0612 0.98 5.80E-062 0.98 1.30E-057 0.98 9.13E-0612 0.98 6.22E-062 0.98 1.29E-057 0.98 9.08E-0612 0.98 5.96E-062 0.98 4.93E-057 0.98 3.59E-0512 0.98 2.51E-052 0.98 4.91E-057 0.98 3.57E-0512 0.98 2.52E-052 0.98 4.92E-057 0.98 3.59E-0512 0.98 2.49E-052 0.98 8.39E-057 0.98 6.11E-0512 0.98 4.26E-052 0.98 8.44E-057 0.98 6.13E-0512 0.98 4.32E-052 0.98 8.47E-057 0.98 6.14E-0512 0.98 4.32E-052 0.98 1.57E-057 0.98 1.11E-0512 0.98 7.13E-062 0.97 1.62E-057 0.97 1.11E-0512 0.98 7.65E-062 0.98 1.68E-057 0.98 1.14E-0512 0.98 7.51E-06
200
1
7
13
800
1
7
13
1400
1
7
13
1400 13
200
1
7
13
0 8
4
0
4

December 19, 2011 MwRSF Report No. TRP-03-251-11
309
Degree of Curvature
Grade (%)
Length of Feature (ft)
Height of Feature (ft)
Offset (ft)
SI b
2 0.98 6.11E-057 0.97 4.39E-0512 0.98 3.10E-052 0.98 6.28E-057 0.97 4.42E-0512 0.98 3.16E-052 0.98 6.20E-057 0.98 4.47E-0512 0.98 3.16E-052 0.98 1.04E-047 0.98 7.61E-0512 0.98 5.39E-052 0.98 1.05E-047 0.98 7.61E-0512 0.98 5.47E-052 0.98 1.06E-047 0.98 7.64E-0512 0.98 5.36E-052 0.97 1.85E-057 0.98 1.30E-0512 0.98 8.59E-062 0.98 1.96E-057 0.97 1.35E-0512 0.98 9.12E-062 0.98 1.94E-057 0.98 1.37E-0512 0.98 8.83E-062 0.98 7.35E-057 0.98 5.38E-0512 0.98 3.73E-052 0.98 7.50E-057 0.98 5.46E-0512 0.98 3.83E-052 0.98 7.43E-057 0.98 5.38E-0512 0.98 3.76E-052 0.98 1.25E-047 0.98 9.08E-0512 0.98 6.47E-05
800
1
7
13
1400 1
1400
1
7
13
200
1
7
13
800
1
7
13
4
4
8

December 19, 2011 MwRSF Report No. TRP-03-251-11
310
Degree of Curvature
Grade (%)
Length of Feature (ft)
Height of Feature (ft)
Offset (ft)
SI b
2 0.98 1.27E-047 0.98 9.23E-0512 0.98 6.36E-052 0.98 1.26E-047 0.98 9.20E-0512 0.98 6.48E-052 0.98 1.78E-057 0.99 1.22E-0512 0.98 7.61E-062 0.98 1.88E-057 0.98 1.23E-0512 0.98 7.98E-062 0.98 1.88E-057 0.98 1.27E-0512 0.98 7.95E-062 0.98 6.58E-057 0.98 4.80E-0512 0.98 3.38E-052 0.98 6.58E-057 0.98 4.83E-0512 0.98 3.32E-052 0.98 6.64E-057 0.98 4.79E-0512 0.98 3.36E-052 0.98 1.07E-047 0.98 7.68E-0512 0.98 5.46E-052 0.98 1.07E-047 0.98 7.78E-0512 0.98 5.50E-052 0.98 1.08E-047 0.98 7.67E-0512 0.98 5.50E-052 0.98 2.28E-057 0.98 1.53E-0512 0.97 9.63E-062 0.98 2.35E-057 0.97 1.49E-0512 0.97 9.54E-06
200
1
7
800
1
7
13
1400
1
7
13
1400
7
13
200
1
7
13
4 8
8
0
4

December 19, 2011 MwRSF Report No. TRP-03-251-11
311
Degree of Curvature
Grade (%)
Length of Feature (ft)
Height of Feature (ft)
Offset (ft)
SI b
2 0.98 2.35E-057 0.98 1.53E-0512 0.98 1.02E-052 0.98 8.27E-057 0.98 5.90E-0512 0.98 4.17E-052 0.98 8.29E-057 0.98 6.01E-0512 0.98 4.29E-052 0.98 8.16E-057 0.98 5.96E-0512 0.98 4.25E-052 0.98 1.35E-047 0.98 9.55E-0512 0.98 6.74E-052 0.98 1.33E-047 0.98 9.63E-0512 0.98 6.81E-052 0.98 1.34E-047 0.98 9.69E-0512 0.98 6.83E-052 0.98 2.64E-057 0.98 1.77E-0512 0.98 1.18E-052 0.97 2.78E-057 0.98 1.84E-0512 0.98 1.24E-052 0.98 2.89E-057 0.98 1.85E-0512 0.98 1.18E-052 0.98 9.70E-057 0.98 7.05E-0512 0.98 5.06E-052 0.98 1.01E-047 0.98 7.14E-0512 0.98 5.04E-052 0.98 9.91E-057 0.98 7.14E-0512 0.98 5.05E-05
800
1
7
13
1400
1
7
13
200
1
7
13
200 13
800
1
7
13
8
4
8

December 19, 2011 MwRSF Report No. TRP-03-251-11
312
Degree of Curvature
Grade (%)
Length of Feature (ft)
Height of Feature (ft)
Offset (ft)
SI b
2 0.98 1.59E-047 0.98 1.16E-0412 0.98 8.21E-052 0.98 1.62E-047 0.98 1.16E-0412 0.98 8.07E-052 0.98 1.60E-047 0.98 1.16E-0412 0.98 8.11E-05
1400
1
7
13
8 8

December 19, 2011 MwRSF Report No. TRP-03-251-11
313
Appendix AA. 1V:6H Undivided Urban Arterial

December 19, 2011 MwRSF Report No. TRP-03-251-11
314
Degree of Curvature
Grade (%)
Length of Feature (ft)
Height of Feature (ft)
Offset (ft)
SI b
2 0.85 7.22E-077 0.85 5.05E-0712 0.85 3.52E-072 0.85 8.25E-077 0.85 5.72E-0712 0.85 3.95E-072 0.85 8.34E-077 0.85 5.67E-0712 0.85 3.94E-072 0.85 2.76E-067 0.85 1.99E-0612 0.85 1.39E-062 0.85 2.83E-067 0.85 2.03E-0612 0.85 1.45E-062 0.85 2.84E-067 0.85 2.03E-0612 0.85 1.44E-062 0.85 4.80E-067 0.85 3.47E-0612 0.85 2.45E-062 0.85 4.87E-067 0.85 3.50E-0612 0.85 2.53E-062 0.85 4.89E-067 0.85 3.54E-0612 0.85 2.47E-062 0.85 8.11E-077 0.86 5.71E-0712 0.85 3.93E-072 0.85 9.39E-077 0.85 6.40E-0712 0.85 4.43E-072 0.85 9.48E-077 0.85 6.44E-0712 0.85 4.49E-072 0.85 3.09E-067 0.85 2.22E-0612 0.85 1.57E-06
800 1
1400
1
7
13
200
1
7
13
200
1
7
13
800
1
7
13
0
0
3

December 19, 2011 MwRSF Report No. TRP-03-251-11
315
Degree of Curvature
Grade (%)
Length of Feature (ft)
Height of Feature (ft)
Offset (ft)
SI b
2 0.85 3.16E-067 0.85 2.26E-0612 0.85 1.61E-062 0.85 3.19E-067 0.85 2.30E-0612 0.85 1.60E-062 0.85 5.37E-067 0.85 3.87E-0612 0.85 2.79E-062 0.85 5.46E-067 0.85 3.96E-0612 0.85 2.84E-062 0.85 5.40E-067 0.85 3.95E-0612 0.85 2.80E-062 0.85 1.09E-067 0.85 7.56E-0712 0.85 5.17E-072 0.85 1.24E-067 0.85 8.59E-0712 0.85 5.86E-072 0.85 1.22E-067 0.85 8.55E-0712 0.85 5.87E-072 0.85 4.12E-067 0.85 2.96E-0612 0.85 2.07E-062 0.85 4.27E-067 0.85 3.06E-0612 0.85 2.15E-062 0.85 4.30E-067 0.85 3.08E-0612 0.85 2.14E-062 0.85 7.21E-067 0.85 5.22E-0612 0.85 3.70E-062 0.85 7.26E-067 0.85 5.31E-0612 0.85 3.76E-06
1400
1
7
200
1
7
13
800
1
7
13
800
7
13
1400
1
7
13
0
3
6
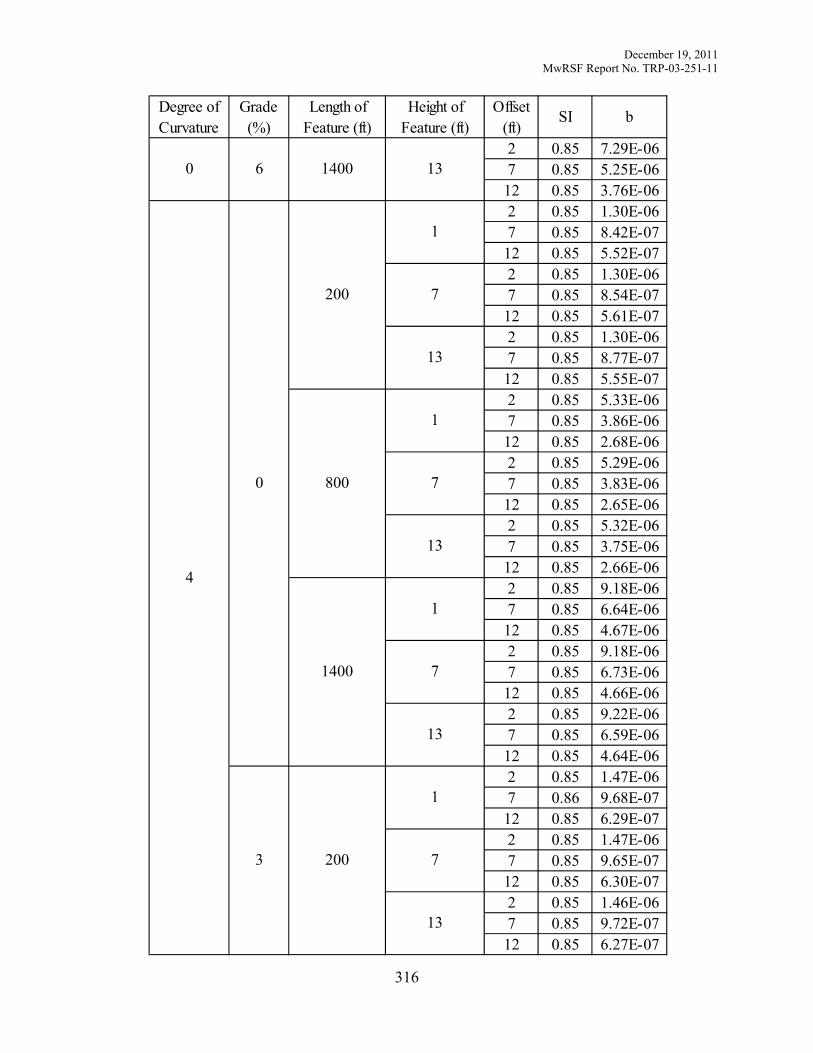
December 19, 2011 MwRSF Report No. TRP-03-251-11
316
Degree of Curvature
Grade (%)
Length of Feature (ft)
Height of Feature (ft)
Offset (ft)
SI b
2 0.85 7.29E-067 0.85 5.25E-0612 0.85 3.76E-062 0.85 1.30E-067 0.85 8.42E-0712 0.85 5.52E-072 0.85 1.30E-067 0.85 8.54E-0712 0.85 5.61E-072 0.85 1.30E-067 0.85 8.77E-0712 0.85 5.55E-072 0.85 5.33E-067 0.85 3.86E-0612 0.85 2.68E-062 0.85 5.29E-067 0.85 3.83E-0612 0.85 2.65E-062 0.85 5.32E-067 0.85 3.75E-0612 0.85 2.66E-062 0.85 9.18E-067 0.85 6.64E-0612 0.85 4.67E-062 0.85 9.18E-067 0.85 6.73E-0612 0.85 4.66E-062 0.85 9.22E-067 0.85 6.59E-0612 0.85 4.64E-062 0.85 1.47E-067 0.86 9.68E-0712 0.85 6.29E-072 0.85 1.47E-067 0.85 9.65E-0712 0.85 6.30E-072 0.85 1.46E-067 0.85 9.72E-0712 0.85 6.27E-07
200
1
7
13
800
1
7
13
1400
1
7
13
1400 13
200
1
7
13
0 6
4
0
3

December 19, 2011 MwRSF Report No. TRP-03-251-11
317
Degree of Curvature
Grade (%)
Length of Feature (ft)
Height of Feature (ft)
Offset (ft)
SI b
2 0.85 6.02E-067 0.85 4.26E-0612 0.85 3.00E-062 0.85 5.99E-067 0.85 4.33E-0612 0.85 3.02E-062 0.85 6.00E-067 0.85 4.27E-0612 0.85 2.97E-062 0.85 1.04E-057 0.85 7.52E-0612 0.85 5.24E-062 0.85 1.05E-057 0.85 7.49E-0612 0.85 5.22E-062 0.85 1.04E-057 0.85 7.45E-0612 0.85 5.23E-062 0.85 1.94E-067 0.85 1.27E-0612 0.85 8.29E-072 0.85 1.95E-067 0.85 1.30E-0612 0.85 8.21E-072 0.85 2.02E-067 0.85 1.31E-0612 0.86 8.52E-072 0.85 7.99E-067 0.85 5.74E-0612 0.85 4.00E-062 0.85 8.18E-067 0.85 5.81E-0612 0.85 4.05E-062 0.85 8.00E-067 0.85 5.75E-0612 0.85 3.97E-062 0.85 1.38E-057 0.85 9.99E-0612 0.85 6.93E-06
800
1
7
13
1400 1
1400
1
7
13
200
1
7
13
800
1
7
13
4
3
6

December 19, 2011 MwRSF Report No. TRP-03-251-11
318
Degree of Curvature
Grade (%)
Length of Feature (ft)
Height of Feature (ft)
Offset (ft)
SI b
2 0.85 1.39E-057 0.85 1.00E-0512 0.85 7.02E-062 0.85 1.38E-057 0.85 1.00E-0512 0.85 7.00E-062 0.85 1.85E-067 0.85 1.19E-0612 0.85 7.08E-072 0.85 1.89E-067 0.85 1.19E-0612 0.85 7.46E-072 0.85 1.86E-067 0.85 1.20E-0612 0.85 7.21E-072 0.85 6.92E-067 0.85 5.05E-0612 0.85 3.52E-062 0.85 7.10E-067 0.85 5.01E-0612 0.85 3.50E-062 0.85 7.06E-067 0.85 5.02E-0612 0.85 3.56E-062 0.85 1.12E-057 0.85 7.97E-0612 0.85 5.63E-062 0.85 1.12E-057 0.85 8.02E-0612 0.85 5.68E-062 0.85 1.11E-057 0.85 8.05E-0612 0.85 5.64E-062 0.85 2.06E-067 0.85 1.34E-0612 0.85 8.03E-072 0.86 2.11E-067 0.85 1.37E-0612 0.84 8.19E-07
200
1
7
800
1
7
13
1400
1
7
13
1400
7
13
200
1
7
13
4 6
8
0
3

December 19, 2011 MwRSF Report No. TRP-03-251-11
319
Degree of Curvature
Grade (%)
Length of Feature (ft)
Height of Feature (ft)
Offset (ft)
SI b
2 0.85 2.11E-067 0.85 1.32E-0612 0.85 8.32E-072 0.85 7.95E-067 0.85 5.62E-0612 0.85 3.96E-062 0.85 7.90E-067 0.85 5.63E-0612 0.85 3.91E-062 0.85 7.93E-067 0.85 5.73E-0612 0.85 3.94E-062 0.85 1.26E-057 0.85 9.02E-0612 0.85 6.28E-062 0.85 1.26E-057 0.85 8.93E-0612 0.85 6.34E-062 0.85 1.25E-057 0.85 8.94E-0612 0.85 6.31E-062 0.85 2.80E-067 0.85 1.79E-0612 0.84 1.08E-062 0.85 2.80E-067 0.86 1.80E-0612 0.85 1.10E-062 0.85 2.88E-067 0.85 1.81E-0612 0.85 1.07E-062 0.85 1.04E-057 0.85 7.55E-0612 0.86 5.24E-062 0.85 1.05E-057 0.85 7.59E-0612 0.85 5.28E-062 0.85 1.06E-057 0.85 7.51E-0612 0.85 5.19E-06
800
1
7
13
1400
1
7
13
200
1
7
13
200 13
800
1
7
13
8
3
6

December 19, 2011 MwRSF Report No. TRP-03-251-11
320
Degree of Curvature
Grade (%)
Length of Feature (ft)
Height of Feature (ft)
Offset (ft)
SI b
2 0.85 1.68E-057 0.85 1.20E-0512 0.85 8.39E-062 0.85 1.68E-057 0.85 1.20E-0512 0.85 8.46E-062 0.85 1.68E-057 0.85 1.21E-0512 0.85 8.42E-06
1400
1
7
13
8 6

December 19, 2011 MwRSF Report No. TRP-03-251-11
321
Appendix BB. 1V:6H Divided Urban Arterial

December 19, 2011 MwRSF Report No. TRP-03-251-11
322
Degree of Curvature
Grade (%)
Length of Feature (ft)
Height of Feature (ft)
Offset (ft)
SI b
2 0.85 1.45E-067 0.85 1.07E-0612 0.85 8.79E-072 0.85 1.87E-067 0.85 1.48E-0612 0.85 1.23E-062 0.85 1.92E-067 0.85 1.55E-0612 0.85 1.21E-062 0.85 5.57E-067 0.85 4.45E-0612 0.85 3.57E-062 0.85 6.05E-067 0.85 4.85E-0612 0.85 3.92E-062 0.85 6.13E-067 0.85 4.83E-0612 0.85 3.94E-062 0.85 9.84E-067 0.85 7.81E-0612 0.85 6.36E-062 0.85 1.02E-057 0.85 8.18E-0612 0.85 6.65E-062 0.85 1.04E-057 0.85 8.20E-0612 0.85 6.65E-062 0.85 1.64E-067 0.85 1.24E-0612 0.85 9.85E-072 0.85 2.11E-067 0.85 1.61E-0612 0.85 1.38E-062 0.85 2.20E-067 0.85 1.74E-0612 0.85 1.42E-062 0.85 6.20E-067 0.85 4.96E-0612 0.85 4.03E-06
800 1
1400
1
7
13
200
1
7
13
200
1
7
13
800
1
7
13
0
0
3

December 19, 2011 MwRSF Report No. TRP-03-251-11
323
Degree of Curvature
Grade (%)
Length of Feature (ft)
Height of Feature (ft)
Offset (ft)
SI b
2 0.85 6.81E-067 0.85 5.43E-0612 0.85 4.41E-062 0.85 6.82E-067 0.85 5.51E-0612 0.85 4.48E-062 0.85 1.10E-057 0.85 8.77E-0612 0.85 7.13E-062 0.85 1.16E-057 0.85 9.17E-0612 0.85 7.55E-062 0.85 1.16E-057 0.85 9.35E-0612 0.85 7.62E-062 0.85 2.16E-067 0.85 1.64E-0612 0.85 1.25E-062 0.85 2.82E-067 0.85 2.16E-0612 0.85 1.83E-062 0.85 3.05E-067 0.85 2.34E-0612 0.85 1.90E-062 0.85 8.42E-067 0.85 6.67E-0612 0.85 5.34E-062 0.85 9.00E-067 0.85 7.19E-0612 0.85 5.84E-062 0.85 9.19E-067 0.85 7.30E-0612 0.85 5.91E-062 0.85 1.48E-057 0.85 1.17E-0512 0.85 9.58E-062 0.85 1.53E-057 0.85 1.23E-0512 0.85 9.98E-06
1400
1
7
200
1
7
13
800
1
7
13
800
7
13
1400
1
7
13
0
3
6

December 19, 2011 MwRSF Report No. TRP-03-251-11
324
Degree of Curvature
Grade (%)
Length of Feature (ft)
Height of Feature (ft)
Offset (ft)
SI b
2 0.85 1.53E-057 0.85 1.23E-0512 0.85 1.01E-052 0.85 2.37E-067 0.85 1.74E-0612 0.85 1.28E-062 0.85 2.57E-067 0.85 1.79E-0612 0.85 1.31E-062 0.85 2.58E-067 0.85 1.83E-0612 0.85 1.35E-062 0.85 1.06E-057 0.85 8.33E-0612 0.85 6.73E-062 0.85 1.08E-057 0.85 8.31E-0612 0.85 6.73E-062 0.85 1.07E-057 0.85 8.44E-0612 0.85 6.71E-062 0.85 1.85E-057 0.85 1.46E-0512 0.85 1.18E-052 0.85 1.86E-057 0.85 1.45E-0512 0.85 1.18E-052 0.85 1.86E-057 0.85 1.47E-0512 0.85 1.18E-052 0.85 2.85E-067 0.85 1.98E-0612 0.85 1.44E-062 0.85 2.81E-067 0.85 2.00E-0612 0.85 1.53E-062 0.85 2.84E-067 0.85 1.99E-0612 0.85 1.50E-06
200
1
7
13
800
1
7
13
1400
1
7
13
1400 13
200
1
7
13
0 6
4
0
3

December 19, 2011 MwRSF Report No. TRP-03-251-11
325
Degree of Curvature
Grade (%)
Length of Feature (ft)
Height of Feature (ft)
Offset (ft)
SI b
2 0.85 1.19E-057 0.85 9.45E-0612 0.85 7.40E-062 0.85 1.20E-057 0.85 9.35E-0612 0.85 7.52E-062 0.85 1.21E-057 0.85 9.49E-0612 0.85 7.66E-062 0.85 2.08E-057 0.85 1.64E-0512 0.85 1.32E-052 0.85 2.09E-057 0.85 1.64E-0512 0.85 1.33E-052 0.85 2.10E-057 0.85 1.66E-0512 0.85 1.32E-052 0.86 3.76E-067 0.85 2.70E-0612 0.86 1.91E-062 0.85 3.80E-067 0.85 2.67E-0612 0.85 2.02E-062 0.85 3.81E-067 0.85 2.74E-0612 0.85 1.95E-062 0.85 1.55E-057 0.85 1.25E-0512 0.85 1.00E-052 0.85 1.59E-057 0.85 1.24E-0512 0.85 1.02E-052 0.85 1.62E-057 0.85 1.25E-0512 0.85 1.00E-052 0.85 2.82E-057 0.85 2.20E-0512 0.85 1.76E-05
800
1
7
13
1400 1
1400
1
7
13
200
1
7
13
800
1
7
13
4
3
6

December 19, 2011 MwRSF Report No. TRP-03-251-11
326
Degree of Curvature
Grade (%)
Length of Feature (ft)
Height of Feature (ft)
Offset (ft)
SI b
2 0.85 2.76E-057 0.85 2.18E-0512 0.85 1.77E-052 0.85 2.83E-057 0.85 2.20E-0512 0.85 1.77E-052 0.85 3.60E-067 0.85 2.46E-0612 0.85 1.61E-062 0.85 3.64E-067 0.85 2.47E-0612 0.85 1.67E-062 0.85 3.65E-067 0.85 2.44E-0612 0.85 1.66E-062 0.85 1.40E-057 0.85 1.07E-0512 0.85 8.62E-062 0.85 1.40E-057 0.85 1.07E-0512 0.85 8.68E-062 0.85 1.37E-057 0.85 1.08E-0512 0.85 8.72E-062 0.85 2.19E-057 0.85 1.71E-0512 0.85 1.40E-052 0.85 2.20E-057 0.85 1.72E-0512 0.85 1.37E-052 0.85 2.19E-057 0.85 1.71E-0512 0.85 1.38E-052 0.85 4.13E-067 0.85 2.84E-0612 0.85 1.86E-062 0.85 4.05E-067 0.85 2.78E-0612 0.85 1.92E-06
200
1
7
800
1
7
13
1400
1
7
13
1400
7
13
200
1
7
13
4 6
8
0
3

December 19, 2011 MwRSF Report No. TRP-03-251-11
327
Degree of Curvature
Grade (%)
Length of Feature (ft)
Height of Feature (ft)
Offset (ft)
SI b
2 0.85 3.93E-067 0.85 2.73E-0612 0.85 1.87E-062 0.85 1.56E-057 0.85 1.20E-0512 0.85 9.83E-062 0.85 1.56E-057 0.85 1.23E-0512 0.85 9.79E-062 0.85 1.58E-057 0.85 1.22E-0512 0.85 9.75E-062 0.85 2.47E-057 0.85 1.93E-0512 0.85 1.56E-052 0.85 2.44E-057 0.85 1.94E-0512 0.85 1.56E-052 0.85 2.45E-057 0.85 1.93E-0512 0.85 1.55E-052 0.85 5.61E-067 0.84 3.75E-0612 0.85 2.44E-062 0.85 5.23E-067 0.85 3.68E-0612 0.85 2.47E-062 0.85 5.34E-067 0.85 3.65E-0612 0.85 2.50E-062 0.85 2.05E-057 0.85 1.63E-0512 0.85 1.30E-052 0.85 2.08E-057 0.85 1.62E-0512 0.85 1.27E-052 0.85 2.12E-057 0.85 1.62E-0512 0.85 1.29E-05
800
1
7
13
1400
1
7
13
200
1
7
13
200 13
800
1
7
13
8
3
6

December 19, 2011 MwRSF Report No. TRP-03-251-11
328
Degree of Curvature
Grade (%)
Length of Feature (ft)
Height of Feature (ft)
Offset (ft)
SI b
2 0.85 3.30E-057 0.85 2.59E-0512 0.85 2.07E-052 0.85 3.30E-057 0.85 2.57E-0512 0.85 2.07E-052 0.85 3.31E-057 0.85 2.56E-0512 0.85 2.06E-05
1400
1
7
13
8 6

December 19, 2011 MwRSF Report No. TRP-03-251-11
329
Appendix CC. 1V:6H Urban Local

December 19, 2011 MwRSF Report No. TRP-03-251-11
330
Degree of Curvature
Grade (%)
Length of Feature (ft)
Height of Feature (ft)
Offset (ft)
SI b
2 1.05 9.38E-067 1.05 6.14E-0612 1.05 4.26E-062 1.05 1.00E-057 1.06 7.22E-0612 1.04 4.70E-062 1.05 1.01E-057 1.04 7.00E-0612 1.05 4.77E-062 1.05 3.37E-057 1.05 2.42E-0512 1.05 1.74E-052 1.05 3.47E-057 1.05 2.46E-0512 1.05 1.77E-052 1.05 3.43E-057 1.05 2.48E-0512 1.04 1.76E-052 1.05 5.77E-057 1.05 4.22E-0512 1.04 2.95E-052 1.05 5.80E-057 1.05 4.25E-0512 1.05 3.06E-052 1.05 5.84E-057 1.05 4.29E-0512 1.05 3.12E-052 1.05 1.39E-057 1.05 9.59E-0612 1.05 6.55E-062 1.04 1.50E-057 1.05 1.05E-0512 1.05 7.03E-062 1.04 1.54E-057 1.04 1.07E-0512 1.05 7.20E-062 1.05 5.04E-057 1.04 3.58E-0512 1.05 2.57E-05
800 1
1400
1
7
13
200
1
7
13
200
1
7
13
800
1
7
13
0
0
6

December 19, 2011 MwRSF Report No. TRP-03-251-11
331
Degree of Curvature
Grade (%)
Length of Feature (ft)
Height of Feature (ft)
Offset (ft)
SI b
2 1.05 5.10E-057 1.05 3.68E-0512 1.05 2.64E-052 1.05 5.14E-057 1.05 3.77E-0512 1.04 2.63E-052 1.05 8.70E-057 1.05 6.32E-0512 1.05 4.55E-052 1.05 8.70E-057 1.05 6.42E-0512 1.04 4.60E-052 1.05 8.83E-057 1.05 6.42E-0512 1.04 4.57E-052 1.05 1.39E-057 1.05 9.70E-0612 1.05 6.63E-062 1.05 1.53E-057 1.04 1.03E-0512 1.05 7.01E-062 1.04 1.48E-057 1.04 1.04E-0512 1.05 7.18E-062 1.05 5.01E-057 1.05 3.57E-0512 1.04 2.55E-052 1.05 5.12E-057 1.05 3.75E-0512 1.05 2.63E-052 1.04 5.07E-057 1.05 3.75E-0512 1.05 2.63E-052 1.05 8.69E-057 1.05 6.38E-0512 1.05 4.51E-052 1.05 8.70E-057 1.05 6.39E-0512 1.05 4.57E-05
1400
1
7
200
1
7
13
800
1
7
13
800
7
13
1400
1
7
13
0
6
12

December 19, 2011 MwRSF Report No. TRP-03-251-11
332
Degree of Curvature
Grade (%)
Length of Feature (ft)
Height of Feature (ft)
Offset (ft)
SI b
2 1.04 8.76E-057 1.05 6.42E-0512 1.05 4.56E-052 1.05 9.49E-067 1.05 5.96E-0612 1.05 3.99E-062 1.05 9.75E-067 1.04 6.03E-0612 1.05 4.25E-062 1.05 9.60E-067 1.04 6.14E-0612 1.05 3.99E-062 1.04 3.49E-057 1.05 2.47E-0512 1.04 1.76E-052 1.05 3.51E-057 1.04 2.56E-0512 1.05 1.78E-052 1.05 3.52E-057 1.04 2.55E-0512 1.04 1.76E-052 1.04 5.89E-057 1.05 4.32E-0512 1.05 3.04E-052 1.04 5.92E-057 1.04 4.31E-0512 1.05 3.07E-052 1.04 5.89E-057 1.05 4.30E-0512 1.05 3.06E-052 1.05 1.32E-057 1.05 8.61E-0612 1.05 6.09E-062 1.04 1.43E-057 1.05 9.28E-0612 1.04 6.20E-062 1.05 1.40E-057 1.04 9.26E-0612 1.05 5.99E-06
200
1
7
13
800
1
7
13
1400
1
7
13
1400 13
200
1
7
13
0 12
3
0
6

December 19, 2011 MwRSF Report No. TRP-03-251-11
333
Degree of Curvature
Grade (%)
Length of Feature (ft)
Height of Feature (ft)
Offset (ft)
SI b
2 1.04 5.17E-057 1.05 3.78E-0512 1.05 2.65E-052 1.04 5.28E-057 1.05 3.83E-0512 1.05 2.67E-052 1.05 5.30E-057 1.05 3.84E-0512 1.05 2.66E-052 1.05 8.88E-057 1.05 6.45E-0512 1.05 4.56E-052 1.04 8.97E-057 1.05 6.42E-0512 1.05 4.59E-052 1.05 8.95E-057 1.04 6.50E-0512 1.04 4.57E-052 1.05 1.40E-057 1.05 8.95E-0612 1.05 6.11E-062 1.04 1.42E-057 1.04 9.21E-0612 1.04 6.06E-062 1.05 1.44E-057 1.05 9.23E-0612 1.05 6.24E-062 1.05 5.28E-057 1.05 3.81E-0512 1.04 2.56E-052 1.05 5.25E-057 1.05 3.83E-0512 1.04 2.70E-052 1.05 5.36E-057 1.05 3.78E-0512 1.05 2.68E-052 1.05 8.89E-057 1.05 6.49E-0512 1.04 4.54E-05
800
1
7
13
1400 1
1400
1
7
13
200
1
7
13
800
1
7
13
3
6
12

December 19, 2011 MwRSF Report No. TRP-03-251-11
334
Degree of Curvature
Grade (%)
Length of Feature (ft)
Height of Feature (ft)
Offset (ft)
SI b
2 1.04 8.94E-057 1.05 6.39E-0512 1.04 4.57E-052 1.05 8.80E-057 1.05 6.53E-0512 1.05 4.56E-052 1.05 2.77E-057 1.05 1.90E-0512 1.05 1.27E-052 1.05 2.88E-057 1.04 1.96E-0512 1.04 1.27E-052 1.05 2.85E-057 1.05 1.98E-0512 1.05 1.28E-052 1.04 1.06E-047 1.04 7.56E-0512 1.05 5.42E-052 1.04 1.06E-047 1.04 7.67E-0512 1.05 5.46E-052 1.05 1.06E-047 1.04 7.60E-0512 1.05 5.47E-052 1.04 1.74E-047 1.05 1.24E-0412 1.05 8.76E-052 1.04 1.71E-047 1.05 1.27E-0412 1.05 8.80E-052 1.05 1.72E-047 1.05 1.24E-0412 1.05 8.83E-052 1.05 4.13E-057 1.05 2.86E-0512 1.05 1.86E-052 1.05 4.42E-057 1.04 2.88E-0512 1.05 1.90E-05
200
1
7
800
1
7
13
1400
1
7
13
1400
7
13
200
1
7
13
3 12
6
0
6
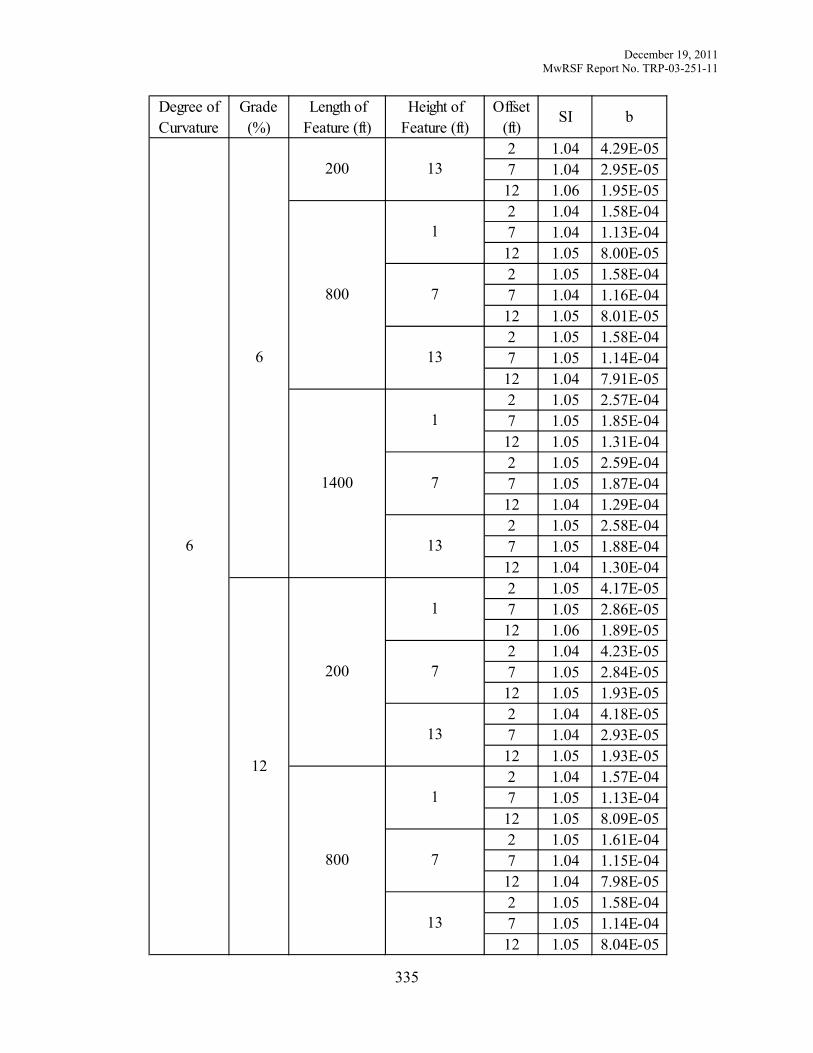
December 19, 2011 MwRSF Report No. TRP-03-251-11
335
Degree of Curvature
Grade (%)
Length of Feature (ft)
Height of Feature (ft)
Offset (ft)
SI b
2 1.04 4.29E-057 1.04 2.95E-0512 1.06 1.95E-052 1.04 1.58E-047 1.04 1.13E-0412 1.05 8.00E-052 1.05 1.58E-047 1.04 1.16E-0412 1.05 8.01E-052 1.05 1.58E-047 1.05 1.14E-0412 1.04 7.91E-052 1.05 2.57E-047 1.05 1.85E-0412 1.05 1.31E-042 1.05 2.59E-047 1.05 1.87E-0412 1.04 1.29E-042 1.05 2.58E-047 1.05 1.88E-0412 1.04 1.30E-042 1.05 4.17E-057 1.05 2.86E-0512 1.06 1.89E-052 1.04 4.23E-057 1.05 2.84E-0512 1.05 1.93E-052 1.04 4.18E-057 1.04 2.93E-0512 1.05 1.93E-052 1.04 1.57E-047 1.05 1.13E-0412 1.05 8.09E-052 1.05 1.61E-047 1.04 1.15E-0412 1.04 7.98E-052 1.05 1.58E-047 1.05 1.14E-0412 1.05 8.04E-05
800
1
7
13
1400
1
7
13
200
1
7
13
200 13
800
1
7
13
6
6
12

December 19, 2011 MwRSF Report No. TRP-03-251-11
336
Degree of Curvature
Grade (%)
Length of Feature (ft)
Height of Feature (ft)
Offset (ft)
SI b
2 1.05 2.55E-047 1.05 1.90E-0412 1.05 1.32E-042 1.05 2.61E-047 1.05 1.89E-0412 1.05 1.31E-042 1.05 2.61E-047 1.05 1.88E-0412 1.05 1.32E-04
1400
1
7
13
6 12

December 19, 2011 MwRSF Report No. TRP-03-251-11
337
Appendix DD. Guardrail Freeway

December 19, 2011 MwRSF Report No. TRP-03-251-11
338
Degree of Curvature
Grade (%)
Length of Feature (ft)
Height of Feature (ft)
Offset (ft)
SI b
2 2.47 9.01E-057 2.49 7.85E-0512 2.45 6.33E-052 2.70 8.57E-057 2.71 6.67E-0512 2.72 5.34E-052 2.96 6.77E-057 2.97 4.92E-0512 2.95 3.69E-052 2.49 3.08E-047 2.49 2.30E-0412 2.49 1.94E-042 2.71 2.38E-047 2.71 1.74E-0412 2.71 1.46E-042 2.97 1.67E-047 2.97 1.22E-0412 2.97 1.02E-042 2.49 5.10E-047 2.48 4.01E-0412 2.48 3.41E-042 2.72 3.74E-047 2.70 2.95E-0412 2.71 2.40E-042 2.98 2.66E-047 2.98 1.98E-0412 2.97 1.62E-042 2.48 9.60E-057 2.47 7.23E-0512 2.45 5.27E-052 2.69 9.17E-057 2.70 7.04E-0512 2.70 5.24E-052 2.96 6.71E-057 2.96 4.41E-0512 2.96 3.92E-052 2.49 3.16E-047 2.47 2.51E-0412 2.47 2.02E-04
800 1
1400
1
7
13
200
1
7
13
200
1
7
13
800
1
7
13
0
0
2

December 19, 2011 MwRSF Report No. TRP-03-251-11
339
Degree of Curvature
Grade (%)
Length of Feature (ft)
Height of Feature (ft)
Offset (ft)
SI b
2 2.71 2.39E-047 2.69 1.91E-0412 2.71 1.43E-042 2.98 1.63E-047 2.98 1.28E-0412 2.98 1.03E-042 2.48 5.25E-047 2.47 4.21E-0412 2.48 3.30E-042 2.71 3.89E-047 2.71 2.97E-0412 2.72 2.43E-042 2.98 2.56E-047 2.98 2.07E-0412 2.98 1.57E-042 2.50 1.09E-047 2.50 7.49E-0512 2.47 5.99E-052 2.67 1.08E-047 2.70 7.51E-0512 2.72 5.63E-052 2.95 8.10E-057 2.95 5.73E-0512 2.95 4.34E-052 2.49 3.45E-047 2.49 2.63E-0412 2.50 2.20E-042 2.72 2.58E-047 2.73 1.98E-0412 2.70 1.66E-042 2.98 1.87E-047 2.98 1.41E-0412 2.97 1.07E-042 2.48 5.99E-047 2.49 4.60E-0412 2.48 3.86E-042 2.72 4.31E-047 2.72 3.29E-0412 2.72 2.64E-04
1400
1
7
200
1
7
13
800
1
7
13
800
7
13
1400
1
7
13
0
2
3

December 19, 2011 MwRSF Report No. TRP-03-251-11
340
Degree of Curvature
Grade (%)
Length of Feature (ft)
Height of Feature (ft)
Offset (ft)
SI b
2 2.98 2.91E-047 2.97 2.25E-0412 2.97 1.93E-042 2.48 8.86E-057 2.49 6.37E-0512 2.48 4.96E-052 2.72 8.14E-057 2.70 6.21E-0512 2.71 4.48E-052 2.94 6.35E-057 2.96 4.45E-0512 2.95 3.55E-052 2.47 2.93E-047 2.49 2.26E-0412 2.47 1.86E-042 2.71 2.21E-047 2.71 1.63E-0412 2.72 1.40E-042 2.97 1.55E-047 2.97 1.14E-0412 2.97 9.42E-052 2.48 4.77E-047 2.48 3.75E-0412 2.48 3.07E-042 2.72 3.61E-047 2.71 2.80E-0412 2.71 2.26E-042 2.98 2.47E-047 2.96 1.90E-0412 2.98 1.51E-042 2.46 8.97E-057 2.49 6.09E-0512 2.48 5.27E-052 2.71 8.48E-057 2.69 5.91E-0512 2.71 4.82E-052 2.97 6.28E-057 2.96 4.56E-0512 3.00 3.39E-05
200
1
7
13
800
1
7
13
1400
1
7
13
1400 13
200
1
7
13
0 3
2
0
2

December 19, 2011 MwRSF Report No. TRP-03-251-11
341
Degree of Curvature
Grade (%)
Length of Feature (ft)
Height of Feature (ft)
Offset (ft)
SI b
2 2.48 2.91E-047 2.49 2.27E-0412 2.48 1.80E-042 2.71 2.22E-047 2.71 1.66E-0412 2.72 1.32E-042 2.97 1.57E-047 2.98 1.17E-0412 2.96 9.49E-052 2.48 4.93E-047 2.49 3.92E-0412 2.48 3.19E-042 2.71 3.54E-047 2.71 2.71E-0412 2.71 2.34E-042 2.97 2.46E-047 2.97 1.83E-0412 2.97 1.55E-042 2.49 9.54E-057 2.48 7.58E-0512 2.48 5.88E-052 2.69 9.48E-057 2.69 7.03E-0512 2.70 5.10E-052 2.95 7.28E-057 2.95 4.83E-0512 2.96 3.68E-052 2.48 3.30E-047 2.48 2.62E-0412 2.48 1.99E-042 2.73 2.48E-047 2.71 1.86E-0412 2.71 1.54E-042 2.97 1.80E-047 2.98 1.30E-0412 2.96 1.07E-042 2.49 5.49E-047 2.48 4.30E-0412 2.48 3.42E-04
800
1
7
13
1400 1
1400
1
7
13
200
1
7
13
800
1
7
13
2
2
3

December 19, 2011 MwRSF Report No. TRP-03-251-11
342
Degree of Curvature
Grade (%)
Length of Feature (ft)
Height of Feature (ft)
Offset (ft)
SI b
2 2.71 4.08E-047 2.71 3.09E-0412 2.72 2.44E-042 2.97 2.76E-047 2.98 2.16E-0412 2.97 1.71E-042 2.50 1.03E-047 2.46 7.96E-0512 2.46 6.21E-052 2.69 1.04E-047 2.70 6.66E-0512 2.68 5.62E-052 2.95 7.07E-057 2.93 5.27E-0512 2.97 3.78E-052 2.48 3.34E-047 2.49 2.54E-0412 2.47 2.12E-042 2.71 2.56E-047 2.71 1.94E-0412 2.71 1.51E-042 2.98 1.76E-047 2.97 1.35E-0412 2.97 1.08E-042 2.48 5.77E-047 2.47 4.32E-0412 2.48 3.77E-042 2.72 4.00E-047 2.71 3.05E-0412 2.72 2.50E-042 2.98 2.79E-047 2.97 2.15E-0412 2.96 1.81E-042 2.46 1.06E-047 2.49 7.66E-0512 2.48 5.83E-052 2.69 1.04E-047 2.70 6.73E-0512 2.70 5.32E-05
200
1
7
800
1
7
13
1400
1
7
13
1400
7
13
200
1
7
13
2 3
3
0
2

December 19, 2011 MwRSF Report No. TRP-03-251-11
343
Degree of Curvature
Grade (%)
Length of Feature (ft)
Height of Feature (ft)
Offset (ft)
SI b
2 2.96 7.24E-057 2.94 5.45E-0512 2.97 3.62E-052 2.47 3.42E-047 2.49 2.49E-0412 2.49 2.09E-042 2.72 2.52E-047 2.72 1.83E-0412 2.71 1.56E-042 2.96 1.77E-047 2.97 1.30E-0412 2.98 1.03E-042 2.48 5.62E-047 2.49 4.37E-0412 2.48 3.61E-042 2.72 4.15E-047 2.72 3.12E-0412 2.72 2.51E-042 2.98 2.76E-047 2.97 2.15E-0412 2.98 1.70E-042 2.47 1.38E-047 2.46 8.13E-0512 2.45 6.61E-052 2.71 1.13E-047 2.72 7.76E-0512 2.70 5.61E-052 2.96 7.99E-057 2.95 5.68E-0512 2.97 4.12E-052 2.49 3.84E-047 2.48 3.03E-0412 2.48 2.37E-042 2.72 2.81E-047 2.70 2.15E-0412 2.72 1.76E-042 2.99 2.01E-047 2.97 1.49E-0412 2.97 1.21E-04
800
1
7
13
1400
1
7
13
200
1
7
13
200 13
800
1
7
13
3
2
3

December 19, 2011 MwRSF Report No. TRP-03-251-11
344
Degree of Curvature
Grade (%)
Length of Feature (ft)
Height of Feature (ft)
Offset (ft)
SI b
2 2.48 6.39E-047 2.49 4.78E-0412 2.48 4.06E-042 2.72 4.52E-047 2.72 3.58E-0412 2.72 2.81E-042 2.98 3.18E-047 2.97 2.46E-0412 2.97 2.00E-04
1400
1
7
13
3 3

December 19, 2011 MwRSF Report No. TRP-03-251-11
345
Appendix EE. Guardrail Undivided Rural Arterial
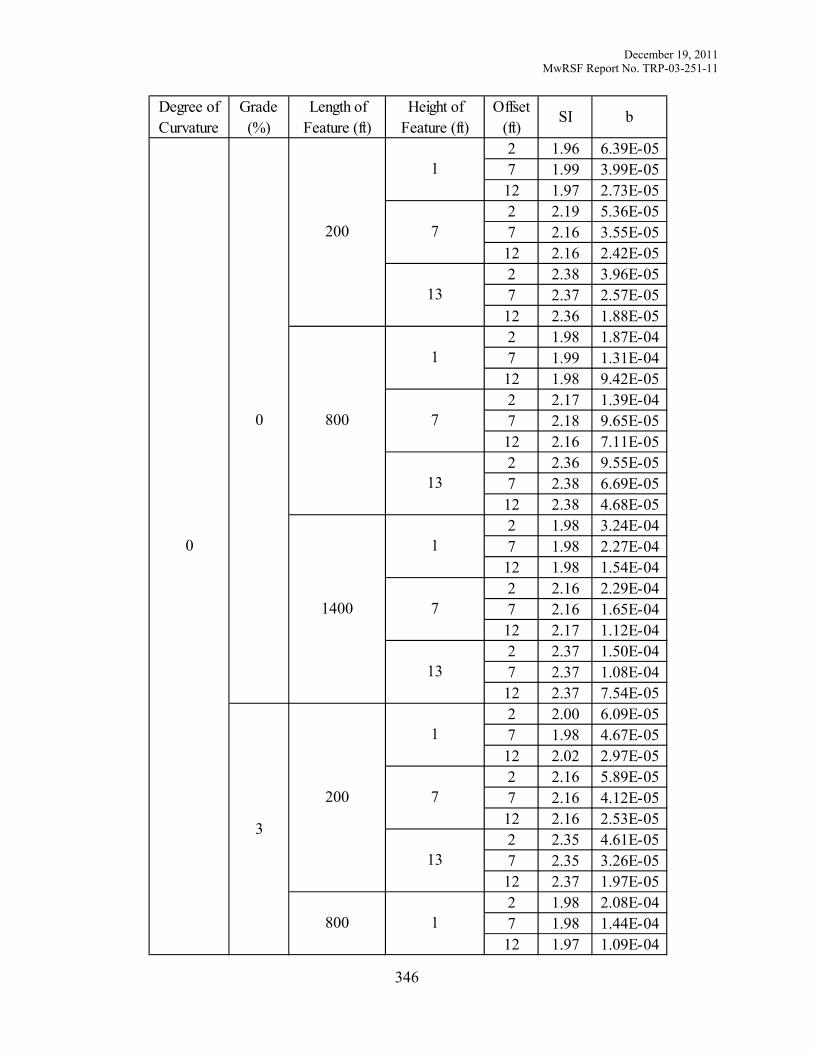
December 19, 2011 MwRSF Report No. TRP-03-251-11
346
Degree of Curvature
Grade (%)
Length of Feature (ft)
Height of Feature (ft)
Offset (ft)
SI b
2 1.96 6.39E-057 1.99 3.99E-0512 1.97 2.73E-052 2.19 5.36E-057 2.16 3.55E-0512 2.16 2.42E-052 2.38 3.96E-057 2.37 2.57E-0512 2.36 1.88E-052 1.98 1.87E-047 1.99 1.31E-0412 1.98 9.42E-052 2.17 1.39E-047 2.18 9.65E-0512 2.16 7.11E-052 2.36 9.55E-057 2.38 6.69E-0512 2.38 4.68E-052 1.98 3.24E-047 1.98 2.27E-0412 1.98 1.54E-042 2.16 2.29E-047 2.16 1.65E-0412 2.17 1.12E-042 2.37 1.50E-047 2.37 1.08E-0412 2.37 7.54E-052 2.00 6.09E-057 1.98 4.67E-0512 2.02 2.97E-052 2.16 5.89E-057 2.16 4.12E-0512 2.16 2.53E-052 2.35 4.61E-057 2.35 3.26E-0512 2.37 1.97E-052 1.98 2.08E-047 1.98 1.44E-0412 1.97 1.09E-04
800 1
1400
1
7
13
200
1
7
13
200
1
7
13
800
1
7
13
0
0
3

December 19, 2011 MwRSF Report No. TRP-03-251-11
347
Degree of Curvature
Grade (%)
Length of Feature (ft)
Height of Feature (ft)
Offset (ft)
SI b
2 2.18 1.52E-047 2.15 1.17E-0412 2.17 8.12E-052 2.38 1.08E-047 2.36 8.03E-0512 2.37 5.15E-052 1.98 3.65E-047 1.98 2.48E-0412 1.97 1.87E-042 2.15 2.62E-047 2.17 1.80E-0412 2.17 1.28E-042 2.36 1.84E-047 2.38 1.25E-0412 2.36 9.01E-052 1.97 8.94E-057 1.96 5.31E-0512 1.94 4.51E-052 2.16 8.68E-057 2.19 5.50E-0512 2.16 3.92E-052 2.36 6.12E-057 2.37 4.00E-0512 2.34 2.85E-052 1.98 2.83E-047 1.97 1.91E-0412 1.98 1.49E-042 2.18 2.13E-047 2.18 1.35E-0412 2.16 1.10E-042 2.38 1.42E-047 2.38 1.03E-0412 2.38 7.17E-052 1.99 4.79E-047 1.98 3.41E-0412 1.99 2.35E-042 2.18 3.39E-047 2.16 2.43E-0412 2.17 1.74E-04
1400
1
7
200
1
7
13
800
1
7
13
800
7
13
1400
1
7
13
0
3
6

December 19, 2011 MwRSF Report No. TRP-03-251-11
348
Degree of Curvature
Grade (%)
Length of Feature (ft)
Height of Feature (ft)
Offset (ft)
SI b
2 2.37 2.31E-047 2.37 1.59E-0412 2.36 1.23E-042 2.01 5.83E-057 1.95 4.21E-0512 1.94 3.07E-052 2.15 6.36E-057 2.13 4.14E-0512 2.16 2.81E-052 2.37 4.61E-057 2.36 3.10E-0512 2.40 1.89E-052 1.99 2.03E-047 1.98 1.46E-0412 2.14 6.86E-052 2.46 9.02E-057 2.47 6.26E-0512 2.47 4.43E-052 2.61 7.38E-057 2.59 5.39E-0512 2.61 3.78E-052 2.24 2.14E-047 2.25 1.53E-0412 2.23 1.11E-042 2.46 1.50E-047 2.46 1.05E-0412 2.46 7.34E-052 2.62 1.15E-047 2.62 8.36E-0512 2.61 6.04E-052 2.23 5.03E-057 2.26 3.10E-0512 2.28 2.14E-052 2.46 4.20E-057 2.45 2.67E-0512 2.49 1.71E-052 2.61 3.32E-057 2.60 2.41E-0512 2.63 1.54E-05
200
1
7
13
800
1
7
13
1400
1
7
13
1400 13
200
1
7
13
0 6
3
0
3

December 19, 2011 MwRSF Report No. TRP-03-251-11
349
Degree of Curvature
Grade (%)
Length of Feature (ft)
Height of Feature (ft)
Offset (ft)
SI b
2 2.24 1.41E-047 2.24 1.09E-0412 2.23 7.19E-052 2.46 1.03E-047 2.47 7.03E-0512 2.47 5.18E-052 2.63 8.25E-057 2.62 5.75E-0512 2.61 4.24E-052 2.24 2.46E-047 2.25 1.69E-0412 2.24 1.20E-042 2.46 1.65E-047 2.47 1.16E-0412 2.47 8.19E-052 2.61 1.32E-047 2.62 9.43E-0512 2.62 6.54E-052 2.27 5.76E-057 2.23 3.74E-0512 2.25 2.80E-052 2.48 5.46E-057 2.46 3.33E-0512 2.46 2.33E-052 2.64 4.39E-057 2.60 3.03E-0512 2.61 1.97E-052 2.23 1.97E-047 2.24 1.37E-0412 2.24 9.35E-052 2.47 1.37E-047 2.46 9.65E-0512 2.49 6.36E-052 2.63 1.08E-047 2.62 7.61E-0512 2.60 5.75E-052 2.25 3.24E-047 2.24 2.33E-0412 2.24 1.61E-04
800
1
7
13
1400 1
1400
1
7
13
200
1
7
13
800
1
7
13
3
3
6

December 19, 2011 MwRSF Report No. TRP-03-251-11
350
Degree of Curvature
Grade (%)
Length of Feature (ft)
Height of Feature (ft)
Offset (ft)
SI b
2 2.47 2.22E-047 2.47 1.62E-0412 2.46 1.13E-042 2.61 1.77E-047 2.61 1.26E-0412 2.61 8.87E-052 2.24 1.49E-047 2.24 1.02E-0412 2.24 7.03E-052 2.42 1.46E-047 2.47 9.05E-0512 2.43 6.42E-052 2.60 1.18E-047 2.64 7.21E-0512 2.61 4.65E-052 2.23 4.83E-047 2.24 3.35E-0412 2.26 2.29E-042 2.45 3.48E-047 2.44 2.37E-0412 2.48 1.68E-042 2.59 2.84E-047 2.60 1.93E-0412 2.63 1.28E-042 2.25 7.97E-047 2.25 5.54E-0412 2.24 4.10E-042 2.46 5.62E-047 2.46 3.89E-0412 2.46 2.69E-042 2.60 4.47E-047 2.61 3.05E-0412 2.63 2.10E-042 2.26 1.62E-047 2.25 1.18E-0412 2.25 8.12E-052 2.48 1.58E-047 2.46 1.02E-0412 2.46 6.72E-05
200
1
7
800
1
7
13
1400
1
7
13
1400
7
13
200
1
7
13
3 6
6
0
3

December 19, 2011 MwRSF Report No. TRP-03-251-11
351
Degree of Curvature
Grade (%)
Length of Feature (ft)
Height of Feature (ft)
Offset (ft)
SI b
2 2.59 1.25E-047 2.65 7.83E-0512 2.62 5.51E-052 2.25 5.23E-047 2.23 3.68E-0412 2.22 2.70E-042 2.46 4.07E-047 2.47 2.62E-0412 2.47 1.85E-042 2.63 3.20E-047 2.61 2.20E-0412 2.62 1.46E-042 2.25 9.24E-047 2.24 6.68E-0412 2.24 4.55E-042 2.47 6.30E-047 2.47 4.26E-0412 2.47 3.08E-042 2.64 4.69E-047 2.61 3.50E-0412 2.63 2.40E-042 2.24 2.37E-047 2.23 1.55E-0412 2.23 1.11E-042 2.48 2.04E-047 2.50 1.34E-0412 2.47 8.85E-052 2.59 1.73E-047 2.63 1.19E-0412 2.62 7.20E-052 2.24 7.12E-047 2.25 5.10E-0412 2.25 3.36E-042 2.46 5.04E-047 2.45 3.61E-0412 2.46 2.57E-042 2.62 4.02E-047 2.61 2.93E-0412 2.61 2.03E-04
800
1
7
13
1400
1
7
13
200
1
7
13
200 13
800
1
7
13
6
3
6

December 19, 2011 MwRSF Report No. TRP-03-251-11
352
Degree of Curvature
Grade (%)
Length of Feature (ft)
Height of Feature (ft)
Offset (ft)
SI b
2 2.24 1.22E-037 2.25 8.50E-0412 2.23 6.06E-042 2.46 8.52E-047 2.46 6.16E-0412 2.47 4.07E-042 2.61 6.66E-047 2.61 4.71E-0412 2.61 3.21E-04
1400
1
7
13
6 6

December 19, 2011 MwRSF Report No. TRP-03-251-11
353
Appendix FF. Guardrail Divided Rural Arterial

December 19, 2011 MwRSF Report No. TRP-03-251-11
354
Degree of Curvature
Grade (%)
Length of Feature (ft)
Height of Feature (ft)
Offset (ft)
SI b
2 1.99 1.22E-047 1.97 9.46E-0512 1.98 6.83E-052 2.17 1.16E-047 2.16 7.85E-0512 2.20 5.91E-052 2.36 8.26E-057 2.36 6.30E-0512 2.36 4.71E-052 1.97 4.05E-047 1.98 3.15E-0412 1.99 2.42E-042 2.16 3.01E-047 2.17 2.27E-0412 2.17 1.88E-042 2.38 1.97E-047 2.36 1.68E-0412 2.38 1.22E-042 1.97 6.88E-047 1.98 5.18E-0412 1.97 4.35E-042 2.17 4.68E-047 2.17 3.65E-0412 2.17 3.11E-042 2.37 3.21E-047 2.39 2.47E-0412 2.38 2.05E-042 1.99 1.46E-047 1.97 9.28E-0512 2.01 7.72E-052 2.13 1.33E-047 2.17 9.49E-0512 2.15 7.25E-052 2.34 1.04E-047 2.37 6.41E-0512 2.37 5.38E-052 1.99 4.52E-047 1.97 3.34E-0412 1.99 2.63E-04
800 1
1400
1
7
13
200
1
7
13
200
1
7
13
800
1
7
13
0
0
3

December 19, 2011 MwRSF Report No. TRP-03-251-11
355
Degree of Curvature
Grade (%)
Length of Feature (ft)
Height of Feature (ft)
Offset (ft)
SI b
2 2.16 3.45E-047 2.16 2.60E-0412 2.16 1.99E-042 2.38 2.13E-047 2.36 1.79E-0412 2.38 1.43E-042 1.97 7.42E-047 1.99 5.99E-0412 1.97 4.95E-042 2.16 5.55E-047 2.16 4.26E-0412 2.17 3.38E-042 2.37 3.62E-047 2.37 2.85E-0412 2.37 2.32E-042 1.97 1.84E-047 1.99 1.36E-0412 1.97 1.04E-042 2.18 1.73E-047 2.17 1.26E-0412 2.15 9.96E-052 2.38 1.22E-047 2.36 8.82E-0512 2.36 6.93E-052 1.99 5.93E-047 1.96 4.77E-0412 1.96 3.67E-042 2.17 4.27E-047 2.16 3.47E-0412 2.17 2.71E-042 2.39 2.88E-047 2.37 2.32E-0412 2.37 1.89E-042 1.98 1.01E-037 1.98 8.26E-0412 1.99 6.19E-042 2.17 7.19E-047 2.17 5.63E-0412 2.18 4.73E-04
1400
1
7
200
1
7
13
800
1
7
13
800
7
13
1400
1
7
13
0
3
6

December 19, 2011 MwRSF Report No. TRP-03-251-11
356
Degree of Curvature
Grade (%)
Length of Feature (ft)
Height of Feature (ft)
Offset (ft)
SI b
2 2.37 4.92E-047 2.37 3.79E-0412 2.37 3.06E-042 1.97 1.36E-047 1.95 9.58E-0512 1.96 7.67E-052 2.18 1.27E-047 2.15 9.65E-0512 2.12 7.49E-052 2.37 9.18E-057 2.40 5.97E-0512 2.39 4.82E-052 1.99 4.28E-047 1.98 3.40E-0412 1.97 2.71E-042 2.18 3.14E-047 2.17 2.36E-0412 2.16 2.07E-042 2.36 2.13E-047 2.39 1.65E-0412 2.37 1.34E-042 1.97 7.05E-047 1.98 5.71E-0412 1.99 4.60E-042 2.15 5.15E-047 2.16 3.99E-0412 2.17 3.31E-042 2.38 3.37E-047 2.38 2.67E-0412 2.37 2.17E-042 1.98 1.46E-047 1.97 1.05E-0412 1.97 8.35E-052 2.16 1.45E-047 2.18 9.20E-0512 2.17 7.91E-052 2.38 9.43E-057 2.39 7.14E-0512 2.35 5.24E-05
200
1
7
13
800
1
7
13
1400
1
7
13
1400 13
200
1
7
13
0 6
3
0
3

December 19, 2011 MwRSF Report No. TRP-03-251-11
357
Degree of Curvature
Grade (%)
Length of Feature (ft)
Height of Feature (ft)
Offset (ft)
SI b
2 1.98 4.71E-047 1.98 3.77E-0412 1.97 2.98E-042 2.16 3.58E-047 2.17 2.80E-0412 2.17 2.24E-042 2.37 2.42E-047 2.36 1.85E-0412 2.37 1.53E-042 1.98 8.00E-047 1.97 6.13E-0412 1.96 5.10E-042 2.17 5.69E-047 2.16 4.50E-0412 2.17 3.56E-042 2.37 3.94E-047 2.37 3.00E-0412 2.38 2.43E-042 1.95 2.12E-047 1.97 1.44E-0412 1.97 1.16E-042 2.16 2.02E-047 2.17 1.22E-0412 2.14 1.03E-042 2.38 1.32E-047 2.38 8.65E-0512 2.37 6.66E-052 1.97 6.47E-047 1.97 4.59E-0412 1.96 3.93E-042 2.15 4.97E-047 2.17 3.60E-0412 2.17 2.84E-042 2.38 3.24E-047 2.37 2.58E-0412 2.37 1.90E-042 1.98 1.07E-037 1.98 8.06E-0412 1.97 6.96E-04
800
1
7
13
1400 1
1400
1
7
13
200
1
7
13
800
1
7
13
3
3
6
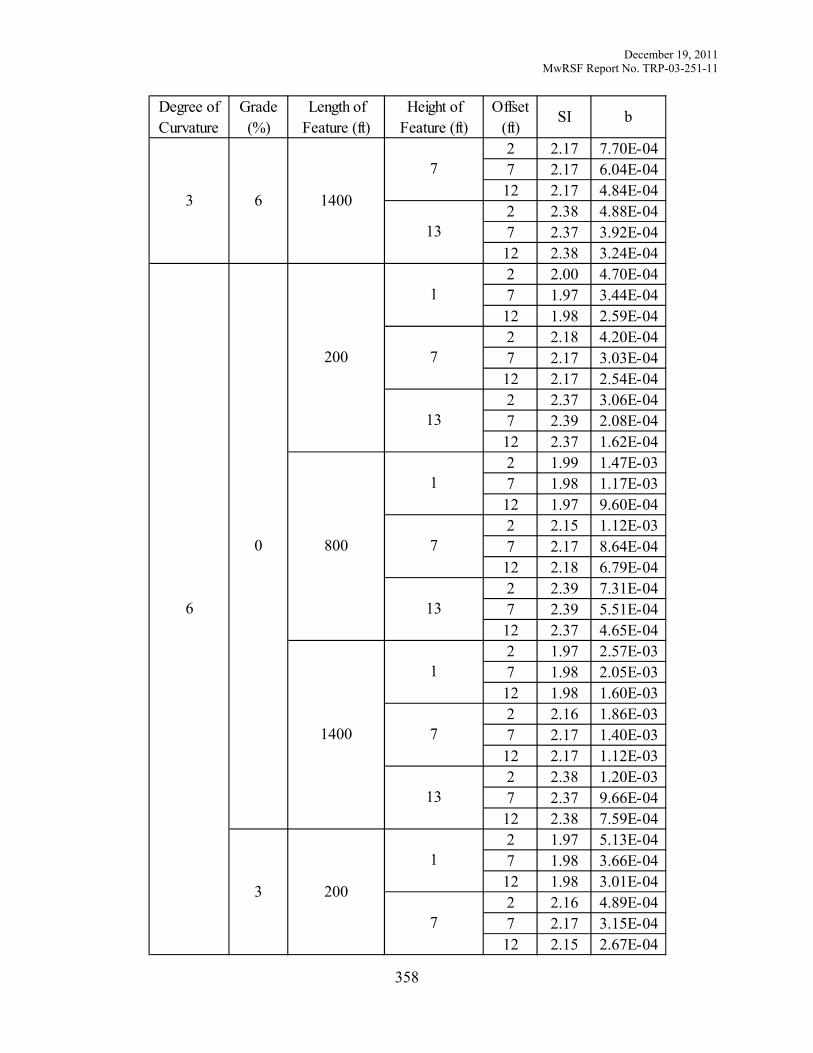
December 19, 2011 MwRSF Report No. TRP-03-251-11
358
Degree of Curvature
Grade (%)
Length of Feature (ft)
Height of Feature (ft)
Offset (ft)
SI b
2 2.17 7.70E-047 2.17 6.04E-0412 2.17 4.84E-042 2.38 4.88E-047 2.37 3.92E-0412 2.38 3.24E-042 2.00 4.70E-047 1.97 3.44E-0412 1.98 2.59E-042 2.18 4.20E-047 2.17 3.03E-0412 2.17 2.54E-042 2.37 3.06E-047 2.39 2.08E-0412 2.37 1.62E-042 1.99 1.47E-037 1.98 1.17E-0312 1.97 9.60E-042 2.15 1.12E-037 2.17 8.64E-0412 2.18 6.79E-042 2.39 7.31E-047 2.39 5.51E-0412 2.37 4.65E-042 1.97 2.57E-037 1.98 2.05E-0312 1.98 1.60E-032 2.16 1.86E-037 2.17 1.40E-0312 2.17 1.12E-032 2.38 1.20E-037 2.37 9.66E-0412 2.38 7.59E-042 1.97 5.13E-047 1.98 3.66E-0412 1.98 3.01E-042 2.16 4.89E-047 2.17 3.15E-0412 2.15 2.67E-04
200
1
7
800
1
7
13
1400
1
7
13
1400
7
13
200
1
7
13
3 6
6
0
3

December 19, 2011 MwRSF Report No. TRP-03-251-11
359
Degree of Curvature
Grade (%)
Length of Feature (ft)
Height of Feature (ft)
Offset (ft)
SI b
2 2.39 3.49E-047 2.32 2.85E-0412 2.37 1.84E-042 1.98 1.62E-037 1.98 1.24E-0312 1.97 9.46E-042 2.14 1.28E-037 2.15 9.69E-0412 2.16 7.82E-042 2.37 8.43E-047 2.37 6.64E-0412 2.38 4.98E-042 1.97 2.95E-037 1.98 2.22E-0312 1.99 1.80E-032 2.17 2.03E-037 2.17 1.58E-0312 2.17 1.28E-032 2.37 1.40E-037 2.39 1.02E-0312 2.38 8.40E-042 1.96 7.48E-047 2.00 4.75E-0412 1.98 4.22E-042 2.18 6.25E-047 2.19 4.20E-0412 2.16 3.45E-042 2.35 4.70E-047 2.39 3.29E-0412 2.38 2.45E-042 1.97 2.27E-037 1.97 1.75E-0312 1.98 1.37E-032 2.17 1.62E-037 2.17 1.33E-0312 2.17 1.01E-032 2.39 1.07E-037 2.38 8.50E-0412 2.36 7.16E-04
800
1
7
13
1400
1
7
13
200
1
7
13
200 13
800
1
7
13
6
3
6

December 19, 2011 MwRSF Report No. TRP-03-251-11
360
Degree of Curvature
Grade (%)
Length of Feature (ft)
Height of Feature (ft)
Offset (ft)
SI b
2 1.98 3.88E-037 1.99 2.84E-0312 1.99 2.39E-032 2.17 2.76E-037 2.17 2.05E-0312 2.17 1.72E-032 2.37 1.79E-037 2.38 1.36E-0312 2.38 1.12E-03
1400
1
7
13
6 6

December 19, 2011 MwRSF Report No. TRP-03-251-11
361
Appendix GG. Guardrail Rural Local

December 19, 2011 MwRSF Report No. TRP-03-251-11
362
Degree of Curvature
Grade (%)
Length of Feature (ft)
Height of Feature (ft)
Offset (ft)
SI b
2 1.95 3.69E-047 1.94 2.93E-0412 1.96 1.70E-042 2.15 3.85E-047 2.15 2.62E-0412 2.13 1.72E-042 2.34 2.79E-047 2.31 1.83E-0412 2.35 1.38E-042 1.95 1.19E-037 1.95 8.85E-0412 1.96 6.32E-042 2.14 8.94E-047 2.14 6.48E-0412 2.14 4.67E-042 2.34 6.43E-047 2.35 4.79E-0412 2.35 3.08E-042 1.95 2.01E-037 1.97 1.39E-0312 1.95 1.03E-032 2.14 1.47E-037 2.15 1.03E-0312 2.15 7.28E-042 2.36 9.48E-047 2.35 7.05E-0412 2.36 5.05E-042 1.95 4.90E-047 1.96 3.39E-0412 1.96 2.46E-042 2.12 4.64E-047 2.13 3.27E-0412 2.13 2.31E-042 2.32 3.75E-047 2.33 2.28E-0412 2.34 1.53E-042 1.95 1.49E-037 1.96 9.84E-0412 1.96 7.46E-04
800 1
1400
1
7
13
200
1
7
13
200
1
7
13
800
1
7
13
0
0
4

December 19, 2011 MwRSF Report No. TRP-03-251-11
363
Degree of Curvature
Grade (%)
Length of Feature (ft)
Height of Feature (ft)
Offset (ft)
SI b
2 2.15 1.13E-037 2.15 7.75E-0412 2.13 5.78E-042 2.36 7.45E-047 2.35 5.48E-0412 2.36 4.03E-042 1.96 2.52E-037 1.95 1.83E-0312 1.95 1.28E-032 2.14 1.83E-037 2.16 1.31E-0312 2.13 9.42E-042 2.34 1.22E-037 2.33 9.20E-0412 2.34 6.55E-042 1.97 5.96E-047 1.97 3.98E-0412 1.99 2.73E-042 2.12 5.72E-047 2.16 3.88E-0412 2.15 2.36E-042 2.35 4.05E-047 2.33 3.00E-0412 2.32 2.01E-042 1.95 1.72E-037 1.97 1.25E-0312 1.97 8.52E-042 2.14 1.36E-037 2.14 9.51E-0412 2.15 7.10E-042 2.34 9.46E-047 2.35 6.99E-0412 2.35 4.84E-042 1.95 2.99E-037 1.96 2.07E-0312 1.97 1.44E-032 2.14 2.20E-037 2.13 1.62E-0312 2.13 1.12E-03
1400
1
7
200
1
7
13
800
1
7
13
800
7
13
1400
1
7
13
0
4
8
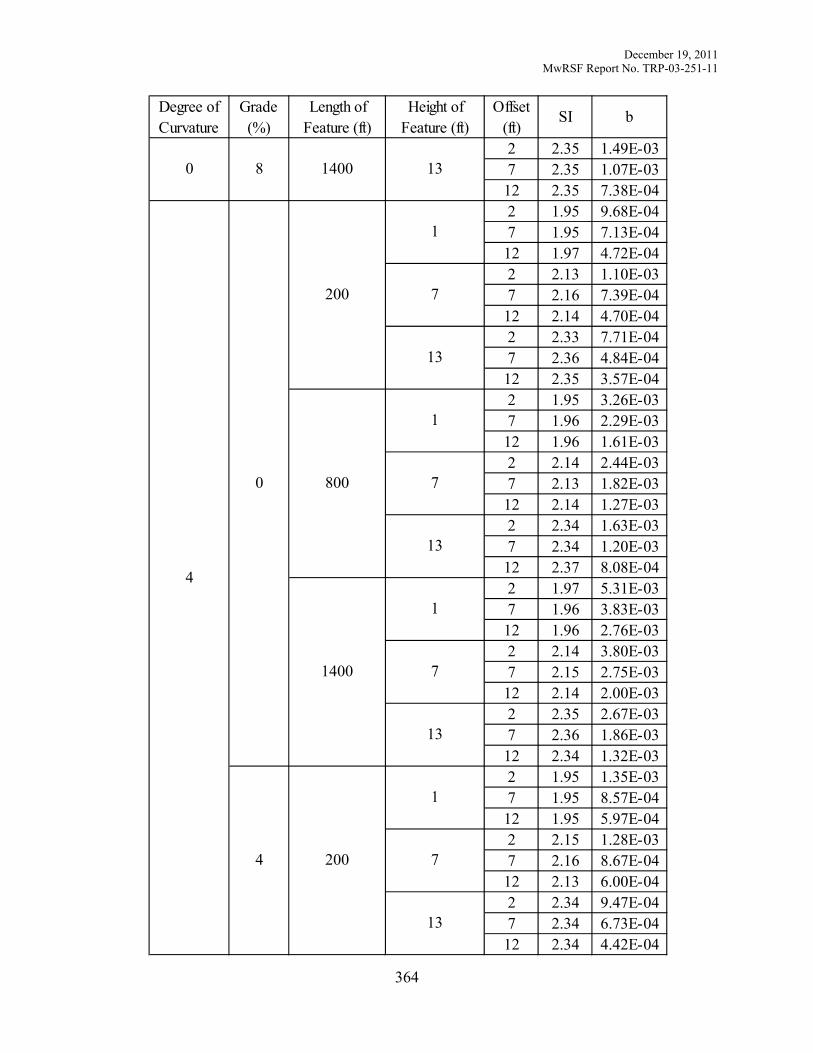
December 19, 2011 MwRSF Report No. TRP-03-251-11
364
Degree of Curvature
Grade (%)
Length of Feature (ft)
Height of Feature (ft)
Offset (ft)
SI b
2 2.35 1.49E-037 2.35 1.07E-0312 2.35 7.38E-042 1.95 9.68E-047 1.95 7.13E-0412 1.97 4.72E-042 2.13 1.10E-037 2.16 7.39E-0412 2.14 4.70E-042 2.33 7.71E-047 2.36 4.84E-0412 2.35 3.57E-042 1.95 3.26E-037 1.96 2.29E-0312 1.96 1.61E-032 2.14 2.44E-037 2.13 1.82E-0312 2.14 1.27E-032 2.34 1.63E-037 2.34 1.20E-0312 2.37 8.08E-042 1.97 5.31E-037 1.96 3.83E-0312 1.96 2.76E-032 2.14 3.80E-037 2.15 2.75E-0312 2.14 2.00E-032 2.35 2.67E-037 2.36 1.86E-0312 2.34 1.32E-032 1.95 1.35E-037 1.95 8.57E-0412 1.95 5.97E-042 2.15 1.28E-037 2.16 8.67E-0412 2.13 6.00E-042 2.34 9.47E-047 2.34 6.73E-0412 2.34 4.42E-04
200
1
7
13
800
1
7
13
1400
1
7
13
1400 13
200
1
7
13
0 8
4
0
4

December 19, 2011 MwRSF Report No. TRP-03-251-11
365
Degree of Curvature
Grade (%)
Length of Feature (ft)
Height of Feature (ft)
Offset (ft)
SI b
2 1.95 3.75E-037 1.97 2.86E-0312 1.97 1.98E-032 2.16 2.91E-037 2.14 2.22E-0312 2.14 1.50E-032 2.35 2.10E-037 2.35 1.49E-0312 2.33 1.05E-032 1.96 6.63E-037 1.95 4.95E-0312 1.96 3.44E-032 2.13 5.07E-037 2.14 3.55E-0312 2.14 2.45E-032 2.33 3.14E-037 2.35 2.30E-0312 2.34 1.68E-032 1.95 1.60E-037 1.96 9.83E-0412 1.94 7.16E-042 2.15 1.52E-037 2.15 1.02E-0312 2.14 6.92E-042 2.36 1.17E-037 2.35 7.33E-0412 2.36 5.16E-042 1.96 4.73E-037 1.96 3.50E-0312 1.96 2.36E-032 2.15 3.67E-037 2.14 2.70E-0312 2.14 1.78E-032 2.35 2.64E-037 2.35 1.72E-0312 2.34 1.28E-032 1.96 8.18E-037 1.97 5.67E-0312 1.96 3.96E-03
800
1
7
13
1400 1
1400
1
7
13
200
1
7
13
800
1
7
13
4
4
8

December 19, 2011 MwRSF Report No. TRP-03-251-11
366
Degree of Curvature
Grade (%)
Length of Feature (ft)
Height of Feature (ft)
Offset (ft)
SI b
2 2.15 5.69E-037 2.13 4.27E-0312 2.14 2.97E-032 2.34 4.06E-037 2.35 2.73E-0312 2.35 1.98E-032 1.95 1.93E-037 1.96 1.34E-0312 1.95 9.37E-042 2.17 2.10E-037 2.13 1.36E-0312 2.14 9.49E-042 2.34 1.59E-037 2.34 1.08E-0312 2.35 7.05E-042 1.96 6.09E-037 1.96 4.30E-0312 1.97 3.02E-032 2.14 4.84E-037 2.15 3.36E-0312 2.14 2.29E-032 2.35 3.26E-037 2.33 2.35E-0312 2.35 1.68E-032 1.96 9.94E-037 1.97 7.30E-0312 1.96 5.32E-032 2.15 7.49E-037 2.14 5.49E-0312 2.14 3.90E-032 2.34 5.26E-037 2.34 3.85E-0312 2.34 2.63E-032 1.97 2.65E-037 1.96 1.76E-0312 1.93 1.24E-032 2.15 2.55E-037 2.13 1.81E-0312 2.16 1.14E-03
200
1
7
800
1
7
13
1400
1
7
13
1400
7
13
200
1
7
13
4 8
8
0
4

December 19, 2011 MwRSF Report No. TRP-03-251-11
367
Degree of Curvature
Grade (%)
Length of Feature (ft)
Height of Feature (ft)
Offset (ft)
SI b
2 2.36 1.82E-037 2.35 1.25E-0312 2.34 8.73E-042 1.96 7.69E-037 1.96 4.91E-0312 1.96 3.84E-032 2.15 6.02E-037 2.14 4.34E-0312 2.15 3.06E-032 2.34 4.12E-037 2.34 2.86E-0312 2.35 1.99E-032 1.96 1.29E-027 1.94 9.87E-0312 1.96 6.28E-032 2.14 9.75E-037 2.14 6.83E-0312 2.15 4.80E-032 2.35 6.49E-037 2.35 4.51E-0312 2.35 3.27E-032 1.95 3.10E-037 1.95 2.04E-0312 1.96 1.47E-032 2.16 2.91E-037 2.14 2.12E-0312 2.13 1.43E-032 2.36 2.31E-037 2.31 1.63E-0312 2.33 1.15E-032 1.97 9.29E-037 1.94 6.66E-0312 1.96 4.72E-032 2.15 7.30E-037 2.14 5.11E-0312 2.14 3.64E-032 2.34 4.85E-037 2.33 3.47E-0312 2.35 2.41E-03
800
1
7
13
1400
1
7
13
200
1
7
13
200 13
800
1
7
13
8
4
8

December 19, 2011 MwRSF Report No. TRP-03-251-11
368
Degree of Curvature
Grade (%)
Length of Feature (ft)
Height of Feature (ft)
Offset (ft)
SI b
2 1.96 1.57E-027 1.97 1.08E-0212 1.96 8.07E-032 2.14 1.15E-027 2.15 8.03E-0312 2.14 5.83E-032 2.35 7.60E-037 2.35 5.55E-0312 2.34 3.78E-03
1400
1
7
13
8 8

December 19, 2011 MwRSF Report No. TRP-03-251-11
369
Appendix HH. Guardrail Undivided Urban Arterial

December 19, 2011 MwRSF Report No. TRP-03-251-11
370
Degree of Curvature
Grade (%)
Length of Feature (ft)
Height of Feature (ft)
Offset (ft)
SI b
2 1.71 6.14E-057 1.72 4.37E-0512 1.68 3.04E-052 1.85 7.29E-057 1.88 4.36E-0512 1.85 3.37E-052 2.06 5.00E-057 2.04 3.41E-0512 2.05 2.27E-052 1.70 2.00E-047 1.69 1.48E-0412 1.69 1.05E-042 1.86 1.83E-047 1.87 1.28E-0412 1.86 9.10E-052 2.03 1.33E-047 2.05 8.99E-0512 2.05 6.21E-052 1.70 3.35E-047 1.70 2.40E-0412 1.71 1.72E-042 1.86 2.86E-047 1.86 2.05E-0412 1.86 1.54E-042 2.04 2.09E-047 2.05 1.49E-0412 2.04 1.06E-042 1.70 7.33E-057 1.70 5.09E-0512 1.72 3.01E-052 1.86 7.63E-057 1.88 5.19E-0512 1.88 3.41E-052 2.05 5.64E-057 2.04 3.98E-0512 2.03 2.87E-052 1.70 2.33E-047 1.70 1.63E-0412 1.71 1.12E-04
800 1
1400
1
7
13
200
1
7
13
200
1
7
13
800
1
7
13
0
0
3

December 19, 2011 MwRSF Report No. TRP-03-251-11
371
Degree of Curvature
Grade (%)
Length of Feature (ft)
Height of Feature (ft)
Offset (ft)
SI b
2 1.85 2.08E-047 1.86 1.42E-0412 1.86 9.76E-052 2.04 1.49E-047 2.03 1.07E-0412 2.05 7.00E-052 1.70 3.75E-047 1.69 2.76E-0412 1.71 1.95E-042 1.86 3.23E-047 1.86 2.39E-0412 1.87 1.63E-042 2.04 2.37E-047 2.04 1.71E-0412 2.04 1.17E-042 1.71 9.24E-057 1.69 6.33E-0512 1.73 4.47E-052 1.86 1.06E-047 1.84 6.92E-0512 1.88 4.99E-052 2.03 8.13E-057 2.05 5.49E-0512 2.06 3.54E-052 1.71 3.02E-047 1.70 2.22E-0412 1.71 1.53E-042 1.85 2.79E-047 1.86 1.86E-0412 1.87 1.34E-042 2.04 2.00E-047 2.04 1.36E-0412 2.05 9.57E-052 1.71 5.02E-047 1.71 3.61E-0412 1.72 2.62E-042 1.86 4.38E-047 1.86 3.15E-0412 1.87 2.19E-04
1400
1
7
200
1
7
13
800
1
7
13
800
7
13
1400
1
7
13
0
3
6

December 19, 2011 MwRSF Report No. TRP-03-251-11
372
Degree of Curvature
Grade (%)
Length of Feature (ft)
Height of Feature (ft)
Offset (ft)
SI b
2 2.03 3.19E-047 2.05 2.27E-0412 2.03 1.62E-042 1.72 1.58E-047 1.71 9.76E-0512 1.70 7.07E-052 1.87 1.82E-047 1.87 1.16E-0412 1.86 7.85E-052 2.06 1.29E-047 2.05 8.83E-0512 2.03 6.00E-052 1.71 4.98E-047 1.70 3.49E-0412 1.70 2.50E-042 1.86 4.33E-047 1.86 3.08E-0412 1.86 2.15E-042 2.04 3.30E-047 2.04 2.26E-0412 2.05 1.56E-042 1.70 8.43E-047 1.72 5.94E-0412 1.71 4.32E-042 1.86 7.12E-047 1.87 4.95E-0412 1.87 3.59E-042 2.04 5.18E-047 2.03 3.70E-0412 2.03 2.56E-042 1.70 1.73E-047 1.72 1.14E-0412 1.73 8.05E-052 1.86 2.07E-047 1.87 1.26E-0412 1.87 8.58E-052 2.07 1.35E-047 2.05 1.02E-0412 2.04 6.53E-05
200
1
7
13
800
1
7
13
1400
1
7
13
1400 13
200
1
7
13
0 6
4
0
3

December 19, 2011 MwRSF Report No. TRP-03-251-11
373
Degree of Curvature
Grade (%)
Length of Feature (ft)
Height of Feature (ft)
Offset (ft)
SI b
2 1.70 5.63E-047 1.71 4.18E-0412 1.69 2.81E-042 1.87 5.02E-047 1.87 3.53E-0412 1.86 2.49E-042 2.04 3.68E-047 2.04 2.61E-0412 2.03 1.83E-042 1.70 9.25E-047 1.70 6.82E-0412 1.70 4.90E-042 1.86 8.30E-047 1.86 5.63E-0412 1.86 4.09E-042 2.05 5.65E-047 2.03 4.11E-0412 2.04 2.88E-042 1.70 2.32E-047 1.71 1.67E-0412 1.70 1.07E-042 1.86 2.66E-047 1.85 1.79E-0412 1.87 1.16E-042 2.04 1.98E-047 2.05 1.32E-0412 2.06 8.49E-052 1.71 7.48E-047 1.69 5.45E-0412 1.67 3.74E-042 1.86 6.91E-047 1.87 4.56E-0412 1.86 3.22E-042 2.05 4.68E-047 2.04 3.39E-0412 2.04 2.37E-042 1.70 1.30E-037 1.70 9.15E-0412 1.70 6.42E-04
800
1
7
13
1400 1
1400
1
7
13
200
1
7
13
800
1
7
13
4
3
6

December 19, 2011 MwRSF Report No. TRP-03-251-11
374
Degree of Curvature
Grade (%)
Length of Feature (ft)
Height of Feature (ft)
Offset (ft)
SI b
2 1.86 1.08E-037 1.87 7.57E-0412 1.86 5.48E-042 2.04 7.89E-047 2.03 5.64E-0412 2.04 3.81E-042 1.69 2.88E-047 1.71 1.83E-0412 1.69 1.21E-042 1.89 3.02E-047 1.87 1.99E-0412 1.87 1.36E-042 2.05 2.42E-047 2.07 1.46E-0412 2.04 1.04E-042 1.69 8.85E-047 1.70 6.01E-0412 1.70 4.29E-042 1.87 7.78E-047 1.87 5.37E-0412 1.86 3.74E-042 2.04 5.55E-047 2.03 4.01E-0412 2.05 2.67E-042 1.70 1.47E-037 1.70 1.05E-0312 1.70 7.42E-042 1.86 1.25E-037 1.86 8.86E-0412 1.86 6.32E-042 2.04 9.01E-047 2.03 6.52E-0412 2.05 4.39E-042 1.71 3.13E-047 1.72 2.00E-0412 1.70 1.38E-042 1.86 3.56E-047 1.88 2.21E-0412 1.85 1.59E-04
200
1
7
800
1
7
13
1400
1
7
13
1400
7
13
200
1
7
13
4 6
8
0
3

December 19, 2011 MwRSF Report No. TRP-03-251-11
375
Degree of Curvature
Grade (%)
Length of Feature (ft)
Height of Feature (ft)
Offset (ft)
SI b
2 2.06 2.59E-047 2.01 1.83E-0412 2.07 1.04E-042 1.70 9.67E-047 1.69 7.07E-0412 1.71 4.76E-042 1.85 9.17E-047 1.85 6.14E-0412 1.86 4.25E-042 2.03 6.81E-047 2.04 4.58E-0412 2.04 3.04E-042 1.70 1.66E-037 1.70 1.16E-0312 1.69 8.37E-042 1.86 1.43E-037 1.87 9.84E-0412 1.86 7.02E-042 2.05 9.97E-047 2.03 7.11E-0412 2.04 5.02E-042 1.72 4.00E-047 1.71 2.72E-0412 1.70 1.89E-042 1.89 4.51E-047 1.87 3.03E-0412 1.88 1.97E-042 2.08 3.37E-047 2.05 2.30E-0412 2.02 1.65E-042 1.70 1.35E-037 1.70 9.06E-0412 1.70 6.39E-042 1.87 1.15E-037 1.86 8.17E-0412 1.86 5.68E-042 2.05 8.28E-047 2.05 5.74E-0412 2.04 4.06E-04
800
1
7
13
1400
1
7
13
200
1
7
13
200 13
800
1
7
13
8
3
6

December 19, 2011 MwRSF Report No. TRP-03-251-11
376
Degree of Curvature
Grade (%)
Length of Feature (ft)
Height of Feature (ft)
Offset (ft)
SI b
2 1.71 2.19E-037 1.70 1.58E-0312 1.70 1.13E-032 1.86 1.88E-037 1.87 1.33E-0312 1.87 9.16E-042 2.04 1.35E-037 2.04 9.83E-0412 2.05 6.44E-04
1400
1
7
13
8 6

December 19, 2011 MwRSF Report No. TRP-03-251-11
377
Appendix II. Guardrail Divided Urban Arterial

December 19, 2011 MwRSF Report No. TRP-03-251-11
378
Degree of Curvature
Grade (%)
Length of Feature (ft)
Height of Feature (ft)
Offset (ft)
SI b
2 1.72 1.23E-047 1.71 9.74E-0512 1.71 7.42E-052 1.86 1.45E-047 1.88 9.57E-0512 1.85 8.43E-052 2.04 1.06E-047 2.05 7.80E-0512 2.04 6.07E-052 1.71 4.18E-047 1.70 3.37E-0412 1.71 2.51E-042 1.85 3.73E-047 1.87 2.84E-0412 1.86 2.23E-042 2.04 2.73E-047 2.04 2.01E-0412 2.04 1.73E-042 1.71 7.09E-047 1.70 5.55E-0412 1.70 4.39E-042 1.86 6.12E-047 1.87 4.63E-0412 1.87 3.72E-042 2.04 4.29E-047 2.05 3.44E-0412 2.03 2.85E-042 1.70 1.52E-047 1.69 9.94E-0512 1.70 8.04E-052 1.87 1.57E-047 1.86 1.17E-0412 1.86 8.79E-052 2.07 1.07E-047 2.04 8.86E-0512 2.04 6.96E-052 1.70 4.71E-047 1.70 3.81E-0412 1.69 3.13E-04
800 1
1400
1
7
13
200
1
7
13
200
1
7
13
800
1
7
13
0
0
3

December 19, 2011 MwRSF Report No. TRP-03-251-11
379
Degree of Curvature
Grade (%)
Length of Feature (ft)
Height of Feature (ft)
Offset (ft)
SI b
2 1.87 4.21E-047 1.86 3.23E-0412 1.87 2.57E-042 2.05 2.94E-047 2.04 2.39E-0412 2.05 1.88E-042 1.70 7.96E-047 1.70 6.25E-0412 1.69 4.94E-042 1.87 6.72E-047 1.85 5.29E-0412 1.86 4.37E-042 2.04 4.84E-047 2.04 3.77E-0412 2.04 3.00E-042 1.71 1.96E-047 1.71 1.36E-0412 1.71 1.13E-042 1.85 2.20E-047 1.89 1.48E-0412 1.88 1.11E-042 2.07 1.57E-047 2.05 1.13E-0412 2.04 8.98E-052 1.71 6.16E-047 1.69 4.98E-0412 1.70 3.79E-042 1.87 5.61E-047 1.86 4.17E-0412 1.86 3.43E-042 2.04 3.94E-047 2.03 3.17E-0412 2.04 2.51E-042 1.70 1.04E-037 1.71 8.19E-0412 1.71 6.95E-042 1.87 9.08E-047 1.87 6.96E-0412 1.86 5.78E-04
1400
1
7
200
1
7
13
800
1
7
13
800
7
13
1400
1
7
13
0
3
6

December 19, 2011 MwRSF Report No. TRP-03-251-11
380
Degree of Curvature
Grade (%)
Length of Feature (ft)
Height of Feature (ft)
Offset (ft)
SI b
2 2.03 6.42E-047 2.04 5.02E-0412 2.04 4.19E-042 1.71 3.01E-047 1.69 2.19E-0412 1.72 1.79E-042 1.86 3.37E-047 1.88 2.33E-0412 1.86 1.88E-042 2.04 2.57E-047 2.02 1.91E-0412 2.03 1.36E-042 1.70 9.82E-047 1.71 7.55E-0412 1.70 6.15E-042 1.88 8.43E-047 1.87 6.56E-0412 1.86 5.51E-042 2.04 6.25E-047 2.03 4.89E-0412 2.05 3.82E-042 1.70 1.69E-037 1.69 1.28E-0312 1.70 1.06E-032 1.86 1.43E-037 1.87 1.11E-0312 1.86 8.94E-042 2.04 1.02E-037 2.03 7.86E-0412 2.04 6.31E-042 1.71 3.56E-047 1.72 2.58E-0412 1.69 1.94E-042 1.87 3.89E-047 1.85 2.75E-0412 1.85 2.19E-042 2.06 2.68E-047 2.04 2.01E-0412 2.03 1.61E-04
200
1
7
13
800
1
7
13
1400
1
7
13
1400 13
200
1
7
13
0 6
4
0
3

December 19, 2011 MwRSF Report No. TRP-03-251-11
381
Degree of Curvature
Grade (%)
Length of Feature (ft)
Height of Feature (ft)
Offset (ft)
SI b
2 1.70 1.13E-037 1.70 8.60E-0412 1.71 6.99E-042 1.87 9.95E-047 1.88 7.47E-0412 1.86 6.01E-042 2.04 7.07E-047 2.05 5.37E-0412 2.04 4.31E-042 1.70 1.84E-037 1.70 1.47E-0312 1.70 1.11E-032 1.86 1.60E-037 1.86 1.24E-0312 1.86 1.00E-032 2.05 1.08E-037 2.05 8.68E-0412 2.04 7.23E-042 1.70 4.48E-047 1.69 3.32E-0412 1.71 2.72E-042 1.87 4.60E-047 1.86 3.66E-0412 1.87 2.77E-042 2.05 3.76E-047 2.07 2.51E-0412 2.02 2.14E-042 1.69 1.51E-037 1.70 1.14E-0312 1.70 9.29E-042 1.86 1.31E-037 1.86 1.02E-0312 1.87 8.15E-042 2.04 1.01E-037 2.04 7.34E-0412 2.04 5.78E-042 1.70 2.53E-037 1.70 1.98E-0312 1.70 1.56E-03
800
1
7
13
1400 1
1400
1
7
13
200
1
7
13
800
1
7
13
4
3
6
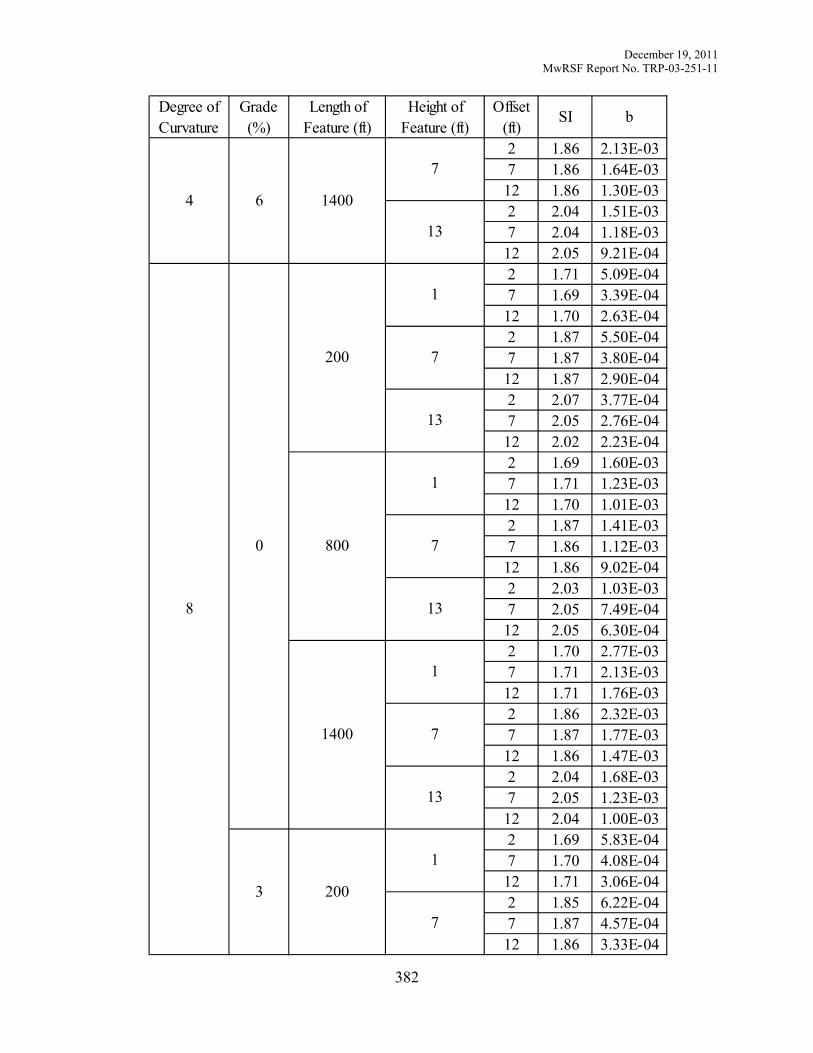
December 19, 2011 MwRSF Report No. TRP-03-251-11
382
Degree of Curvature
Grade (%)
Length of Feature (ft)
Height of Feature (ft)
Offset (ft)
SI b
2 1.86 2.13E-037 1.86 1.64E-0312 1.86 1.30E-032 2.04 1.51E-037 2.04 1.18E-0312 2.05 9.21E-042 1.71 5.09E-047 1.69 3.39E-0412 1.70 2.63E-042 1.87 5.50E-047 1.87 3.80E-0412 1.87 2.90E-042 2.07 3.77E-047 2.05 2.76E-0412 2.02 2.23E-042 1.69 1.60E-037 1.71 1.23E-0312 1.70 1.01E-032 1.87 1.41E-037 1.86 1.12E-0312 1.86 9.02E-042 2.03 1.03E-037 2.05 7.49E-0412 2.05 6.30E-042 1.70 2.77E-037 1.71 2.13E-0312 1.71 1.76E-032 1.86 2.32E-037 1.87 1.77E-0312 1.86 1.47E-032 2.04 1.68E-037 2.05 1.23E-0312 2.04 1.00E-032 1.69 5.83E-047 1.70 4.08E-0412 1.71 3.06E-042 1.85 6.22E-047 1.87 4.57E-0412 1.86 3.33E-04
200
1
7
800
1
7
13
1400
1
7
13
1400
7
13
200
1
7
13
4 6
8
0
3
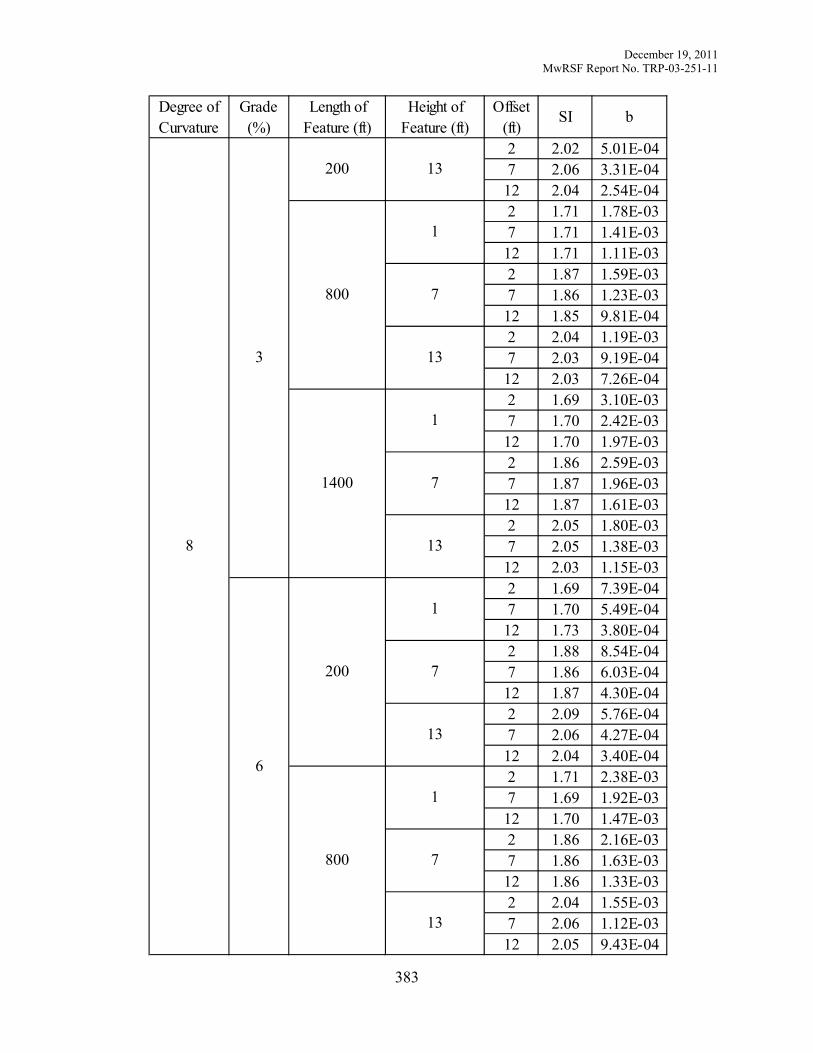
December 19, 2011 MwRSF Report No. TRP-03-251-11
383
Degree of Curvature
Grade (%)
Length of Feature (ft)
Height of Feature (ft)
Offset (ft)
SI b
2 2.02 5.01E-047 2.06 3.31E-0412 2.04 2.54E-042 1.71 1.78E-037 1.71 1.41E-0312 1.71 1.11E-032 1.87 1.59E-037 1.86 1.23E-0312 1.85 9.81E-042 2.04 1.19E-037 2.03 9.19E-0412 2.03 7.26E-042 1.69 3.10E-037 1.70 2.42E-0312 1.70 1.97E-032 1.86 2.59E-037 1.87 1.96E-0312 1.87 1.61E-032 2.05 1.80E-037 2.05 1.38E-0312 2.03 1.15E-032 1.69 7.39E-047 1.70 5.49E-0412 1.73 3.80E-042 1.88 8.54E-047 1.86 6.03E-0412 1.87 4.30E-042 2.09 5.76E-047 2.06 4.27E-0412 2.04 3.40E-042 1.71 2.38E-037 1.69 1.92E-0312 1.70 1.47E-032 1.86 2.16E-037 1.86 1.63E-0312 1.86 1.33E-032 2.04 1.55E-037 2.06 1.12E-0312 2.05 9.43E-04
800
1
7
13
1400
1
7
13
200
1
7
13
200 13
800
1
7
13
8
3
6

December 19, 2011 MwRSF Report No. TRP-03-251-11
384
Degree of Curvature
Grade (%)
Length of Feature (ft)
Height of Feature (ft)
Offset (ft)
SI b
2 1.71 4.15E-037 1.70 3.20E-0312 1.70 2.59E-032 1.86 3.61E-037 1.86 2.69E-0312 1.86 2.16E-032 2.04 2.58E-037 2.04 1.94E-0312 2.04 1.52E-03
1400
1
7
13
8 6

December 19, 2011 MwRSF Report No. TRP-03-251-11
385
Appendix JJ. Guardrail Urban Local

December 19, 2011 MwRSF Report No. TRP-03-251-11
386
Degree of Curvature
Grade (%)
Length of Feature (ft)
Height of Feature (ft)
Offset (ft)
SI b
2 2.11 3.56E-047 2.09 2.88E-0412 2.06 2.05E-042 2.30 3.71E-047 2.29 2.46E-0412 2.29 1.78E-042 2.54 2.51E-047 2.53 1.78E-0412 2.52 1.22E-042 2.11 1.24E-037 2.11 8.23E-0412 2.08 6.06E-042 2.28 9.06E-047 2.29 6.61E-0412 2.30 4.42E-042 2.53 5.97E-047 2.51 4.34E-0412 2.52 3.12E-042 2.09 2.06E-037 2.09 1.47E-0312 2.09 1.03E-032 2.28 1.50E-037 2.28 1.08E-0312 2.29 7.35E-042 2.50 9.67E-047 2.51 7.05E-0412 2.51 4.99E-042 2.07 6.63E-047 2.09 3.67E-0412 2.09 2.95E-042 2.29 5.52E-047 2.31 3.58E-0412 2.29 2.63E-042 2.52 3.40E-047 2.52 2.49E-0412 2.51 2.02E-042 2.09 1.88E-037 2.10 1.31E-0312 2.08 9.73E-04
800 1
1400
1
7
13
200
1
7
13
200
1
7
13
800
1
7
13
0
0
6

December 19, 2011 MwRSF Report No. TRP-03-251-11
387
Degree of Curvature
Grade (%)
Length of Feature (ft)
Height of Feature (ft)
Offset (ft)
SI b
2 2.30 1.29E-037 2.28 9.41E-0412 2.29 6.60E-042 2.50 9.41E-047 2.51 6.52E-0412 2.50 4.92E-042 2.09 3.13E-037 2.09 2.37E-0312 2.11 1.53E-032 2.29 2.15E-037 2.29 1.60E-0312 2.29 1.11E-032 2.53 1.44E-037 2.51 1.03E-0312 2.52 7.37E-042 2.13 5.16E-047 2.07 3.99E-0412 2.12 2.92E-042 2.34 5.90E-047 2.32 3.46E-0412 2.29 2.83E-042 2.58 3.55E-047 2.54 2.48E-0412 2.53 1.89E-042 2.09 1.85E-037 2.08 1.40E-0312 2.09 9.54E-042 2.31 1.34E-037 2.28 9.67E-0412 2.27 7.26E-042 2.51 8.93E-047 2.51 6.68E-0412 2.52 4.43E-042 2.10 3.03E-037 2.10 2.24E-0312 2.10 1.64E-032 2.29 2.25E-037 2.29 1.59E-0312 2.30 1.11E-03
1400
1
7
200
1
7
13
800
1
7
13
800
7
13
1400
1
7
13
0
6
12

December 19, 2011 MwRSF Report No. TRP-03-251-11
388
Degree of Curvature
Grade (%)
Length of Feature (ft)
Height of Feature (ft)
Offset (ft)
SI b
2 2.48 1.42E-037 2.52 1.08E-0312 2.52 7.30E-042 2.09 5.28E-047 2.13 2.42E-0412 2.08 2.55E-042 2.29 4.60E-047 2.30 2.92E-0412 2.30 1.91E-042 2.53 3.15E-047 2.51 2.24E-0412 2.55 1.29E-042 2.10 1.34E-037 2.10 9.25E-0412 2.08 7.17E-042 2.30 1.06E-037 2.30 7.45E-0412 2.30 5.18E-042 2.52 7.12E-047 2.52 5.05E-0412 2.50 3.74E-042 2.09 2.38E-037 2.09 1.57E-0312 2.08 1.23E-032 2.30 1.61E-037 2.29 1.24E-0312 2.30 8.66E-042 2.52 1.16E-037 2.52 7.90E-0412 2.51 5.65E-042 2.11 6.33E-047 2.07 4.68E-0412 2.10 3.15E-042 2.28 6.98E-047 2.29 4.13E-0412 2.32 2.76E-042 2.53 4.87E-047 2.50 3.36E-0412 2.53 2.13E-04
200
1
7
13
800
1
7
13
1400
1
7
13
1400 13
200
1
7
13
0 12
3
0
6

December 19, 2011 MwRSF Report No. TRP-03-251-11
389
Degree of Curvature
Grade (%)
Length of Feature (ft)
Height of Feature (ft)
Offset (ft)
SI b
2 2.10 1.97E-037 2.10 1.46E-0312 2.08 1.06E-032 2.30 1.53E-037 2.30 1.17E-0312 2.28 7.84E-042 2.53 1.07E-037 2.51 7.60E-0412 2.52 5.12E-042 2.10 3.42E-037 2.10 2.39E-0312 2.10 1.87E-032 2.29 2.63E-037 2.29 1.87E-0312 2.29 1.26E-032 2.51 1.66E-037 2.51 1.25E-0312 2.51 8.92E-042 2.12 6.38E-047 2.10 4.63E-0412 2.10 3.07E-042 2.25 6.79E-047 2.31 4.42E-0412 2.32 2.83E-042 2.51 4.81E-047 2.51 3.24E-0412 2.51 2.39E-042 2.10 2.09E-037 2.09 1.42E-0312 2.09 1.05E-032 2.27 1.69E-037 2.30 1.11E-0312 2.29 7.90E-042 2.51 1.08E-037 2.51 7.74E-0412 2.53 5.22E-042 2.09 3.54E-037 2.08 2.50E-0312 2.10 1.79E-03
800
1
7
13
1400 1
1400
1
7
13
200
1
7
13
800
1
7
13
3
6
12

December 19, 2011 MwRSF Report No. TRP-03-251-11
390
Degree of Curvature
Grade (%)
Length of Feature (ft)
Height of Feature (ft)
Offset (ft)
SI b
2 2.29 2.58E-037 2.29 1.81E-0312 2.28 1.28E-032 2.52 1.66E-037 2.52 1.21E-0312 2.52 8.51E-042 2.13 1.48E-037 2.11 1.12E-0312 2.12 7.59E-042 2.28 1.70E-037 2.30 1.19E-0312 2.30 7.25E-042 2.50 1.01E-037 2.49 9.50E-0412 2.55 4.68E-042 2.08 5.49E-037 2.10 3.61E-0312 2.07 2.78E-032 2.29 3.82E-037 2.29 2.85E-0312 2.30 1.94E-032 2.53 2.56E-037 2.50 1.84E-0312 2.51 1.30E-032 2.09 8.77E-037 2.09 6.49E-0312 2.10 4.32E-032 2.29 6.18E-037 2.30 4.43E-0312 2.28 3.05E-032 2.51 4.11E-037 2.52 2.88E-0312 2.52 2.01E-032 2.07 2.80E-037 2.14 1.65E-0312 2.11 1.06E-032 2.32 2.47E-037 2.27 1.75E-0312 2.31 1.11E-03
200
1
7
800
1
7
13
1400
1
7
13
1400
7
13
200
1
7
13
3 12
6
0
6
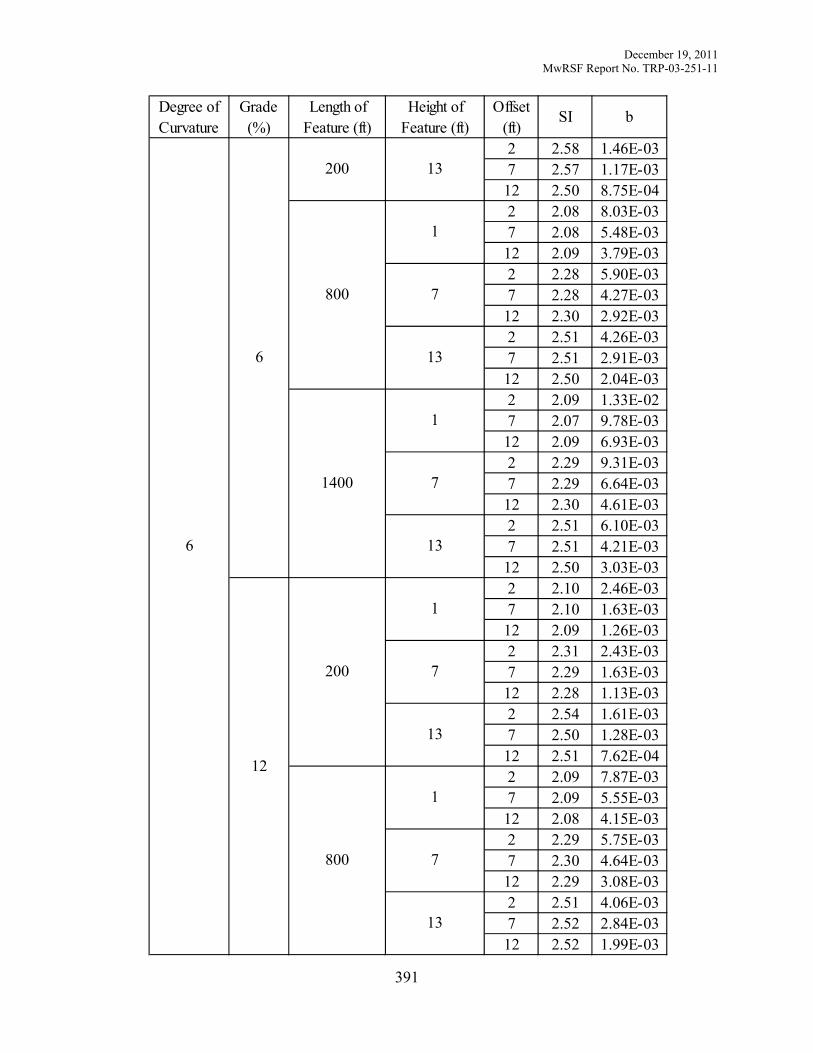
December 19, 2011 MwRSF Report No. TRP-03-251-11
391
Degree of Curvature
Grade (%)
Length of Feature (ft)
Height of Feature (ft)
Offset (ft)
SI b
2 2.58 1.46E-037 2.57 1.17E-0312 2.50 8.75E-042 2.08 8.03E-037 2.08 5.48E-0312 2.09 3.79E-032 2.28 5.90E-037 2.28 4.27E-0312 2.30 2.92E-032 2.51 4.26E-037 2.51 2.91E-0312 2.50 2.04E-032 2.09 1.33E-027 2.07 9.78E-0312 2.09 6.93E-032 2.29 9.31E-037 2.29 6.64E-0312 2.30 4.61E-032 2.51 6.10E-037 2.51 4.21E-0312 2.50 3.03E-032 2.10 2.46E-037 2.10 1.63E-0312 2.09 1.26E-032 2.31 2.43E-037 2.29 1.63E-0312 2.28 1.13E-032 2.54 1.61E-037 2.50 1.28E-0312 2.51 7.62E-042 2.09 7.87E-037 2.09 5.55E-0312 2.08 4.15E-032 2.29 5.75E-037 2.30 4.64E-0312 2.29 3.08E-032 2.51 4.06E-037 2.52 2.84E-0312 2.52 1.99E-03
800
1
7
13
1400
1
7
13
200
1
7
13
200 13
800
1
7
13
6
6
12

December 19, 2011 MwRSF Report No. TRP-03-251-11
392
Degree of Curvature
Grade (%)
Length of Feature (ft)
Height of Feature (ft)
Offset (ft)
SI b
2 2.09 1.34E-027 2.10 8.76E-0312 2.09 6.64E-032 2.28 9.41E-037 2.28 6.80E-0312 2.29 4.65E-032 2.52 5.88E-037 2.53 4.64E-0312 2.50 3.05E-03
1400
1
7
13
6 12

December 19, 2011 MwRSF Report No. TRP-03-251-11
393
END OF DOCUMENT