Roadshow Title In Here - Home - C&C Group · securities of C&C Group plc (the "Company"). The...
108
Investor Seminar Glasgow 10 th November 2010
-
Upload
duongnguyet -
Category
Documents
-
view
217 -
download
0
Transcript of Roadshow Title In Here - Home - C&C Group · securities of C&C Group plc (the "Company"). The...

Investor Seminar
Glasgow 10th November 2010

Stephen GlanceyChief Operating Officer
Glasgow 10th November 2010
Kenny NeisonStrategy and IR Director

• Investor Presentation
• Lunch
• Brewery visit and tour
• Trade Visits
• Dinner and Cider Tasting
Overview of Today

• Philosophy and Progress
• Our Brands
• Ireland
• C&C Investment Case
Introduction

Marketing Overview UK
• Paul Bartlett -
• Kirsty Hunter – Head of Consumer Marketing Magners GB
• Sandra Mitchell – Brand Director Tennent‟s
Republic of Ireland Overview
• Michael Merrins
• Stephen Kent
Introducing the Presenters

DISCLAIMER
This presentation does not constitute an invitation to underwrite, subscribe for, or otherwise acquire or dispose of any shares or othersecurities of C&C Group plc (the "Company").
The presentation contains forward-looking statements, including statements about the Company's intentions, beliefs and expectations.These statements are based on the Company's current plans, estimates and projections, as well as the Company's expectations ofexternal conditions and events. Forward-looking statements involve inherent risks and uncertainties and speak only as of the date theyare made. The Company undertakes no duty to and will not necessarily update any such statements in light of new information orfuture events, except to the extent required by any applicable law or regulation. Recipients of this presentation are therefore cautionedthat a number of important factors could cause actual results or outcomes to differ materially from those expressed in any forward-looking statements.
Past performance is no guide to future performance and persons needing advice should consult an independent financial adviser.
Any statement in this presentation which infers that the transactions may be earnings accretive does not constitute a profit forecastand should not be interpreted to mean that the Company’s earnings or net assets in the first full financial year following thetransactions, nor in any subsequent period, would necessarily match or be greater than those for the relevant preceding financial year.
Your attention is drawn to the risk factors set out in the Appendix to this presentation. They are not set out in any particular order ofpriority. The risks described in this document, however, are not exhaustive and consequently do not necessarily comprise all thoseassociated with the Company and/or the recently acquired businesses. There may be other risks which may have an adverse effect onthe business, financial condition, results or future prospects of the Company.

DISCLAIMER
C&C Group plc and its subsidiaries Wm.Magner Limited and Bulmers Limited of
Clonmel Ireland are not connected to H P Bulmer Limited of Hereford, UK.
Bulmers Original Cider produced by Bulmers Ltd of Clonmel is sold outside the
Republic of Ireland under the name Magners Original Irish Cider.

Stabilise
ConsolidateTransform
Two Years In…..

Consumers
Customers
EmployeesSuppliers
Shareholders
Stakeholder Approach
Long Term
View

• Decentralised business model
• Small Head Office - capital allocation
• Shareholder alignment
• Balanced investment in customer and consumer
Point Of Differentiation
We Zig while others Zag

• Successful integration of Tennent's and Gaymers
• Grow with the market in Great Britain
• Hold earnings in Ireland
• Lay the foundation for international development
• Capital structure
Our Objectives This Year

• Transitional services for 1 year
• Production volume triples
• Employee base moves from 450 to 1200
• Sales Force integration in all territories
• Revenue and cost delivery
• Three plants versus one
• Focus on business with minimal customer disruption
• Separation of Spirits Division
Integration….A huge task

Magners GB: Perform in line with market
Source: ACNielsen & CGA Data to 4/9/2010
How
• Sales execution
• Effective marketing
• Brand renovation
• Business model

Ireland: Hold earnings
Source: ACNielsen Data to Sep 2010
Reality H1 2010/11:
• Bulmers volume (3.4%)
• Price (4.7%)
• Operating Margin (0.3ppt)
Focus:
• Cost
• Innovation
• Diversification
• Investment

• From FY09 Clonmel output per man from 6Khl to 9Khl
• From FY09 reduce cost per HL produced from €20 to €13
• October further reduction in Ireland operations €3m annualised benefit.
• Full year synergy guidance €18m
Operations….continued focus on cost reduction

• World cider market is growing
• C&C is No 2 in GB and in the
top 3 Cider brands in the world
• CAGR of 15% from FY06 to
FY11
• North America and Australia
have been the growth engines
• Plan to scale up resource in
USA
Magners International Volume Growth
9 13 15 1420 16
02
5 1111 7
20
30 20 23 21 18
0%
10%
20%
30%
40%
50%
60%
70%
80%
90%
100%
F06 F07 F08 F09 F10 H1 F11
Magners Export Growth
North America
Iberia
Australia
Other Markets
+35%+9%
82Khl+15%(2%)+21%
68Khl+35%
89Khl +9%
71Khl(2%)
73Khl+39%
53Khl+21%
khl

Update on capital structure
Free Cash Flow• Half Year Cash Surplus
• C&C is well invested with strong
cash flow characteristics
• Capable of free cash flow
conversion at 70% - 80% EBITDA
• Current preference to retain
flexibility and liquidity
• Cash utilisation will be driven by
TSR philosophy

Paul BartlettMarketing Director
Glasgow 10th November 2010
Kirsty HunterHead of Consumer Marketing Magners GB
Sandra MitchellBrand Director Tennent’s

Magners GB Bulmers ROI
Locally relevant brand strategy and execution
Consumer + Customer needs by market
Marketing Goal: Strong Local Brands & Margin Optimisation
Magners ROWTennent‟s
Growing with
growing Cider
category
Revitalise
brand amongst
18-24yr olds
Extend share of
LADs
Sustainable
consumer-led
growth

The UK Cider Market is in long term growth
Source NACM

The historical advertising for Magners in the UK ran under the
proposition of „time dedicated to you‟

A growing Cider category,
but Magners was not differentiated enough
Source: Neilson
Source: Magners Shipment – internal and HMRC clearance data
12.4%
14.1%
UK CIDER GROWTH & MAGNERS SHARE GB

Whilst we worked on a new unique proposition for Magners in
GB we successfully launched Magners Pear
Volume (000s Ltr)
BRANDMAT TO WE 06.09.08
MAT TO WE 04.09.10
MAGNERS PEAR CIDER 0 4682
CRABBIES GINGER BEER 0 3424
BUDWEISER BREW NO 66 0 1616
GROLSCH BLONDE 0 1016
AMBER JACK 0 1001
JACK DANIELS & COLA 0 913
BULMERS SUMMER BLEND 0 656
WKD CORE 0 585
REKORDERLIG STRAWBERRY & LIME 0 574
MARSTONS CLASSIC 0 507
Source: Nielsen Off Trade MAT Sept 2010
• Magners Pear was the seventh Pear to launch to the market in GB
• Supported with heavyweight TV investment
• Value Share of Pear Cider Off Trade = 16.3%
• Value Share of Pear Cider On Trade = 18.6%
• Being late to market has made achieving potential hard.
Source: Nielsen Off Trade MAT Sept 2010

The way we do things may seem a little
mad, but there's reason to it.
In March 2010 in GB we introduced our
new creative proposition

Which we launched through two TV executions
„Catch‟ and „Straight‟

% Share of Voice01/03/10 - 31/8/10
Magners Cider
Carling Lager
Strongbow Cider
Fosters Lager
Carlsberg Lager
Budweiser Beer
Bulmers Cider
Guinness Draught
Heavy investment behind Magners within a well supported
category (4 of the top 11 brands are cider)
14.49%
11.95%
10.07%
9.97%
7.24%
6.23%
6%
5.51%
5.45%
4.66%
4.01%3.33%
2.01%
1.75%
1.68%
Source: NMR
Source: NMR

37%
37%44%
45%
38%46%
41%
38%44%
Salience
This has led to a strong relationship with consumer and a clearly
differentiated position
APRIL MAY JUNE
Source: H&P
InvolvementPersuasion
Source: H&P

Magners ahead of category leader on key measures
‘Excellent Quality’
‘Worth Paying More For’
Source: Hall and Partners, Aug 2010

We will continue to innovate as Magners creates a new
premium draught category through the launch of Magners
Golden Draught
Source:Nielsen Ons

The purchase of the Gaymers business allows us to support our
Growth plan for the Magners Brand
Gaymers
• Gives us the opportunity to meet different consumer needs without stretching Magners too far
Blackthorn
• Strong in the SW of England, cider heartland and will support our distribution of Magners Golden Draught
Addlestones
• Super premium offering that supports Magners in the top end outlets
Own label
• Leverage Own-Label to support Magners growth plans

• Magners was a phenomenon which changed perception of Cider in GB
• Magners was not well differentiated from competition
• Nor were customers well managed
• New proposition and improved customer focus
• Magners has returned to growth
Summary

Tennent‟s Lager

• 1 in 3 pints of all beer consumed in Scottish pubs
• Stocked by 7 out of 10 pubs
• Highest rate of sale of any beer brand in the GB Off Trade
• A Scottish icon
• “it sits at the heart of what it means to be Scottish”
Scotland‟s No.1 Long Alcoholic Drink Brand
CGA Aug 2010; AC Nielsen; 2010; Brand GeneticCGA Aug 2010; AC Nielsen; 2010; Brand Genetic

£0
£200,000
£400,000
£600,000
£800,000
£1,000,000
£1,200,000S
tell
a A
rto
is
Car
lin
g
Fo
ster
s
Mag
ner
s
Bac
ard
i
Bu
lmer
s
Cap
tain
Mo
rgan
Ru
m
Sm
irn
off
Jack
Dan
iels
Str
on
gb
ow
Gro
lsch
Co
ors
Ten
nen
ts
Ru
ssia
n S
tan
dar
d
Ab
solu
t
San
Mig
uel
So
uth
ern
Co
mfo
rt
Tennent‟s had been suffering from underinvestment over the
past few years, leading to brand health decline
Nielsen Jan 2010. Scotland Media
2009 Scotland Media Spend
SOURCE MPG & Company Estimates

In 2010, we set out our new strategy to revitalise the brandIn 2010, we set out our new strategy
Build Brand Preference
amongst 18-24 year old ABC1
drinkers
Identify and exploit new
profit streams through
innovation
Improve brand presence in
Trade & build Off Trade Value
Revitalise the brand
Quality Football MusicAdvertising

In 2010, we’re back in business with a new brand advertising and PR campaign...
In June 2010, we launched a new advertising campaign, aimed
at our target 18-24 year old lager drinkers
*MPG data 2010
• In 2010, Tennent’s has now jumped to
No 5 media spender in Scotland this
year to date
• 83% of 18-24 year olds saw TV adat least 10 times
*MPG data 2010

Sources: H&P 2006; 2cv Football Research 2007 Celtic & Rangers own data 2009
We launched a new 3 year sponsorship agreement with Celtic
and Rangers
•
•Scotland’s national passion – 73% 18-24 yr old Scots claim an interest in football (1)
• Rangers and Celtic are supported by 70%+ of Scottish football fans

Scotland’s No.1 Alcohol Brand
• 100,000+ music fans over 3 days• 27 hours of BBC TV coverage• Sold out every year since 1996 despite nowbeing more than 4 times its original size
Official T in the Park website
In July, we celebrated the 17th year of the
T in the Park music festival
Official T in the Park website

This month, we opened the „Tennent‟s Training Academy‟
•Launch of the newly created Tennent’sTraining Academy in Wellpark Brewery• Capacity to train up to 15,000 bar staff eachyear from running a pub to serving a perfect pint.

56.254.2 55.2
56.9 5658.5 58
56.4 57 58.2 59 58.4 57.4 56.4 5553.5 54.1
52.2 52.3 51.9 50.5 50.348.5 47.8 49.1 5050.6
30.9 30 30.2 30.2 31 31.1 30.7 30.4 30.3 3133.1 31.7 30.9 31.2 30.7 30.4 29.6 29.8 29.8 29.1 28.6 28.6
25.9 24.826.8 26.427
-5
5
15
25
35
45
55
65
Tennent’s Brand Health amongst 18-24 year oldsKey Indicators
Brand I would consider drinking One of my 3 favourite brands
Early indicators show that there has been a recent improvement
in brand health since the start of the marketing programme in
June 2010
Sources: Nunwood Brand Tracking 2010

• Tennent‟s revitalisation programme launched 2010
• TV and Poster advertising
• Sponsorship of Celtic and Rangers
• 17th year of T in the Park
• New Tennent‟s Training Academy
• Early signs of brand health recovery in 2010
• Positive platform for further growth
Summary

Michael MerrinsManaging Director Bulmers Ireland
Glasgow 10th November 2010
Stephen KentMarketing Director Bulmers Ireland
Republic of Ireland

1. Market Overview Michael Merrins
• Drinks Industry Trends
• Bulmers Performance against the market
• Key Challenges
2. Brand Growth Initiatives Stephen Kent
• Key Pillars
• Performance Impact
3. Priorities & Summary
Agenda

-
1,000,000
2,000,000
3,000,000
4,000,000
5,000,000
6,000,000
7,000,000
MAT SEP07 MAT SEP08 MAT SEP09 MAT SEP10
On & Off Trade LAD Volume (hectolitres)
In 2010, LAD volume continues to decline
Source: ACNielsen
-7% -9% -4%

-
500,000
1,000,000
1,500,000
2,000,000
2,500,000
3,000,000
3,500,000
4,000,000
MAT SEP07 MAT SEP08 MAT SEP09 MAT SEP10
On & Off Trade LAD Value (€ '000)
LAD market value continues to decline
Source: ACNielsen
-5% -7% -7%

4 2 2 4
4241
30 26
1010
8 7
8 11
12 16
35 3748 47
2002 2004
3+ times a week
1 / 2 times a week
Once a fortnight
Once every 3-4 weeks
Less often/never
20102008
% % % %
Consumers are changing behavior…..- Republic of Ireland Pub Drinking frequency has dropped since 2002
Source: B&A Dublin

3 3 6 8
21 23 2625
8 67 56 6
7 9
63 6254 53
3+ times a week
1 / 2 times a week
Once a fortnight
Once every 3 - 4 weeks
Less often/never
2002 2004 20102008
% % % %
Home Consumption is on the rise……..- Republic of Ireland Home consumption has grown
Source: B&A Dublin

The current backdrop could accelerate this trend.....
ESRI Autumn Report Latest outlook for 2010
GDP Rate -0.25%
GNP Rate -1.5%
CPI -0.5%
Unemployment 13.25%
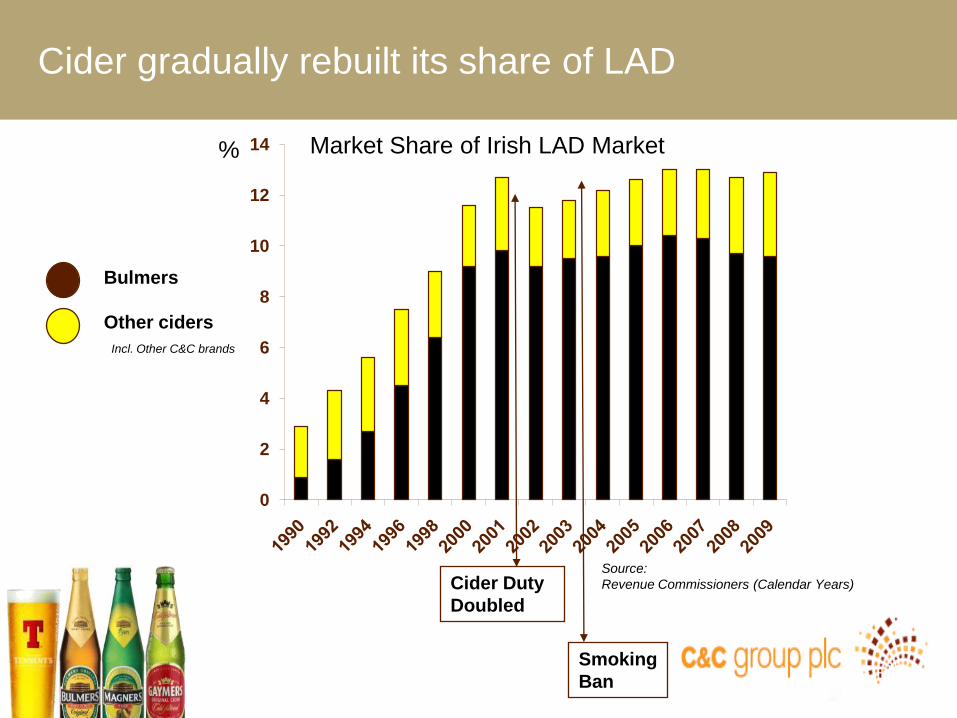
Cider gradually rebuilt its share of LAD
0
2
4
6
8
10
12
14 Market Share of Irish LAD Market
Bulmers
Other ciders
Incl. Other C&C brands
Cider Duty
Doubled
Smoking
Ban
%
Source:
Revenue Commissioners (Calendar Years)

Bulmers volume performance versus the market
Source: ACNielsen
-10-9
-8-8
-7
-7-6
-5-5
-5 -4
-4-4
-4
-10
-9
-8
-7
-6
-5
-4
-3-2 -2
-5
-5-5
-6
Aug-09 Sep-09 Oct-09 Nov-09 Dec-09 Jan-10 Feb-10 Mar-10 Apr-10 May-10 Jun-10 Jul-10 Aug-10 Sep-10
ROI On + Off Trade Rolling MAT Volume Sales Trend - %
LAD Bulmers Brand
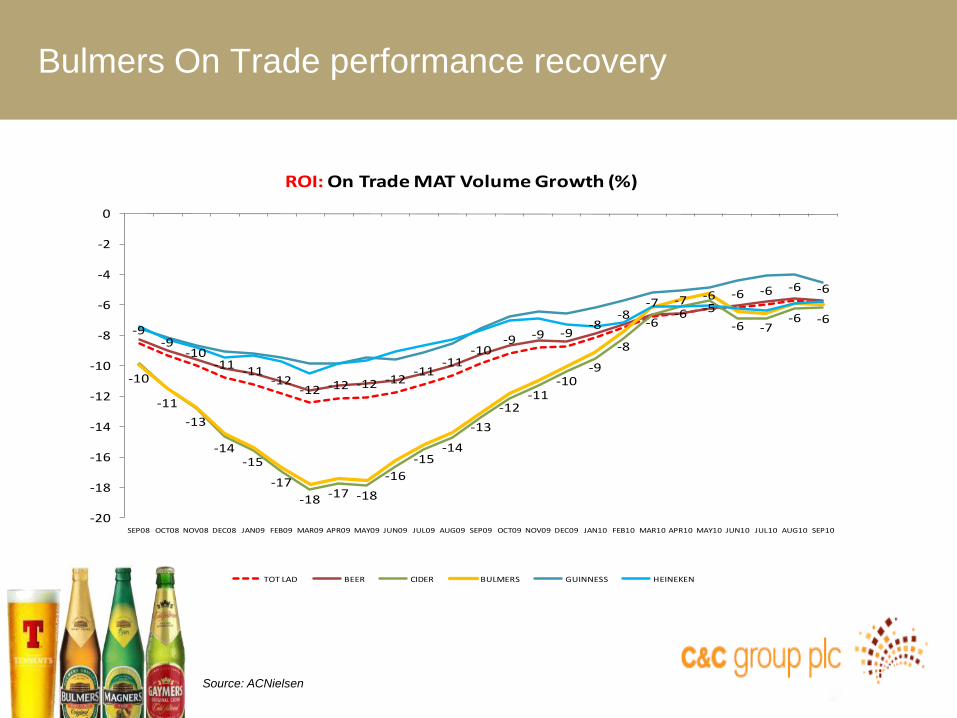
Bulmers On Trade performance recovery
Source: ACNielsen
-9-9
-10-11
-11-12
-12 -12 -12 -12-11
-11-10
-9 -9 -9-8
-8-7 -7 -6 -6 -6 -6 -6
-10
-11
-13
-14-15
-17
-18 -17 -18
-16
-15-14
-13
-12-11
-10-9
-8
-6-6 -5
-6 -7-6 -6
-20
-18
-16
-14
-12
-10
-8
-6
-4
-2
0
SEP08 OCT08 NOV08 DEC08 JAN09 FEB09 MAR09 APR09 MAY09 JUN09 JUL09 AUG09 SEP09 OCT09 NOV09 DEC09 JAN10 FEB10 MAR10 APR10 MAY10 JUN10 JUL10 AUG10 SEP10
ROI: On Trade MAT Volume Growth (%)
TOT LAD BEER CIDER BULMERS GUINNESS HEINEKEN

Volatility in Bulmers Off Trade volume performance
Source: ACNielsen
-7-6
-5
-4-3 -3
-3-2
-1-1
01 1
45
67
7 7 8 7
6
0
-2-3
-4
-8
-6
-4
-2
0
2
4
6
8
10
SEP09 OCT09 NOV09 DEC09 JAN10 FEB10 MAR10 APR10 MAY10 JUN10 JUL10 AUG10 SEP10
ROI: Off Trade MAT Volume Growth (%)
TOT LAD BULMERS

Brand Growth Initiatives
Glasgow 10th November 2010

Three Key Pillars underpin our initiatives....
REVITALISE
RECRUIT
INNOVATE
------------------------ Strengthened Bulmers Proposition-----------------------------
• Increase Salience and Usage
• Provoke (re)-consideration
• Focus on winning 18-24 market
• Extend opportunities for trial
• Broaden franchise through new products

Our Calendar has been step-change....- Republic of Ireland
March 2009 Bulmers Pear Launched
June 2009 Pint Bottle Price Reduced
Summer 2009 New Off Trade Promotional Strategy
October 2009 New Beer Portfolio Integrated
March 2010 New Berry Launched
New
Creative
Campaign
May 2010
Becks Vier /Tennent's Distribution DriveMay 2010
Bulmers Draught Price Reduced
Our Calendar has been step-change....

Bulmers Berry
• Bulmers Berry launched to directly appeal
to 18-24s
• Creative and PR tailored to drive appeal with
‘An Undergrowth Movement’’
• Grocery data show 46% of Berry volume comes
from non-Bulmers brands.

Bulmers Berry Advertising
Driving Salience through.....
• Unique „Live‟ Art Billboard Installations.....
• Social Media campaigns integrated into
Sampling events
• And cutting through using TV…..

Bulmers Berry TV Advertisement...

Our Bulmers Pint Bottle Price Reduction reversed a trend...
Source: ACNielsen
-7
-8
-10
-12
-14
-15
-17
-19 -19
-20-19
-18 -18-17
-16-15
-14
-13
-11
-9-8
-6 -7-6
-3
480
482
484
486
488
490
492
494
496
498
500
-25
-20
-15
-10
-5
0
AUG08SEP08OCT08NOV08DEC08JAN09FEB09MAR09APR09MAY09JUN09JUL09AUG09SEP09OCT09NOV09DEC09JAN10FEB10MAR10APR10MAY10JUN10JUL10AUG10
Cent
Hecto
litre
s
On Trade - Bulmers Original Pint Bottle, Volume Growth YOY (%) vs RSP/Pint, MAT
VOLUME GROWTH YOY % RSP PER PINT CENT

Bulmers Draught Support
• Reduced price to harmonise retail price with
premium lager
• Strong ROS support programmes
• New Livery and Glassware
• Dedicated Advertising Campaign
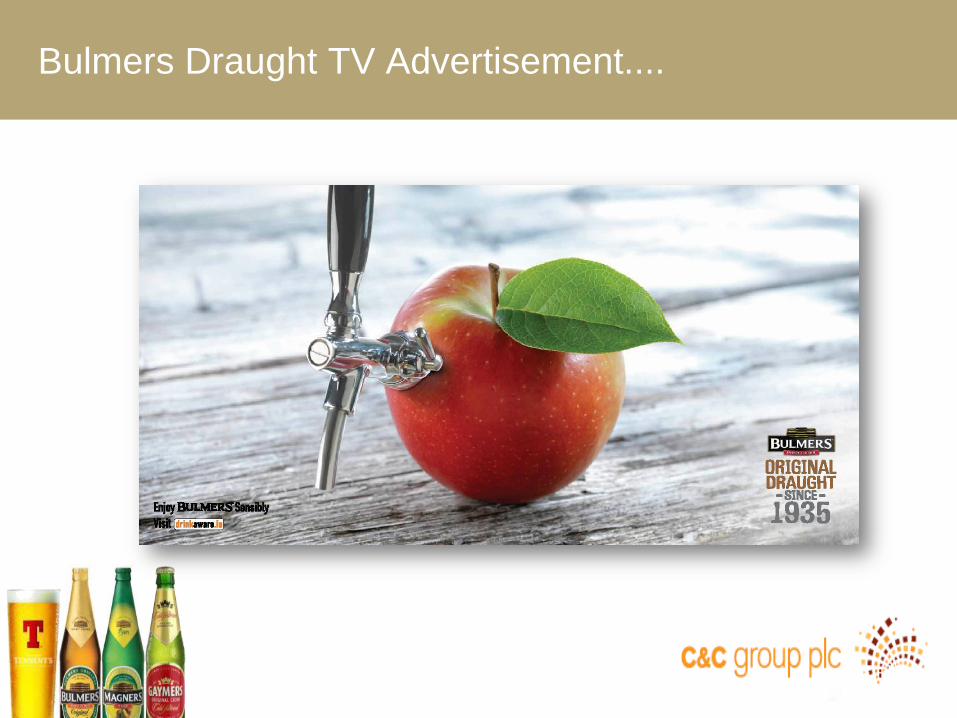
Bulmers Draught TV Advertisement....

Our Recruitment Strategy extended our reach....
Over 200,000
Consumers
Sampled

We united our Brand message....with a Brand TV Campaign
63

Brand Health - MATsMar-09Feb-10#
Apr-09Mar-10#
May-09Apr-10#
Jun-09May-10#
July-09Jun-10
Aug-09Jul-10
Sep-09Aug-10
Oct-09Sep-10
Penetration 6 Mth, 18-24s 54% 53% 54% 54% 54% 54% 54% 55%
"Most Often" (On Trade) Drunk Brand, 18-24s 22% 20% 21% 21% 22% 22% 22% 23%
Total Spontaneous brand awarenessamong 18-24s 65% 66% 65% 66% 66% 66% 66% 66%
Is worth paying a bit extra for, 18-24s* 16% 16% 16% 16% 16% 17% 18% 19%
Has consistently high quality, 18-24s* 35% 36% 35% 34% 35% 36% 36% 37%
The Result : Bulmers Brand Health is improving....
Source : MRBI IPSOS

Finally, these are early days with Beer....
Progress is slow but positive…
Regional Beer Advertising commenced....
Becks Vier in Cork
Tennent‟s in Northwest
Distribution Drive Successful.....

Summary
66
1. Hold and grow Bulmers share of LAD.
• Brand Health is at a two year high.
• Share of Cider has strengthened across On and Off Trade
• Our Brand campaigns are focused and effective.
2. Protect and optimize earnings in the ROI market.
• Continued investment in our brands to deliver volume
• Innovation to deliver growth especially through Off Trade
• Focus on Cost Reduction.
• Leverage our beer brands to deliver incremental profit.

John Dunsmore
Chief Executive Officer
Glasgow 10th November 2010

C&C Investment Case

1. Long term in perspective
2. Differentiation, not Scale, is the objective
3. Cider is a global growth category
4. C&C is a top 3 cider company in the world
5. Magners is the preferred cider brand in the biggest cider market in the world
6. Our cash position gives us choices
7. Team focus on sustainable value growth
8. Entrepreneurial
The basis for investment

Why companies fail
How the Mighty Fall, by Jim Collins

The hubris of success
„When the rhetoric of success (“we‟re successful
because we do these specific things”) replaces
penetrating understanding and insight (“we‟re
successful because we understand why we do
these specific things and under what conditions
they would no longer work”)‟
How is this relevant to C&C?
How the Mighty Fall, by Jim Collins

• Advertising strategy…..localised
• Route to market strategy…..have one
• Internal or external people?
• Relationship between group and divisions
• International management resource
How is this relevant to the future?
Flywheel not yet in place
How the Mighty Fall, by Jim Collins

Our Asset In Republic Of Ireland
BrandFootprint- Top 2
Base: All Respondents: Quarter 1: 1,822, September: 602
0
10
20
30
40
50
60
70
80
Total Total Total 18-24s 18-24s 18-24s
Salience Involvement Persuasion - Salience Involvement Persuasion
June/Aug
Sept 2010

Our Asset In Northern Ireland
(Base: All Past 3 Month 18-64 yo Beer/Cider Drinkers)
94 97
36
19
11
6
7
63
33
21
14
13
Northern Ireland On Trade Consumer Funnel – July 2010

Our Asset In Scotland

37%
37%44%
45%
38%46%
41%
38%44%
Salience
This has led to a strong relationship with consumer and a clearly
differentiated position
APRIL MAY JUNE
Source: H&P
InvolvementPersuasion
Source: H&P

BEER
• Tennent's 100
• Beer 124
• Stella Artois 132
• Peroni 204
Magners preferred status is reflected
in its price premium
CIDER
• Strongbow 100
• Cider 109
• Magners 159
• Jacques 266
Nielsen Data

NET FAVOURABLE SCORES ADVANTAGE GROUP SURVEY 2010
Our UK Sales effectiveness is starting to help….
but a long way to go
2010
Carlsberg 64
AB Inbev 42
Magners 21
Molson-Coors 14
Gaymers 7
Miller Brands 7
Diageo -6
Heineken -8
Wells & Youngs -26
2009
Carlsberg 45
Heineken 34
AB Inbev 33
Molson-Coors 21
Wells & Youngs 21
Gaymers 7
Miller Brands -7
Magners -10
Diageo/Guinness -67
Category Development & Support
22nd 19th
OVERALL POSITION
NET FAVOURABLE SCORES ADVANTAGE GROUP SURVEY 2010

Cider is a worldwide growth market,
capable of acceleration
Source: Euromonitor

1. Heineken 19.5
2. C&C 12.7
3. Distell 12.1
4. Halewood 2.9
5. Aston Manor 2.8
6. Carlsberg 2.7
7. Saenz Briones 2.7
8. AGRIAL 2.5
9. Sidra La Victoria 2.2
10. Foster‟s 1.5
(VOLUME MARKET SHARE PERCENT)
C&C is one of the Top 3 Cider producers in the world
Source: Euromonitor

• Imagination
• Speed
• Flexibility (to local markets)
• Conservative entrepreneurialism
C&C‟s (potential) management USP

• Domestic markets provide cashflow for expansion
• International development benefits from a long term “Spirits”
type of approach
• We have to pioneer the category as well as our brands
• We will expand in line with management competency
• Operational improvement has been back-end driven so far
• There is more to do now than when we started
The opportunities for C&C are expanding all the time

Investor Seminar
Glasgow 10th November 2010

Mike Lees MD Scotland
Tom McCusker MD N Ireland

Tennent’s has been leading for a long time
and will continue to do so going forward
1556
Wellpark Brewery
established by the
monks of St Mungo
1885
Hugh Tennent launched
the UKs first commercial
scale lager – Tennent’s
Lager
1860
J&R Tennent becomes
the largest exporter of
bottle beers worldwide
1935
Tennent’s Lager
launched the first UK
lager in cans
1955
Tennent’s Lager launches
the first flat topped cans in
the UK
1967
Charrington United
Breweries merges
with Bass
2001
Bass acquired by
Interbrew
1963
Charrington United Breweries
acquires Tennent’s
Tennent’s launches the first
lager brand in draught
2008
Merger of InBev (ex-
Interbrew) and
Anheuser-Busch
2009
C&C acquires
Tennent’s

Tom McCusker MD N Ireland
Source: Canadean and NI DHSS
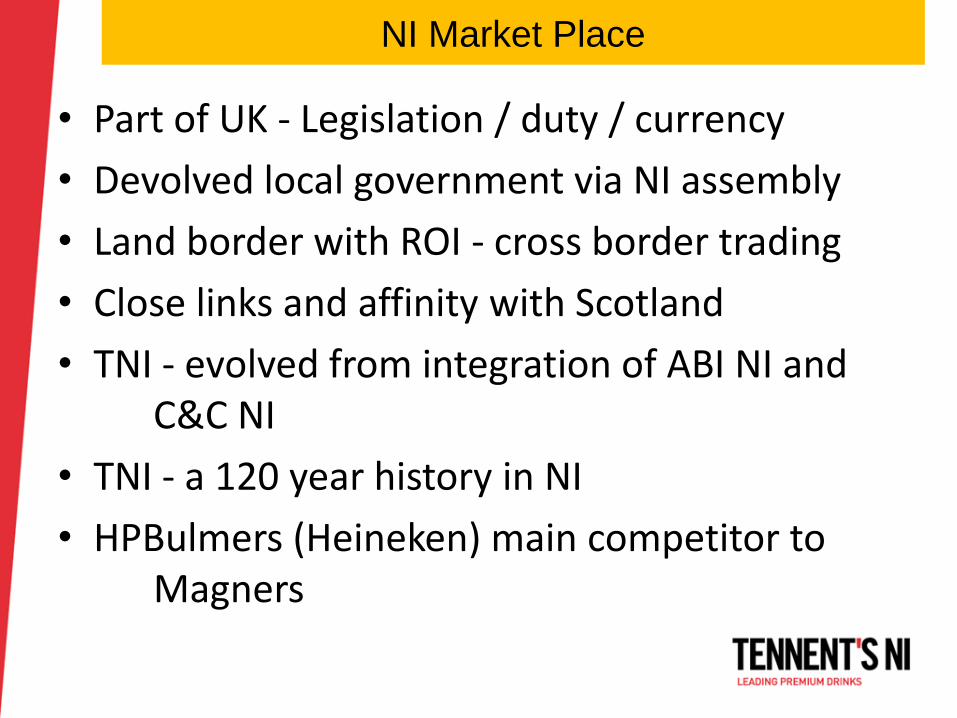
NI market place
• Part of UK - Legislation / duty / currency
• Devolved local government via NI assembly
• Land border with ROI - cross border trading
• Close links and affinity with Scotland
• TNI - evolved from integration of ABI NI and C&C NI
• TNI - a 120 year history in NI
• HPBulmers (Heineken) main competitor to Magners
NI Market Place

Brand Portfolio is vital – TNI strong in key areas
No. 1
CiderNo. 1
Packaged
LAD
No. 1
Premium
Packaged
Lager
No 1
On trade
Lager
Highest ROS
Draught
Lager
No 2
Packaged
LADs
No. 1 Non
Alcoholic
Beer
No 2
Total
LADs
Source AC Nielsen

NI Trading Environment – a difficult outlook
Economic
• Economy to decline
• Unemployment rate 6.9% forecast to double
• High reliance on public sector ( 65%)
• High growth potential for tourism with 1.9m visitors in 2009
• Peace dividend expected
Demographics
• Population 1.8m
• 1.35m (75.8%) are 18+
• 70% of adults drink alcohol
• 54% of 18 to 29 yr old males drink beer
• Per capita consumption beer 78.8L and cider 10.7L
• Session drinking culture with average 5 measures per pub visit
Source: Canadean and NI DHSS

NI Beer and Cider Splits
• Total 1.5m HL
• Overall Beer & Cider shrinking @ -3%, driven by On Trade
• Cider still enjoying growth in the off trade but slowing in recent months
Beer On37%
Beer Off50%
Cider On4%
Cider Off9%
Source AC Nielsen

On Trade - lager and cider combined over 70%
52%
9%
20%
10%
9%
% Total LAD
Dr Lager Dr Ale Dr Stout Beer Packaged Cider
TNI competes in all sectors - except Guinness

Tied by Loan – a big part of On Trade mix
Ties usually continue for 10 yrs for draught lager, ale and cider
Diageo31%
Free49%
TNI20%
% of On Trade Outlets
Diageo45%
Free33%
TNI22%
% of Total LAD Volume
Dr Guinnessvia Diageo 2%
Free35%
TNI63%
% of Total TNI Volume
Company estimates

Manufacturers’ shares of On Trade beer and cider
All others 5%
Diageo 61% includes
Guinness @ 32%
Molson Coors 5%
TNI 29%
Source AC Nielsen

NI ON TRADE LAD REVIEW
What is the trend for my brands? - MonthlyTOTAL NI LIQUOR - Volume % Share | Share Basis: LONG ALCOHOL | Top 8
Source: Nielsen | Monthly On Trade (ROI), data to SEP 2010
Starting to see positive results .............

Magners performing well – maintaining share
UK MULTS & MUSGRAVE DATA

UK MULTS & MUSGRAVE DATA
*Including Musgrave Supervalu
41.8%
24.1%
7.9%
3.6%
3.5%
3.1%
3.0%
2.8%
1.7%
1.6%
37.7%
28.7%
7.7%
4.0%
3.6%
3.3%
2.4%
2.4%
1.9%
1.6%
0.0% 5.0% 10.0% 15.0% 20.0% 25.0% 30.0% 35.0% 40.0% 45.0%
Magners
Strongbow
Bulmers
Olde English
Private Label
Kopparberg
Country Manor
Orchard Mill
Dry Blackthorn
Frosty Jack
Last MAT
This MAT
Take Home - In UK Mults* Magners retains lead
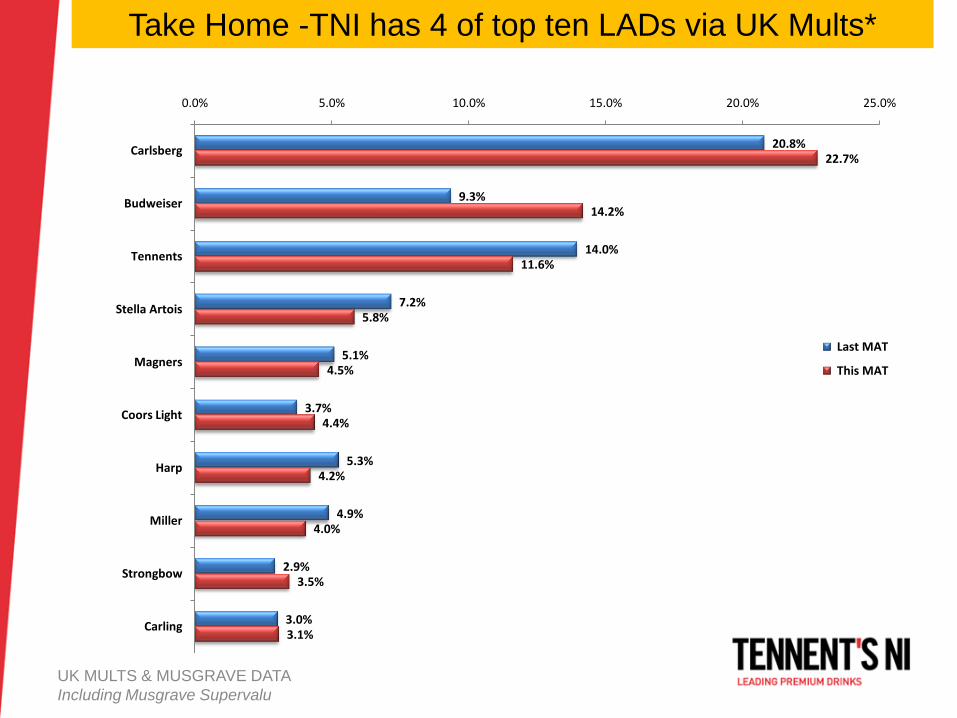
UK MULTS & MUSGRAVE DATA
Including Musgrave Supervalu
20.8%
9.3%
14.0%
7.2%
5.1%
3.7%
5.3%
4.9%
2.9%
3.0%
22.7%
14.2%
11.6%
5.8%
4.5%
4.4%
4.2%
4.0%
3.5%
3.1%
0.0% 5.0% 10.0% 15.0% 20.0% 25.0%
Carlsberg
Budweiser
Tennents
Stella Artois
Magners
Coors Light
Harp
Miller
Strongbow
Carling
Last MAT
This MAT
Take Home -TNI has 4 of top ten LADs via UK Mults*

Summary
• Difficult market – making solid progress
• Great brand portfolio – fit for purpose
• Sustained brand support
• Loan investment and good loan book
• Excellent RTM – direct coverage of on trade
• Experienced and knowledgeable team
• Building momentum


Total alcohol sales are relatively stable in Scotland.
Beer drives the On Trade category
• 4.1m adults in Scotland, with an average per
capita consumption of 153 litres alcoholic
drinks per annum;
• This fell by -3.2% in 2008, but has since
returned to previous levels
• Beer is performing better in Scotland (-2%
MAT) than in the rest of GB (-3% MAT)
• Beer is more On Trade focused than total
alcohol.
Alcovision; Nielsen; CGA

In the Off Trade, we have seen our share decline, as
we start to rebuild Tennent’s value
Nielsen Off Trade MAT 2.10.10

There are over 11,000 outlets in Scottish On Trade.
Free Trade is more important than in England & Wales,
accounting for 60% of volume sales.
CGA On Trade MAT 4.9.10
• Free Trade is the largest
margin pool
•Loan finance still a key driver of
business development and we
have a small loan book compared
with competitors
• Managed / Lease groups are
reducing their presence

Draught Standard
Lager47%
Draught Premium
Lager11%
Pkgd Lager
7%
Draught Ale25%
DraughtStout
9%
Pkgd Ale & Stout
1%
Scotland OnsBeer Volume Segmentation
Draught Standard Lager is the biggest segment in
the Scottish On Trade. Tennent’s is the leading
brand.
CGA On Trade MAT 4.9.10

Tennent’s is a local business
• Experienced direct sales force with market knowledge
• Long-standing trading history with wholesalers
• Links with independent outlets strengthened by a quality
loan book
• New Contact Centre
• New Credit Control / Finance Team

We’re seeing signs of recovery
CGA On Trade MAT 4.9.10

Magners Packaged: its recovery shows the result of
focus on Free Trade
CGA On Trade MAT 4.9.10

Mike Lees MD Scotland
Tom McCusker MD N Ireland