Roadshow Jun 12 Eng
31
Corporate Presentation June/2012
description
Transcript of Roadshow Jun 12 Eng

Corporate PresentationJune/2012

2
The forward-looking statements contained in this presentation are based on the current assumptions and outlook of the Company’s management. Actual results, performance and events may differ significantly from those expressed or implied in these forward-looking statements as a result of several factors such as the general and economic conditions in Brazil and abroad, interest and exchange rates, future renegotiations or pre-payments of liabilities or loans denominated in foreign currency, changes in laws and regulations, and general competitive factors (regionally, nationally or internationally).
Disclaimer

3
Overview
(1) Besides the 46 hotels, we also own a minority interest in the Everest Hotels Chain (3 hotels).(2) 42,566,797 common shares.
BHG at a Glance
Brazil’s third largest hotel Company;
Focused on business tourism (three and four-star brands) in areas with high economic activity;
46¹ hotels throughout Brazil’s main regions, with a total of 8,431 rooms;
Net Revenue of R$ 51.7 mm and Hotel EBITDA of R$ 14.9 mm in the 1Q12;
16 properties in strategic locations for tourism-oriented development along the Brazilian coast;
Listed on the Novo Mercado segment of BM&FBovespa;
Shareholder Structure (04/30/12)²
Traded in the OTC Market in New York under the ticker BZHGY.
20 hotels under development throughout Brazil, which will add approx. 4,000 rooms by 2015;
LA HOTELS LLC + GPCP4 = 44.6%
MFC GLOBAL INVESTMENT = 9.0%JHL = 5.8%
ES TOURISM EUROPE = 5.4%
TREASURY = 1.1%
BOARD OF DIRECTORS & EXECUTIVES = 1.1%
OTHERS = 32.4%

4
3
Acquisition of Hotels
2
Management of Third Parties’ Hotel
Development of New Hotels
1
► Accelerate expansion► Increase the scale of
operation and brand exposure
► Entry into the Budget Segment
Franchising
4
► Highly fragmented market
► Old, poorly kept hotels
► Capacity to turnaround assets
► Track-record of attractive acquisitions
► Balanced Capital Structure
► Fee business► No overlap with
consolidation opportunities
► Increased scale benefits BHG bargain power with suppliers and customers
► Low penetration► Absence of major
companies► Expertise to
develop and operate hotels
... and its goal is to become the largest Hotel company in Brazil
BHG’s Consolidation StrategyBHG has multiple growth drivers…

5
2009 2010 2011 2012 2013 2014 2015
70%
30%
58%
42%
51%
49%
56%
44%
58%
42%
60%
40%
65%
35%
BHG’s Timeline and Announced Deals
► BHG initiated its operations in February 2009, after a merger between:
• Invest Tur : A company created in 2007, that raised R$ 945 million in an IPO for the development of 2nd home properties on Brazilian beaches;
• L.A. Hotel : A GP Investments company created in January 2008, focused on the business tourism hotel segment.
The Hotels managed figures does not include the minority participation in the 3 hotels part of the Everest Hotel Chain;The numbers presented above illustrates the position in the end of each year.
For the years 2012 through 2015, the number of rooms and hotels are based on information already disclosed to the market:
Hotels Under Management:
Fully Owned
Partially Owned
Third-Party Properties
Owned Rooms
Managed Rooms
%CAGR 09-14
15%
14%
18%
BHG is the first listed Brazilian company to operate in the tourism-oriented real estate segment.
5,293 5,8947,222
8,83610,220 10,900
12,480
31 34 37 48 55 59 66
11 15 16 16 16 16 16
2 3 5 9 16 18 18
18 16 16 23 23 25 32
6
SP
3
2
1
1
5
3
1
1
2
1
6
1
12
1
1
4
1
2
1
1
1
1
1
ES
RJ
BA
PE
RN
CEMA
PA 1
RS
PR
GO &DF
MT
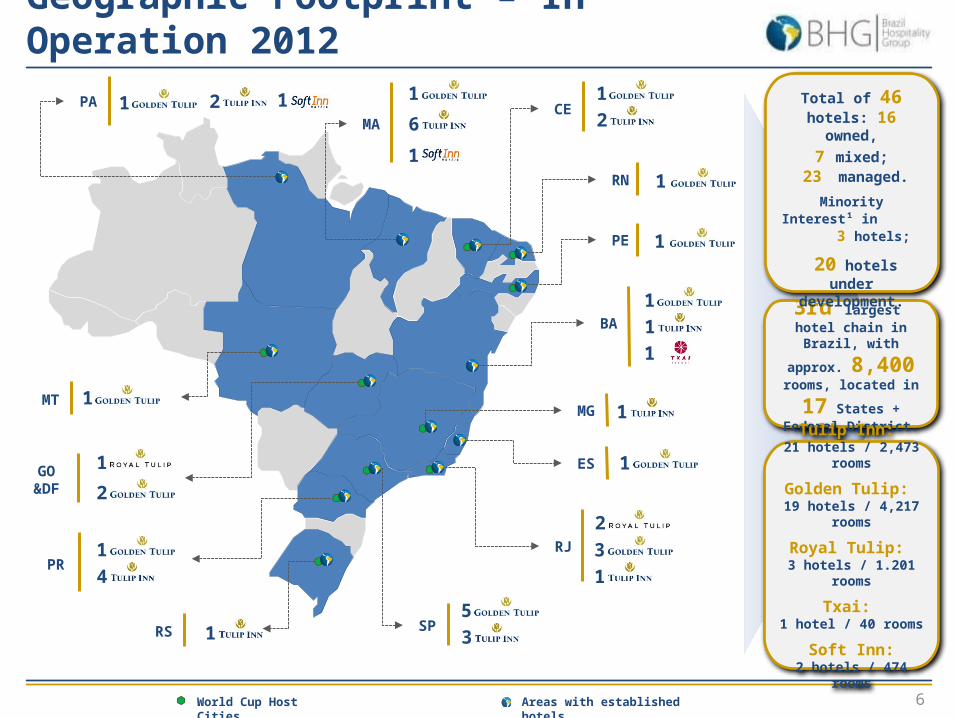
3rd largest hotel chain in Brazil, with approx.
8,400 rooms, located
in 17 States + Federal District.
Total of 46 hotels: 16 owned,
7 mixed; 23 managed.
Minority Interest¹ in 3 hotels;
20 hotels under development.
Tulip Inn: 21 hotels / 2,473 rooms
Golden Tulip: 19 hotels / 4,217 rooms
Royal Tulip: 3 hotels / 1.201 rooms
Txai: 1 hotel / 40 rooms
Soft Inn:2 hotels / 474 rooms
Geographic Footprint – In Operation 2012
Areas with established hotelsWorld Cup Host Cities
MG 1

7
Rio de Janeiro
TI Angra dos Reis
TI Campos
TI Itaguaí
Paraná
Belo Horizonte
TI Savassi
Areas with established hotelsWorld Cup Host Cities
Owned
Managed
Under Development
Key
RT = GT = TI = SI =
SI Maringá
Campo Grande
TI Campo Grande
Fortaleza
TI Sobral
Palmas
GT Palmas
TI Palmas
Belém
RT Bolonha
TI Hangar
SI Hangar
GT Belo Horizonte
Geographic Footprint – Under Development
Maceió
Gran Solare
TI Maringá
TI Marabá
GT Marabá
Maranhão
SI Imperatriz
TI Castanhal
Gran Solare
20 hotels under development, with
a total of aprox. 4,000 rooms until
2015
8
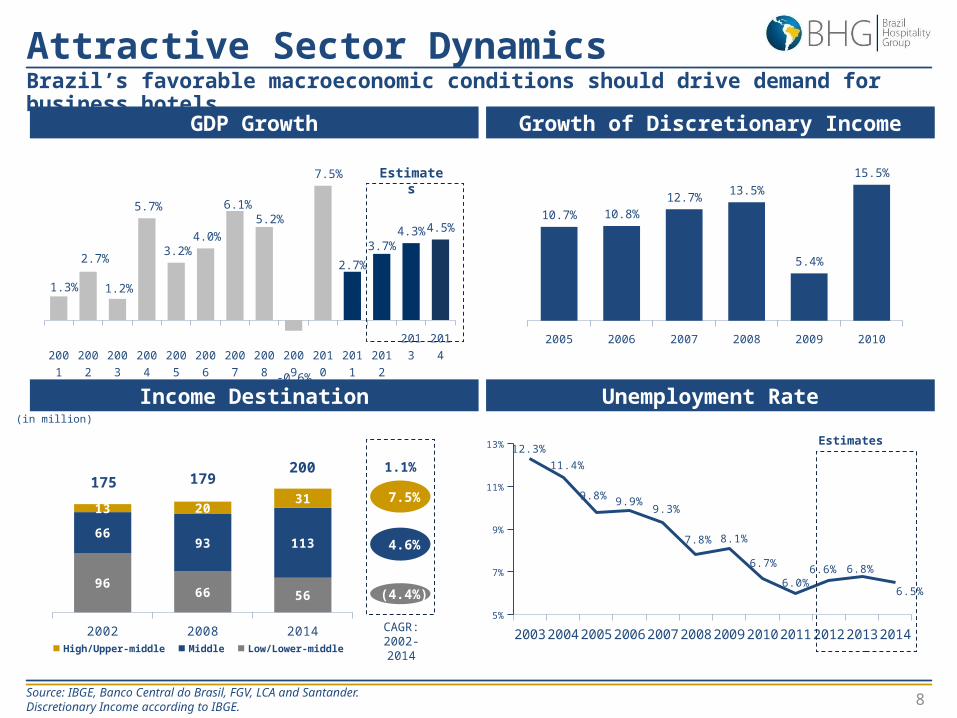
2001 2002 2003 2004 2005 2006 2007 2008 2009 2010 2011 2012 2013 2014
1.3%
2.7%
1.2%
5.7%
3.2%4.0%
6.1%5.2%
-0.6%
7.5%
2.7%
3.7%4.3% 4.5%
GDP Growth Growth of Discretionary Income
Income Destination Unemployment Rate(in million)
2003 2004 2005 2006 2007 2008 2009 2010 2011 2012 2013 20145%
7%
9%
11%
13% 12.3%11.4%
9.8% 9.9%9.3%
7.8% 8.1%
6.7%
6.0%6.6% 6.8%
6.5%
2005 2006 2007 2008 2009 2010
10.7% 10.8%12.7% 13.5%
5.4%
15.5%Estimates
2002 2008 2014
9666 56
6693 113
13 2031
High/Upper-middle Middle Low/Lower-middle
200175
Attractive Sector DynamicsBrazil’s favorable macroeconomic conditions should drive demand for business hotels.
Source: IBGE, Banco Central do Brasil, FGV, LCA and Santander.Discretionary Income according to IBGE.
7.5%
4.6%
(4.4%)
CAGR: 2002-2014
1.1%179
Estimates

9
2010 2011 2012 2013 2014 2015 2016 2017 2018 2019 2020
5.0 5.4 6.4 7.1 8.1 7.8
8.9 8.6 9.3 10.2
11.1
► Important events in Brazil: Rio + 20 (2012), Confederation Cup
(2013), World Youth Day (2013), World Cup (2014), Copa
América (2017) and Olympic Games (2016);
► Massive investments, over R$110bn, in infrastructure to adopt
the stadia and to prepare host cities;
► BNDES launched a credit line of R$1bn for the hotel sector to
support investments and construction of hotels.
Relevant Upcoming Events Arrivals of Foreign Tourists in Brazil
2014 World Cup and 2016 Olympic Games will consolidate Brazil as a tourist destination.
Domestic Passenger Air Traffic in Brazil
(in million)
(in million)
Attractive Sector DynamicsBrazil’s booming business activity combined with the country’s unique natural environment creates favorable dynamics for tourism.
CAGR 10E-20E = 7.3%
Source: IBGE, Ministério do Turismo, Embraer and Research Reports.
2007 2008 2009 2010 2011
44.4 47.8 56.2
68.3
79.0
+15.8%

10
Accor
Atlântica
BHG
Blue Tree
Nacional
Inn
Transam
érica
Sol M
eliá
Allia Hotel
s
Windso
r
Slave
iro
Owned Managed
Natural Consolidator
Hotel Industry in Brazil Number of Rooms (Jun/12)
Number of hotels Number of rooms
6.1%12.9%6.0%
16.4%
87.9%
70.7%
Independent International chains National chains
6,076 Hotels 410,327 rooms
44% 90%86% 100%
21,028
12,876
4,172 3,986 2,940 3,391 2,930 2,7722,819
BHG has approximately 8,300 rooms among its owned and managed properties, taking advantages of synergies of scale in its operations.
Source: Jones Lang La Salle and BHG estimates.
17%
8,431

11
Economies of Scale
Proven capacity to integrate and turnaround targets hotels
Main Synergies
► Better allocation of clients among hotels, minimizing sales losses;
► Marketing synergies strengthening brands;
► National / international sales force - call centers in Brazil and abroad;
► Negotiating power with travel agencies and tour operators;
► Scale to serve corporate clients in various regions.
Commercial
► Professional administration instead of family managed;
► Centralized administrative operations;
► Joint negotiation of supply contracts;
► IT systems that allow major cost reductions;
► Benchmark of best operational practices among the various hotels;
► Capacity for attraction and retention of talent.
Operational / Administrative
72% of all hotel rooms in Brazil are independently managed, creating the opportunity for post-acquisition operational turnaround
(1) 2008 - February 2011: 231 rooms in operation; In March/2011: 327 rooms in operation.
RevPar (R$)
EBITDA (R$ million)Hotel’s Acquisition (fev/2008)
2007 2009 2011
2.6
6.3
10.4
Golden Tulip Regente Case¹
Daily Rate of R$ 180;
OCC of 66%
Daily Rate of R$ 278; OCC of 76%
2007 2009 2011
120.0
170.0
212.0

12
EBITDA Multiples
2012 7.0x
2011 8.5x
2009 9.8x
2007 19.7x
EBITDA (R$ million)
2012 13.6
2011 10.4
2009 6.3
2007¹ 2.6
Golden Tulip Regente Case
Total Invested Value
BHG significantly improved the hotel's EBITDA reducing it's multiple and the time required for the investment's capital return since it’s acquisition in fev/08.
2007¹ = EBITDA generated by the former owner.
Estimate
Estimate
2007 2009 2011 2012
51.2
61.8
88.694.9

13
Acquisition Track Record and Pipeline• BHG has a solid track record of acquiring operating properties and a robust pipeline.
Projects
RoomsShare
(%)Price ¹
(R$ million)Mult.² 2013
Hotel A(Rio de Janeiro)
143 100% $105.0 9.1x
Hotel B(Rio de Janeiro)
189 100% $199.1 9.3x
Hotel C(Porto Alegre)
171 100% $60.0 7.1x
Hotel D(Maceió)
149 100% $18.5 5.3x
Hotel E(Fortaleza)
202 20% $9.3 5.8x
Hotel F(São Luis)
243 20% $11.4 6.3x
Hotel G(Joinville)
140 100% $17.0 6.8x
Hotel H(Uberlândia)
128 25% $3.8 5.4x
TOTAL 1,365 - $424.1 6.9x
Acquisition Track Record Acquisition Pipeline
316 million invested in 2011
EverestRooms: 181
(8,5%)
2010
Batista Campos and Nazaré
Rooms: 190
2010
IntercontinentalRooms: 418
2010
SofitelRooms: 388
2011
Soft Inn “Plus” Batista CamposRooms: 258
2011
Golden Tulip Recife PalaceRooms: 299
2010
Tulip Inn Hangar and Soft Inn
Hangar
Rooms: 1322011
Golden Tulip Connext
Rooms: 1272011
Historical Multiple of
Acquisitions of 7.6x
(08-12).
1) Includes retrofit expenses;2) Multiple EBITDA = BHG’s EBITDA Share + administration fees after taxes (when applied).

14
Tulip Inn Model Strategy
Tulip Inn Double Room (Project) Tulip Inn Double Room (Preview)
► Project model with 140 apartments;
► Construction timeframe of 30 months;► Including 6 months for licensing and project
approval;
► BHG’s share of the project will usually be: 25%;
► Land Acquisition estimated at 25% of the construction’s cost;
► SPE 60% with Long Term debt (BNDES);► Debt Cost: TJPL + 3,8%► Term:12 years with 4 years of interest grace period
► We conducted a Geographical Study which defined 31 target cities as potential markets to be explored;
► Our strategy is to develop and construct around 5,600 new rooms between 2011 and 2016;
► Total Equity necessary from BHG will be R$ 100 million, considering that we will leverage 60% though BNDES and have partners from the remaining portion.
We will also build new economic hotels (greenfield projects)Greenfield Hotels

15
Done Deals & Pipeline | Greenfield Hotels
*Investment¹ = BHG’s participation share in the deal; Multiple 2015² = Considering BHG´s share on the hotel´s EBITDA + management fees.
Projects
RoomsInvest.¹(R$ mm)
Share (%) LaunchMult. 2015²
Itaguaí(Rio de Janeiro)
200 $6.5 53% 2013 3.5x
Campos(Rio de Janeiro)
160 $20.0 100% 2013 7.8x
Maringá(Paraná)
228 $9.5 51% 2013 3.4x
Palmas(Tocantins)
140 $5.0 50% 2013 2.7x
Belo Horizonte(Minas Gerais)
240 $16.7 25% 2014 7.3x
Sobral(Ceará)
120 $3.0 33% 2013 2.8x
Angra dos Reis(Rio de Janeiro)
120 $3.6 33% 2014 2.6x
Campo Grande(MS)
140 7.0 33% 2014 4.9x
TOTAL 1,348 $71.3 - - 4.4x
Done Deals
Projects
RoomsInvest.¹(R$ mm)
Share (%) LaunchMult. 2015²
Uberlândia (MG)
302 $3.0 10% 2013 5.5x
Porto Velho(RO)
200 $12.0 51% 2015 5.8x
Marabá(PA)
200 $12.0 51% 2015 6.6x
São José do Rio Preto (SP)
140 $10.0 51% 2014 6.2x
Sorocaba (SP)
140 $10.0 51% 2014 6.2x
Campinas(SP)
140 $10.0 51% 2014 6.2x
Macaé (RJ)
150 5.0 25% 2014 5.0x
Resende (RJ)
140 5.0 25% 2014 5.0x
TOTAL 1,412 $67.0 - - 5.8x
Pipeline
• The Done Deals listed above only illustrates the Tulip Inn Greenfield Projects where BHG holds equity participation.

16
► Golden Tulip Hospitality is part of an international hotel company with more than 1,000 hotels in 40 countries
► In July of 2009, Golden Tulip was acquired by Starwood Capital, becoming the world’s 8th largest hotel chain
► Brands:
– 5 star:
– 4 star:
– 3 star:
► BHG – Golden Tulip Agreement:– Exclusive use of the Golden Tulip brand in
South America– Benefits in royalty and international
marketing fees– Access to an international distribution
network and call centers around the world– Use of Value Drivers, Golden Tulip’s
commercial tools – Access to Golden Tulip miles program
(Flavours)
Description Benefits for BHG
► 6-star resort in Itacaré, BA► Established tourist destination with one of
the best resorts in the country and the world
► BHG-owned brand
► Use of the Txai brand in real estate development projects
► Leverage of the Txai brand in condo-hotel and villa/home launches
► Synergies with Txai projects
BHG has an exclusivity agreement with Golden Tulip allowing access to an international distribution network and guaranteeing operating standards in its hotels.
Strong Brands
► The Soft Inn brand allows BHG to operate in every segment of the Hotel Industry, acessing all kinds of guest profiles.
► Budget:
► Group recently acquired by BHG

17
Tier 1 Management Team
BHG has a team of top executives with broad experience in various industries.
- Bachelors degree in Hotel Management (Cornell University)- Bachelors degree in Management (Hotel Man. Sch. Les Roches)- M&A manager of Odebrecht- M&A director of Westmont Hospitality Group
Fabrício MuzzioDirector of Investments
- Master degree in International Business (Florida Int. Univ.)- Bachelors degree in Hotel Management (FIU e HHS Hague)- CEO of Brazil Fast Food Corporation- Occupied different positions in marketing and sales of Shell
Pieter van Voorst VaderCEO
Ricardo LevyCFO & IRO- MBA in Management (Coppead)- Bachelors degree in Management (PUC-RJ)- Former financial superintendent of Light (energy provider)
Reginaldo L. OliviOperations Officer- Bachelors degree in Economics (PUC-SP)- Director of Grupo Chambertin Hotels Administration- Director of Olivi Advising and Consultancy
André Luiz D. LameiroCommercial Officer- Bachelors degree in Economics (FMV)- Bachelors degree in Marketing (Amnnhembi)- Director of Grupo Chambertin Hotels Administration
► Latin America’s leader in private equity
► Raised more than US$4 billion from private equity investors
► Concluded 48 investments in 15 different sectors
► In May of 2006, became the first private equity firm to list on a Latin American stock exchange
► Counts on a group of experienced professionals recognized by the market for their expertise
Focused Management Team and Sponsorship

18
Geographic Footprint
BHG’s strategy for the land bank is to monetize the properties through environmental licenses and partnerships.
* Values in R$ million. ¹ Book Value considering only BHG’s share. TBD = To Be Defined. PSV* = Estimated PSV.
1 Project under development. 50% sold on the 1st sales lot.
2 properties for development
2 long-term land banks
1 long-term land bank
8 properties for development
2 properties for development
Other properties
Canavieiras I BA 569 26,6 8,2 -
Txai Paraty RJ 480 12,3 4,8 -
Canavieiras II BA 577 16,0 8,4 -
Carro Quebrado AL 1.265 22,6 7,6 -
Deep Beach RJ 2.260 30,1 12,3 -
Txai Salvador BA 5 6,9 2,7 -
Canavieiras III BA 102 4,8 1,3 -
Wind Beach CE 11.254 9,0 5,4 -
Nossa Shra. Vit. BA 729 10,8 4,6 -
Wind Farm
Long Beach CE 54.014 13,1 8,5 1.75%
Port Beach PI/MA 8.332 13,8 5,9 TBD
Total Book Value - 288,0 159,0 -
Rent
Properties States Sqmt Invest. Value
Book Value¹ PSV*
Under development
Txai Terravista BA 72 15,9 9,4 63,0
Txai Ganchos SC 530 8,1 3,1 117,5
Conduru BA 430 12,7 10,3 26,1
Properties States Sqmt Invest. Value
Book Value¹
Negotiated Value
Done Deals
Kino SP 7.200 45,4 26,8 52,4
Txai Itacaré BA - - 18,5 18,5
P. Camaragibe AL 1.630 56,6 32,4 TBD
Singlehome BA 3.695 28,7 25,1 TBD
Land Bank | Additional Source of Value
Greenfield areas
States where BHG operates

19
2012201120102009
189.4157.7
153.8125.0
2012201120102009
67.3%66.9%
64.2%
65.1%
Occupancy Rate (%) Daily Rate (R$)
Hotel’s Indicators: 2009 - 2012The performance of Company's hotel's indicators since 2009, including projections for 2012 and 2014 – when Brazil will host FIFA's World Cup.
Estimate
Estimate
Estimate
RevPar (R$)
8.1%
2012201120102009
262.0235.5
229.9194.52.4%
2.5%

20
Net Operating Revenue (in R$ mm) Hotel’s EBITDA (in R$ mm) and Margin (%)
Company’s EBITDA (in R$ mm) and Margin (%) Net Profit (in R$ mm)
Driven by the maturity of the acquired hotels, BHG expects a solid growth in EBITDA and Net Operating Revenue for 2012.
Historical Financial Highlights
201120102009
9.6
(6.2)
2.6
2009 2010 2011(10.9)
10.7
41.9
(14.2)
8.7
23.7
201120102009
176.6
121.8
76.9
2009 2010 2011
19.3
33.0
58.225.1
27.1
33.0

21
At the end of 2011, the Company reappraised hotels acquired more than 3 years ago in Rio de Janeiro and São Paulo, which are recorded under property, plant and equipment in the amount of R$133.5 million. Upon reappraisal by the consulting firm APSIS, a specialist in the reappraisal of assets, the properties were valued at R$465.9 million. Even so, the difference of R$332.4 million was not recorded in the Company’s balance sheet,
Financial Highlights | 2011
When considering only the calculation of Net Asset Value (NAV) using the new market value of the Company’s assets, it is clear that BHG is undervalued, with a difference between NAV in 2011 without and with adjustments of 48.5%.
Annual Data
Indicators 2011 Unadjusted 2011 Adjusted
Portfólio R$ million 885.5 1,217.8
Hotels R$ million 727.3 1,059.7
Landbank R$ million 158.2 158.2
Net Debt R$ million (199.6) (199.6)
NAV R$ million 685.9 1,018.2
No. of Shares Million 41.1 41.1
NAV/shares R$ 16.70 24.79
Share Price R$ 15.50 15.50
% of NAV % 92.8% 62.5%
2011 = Price on 12/31/11;

22
Leadership Position and Scalability
Natural Consolidator
Strong Brands
Focused Management Team and Sponsorship
Land bank: Additional Source of Capital
Attractive Sector Dynamics
1
2
3
4
5
6
Investment Case Key PointsBHG has competitive advantages that position it to become the largest and most profitable player in the Brazilian hotel industry.

Financial Highlights1Q12

24
Hotel’s Indicators – SSS¹ Hotel’s EBITDA (R$ mm) and margin (%) – SSS¹
Financial Highlights | 1Q12
(1) The 1Q12 results consider the same base of owned hotels in 1Q11, totaling 2,533 owned rooms (“Same Store Sales”).
Hotel’s Indicators Hotel’s EBITDA (R$ mm) and margin (%)
1Q11 4Q11 1Q12
12.915.8
13.9
34.1%36.6%
31.8%
1Q11 4Q11 1Q12
142.1155.8 164.5
216.1230.3
258.3
65.8% 67.7% 63.7%
RevPar (R$) Average Daily Rate (R$) Occupancy (%)
1Q11 4Q11 1Q12
147.4160.2 161.1
225.6239.2
261.8
65.3% 67.0% 61.5%
RevPar (R$) Average Daily Rate (R$) Occupancy (%)
13.2
18.8
14.9
32.4%35.0%
28.8%
1Q11 4Q11 1Q12

25
Gross Operating Revenue (R$ mm)
Net Profit (R$ million)
Financial Highlights | 1Q12
BHG’s EBITDA (R$ mm) and EBITDA margin(%)
Net Operating Revenue - NOR (R$ million)
40.8
53.8 51.7
1Q11 4Q11 1Q12
4.5% 3.8% 4.2%21.3%
24.6% 20.9%
74.2%
71.6%74.9%
1Q11 4Q11 1Q12
Management Fees F&B Room Revenue
45.0
57.460.2
7.2
16.7
11.4
17.7
31.1
22.0
1Q11 4Q11 1Q12

26
2Q09 3Q09 4Q09 1Q10 2Q10 3Q10 4Q10 1Q11 2Q11 3Q11 4Q11 1Q12
4.2 4.8 4.5 6.6 6.1
10.5 11.3 13.2 12.2
14.1
18.8
14.9
2Q09 3Q09 4Q09 1Q10 2Q10 3Q10 4Q10 1Q11 2Q11 3Q11 4Q11 1Q12
16.8 18.3 21.3 22.129.0
35.3 37.2 40.8 39.8 42.3
53.8 51.7
(R$ thousand)
(R$ thousand)
727.3
Asset
27.3
Hotels portfolio
262.0
234.7
Total Debt
Total Cash & Cash Equivalents
Net Debt
23# of properties*
158.4Landbank areas
16# of properties
Balance Sheet
725.8Net Equity
Net Operating Revenue
Hotel´s EBITDA
BHG – 1Q12 (in R$ mm)
Financial Highlights | 1Q12BHG has a balanced capital structure, key for its strategy of consolidating the hotel industry.
CAGR = 12.2%
CAGR = 10.8%
* Includes owned and partially owned hotels.

27
The hotels operation presented a Net Revenue of R$51.7 mm and EBITDA of R$14.9 mm in 1Q12. Company’s EBITDA reached R$ 14.9mm and a Net Loss of R$ 2.4 mm.
Financial Highlights | 1Q12
BHG (R$ million)1Q12 4Q11 1Q11 ∆% (1Q12
X 4Q11)∆% (1Q12 X 1Q11)
Net Revenues 51.7 53.8 40.8 -3.8% 26.8%
(-) Cost of Services (15.9) (16.1) (12.4) -1.1% 28.2%
(-) Hotel Adm. Exp. (14.8) (13.4) (10.0) 10.7% 47.9%
(-) Maintenance (2.3) (1.8) (1.9) 25.8% 22.8%
(-) Marketing and Commercial Exp. (3.9) (3.7) (3.3) 4.6% 16.9%
HOTEL - EBITDA 14.9 18.8 13.2 -20.9% 12.5%
(+) Rev. from Non - Ope. Prop. 3.2 5.0 - n.m. n.m.
(-) Administrative Expenses (5.3) (5.5) (4.2) -3.1% 27.3%
(+/-) Real Estate Op. Expenses (1.3) (1.6) (1.8) -15.4% -26.4%
BHG - EBITDA 11.4 16.7 7.2 -32.2% 57.3%
(+/-) Depre./Amort. (6.1) (4.0) (3.5) 50.2% 74.0%
(+/-) Financial Result (7.9) (6.4) (0.6) 23.1% 1137.4%
(+/-) Others 2.0 1.2 6.7 n.m. n.m.
(+/-) Minority Interest 0.3 0.3 0.2 0.9% 32.1%
(-) Taxes and Social Cont. (2.3) (4.1) (3.8) -44.7% -40.7%
Net Profit/Loss (2.5) 3.7 6.3 -169.5% -140.7%

28
EBITDA Margin and Business MixEBITDA Margin(1)
Lodging Corps Lodging REITs
Full-Service Select-Service
Business Mix (EBITDA) (1)
1. Reflects full year 2010 results, except where noted;Source: Barclays.
CHH IHGMAR
HOT
Whitb
read
BHG
Mandari
n
Sol M
elia H
MHGC
Posadas
Accor
RLH
NH Hoteles
Rezidor
0%
10%
20%
30%
40%
50%
60%
70% 64%
34%29% 27% 27% 24% 21% 19% 18% 18% 15% 15% 14% 11%
4%
LHO DRH HST RLJ CLDT HT INN
27%23%
19%
29% 29% 27% 25%
CHH IHGMAR
HOT
Mandari
n
Sol M
elia H
MHGC
Posadas
Accor
RHL
Rezidor
LHO
DRHHST RLJ
CLDT HT
INN0%
20%
40%
60%
80%
100%
100%87%
57%45%
17%35% 28%
44%32%
66%
13%
19% 38%83%
75%
56% 72% 32%68%
9%
26%
100% 100% 100% 100% 100% 100% 100%
24% 17% 25%9%
24%
91%
8%
Managed/Franchised Owned Others
2011Results

29
Rezidor MAR CHH HOT MHGC RLH H ING BHG CLDT INN Posadas RLJ Whitbread HT-2%
0%
2%
4%
6%
8%
10%
12%
14%
11.4%
5.0%3.9%
2.9% 2.8% 2.8% 2.3% 2.1% 1.9%0.9% 0.8% 0.8% 0.7% 0.7% 0.5%
CHH MAR HOT BHG MHGC IHG H CLDT Rezidor RLH INN HT RJL Posadas Whitbread0%
10%
20%
30%
40%34%
18.0%
11.6% 11.3% 10.0%7.3% 7.1% 6.0% 5.1% 3.9% 3.4% 3.2% 2.7% 1.7% 1.4%
Corporate Overhead2011 Overhead as % of Enterprise Value
2011 Overhead as % of Revenue
(1)
2011Results
Source: Barclays.
2011Results

30
Jan-09Apr-09Jul-09Oct-09Jan-10Apr-10Jul-10Oct-10Jan-11Apr-11Jul-11Oct-11Jan-12Apr-12
IMOBIBOVBHG
Apr-11M
ay-11Jun-11Jul-11Aug-11Sep-11Oct-11Nov-11Dec-11Jan-12Feb-12M
ar-12
IMOBIBOVBHG
Comparative between the IMOB (real estate) and IBOV indexes, both related to BM&FBovespa, and the Company's equity (BHGR3) considering the period of 2009 – up to today¹.
Capital Market Performance | 2012
Jan/09 Abr/12 ∆% (2009-2012)
BHGR3 (R$) 10.80 23.08 114%
IBOV (ths) 40.20 61.82 54%
IMOB (ths) 0.32 0.83 152%
Apr/11 Abr/12 ∆% (12M)
BHGR3 (R$) 22.70 23.08 2.0%
IBOV (ths) 69.26 61.82 -5.2%
IMOB (ths) 0.94 0.83 -7.1%
2.0%
-5.2%-7.1%
2009 - 2012 Moving Average (12M)
¹Today = Stock price on 04/30/12;Source: Bloomberg.
152%
114%
54%

31
Contacts
Peter van Voorst Vader (CEO) +55 (21) [email protected]
Ricardo Levy (CFO & IRO) +55 (21) [email protected]

![KOF Roadshow 2011 Octubre ENG 2.ppt [Modo de compatibilidad] · Microsoft PowerPoint - KOF Roadshow 2011 Octubre ENG 2.ppt [Modo de compatibilidad] Author: MX01001659 Created Date:](https://static.fdocuments.in/doc/165x107/61436e126b2ee0265c020a4a/kof-roadshow-2011-octubre-eng-2ppt-modo-de-compatibilidad-microsoft-powerpoint.jpg)