Roadmap High Capacity Transports on road in Sweden · Roadmap High Capacity Transports on road in...
74
Roadmap High Capacity Transports on road in Sweden
-
Upload
truongkhanh -
Category
Documents
-
view
214 -
download
0
Transcript of Roadmap High Capacity Transports on road in Sweden · Roadmap High Capacity Transports on road in...
Roadmap High Capacity Transports on road in Sweden
2
Document title: Roadmap High Capacity Transports on Road in Sweden
Written by: Helena Kyster-Hansen – Tetraplan and Jerker Sjögren - CLOSER
Document date: 2013-04-10
Document type: Rapport
Document ID:
Case number: [Ärendenummer]
Project number: [Projektnummer]
Version: Final
Publishing year: 2013-04-10
Publisher: CLOSER
Contact person: Jerker Sjögren
Assignment manager: Jerker Sjögren
Press:
Distributor:
3
Contents Preface 6
1 Summary 7
1.1 Large interest, large potential .................................................................7
1.2 Measures ................................................................................................. 8
1.3 Implementation ...................................................................................... 9
2 Introduction 12
2.1 Background and rationale ..................................................................... 12
2.2 Implementation of the work .................................................................. 12
2.3 Target ..................................................................................................... 13
2.4 Target for HCT - Road ........................................................................... 15
2.5 Contributions to the Forum’s overall targets ........................................ 16
3 Stakeholder model 16
3.1 Goods owner .......................................................................................... 17
3.2 Transporters .......................................................................................... 18
3.3 Vehicle Manufacturers .......................................................................... 18
3.4 Infrastructure owners ............................................................................ 18
3.5 Secondary stakeholders ......................................................................... 18
4 The need and demand for HCT 19
4.1 HCT for various types of goods – shippers’/goods owners’ perspective20
4.2 Technical aspects of HCT – the vehicle manufacturer’s perspective .... 21
4.3 Traffic aspects of HCT – Infrastructure owner perspective ................. 22
5 Innovation domains 22
5.1 Domain - Infrastructure Adaptation .................................................... 23
5.2 Domain – Information Systems ........................................................... 26
5.3 Domain – HCT-Logistics ...................................................................... 30
5.4 HCT Vehicle Combinations .................................................................. 33
5.5 Domain – Regulations .......................................................................... 38
5.6 HCT and road safety ............................................................................. 40
6 Proposals for action 41
7 Socio-economic benefits of HCT 43
7.1 Reference framework for cost-benefit analysis of the introduction to HTC roads
44
7.2 WSP calculating the economic benefits HTC 2030 .............................. 45
7.3 Socio-economic benefits of HTC in timber haulage, terminal transport and other
transport .......................................................................................................... 46
4
7.4 The introduction of HCT shifts the focus in investment in infrastructure
48
7.5 Discussion ............................................................................................. 49
8 SWOT – Feasibility of the roadmap 51
9 Recommendations and the next steps 51
10 Annex: Modularity 54
10.1 Vehicle length and GCW ....................................................................... 54
10.2 The modular system ............................................................................. 54
10.3 The concept versus the system ............................................................. 55
11 Annex: International perspectives 55
11.1 Definition of long vehicles .................................................................... 55
11.2 Overview of LCV in different countries ................................................ 58
11.3 Countries that allow short LCV (up to 25.25 m) .................................. 59
11.4 Countries that allow medium LCV (25 - 30 m) .................................... 59
11.5 Countries that allow long LCV .............................................................. 59
12 Annex: Effects of the use of long vehicles 63
12.1 General effects ...................................................................................... 63
12.2 Experiences from different countries ................................................... 64
12.3 Conclusions........................................................................................... 67
13 Annex: HCT and traffic safety 68
14 Annex: Acronyms 71
15 Annex: References 73
Figure 1-1 Vision for the HCT-Road 2030 – Efficiency in percent for 2010. Red numbers in () applies to
the entire transport system. ................................................................................................................... 7
Figure 1-2 Overall context of HCT ........................................................................................................... 8
Figure 1-3 Summary of proposed actions ............................................................................................... 9
Figure 1-4 Stakeholder model for HCT .................................................................................................. 10
Figure 2-1 in ERTRAC’s target for 2030 ................................................................................................. 13
Figure 2-2 Decisions and objectives by the EU-Commission, the Parliament and the Government .... 13
Figure 2-3 Sub-targets from FFI’s program council for transport efficiency ......................................... 14
Figure 2-4 FFI’s program council for transport efficiency’s roadmap and milestones ......................... 14
Figure 2-5 Targets for transport efficiency (FFI) .................................................................................... 15
Figure 2-6 Targets for HCT-Road 2030 – Efficiency in percent for 2010. Red numbers in () applies to
the entire transport system. ................................................................................................................. 16
Figure 3-1 Stakeholders in the HCT-sphere ........................................................................................... 17
Figure 4-1 Ranking of goods groups according to Lastbilsundersökningen and
Varuflödesundersökningen (from the forthcoming report in the context of R&D Program: "Needs
5
and benefits of transportation with high capacity (HCT) in different industries and for different
kinds of goods") .................................................................................................................................... 20
Figure 5-1 Correlation within HCT ......................................................................................................... 22
Figure 5-2 Impact on targets 2030 - Innovation Domain Infrastructure Adaptation ......................... 23
Figure 5-3 Costs to upgrade the bearing capacity on a designated road network in millions ........... 24
Figure 5-4 Measures in the Innovation Domain Infrastructure Adaptation ....................................... 26
Figure 5-5 Impact on targets 2030 - Innovation Domain Information Systems ................................. 27
Figure 5-6 The IAP system ..................................................................................................................... 28
Figure 5-7 Measures in the innovation domain Information Systems ............................................... 30
Figure 5-8 Impact on targets 2030 - Innovation domain HCT Logistics ............................................... 30
Figure 5-9 Measures in the innovation domain HCT Logistics ............................................................ 33
Figure 5-10 Impact on targets 2030 - Innovation domain HCT Vehicle Combinations ...................... 33
Figure 5-11 Performance of various vehicle combinations ................................................................. 34
Figure 5-12 Custom combinations of HCT-transport ........................................................................... 36
Figure 5-13 Measures in the innovation domain HCT Vehicles Equipage .......................................... 37
Figure 5-14 Impact on targets for 2030 - Innovation domain regulations .......................................... 38
Figure 5-15 Measures in the Innovation Domain Regulations ............................................................ 40
Figure 6-1 Proposed actions .................................................................................................................. 43
Figure 7-1 Peer relationships in a cost-benefit analysis of HCT. Read the chart from the green
square. ................................................................................................................................................... 44
Figure 7-2 Summary of the analysis result if 11.35 percent vehicle kilometres are done by HCT
vehicles in 2030 (mio. SEK m in 2010 prices) ....................................................................................... 45
Figure 7-3 Transport work for the three market segments in 2011 and the adoption of high resp.
low proportion of HCT 2030 ................................................................................................................. 47
Figure 7-4 The present value of social benefits 2015-54 for the three market segments at high and a
low proportion of HCT 2030 (million SEK in 2010 prices) .................................................................... 48
Figure 8-1 Results of the SWOT analysis of the feasibility of the Roadmap for HCT-Road ................ 51
Figure 11-1 UNESCAP classification of LCV and examples of the types .............................................. 56
Figure 11-2 Method for classification of LCV by UNESCAP ................................................................. 56
Figure 11-3 Modules that combine to long vehicle combinations ........................................................ 57
Figure 11-4 Examples of vehicle combinations in each class .............................................................. 58
Figure 11-5 Australian example of Performance Based Standards ....................................................... 60
Figure 11-6 Long LCV in Australia .......................................................................................................... 60
Figure 11-7 Different configurations of LCV in Australia ....................................................................... 61
Figure 11-8 Main types of LCV in the United States .............................................................................. 61
Figure 11-9 American states that allow different kinds of LCV, 1 ....................................................... 62
Figure 11-10 American states that allow different kinds of LCV, 2 ....................................................... 62
Figure 11-11 Canadian types of LCV ...................................................................................................... 63
Figure 12-1 Analysis of 31 Smart-Trucks use in 2011 ........................................................................... 66
6
Preface CLOSER has been commissioned by the Forum for innovation in the transport sector to develop a roadmap for High Capacity Transports by road - HCT-road. The work is now completed and we hereby submit our report.
The work has been carried out as a project with a project group and a reference group. The project group has included Per-Olof Arnäs, Chalmers; Thomas Asp, Trafikverket; Anders Berger, Volvo; Anders Berndtsson, Trafikverket; Fredrik Börjesson, Schenker; Niklas Fogdestam, Skogforsk; Anders Johnson, Scania; Jesper Sandin, SAFER/VTI, and Sten Wandel, Lund University and Ulf Ehrning, Volvo. The project leader was Helena Kyster-Hansen, Tetraplan.
The project group members have actively participated in the development of the roadmap report. The reference group has taken part in four different workshops during the project and provided valuable input. The work has been conducted in close collaboration with the project roadmap for HCT-rail and two joint workshops have been held.
When work on the roadmap is now completed, we note that the image of the HCT's potential was further reinforced. With the widespread introduction of HCT, a number of positive effects will be achieved - more efficient use of road infrastructure, reducing the need for investment to improve road and rail capacity, lower transport costs, reduced energy consumption and significant reductions in CO2 emissions and other emissions.
The introduction of HCT-road requires the development of HCT-vehicles, customizing the infrastructure to cope with HCT-vehicles, the adaptation of legislation and regulations, and systems for monitoring compliance. The relatively limited one-time investments needed to adapt infrastructure to HCT vehicles are expected to be economically very profitable.
Overall, HCT contributes to the necessary shift in trend of transport in terms of energy use and greenhouse gas emissions, while helping to strengthen the Swedish business community and its competitiveness.
A successful implementation will require continuing and major demonstration projects to provide in-depth knowledge and experience of HCT, as it is a relatively new concept in the field of transport. It also requires in-depth market analysis and a proactive approach in the development of regulations. Research is also needed, especially in the field of road safety, in support of a progressive and successful introduction of HCT as an integral part of the whole transport system. Finally, it is of utmost importance that the next steps of the development and implementation are done in close cooperation with all relevant actors and stakeholders. Gothenburg 10 April 2013
Jerker Sjögren
Program Manager
CLOSER
Lindholmen Science Park
7
1 Summary
Freight transport is the circulation system of society’s lifeblood. Shipments move raw materials and semi-finished goods between production sites in the processing chain, finished goods to stores and the consumer’s home, and finally re-enter the recycled materials into the cycle. A healthy circulatory system is essential for a healthy economy with good competitiveness and it is vital to avoid clogging the arteries. Logistic costs, i.e. the costs of transportation, handling and storage, accounts for about 8-10 percent of Sweden's total value added (GDP) of which almost half is transportation. Logistic costs as a proportion of value added varies considerably between sectors of society and is low for the services sector, 20 percent in industry, 36 percent of trade and about 50 percent for primary industry. This shows that effective transportation and low transportation costs are especially important for the international competitiveness in the primary industry, as well as for the regions that have a larger proportion of logistics enterprises than average. Maritime, air and rail transport dominate the long distance arteries, while road transport dominates in the small mesh that reaches out to society's smallest cells in the form of building sites, gravel pits, mines and timber. Sweden is a long narrow peninsula where 75 percent is sparsely populated, 1,000 km from the centre of Europe and also highly dependent on international trade. This has led to the distances between the nodes in the value chains are 3-4 times longer than that of our competitors on the European continent. Cost-efficient transportation with high degree of consolidation of goods to large transport units and concentration of flows to a small number of arteries and nodes is therefore particularly important for Sweden. Conditions are similar in Finland, Australia and Canada, which explains these countries’ long passion for High Capacity Transports (HCT) on both road and rail.
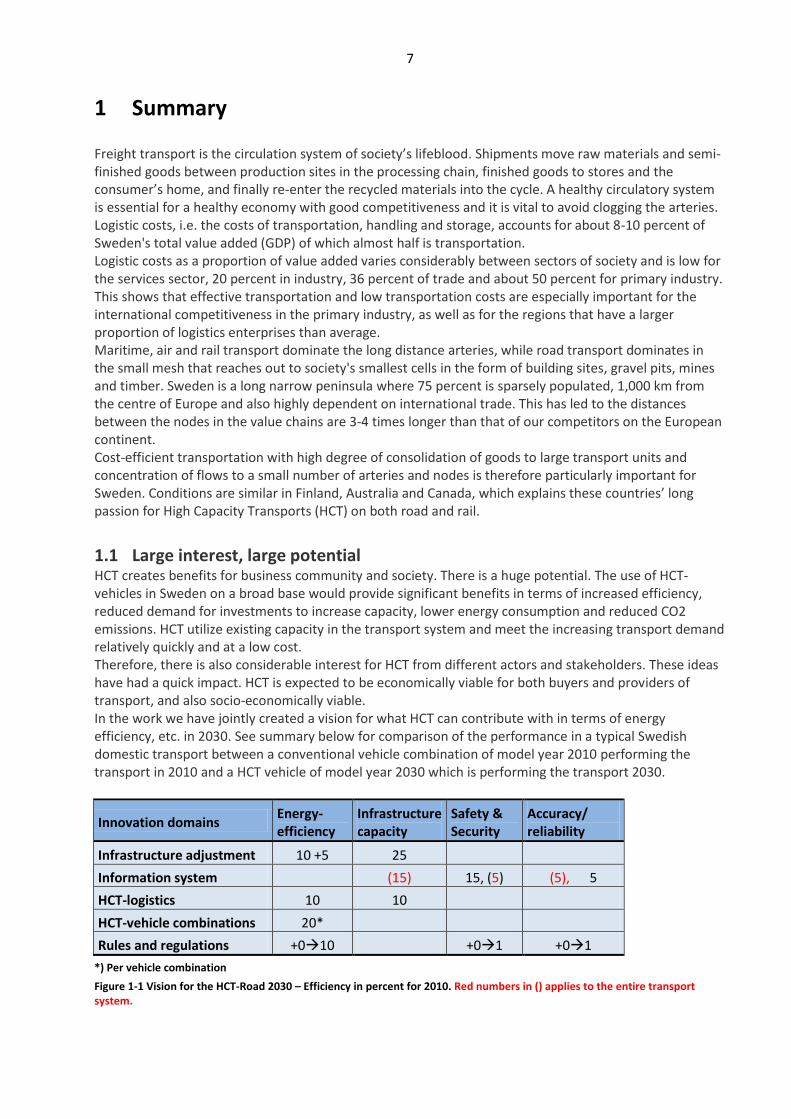
1.1 Large interest, large potential HCT creates benefits for business community and society. There is a huge potential. The use of HCT-vehicles in Sweden on a broad base would provide significant benefits in terms of increased efficiency, reduced demand for investments to increase capacity, lower energy consumption and reduced CO2 emissions. HCT utilize existing capacity in the transport system and meet the increasing transport demand relatively quickly and at a low cost. Therefore, there is also considerable interest for HCT from different actors and stakeholders. These ideas have had a quick impact. HCT is expected to be economically viable for both buyers and providers of transport, and also socio-economically viable. In the work we have jointly created a vision for what HCT can contribute with in terms of energy efficiency, etc. in 2030. See summary below for comparison of the performance in a typical Swedish domestic transport between a conventional vehicle combination of model year 2010 performing the transport in 2010 and a HCT vehicle of model year 2030 which is performing the transport 2030.
Innovation domains Energy-efficiency
Infrastructure capacity
Safety & Security
Accuracy/ reliability
Infrastructure adjustment 10 +5 25
Information system (15) 15, (5) (5), 5
HCT-logistics 10 10
HCT-vehicle combinations 20*
Rules and regulations +010 +01 +01
*) Per vehicle combination
Figure 1-1 Vision for the HCT-Road 2030 – Efficiency in percent for 2010. Red numbers in () applies to the entire transport system.
8
The roadmap states that there is a large interest in HCT and that there is a significant potential. The first proposed steps of HCT introduction is clearly very profitable from a socio-economically point of view. But the knowledge of HCT is inadequate at the moment and the actors and stakeholders knowledge is limited in the areas:
The market for HCT-transport
Attitudes of the general public; will additional long and/or heavy vehicle combinations be accepted?
The risk of rail transport competitiveness being adversely affected if the HCT-transport becomes
attractive
The extent to which different rules need to change to support the implementation of HCT
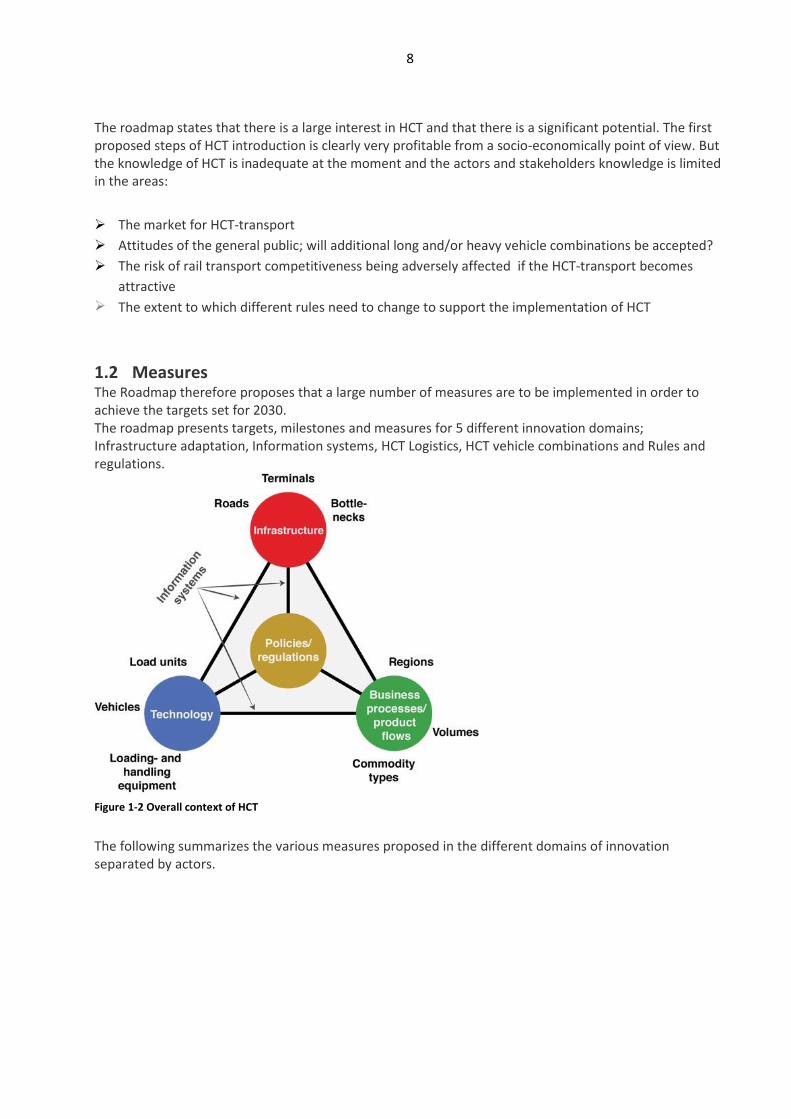
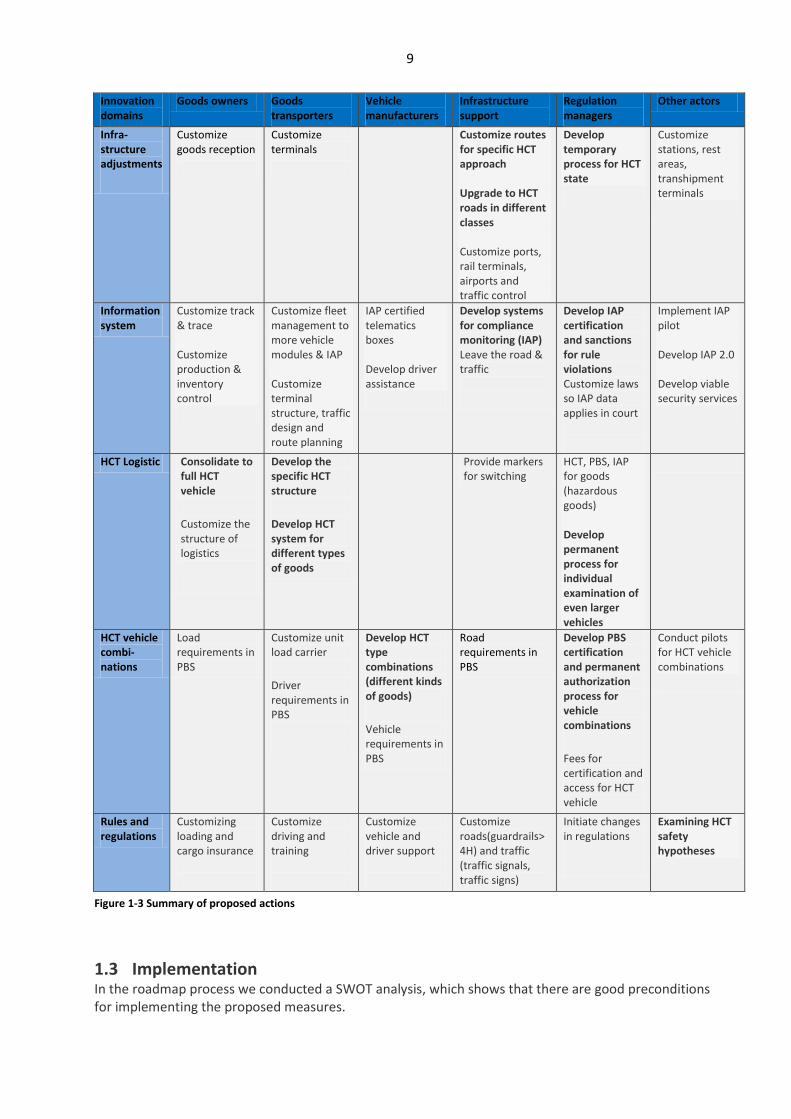
1.2 Measures The Roadmap therefore proposes that a large number of measures are to be implemented in order to achieve the targets set for 2030. The roadmap presents targets, milestones and measures for 5 different innovation domains; Infrastructure adaptation, Information systems, HCT Logistics, HCT vehicle combinations and Rules and regulations.
Figure 1-2 Overall context of HCT
The following summarizes the various measures proposed in the different domains of innovation separated by actors.
9
Innovation domains
Goods owners Goods transporters
Vehicle manufacturers
Infrastructure support
Regulation managers
Other actors
Infra-structure adjustments
Customize goods reception
Customize terminals
Customize routes for specific HCT approach Upgrade to HCT roads in different classes Customize ports, rail terminals, airports and traffic control
Develop temporary process for HCT state
Customize stations, rest areas, transhipment terminals
Information system
Customize track & trace Customize production & inventory control
Customize fleet management to more vehicle modules & IAP Customize terminal structure, traffic design and route planning
IAP certified telematics boxes Develop driver assistance
Develop systems for compliance monitoring (IAP) Leave the road & traffic
Develop IAP certification and sanctions for rule violations Customize laws so IAP data applies in court
Implement IAP pilot Develop IAP 2.0 Develop viable security services
HCT Logistic Consolidate to full HCT vehicle
Customize the structure of logistics
Develop the specific HCT structure
Develop HCT system for different types of goods
Provide markers for switching
HCT, PBS, IAP for goods (hazardous goods) Develop permanent process for individual examination of even larger vehicles
HCT vehicle combi-nations
Load requirements in PBS
Customize unit load carrier
Driver requirements in PBS
Develop HCT type combinations (different kinds of goods)
Vehicle requirements in PBS
Road requirements in PBS
Develop PBS certification and permanent authorization process for vehicle combinations
Fees for certification and access for HCT vehicle
Conduct pilots for HCT vehicle combinations
Rules and regulations
Customizing loading and cargo insurance
Customize driving and training
Customize vehicle and driver support
Customize roads(guardrails> 4H) and traffic (traffic signals, traffic signs)
Initiate changes in regulations
Examining HCT safety hypotheses
Figure 1-3 Summary of proposed actions
1.3 Implementation In the roadmap process we conducted a SWOT analysis, which shows that there are good preconditions for implementing the proposed measures.
10
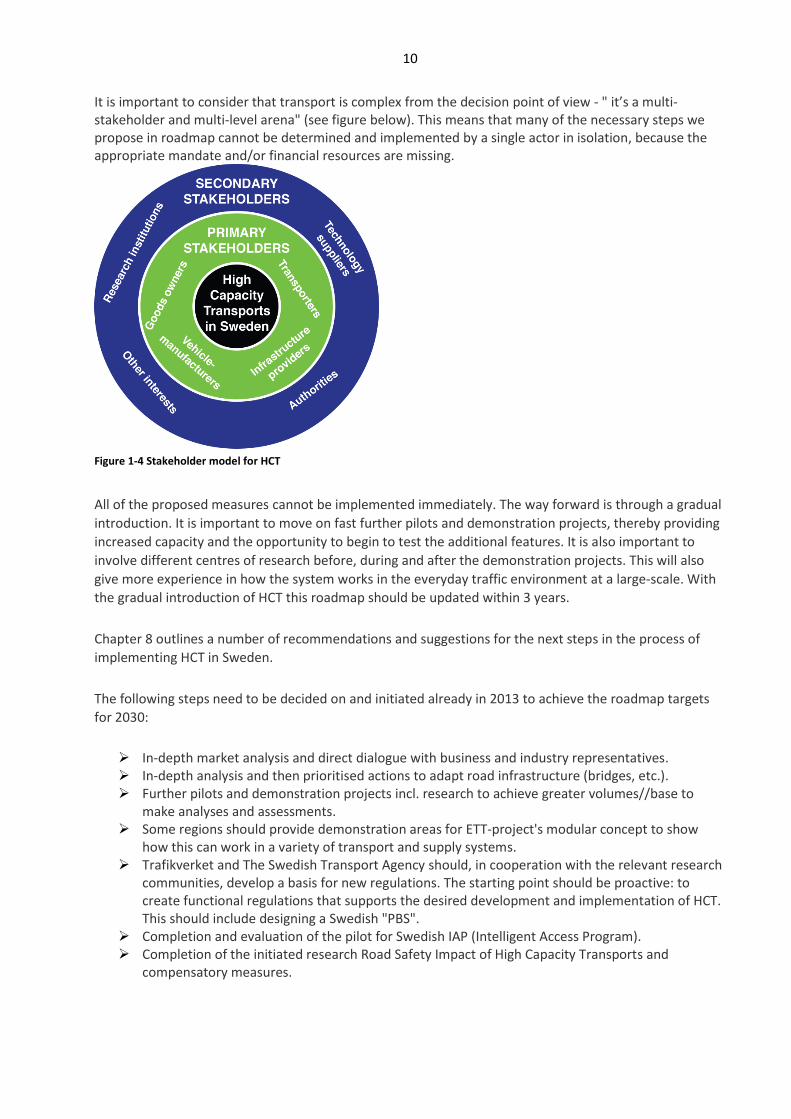
It is important to consider that transport is complex from the decision point of view - " it’s a multi-stakeholder and multi-level arena" (see figure below). This means that many of the necessary steps we propose in roadmap cannot be determined and implemented by a single actor in isolation, because the appropriate mandate and/or financial resources are missing.
Figure 1-4 Stakeholder model for HCT
All of the proposed measures cannot be implemented immediately. The way forward is through a gradual
introduction. It is important to move on fast further pilots and demonstration projects, thereby providing
increased capacity and the opportunity to begin to test the additional features. It is also important to
involve different centres of research before, during and after the demonstration projects. This will also
give more experience in how the system works in the everyday traffic environment at a large-scale. With
the gradual introduction of HCT this roadmap should be updated within 3 years.
Chapter 8 outlines a number of recommendations and suggestions for the next steps in the process of
implementing HCT in Sweden.
The following steps need to be decided on and initiated already in 2013 to achieve the roadmap targets
for 2030:
In-depth market analysis and direct dialogue with business and industry representatives. In-depth analysis and then prioritised actions to adapt road infrastructure (bridges, etc.). Further pilots and demonstration projects incl. research to achieve greater volumes//base to
make analyses and assessments. Some regions should provide demonstration areas for ETT-project's modular concept to show
how this can work in a variety of transport and supply systems. Trafikverket and The Swedish Transport Agency should, in cooperation with the relevant research
communities, develop a basis for new regulations. The starting point should be proactive: to create functional regulations that supports the desired development and implementation of HCT. This should include designing a Swedish "PBS".
Completion and evaluation of the pilot for Swedish IAP (Intelligent Access Program). Completion of the initiated research Road Safety Impact of High Capacity Transports and
compensatory measures.
11
Focus simultaneously on the HCT-rail and the actions they propose. This counters the risk of (reversed) modal shift and creates favourable conditions for a bigger increase in intermodal transport.
This requires continuous dialogue and interaction between the actors, and the Forum must continuously
provide a platform for this collaboration. The introduction of HCT on a broad base is not a quick fix – it is a
long and complex processes.
The positive experience of the initiated cooperation with Australia should be taken to the full. An
prioritised and close cooperation with the EU, the OECD and others. International forums are also
important for the Swedish ideas and suggestions to have an impact.
12
2 Introduction
2.1 Background and rationale The Swedish transport system is under pressure. It competes for public funding with other public areas such as schools, health care, while it is dominated by four major problems - energy, climate change, lack of capacity and safety for people, animals and goods. In addition there is a lack of knowledge and different views about in which way the various parts of the transport systems should contribute to overcome these problems. The transport sector is facing a major challenge to reduce energy consumption and limit environmental impact, both in relation to carbon dioxide emissions and emissions of regulated emissions (NOx, CO, HC and PM). The transport sector is the only sector of society that has not yet succeeded in finding a potent tool to reverse the trend of increasing carbon emissions and energy use. Although the potential to limit carbon dioxide emissions by transferring between modes is significant, the potential for improving the efficiency of transport is much higher within each mode. A problem here is that it requires investment in rail infrastructure to allow for transfers and it is expensive to reduce carbon emissions through the development of the railway infrastructure. The public infrastructure is already heavily congested. The situation will be further intensified if the long-term forecasts of traffic demand become reality. Compared with the railway system, the road transport only has few capacity constraints. High Capacity Transports (HCT) refers to the introduction of vehicles with higher capacity (longer and heavier or with higher volume) than what is currently used. Such vehicles imply that existing infrastructure capacity is used more rationally. This also reduces the need for investment in new infrastructure. HCT also means increased productivity, lower energy consumption per tonnes-km/person-km and lower emissions, especially carbon dioxide. The focus of this roadmap is HCT for transportation of goods by road. HCT has significant potential to streamline the road transport and reduce environmental impact, and at the same time HCT can strengthening Swedish competitiveness and be a future export area for the Swedish automotive industry.
2.2 Implementation of the work CLOSER received the mandate from the Forum in mid-August 2012, which gave us until the spring of 2013 to prepare a roadmap for the HCT Road. Since CLOSER has been working on the issues of the HCT under an FOI program initiated by Trafikverket in 2011, it was natural to build on the work undertaken. Among other things, we have been able to take advantage of a feasibility study on the market for HCT started in 2012 and also the University of Lund´s work on a pilot of an IAP system for Sweden. Part of the existing program group became the project group for the roadmap work. Others became the backbone of a reference group, which was supplemented by a number of individuals from the business community and society. The project group included Per-Olof Arnäs, Chalmers; Thomas Asp, Trafikverket; Anders Berger, Volvo; Fredrik Börjesson, Schenker; Niklas Fogdestam, Skogforsk; Anders Johnson, Scania, Sten Wandel, Lund University and Ulf Ehrning, Volvo. Jerker Sjögren, program manager for CLOSER, has been the Process Leader and Helena Kyster-Hansen, consultant from Tetraplan A/S, Project Manager. The set-up of our work has been to carry out 8 (4 x 2) workshops as a process where the project team and the larger reference group gradually developed a concrete plan of action by discussions on the potential and challenges for achieving the targets set for 2030.
13
Two of these workshops have been organized with the HCT-railway to facilitate integrated and coordinated results from the process of both roadmaps. To obtain a preliminary assessment of the socio-economic benefits of HCT, we have in the final stages of the work commissioned consultancy WSP for a limited effort.
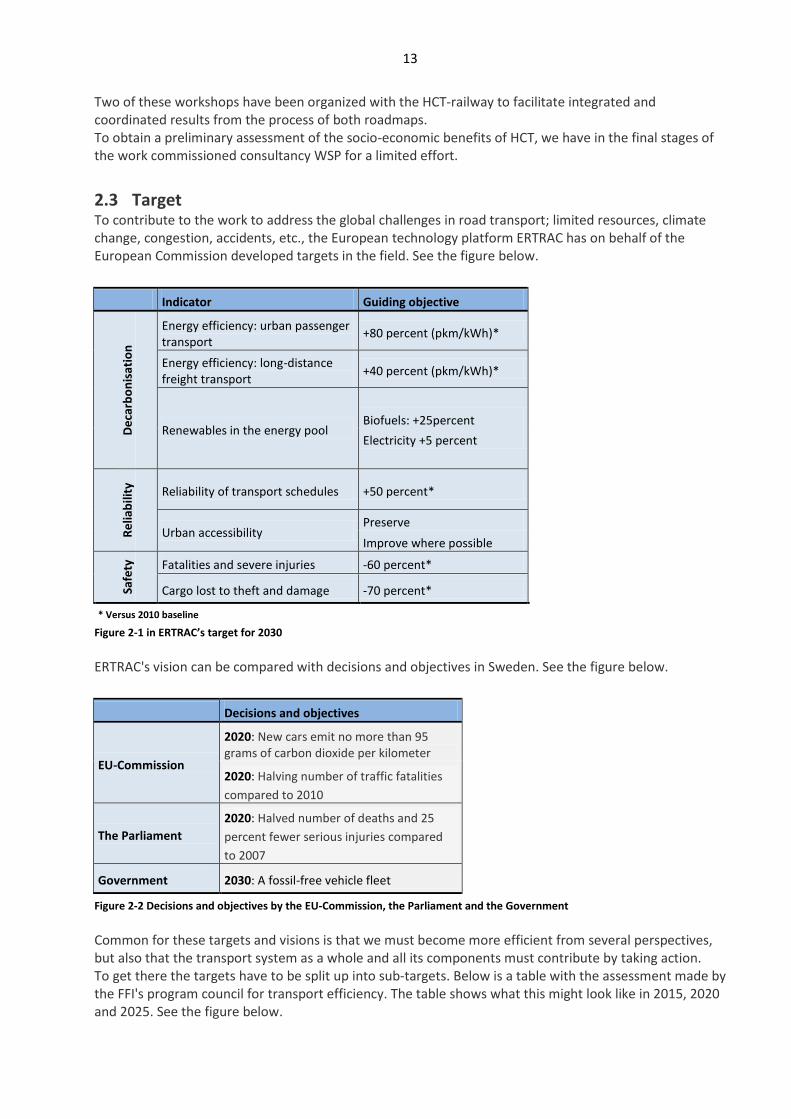
2.3 Target To contribute to the work to address the global challenges in road transport; limited resources, climate change, congestion, accidents, etc., the European technology platform ERTRAC has on behalf of the European Commission developed targets in the field. See the figure below.
Indicator Guiding objective
De
carb
on
isat
ion
Energy efficiency: urban passenger transport
+80 percent (pkm/kWh)*
Energy efficiency: long-distance freight transport
+40 percent (pkm/kWh)*
Renewables in the energy pool Biofuels: +25percent
Electricity +5 percent
Re
liab
ility
Reliability of transport schedules +50 percent*
Urban accessibility Preserve
Improve where possible
Safe
ty
Fatalities and severe injuries -60 percent*
Cargo lost to theft and damage -70 percent*
* Versus 2010 baseline
Figure 2-1 in ERTRAC’s target for 2030
ERTRAC's vision can be compared with decisions and objectives in Sweden. See the figure below.
Decisions and objectives
EU-Commission
2020: New cars emit no more than 95 grams of carbon dioxide per kilometer
2020: Halving number of traffic fatalities
compared to 2010
The Parliament
2020: Halved number of deaths and 25
percent fewer serious injuries compared
to 2007
Government 2030: A fossil-free vehicle fleet
Figure 2-2 Decisions and objectives by the EU-Commission, the Parliament and the Government
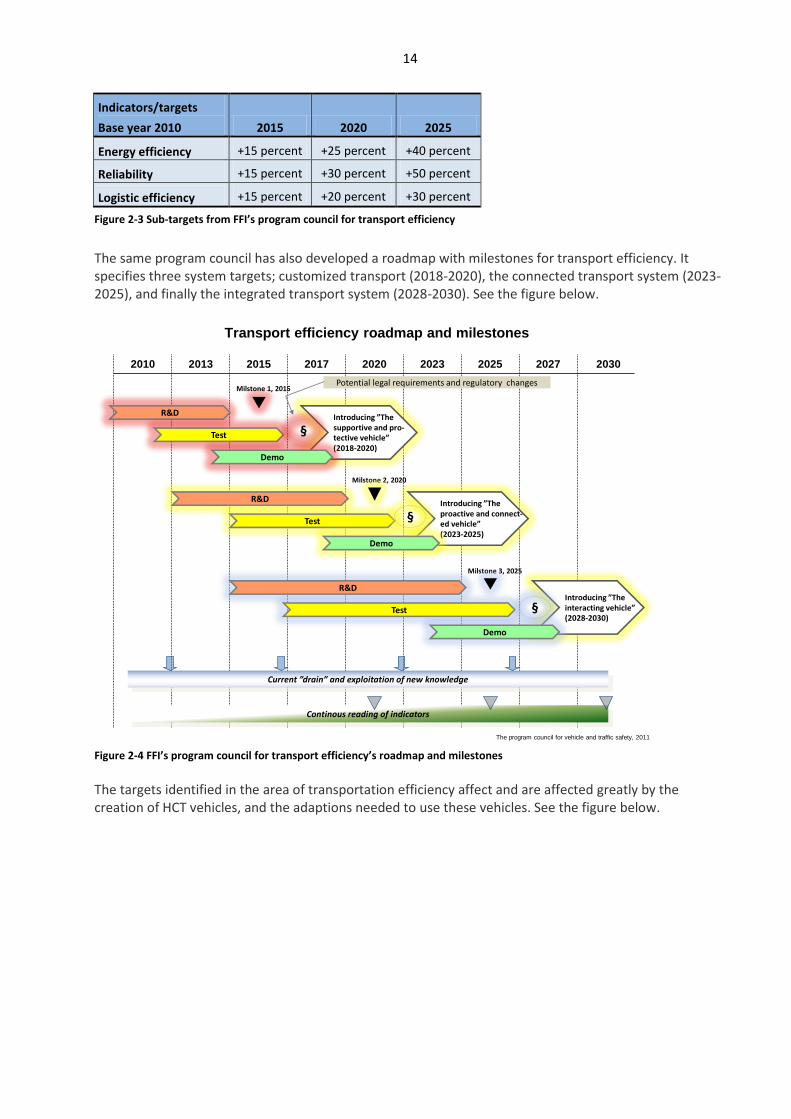
Common for these targets and visions is that we must become more efficient from several perspectives, but also that the transport system as a whole and all its components must contribute by taking action. To get there the targets have to be split up into sub-targets. Below is a table with the assessment made by the FFI's program council for transport efficiency. The table shows what this might look like in 2015, 2020 and 2025. See the figure below.
14
Indicators/targets
Base year 2010 2015 2020 2025
Energy efficiency +15 percent +25 percent +40 percent
Reliability +15 percent +30 percent +50 percent
Logistic efficiency +15 percent +20 percent +30 percent
Figure 2-3 Sub-targets from FFI’s program council for transport efficiency
The same program council has also developed a roadmap with milestones for transport efficiency. It specifies three system targets; customized transport (2018-2020), the connected transport system (2023-2025), and finally the integrated transport system (2028-2030). See the figure below.
2010 2013 2015 2017 2020 2023 2025 2027
Transport efficiency roadmap and milestones
The program council for vehicle and traffic safety, 2011
2030
Introducing ”Theinteracting vehicle”(2028-2030)
Introducing ”Thesupportive and pro-tective vehicle”(2018-2020)
Introducing ”Theproactive and connect-ed vehicle”(2023-2025)
R&D
Test
Demo
R&D
Test
Demo
R&D
Test
Demo
§
§
§
Milstone 1, 2015
Milstone 2, 2020
Milstone 3, 2025
Potential legal requirements and regulatory changes
Current ”drain” and exploitation of new knowledge
Continous reading of indicators
Figure 2-4 FFI’s program council for transport efficiency’s roadmap and milestones
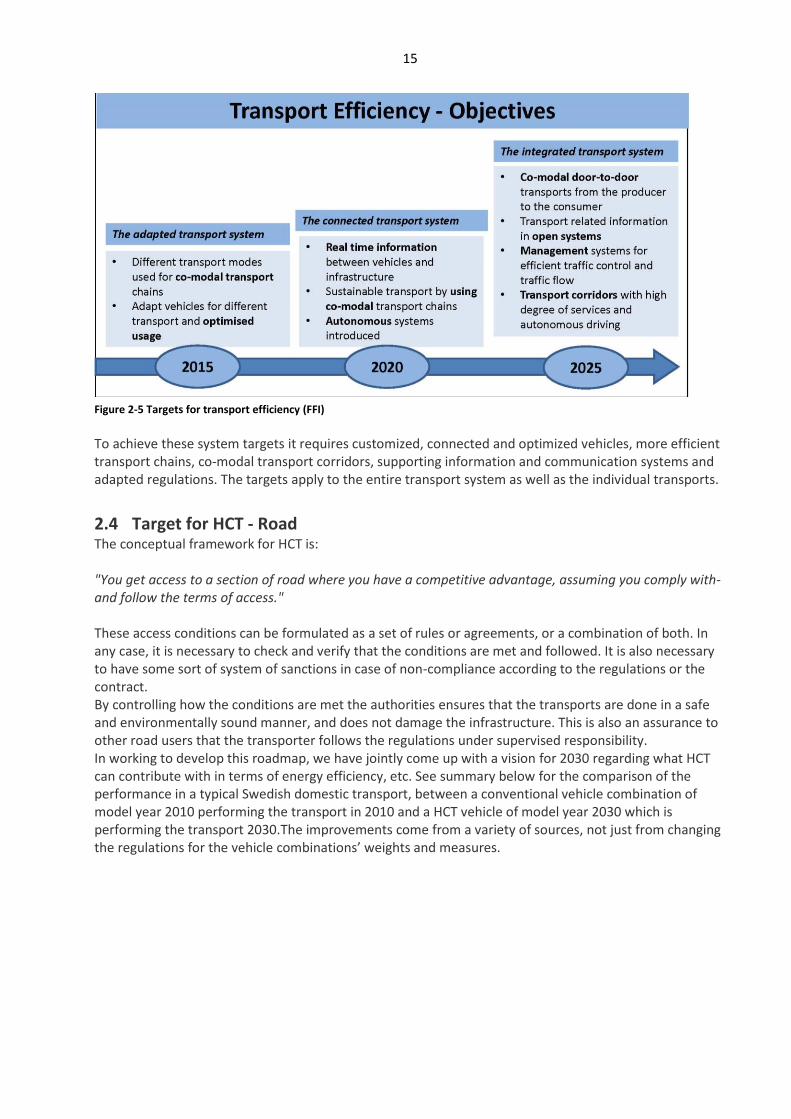
The targets identified in the area of transportation efficiency affect and are affected greatly by the creation of HCT vehicles, and the adaptions needed to use these vehicles. See the figure below.
15
Figure 2-5 Targets for transport efficiency (FFI)
To achieve these system targets it requires customized, connected and optimized vehicles, more efficient transport chains, co-modal transport corridors, supporting information and communication systems and adapted regulations. The targets apply to the entire transport system as well as the individual transports.
2.4 Target for HCT - Road The conceptual framework for HCT is: "You get access to a section of road where you have a competitive advantage, assuming you comply with- and follow the terms of access." These access conditions can be formulated as a set of rules or agreements, or a combination of both. In any case, it is necessary to check and verify that the conditions are met and followed. It is also necessary to have some sort of system of sanctions in case of non-compliance according to the regulations or the contract. By controlling how the conditions are met the authorities ensures that the transports are done in a safe and environmentally sound manner, and does not damage the infrastructure. This is also an assurance to other road users that the transporter follows the regulations under supervised responsibility. In working to develop this roadmap, we have jointly come up with a vision for 2030 regarding what HCT can contribute with in terms of energy efficiency, etc. See summary below for the comparison of the performance in a typical Swedish domestic transport, between a conventional vehicle combination of model year 2010 performing the transport in 2010 and a HCT vehicle of model year 2030 which is performing the transport 2030.The improvements come from a variety of sources, not just from changing the regulations for the vehicle combinations’ weights and measures.
16
Innovation domains Energy efficiency
Infrastructure capacity
Safety & Security
Accuracy/Reliability
Infrastructure adjustment 10 +5 25
Information system (15) 15, (5) (5), 5
HCT-logistics 10 10
HCT-vehicle combination 20*)
Regulations +010 +01 +01
*) Per vehicle combination
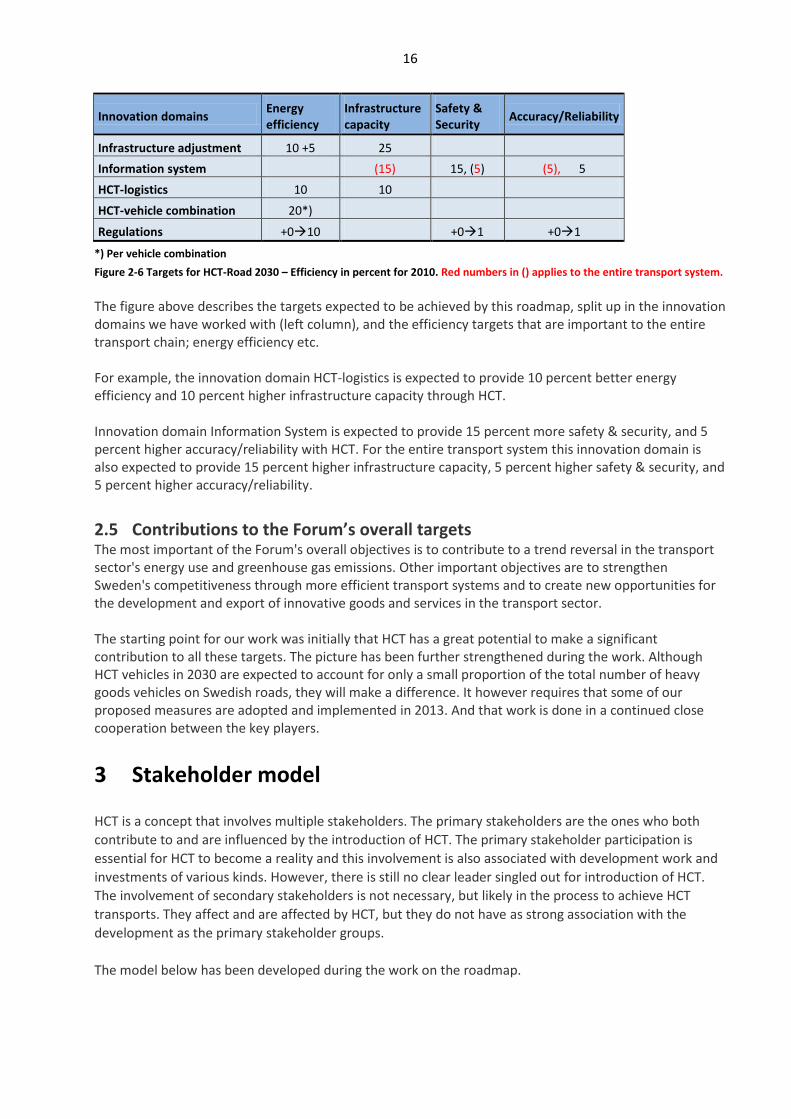
Figure 2-6 Targets for HCT-Road 2030 – Efficiency in percent for 2010. Red numbers in () applies to the entire transport system.
The figure above describes the targets expected to be achieved by this roadmap, split up in the innovation domains we have worked with (left column), and the efficiency targets that are important to the entire transport chain; energy efficiency etc. For example, the innovation domain HCT-logistics is expected to provide 10 percent better energy efficiency and 10 percent higher infrastructure capacity through HCT. Innovation domain Information System is expected to provide 15 percent more safety & security, and 5 percent higher accuracy/reliability with HCT. For the entire transport system this innovation domain is also expected to provide 15 percent higher infrastructure capacity, 5 percent higher safety & security, and 5 percent higher accuracy/reliability.
2.5 Contributions to the Forum’s overall targets The most important of the Forum's overall objectives is to contribute to a trend reversal in the transport sector's energy use and greenhouse gas emissions. Other important objectives are to strengthen Sweden's competitiveness through more efficient transport systems and to create new opportunities for the development and export of innovative goods and services in the transport sector. The starting point for our work was initially that HCT has a great potential to make a significant contribution to all these targets. The picture has been further strengthened during the work. Although HCT vehicles in 2030 are expected to account for only a small proportion of the total number of heavy goods vehicles on Swedish roads, they will make a difference. It however requires that some of our proposed measures are adopted and implemented in 2013. And that work is done in a continued close cooperation between the key players.
3 Stakeholder model
HCT is a concept that involves multiple stakeholders. The primary stakeholders are the ones who both
contribute to and are influenced by the introduction of HCT. The primary stakeholder participation is
essential for HCT to become a reality and this involvement is also associated with development work and
investments of various kinds. However, there is still no clear leader singled out for introduction of HCT.
The involvement of secondary stakeholders is not necessary, but likely in the process to achieve HCT
transports. They affect and are affected by HCT, but they do not have as strong association with the
development as the primary stakeholder groups.
The model below has been developed during the work on the roadmap.
17
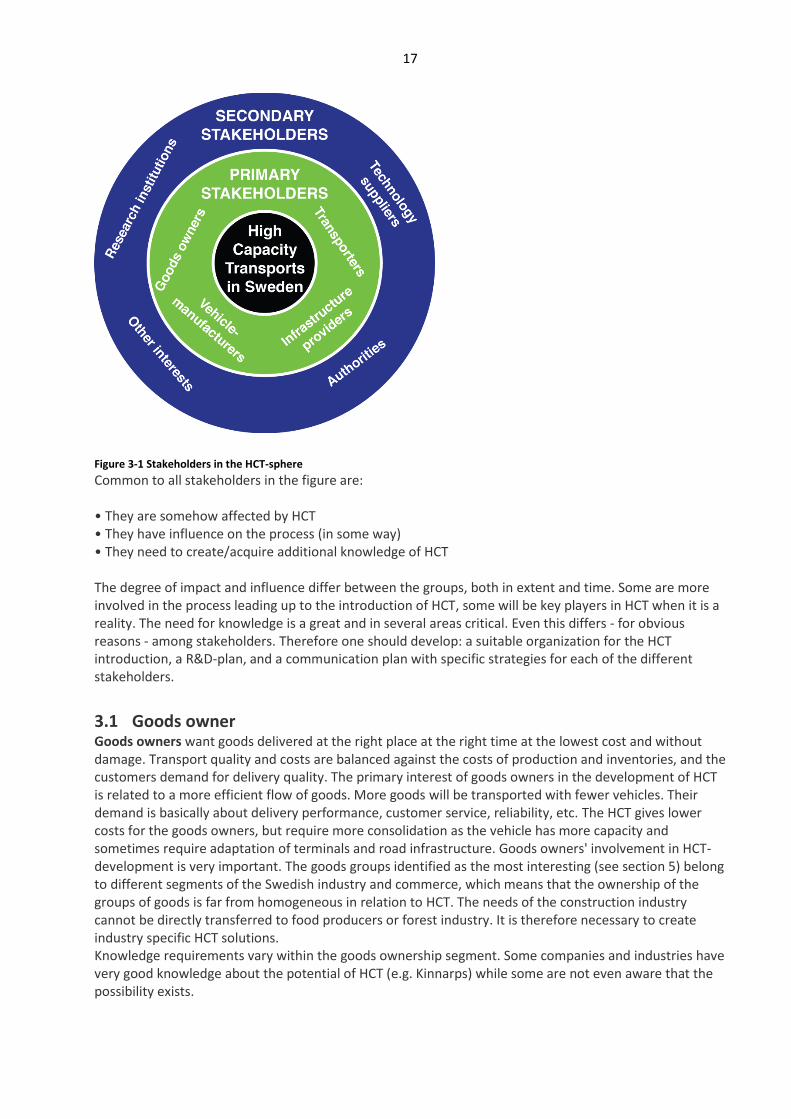
Figure 3-1 Stakeholders in the HCT-sphere
Common to all stakeholders in the figure are: • They are somehow affected by HCT • They have influence on the process (in some way) • They need to create/acquire additional knowledge of HCT The degree of impact and influence differ between the groups, both in extent and time. Some are more involved in the process leading up to the introduction of HCT, some will be key players in HCT when it is a reality. The need for knowledge is a great and in several areas critical. Even this differs - for obvious reasons - among stakeholders. Therefore one should develop: a suitable organization for the HCT introduction, a R&D-plan, and a communication plan with specific strategies for each of the different stakeholders.
3.1 Goods owner Goods owners want goods delivered at the right place at the right time at the lowest cost and without damage. Transport quality and costs are balanced against the costs of production and inventories, and the customers demand for delivery quality. The primary interest of goods owners in the development of HCT is related to a more efficient flow of goods. More goods will be transported with fewer vehicles. Their demand is basically about delivery performance, customer service, reliability, etc. The HCT gives lower costs for the goods owners, but require more consolidation as the vehicle has more capacity and sometimes require adaptation of terminals and road infrastructure. Goods owners' involvement in HCT-development is very important. The goods groups identified as the most interesting (see section 5) belong to different segments of the Swedish industry and commerce, which means that the ownership of the groups of goods is far from homogeneous in relation to HCT. The needs of the construction industry cannot be directly transferred to food producers or forest industry. It is therefore necessary to create industry specific HCT solutions. Knowledge requirements vary within the goods ownership segment. Some companies and industries have very good knowledge about the potential of HCT (e.g. Kinnarps) while some are not even aware that the possibility exists.
18
3.2 Transporters The transport industry develops and produces efficient transportation for the goods owners, which is adapted to the rules of the infrastructure owner. In many cases, the transporters are reactive, i.e. the transport demand generated is outside the company, by the goods owners. This means that the transporters have limited control over which goods are to be transported and to where. This stakeholder group is, like the goods owners, heterogeneous. Different goods types differ in terms of transport distances, volumes, handling and more. For example, transporters of filling have very little in common with a network operator in general cargo. The transport industry’s participation in the HCT project is crucial. The development will demand investment, process changes and, hopefully, bring increases in efficiency. The need for knowledge in the transportation sector concerning HCT is great. The rules of the game are changing and the business models have to be adapted. Investment in HCT vehicles compared to conventional vehicles reduces cost per tonnes-km, but requires adaptation of terminals, networks, administration and fleet management.
3.3 Vehicle Manufacturers This group includes both vehicle manufacturers, their suppliers and producers of trailers and accessories. Some of the ICT providers also belong to this group (e.g. suppliers of IAP system). The group develops and produces efficient vehicles and related services that are adapted to the infrastructure and regulatory conditions and contributes to the transporters’ and goods owners' profitability. Their involvement is characterized by technological development of vehicles combinations and their components. Production and sales of HCT-vehicles for the Swedish market supports increased exports of HCT vehicles and encourage innovation and further development of all types of vehicles. There are significant technical challenges in HCT and the need for knowledge is great. The group’s participation is crucial for HCT to become reality.
3.4 Infrastructure owners Infrastructure owners develop and provide infrastructure and related services such as traffic management and collection of fees. Common for them is that they manage different types of infrastructure that can be of interest for HCT. The group includes Trafikverket and also smaller players like municipalities and private interests. The infrastructure is primarily roads, but also terminals, gateways, etc. are included. For the infrastructure owner, it is important that the infrastructure is used efficiently, e.g. maximizing the use of road capacity, high road safety, low road wear etc. HCT-transport causes changes in impacts on the infrastructure and it's infrastructure owners task to deal with these changes. It will require both upgrades of bearing capacity and adaptations, including longer lanes before rail crossings. The cost of the upgrades must be balanced against the cost reductions made by HCT, e.g. reduction in traffic, which gives less congestion and reduce the need for investment in capacity or that they reduce the road wear and therefore reduces the costs of maintenance. There is a huge need for knowledge, for example in terms of the pace and scale of the transition to HCT, traffic impacts and other long-term effects of large-scale introduction of HCT-vehicles.
3.5 Secondary stakeholders The secondary stakeholders contribute indirectly to the HCT development by providing the conditions or by being subcontractors to the primary stakeholders. The regulator/supervisor ensures that laws and regulations are followed. An important aspect here is the handling of permits for HCT, which currently takes very long time and is very bureaucratic. Research organizations include both funders and providers of research, development and innovation, whether it is in business, government or universities/colleges. Although the roadmap shows that, based on the knowledge we already have, the introduction of HCT vehicles should begin immediately, it also points out that there is need for R&D for the future development and roll out of the HCT.
19
ICT suppliers are an important supplier group for all the primary stakeholders. They often develop new services before the vehicle manufacturers and the other primary stakeholders. The development of digital support systems and ITS services for the transport sector is moving very fast. Other special interests are also very important in the democratic process. There are many vested interests that are both affected by and affect the development of HCT. It is important that these are included in the process and that their knowledge can be developed in dialogue with other stakeholders. In relation to this there will be a support system which governs and facilitates processes within and between stakeholders. The components of the support system are: Regulations in the form of laws and regulations. These are prepared and decided by political bodies and authorities. The regulators then ensure that these are followed. It requires changes in the regulatory environment, both for permission to use of HCT vehicles and also to monitor if the conditions are met. The latter is important because HCT vehicles can severely damage infrastructure or a third party if they are used in places or ways not permitted or outside allowed time slots. Information systems collect, transmit, store and process the data within and between all of the transport systems parts and modules, and presents information to all operators in the system. HCT requires vehicle information systems (GPS boxes for monitoring HCT compliance, driver support and connections between the vehicles combinations’ parts for e.g. brakes and ID), the road’s information system (where and when certain types of HCT vehicles may be driven, communication to the infrastructure (I2V) and between vehicles (V2V)), the transporters’ Fleet Management System (FMS) and the goods owner's or agent's consolidation systems. These systems provided by IT, telematics and telecommunications companies that develop them in close cooperation with the stakeholders mentioned above. The development of digital information and communication technology is moving very quickly and expected for many years to follow Moore's Law, which broadly states a doubling of cost efficiency every two years.
4 The need and demand for HCT
Generally speaking, the development of HCT can be made according to two principles: top-down or
bottom-up.
Top-down means that any system-wide operator, such as an infrastructure manager, upgrades some of
the infrastructure for HCT vehicles. This may involve strengthening bridges, ramps and other road
sections, or to widen roads and otherwise improving accessibility. A top-down approach does not aim to
introduce HCT in a single relationship, but rather upgrade the infrastructure to a new level of
functionality.
Bottom-up means that one or more stakeholders identify flows that could be upgraded by using the HCT.
The potential infrastructural change required will then be based on the individual needs of these
stakeholders.
In both cases, one must take into account the problems of "First & last mile" – how the vehicle gets to and
from the HCT network from the starting point or endpoint, being the individual worksite, terminal or port.
Even without the need for digital surveillance (such as IAP, see section 5.2) of the HCT road network,
there will still be need for some form of monitoring in vulnerable areas.
With reference to the stakeholder model presented in Section 3, there are different motives, incentives
and methods for the introduction of HCT between the stakeholders. The four identified groups – goods
owners, transporters, vehicle manufacturers and infrastructure owners - have different perspectives on
the HCT. Below these four perspectives are described briefly.
20
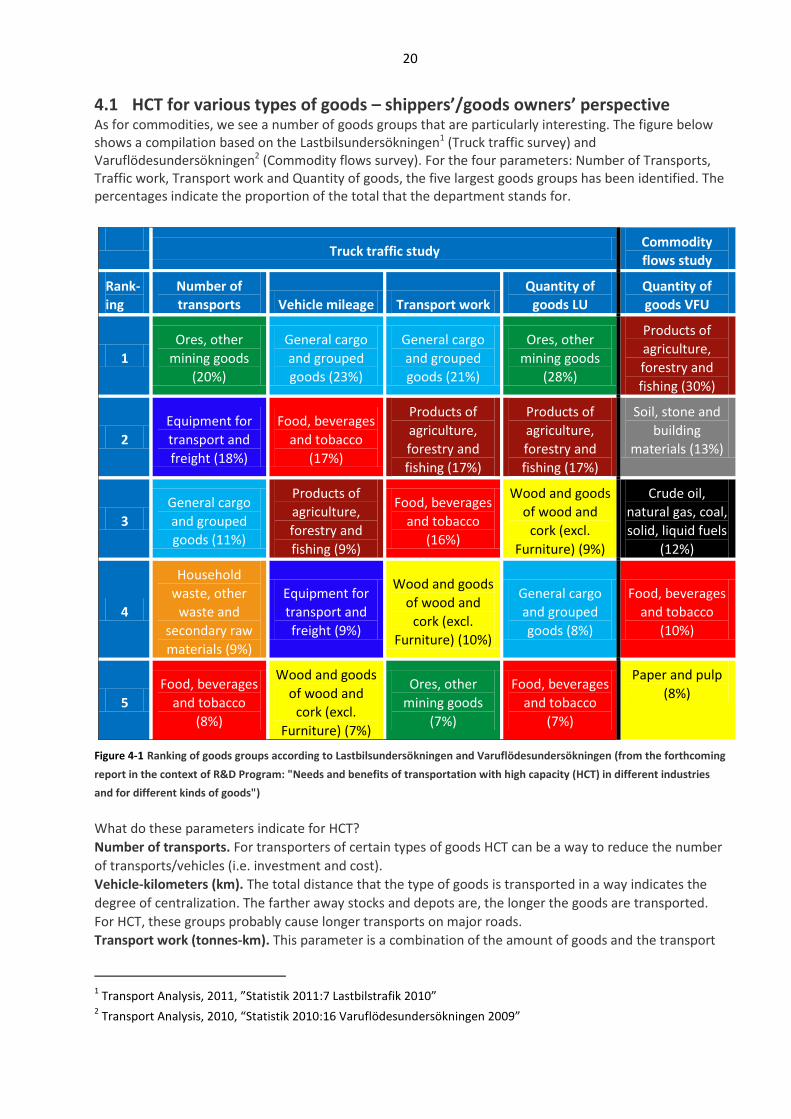
4.1 HCT for various types of goods – shippers’/goods owners’ perspective As for commodities, we see a number of goods groups that are particularly interesting. The figure below shows a compilation based on the Lastbilsundersökningen1 (Truck traffic survey) and Varuflödesundersökningen2 (Commodity flows survey). For the four parameters: Number of Transports, Traffic work, Transport work and Quantity of goods, the five largest goods groups has been identified. The percentages indicate the proportion of the total that the department stands for.
Truck traffic study
Commodity
flows study
Rank-
ing
Number of
transports Vehicle mileage Transport work
Quantity of
goods LU
Quantity of
goods VFU
1
Ores, other
mining goods
(20%)
General cargo
and grouped
goods (23%)
General cargo
and grouped
goods (21%)
Ores, other
mining goods
(28%)
Products of
agriculture,
forestry and
fishing (30%)
2
Equipment for
transport and
freight (18%)
Food, beverages
and tobacco
(17%)
Products of
agriculture,
forestry and
fishing (17%)
Products of
agriculture,
forestry and
fishing (17%)
Soil, stone and
building
materials (13%)
3
General cargo
and grouped
goods (11%)
Products of
agriculture,
forestry and
fishing (9%)
Food, beverages
and tobacco
(16%)
Wood and goods
of wood and
cork (excl.
Furniture) (9%)
Crude oil,
natural gas, coal,
solid, liquid fuels
(12%)
4
Household
waste, other
waste and
secondary raw
materials (9%)
Equipment for
transport and
freight (9%)
Wood and goods
of wood and
cork (excl.
Furniture) (10%)
General cargo
and grouped
goods (8%)
Food, beverages
and tobacco
(10%)
5
Food, beverages
and tobacco
(8%)
Wood and goods
of wood and
cork (excl.
Furniture) (7%)
Ores, other
mining goods
(7%)
Food, beverages
and tobacco
(7%)
Paper and pulp
(8%)
Figure 4-1 Ranking of goods groups according to Lastbilsundersökningen and Varuflödesundersökningen (from the forthcoming
report in the context of R&D Program: "Needs and benefits of transportation with high capacity (HCT) in different industries
and for different kinds of goods")
What do these parameters indicate for HCT?
Number of transports. For transporters of certain types of goods HCT can be a way to reduce the number
of transports/vehicles (i.e. investment and cost).
Vehicle-kilometers (km). The total distance that the type of goods is transported in a way indicates the
degree of centralization. The farther away stocks and depots are, the longer the goods are transported.
For HCT, these groups probably cause longer transports on major roads.
Transport work (tonnes-km). This parameter is a combination of the amount of goods and the transport
1 Transport Analysis, 2011, ”Statistik 2011:7 Lastbilstrafik 2010”
2 Transport Analysis, 2010, “Statistik 2010:16 Varuflödesundersökningen 2009”
21
distance. The large transport work indicates that there is a great potential for HCT, both volume and
distance wise.
Quantity of goods (tonnes). The more goods available, the more profitable a HCT investment becomes to
a transporter (larger vehicles require more goods per relationship).
The major difference between Lastbilsundersökningen (LU) and Varuflödesundersökningen (VFU) relates
to different data collection methods and that the definition of the goods groups is not totally compatible.
For example, there is no counterpart to the placement of general cargo in VFU.
The goods groups identified possess different properties and can from a HCT perspective be described as: • General cargo and grouped goods are placed high regardless of the parameter being studied. These goods
belong to the transport sector. Large parts of the national flow of general cargo are handled by forwarding companies in large terminal networks. These operators are likely to have a significant potential to increase internal efficiency (transportation between terminals) using HCT.
Food, beverages and tobacco are, just like general cargo, responsible for a large share of the transport in the country - regardless the parameter. The low proportion of empty runs (even for general cargo) can be an indicator of a high degree of planning and control of flows and related activities. HCT vehicles could streamline this segment further, mainly due to the large volume of goods. This indicates that it is possible to identify sufficient flows on certain relations..
• The large amount of cargo belonging to Products of agriculture, forestry and fisheries, together with the high transport and traffic work and the relatively low amount of transports (7 percent of the transports) shows that transports are done by large vehicles with big loads that drives long distances. The fact that timber transports, which constitute the majority of the goods in the group, is suitable for HCT has already been proven in the ETT-project, but these transports are often on minor roads which can be a problem.
The group Wood and goods of wood and cork (except furniture) consist of large, long flows, in this case primarily of wood chips, paper and sawn timber. Again, minor roads can become relevant.
• Ores and other mining goods is dominated by fill material (soil, rock, sand). Vehicle mileage is low (short-range transports) which indicates that the road network used is probably local (often municipal). There is a great HCT potential here, especially if you look at the quantity of goods that despite the low mileage still generates 7 percent of the total transports.
4.2 Technical aspects of HCT – the vehicle manufacturer’s perspective In many parts of the world, such as Brazil, New Zealand, Australia, USA, Canada, Mexico and South Africa, they allow significantly longer and heavier vehicles than in Sweden on parts of the road network. These are classified with load capacity of 4 TEUs (30 meter and 60 to 86 tonnes), or 6 TEUs (up to 53,5 meters and from 62 to 126 tonnes). Several of these countries require these HCT vehicles to be certified after rigorous Performance Based Standards (PBS). Finland has the same weights and lengths as Sweden, but recently the Ministry of Transport has decided to increase the weight limit to 76 tonnes but still within 25.25 meters. A EU decision on the issue is awaited. For the past four years longer and heavier vehicle combinations (up to 30 to 32 m/90 tonnes) have been tested in Sweden, in order to allow for a stepwise increase to in size; step 1, 32 meters and 76 or 80 tonnes and step 2, 25.25 meters and 74 or 76 tonnes. What can HCT contribute with in this segment? Today there are a large number of HCT vehicles on the market outside Europe (see Ch. 11 Annex - International Outlook). It is still important to choose the vehicle with the right technical specification for the intended task and road network. Therefore among others the expected functional requirements (PBS) that affect the entire vehicle combination should be taken into account. This means that vehicle manufacturers and trailer manufacturers must cooperate more. Requirements relating to transport and
22
route monitoring (IAP) in real time and different access control for vehicles, goods, and even drivers, to get access to both road and enhanced service. This is based on a developed communication interface between vehicles, infrastructure and government and these systems are expected to be delivered from the factory and not be retrofitted. Furthermore, the development of HCT-vehicles will drive the development of innovative solutions to minimize impacts on infrastructure, such as by retractable axles, adapted driving (en- and disengaged) for various transport tasks and further development of driver support e.g. to be able to reverse with a combination of several trailers. HCT is the key driver in order to increasingly adapt a vehicle combination to its transport assignments, i.e. create more customized and efficient transports. This also has implications for the design and development of terminals and other supporting infrastructure used by HCT vehicles.
4.3 Traffic aspects of HCT – Infrastructure owner perspective The large flow of goods between the regions in the country is done on motorways. Today (2013) a number of trials including a duo-trailer is done on this type of road. The large number of conventional vehicles on these roads is a natural focus point for HCT. There are a number of barriers for HCT on the road today, mainly bridges and ramps, which limits accessibility for heavy vehicles over 60 tonnes. The length is an obstacle if there isn’t room for the vehicle combination before or after a rail or road crossing. Even areas at terminals, parking areas and turning areas must be adapted. Few drivers are capable of reversing a vehicle combination with two or more joints. Driver support or robot for reversing is an important support. Swipe when turning might be a problem in tight roundabouts especially if there are two lanes. However, with the small adaptions large parts of the main road network can handle HCT vehicles already now.
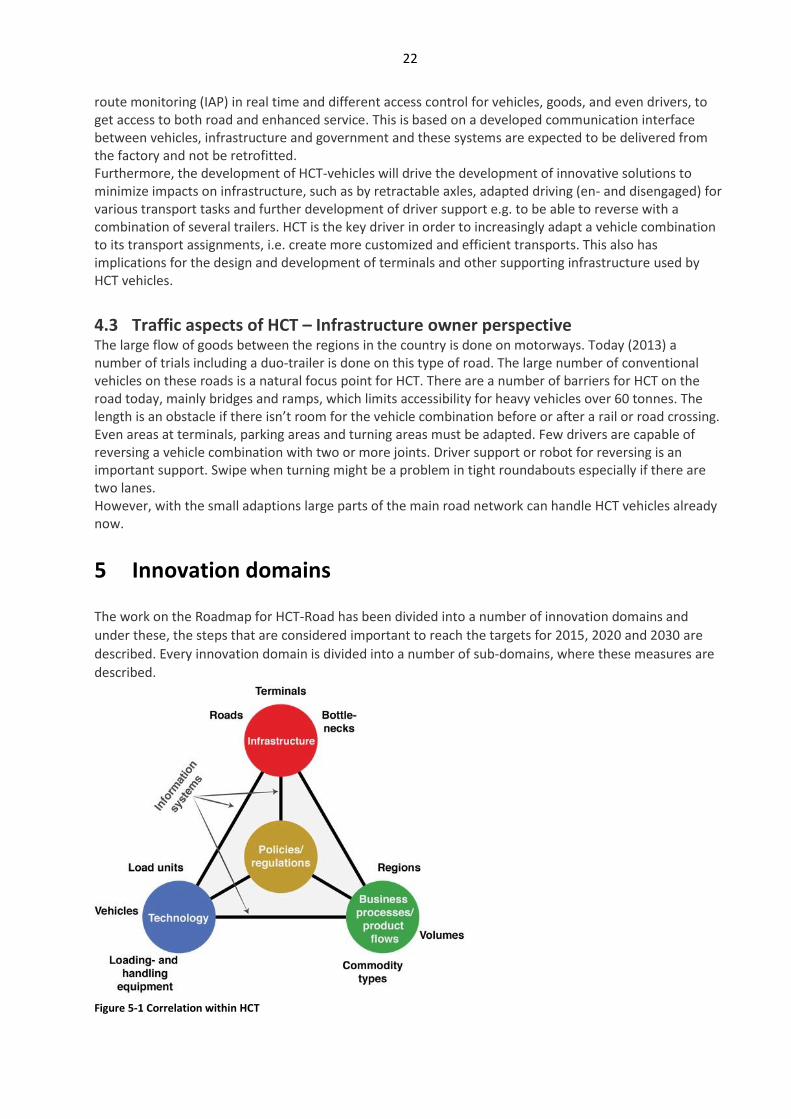
5 Innovation domains
The work on the Roadmap for HCT-Road has been divided into a number of innovation domains and
under these, the steps that are considered important to reach the targets for 2015, 2020 and 2030 are
described. Every innovation domain is divided into a number of sub-domains, where these measures are
described.
Figure 5-1 Correlation within HCT
23
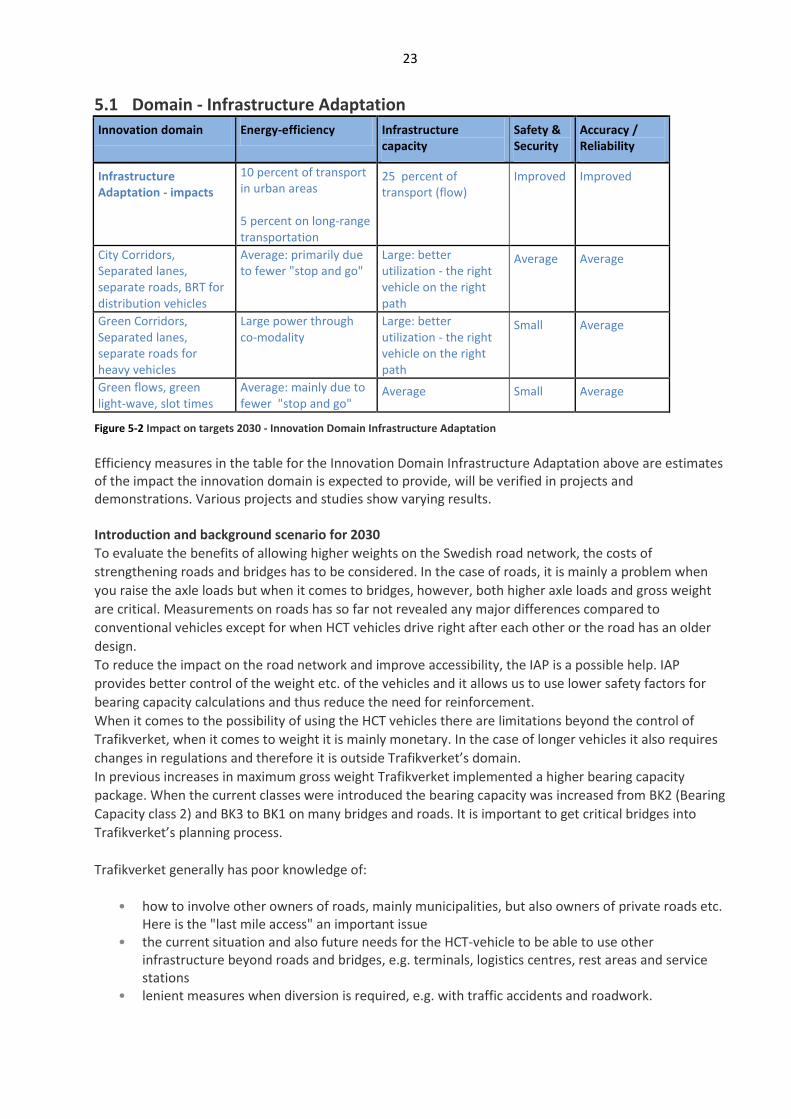
5.1 Domain - Infrastructure Adaptation
Innovation domain Energy-efficiency Infrastructure capacity
Safety & Security
Accuracy / Reliability
Infrastructure Adaptation - impacts
10 percent of transport in urban areas 5 percent on long-range transportation
25 percent of transport (flow)
Improved Improved
City Corridors, Separated lanes, separate roads, BRT for distribution vehicles
Average: primarily due to fewer "stop and go"
Large: better utilization - the right vehicle on the right path
Average Average
Green Corridors, Separated lanes, separate roads for heavy vehicles
Large power through co-modality
Large: better utilization - the right vehicle on the right path
Small Average
Green flows, green light-wave, slot times
Average: mainly due to fewer "stop and go"
Average Small Average
Figure 5-2 Impact on targets 2030 - Innovation Domain Infrastructure Adaptation
Efficiency measures in the table for the Innovation Domain Infrastructure Adaptation above are estimates of the impact the innovation domain is expected to provide, will be verified in projects and demonstrations. Various projects and studies show varying results. Introduction and background scenario for 2030
To evaluate the benefits of allowing higher weights on the Swedish road network, the costs of
strengthening roads and bridges has to be considered. In the case of roads, it is mainly a problem when
you raise the axle loads but when it comes to bridges, however, both higher axle loads and gross weight
are critical. Measurements on roads has so far not revealed any major differences compared to
conventional vehicles except for when HCT vehicles drive right after each other or the road has an older
design.
To reduce the impact on the road network and improve accessibility, the IAP is a possible help. IAP
provides better control of the weight etc. of the vehicles and it allows us to use lower safety factors for
bearing capacity calculations and thus reduce the need for reinforcement.
When it comes to the possibility of using the HCT vehicles there are limitations beyond the control of
Trafikverket, when it comes to weight it is mainly monetary. In the case of longer vehicles it also requires
changes in regulations and therefore it is outside Trafikverket’s domain.
In previous increases in maximum gross weight Trafikverket implemented a higher bearing capacity
package. When the current classes were introduced the bearing capacity was increased from BK2 (Bearing
Capacity class 2) and BK3 to BK1 on many bridges and roads. It is important to get critical bridges into
Trafikverket’s planning process.
Trafikverket generally has poor knowledge of:
• how to involve other owners of roads, mainly municipalities, but also owners of private roads etc.
Here is the "last mile access" an important issue • the current situation and also future needs for the HCT-vehicle to be able to use other
infrastructure beyond roads and bridges, e.g. terminals, logistics centres, rest areas and service stations
• lenient measures when diversion is required, e.g. with traffic accidents and roadwork.
24
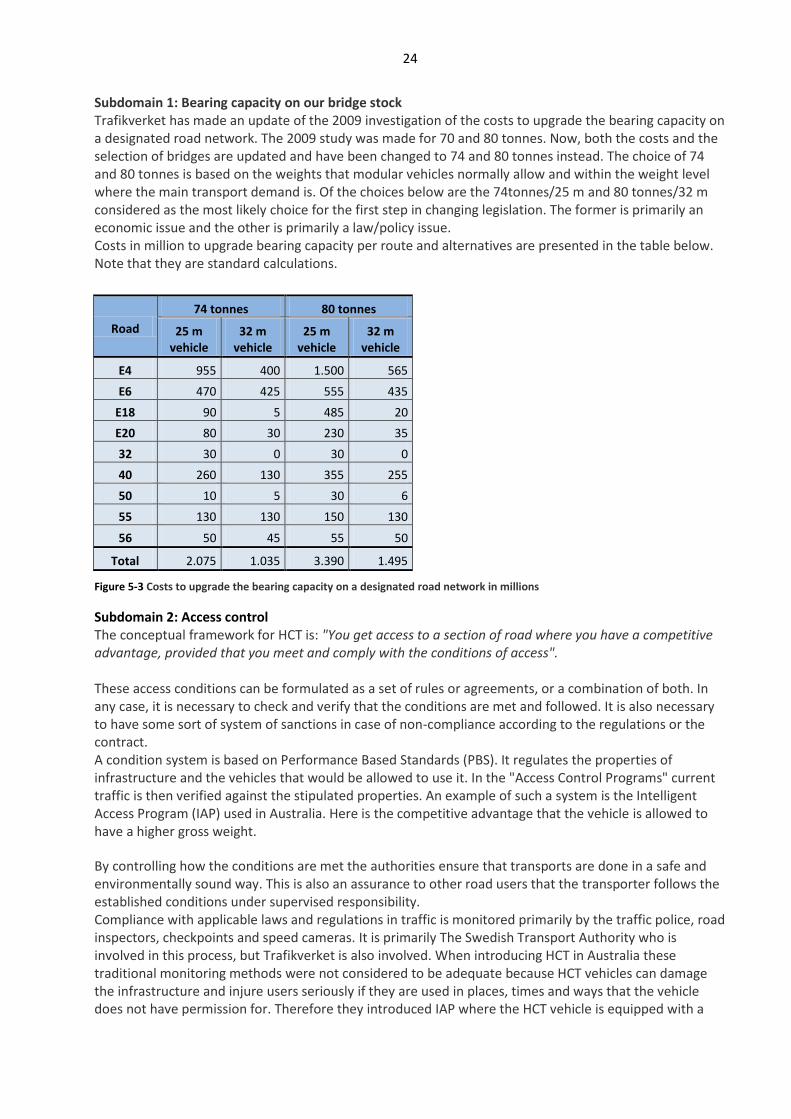
Subdomain 1: Bearing capacity on our bridge stock Trafikverket has made an update of the 2009 investigation of the costs to upgrade the bearing capacity on a designated road network. The 2009 study was made for 70 and 80 tonnes. Now, both the costs and the selection of bridges are updated and have been changed to 74 and 80 tonnes instead. The choice of 74 and 80 tonnes is based on the weights that modular vehicles normally allow and within the weight level where the main transport demand is. Of the choices below are the 74tonnes/25 m and 80 tonnes/32 m considered as the most likely choice for the first step in changing legislation. The former is primarily an economic issue and the other is primarily a law/policy issue. Costs in million to upgrade bearing capacity per route and alternatives are presented in the table below. Note that they are standard calculations.
Road
74 tonnes 80 tonnes
25 m vehicle
32 m vehicle
25 m vehicle
32 m vehicle
E4 955 400 1.500 565
E6 470 425 555 435
E18 90 5 485 20
E20 80 30 230 35
32 30 0 30 0
40 260 130 355 255
50 10 5 30 6
55 130 130 150 130
56 50 45 55 50
Total 2.075 1.035 3.390 1.495
Figure 5-3 Costs to upgrade the bearing capacity on a designated road network in millions
Subdomain 2: Access control The conceptual framework for HCT is: "You get access to a section of road where you have a competitive advantage, provided that you meet and comply with the conditions of access". These access conditions can be formulated as a set of rules or agreements, or a combination of both. In any case, it is necessary to check and verify that the conditions are met and followed. It is also necessary to have some sort of system of sanctions in case of non-compliance according to the regulations or the contract. A condition system is based on Performance Based Standards (PBS). It regulates the properties of infrastructure and the vehicles that would be allowed to use it. In the "Access Control Programs" current traffic is then verified against the stipulated properties. An example of such a system is the Intelligent Access Program (IAP) used in Australia. Here is the competitive advantage that the vehicle is allowed to have a higher gross weight. By controlling how the conditions are met the authorities ensure that transports are done in a safe and environmentally sound way. This is also an assurance to other road users that the transporter follows the established conditions under supervised responsibility. Compliance with applicable laws and regulations in traffic is monitored primarily by the traffic police, road inspectors, checkpoints and speed cameras. It is primarily The Swedish Transport Authority who is involved in this process, but Trafikverket is also involved. When introducing HCT in Australia these traditional monitoring methods were not considered to be adequate because HCT vehicles can damage the infrastructure and injure users seriously if they are used in places, times and ways that the vehicle does not have permission for. Therefore they introduced IAP where the HCT vehicle is equipped with a
25
box with GPS and cellular modem that via an IAP service provider reports all violations to the road authority for further action. Most of the work is carried out by the private sector under the supervision of the newly created authority Transport Certification Australia (TCA). Today IAP is required for most types of HCT vehicles. It went from sampling at 1 out of 1000 to 100 percent monitoring via IAP. In Sweden a similar monitoring system is needed. Read more about this in Section 6.2.
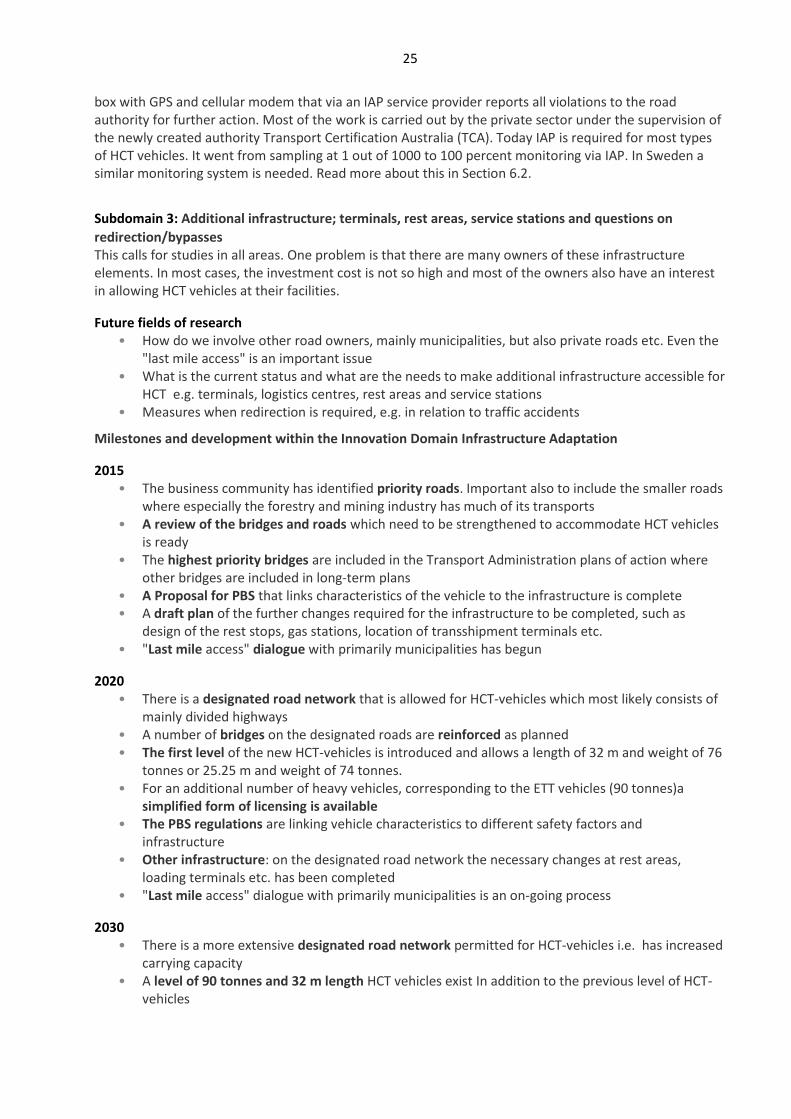
Subdomain 3: Additional infrastructure; terminals, rest areas, service stations and questions on
redirection/bypasses This calls for studies in all areas. One problem is that there are many owners of these infrastructure elements. In most cases, the investment cost is not so high and most of the owners also have an interest in allowing HCT vehicles at their facilities.
Future fields of research • How do we involve other road owners, mainly municipalities, but also private roads etc. Even the
"last mile access" is an important issue • What is the current status and what are the needs to make additional infrastructure accessible for
HCT e.g. terminals, logistics centres, rest areas and service stations • Measures when redirection is required, e.g. in relation to traffic accidents
Milestones and development within the Innovation Domain Infrastructure Adaptation
2015 • The business community has identified priority roads. Important also to include the smaller roads
where especially the forestry and mining industry has much of its transports • A review of the bridges and roads which need to be strengthened to accommodate HCT vehicles
is ready • The highest priority bridges are included in the Transport Administration plans of action where
other bridges are included in long-term plans • A Proposal for PBS that links characteristics of the vehicle to the infrastructure is complete • A draft plan of the further changes required for the infrastructure to be completed, such as
design of the rest stops, gas stations, location of transshipment terminals etc. • "Last mile access" dialogue with primarily municipalities has begun
2020 • There is a designated road network that is allowed for HCT-vehicles which most likely consists of
mainly divided highways • A number of bridges on the designated roads are reinforced as planned • The first level of the new HCT-vehicles is introduced and allows a length of 32 m and weight of 76
tonnes or 25.25 m and weight of 74 tonnes. • For an additional number of heavy vehicles, corresponding to the ETT vehicles (90 tonnes)a
simplified form of licensing is available • The PBS regulations are linking vehicle characteristics to different safety factors and
infrastructure • Other infrastructure: on the designated road network the necessary changes at rest areas,
loading terminals etc. has been completed • "Last mile access" dialogue with primarily municipalities is an on-going process
2030 • There is a more extensive designated road network permitted for HCT-vehicles i.e. has increased
carrying capacity • A level of 90 tonnes and 32 m length HCT vehicles exist In addition to the previous level of HCT-
vehicles
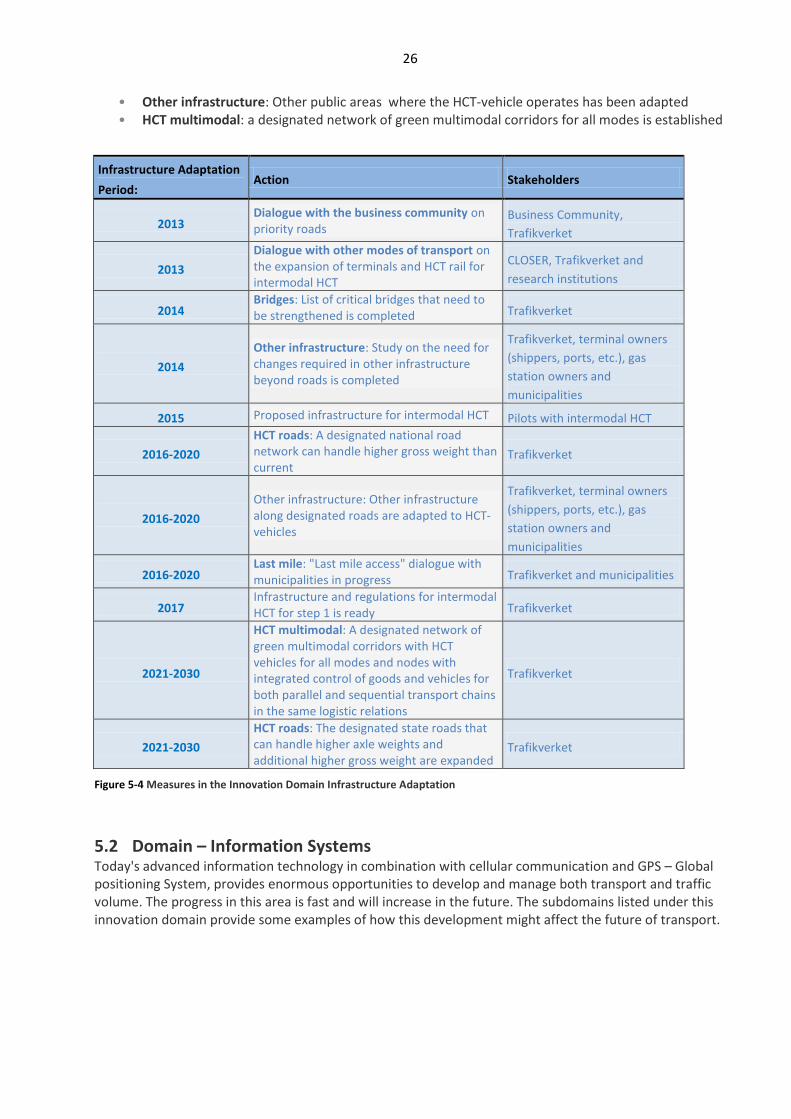
26
• Other infrastructure: Other public areas where the HCT-vehicle operates has been adapted • HCT multimodal: a designated network of green multimodal corridors for all modes is established
Infrastructure Adaptation
Period: Action Stakeholders
2013 Dialogue with the business community on priority roads
Business Community,
Trafikverket
2013
Dialogue with other modes of transport on the expansion of terminals and HCT rail for intermodal HCT
CLOSER, Trafikverket and
research institutions
2014 Bridges: List of critical bridges that need to be strengthened is completed Trafikverket
2014
Other infrastructure: Study on the need for changes required in other infrastructure beyond roads is completed
Trafikverket, terminal owners
(shippers, ports, etc.), gas
station owners and
municipalities
2015 Proposed infrastructure for intermodal HCT Pilots with intermodal HCT
2016-2020
HCT roads: A designated national road network can handle higher gross weight than current
Trafikverket
2016-2020
Other infrastructure: Other infrastructure along designated roads are adapted to HCT-vehicles
Trafikverket, terminal owners
(shippers, ports, etc.), gas
station owners and
municipalities
2016-2020 Last mile: "Last mile access" dialogue with municipalities in progress Trafikverket and municipalities
2017 Infrastructure and regulations for intermodal HCT for step 1 is ready Trafikverket
2021-2030
HCT multimodal: A designated network of green multimodal corridors with HCT vehicles for all modes and nodes with integrated control of goods and vehicles for both parallel and sequential transport chains in the same logistic relations
Trafikverket
2021-2030
HCT roads: The designated state roads that can handle higher axle weights and additional higher gross weight are expanded
Trafikverket
Figure 5-4 Measures in the Innovation Domain Infrastructure Adaptation
5.2 Domain – Information Systems Today's advanced information technology in combination with cellular communication and GPS – Global positioning System, provides enormous opportunities to develop and manage both transport and traffic volume. The progress in this area is fast and will increase in the future. The subdomains listed under this innovation domain provide some examples of how this development might affect the future of transport.
27
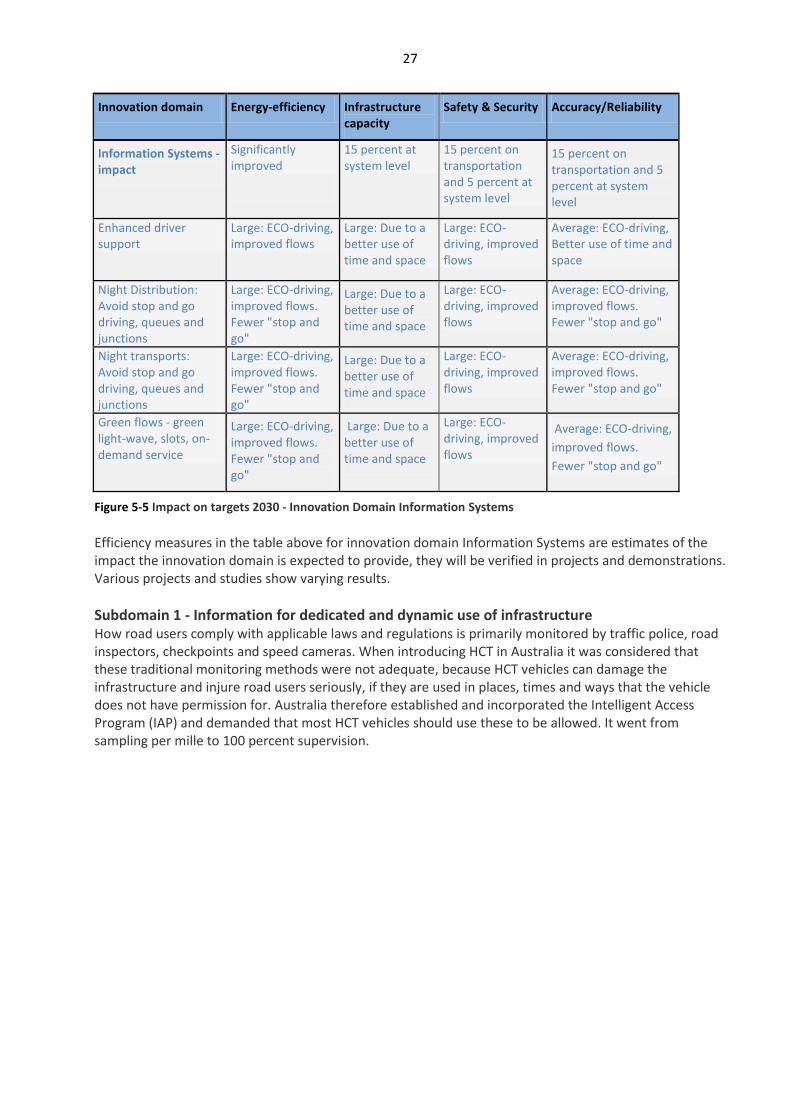
Innovation domain Energy-efficiency Infrastructure capacity
Safety & Security Accuracy/Reliability
Information Systems -impact
Significantly improved
15 percent at system level
15 percent on transportation and 5 percent at system level
15 percent on transportation and 5 percent at system level
Enhanced driver support
Large: ECO-driving, improved flows
Large: Due to a better use of time and space
Large: ECO-driving, improved flows
Average: ECO-driving, Better use of time and space
Night Distribution: Avoid stop and go driving, queues and junctions
Large: ECO-driving, improved flows. Fewer "stop and go"
Large: Due to a better use of time and space
Large: ECO-driving, improved flows
Average: ECO-driving, improved flows. Fewer "stop and go"
Night transports: Avoid stop and go driving, queues and junctions
Large: ECO-driving, improved flows. Fewer "stop and go"
Large: Due to a better use of time and space
Large: ECO-driving, improved flows
Average: ECO-driving, improved flows. Fewer "stop and go"
Green flows - green light-wave, slots, on-demand service
Large: ECO-driving, improved flows. Fewer "stop and go"
Large: Due to a better use of time and space
Large: ECO-driving, improved flows
Average: ECO-driving,
improved flows.
Fewer "stop and go"
Figure 5-5 Impact on targets 2030 - Innovation Domain Information Systems
Efficiency measures in the table above for innovation domain Information Systems are estimates of the impact the innovation domain is expected to provide, they will be verified in projects and demonstrations. Various projects and studies show varying results.
Subdomain 1 - Information for dedicated and dynamic use of infrastructure How road users comply with applicable laws and regulations is primarily monitored by traffic police, road inspectors, checkpoints and speed cameras. When introducing HCT in Australia it was considered that these traditional monitoring methods were not adequate, because HCT vehicles can damage the infrastructure and injure road users seriously, if they are used in places, times and ways that the vehicle does not have permission for. Australia therefore established and incorporated the Intelligent Access Program (IAP) and demanded that most HCT vehicles should use these to be allowed. It went from sampling per mille to 100 percent supervision.
28
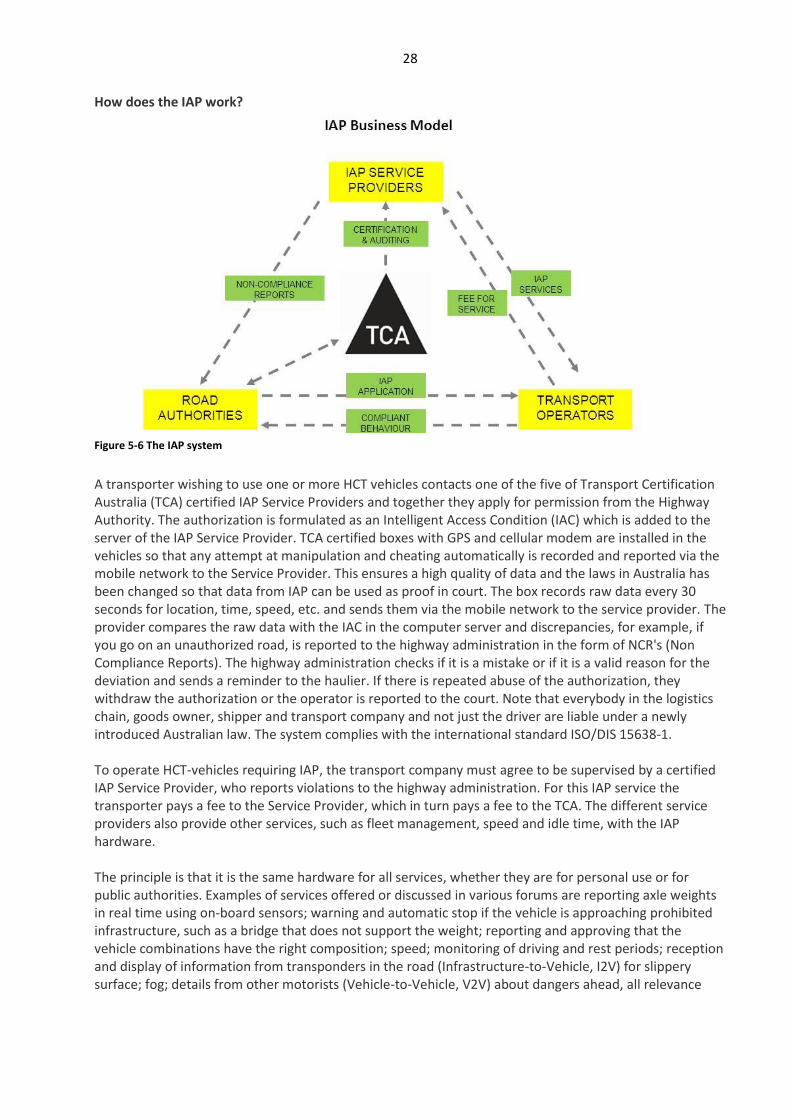
How does the IAP work?
Figure 5-6 The IAP system
A transporter wishing to use one or more HCT vehicles contacts one of the five of Transport Certification Australia (TCA) certified IAP Service Providers and together they apply for permission from the Highway Authority. The authorization is formulated as an Intelligent Access Condition (IAC) which is added to the server of the IAP Service Provider. TCA certified boxes with GPS and cellular modem are installed in the vehicles so that any attempt at manipulation and cheating automatically is recorded and reported via the mobile network to the Service Provider. This ensures a high quality of data and the laws in Australia has been changed so that data from IAP can be used as proof in court. The box records raw data every 30 seconds for location, time, speed, etc. and sends them via the mobile network to the service provider. The provider compares the raw data with the IAC in the computer server and discrepancies, for example, if you go on an unauthorized road, is reported to the highway administration in the form of NCR's (Non Compliance Reports). The highway administration checks if it is a mistake or if it is a valid reason for the deviation and sends a reminder to the haulier. If there is repeated abuse of the authorization, they withdraw the authorization or the operator is reported to the court. Note that everybody in the logistics chain, goods owner, shipper and transport company and not just the driver are liable under a newly introduced Australian law. The system complies with the international standard ISO/DIS 15638-1. To operate HCT-vehicles requiring IAP, the transport company must agree to be supervised by a certified IAP Service Provider, who reports violations to the highway administration. For this IAP service the transporter pays a fee to the Service Provider, which in turn pays a fee to the TCA. The different service providers also provide other services, such as fleet management, speed and idle time, with the IAP hardware. The principle is that it is the same hardware for all services, whether they are for personal use or for public authorities. Examples of services offered or discussed in various forums are reporting axle weights in real time using on-board sensors; warning and automatic stop if the vehicle is approaching prohibited infrastructure, such as a bridge that does not support the weight; reporting and approving that the vehicle combinations have the right composition; speed; monitoring of driving and rest periods; reception and display of information from transponders in the road (Infrastructure-to-Vehicle, I2V) for slippery surface; fog; details from other motorists (Vehicle-to-Vehicle, V2V) about dangers ahead, all relevance
29
road signs as a voice message to the driver; and billing of dynamic road pricing based on several parameters, including CO2 emissions, distance, weight, congestion, time and geography.
Subdomain 2 ITS, Fleet management Information and communication technology is an important enabler for ITS solutions for both urban transport and long-distance transport. A modern system architecture that includes both vehicles and infrastructure, provides a flexible system where services can be produced based on mutual agreements on the use of data and other resources, and based on well-established business models, payment flows, etc. Through a modern system architecture it is possible to create conditions for an effective use of the opportunities offered by modern communications. Utilizing the data generated by vehicles (and freight) can help streamline the transport system through services for control, monitoring and information. A well designed system architecture can thus contribute to improve all levels and activities in a transport chain. A good example of useful ITS systems is a Fleet Management system. A modern Fleet Management system helps the owner to get more out of his vehicle fleet, while reducing paperwork and costs. Web-based Fleet Management Services can connect vehicles to office systems via wireless links and the Internet and improve communications between the drivers and office. It provides faster and more efficient services that can give smother and more cost-effective operations. The owner will receive real time data from the fleet with respect to capacity utilisation and fuel efficiency, as well as finished environmental reports, this can also be automated and coupled for enforcement.
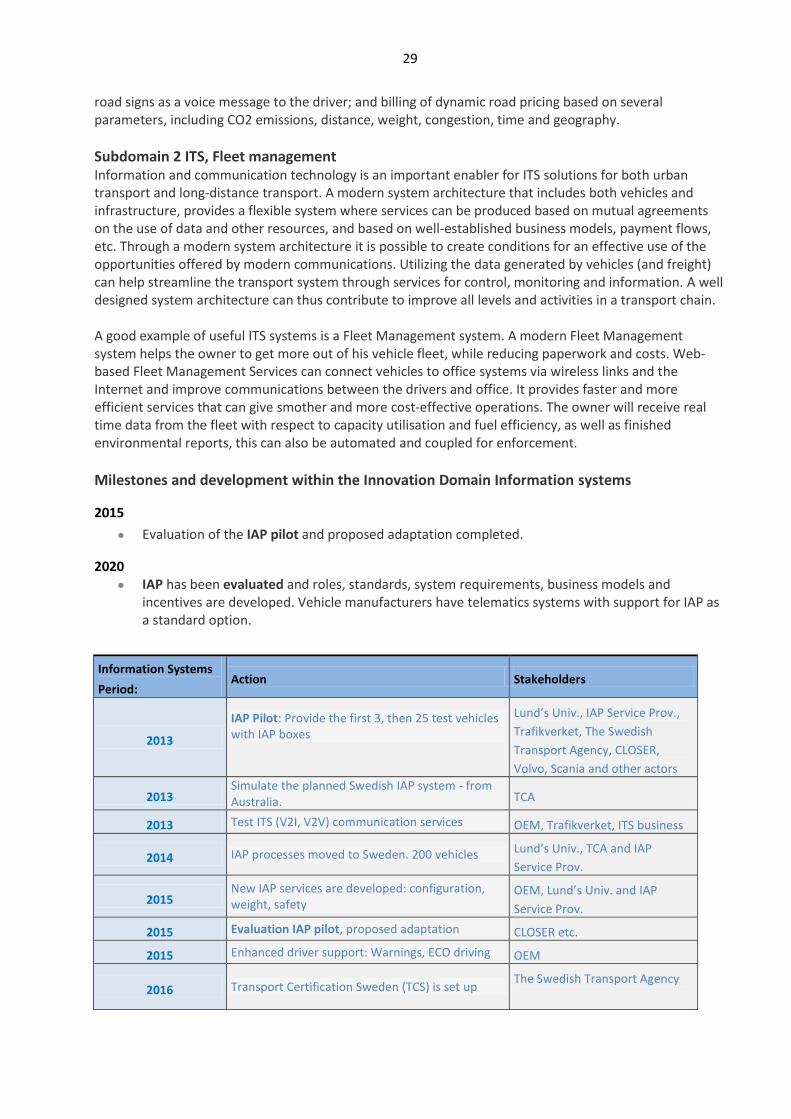
Milestones and development within the Innovation Domain Information systems
2015
Evaluation of the IAP pilot and proposed adaptation completed.
2020
IAP has been evaluated and roles, standards, system requirements, business models and incentives are developed. Vehicle manufacturers have telematics systems with support for IAP as a standard option.
Information Systems
Period: Action Stakeholders
2013
IAP Pilot: Provide the first 3, then 25 test vehicles with IAP boxes
Lund’s Univ., IAP Service Prov.,
Trafikverket, The Swedish
Transport Agency, CLOSER,
Volvo, Scania and other actors
2013 Simulate the planned Swedish IAP system - from Australia. TCA
2013 Test ITS (V2I, V2V) communication services OEM, Trafikverket, ITS business
2014 IAP processes moved to Sweden. 200 vehicles Lund’s Univ., TCA and IAP
Service Prov.
2015 New IAP services are developed: configuration, weight, safety
OEM, Lund’s Univ. and IAP
Service Prov.
2015 Evaluation IAP pilot, proposed adaptation CLOSER etc.
2015 Enhanced driver support: Warnings, ECO driving OEM
2016 Transport Certification Sweden (TCS) is set up The Swedish Transport Agency
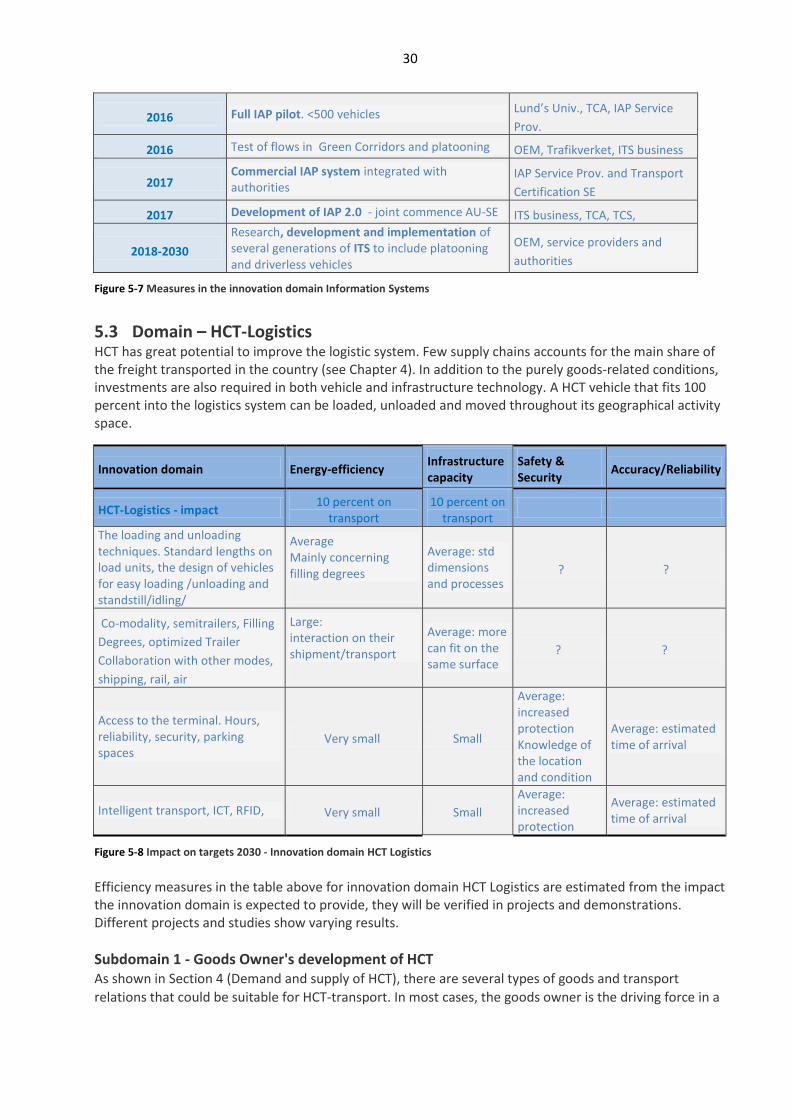
30
2016 Full IAP pilot. <500 vehicles Lund’s Univ., TCA, IAP Service
Prov.
2016 Test of flows in Green Corridors and platooning OEM, Trafikverket, ITS business
2017 Commercial IAP system integrated with authorities
IAP Service Prov. and Transport
Certification SE
2017 Development of IAP 2.0 - joint commence AU-SE ITS business, TCA, TCS,
2018-2030
Research, development and implementation of several generations of ITS to include platooning and driverless vehicles
OEM, service providers and
authorities
Figure 5-7 Measures in the innovation domain Information Systems
5.3 Domain – HCT-Logistics HCT has great potential to improve the logistic system. Few supply chains accounts for the main share of the freight transported in the country (see Chapter 4). In addition to the purely goods-related conditions, investments are also required in both vehicle and infrastructure technology. A HCT vehicle that fits 100 percent into the logistics system can be loaded, unloaded and moved throughout its geographical activity space.
Innovation domain Energy-efficiency Infrastructure capacity
Safety & Security
Accuracy/Reliability
HCT-Logistics - impact 10 percent on
transport 10 percent on
transport
The loading and unloading techniques. Standard lengths on load units, the design of vehicles for easy loading /unloading and standstill/idling/
Average Mainly concerning filling degrees
Average: std dimensions and processes
? ?
Co-modality, semitrailers, Filling
Degrees, optimized Trailer
Collaboration with other modes,
shipping, rail, air
Large: interaction on their shipment/transport
Average: more can fit on the same surface
? ?
Access to the terminal. Hours, reliability, security, parking spaces
Very small Small
Average: increased protection Knowledge of the location and condition
Average: estimated time of arrival
Intelligent transport, ICT, RFID, Very small Small
Average: increased protection
Average: estimated time of arrival
Figure 5-8 Impact on targets 2030 - Innovation domain HCT Logistics
Efficiency measures in the table above for innovation domain HCT Logistics are estimated from the impact the innovation domain is expected to provide, they will be verified in projects and demonstrations. Different projects and studies show varying results.
Subdomain 1 - Goods Owner's development of HCT As shown in Section 4 (Demand and supply of HCT), there are several types of goods and transport
relations that could be suitable for HCT-transport. In most cases, the goods owner is the driving force in a
31
HCT-development based on goods group. So this is a typical bottom-up domain where HCT can be used to
streamline existing flows of goods which are not considered "standard". It may for example involve long
timber vehicles or heavy ore vehicles. In flows where it’s not necessary to load different types of goods
(consolidate), HCT vehicles works without adaptation. For example, timber, ore, and other commodities
on transport relations with more vehicles per day, e.g. trailers with cargo between terminals or containers
from the port or rail. In flows that require additional loading (between goods owners, freight forwarders,
cargo types or over time in stock) to fill a HCT vehicle, it is expected that HCT will get a smaller market
share.
Because of heterogeneity between the goods it is difficult to generalize such impacts and effects of the
introduction of HCT on goods category level. Each case needs to be evaluated individually to some extent.
A prerequisite for substantial development in this segment is that there are routines and tools for
licensing and monitoring (presumably digital surveillance/access control as IAP).
Identified groups are (from Section 4):
Ores and other products from mining dominated by fill material (soil, rock, sand). Vehicle mileage is low (short-range) which means that the road network is probably local (often municipal). There is a great HCT potential here, especially if you look at the quantity of goods that despite the low mileage, still generates 7 percent of the total transports.
Food, beverages and tobacco are as general cargo standing for a large share of transport in the country - regardless parameter. The low proportion of empty running (even for general cargo) can be an indicator of a high degree of planning and control of flows and related activities. HCT vehicles could streamline this segment further, mainly due to the large volume of goods. This indicates that it is possible to identify sufficient flows on certain relations.
The large amount of cargo belonging to Products of agriculture, forestry and fisheries, together with the high transport and traffic work and the relatively low amount of transports (7 percent of the transports) shows that transports are done by large vehicles with big loads that drives long distances. The fact that timber transports, which constitute the majority of the goods in the group, is suitable for HCT has already been proven in the ETT-project, but these transports are often on minor roads which can be a problem.
In the same way as timber, the group Wood and goods of wood and cork (except furniture) consist of large, long flows, in this case primarily of wood chips, paper and sawn timber. Again, minor roads can become relevant.
The flow anatomy differs between the goods. What might be the best (or most common) practice for one
good is often the opposite for another. Today we can see the large, specialized, vehicle fleets that are
optimized to handle a few or even one-off goods types. Timber, ore, concrete, petroleum and waste are
some examples of vehicles where the specialization is very prominent. Subdomain 2 Transporters’ development of HCT For other types of goods, it may be the load carrier itself, or the transport unit (trailer), which is
specialized. A standard traction unit coupled to a specialized trailer.
General cargo and grouped goods are placed high regardless of the parameter being studied. These goods belong to the transport sector. Large parts of the national flow of general cargo are handled by forwarding companies in large terminal networks. These operators are likely to have a significant potential to increase internal efficiency (transportation between terminals) using HCT. Type of transport refers to different combinations of vehicles/ and transport activities, such as distribution services, long-distance, direct transport, FTL, LTL, etc. It is the transporters’ classification that is used here and exactly what kind of goods vehicles are laden with is not considered relevant. It may for example involve a shipper whose terminal network linked by bidirectional direct relations, or a
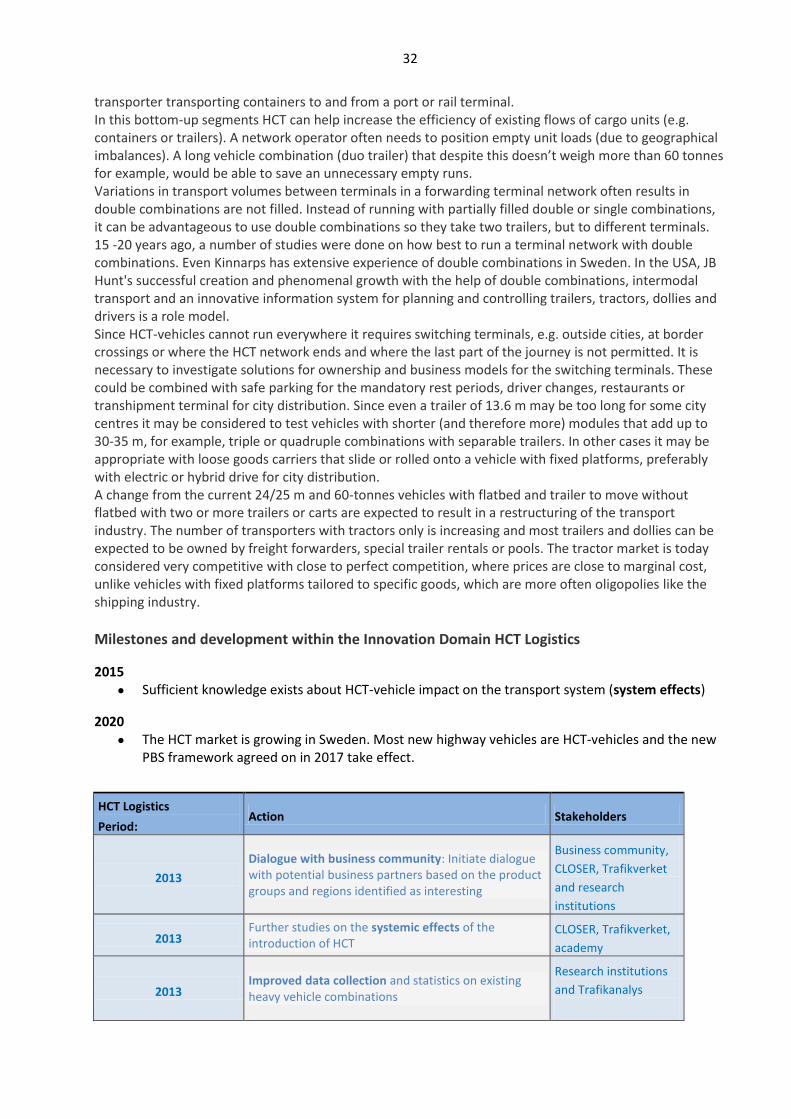
32
transporter transporting containers to and from a port or rail terminal. In this bottom-up segments HCT can help increase the efficiency of existing flows of cargo units (e.g. containers or trailers). A network operator often needs to position empty unit loads (due to geographical imbalances). A long vehicle combination (duo trailer) that despite this doesn’t weigh more than 60 tonnes for example, would be able to save an unnecessary empty runs. Variations in transport volumes between terminals in a forwarding terminal network often results in double combinations are not filled. Instead of running with partially filled double or single combinations, it can be advantageous to use double combinations so they take two trailers, but to different terminals. 15 -20 years ago, a number of studies were done on how best to run a terminal network with double combinations. Even Kinnarps has extensive experience of double combinations in Sweden. In the USA, JB Hunt's successful creation and phenomenal growth with the help of double combinations, intermodal transport and an innovative information system for planning and controlling trailers, tractors, dollies and drivers is a role model. Since HCT-vehicles cannot run everywhere it requires switching terminals, e.g. outside cities, at border crossings or where the HCT network ends and where the last part of the journey is not permitted. It is necessary to investigate solutions for ownership and business models for the switching terminals. These could be combined with safe parking for the mandatory rest periods, driver changes, restaurants or transhipment terminal for city distribution. Since even a trailer of 13.6 m may be too long for some city centres it may be considered to test vehicles with shorter (and therefore more) modules that add up to 30-35 m, for example, triple or quadruple combinations with separable trailers. In other cases it may be appropriate with loose goods carriers that slide or rolled onto a vehicle with fixed platforms, preferably with electric or hybrid drive for city distribution. A change from the current 24/25 m and 60-tonnes vehicles with flatbed and trailer to move without flatbed with two or more trailers or carts are expected to result in a restructuring of the transport industry. The number of transporters with tractors only is increasing and most trailers and dollies can be expected to be owned by freight forwarders, special trailer rentals or pools. The tractor market is today considered very competitive with close to perfect competition, where prices are close to marginal cost, unlike vehicles with fixed platforms tailored to specific goods, which are more often oligopolies like the shipping industry.
Milestones and development within the Innovation Domain HCT Logistics
2015
Sufficient knowledge exists about HCT-vehicle impact on the transport system (system effects)
2020
The HCT market is growing in Sweden. Most new highway vehicles are HCT-vehicles and the new PBS framework agreed on in 2017 take effect.
HCT Logistics
Period: Action Stakeholders
2013
Dialogue with business community: Initiate dialogue with potential business partners based on the product groups and regions identified as interesting
Business community,
CLOSER, Trafikverket
and research
institutions
2013 Further studies on the systemic effects of the introduction of HCT
CLOSER, Trafikverket,
academy
2013 Improved data collection and statistics on existing heavy vehicle combinations
Research institutions
and Trafikanalys
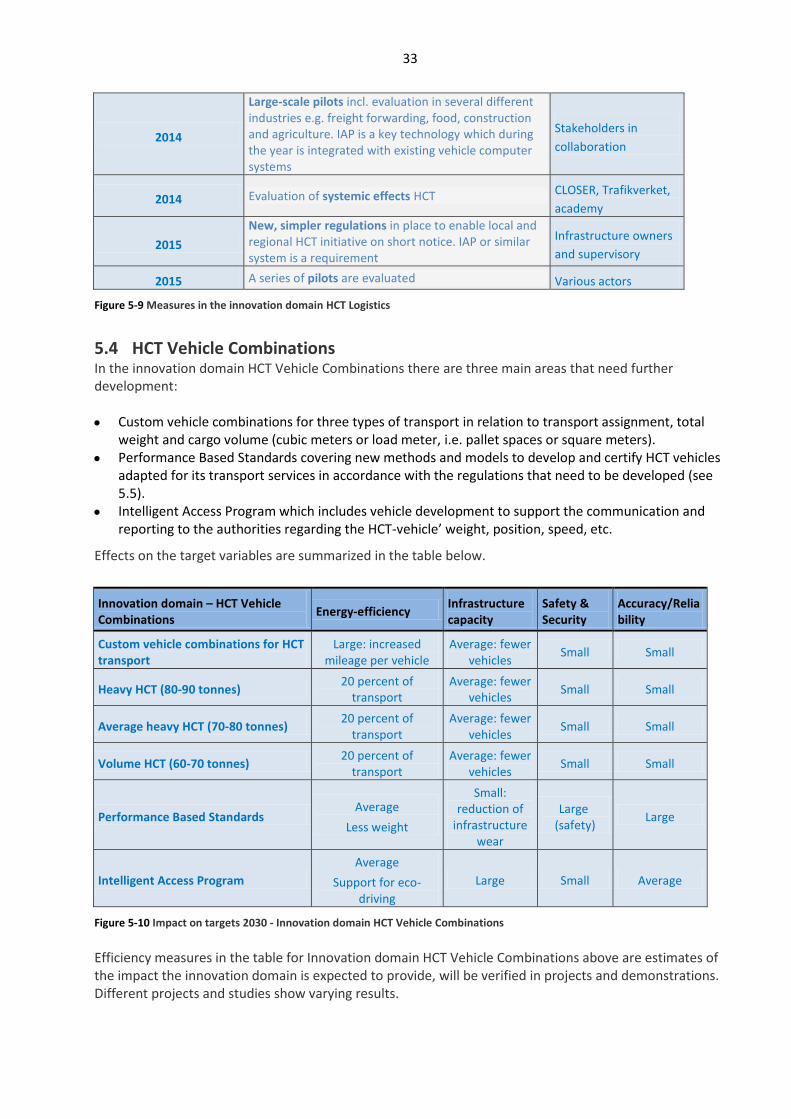
33
2014
Large-scale pilots incl. evaluation in several different industries e.g. freight forwarding, food, construction and agriculture. IAP is a key technology which during the year is integrated with existing vehicle computer systems
Stakeholders in
collaboration
2014 Evaluation of systemic effects HCT CLOSER, Trafikverket,
academy
2015
New, simpler regulations in place to enable local and regional HCT initiative on short notice. IAP or similar system is a requirement
Infrastructure owners
and supervisory
2015 A series of pilots are evaluated Various actors
Figure 5-9 Measures in the innovation domain HCT Logistics
5.4 HCT Vehicle Combinations In the innovation domain HCT Vehicle Combinations there are three main areas that need further development:
Custom vehicle combinations for three types of transport in relation to transport assignment, total weight and cargo volume (cubic meters or load meter, i.e. pallet spaces or square meters).
Performance Based Standards covering new methods and models to develop and certify HCT vehicles adapted for its transport services in accordance with the regulations that need to be developed (see 5.5).
Intelligent Access Program which includes vehicle development to support the communication and reporting to the authorities regarding the HCT-vehicle’ weight, position, speed, etc.
Effects on the target variables are summarized in the table below.
Innovation domain – HCT Vehicle Combinations
Energy-efficiency Infrastructure capacity
Safety & Security
Accuracy/Reliability
Custom vehicle combinations for HCT transport
Large: increased mileage per vehicle
Average: fewer vehicles
Small Small
Heavy HCT (80-90 tonnes) 20 percent of
transport Average: fewer
vehicles Small Small
Average heavy HCT (70-80 tonnes) 20 percent of
transport Average: fewer
vehicles Small Small
Volume HCT (60-70 tonnes) 20 percent of
transport Average: fewer
vehicles Small Small
Performance Based Standards Average
Less weight
Small: reduction of
infrastructure wear
Large (safety)
Large
Intelligent Access Program
Average
Support for eco-driving
Large Small Average
Figure 5-10 Impact on targets 2030 - Innovation domain HCT Vehicle Combinations
Efficiency measures in the table for Innovation domain HCT Vehicle Combinations above are estimates of the impact the innovation domain is expected to provide, will be verified in projects and demonstrations. Different projects and studies show varying results.
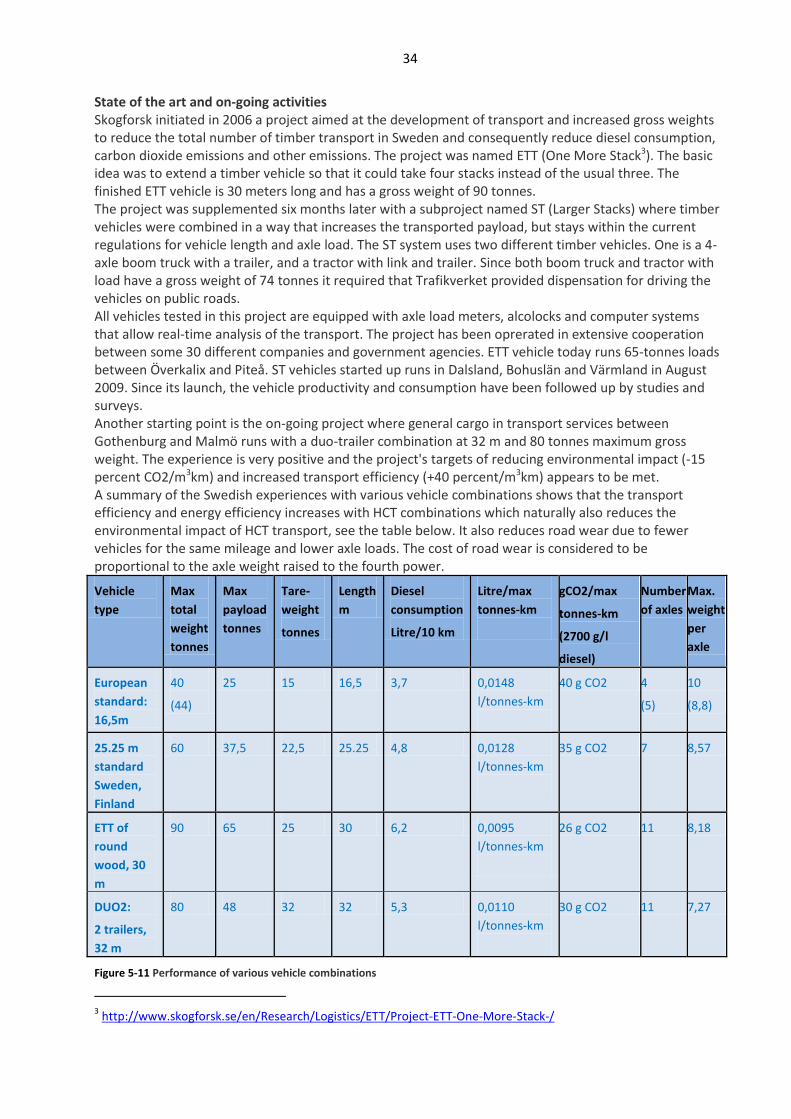
34
State of the art and on-going activities Skogforsk initiated in 2006 a project aimed at the development of transport and increased gross weights to reduce the total number of timber transport in Sweden and consequently reduce diesel consumption, carbon dioxide emissions and other emissions. The project was named ETT (One More Stack3). The basic idea was to extend a timber vehicle so that it could take four stacks instead of the usual three. The finished ETT vehicle is 30 meters long and has a gross weight of 90 tonnes. The project was supplemented six months later with a subproject named ST (Larger Stacks) where timber vehicles were combined in a way that increases the transported payload, but stays within the current regulations for vehicle length and axle load. The ST system uses two different timber vehicles. One is a 4-axle boom truck with a trailer, and a tractor with link and trailer. Since both boom truck and tractor with load have a gross weight of 74 tonnes it required that Trafikverket provided dispensation for driving the vehicles on public roads. All vehicles tested in this project are equipped with axle load meters, alcolocks and computer systems that allow real-time analysis of the transport. The project has been oprerated in extensive cooperation between some 30 different companies and government agencies. ETT vehicle today runs 65-tonnes loads between Överkalix and Piteå. ST vehicles started up runs in Dalsland, Bohuslän and Värmland in August 2009. Since its launch, the vehicle productivity and consumption have been followed up by studies and surveys. Another starting point is the on-going project where general cargo in transport services between Gothenburg and Malmö runs with a duo-trailer combination at 32 m and 80 tonnes maximum gross weight. The experience is very positive and the project's targets of reducing environmental impact (-15 percent CO2/m3km) and increased transport efficiency (+40 percent/m3km) appears to be met. A summary of the Swedish experiences with various vehicle combinations shows that the transport efficiency and energy efficiency increases with HCT combinations which naturally also reduces the environmental impact of HCT transport, see the table below. It also reduces road wear due to fewer vehicles for the same mileage and lower axle loads. The cost of road wear is considered to be proportional to the axle weight raised to the fourth power.
Vehicle
type
Max
total
weight
tonnes
Max
payload
tonnes
Tare-
weight
tonnes
Length
m
Diesel
consumption
Litre/10 km
Litre/max
tonnes-km
gCO2/max
tonnes-km
(2700 g/l
diesel)
Number
of axles
Max.
weight
per
axle
European
standard:
16,5m
40
(44)
25 15 16,5 3,7 0,0148
l/tonnes-km
40 g CO2 4
(5)
10
(8,8)
25.25 m
standard
Sweden,
Finland
60 37,5 22,5 25.25 4,8 0,0128
l/tonnes-km
35 g CO2 7 8,57
ETT of
round
wood, 30
m
90 65 25 30 6,2 0,0095
l/tonnes-km
26 g CO2 11 8,18
DUO2:
2 trailers,
32 m
80 48 32 32 5,3 0,0110
l/tonnes-km
30 g CO2 11 7,27
Figure 5-11 Performance of various vehicle combinations
3 http://www.skogforsk.se/en/Research/Logistics/ETT/Project-ETT-One-More-Stack-/
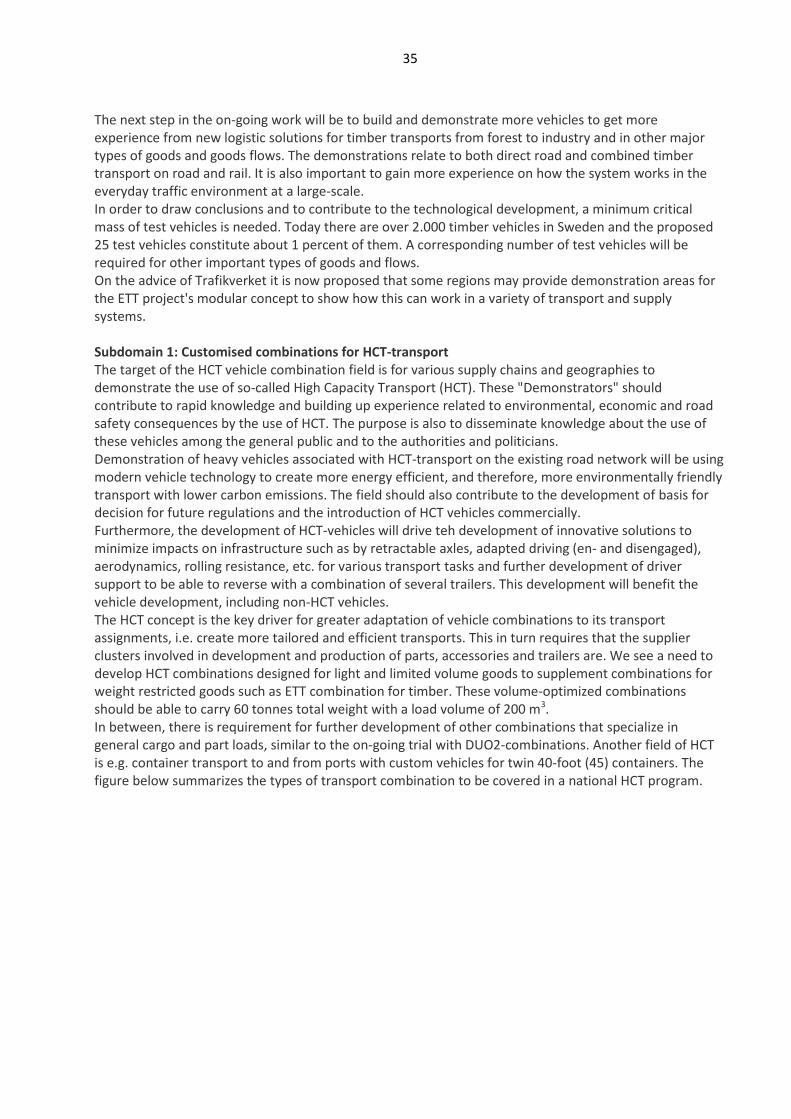
35
The next step in the on-going work will be to build and demonstrate more vehicles to get more experience from new logistic solutions for timber transports from forest to industry and in other major types of goods and goods flows. The demonstrations relate to both direct road and combined timber transport on road and rail. It is also important to gain more experience on how the system works in the everyday traffic environment at a large-scale. In order to draw conclusions and to contribute to the technological development, a minimum critical mass of test vehicles is needed. Today there are over 2.000 timber vehicles in Sweden and the proposed 25 test vehicles constitute about 1 percent of them. A corresponding number of test vehicles will be required for other important types of goods and flows. On the advice of Trafikverket it is now proposed that some regions may provide demonstration areas for the ETT project's modular concept to show how this can work in a variety of transport and supply systems. Subdomain 1: Customised combinations for HCT-transport The target of the HCT vehicle combination field is for various supply chains and geographies to demonstrate the use of so-called High Capacity Transport (HCT). These "Demonstrators" should contribute to rapid knowledge and building up experience related to environmental, economic and road safety consequences by the use of HCT. The purpose is also to disseminate knowledge about the use of these vehicles among the general public and to the authorities and politicians. Demonstration of heavy vehicles associated with HCT-transport on the existing road network will be using modern vehicle technology to create more energy efficient, and therefore, more environmentally friendly transport with lower carbon emissions. The field should also contribute to the development of basis for decision for future regulations and the introduction of HCT vehicles commercially. Furthermore, the development of HCT-vehicles will drive teh development of innovative solutions to minimize impacts on infrastructure such as by retractable axles, adapted driving (en- and disengaged), aerodynamics, rolling resistance, etc. for various transport tasks and further development of driver support to be able to reverse with a combination of several trailers. This development will benefit the vehicle development, including non-HCT vehicles. The HCT concept is the key driver for greater adaptation of vehicle combinations to its transport assignments, i.e. create more tailored and efficient transports. This in turn requires that the supplier clusters involved in development and production of parts, accessories and trailers are. We see a need to develop HCT combinations designed for light and limited volume goods to supplement combinations for weight restricted goods such as ETT combination for timber. These volume-optimized combinations should be able to carry 60 tonnes total weight with a load volume of 200 m3. In between, there is requirement for further development of other combinations that specialize in general cargo and part loads, similar to the on-going trial with DUO2-combinations. Another field of HCT is e.g. container transport to and from ports with custom vehicles for twin 40-foot (45) containers. The figure below summarizes the types of transport combination to be covered in a national HCT program.
36
Figure 5-12 Custom combinations of HCT-transport
HCT will also cause challenges for the design and development of terminals and other supporting infrastructure around the HCT-vehicles, such as the facilities for loading and unloading, accessibility, “last mile” and manoeuvring capabilities. The link to efficient logistics solutions that ensure load factors and controlled empty runs, etc. is addressed in section 6.3. Subdomain 2: Performance Based Standards (PBS) PBS will require the development of methods and models to enable a safe and as cost-effective production of vehicle combinations adapted to their respective transport tasks. Authorities and vehicle manufacturers along with other suppliers of parts, accessories and trailers must agree on standards and design parameters that meet the security, stability and infrastructure impacts. HCT will not be implemented on a broad scale without a "blue print" – an approach where a number of standardized HCT combinations are approved for traffic on designated roads, without every single vehicle combination has to undergo time-consuming and costly regulation processes, e.g. require stability test pilots on a test track. Investigation, evaluation and possible development of existing software for this purpose must be included in the further development of the HCT program. Experience from Australia indicates that the time and costs for the approval of HCT-combinations is crucial for the transporters’ ability to exploit the efficiency potential of vehicle combinations that are better adapted to its transport services. Much work must be done to identify these effective vehicle combinations, developing/modifying "combination types" and validate these with simulation software and supporting driving tests on the test track. The HCT program should be able to gain experience in relation to stability and infrastructure wear from "combination types" documented and tested in other countries, such as Australia and The Netherlands. PBS also brings extensive regulatory developments, which is described more in detail in section 5.5. Subdomain 3: Intelligent Access Program (IAP) Although IAP as described in section 5.2 will require a coordinated vehicle development and standardization to reduce costs and possible technical barriers allowing for a faster and wider implementation. Vehicle manufacturers along with the authorities and service providers have the opportunity to jointly develop IAP functionality both on telematics required on the vehicles and for the required “back office” software for service providers. The requirements for information between vehicles – service providers - authority must be clarified as to which parameters are to be included, frequency of
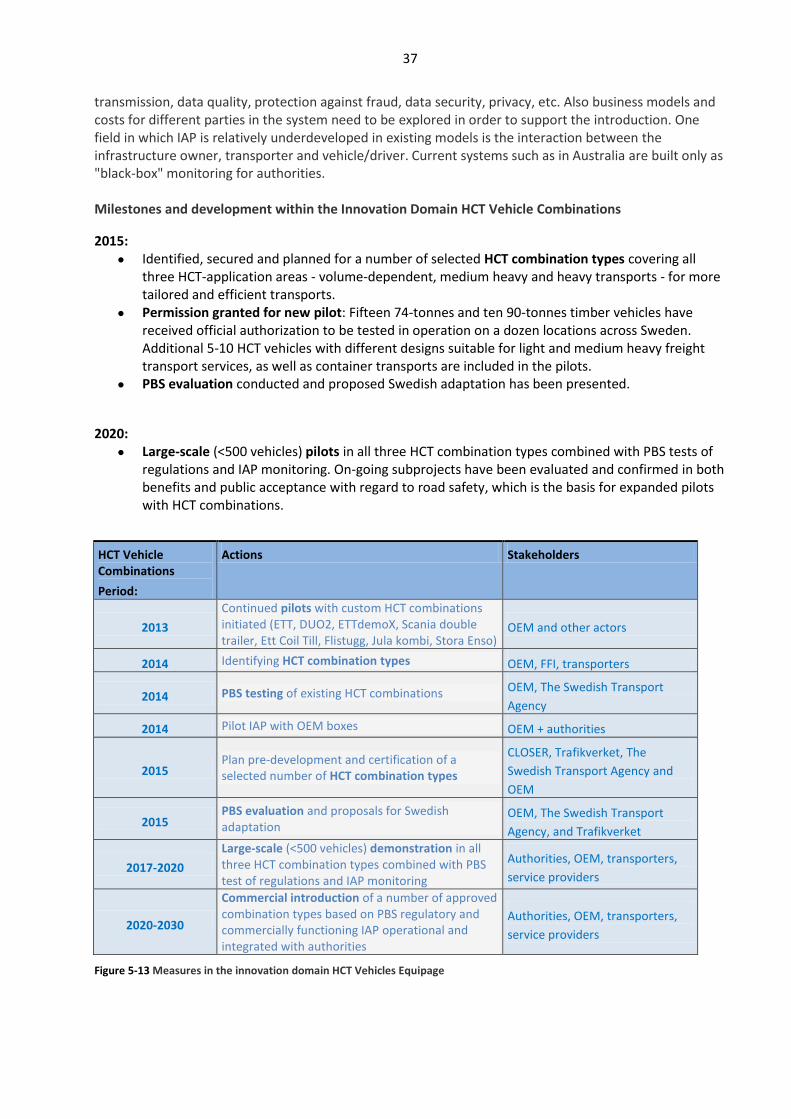
37
transmission, data quality, protection against fraud, data security, privacy, etc. Also business models and costs for different parties in the system need to be explored in order to support the introduction. One field in which IAP is relatively underdeveloped in existing models is the interaction between the infrastructure owner, transporter and vehicle/driver. Current systems such as in Australia are built only as "black-box" monitoring for authorities. Milestones and development within the Innovation Domain HCT Vehicle Combinations
2015:
Identified, secured and planned for a number of selected HCT combination types covering all three HCT-application areas - volume-dependent, medium heavy and heavy transports - for more tailored and efficient transports.
Permission granted for new pilot: Fifteen 74-tonnes and ten 90-tonnes timber vehicles have received official authorization to be tested in operation on a dozen locations across Sweden. Additional 5-10 HCT vehicles with different designs suitable for light and medium heavy freight transport services, as well as container transports are included in the pilots.
PBS evaluation conducted and proposed Swedish adaptation has been presented.
2020:
Large-scale (<500 vehicles) pilots in all three HCT combination types combined with PBS tests of regulations and IAP monitoring. On-going subprojects have been evaluated and confirmed in both benefits and public acceptance with regard to road safety, which is the basis for expanded pilots with HCT combinations.
HCT Vehicle Combinations
Period:
Actions Stakeholders
2013
Continued pilots with custom HCT combinations initiated (ETT, DUO2, ETTdemoX, Scania double trailer, Ett Coil Till, Flistugg, Jula kombi, Stora Enso)
OEM and other actors
2014 Identifying HCT combination types OEM, FFI, transporters
2014 PBS testing of existing HCT combinations OEM, The Swedish Transport
Agency
2014 Pilot IAP with OEM boxes OEM + authorities
2015 Plan pre-development and certification of a selected number of HCT combination types
CLOSER, Trafikverket, The
Swedish Transport Agency and
OEM
2015 PBS evaluation and proposals for Swedish adaptation
OEM, The Swedish Transport
Agency, and Trafikverket
2017-2020
Large-scale (<500 vehicles) demonstration in all three HCT combination types combined with PBS test of regulations and IAP monitoring
Authorities, OEM, transporters,
service providers
2020-2030
Commercial introduction of a number of approved combination types based on PBS regulatory and commercially functioning IAP operational and integrated with authorities
Authorities, OEM, transporters,
service providers
Figure 5-13 Measures in the innovation domain HCT Vehicles Equipage
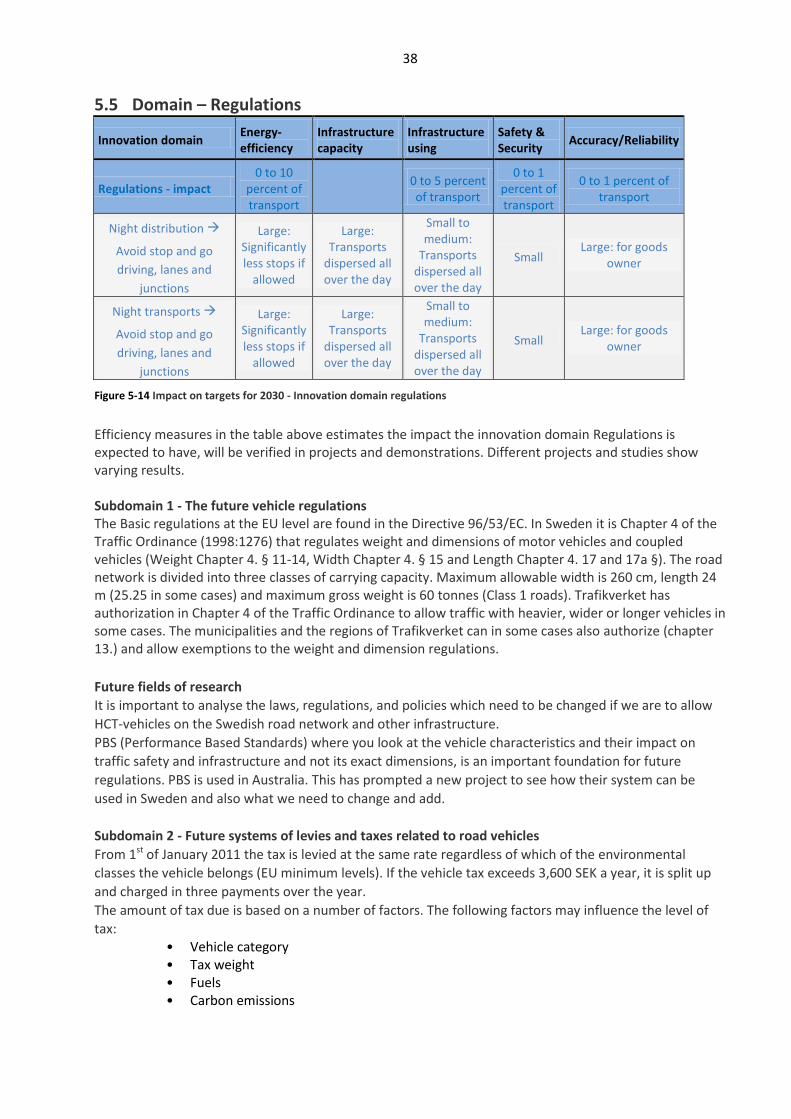
38
5.5 Domain – Regulations
Innovation domain Energy-efficiency
Infrastructure capacity
Infrastructure using
Safety & Security
Accuracy/Reliability
Regulations - impact 0 to 10
percent of transport
0 to 5 percent of transport
0 to 1 percent of transport
0 to 1 percent of transport
Night distribution
Avoid stop and go
driving, lanes and
junctions
Large: Significantly less stops if
allowed
Large: Transports
dispersed all over the day
Small to medium:
Transports dispersed all over the day
Small Large: for goods
owner
Night transports
Avoid stop and go
driving, lanes and
junctions
Large: Significantly less stops if
allowed
Large: Transports
dispersed all over the day
Small to medium:
Transports dispersed all over the day
Small Large: for goods
owner
Figure 5-14 Impact on targets for 2030 - Innovation domain regulations
Efficiency measures in the table above estimates the impact the innovation domain Regulations is expected to have, will be verified in projects and demonstrations. Different projects and studies show varying results. Subdomain 1 - The future vehicle regulations The Basic regulations at the EU level are found in the Directive 96/53/EC. In Sweden it is Chapter 4 of the Traffic Ordinance (1998:1276) that regulates weight and dimensions of motor vehicles and coupled vehicles (Weight Chapter 4. § 11-14, Width Chapter 4. § 15 and Length Chapter 4. 17 and 17a §). The road network is divided into three classes of carrying capacity. Maximum allowable width is 260 cm, length 24 m (25.25 in some cases) and maximum gross weight is 60 tonnes (Class 1 roads). Trafikverket has authorization in Chapter 4 of the Traffic Ordinance to allow traffic with heavier, wider or longer vehicles in some cases. The municipalities and the regions of Trafikverket can in some cases also authorize (chapter 13.) and allow exemptions to the weight and dimension regulations.
Future fields of research
It is important to analyse the laws, regulations, and policies which need to be changed if we are to allow
HCT-vehicles on the Swedish road network and other infrastructure.
PBS (Performance Based Standards) where you look at the vehicle characteristics and their impact on
traffic safety and infrastructure and not its exact dimensions, is an important foundation for future
regulations. PBS is used in Australia. This has prompted a new project to see how their system can be
used in Sweden and also what we need to change and add.
Subdomain 2 - Future systems of levies and taxes related to road vehicles
From 1st of January 2011 the tax is levied at the same rate regardless of which of the environmental
classes the vehicle belongs (EU minimum levels). If the vehicle tax exceeds 3,600 SEK a year, it is split up
and charged in three payments over the year.
The amount of tax due is based on a number of factors. The following factors may influence the level of
tax: • Vehicle category • Tax weight • Fuels • Carbon emissions
39
• Number of axles • Coupling • Municipality of residence • Usage • Environmental class
The three most important additions to the vehicle category are presented below:
1. Tax Weight
The vehicle’s tax weight is the factor that is used in the calculation. What the tax weight consist of varies
depending on the vehicle category. For passenger cars, the tax weight is the vehicle's weight. For light
trucks and trailers the tax-weight is the vehicle's total weight, i.e. service weight + payload. The indication
of a vehicle’s weight tax is on the registration certificate.
2. Number of axles
A vehicle's number of axles affect the vehicle tax. A vehicle can have between one and five axles.
3. COUPLING
The type of coupling between heavy trucks and trailers affects the taxation of the vehicle. Examples of
couplings: turntable, loop or hitch.
Below there are a number of examples on how it works today and the amount of tax for the vehicle
combinations:
Tractor - 2 axles and towing up to 18 tonnes mass has a tax of 7.200, - per year, 3-axles, over 18 tonnes
have a tax of 9.500,- per year combined with a toll where the tax is determined by the vehicle's total
weight and does the vehicle have a hitch besides the turntable, the tax becomes higher. The toll is
10.591,- per year.
Truck - about 600,- in taxes plus toll. Trucks with no pulling device has a toll of is 6.300,- per year and
trucks with pulling devices 10.591,- per year.
Dolly – has a fixed tax of approximately 12.000,- per year (this amount varies a lot).
Semitrailer - tax free
Trailer - 4-axles, the tax is 14.300,- per year (as an example). Toll for trucks Toll is levied on trucks with a gross weight of 12 tonnes or trucks with a gross weight of 7 tonnes fitted with a pulling device. The toll has to be paid for the truck or vehicle combination in order to be allowed on the Swedish roads. In return a vehicle owner does not have to pay toll in other countries in the toll cooperation: Denmark, Belgium, the Netherlands and Luxembourg. On top of the vehicle tax and tolls, fuel tax is added which is generally increasing and is directly linked to the consumption of fuel. Generally speaking, the system of the vehicle tax is designed so that a Swedish domestic combination of truck and trailer is about the same vehicle tax as an EMS vehicle by truck, dolly and trailer. Thus, a certain load capacity has a similar vehicle tax regardless of the combination of units. Similarly, a trailer has about the same vehicle tax as a dolly with a trailer. Future charges Trailers are tax-free in all countries. The tax is applied to the pulling unit (truck/tractor) and the fuel is taxed where it is consumed. The problem is that trucks coming in from other countries with full tanks to e.g. Sweden, reduces tax revenue since the fuel is not bought where it is consumed, and the wear and tear on the infrastructure is not coupled to the fuel tax. In Norway you are allowed to bring in 200 litres of fuel, and if you have more fuel you have to pay fuel tax for it.. Taxes should focus on consumption, i.e., higher fuel taxes provide incentives to create more efficient vehicles - you go from a fixed to a variable tax, which is a prerequisite for efficiency improvements in the system. The most common way of collecting congestion charges and tolls for roads and bridges are with active
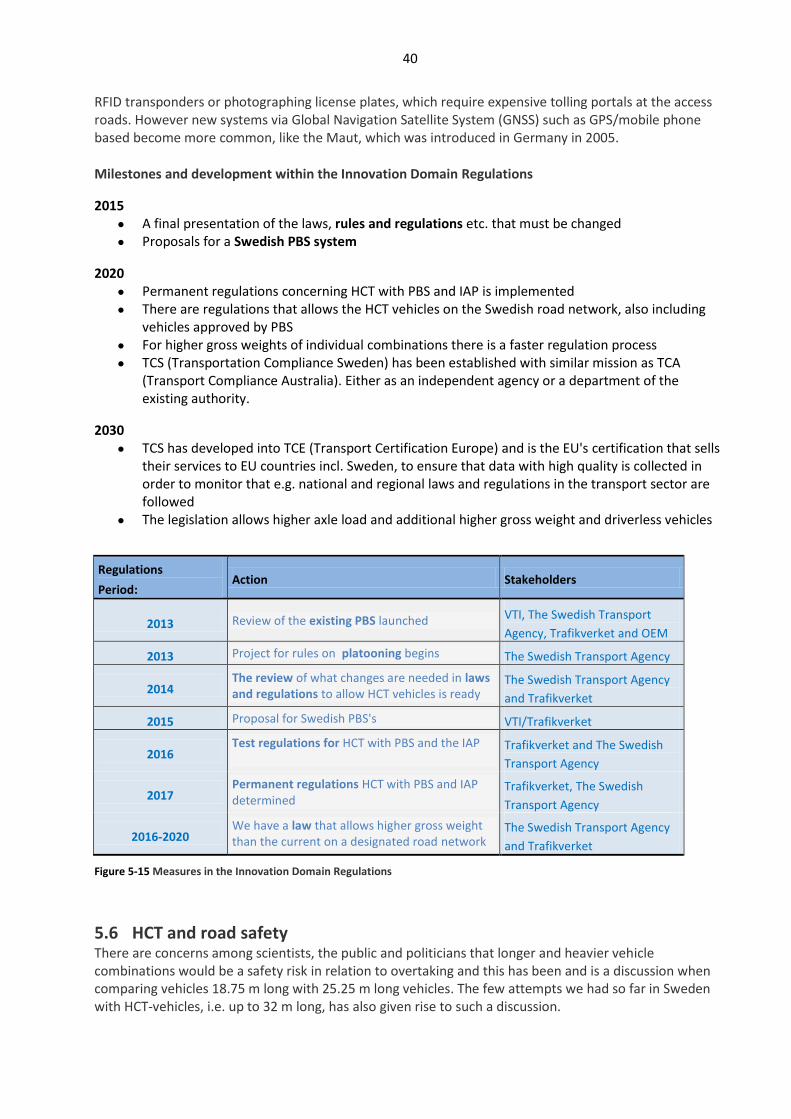
40
RFID transponders or photographing license plates, which require expensive tolling portals at the access roads. However new systems via Global Navigation Satellite System (GNSS) such as GPS/mobile phone based become more common, like the Maut, which was introduced in Germany in 2005.
Milestones and development within the Innovation Domain Regulations
2015
A final presentation of the laws, rules and regulations etc. that must be changed
Proposals for a Swedish PBS system
2020
Permanent regulations concerning HCT with PBS and IAP is implemented
There are regulations that allows the HCT vehicles on the Swedish road network, also including vehicles approved by PBS
For higher gross weights of individual combinations there is a faster regulation process
TCS (Transportation Compliance Sweden) has been established with similar mission as TCA (Transport Compliance Australia). Either as an independent agency or a department of the existing authority.
2030
TCS has developed into TCE (Transport Certification Europe) and is the EU's certification that sells their services to EU countries incl. Sweden, to ensure that data with high quality is collected in order to monitor that e.g. national and regional laws and regulations in the transport sector are followed
The legislation allows higher axle load and additional higher gross weight and driverless vehicles
Regulations
Period: Action Stakeholders
2013 Review of the existing PBS launched VTI, The Swedish Transport
Agency, Trafikverket and OEM
2013 Project for rules on platooning begins The Swedish Transport Agency
2014 The review of what changes are needed in laws and regulations to allow HCT vehicles is ready
The Swedish Transport Agency
and Trafikverket
2015 Proposal for Swedish PBS's VTI/Trafikverket
2016 Test regulations for HCT with PBS and the IAP
Trafikverket and The Swedish
Transport Agency
2017 Permanent regulations HCT with PBS and IAP determined
Trafikverket, The Swedish
Transport Agency
2016-2020 We have a law that allows higher gross weight than the current on a designated road network
The Swedish Transport Agency
and Trafikverket
Figure 5-15 Measures in the Innovation Domain Regulations
5.6 HCT and road safety There are concerns among scientists, the public and politicians that longer and heavier vehicle combinations would be a safety risk in relation to overtaking and this has been and is a discussion when comparing vehicles 18.75 m long with 25.25 m long vehicles. The few attempts we had so far in Sweden with HCT-vehicles, i.e. up to 32 m long, has also given rise to such a discussion.
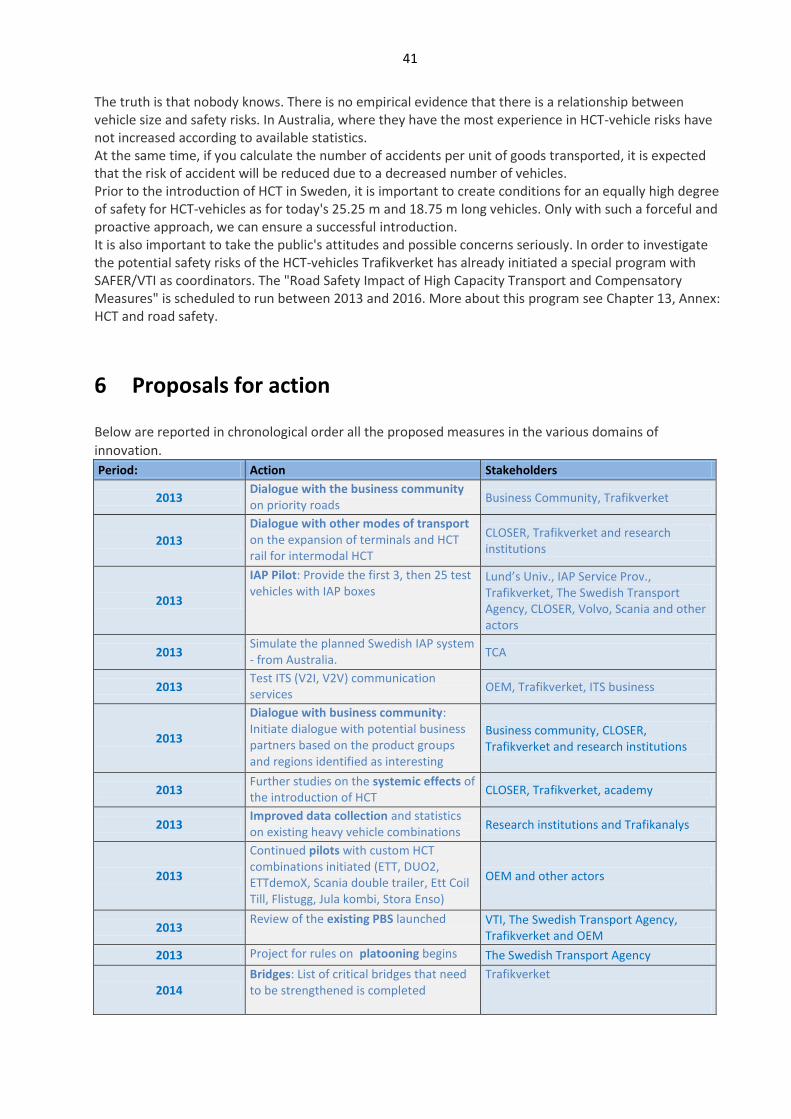
41
The truth is that nobody knows. There is no empirical evidence that there is a relationship between vehicle size and safety risks. In Australia, where they have the most experience in HCT-vehicle risks have not increased according to available statistics. At the same time, if you calculate the number of accidents per unit of goods transported, it is expected that the risk of accident will be reduced due to a decreased number of vehicles. Prior to the introduction of HCT in Sweden, it is important to create conditions for an equally high degree of safety for HCT-vehicles as for today's 25.25 m and 18.75 m long vehicles. Only with such a forceful and proactive approach, we can ensure a successful introduction. It is also important to take the public's attitudes and possible concerns seriously. In order to investigate the potential safety risks of the HCT-vehicles Trafikverket has already initiated a special program with SAFER/VTI as coordinators. The "Road Safety Impact of High Capacity Transport and Compensatory Measures" is scheduled to run between 2013 and 2016. More about this program see Chapter 13, Annex: HCT and road safety.
6 Proposals for action
Below are reported in chronological order all the proposed measures in the various domains of
innovation.
Period: Action Stakeholders
2013 Dialogue with the business community on priority roads
Business Community, Trafikverket
2013
Dialogue with other modes of transport on the expansion of terminals and HCT rail for intermodal HCT
CLOSER, Trafikverket and research institutions
2013
IAP Pilot: Provide the first 3, then 25 test vehicles with IAP boxes
Lund’s Univ., IAP Service Prov., Trafikverket, The Swedish Transport Agency, CLOSER, Volvo, Scania and other actors
2013 Simulate the planned Swedish IAP system - from Australia.
TCA
2013 Test ITS (V2I, V2V) communication services
OEM, Trafikverket, ITS business
2013
Dialogue with business community: Initiate dialogue with potential business partners based on the product groups and regions identified as interesting
Business community, CLOSER, Trafikverket and research institutions
2013 Further studies on the systemic effects of the introduction of HCT
CLOSER, Trafikverket, academy
2013 Improved data collection and statistics on existing heavy vehicle combinations
Research institutions and Trafikanalys
2013
Continued pilots with custom HCT combinations initiated (ETT, DUO2, ETTdemoX, Scania double trailer, Ett Coil Till, Flistugg, Jula kombi, Stora Enso)
OEM and other actors
2013 Review of the existing PBS launched VTI, The Swedish Transport Agency,
Trafikverket and OEM
2013 Project for rules on platooning begins The Swedish Transport Agency
2014 Bridges: List of critical bridges that need to be strengthened is completed
Trafikverket
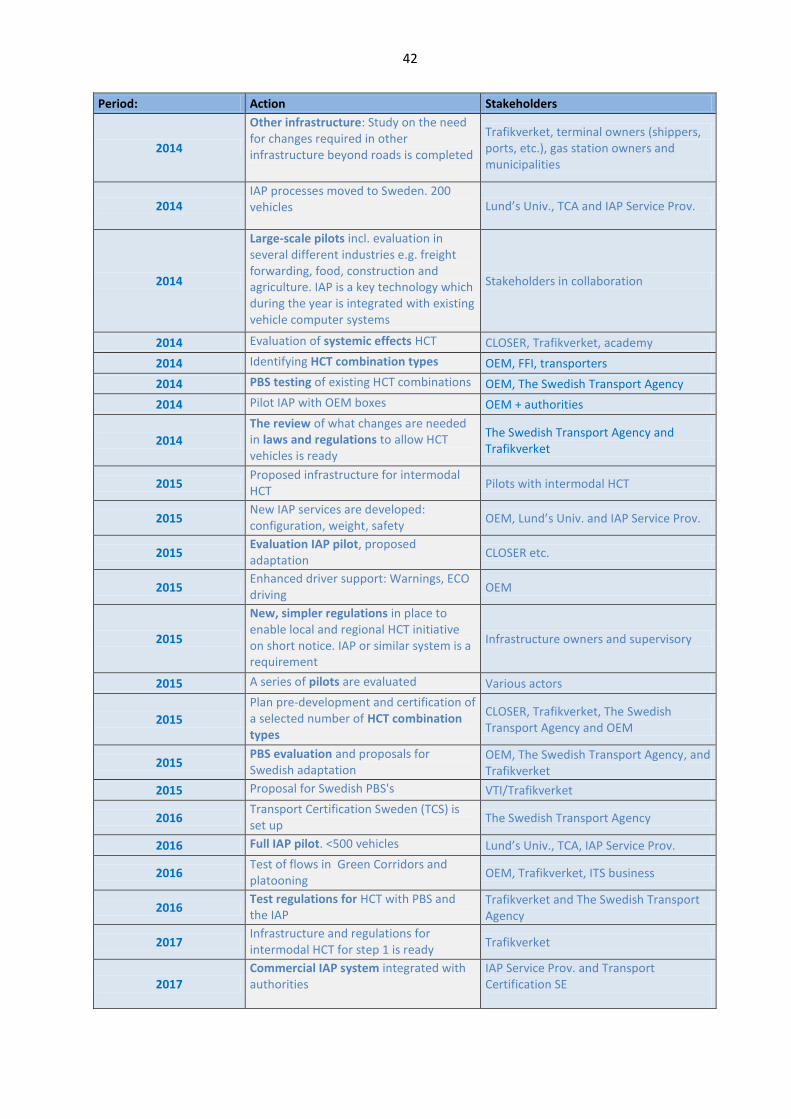
42
Period: Action Stakeholders
2014
Other infrastructure: Study on the need for changes required in other infrastructure beyond roads is completed
Trafikverket, terminal owners (shippers, ports, etc.), gas station owners and municipalities
2014 IAP processes moved to Sweden. 200 vehicles Lund’s Univ., TCA and IAP Service Prov.
2014
Large-scale pilots incl. evaluation in several different industries e.g. freight forwarding, food, construction and agriculture. IAP is a key technology which during the year is integrated with existing vehicle computer systems
Stakeholders in collaboration
2014 Evaluation of systemic effects HCT CLOSER, Trafikverket, academy
2014 Identifying HCT combination types OEM, FFI, transporters
2014 PBS testing of existing HCT combinations OEM, The Swedish Transport Agency
2014 Pilot IAP with OEM boxes OEM + authorities
2014
The review of what changes are needed in laws and regulations to allow HCT vehicles is ready
The Swedish Transport Agency and Trafikverket
2015 Proposed infrastructure for intermodal HCT
Pilots with intermodal HCT
2015 New IAP services are developed: configuration, weight, safety
OEM, Lund’s Univ. and IAP Service Prov.
2015 Evaluation IAP pilot, proposed adaptation
CLOSER etc.
2015 Enhanced driver support: Warnings, ECO driving
OEM
2015
New, simpler regulations in place to enable local and regional HCT initiative on short notice. IAP or similar system is a requirement
Infrastructure owners and supervisory
2015 A series of pilots are evaluated Various actors
2015
Plan pre-development and certification of a selected number of HCT combination types
CLOSER, Trafikverket, The Swedish Transport Agency and OEM
2015 PBS evaluation and proposals for Swedish adaptation
OEM, The Swedish Transport Agency, and Trafikverket
2015 Proposal for Swedish PBS's VTI/Trafikverket
2016 Transport Certification Sweden (TCS) is set up
The Swedish Transport Agency
2016 Full IAP pilot. <500 vehicles Lund’s Univ., TCA, IAP Service Prov.
2016 Test of flows in Green Corridors and platooning
OEM, Trafikverket, ITS business
2016 Test regulations for HCT with PBS and the IAP
Trafikverket and The Swedish Transport Agency
2017 Infrastructure and regulations for intermodal HCT for step 1 is ready
Trafikverket
2017 Commercial IAP system integrated with authorities
IAP Service Prov. and Transport Certification SE
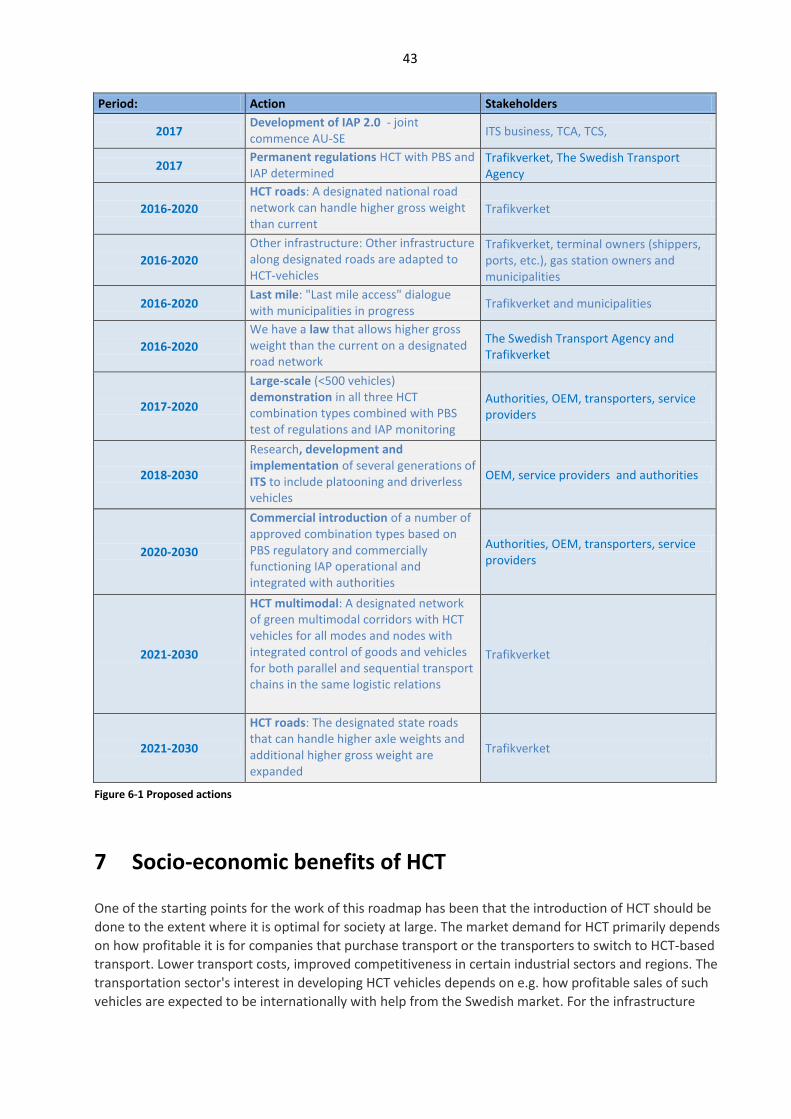
43
Period: Action Stakeholders
2017 Development of IAP 2.0 - joint commence AU-SE
ITS business, TCA, TCS,
2017 Permanent regulations HCT with PBS and IAP determined
Trafikverket, The Swedish Transport Agency
2016-2020
HCT roads: A designated national road network can handle higher gross weight than current
Trafikverket
2016-2020
Other infrastructure: Other infrastructure along designated roads are adapted to HCT-vehicles
Trafikverket, terminal owners (shippers, ports, etc.), gas station owners and municipalities
2016-2020 Last mile: "Last mile access" dialogue with municipalities in progress
Trafikverket and municipalities
2016-2020
We have a law that allows higher gross weight than the current on a designated road network
The Swedish Transport Agency and Trafikverket
2017-2020
Large-scale (<500 vehicles) demonstration in all three HCT combination types combined with PBS test of regulations and IAP monitoring
Authorities, OEM, transporters, service providers
2018-2030
Research, development and implementation of several generations of ITS to include platooning and driverless vehicles
OEM, service providers and authorities
2020-2030
Commercial introduction of a number of approved combination types based on PBS regulatory and commercially functioning IAP operational and integrated with authorities
Authorities, OEM, transporters, service providers
2021-2030
HCT multimodal: A designated network of green multimodal corridors with HCT vehicles for all modes and nodes with integrated control of goods and vehicles for both parallel and sequential transport chains in the same logistic relations
Trafikverket
2021-2030
HCT roads: The designated state roads that can handle higher axle weights and additional higher gross weight are expanded
Trafikverket
Figure 6-1 Proposed actions
7 Socio-economic benefits of HCT
One of the starting points for the work of this roadmap has been that the introduction of HCT should be
done to the extent where it is optimal for society at large. The market demand for HCT primarily depends
on how profitable it is for companies that purchase transport or the transporters to switch to HCT-based
transport. Lower transport costs, improved competitiveness in certain industrial sectors and regions. The
transportation sector's interest in developing HCT vehicles depends on e.g. how profitable sales of such
vehicles are expected to be internationally with help from the Swedish market. For the infrastructure
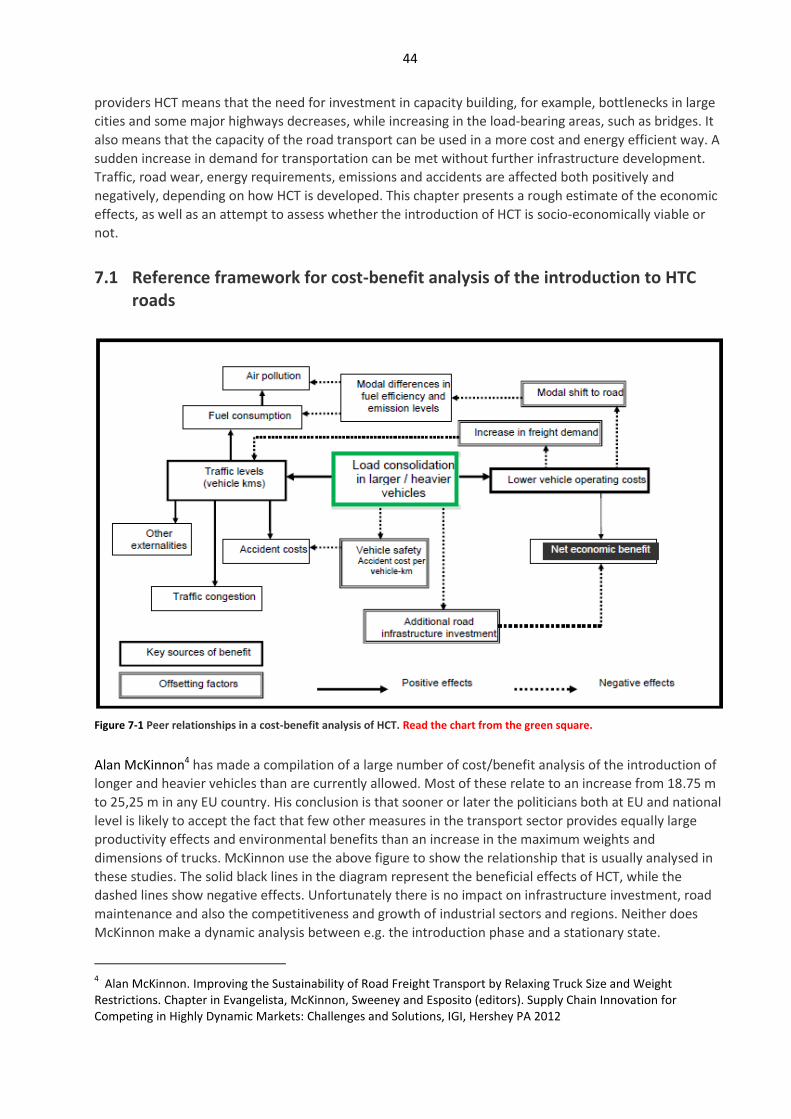
44
providers HCT means that the need for investment in capacity building, for example, bottlenecks in large
cities and some major highways decreases, while increasing in the load-bearing areas, such as bridges. It
also means that the capacity of the road transport can be used in a more cost and energy efficient way. A
sudden increase in demand for transportation can be met without further infrastructure development.
Traffic, road wear, energy requirements, emissions and accidents are affected both positively and
negatively, depending on how HCT is developed. This chapter presents a rough estimate of the economic
effects, as well as an attempt to assess whether the introduction of HCT is socio-economically viable or
not.
7.1 Reference framework for cost-benefit analysis of the introduction to HTC roads
Figure 7-1 Peer relationships in a cost-benefit analysis of HCT. Read the chart from the green square.
Alan McKinnon4 has made a compilation of a large number of cost/benefit analysis of the introduction of
longer and heavier vehicles than are currently allowed. Most of these relate to an increase from 18.75 m
to 25,25 m in any EU country. His conclusion is that sooner or later the politicians both at EU and national
level is likely to accept the fact that few other measures in the transport sector provides equally large
productivity effects and environmental benefits than an increase in the maximum weights and
dimensions of trucks. McKinnon use the above figure to show the relationship that is usually analysed in
these studies. The solid black lines in the diagram represent the beneficial effects of HCT, while the
dashed lines show negative effects. Unfortunately there is no impact on infrastructure investment, road
maintenance and also the competitiveness and growth of industrial sectors and regions. Neither does
McKinnon make a dynamic analysis between e.g. the introduction phase and a stationary state.
4 Alan McKinnon. Improving the Sustainability of Road Freight Transport by Relaxing Truck Size and Weight
Restrictions. Chapter in Evangelista, McKinnon, Sweeney and Esposito (editors). Supply Chain Innovation for Competing in Highly Dynamic Markets: Challenges and Solutions, IGI, Hershey PA 2012
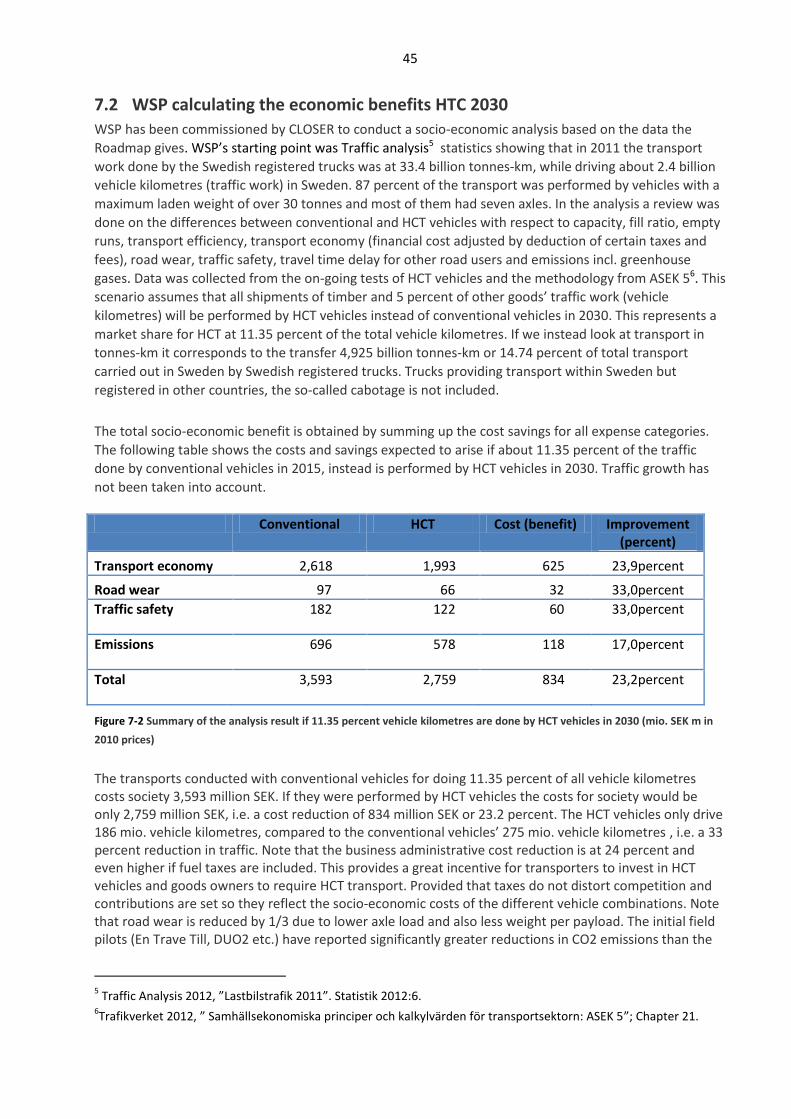
45
7.2 WSP calculating the economic benefits HTC 2030
WSP has been commissioned by CLOSER to conduct a socio-economic analysis based on the data the
Roadmap gives. WSP’s starting point was Traffic analysis5 statistics showing that in 2011 the transport
work done by the Swedish registered trucks was at 33.4 billion tonnes-km, while driving about 2.4 billion
vehicle kilometres (traffic work) in Sweden. 87 percent of the transport was performed by vehicles with a
maximum laden weight of over 30 tonnes and most of them had seven axles. In the analysis a review was
done on the differences between conventional and HCT vehicles with respect to capacity, fill ratio, empty
runs, transport efficiency, transport economy (financial cost adjusted by deduction of certain taxes and
fees), road wear, traffic safety, travel time delay for other road users and emissions incl. greenhouse
gases. Data was collected from the on-going tests of HCT vehicles and the methodology from ASEK 56. This
scenario assumes that all shipments of timber and 5 percent of other goods’ traffic work (vehicle
kilometres) will be performed by HCT vehicles instead of conventional vehicles in 2030. This represents a
market share for HCT at 11.35 percent of the total vehicle kilometres. If we instead look at transport in
tonnes-km it corresponds to the transfer 4,925 billion tonnes-km or 14.74 percent of total transport
carried out in Sweden by Swedish registered trucks. Trucks providing transport within Sweden but
registered in other countries, the so-called cabotage is not included.
The total socio-economic benefit is obtained by summing up the cost savings for all expense categories.
The following table shows the costs and savings expected to arise if about 11.35 percent of the traffic
done by conventional vehicles in 2015, instead is performed by HCT vehicles in 2030. Traffic growth has
not been taken into account.
Conventional HCT Cost (benefit) Improvement (percent)
Transport economy 2,618 1,993 625 23,9percent
Road wear 97 66 32 33,0percent
Traffic safety 182 122 60 33,0percent
Emissions 696 578 118 17,0percent
Total 3,593 2,759 834 23,2percent
Figure 7-2 Summary of the analysis result if 11.35 percent vehicle kilometres are done by HCT vehicles in 2030 (mio. SEK m in
2010 prices)
The transports conducted with conventional vehicles for doing 11.35 percent of all vehicle kilometres costs society 3,593 million SEK. If they were performed by HCT vehicles the costs for society would be only 2,759 million SEK, i.e. a cost reduction of 834 million SEK or 23.2 percent. The HCT vehicles only drive 186 mio. vehicle kilometres, compared to the conventional vehicles’ 275 mio. vehicle kilometres , i.e. a 33 percent reduction in traffic. Note that the business administrative cost reduction is at 24 percent and even higher if fuel taxes are included. This provides a great incentive for transporters to invest in HCT vehicles and goods owners to require HCT transport. Provided that taxes do not distort competition and contributions are set so they reflect the socio-economic costs of the different vehicle combinations. Note that road wear is reduced by 1/3 due to lower axle load and also less weight per payload. The initial field pilots (En Trave Till, DUO2 etc.) have reported significantly greater reductions in CO2 emissions than the
5 Traffic Analysis 2012, ”Lastbilstrafik 2011”. Statistik 2012:6.
6Trafikverket 2012, ” Samhällsekonomiska principer och kalkylvärden för transportsektorn: ASEK 5”; Chapter 21.
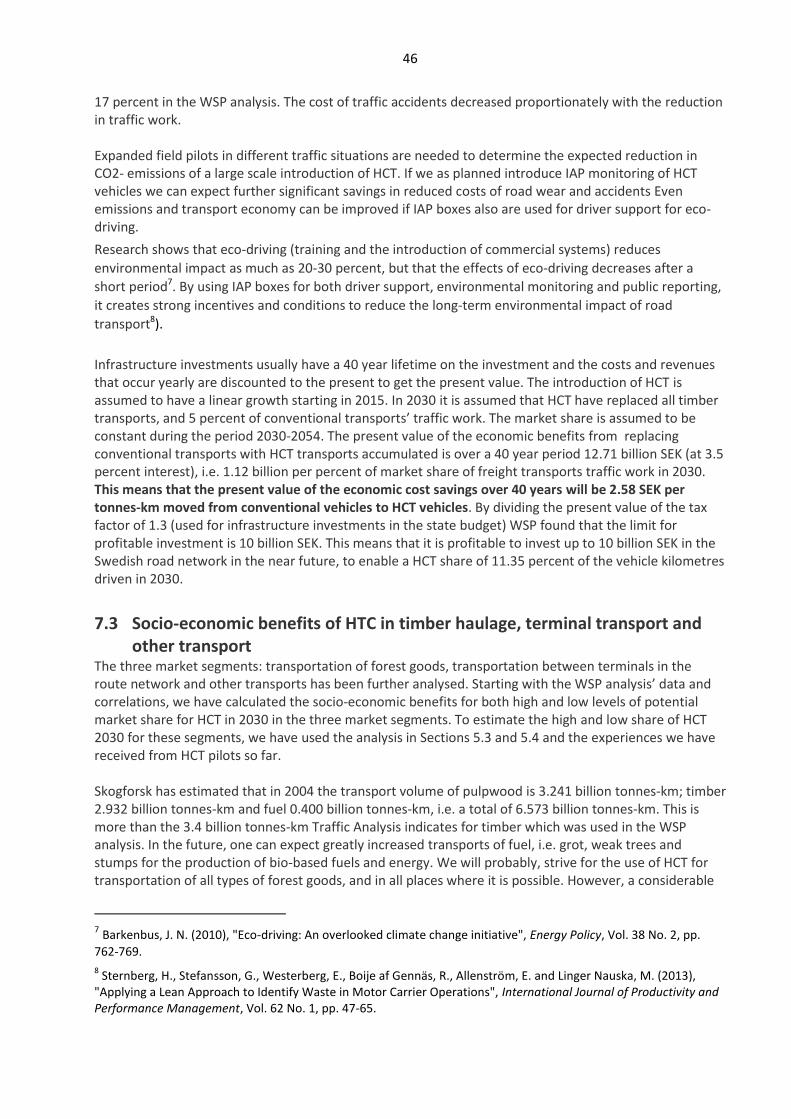
46
17 percent in the WSP analysis. The cost of traffic accidents decreased proportionately with the reduction in traffic work. Expanded field pilots in different traffic situations are needed to determine the expected reduction in CO2- emissions of a large scale introduction of HCT. If we as planned introduce IAP monitoring of HCT vehicles we can expect further significant savings in reduced costs of road wear and accidents Even emissions and transport economy can be improved if IAP boxes also are used for driver support for eco-driving.
Research shows that eco-driving (training and the introduction of commercial systems) reduces
environmental impact as much as 20-30 percent, but that the effects of eco-driving decreases after a
short period7. By using IAP boxes for both driver support, environmental monitoring and public reporting,
it creates strong incentives and conditions to reduce the long-term environmental impact of road
transport8).
Infrastructure investments usually have a 40 year lifetime on the investment and the costs and revenues that occur yearly are discounted to the present to get the present value. The introduction of HCT is assumed to have a linear growth starting in 2015. In 2030 it is assumed that HCT have replaced all timber transports, and 5 percent of conventional transports’ traffic work. The market share is assumed to be constant during the period 2030-2054. The present value of the economic benefits from replacing conventional transports with HCT transports accumulated is over a 40 year period 12.71 billion SEK (at 3.5 percent interest), i.e. 1.12 billion per percent of market share of freight transports traffic work in 2030. This means that the present value of the economic cost savings over 40 years will be 2.58 SEK per tonnes-km moved from conventional vehicles to HCT vehicles. By dividing the present value of the tax factor of 1.3 (used for infrastructure investments in the state budget) WSP found that the limit for profitable investment is 10 billion SEK. This means that it is profitable to invest up to 10 billion SEK in the Swedish road network in the near future, to enable a HCT share of 11.35 percent of the vehicle kilometres driven in 2030.
7.3 Socio-economic benefits of HTC in timber haulage, terminal transport and other transport
The three market segments: transportation of forest goods, transportation between terminals in the route network and other transports has been further analysed. Starting with the WSP analysis’ data and correlations, we have calculated the socio-economic benefits for both high and low levels of potential market share for HCT in 2030 in the three market segments. To estimate the high and low share of HCT 2030 for these segments, we have used the analysis in Sections 5.3 and 5.4 and the experiences we have received from HCT pilots so far. Skogforsk has estimated that in 2004 the transport volume of pulpwood is 3.241 billion tonnes-km; timber 2.932 billion tonnes-km and fuel 0.400 billion tonnes-km, i.e. a total of 6.573 billion tonnes-km. This is more than the 3.4 billion tonnes-km Traffic Analysis indicates for timber which was used in the WSP analysis. In the future, one can expect greatly increased transports of fuel, i.e. grot, weak trees and stumps for the production of bio-based fuels and energy. We will probably, strive for the use of HCT for transportation of all types of forest goods, and in all places where it is possible. However, a considerable
7 Barkenbus, J. N. (2010), "Eco-driving: An overlooked climate change initiative", Energy Policy, Vol. 38 No. 2, pp.
762-769.
8 Sternberg, H., Stefansson, G., Westerberg, E., Boije af Gennäs, R., Allenström, E. and Linger Nauska, M. (2013),
"Applying a Lean Approach to Identify Waste in Motor Carrier Operations", International Journal of Productivity and Performance Management, Vol. 62 No. 1, pp. 47-65.
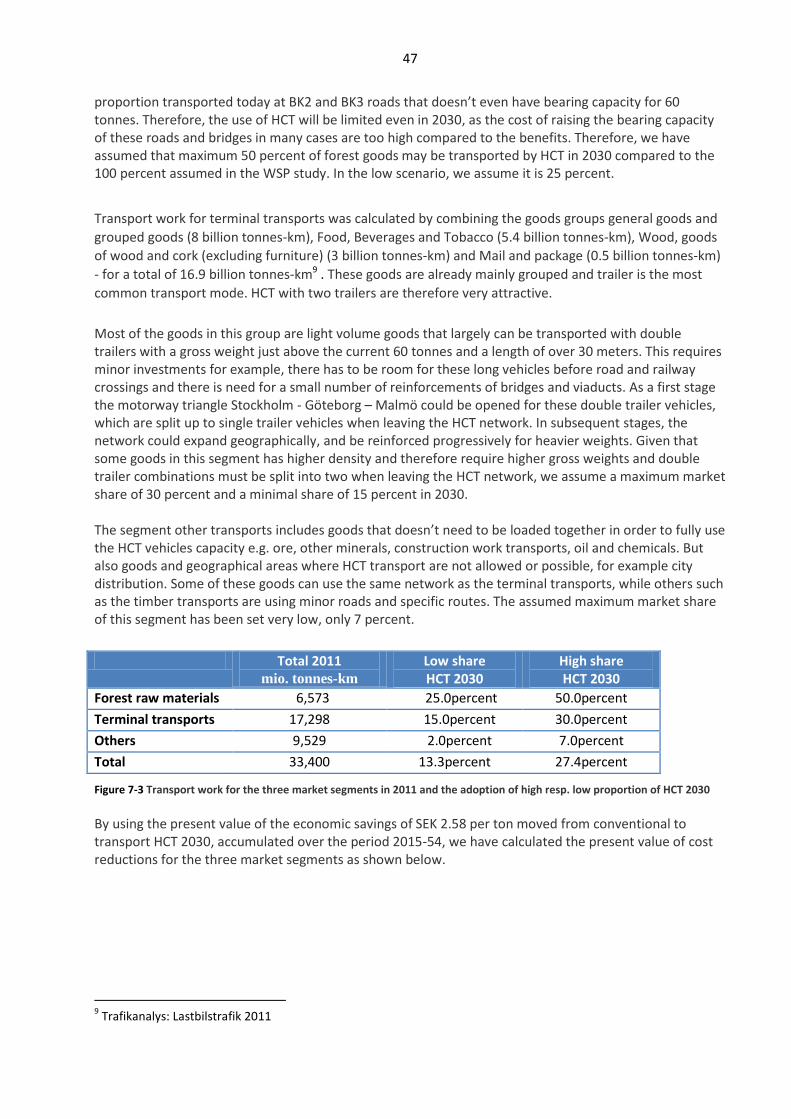
47
proportion transported today at BK2 and BK3 roads that doesn’t even have bearing capacity for 60 tonnes. Therefore, the use of HCT will be limited even in 2030, as the cost of raising the bearing capacity of these roads and bridges in many cases are too high compared to the benefits. Therefore, we have assumed that maximum 50 percent of forest goods may be transported by HCT in 2030 compared to the 100 percent assumed in the WSP study. In the low scenario, we assume it is 25 percent.
Transport work for terminal transports was calculated by combining the goods groups general goods and
grouped goods (8 billion tonnes-km), Food, Beverages and Tobacco (5.4 billion tonnes-km), Wood, goods
of wood and cork (excluding furniture) (3 billion tonnes-km) and Mail and package (0.5 billion tonnes-km)
- for a total of 16.9 billion tonnes-km9 . These goods are already mainly grouped and trailer is the most
common transport mode. HCT with two trailers are therefore very attractive.
Most of the goods in this group are light volume goods that largely can be transported with double trailers with a gross weight just above the current 60 tonnes and a length of over 30 meters. This requires minor investments for example, there has to be room for these long vehicles before road and railway crossings and there is need for a small number of reinforcements of bridges and viaducts. As a first stage the motorway triangle Stockholm - Göteborg – Malmö could be opened for these double trailer vehicles, which are split up to single trailer vehicles when leaving the HCT network. In subsequent stages, the network could expand geographically, and be reinforced progressively for heavier weights. Given that some goods in this segment has higher density and therefore require higher gross weights and double trailer combinations must be split into two when leaving the HCT network, we assume a maximum market share of 30 percent and a minimal share of 15 percent in 2030. The segment other transports includes goods that doesn’t need to be loaded together in order to fully use the HCT vehicles capacity e.g. ore, other minerals, construction work transports, oil and chemicals. But also goods and geographical areas where HCT transport are not allowed or possible, for example city distribution. Some of these goods can use the same network as the terminal transports, while others such as the timber transports are using minor roads and specific routes. The assumed maximum market share of this segment has been set very low, only 7 percent.
Total 2011 mio. tonnes-km
Low share HCT 2030
High share HCT 2030
Forest raw materials 6,573 25.0percent 50.0percent
Terminal transports 17,298 15.0percent 30.0percent
Others 9,529 2.0percent 7.0percent
Total 33,400 13.3percent 27.4percent
Figure 7-3 Transport work for the three market segments in 2011 and the adoption of high resp. low proportion of HCT 2030
By using the present value of the economic savings of SEK 2.58 per ton moved from conventional to transport HCT 2030, accumulated over the period 2015-54, we have calculated the present value of cost reductions for the three market segments as shown below.
9 Trafikanalys: Lastbilstrafik 2011
48
Total 2011 mio. tonnes-km
Cost Low share HCT mio. SEK 2030
Cost High share HCT mio. SEK 2030
Forest raw materials 6,573 4,239 8,478
Terminal transports 17,298 6,695 12,388
Others 9,529 493 1,721
Total 33,400 11,427 23,586
Figure 7-4 The present value of social benefits 2015-54 for the three market segments at high and a low proportion of HCT
2030 (million SEK in 2010 prices)
7.4 The introduction of HCT shifts the focus in investment in infrastructure For infrastructure owners HCT reduces the need for investment in capacity building, for example, bottlenecks in large cities and on some motorways can be delayed, while the investment in increasing bearing capacity on e.g. bridges in many cases must be done before HCT vehicles can be allowed. The effect of HCT gives around 20-30 percent more tonnes-km/year for each meter of roadway. Thus, there is room for some increase in transport work, without increasing the traffic volume and without the need for investments to increase capacity. The experience in Australia is that after the introduction of continuously larger vehicles has absorbed the increases in transport work, without increasing vehicle mileage and with a marginal increase in CO2 emissions. However, we have no information to whether this has led to the postponement of investment to increase the capacity, nor if those freed investment funds has been used for investments to enable more HCT vehicles. A reduced need for investments can be regarded as a socio-economic cost saving and can be added to the other savings that we outlined in the previous section. Since the reduction of the traffic volume is given as the main reason for the introduction of HCT, calculation methods and data should be produced to quantify these savings.
A reduction of traffic also leads to less congestion and reduced travel times unless mileage increases. However, the travel time for other road user can be extended if HCT vehicles accelerate slower or drive more cautious in roundabouts compared to conventional vehicles. WSP assumed that these effects cancel each other out. As reported in section 5.1 subdomain 1, Trafikverket made an update of the 2009 study of the costs of upgrading the bearing capacity on the designated road network: E4, E6, E18, E20, and highways 32, 40, 50, 55 and 56. An upgrade to 80 tonnes and 32 m is estimated to cost about 1.5 billion SEK and an upgrade to 74 tonnes and 25.25 m about 2.1 billion. These designated routes should primarily be considered for HCT transport between terminals for general cargo and grouped goods, which according to the above calculation would be profitable if investment requirements are below 6.7 to 13.4 billion SEK. The savings are about 5 times greater than the estimated investments cost and a sensitivity analysis shows that the investment to 80 tonnes/32 m is profitable even if HCT only reach a market of 3.4 percent. Therefore, we asses that investments in increasing bearing capacity on the core designated road network is socio-economically very profitable. If we also take into account that a transition to HCT reduces traffic and the need for capacity investments, as discussed in the beginning of this section, then the upgrade for HCT is even more profitable. Such a top-down investment in a dedicated HCT network can also be used for transports in the other two market segments, in which case the calculation will be even more positive. However, the timber transports will require reinforcements of bearing capacity also on the smaller roads. The same applies for the mining and construction transports. Suitably HCT vehicles will be permitted to drive in limited area, provided that they do not use designated vulnerable infrastructure. A HCT fee that
49
goes to an insurance fund could reimburse damages done to infrastructure by HCT vehicles. The permits for the on-going efforts by 76 tonnes ST vehicles are set up this way. As the use of HCT increases you can gradually reinforce this vulnerable infrastructure through a bottom-up process with investment calculation for each infrastructure element and/or HCT permit. The investment made to allow 90 tonnes vehicles for the transportation of iron ore from the mine north of Pajala to Malmbanan is a good example of such a bottom-up approach. As long as the investments that primarily benefits the use of HCT in timber transports is less than 4.2 billion SEK to reach a HCT share of 25 percent or less than 8.5 billion to reach a 50 percent share of HCT, it is socio-economically viable.
7.5 Discussion WSP conducted its analysis in a short time and with great uncertainties in assumptions and the available data. This meant that they had to take many shortcuts which are important to keep in mind when interpreting the results. There are a number of assumptions under which the analysis has some weaknesses/limitations which are listed below. The biggest uncertainty lies in the estimate of the market shares of HCT are expected to have in 2030 for the different market segments, as well as the investment needed to achieve this market share. In the WSP-analysis, a zero growth in transport was assumed and that prices and performance remained fixed at 2010 levels until the 2054. And also the higher the growth in transport and the higher the CO2 prices the higher cost savings with HCT. WSP based the analysis on the traffic performance by market segment as reported in Traffic Analysis’ statistics. However, there are "loopholes" in the raw data, such as lack of statistics on transport by vehicles registered abroad and the existing number of 24 to 25.25 m vehicles, what they are used for and where they are used. The division between company-owned vehicles and vehicles in commercial transport would also be of interest, since both utilization of capacity and mileage of company owned vehicles is significantly lower than for vehicles in commercial transport. Statistics are also missing on the goods’ density and thus if the capacity limit is in relation to weight or volume. We have therefore in some cases found a back door for the calculations by starting with tonnes-km and calculated the number of tonnes-km per truck based on assumptions on share of empty runs, capacity use, load weight, weight or volume limitation and average mileage. The amount of vehicles is calculated by dividing tonnes-km with estimated tonnes-km per vehicle. Vehicle mileage is calculated by multiplying the estimated number of vehicles and the average mileage. In the supplementary analysis of high and low scenario for the three market segments, it was assumed that the proceeds from switching from conventional vehicle to HCT was the same per tonnes-km for all segments. In reality, the proceeds are very situation specific, and some differences should be made even between the goods. The chosen assumptions can be wrong on conventional vehicles or HCT vehicles or on both.
A built-in assumption in the calculation is that the higher load capacity does not generate extra traffic work the start/endpoints. In many situations, especially in the beginning when the HCT network is not developed, will e.g. the DUO combinations with two trailers have to be split up into two vehicles with one trailer, when leaving the HCT network is left for the "last mile". Besides the extra mileage there are also costs for manoeuvring when splitting up the vehicle. This compares with the railway situation where goods on rail require further distribution the consignee of the goods, because few companies have sidings. A delimitation in this analysis is that the effects on other modes have not been included in the calculation. We assume that the policy is to make every mode of transport as efficiently as possible and, where necessary, regulate the distribution between modes with measures. The work on the HCT-road roadmap has been done in close cooperation with the parallel work in the HCT-rail roadmap and our proposal is
50
that both should be implemented simultaneously, thereby reducing the risk of an unwanted mix between modes or increases in emissions of greenhouse gases. One measure could be to prioritize the upgrading of roads to ports and rail terminals to HCT standard. Another variation is to offer good owners so-called a-modal transport, where shippers primarily allocate the transports to the “CO2-friendly” sea and rail alternatives, and when they are full or due to time limitations then transports are done with HCT vehicles. This concept has been proposed for the so-called "Green corridors". In the experiments in progress with HCT vehicles transporting steel coils from Sölvesborg port to Volvo's factory in Olofström, HCT has enabled energy efficient maritime transport from steel mills on the European continent and freed rail capacity in a bottleneck on the main line. Alan McKinnon's frame of reference in Figure 7-1 above shows that efficient transports can lead to lower prices, which in turn can lead to increases in transports, for example by making it more profitable for the business community to choose partners further away, based on small price difference compared with the partners close. Worst case scenario is that the traffic volume increases despite increased consolidation to the larger HCT vehicles. The risk of this so-called rebound effect is small and is completely eliminated if the costs of CO2 and/or other taxes are simultaneously increased, as planned to reduce the climate impact of transport.
If we broaden the perspective and look at society as a whole, the introduction of HCT can give additional benefits that should be analysed and considered. The lowered transport costs lead to improved competitiveness for the companies buying transports e.g. industries and regions, especially for those who have a high share of transport costs in its value adding process. HCT can reduce transport costs with up to 30 percent. For the primary industry, where 50 percent and the value added consists of the logistics and more than half is transportation. This would mean that the price of their goods could be reduced by about 7.5 percent. This would give a significant increase in competitiveness in the fierce and price sensitive global market. One can also express this as the distances between the processing nodes in Sweden is not 4 times longer than our competitors on the continent anymore, but has shrunk to just 2.8 times longer, or that the distance to the centre of Europe has shrunk from 1,000 km to 700 km. Moreover, the introduction of HCT provides both the automotive and IT industry with a boost to innovation and increased exports. In summary, it is concluded that based on the assumptions and sensitivity analysis, the introduction of HCT socio-economically viable. The first proposed steps of HCT introduction is obvious socio-economically very profitable. However, it’s unclear, what investments might be required and which of these can be postponed, and the pace and extent to which HCT should be introduced. Conservative estimates of HCT market for timber transports,, transports between terminals and other transports are expected to provide a public benefit that justifies increased investments in infrastructure at 11 - 24 billion SEK with, which would go pretty far. The first steps, for example on the busy road network and for dedicated routes, are probably highly profitable. However, we have not assessed the viability of the measures required to enable HCT vehicles on minor roads, e.g. to get to the woods. It is therefore important to collect better statistics on how transports are done in reality and which types of vehicles are used. It is also important to extend the pilots with HCT transports to several different kinds of goods, roads and transport situations in order to gain experience and statistics. This will gradually become a base for making better informed decisions about investments in infrastructure and the development of HCT solutions, with increasing social benefits.
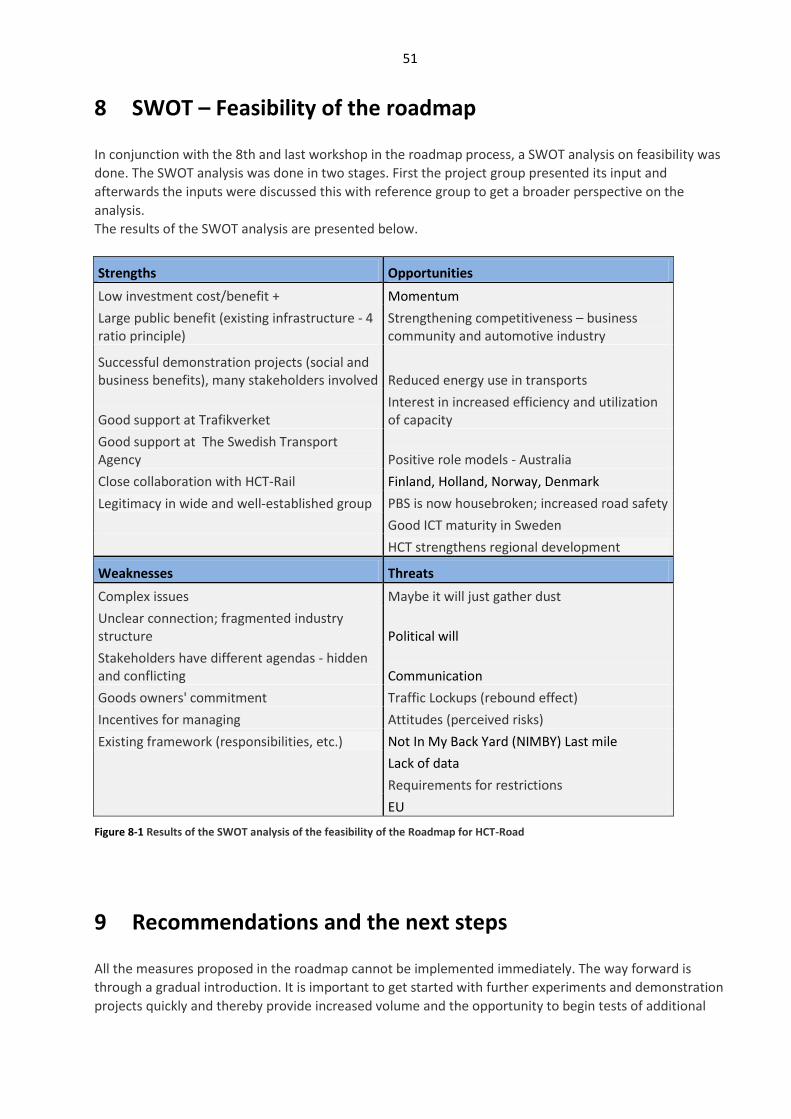
51
8 SWOT – Feasibility of the roadmap
In conjunction with the 8th and last workshop in the roadmap process, a SWOT analysis on feasibility was
done. The SWOT analysis was done in two stages. First the project group presented its input and
afterwards the inputs were discussed this with reference group to get a broader perspective on the
analysis.
The results of the SWOT analysis are presented below.
Strengths Opportunities
Low investment cost/benefit + Momentum
Large public benefit (existing infrastructure - 4 ratio principle)
Strengthening competitiveness – business community and automotive industry
Successful demonstration projects (social and business benefits), many stakeholders involved Reduced energy use in transports
Good support at Trafikverket Interest in increased efficiency and utilization of capacity
Good support at The Swedish Transport Agency Positive role models - Australia
Close collaboration with HCT-Rail Finland, Holland, Norway, Denmark
Legitimacy in wide and well-established group PBS is now housebroken; increased road safety
Good ICT maturity in Sweden
HCT strengthens regional development
Weaknesses Threats
Complex issues Maybe it will just gather dust
Unclear connection; fragmented industry structure Political will
Stakeholders have different agendas - hidden and conflicting Communication
Goods owners' commitment Traffic Lockups (rebound effect)
Incentives for managing Attitudes (perceived risks)
Existing framework (responsibilities, etc.) Not In My Back Yard (NIMBY) Last mile
Lack of data
Requirements for restrictions
EU
Figure 8-1 Results of the SWOT analysis of the feasibility of the Roadmap for HCT-Road
9 Recommendations and the next steps
All the measures proposed in the roadmap cannot be implemented immediately. The way forward is
through a gradual introduction. It is important to get started with further experiments and demonstration
projects quickly and thereby provide increased volume and the opportunity to begin tests of additional
52
features. This will continuously give more experience of how the system works in the everyday traffic at a
large-scale. It is important to involve different research environments and disciplines before, during and
after the demonstration projects to cover different perspectives and ensure progress.
In the analysis of the proposed measures a number of "waves" that come one after the other over a
number of years, can be identified. These "waves" contains an increasingly perfected HCT system,
providing an increasing market share for HCT:
Testing of individual HCT vehicle combinations along a specific route, such as ETT and DUO2.
Test of more HCT vehicle combinations in a transport chain, e.g. Ett Coil Till (ECT) in multimodal transport solutions, ST vehicles or mobile cranes in a dedicated area.
Large-scale pilots in several different industries, including freight forwarding, food, building and construction, mining, forestry and agriculture. IAP is in this context a key technology that integrates with existing vehicle computer systems. Requires provisional regulations.
Large-scale (<500 vehicles) demonstration in all three HCT combinations types combined with PBS test regulations and IAP monitoring.
HCT road network with different classes by vehicle types. Appropriate upgrades of road network in stages, e.g. 25 m from 60 to 76 tonnes with existing axle loads, 32 m from 80 to 90 tonnes, more than 10 tonnes axle load etc. First core network of green corridors, then continuously more and more dense. In addition to this, in every step there would be arrangements for even larger vehicle combinations to obtain permission through individual examination (PBS + regulation) for specific routes.
HCT multimodal: A designated network of green multimodal corridors with HCT vehicles for all transport modes and nodes with integrated management of goods and vehicles for both parallel and sequential transport chains in the same logistics relationship.
For the fastest possible introduction there should be a parallel to the top-down approach above, a
bottom-up approach beginning now for the development of specific HCT combinations and adapt the
infrastructure along the specific route for these combinations. It implies rapidly to increase the extent of
test activity on specific routes. The solutions then become permanent.
There are also already several proposals for new demo project:
ETTdemoX: Various projects with multi-modal features
Ett Coil Till: Sölvesborg port - Olofström with coils at the Volvo factory extended with scrap back down to the harbour, where some go by boat and some by train to Malmö for forwarding bet boat to the United States
Scania double trailer: Twin-trailer rigs between Södertälje and Helsingborg for forwarding to Scania's central warehouse in Zwolle. Scania run daily a number of trailers between Södertälje and Zwolle and could usefully run these as a double rig
FLIS: Fewer trucks in urban environments. Wood chewing load of 74 tonnes to reduce the number of transport in Skåne
Jula kombi: Multimodal projects with rail transport at Falkirk and then by road to Skara
StoraEnso: 2 x 40 'ISO containers between Nymölla and Helsingborg harbour
Parallel to the bottom-up activities, the work on a number of top-down measures should begin, in
order to develop HCT vehicle combinations (for different types of goods) and to upgrade parts of the
Swedish road network to a HCT road network, divided in different classes to match the vehicle
combinations.
Several of the measures proposed in the roadmap need to be decided on and put into effect as early
as 2013 if the targets for 2030 are to be met. The introduction of HCT on a broad base is not a quick
fix. In many ways it is about complex and lengthy processes.
This requires continuous dialogue and interaction between the players and the Forum must continue

53
to provide a platform for this cooperation. For the operational initiatives the R&D program already
initiated within CLOSER is a resource that can be used to coordinate further actions.
Finally, we suggest that this roadmap is updated within 3 years.
54
10 Annex: Modularity
10.1 Vehicle length and GCW Vehicle length and weight have no direct connection with each other, except that the heavier a vehicle or vehicle combination is, the more axes are needed and the weight needs to be distributed over a longer distance. For example, in volume goods, increased length is of great value, even without changing the weight of the vehicles. Length Sweden has long time experience with long road trains. Prior to 1968 there were no restrictions on length on our roads. Already in the mid-60’s half of the heavy vehicle trains were longer than 20 meters. and a few percent was more than 25 m and also vehicle trains longer than 30 m occurred. In 1968 the length was limited to 24 m, and this length was chosen in anticipation of a growing need to transport 20-foot containers. To transport 3 20-foot containers you need 24 m, but not more. This was part of an effort to stimulate intermodal transports because 20 - and 40-foot containers are designed for sea transport and present in large quantities around the world. In 1977 the Swedish government proposed to reduce the limit to maximum 18 m Sweden in the belief that this would improve traffic safety. But it got no sympathy for this because several studies demonstrated that the result would rather be the opposite. During the 1980’s, there were many different projects on creating innovative long and efficient vehicles and several concepts were tested, many of them based on various modular combinations. In 1985 the first European weight/dimensions Directive 85/3/EEC was presented and in the following years there were made several adjustments to the regulations, both nationally and internationally. In 1996 Directive 96/53/EC was presented and it is still in force.
Weight The weight for vehicles in Sweden has gradually increased throughout the 1900s. In the early 1980’s, the maximum gross weight on most of the road network was 51.4 tonnes. The business community was not satisfied with this limit, especially as the vehicle combinations used in e.g. timber transports had higher technical capacity. The forest industry has been a strong driving force for the continued increase in the maximum allowable gross weight and also allowed bogie load. Several inquiries were made and showed major benefits of an increase to 56 or 60 tonnes, and that the extra infrastructure cost would be moderate. Through the budget period of 1986/87 the government and parliament started a ten-year investment program. This resulted in a two stage development; in 1990 the maximum gross weight was increased to 56 tonnes and in 1995 to 60 tonnes, supplemented by an increase in the bogie pressure to 18 tonnes.
10.2 The modular system When Sweden and Finland joined the EU, problems occurred with our long vehicle combinations. At the time, the European Commission worked on making the vehicle directive applicable not just in international traffic, but also in national traffic. This would mean that Sweden and Finland would need to adapt the dimensions and weight to current European standard (maximum 16.5 m/18.35 m/40 tonnes). An impact study found that the negative effects would be significant because if the freight was transported by vehicles with smaller capacity, it would significantly increase traffic volume and result in higher transport costs for business. Similar investigations were made by Finland with similar results. Through hard work from the Swedish side the idea of a modular system was developed and Volvo presented it to the government, parliament and the business in 1992. The following year, the Swedish Minister for Transport presented the idea for the EU Commission who took to the idea. Therefore, in directive 96/53/EC the countries allowed couple EU modules "in a modular concept". At the same time, the EU standards for truck and trailer maximum length was increased from 18.35 m to 18.75 m. The
55
concept is based on the principle that the various existing European vehicle units ("modules"), truck, tractor, 13.6 m semi-trailer and 7.82 m trolley can be combined in many different ways. The purpose of the application of the modular concept system was partly so that Sweden (and Finland) could continue to have vehicles longer than the European maximum of 18,75m and to create a level playing field for foreign transporters, giving them the possibility to couple their short EU adapted vehicles into 25.25 m modular combinations when entering Sweden and vice versa, hence the requirement for EU modules.
10.3 The concept versus the system It is important to distinguish between modular concept ("Modular Concept") and the module system ("EMS", or "European Modular System") The concept simply means that Directive 96/53/EC allows member states to allow the EU units to be combined in different ways "According to a modular concept." This means that neither the length of 25.25 m or the weight of 60 tonnes are specified in the EU directive, these dimensions are national regulations for Sweden/Finland and has also been applied later in some other countries. The system means that we in Sweden (and some other countries) apply the modular concept, put it into a logistics system and adapt it to local conditions. In Sweden the length is set at maximum 25.25 m and the maximum weight at 60 tonnes. Furthermore there are special requirements for these vehicle combinations in addition to the standard requirements for the 24 m vehicles. Other European countries that use the module system has applied their limitations, such as limit the use to a specific network, have special requirements for vehicles and/or drivers, special rules on which types of goods that can be transported or requirement that the modules must be designed for intermodal transport. Swedish application In Sweden the base is still a maximum vehicle length of 24 m in addition to the allowed modular vehicles of 25.25 m and the maximum gross weight is in both cases 60 tonnes. The Swedish modular system is based on the combination of a 7.82 m unit (the largest loading platform in the CEN standard) and a 13.6 m unit (a semi-trailer, the longest vehicle in accordance with EU rules). This combination "happens to be" approximately 25.25 m. Since this is so close to our old 24-m total length, it poses no significant problems and the length of 25.25 m has been in force since 1st of November 1997. There are no special requirements that are caused by vehicle length for vehicles up to 24 m in length. If the vehicle combinations’ length exceeds 24 m, there are however specific requirements to the constituent vehicle units’ dimensions and equipment. The vehicle units shall not exceed the EU common dimensions. This means that the width must not exceed 2.55 m (2.60 m for temperature controlled units). This also applies to containers, swap bodies and other removable bodywork. There are also specific requirements for brakes, turning radius, steerable axles, pivot points etc. The on-going pilots of vehicle combinations longer than 25.25 m (timber vehicle ETT and the double combination DUO2), which both are based on the modular concept, are a new way of combining load modules 7.82 m and 13.6 m. The EU Directive 96/53/EC thus imposes no obstacle because it does not specify a maximum weight or length for modular combinations. It is the Swedish regulations that are affected by the use of modular vehicles bigger than 25.25 m/60 tonnes.
11 Annex: International perspectives
11.1 Definition of long vehicles
When classifying vehicle lengths a 20-foot container (6 meters) has often been the starting point, not
least to stimulate intermodal transport. When Sweden set the maximum length of 24 m in 1968, it was
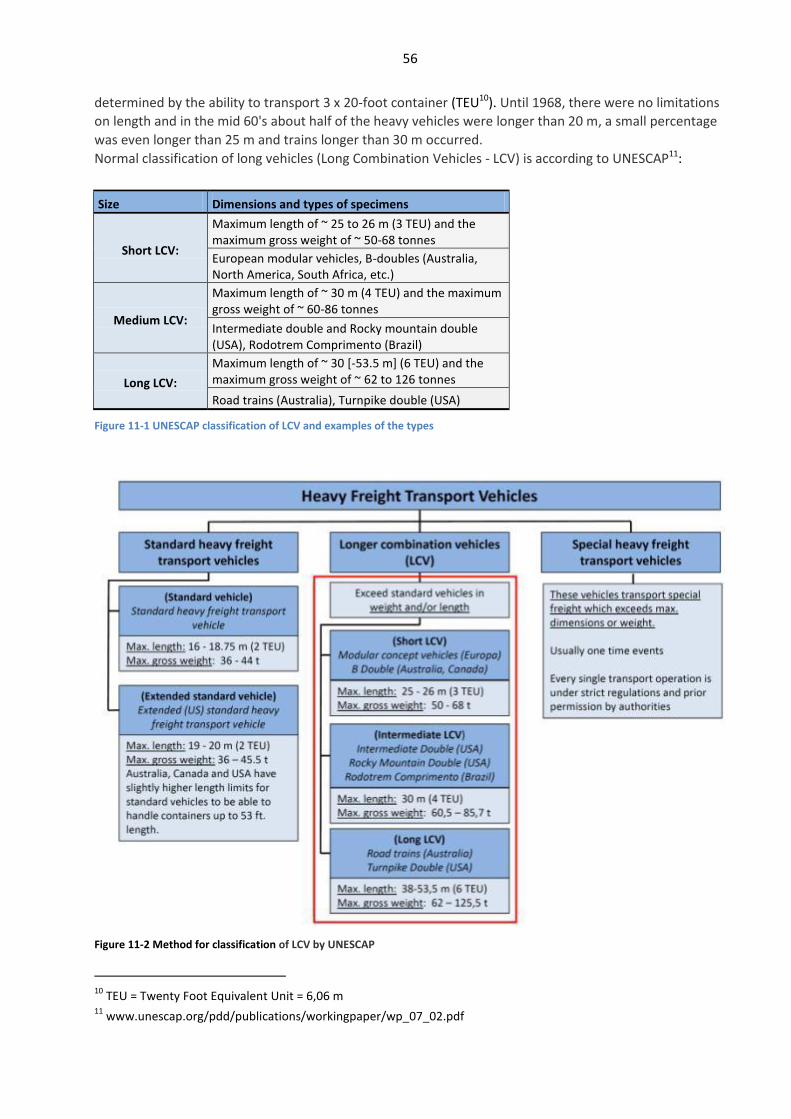
56
determined by the ability to transport 3 x 20-foot container (TEU10). Until 1968, there were no limitations
on length and in the mid 60's about half of the heavy vehicles were longer than 20 m, a small percentage
was even longer than 25 m and trains longer than 30 m occurred.
Normal classification of long vehicles (Long Combination Vehicles - LCV) is according to UNESCAP11:
Size Dimensions and types of specimens
Short LCV:
Maximum length of ~ 25 to 26 m (3 TEU) and the maximum gross weight of ~ 50-68 tonnes
European modular vehicles, B-doubles (Australia, North America, South Africa, etc.)
Medium LCV:
Maximum length of ~ 30 m (4 TEU) and the maximum gross weight of ~ 60-86 tonnes
Intermediate double and Rocky mountain double (USA), Rodotrem Comprimento (Brazil)
Long LCV:
Maximum length of ~ 30 [-53.5 m] (6 TEU) and the maximum gross weight of ~ 62 to 126 tonnes
Road trains (Australia), Turnpike double (USA)
Figure 11-1 UNESCAP classification of LCV and examples of the types
Figure 11-2 Method for classification of LCV by UNESCAP
10
TEU = Twenty Foot Equivalent Unit = 6,06 m 11
www.unescap.org/pdd/publications/workingpaper/wp_07_02.pdf
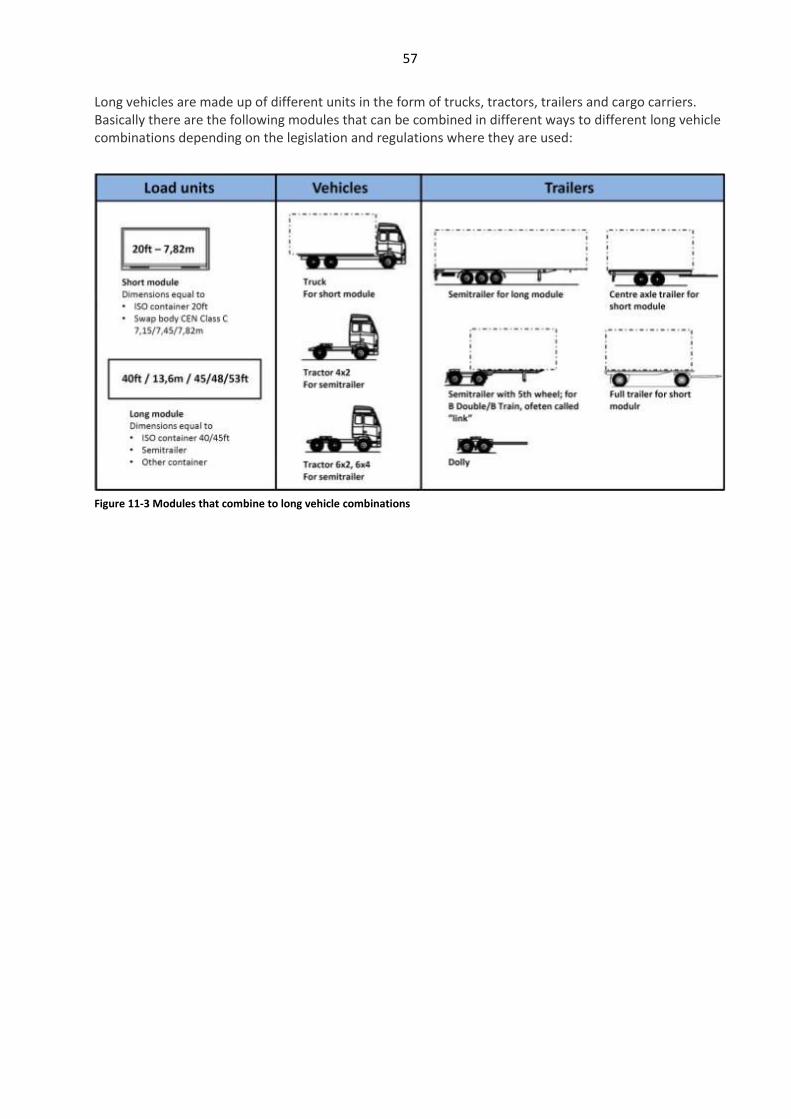
57
Long vehicles are made up of different units in the form of trucks, tractors, trailers and cargo carriers. Basically there are the following modules that can be combined in different ways to different long vehicle combinations depending on the legislation and regulations where they are used:
Figure 11-3 Modules that combine to long vehicle combinations
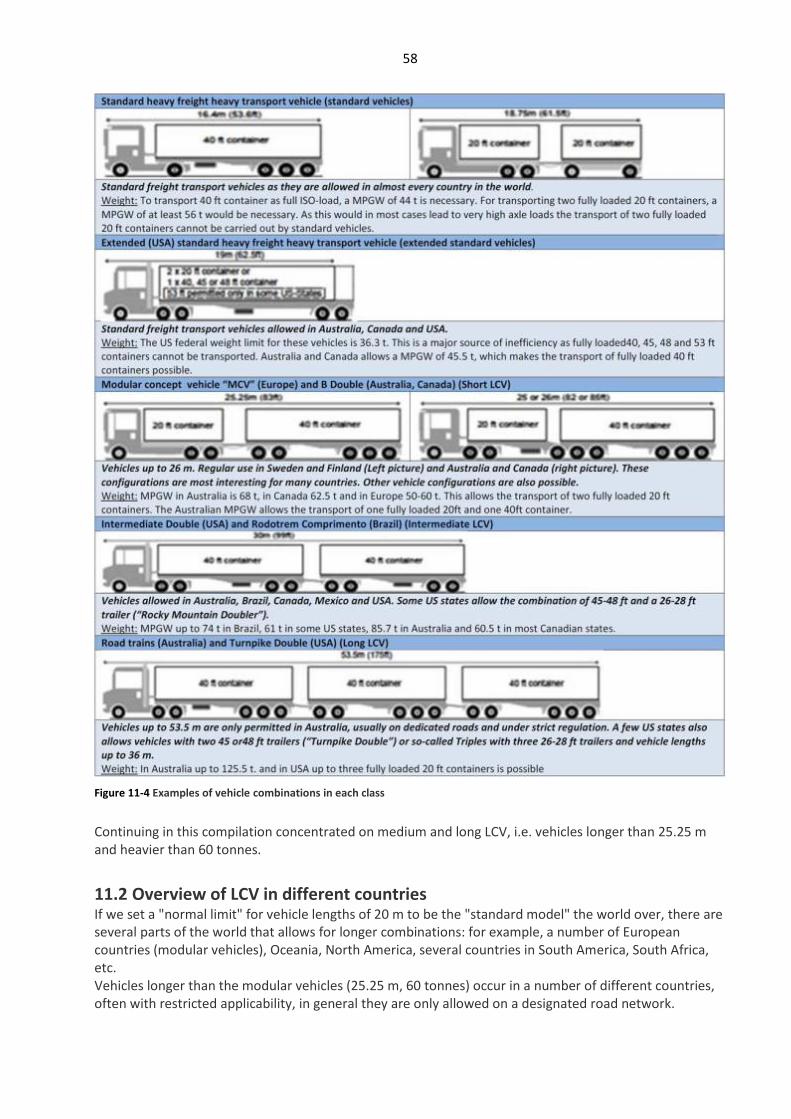
58
Figure 11-4 Examples of vehicle combinations in each class
Continuing in this compilation concentrated on medium and long LCV, i.e. vehicles longer than 25.25 m and heavier than 60 tonnes.
11.2 Overview of LCV in different countries If we set a "normal limit" for vehicle lengths of 20 m to be the "standard model" the world over, there are several parts of the world that allows for longer combinations: for example, a number of European countries (modular vehicles), Oceania, North America, several countries in South America, South Africa, etc. Vehicles longer than the modular vehicles (25.25 m, 60 tonnes) occur in a number of different countries, often with restricted applicability, in general they are only allowed on a designated road network.
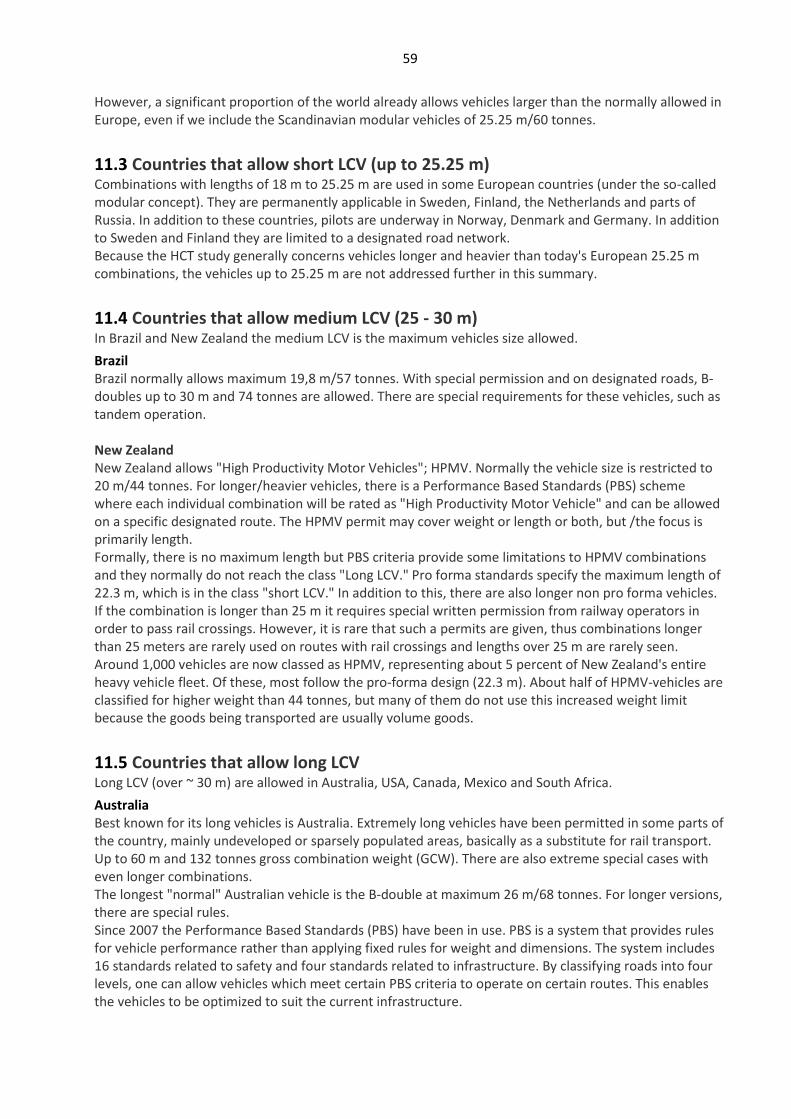
59
However, a significant proportion of the world already allows vehicles larger than the normally allowed in Europe, even if we include the Scandinavian modular vehicles of 25.25 m/60 tonnes.
11.3 Countries that allow short LCV (up to 25.25 m) Combinations with lengths of 18 m to 25.25 m are used in some European countries (under the so-called modular concept). They are permanently applicable in Sweden, Finland, the Netherlands and parts of Russia. In addition to these countries, pilots are underway in Norway, Denmark and Germany. In addition to Sweden and Finland they are limited to a designated road network. Because the HCT study generally concerns vehicles longer and heavier than today's European 25.25 m combinations, the vehicles up to 25.25 m are not addressed further in this summary.
11.4 Countries that allow medium LCV (25 - 30 m) In Brazil and New Zealand the medium LCV is the maximum vehicles size allowed.
Brazil Brazil normally allows maximum 19,8 m/57 tonnes. With special permission and on designated roads, B-doubles up to 30 m and 74 tonnes are allowed. There are special requirements for these vehicles, such as tandem operation. New Zealand New Zealand allows "High Productivity Motor Vehicles"; HPMV. Normally the vehicle size is restricted to 20 m/44 tonnes. For longer/heavier vehicles, there is a Performance Based Standards (PBS) scheme where each individual combination will be rated as "High Productivity Motor Vehicle" and can be allowed on a specific designated route. The HPMV permit may cover weight or length or both, but /the focus is primarily length. Formally, there is no maximum length but PBS criteria provide some limitations to HPMV combinations and they normally do not reach the class "Long LCV." Pro forma standards specify the maximum length of 22.3 m, which is in the class "short LCV." In addition to this, there are also longer non pro forma vehicles. If the combination is longer than 25 m it requires special written permission from railway operators in order to pass rail crossings. However, it is rare that such a permits are given, thus combinations longer than 25 meters are rarely used on routes with rail crossings and lengths over 25 m are rarely seen. Around 1,000 vehicles are now classed as HPMV, representing about 5 percent of New Zealand's entire heavy vehicle fleet. Of these, most follow the pro-forma design (22.3 m). About half of HPMV-vehicles are classified for higher weight than 44 tonnes, but many of them do not use this increased weight limit because the goods being transported are usually volume goods.
11.5 Countries that allow long LCV Long LCV (over ~ 30 m) are allowed in Australia, USA, Canada, Mexico and South Africa.
Australia Best known for its long vehicles is Australia. Extremely long vehicles have been permitted in some parts of the country, mainly undeveloped or sparsely populated areas, basically as a substitute for rail transport. Up to 60 m and 132 tonnes gross combination weight (GCW). There are also extreme special cases with even longer combinations. The longest "normal" Australian vehicle is the B-double at maximum 26 m/68 tonnes. For longer versions, there are special rules. Since 2007 the Performance Based Standards (PBS) have been in use. PBS is a system that provides rules for vehicle performance rather than applying fixed rules for weight and dimensions. The system includes 16 standards related to safety and four standards related to infrastructure. By classifying roads into four levels, one can allow vehicles which meet certain PBS criteria to operate on certain routes. This enables the vehicles to be optimized to suit the current infrastructure.
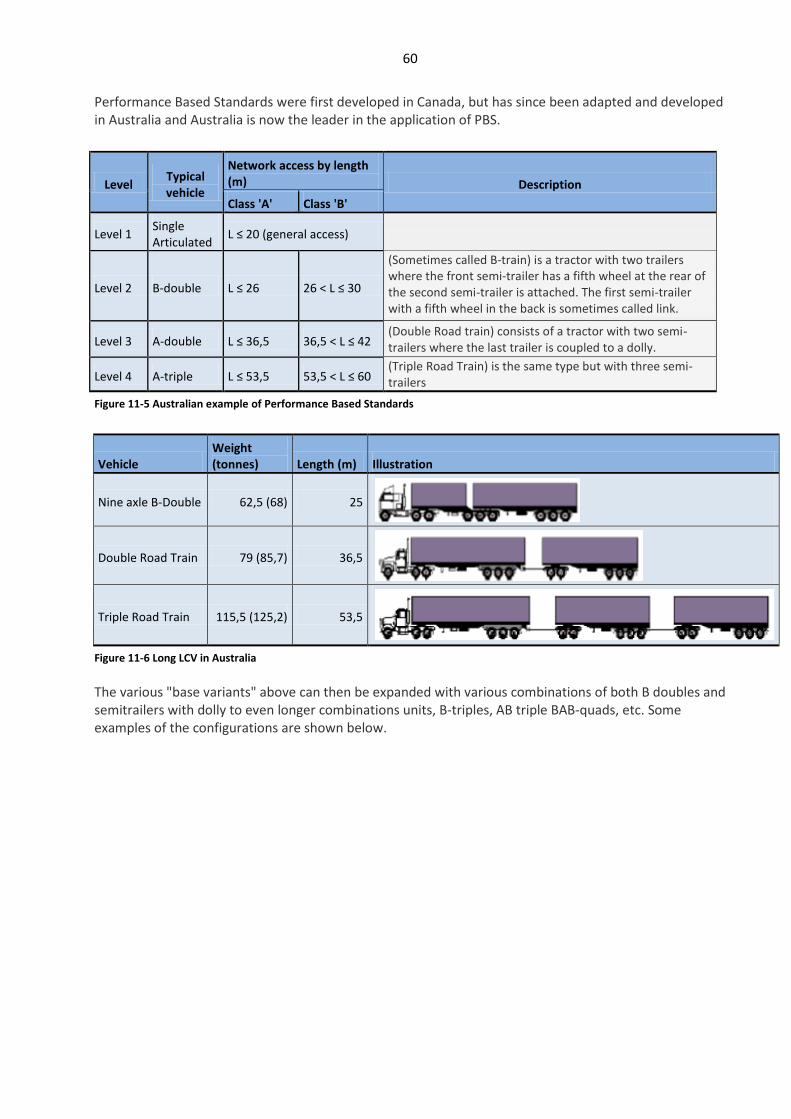
60
Performance Based Standards were first developed in Canada, but has since been adapted and developed in Australia and Australia is now the leader in the application of PBS.
Level Typical vehicle
Network access by length (m) Description
Class 'A' Class 'B'
Level 1 Single Articulated
L ≤ 20 (general access)
Level 2 B-double L ≤ 26 26 < L ≤ 30
(Sometimes called B-train) is a tractor with two trailers where the front semi-trailer has a fifth wheel at the rear of the second semi-trailer is attached. The first semi-trailer with a fifth wheel in the back is sometimes called link.
Level 3 A-double L ≤ 36,5 36,5 < L ≤ 42 (Double Road train) consists of a tractor with two semi-trailers where the last trailer is coupled to a dolly.
Level 4 A-triple L ≤ 53,5 53,5 < L ≤ 60 (Triple Road Train) is the same type but with three semi-trailers
Figure 11-5 Australian example of Performance Based Standards
Vehicle Weight (tonnes) Length (m) Illustration
Nine axle B-Double 62,5 (68) 25
Double Road Train 79 (85,7) 36,5
Triple Road Train 115,5 (125,2) 53,5
Figure 11-6 Long LCV in Australia
The various "base variants" above can then be expanded with various combinations of both B doubles and semitrailers with dolly to even longer combinations units, B-triples, AB triple BAB-quads, etc. Some examples of the configurations are shown below.
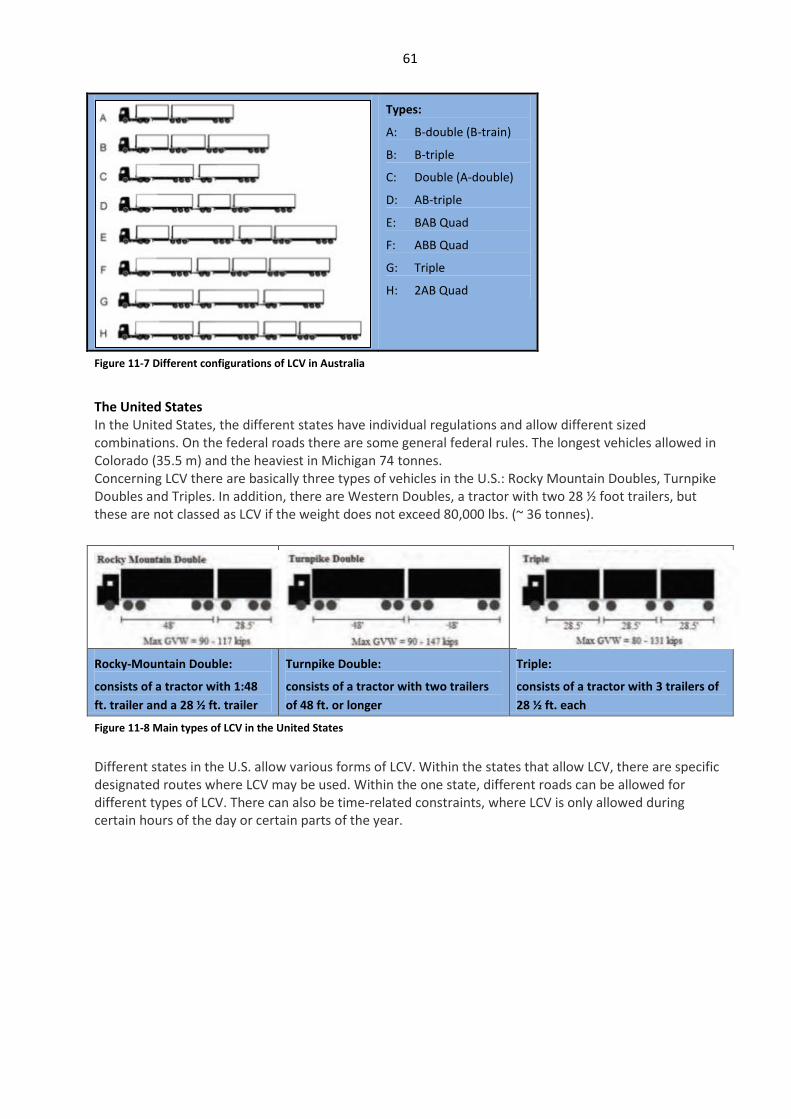
61
Types:
A: B-double (B-train)
B: B-triple
C: Double (A-double)
D: AB-triple
E: BAB Quad
F: ABB Quad
G: Triple
H: 2AB Quad
Figure 11-7 Different configurations of LCV in Australia
The United States In the United States, the different states have individual regulations and allow different sized combinations. On the federal roads there are some general federal rules. The longest vehicles allowed in Colorado (35.5 m) and the heaviest in Michigan 74 tonnes. Concerning LCV there are basically three types of vehicles in the U.S.: Rocky Mountain Doubles, Turnpike Doubles and Triples. In addition, there are Western Doubles, a tractor with two 28 ½ foot trailers, but these are not classed as LCV if the weight does not exceed 80,000 lbs. (~ 36 tonnes).
Rocky-Mountain Double:
consists of a tractor with 1:48
ft. trailer and a 28 ½ ft. trailer
Turnpike Double:
consists of a tractor with two trailers
of 48 ft. or longer
Triple:
consists of a tractor with 3 trailers of
28 ½ ft. each
Figure 11-8 Main types of LCV in the United States
Different states in the U.S. allow various forms of LCV. Within the states that allow LCV, there are specific designated routes where LCV may be used. Within the one state, different roads can be allowed for different types of LCV. There can also be time-related constraints, where LCV is only allowed during certain hours of the day or certain parts of the year.
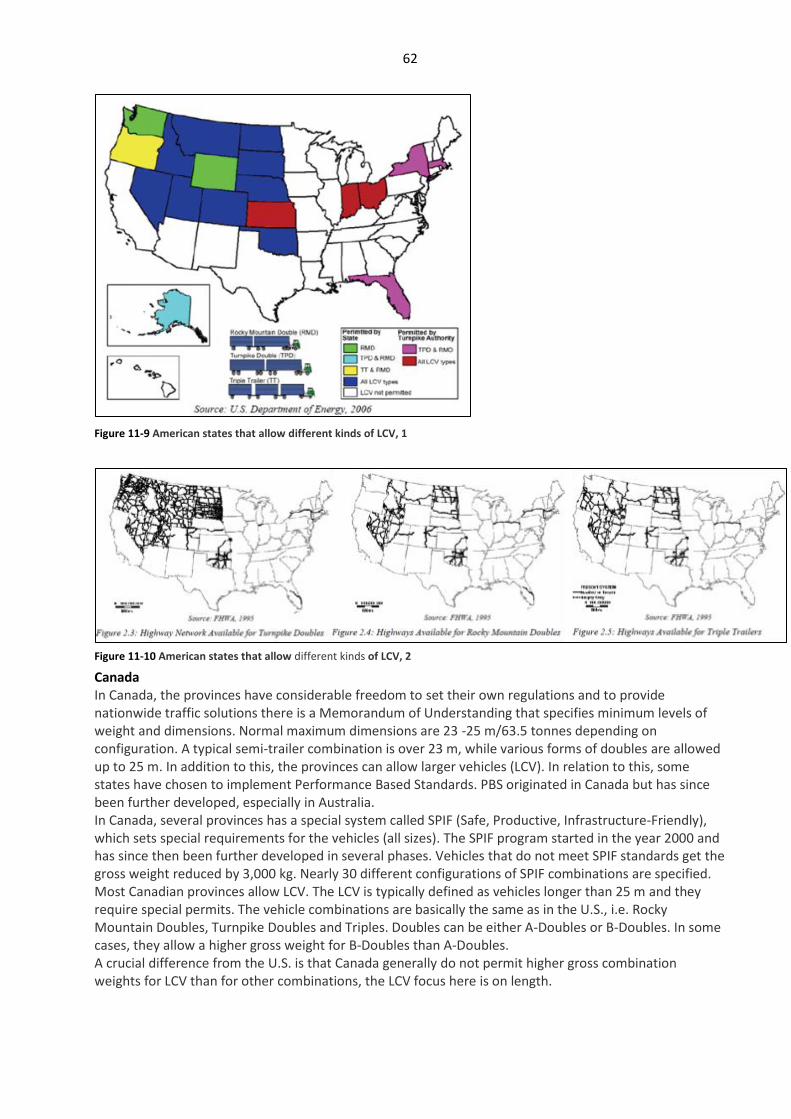
62
Figure 11-9 American states that allow different kinds of LCV, 1
Figure 11-10 American states that allow different kinds of LCV, 2
Canada In Canada, the provinces have considerable freedom to set their own regulations and to provide nationwide traffic solutions there is a Memorandum of Understanding that specifies minimum levels of weight and dimensions. Normal maximum dimensions are 23 -25 m/63.5 tonnes depending on configuration. A typical semi-trailer combination is over 23 m, while various forms of doubles are allowed up to 25 m. In addition to this, the provinces can allow larger vehicles (LCV). In relation to this, some states have chosen to implement Performance Based Standards. PBS originated in Canada but has since been further developed, especially in Australia. In Canada, several provinces has a special system called SPIF (Safe, Productive, Infrastructure-Friendly), which sets special requirements for the vehicles (all sizes). The SPIF program started in the year 2000 and has since then been further developed in several phases. Vehicles that do not meet SPIF standards get the gross weight reduced by 3,000 kg. Nearly 30 different configurations of SPIF combinations are specified. Most Canadian provinces allow LCV. The LCV is typically defined as vehicles longer than 25 m and they require special permits. The vehicle combinations are basically the same as in the U.S., i.e. Rocky Mountain Doubles, Turnpike Doubles and Triples. Doubles can be either A-Doubles or B-Doubles. In some cases, they allow a higher gross weight for B-Doubles than A-Doubles. A crucial difference from the U.S. is that Canada generally do not permit higher gross combination weights for LCV than for other combinations, the LCV focus here is on length.
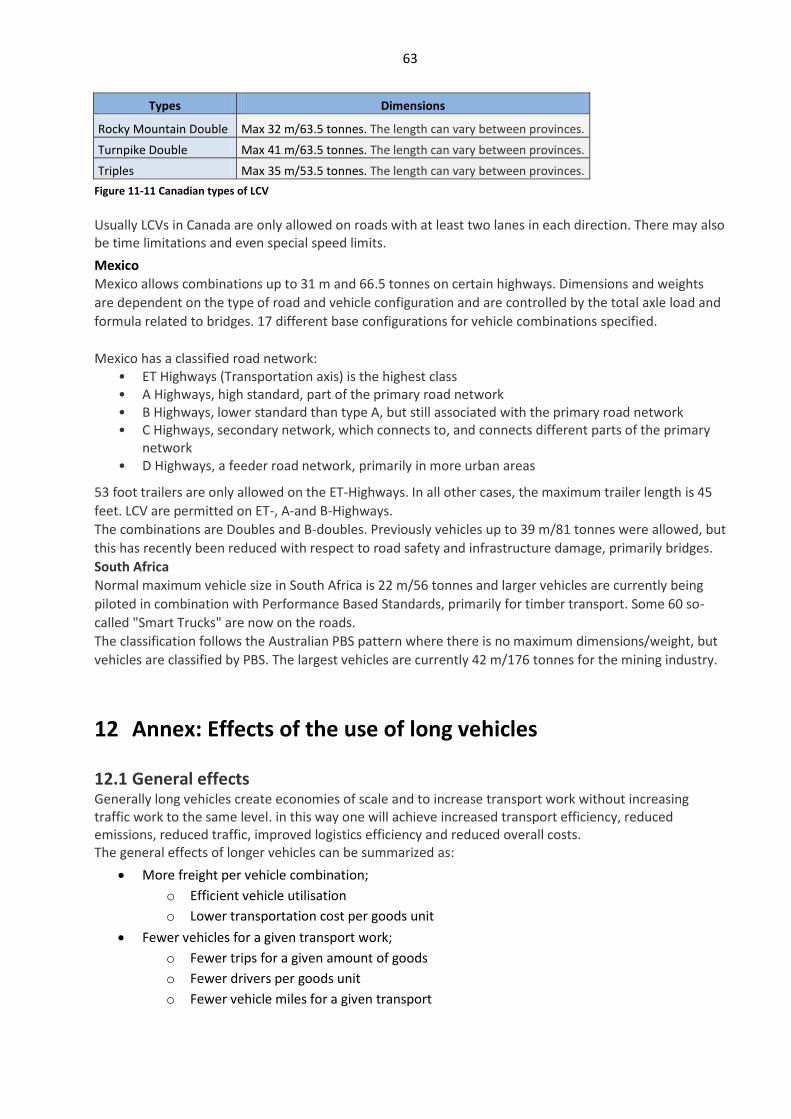
63
Types Dimensions
Rocky Mountain Double Max 32 m/63.5 tonnes. The length can vary between provinces.
Turnpike Double Max 41 m/63.5 tonnes. The length can vary between provinces.
Triples Max 35 m/53.5 tonnes. The length can vary between provinces.
Figure 11-11 Canadian types of LCV
Usually LCVs in Canada are only allowed on roads with at least two lanes in each direction. There may also be time limitations and even special speed limits.
Mexico
Mexico allows combinations up to 31 m and 66.5 tonnes on certain highways. Dimensions and weights
are dependent on the type of road and vehicle configuration and are controlled by the total axle load and
formula related to bridges. 17 different base configurations for vehicle combinations specified.
Mexico has a classified road network: • ET Highways (Transportation axis) is the highest class • A Highways, high standard, part of the primary road network • B Highways, lower standard than type A, but still associated with the primary road network • C Highways, secondary network, which connects to, and connects different parts of the primary
network • D Highways, a feeder road network, primarily in more urban areas
53 foot trailers are only allowed on the ET-Highways. In all other cases, the maximum trailer length is 45
feet. LCV are permitted on ET-, A-and B-Highways.
The combinations are Doubles and B-doubles. Previously vehicles up to 39 m/81 tonnes were allowed, but
this has recently been reduced with respect to road safety and infrastructure damage, primarily bridges.
South Africa
Normal maximum vehicle size in South Africa is 22 m/56 tonnes and larger vehicles are currently being
piloted in combination with Performance Based Standards, primarily for timber transport. Some 60 so-
called "Smart Trucks" are now on the roads.
The classification follows the Australian PBS pattern where there is no maximum dimensions/weight, but
vehicles are classified by PBS. The largest vehicles are currently 42 m/176 tonnes for the mining industry.
12 Annex: Effects of the use of long vehicles
12.1 General effects Generally long vehicles create economies of scale and to increase transport work without increasing traffic work to the same level. in this way one will achieve increased transport efficiency, reduced emissions, reduced traffic, improved logistics efficiency and reduced overall costs. The general effects of longer vehicles can be summarized as:
More freight per vehicle combination;
o Efficient vehicle utilisation
o Lower transportation cost per goods unit
Fewer vehicles for a given transport work;
o Fewer trips for a given amount of goods
o Fewer drivers per goods unit
o Fewer vehicle miles for a given transport
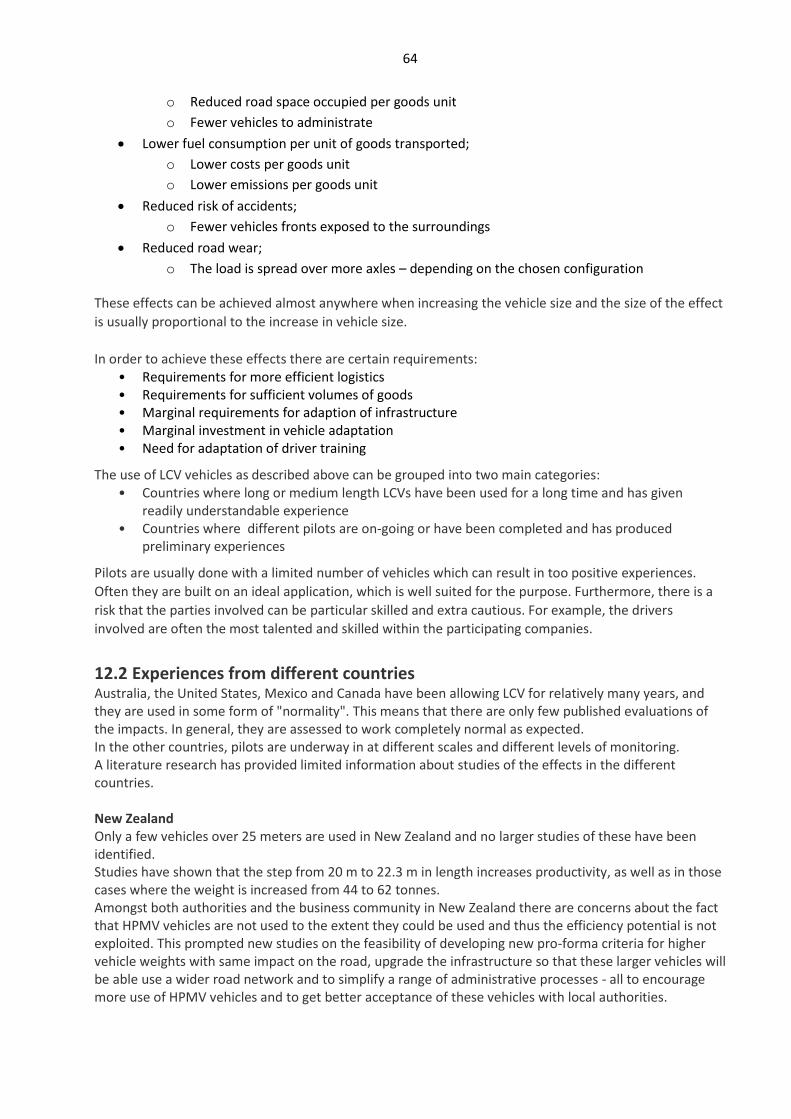
64
o Reduced road space occupied per goods unit
o Fewer vehicles to administrate
Lower fuel consumption per unit of goods transported;
o Lower costs per goods unit
o Lower emissions per goods unit
Reduced risk of accidents;
o Fewer vehicles fronts exposed to the surroundings
Reduced road wear;
o The load is spread over more axles – depending on the chosen configuration
These effects can be achieved almost anywhere when increasing the vehicle size and the size of the effect
is usually proportional to the increase in vehicle size.
In order to achieve these effects there are certain requirements: • Requirements for more efficient logistics • Requirements for sufficient volumes of goods • Marginal requirements for adaption of infrastructure • Marginal investment in vehicle adaptation • Need for adaptation of driver training
The use of LCV vehicles as described above can be grouped into two main categories: • Countries where long or medium length LCVs have been used for a long time and has given
readily understandable experience • Countries where different pilots are on-going or have been completed and has produced
preliminary experiences
Pilots are usually done with a limited number of vehicles which can result in too positive experiences.
Often they are built on an ideal application, which is well suited for the purpose. Furthermore, there is a
risk that the parties involved can be particular skilled and extra cautious. For example, the drivers
involved are often the most talented and skilled within the participating companies.
12.2 Experiences from different countries Australia, the United States, Mexico and Canada have been allowing LCV for relatively many years, and they are used in some form of "normality". This means that there are only few published evaluations of the impacts. In general, they are assessed to work completely normal as expected. In the other countries, pilots are underway in at different scales and different levels of monitoring. A literature research has provided limited information about studies of the effects in the different countries. New Zealand Only a few vehicles over 25 meters are used in New Zealand and no larger studies of these have been identified. Studies have shown that the step from 20 m to 22.3 m in length increases productivity, as well as in those cases where the weight is increased from 44 to 62 tonnes. Amongst both authorities and the business community in New Zealand there are concerns about the fact that HPMV vehicles are not used to the extent they could be used and thus the efficiency potential is not exploited. This prompted new studies on the feasibility of developing new pro-forma criteria for higher vehicle weights with same impact on the road, upgrade the infrastructure so that these larger vehicles will be able use a wider road network and to simplify a range of administrative processes - all to encourage more use of HPMV vehicles and to get better acceptance of these vehicles with local authorities.
65
Australia Most transporters have been able to streamline especially containerized shipments significantly, using longer and heavier vehicles for many years. Though the regulations have been adjusted in various ways over the years. With traditional vehicles one can o often only transport two 20-foot containers or one 40-foot container. Depending on the combination and the container weights, it has been common only to be able to transport a fully loaded 20-foot container or two empty 20-foot containers per vehicle. Because of the longer vehicles one can now transport double the number of containers per trip. A few examples: Grain Shipments in 20-foot containers; one company transports 120,000 tonnes of grain to a shipping port annually. Each return trip is 280 km. With traditional vehicles one could only transport one fully loaded 20-foot container or 3 empty containers per trip. With larger vehicles one can transport two fully loaded containers or 4 empty per trip. For this company, the use of longer vehicles annually reduced the number of trips with 2,400, kilometres by 672,000 and reduced fuel consumption of 245,000 litres of diesel, equivalent to saving of 612 tonnes of CO2. Container transports between the Port of Melbourne and Somerton intermodal terminal usually takes 3.75 hours for a round trip. 40,000 TEUs are transported each year and with conventional vehicles this requires 70 trips per day (three TEUs per trip). Larger vehicles that can take 4 TEUs per trip can reduce the number of trips by 50 percent for heavy 20-foot containers, 25 to 50 percent with lightweight 20-foot containers depending on the vehicle and 50 percent with light 40-foot containers. The United States
In the United States, LCV combinations have been allowed in some states for many years and this is why
there are no current analysis of the effects. In an on-going debate about permitting LCV on a wider road
network there is information on productivity effects but these are more theoretical calculations and the
result in are effects proportional to the differences in vehicle sizes.
Canada
A number of Canadian provinces have allowed LCV for several years, but usually with higher weight aren’t
allowed than for standard vehicles - only the length is different. Analysis of the use has primarily been
made in Alberta and Ontario, but since LCV has been allowed for over 30 years, most analyses are
relatively old, Most of them are from the 1990’s, based on slightly different conditions than at present.
Therefore, it may be difficult to draw conclusions on the validity of results today.
In a study from Ontario (Long Combination Vehicle Program Review) it is noted that LCV has been allowed
in several provinces for 25 years and this has worked to their full contend. The study covers the period
August 2009 - November 2010. In the last month there were 2,180 trips with LCV with a total mileage of
696,800 km.
LCV are mainly used for transport of consumer goods, packaged foods, and supplies for manufacturing.
Estimates are that companies in Ontario with extended use of the LCV would reduce transport costs,
mainly fuel costs by $ 320 million or 70 million litres of diesel per year.
In Alberta, recent studies show that the use of LCV increases safety, it reduces the chance of being
involved in a collision with up to 58 percent, compared to a standard semi-trailer combination. "LCV as a
group has the lowest collision rates of all types of vehicles using the road network where LCV is allowed"
(Alberta provincial government). A summary of several studies from the Canadian government shows
quite unanimously the following effects of the use of LCV. Some variations occur depending on the exact
type of vehicles being compared. The figure also includes LCV primarily used at night on the main roads
and each that LCV usually replaces two standard combinations.
• Transportation costs will decrease by 20-33 percent • Logistic costs are reduced by 20-30 percent • Fuel consumption (and hence CO2) decreases by 25-35 percent
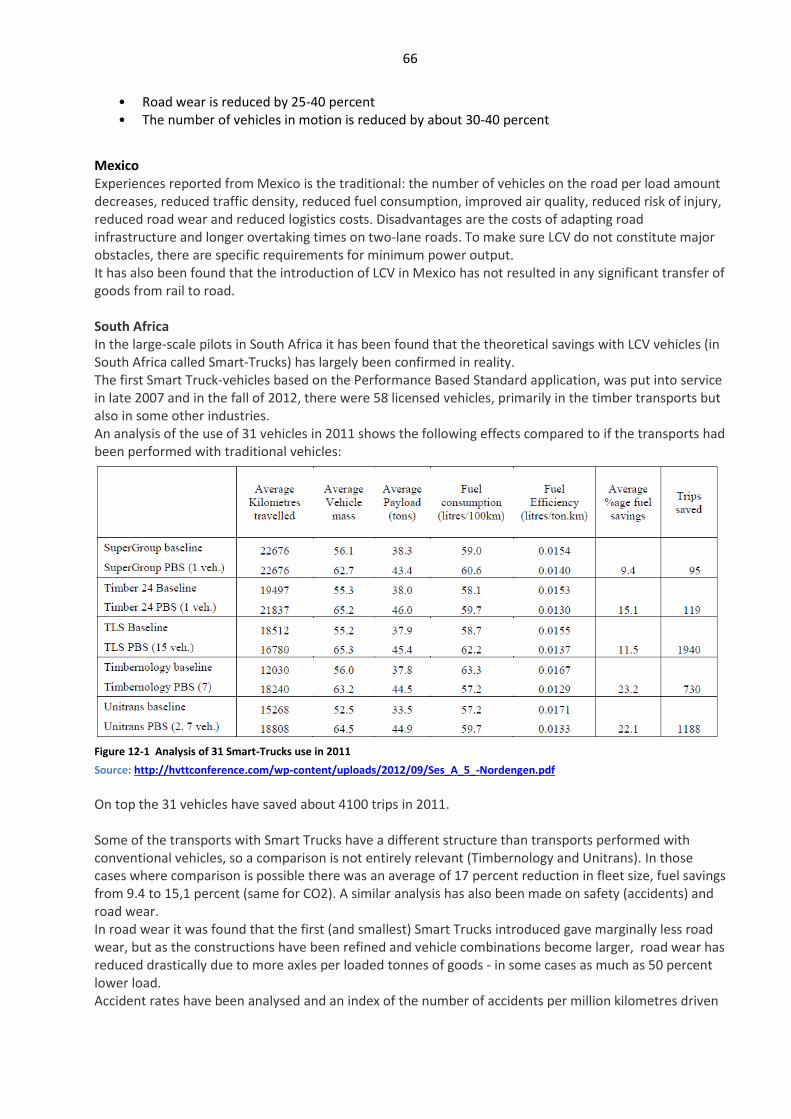
66
• Road wear is reduced by 25-40 percent • The number of vehicles in motion is reduced by about 30-40 percent
Mexico Experiences reported from Mexico is the traditional: the number of vehicles on the road per load amount decreases, reduced traffic density, reduced fuel consumption, improved air quality, reduced risk of injury, reduced road wear and reduced logistics costs. Disadvantages are the costs of adapting road infrastructure and longer overtaking times on two-lane roads. To make sure LCV do not constitute major obstacles, there are specific requirements for minimum power output. It has also been found that the introduction of LCV in Mexico has not resulted in any significant transfer of goods from rail to road. South Africa In the large-scale pilots in South Africa it has been found that the theoretical savings with LCV vehicles (in South Africa called Smart-Trucks) has largely been confirmed in reality. The first Smart Truck-vehicles based on the Performance Based Standard application, was put into service in late 2007 and in the fall of 2012, there were 58 licensed vehicles, primarily in the timber transports but also in some other industries. An analysis of the use of 31 vehicles in 2011 shows the following effects compared to if the transports had been performed with traditional vehicles:
Figure 12-1 Analysis of 31 Smart-Trucks use in 2011
Source: http://hvttconference.com/wp-content/uploads/2012/09/Ses_A_5_-Nordengen.pdf
On top the 31 vehicles have saved about 4100 trips in 2011. Some of the transports with Smart Trucks have a different structure than transports performed with conventional vehicles, so a comparison is not entirely relevant (Timbernology and Unitrans). In those cases where comparison is possible there was an average of 17 percent reduction in fleet size, fuel savings from 9.4 to 15,1 percent (same for CO2). A similar analysis has also been made on safety (accidents) and road wear. In road wear it was found that the first (and smallest) Smart Trucks introduced gave marginally less road wear, but as the constructions have been refined and vehicle combinations become larger, road wear has reduced drastically due to more axles per loaded tonnes of goods - in some cases as much as 50 percent lower load. Accident rates have been analysed and an index of the number of accidents per million kilometres driven
67
has been calculated. The index for standard vehicles is 4.6, while it is only 0.69 for the Smart Trucks, a remarkable difference in favour of Smart trucks. A contributing factor is that Smart Trucks in general are driven by drivers who are considerably more experienced than normal. The conclusions drawn are that Smart Trucks show improved safety (lower accident risk), improved productivity, reduced CO2 emissions, reduced road wear and no effect on the structural safety of bridges.
12.3 Conclusions Most of the analyses are about the vehicles' technical design and how they can be used in relation to the infrastructure. Significantly fewer analyses have been made for logistical effects and these have been especially summarizing in their form. The most extensive analysis has been done in The Netherlands on the effects of the introduction of the 25.25 m concept. Although reports about the use of the longest vehicles are at a summary level, it can be concluded that effects from the theoretical studies have been achieved in general: higher efficiency, lower costs, fewer vehicles doing same transport work, lower fuel consumption and hence lower CO2 emissions per tonnes, unaffected or improved safety, unaffected or marginal transfer of goods from rail, unchanged or lower road wear and small costs of adapting infrastructure. As a rule of thumb for the most important parameters it can be noted that with an increase in load capacity by 50 percent, reduces the number of vehicles by 30 percent, fuel consumption per tonnes by about 15-25 percent, and transportation/logistics costs by about 15-20 percent.
68
13 Annex: HCT and traffic safety
Background There are concerns among scientists, the public and politicians that HCT-vehicles are more dangerous and less secure than conventional vehicles, as HCT-vehicles are heavier and/or longer. As the need for transports and energy-efficient transports is increasing globally, there is an international interest in Sweden's experience of 25.25 meter vehicles and pilots with HCT-vehicles. Especially since the traffic safety is studied systematically. The fears and risks mentioned are the same nationally and internationally. In order to investigate the potential safety risks of HCT-vehicles the "Traffic Safety Effects of High Capacity Transport and Compensatory Measures" have formulated with SAFER as a host of the program. The program is intended to identify security risks, study their mechanisms and make suggestions for compensatory measures to balance any reduction in safety. SAFER builds up a R&D consortium that will conduct the program together. The consortium is made up by the government, the business community, academia and research institutions, and the program is carried out in close cooperation with CLOSER. A program coordinator from SAFER (Jesper Sandin, VTI) has been put in the position to drive the business forward, take care of administration, scientific quality control, organize and conduct meetings with the steering committee and possible workshops. The program is scheduled to run between 2013 and 2016 (3-4 years). The main funder initially is Trafikverket and in-kind efforts in the vehicle and transportation industry and academia through its strategic research funding. In the long term links with FFI and their programs should be examined. Problem description In general studies of accident data shows a slightly increased risk of accidents per vehicle kilometre, and that the increase is due to the vehicle combinations’ character. Other studies show that the difference in the accident rate compared to conventional vehicles will be small, at least on the larger and safer roads. Several studies say that if you count the number of accidents per unit of goods transported, the risk of accident is expected to be reduced with longer and heavier vehicles. Any adverse safety effects could thus be offset by the lower number of vehicles needed to transport a given amount of goods. Some studies conclude that longer and heavier vehicles may even produce a net positive effect on road safety. In summary, the literature shows that it is very complex to estimate how traffic safety in general would be affected by the introduction of longer and heavier vehicles. Regarding more specific traffic situations, several research papers mentions that the risk of overtaking accidents will increase with longer and heavier vehicles. However, there are no studies that can quantify the risk when overtaking in terms of accident risk. Meeting margins have been used as an indirect measure of risk in a number of field studies where overtaking of different long vehicles has been analysed. The results indicate that the average meeting margin is smaller for the longer vehicle in the studies, but without statistically significant difference. Besides overtaking situations, there is today very little knowledge of how long vehicles can affect other traffic situations, e.g. ramps to the motorway/, roundabouts, intersections, and walking or cycling paths. The literature often mentions that longer and heavier vehicles can be expected to have a negative impact at intersections caused by the length of the vehicle and/or slower acceleration. Studies need to be done to determine if this is the case. A frequent problem in the assessment of safety risks is the lack of exposure data. When large vehicles tend to use larger and therefore safer roads, you have to take into account their exposure to traffic on different roads. One consequence of this is that only trucks that run on the same type of roads can be compared, and the results cannot be generalized to other types of roads. Another problem is to figure out how much the different vehicle models have been used, i.e. its mileage. An important part of the program is to investigate the possibility to implement, adapt and complement, Performance Based Standards (PBS) to Swedish conditions. PBS is a way to control HCT-vehicle characteristics and allow them on the road network. In a performance-based assessment the vehicle's
69
characteristics are assessed from a number of standard criteria and not based on how the vehicle is, for example, designed to for a given level of performance. PBS has been implemented for HCT-vehicles in Australia, Canada, and New Zealand. Research fields
As the first step, the program has formulated a number of hypotheses to capture the concerns and risks
that exist when it comes to HCT and road safety. The hypotheses should be seen as starting points for
project proposals and studies, and the list will be revised and completed during the program.
Hypotheses regarding HCT and road safety: • An HCT vehicle is more dangerous than a conventional vehicle, i.e. there's something in the
vehicle characteristics that make them dangerous. This is argued in the literature (Knight et al 2008).
• The larger the vehicle, the greater the proportion of (serious accidents). • The consequences in a frontal impact with a heavier vehicle will be worse than with ordinary
vehicles. • It is more risky to overtake a long vehicle than a short one, since it takes longer to pass and
thereby increases the exposure. • At ramps to motorways, a longer vehicle can make other road users miscalculate the available
access window /slot • HCT vehicles are particularly dangerous to vulnerable road users due to their larger sweep and
that they are more difficult to maintain overview of and control due to its size. • The safety gained through fewer vehicle movements are eaten up by the increase in traffic
induced by the higher transport efficiency. • HCT vehicles are particularly difficult to manage in the snow and ice and therefore unsuitable. • We do not know what traffic situations cause the most accidents involving heavy vehicles. • Longer vehicles are more dangerous at intersections because they spend more time in the
intersections compared to shorter vehicles. • Fewer vehicles are needed to transport the same amount of goods, which reduces the exposure. • Does the fatigue of the driver correlate to vehicle size? I.e. are larger vehicles to a greater extent a
cause of single-vehicle accidents, where the driver is injured • Compatibility in collisions with road equipment, ex. guardrails, and bridge piers. How well does
today's road equipment handle heavier vehicles?
Methods
The program develops and uses several methods to achieve desired results. This means that several
scientific and practical skills will interact within the program. • Environmental analysis (e.g. through literature studies) • Surveys and interviews • Traffic simulation • Accident data: statistical analyses, and studies of fatal accidents • Technology development • Field studies on risk evaluation and analysis • Driving simulator studies • Verification and demonstration of technology and safety solutions • Implementation methods • Incident analysis in the event of incidents and accidents that occur in connection to the pilots and
demonstration projects with HCT-vehicles
Expected results
The expected results of the program are broadly to: • Clarify, confirm, or falsify concerns and security risks, and if possible describe their mechanisms,
effects and extend
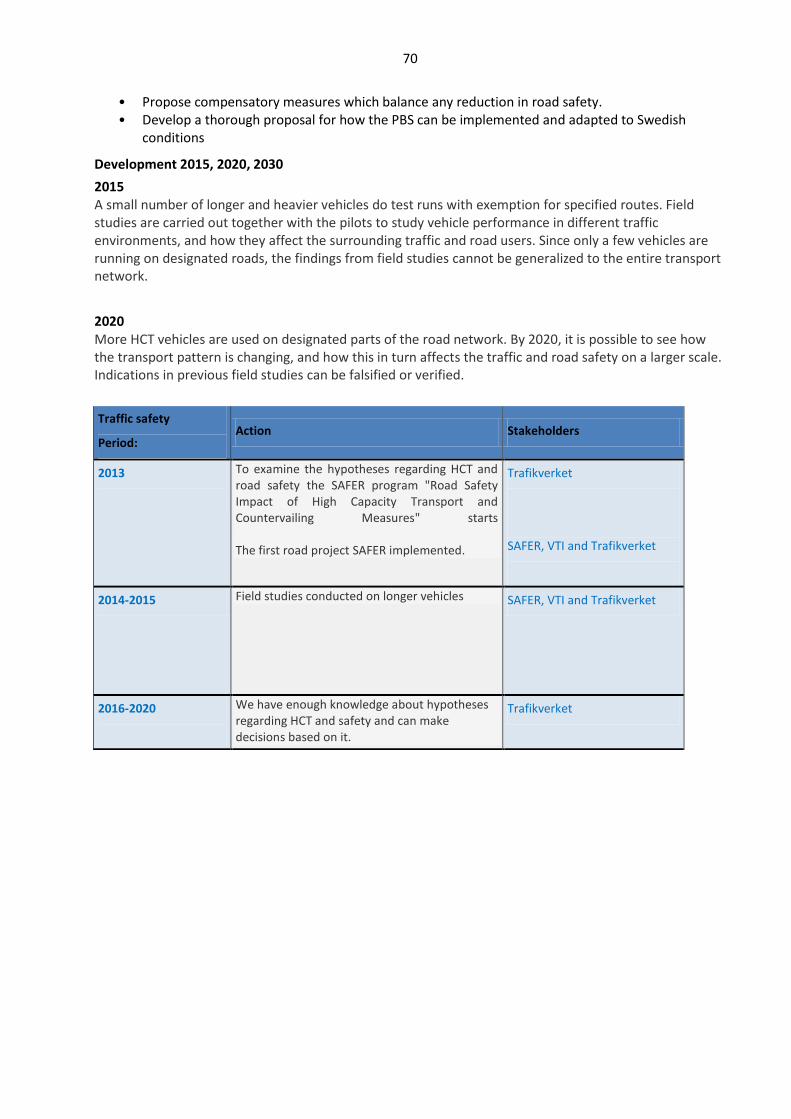
70
• Propose compensatory measures which balance any reduction in road safety. • Develop a thorough proposal for how the PBS can be implemented and adapted to Swedish
conditions
Development 2015, 2020, 2030
2015 A small number of longer and heavier vehicles do test runs with exemption for specified routes. Field studies are carried out together with the pilots to study vehicle performance in different traffic environments, and how they affect the surrounding traffic and road users. Since only a few vehicles are running on designated roads, the findings from field studies cannot be generalized to the entire transport network.
2020 More HCT vehicles are used on designated parts of the road network. By 2020, it is possible to see how the transport pattern is changing, and how this in turn affects the traffic and road safety on a larger scale. Indications in previous field studies can be falsified or verified.
Traffic safety
Period: Action Stakeholders
2013
To examine the hypotheses regarding HCT and road safety the SAFER program "Road Safety Impact of High Capacity Transport and Countervailing Measures" starts The first road project SAFER implemented.
Trafikverket
SAFER, VTI and Trafikverket
2014-2015 Field studies conducted on longer vehicles SAFER, VTI and Trafikverket
2016-2020
We have enough knowledge about hypotheses regarding HCT and safety and can make decisions based on it.
Trafikverket
71
14 Annex: Acronyms
Accis Automated Command and Control Information System
AIS-system Automatic Identification System, an automatic tracking system used for navigation
BRT Bus Rapid Transport
CO2 Carbon DUO2-projektet Pilot projects with vehicles of 32 meters and cargo weighing up to 80 tonnes
DUO-Trailer Vehicle combination with tractor, dolly and two semi-trailers
ERS Electric Road Systems
ERTRAC European Road Transport Research Advisory Council
ETT-vehicle Vehicles used in the En Trave Till project
ETT-project En Trave Till project (One Stack More)
EV Electric Vehicle
FFI Strategic Vehicle Research and Innovation
FoI Research and Innovation
Vehiclekm Amount of kilometers driven by vehicles
FTL Full Truckload
GCW Gross Combination Weight
GIS Geographic Information Systems
GHG Green House Gasses
HC Hydrocarbon - hydrogen
HCT High Capacity Transports
HPMV High Productivity Motor Vehicles
IAC Intelligent Access Conditions
IAP Intelligent Access Program
ICT Information and communication technologies
ITS Intelligent Transport System
IVU In Vehicle Unit
kWh Kilowatt hours
Lbs Pound (weight)
LTL Less than truckload
NCR Non Compliance Report (IAP related)
NOx nitrogen oxides, NO and NO2
PBS Performance Based Standards
Passengerkm Passenger kilometers
Pkm Passenger kilometers
PM Particulate matter
R&D Research and development
Safer Chalmers Vehicle and Traffic Safety Centre
Skogforsk Swedish forestry research institute
SPIF Safe, Productive, Infrastructure-Friendly
ST Larger Stacks project for heavier vehicles in timber industry
SWOT Analysis of Strengths, Weaknesses, Opportunities and Threats
TCA Transport Certification Australia (Authority of IAP)
TCE Transport Certification Europe (not established yet)

72
TCS Transport Certification Sweden (not established yet)
TEU Twenty Foot Equivalent Unit = 6,06 m
TFK TfK Transport Research
Tonnes-km Number of kilometers driven with 1 tonnes (goods)
UNESCAP The United Nations Economic and Social Commission for Asia and the Pacific is the regional development arm of the United Nations for the Asia-Pacific region
V2X Vehicle-to-vehicle, vehicle-to-infrastructure, and vehicle-to-anything communications
V2V Vehicle-to-vehicle communication
V2I Vehicle-to-infrastructure communication
VTI National Road and Transport Research Institute
73
15 Annex: References
http://hvttconference.com/wp-content/uploads/2012/09/Ses_A_5_-Nordengen.pdf
Improving the Sustainability of Road Freight Transport by Relaxing Truck Size and Weight Restrictions –
Alan McKinnon.
Ljungberg, Christer. Road pricing i Holland – den eviga historien, Reflexen nr 2, Trafiktekniska föreningen,
juni 2010, Ministerie van Verkeer en Waterstaat. Road pricing in the Netherlands – Overview, Power Point
Presentation, 13 January 2010, and Road pricing in the Netherlands – Lessen learned, Power Point
Presentation, 21 April 2010 Link to the Swedish Tax Agency, car tax tables: http://www.skatteverket.se/skatter/fordonsskatt.4.18e1b10334ebe8bc80002921.html
Löfroth, C. & Svenson, G. Skogforsk Resultat 17, 2010 and Skogforsk Working Paper 723, 2010
TRAFIKANALYS 2011b. PM 2011:13 Methodology Report Varuflödesundersökningen (Goods Flow Survey)
2009
TRAFIKANALYS 2011. Statistics 2011:7 Lastbilstrafik (Truck Traffic) 2010
TRAFIKANALYS 2010. Statistics 2010:16 Varuflödesundersökningen (Goods Flow Survey) 2009
Traffic Analysis: Lastbilstrafik (Truck Traffic) 2011
www.unescap.org/pdd/publications/workingpaper/wp_07_02.pdf
74
Forum for innovation in the transport sector, XXX XX Ort.
Address: Street XX. Telephone: 070-161 38 20.
www.transportinnovation.se