
Roadma to Rihe - Pension Dynamics · 2 inspirational answer to those of you who claim, “We just...
70
How to Build Retirement Wealth
Transcript of Roadma to Rihe - Pension Dynamics · 2 inspirational answer to those of you who claim, “We just...

Roadmapto RichesHow to BuildRetirement Wealth
By Stephen J. Butler


ContentsIntroduction ........................................................................................................1
Set Your Goals and Wake up Rich ....................................................................8
The Fundamentals of Risk, Return and Time ...............................................15
Three Asset Classes: Cash, Bonds, and Stocks ..............................................23
Mutual Funds ....................................................................................................27
Adopting the Cornerstones of Intelligent Investing ....................................34
The Automatic Pilots of Retirement Plan Investing .....................................39
Choosing Your Investment Mix .....................................................................44
Managing “Other Money” ...............................................................................53
The End Game ..................................................................................................60
Suggested Reading ............................................................................................66

1
Introduction
This book provides what people need to know about investing from start to finish from the day they sign up for their first retirement plan until the day, on their deathbed, they give away what’s left of what they own.
Until recently, the average American’s most valuable asset was the equity in their home. Today, it is the value of their retirement account, primarily their company-sponsored retirement plan and/or their collection of Individual Retirement Accounts (IRAs) that derived from company-sponsored retirement plan roll-over money. In addition to that major source of wealth, however, many people have other money (independent of retirement plans) they have saved, inherited, or generated by the sale of a home or business. Investing money in any retirement plan is easier by the tax-free treatment of these dollars. Investing other, taxable assets can be an entirely different challenge. This book focuses primarily on retirement fund money for the same reason Willie Sutton robbed banks. It’s where the money is. However, a later chapter does address the challenges of investing taxable money and offers advice about how to invest one’s way through the minefield of investment taxation that can otherwise rob from our successes.
This book describes the guiding principles that have traditionally led employees to retirement plan investment success and financial independence. It offers advice covering the entire spectrum of what people need to know, regardless of where they are in the retirement investment process. From the young employee signing up for their first plan to someone actually spending their retirement plan money in retirement, the book offers a “track to run on,” including simple illustrations of investment concepts. The mysteries of the investment world will fade away in the face of these clear teaching tools. Moreover, the book is designed to be an

2
inspirational answer to those of you who claim, “We just can’t deal with it.” This book is for you more than anyone else.
The first chapter outlines why the voluntary retirement plan (401(k) or 403(b)), a powerful and flexible financial tool, has allowed Americans to accomplish so much since its invention more than thirty years ago. The next chapter outlines the most basic fundamentals of investing, followed by a discussion of the basic asset classes: stocks, bonds, and cash. Then there’s an explanation of what mutual funds are really all about. The next three chapters address how to make sense of the different funds and the extent to which they can be combined successfully. Learn how professional investors increase their rates of return while reducing their level of risk. And finally, once you’ve made a pile of retirement money, how do you shift gears and start spending it without running out? That’s the question explored in Chapter 9.
I have been designing, installing, administering, advising, and improving 401(k)s and other retirement plans for over thirty years. A major part of my effort has been educating employee participants. For more than sixteen years, my weekly financial column in fifteen San Francisco Bay Area newspapers has offered a steady stream of investment basics that have helped readers capitalize on positive economic forces while avoiding human behavioral failures. Understanding the system and avoiding mistakes increases the potential for reaching retirement goals.
The first 401(k) plan my company ever installed was at a San Francisco company in 1980. In January 2010, at the company’s annual retirement plan employee meeting, a person who had been in this plan for 30 years, said, “Steve, I took your advice. I stayed the course (mostly in stocks) while the markets were falling apart, and now I’m back up to $2.5 million.”
This person had deposited an average contribution over the years of about $10,000 per year. The total for thirty years was $300,000. Since roughly one-third of that $10,000 each year was “paid” with money that would have otherwise disappeared in taxes, his actual cost in take-home pay was only about $200,000. His average rate of return over the period was a typical

3
10 percent per year. Voila! He now has more than enough money to retire (early, in fact).
Today’s average 401(k) plan account balance for people over age fifty-five is more than $200,000. This figure is based on government information that includes only retirement plan accounts. It fails to include retirement plan money that has long since rolled into Individual Retirement Accounts (IRAs). It’s safe to say that the average retiree, when the day comes, has between $300,000 and $1 million in their accounts, and this kind of money can support an adequate retirement income stream when invested wisely.
The Wall Street Journal cites the growing number of retirement plan millionaires, while a McKinsey and Company study points out that the average American worker has five times more in retirement benefits than would have been the case had 401(k) or 403(b) plans not been invented. These successes have been an accident in legislative history; lawmakers never anticipated how effective the programs would be. The old joke about “We’re the government and we’re here to help” actually turns out to be true in this case.
You Don’t Have to Wait until RetirementOur voluntary retirement plan has proven to be history’s most powerful financial tool for accomplishing the financial goals sought by most of us as working Americans. Buying homes, educating children, saving for emergencies, and providing for our retirement are the primary reasons we save. While retirement plans are designed to provide financial security in retirement, they can be extremely valuable resources for meeting financial goals before then. The loan provision offered by most plans, the financial hardship provisions, and the access to cash while between jobs can play major roles in the ongoing financial security of all working adults. Long before retirement itself, the purchase of homes, funding of education, and a variety of other financial goals can be met by accessing retirement plan savings.
Here’s a real-life example: Recently, a newly reemployed middle-aged participant was eager to sign up for the maximum annual contribution

4
to his retirement plan. In the course of our conversation, he mentioned that tapping his previous retirement plan account while between jobs had been the key to keeping his home and his family together. Given this person’s first hand experience of the value of a financial lifeline offered by the retirement plan, he needed nothing to convince him to replenish his account with maximum contributions. After all, the retirement plan is currently American’s most powerful tool for accumulating meaningful amounts of money.
What’s the Secret to This Savings Phenomenon?The government’s sanction, or “invention,” of tax-deferred retirement plans effectively amounts to a substantial government subsidy. Why? Because our voluntary contributions to the plan come right off the top of our pay, before any taxes are calculated. Some of what we would otherwise have paid in taxes is, instead, deposited into our retirement plan accounts. Then, as the money starts compounding (money earning 7.2 percent doubles every ten years), all of our earnings on assets accumulate tax-free. When we combine this subsidy of tax savings with our employer’s willingness to offer the convenience of an automatic payroll deduction (and maybe even a matching or profit-sharing contribution), we can see why most people say that their retirement plan is their only long-term savings plan that has ever worked.
But Then You Get to Spend the MoneyAt retirement, the accumulation phase ends and supporting a lifestyle begins.
For many people, this is more challenging (if not just plain scary). By comparison, the steady building of assets over the years with the help of your employer was easy. Now, everybody wants to help you manage what has become a significant account balance. But you’re now alone with your money. Acting on bad advice can cost half of what you’ve saved over the years.

5
Nobody but you has interests that are 100 percent aligned with yours. The nicest people in the world can rationalize what’s in their self-interest, and nowhere is this more pronounced and misplaced than in the financial services industry. The last chapter of this book will lead you in the right direction and help you understand the basics of generating the income you need while avoiding the risk of losing your nest egg.
How the Book Is StructuredThe purpose of this book is to help you understand the basics of investing in light of the unique characteristics and framework of your retirement plan.
The topics we will discuss are presented in the following order:
Section 1—Set Your Goals and Wake Up Rich
You need to know what you’re trying to accomplish before you can structure a cohesive investment plan.
Section 2—The Fundamentals of Risk, Return, and Time
It never hurts for even sophisticated investors to recall that risk and return are related and that time reduces risk. The temptation to think short term is the hobgoblin at all levels of experience.
Section 3—Three Asset Classes: Cash, Bonds, and Stocks
What we can expect of each and how they work together to increase returns while reducing risk. How, for instance, do bond investments actually work?
Section 4—Mutual Funds
The investment medium of choice for retirement plans and the world’s most profitable industry at our expense. What a mutual fund is, and how we can get the most from them.

6
Section 5—Adopting the Cornerstones of Intelligent Investing
How we use investment building blocks to begin crafting a strategy for success.
Section 6—The Automatic Pilots of Retirement Plan Investing
Once we have a strategy in place, how we keep it from getting derailed. What we need to know about economics and financial market history to bulletproof our asset-building efforts.
Section 7—Choosing Your Investment Mix
The final step in managing our retirement plan is to pick the investment mix. What investment choices make the most sense based on our goals and our comfort level with risk?
Section 8—Managing Other Money
Many people have “after-tax” money saved outside of their retirement accounts. Managing this money requires the application of tax-saving investment techniques, because every investment decision is impacted by potential income tax costs.
Section 9—The End Game
When we start spending our retirement income, where do we take that account. How we can arrange our investments so that we maximize our income but don’t run out of money.

7
Why This Book Is So ImportantThe level of success you achieve as a retirement plan participant depends more on the skills you develop as an investor than on the amount of money you sacrifice each pay period. You can work hard or you can “work smartly.” It’s best to do both, of course, but the purpose of this book is to help you develop the skills needed to “work smartly” as you develop what will be a retirement plan fortune.
The financial basics and investment techniques outlined in the following pages will help you understand the history and the mysteries of the investment world. This information will guide you to greater success over the years ahead.

1
8
The Wall Street Journal published an article entitled “Waking Up Rich—Retirement Accounts Stashed in Stocks Make Employees Millionaires.” The article’s author stated, “the retirement plan rich are changing their lives. Quitting jobs early, taking extended holidays, starting new careers—or restructuring jobs to make them more fun.” These retirement plan millionaires are people who never thought of themselves as having any personal wealth, and suddenly they realize that they do. They are feeling good about it.
Another interesting insight for the article was this: “For some people who thought they wanted to retire early, having a financial cushion has a curious effect… for many people the security of a nest egg allows them to relax and enjoy work more.”
Today, many people approaching retirement have had an opportunity to participate in a 401(k) plan for the past thirty years. The first plans were rolled out in the early 1980s, and almost all major companies adopted them immediately. Even most small companies offered some retirement plan opportunity, even if they could not afford an employer matching contribution.
Most people who have been contributing for this entire thirty-year period have somewhere between $300,000 and $1 million in a combination of their current, company-sponsored retirement plan and the roll-over IRA account (or accounts) formed as they changed jobs over the years.
If these numbers sound high, consider the example of someone who earned $40,000 a year back in 1980 and who saw steady increases in pay until reaching $70,000 a year today. These are rough average pay levels for
Set Your Goals and Wake up Rich

9
American workers over this period. At an average contribution level of 6 percent of pay per year (the nation’s average retirement plan voluntary contribution) and assuming an average rate of return of 10 percent per year, this typical employee would have accumulated just over $500,000.
In most cases, the employer has been contributing at least some amount of additional money over and above the voluntary contribution from the employee, so the total percentage contribution would have been higher than 6 percent of pay. Moreover, the average mutual fund through the '80s and '90s actually increased in value at a rate of more than 15 percent per year instead of the 10 percent historical average stock market return used in our calculation above. Factor in these reasons for improved results, and we can see why a $1 million account balance is within reach for many people.
The underlying facts speak for themselves. Today $3 trillion is invested in 401(k) plans, and an estimated $3 trillion more is invested in roll-over IRA accounts resulting from previous retirement plan contributions. The total amount in all mutual funds today is $9 trillion, so we can assume that two-thirds of that figure is attributable to the 401(k) plan phenomenon.
If you’re young, with thirty years of work ahead of you, those numbers should be inspirational. If you’re older and part-way up the ladder, you can assess what course correcting, if any, you may want to do to reach your intended goal. If you’re close to retirement and these numbers seem unreal or certainly not applicable to you, then you have made one or more of three mistakes along the way:
1. You’re not committed enough to saving.2. You’ve spent big chunks of what should have been roll-overs
when you left your job.3. Or you’ve made some bad investment decisions.
The purpose of this book, regardless of your retirement plan stage in life, is to provide you with the tools you need to make constructive, informed decisions that will help you reach your goals.

10
Identifying Goals: An Important Consideration for an InvestorLet’s start with Warren Buffett, who says, “You shouldn’t buy any stock that you’re not prepared to hold for ten years.” In the meantime, the stock market can be volatile for reasons having little to do with the intrinsic value of the companies in which our mutual funds have invested. When J.P. Morgan was once asked what he thought the stock market would do, he answered, “It will fluctuate.”
To invest intelligently, then, we need to understand the following:
A fundamental cornerstone of investment decision-making is the time frame or length of time that the money can be committed to an investment.
Without a clear understanding of our goals, it is impossible to know for certain how much time we are allowing an investment to meet our expectations.
There Can be Confusion about the Time Frame of GoalsFor young people, a common misconception is that the company-sponsored retirement plan is exclusively for retirement savings and that their only investment goal is long term, thirty-five to forty years. In fact, younger employees can often have short-term goals for portions of their retirement plan money thanks to the fact that retirement plan loans offer access to what is generally long-term retirement money. Down payments on homes, educational expenses, and many other financial objectives short of retirement can be reasons for using the retirement plan since the pre-tax dollars make this the fastest way to accumulate wealth.
The Young are Different…Younger people are also different in that their lives are in flux. This means that they can expect to be unemployed from time to time until they get settled in a career. Between jobs, it’s not a sin to tap retirement plan accounts to pay for rent and food. Moreover, retirement plan money can

11
be a source of support while taking a year or more to go back to school. There are extremely important reasons, well short of retirement, to be saving money. There is no more powerful savings “machine” than a 401(k) or 403(b) plan with automatic payroll deductions, tax savings, and even employer matching contributions in many cases. Any young person who would rather not to move back in with parents, or live on a friend’s couch, should jump at the chance to sock away some retirement plan money. Anyone who has an occasion to tap this lifeline will never again have any doubts about the value of the retirement plan opportunity when settled in a future job.
If my spouse and I are in our thirties, both contributing the maximum, can we retire at age fifty?
Relatively young people have been able to retire in recent years long before what is normally considered to be retirement age. This doesn’t mean they quit working altogether. But more important, they have been able to consider career options for reasons other than earning enough to support their lifestyles.
Two spouses contributing an annual $10,000 each will have a total of $1 million in twenty years if their investments earn an average of 10 percent per year, the stock market’s average annual return. That $20,000 total contribution for a two-income couple costs their family unit about $13,000 in take-home pay.
It’s that simple.
If we’re in our fifties now, aren’t we within ten or so years of our goal of retirement?
Ten years to retirement may be true, but if you are in good health and have parents who lived long lives, there is a possibility that you will need money for many years. While retirement itself is just around the corner, a portion of your retirement money is still subject to a long-term goal.

12
Someone fifty years old today may still need their money to be growing at age eighty-five, the same thirty-five year time frame that a thirty-year old employee is considering.
Here’s a formula that some investment advisors suggest: Divide your age by one hundred and that will indicate what percentage of your assets you should have in bonds. Does age sixty-five over 100 indicate that 65 percent of your money should be in bonds and 35 percent in stocks? Hold on a minute. That won’t work for someone who might reasonably live to age ninety, and it ignores the equity someone may have in their home. Home equity amounts to a combination of a stock and a bond (it’s more like a bond). These common formulas that define many package retirement investments (target or lifestyle funds) are much too simplistic for most situations.
The information in this book will arm the retirement plan participant with a broader understanding of what they need to know to better meet their retirement goals.
We talked about young people, but what if any of us lose our jobs?
Is retirement the only reason for retirement plan savings? Who knows? Many of us are employed in volatile industries that periodically subject us to layoffs and extended periods of unemployment. This might be the most effective reason to be building a nest egg, our retirement plan. Between jobs, we can tap this money at any time and use it as our personal unemployment compensation. While the money is taxed just like job income, plus a 10 percent penalty for anyone younger than age fifty-nine and a half, receiving it in a year when little or no work has reduced income may mean that the only “tax” will be the penalty itself. Moreover, there are no Social Security or Medicare taxes (8.5 percent) on what would be distributions from a roll-over IRA, so this helps soften the blow of the penalty. Later, back at work at the next job, anyone who has experienced the “lifesaver” that the retirement plan represents will need little convincing to participate with the highest voluntary contribution possible.

13
Investment Decisions Start with Identifying GoalsGoal-Setting Exercise
Write down all the reasons you can think of for why you would want to save money.
• one- to five-year goals• ten-year goals• twenty-year goals• thirty-year or longer goals
The longer a goal, the greater the boost from the “invisible hand” of economic forces.
The reason goal-setting is so important is because investments offering more volatility will outperform more stable investment types. If we clearly identify a longer period for some of our retirement money, we can be comfortable with the risks that will yield a higher return over time.
While the overall stock market yields an average of 10 percent per year, small companies grow on average at a rate of 12.5 percent per year. What’s it worth to take the risk of investing in them? On a $10,000 annual investment, the small stocks will be worth an extra $200,000 in just twenty years ($572,000 versus $763,000).
The longer a goal, the less a financial crisis matters.
The collapse of stock prices in 2008 and early 2009 was in response to a failure of the financial services industry, primarily the banks who had made and packaged bad loans. So what? The time before that, the market crash was due to the bursting of the Internet “bubble.” Before that, in 1987, it was the invention and then the failure of “programmed trading,” where computers newly introduced for investment management all freaked out and decided to sell at the same time.
The great thing about these temporary disasters is that the market always recovers. They’re only a problem for someone with a short-term goal who has to sell everything in the middle of the crisis or someone who just can’t handle what is only a big loss on paper. A long-term goal kept in mind

14
throughout is what allows us to just shrug off these market downdrafts. We can sleep like babies.
It may further help to realize that market crashes often coincide with a reduction in the size of the economy, which leads to recession and joblessness. But, remember this fact: The average recession lasts only sixteen months, and while the unemployment rate increases, the remaining people still working tend to receive, on average, pay raises of about 3 percent. The stock market can be completely disconnected from an economic engine that may have slowed down, but that engine is still producing a huge amount of output. Think about this: the stock market dropped in value by 50 percent during 2008 and early 2009. Do you think that the total value of America’s public companies and their economic output dropped by that much over night?
Of course not.
Also, we have to remember that most market crashes follow a previous high-yielding “blowout” of increased stock prices that left investors giddy. The temptation is always to compare where we are after the crash with that unreasonable (we might say “undeserved”) high-water mark that our account balance hit at the height back when we all felt like geniuses. If we compare where we are at the bottom of a crash to a time further back like five or ten years, things are never all that bad and we’re clearly making progress.
With Goals Established, We Can Move on to the Basics
Investment success rests with understanding the relationship between risk, return, and time. The next section explores how these three investment components, like a three-legged stool, work together to create the wind under the wings of investment performance.

2
15
1. Risk—a self-assessment of risk-taking ability2. Return—an appreciation of what higher returns can accomplish3. Time—the time frame of goals
Keeping the fundamentals uppermost in mind will be a key factor in the successful outcome of retirement plan investing over time.
The man who knows more about risk, return, and time than anyone else in the United States is Warren Buffett, our second-richest citizen. Here is some advice from his book, The Warren Buffett Way:
“Fear and greed move stock prices above and below a company’s intrinsic value. In the long run, the value of stock holdings is determined by the underlying economic business; not by the daily stock market quotations.”
“If you expect to purchase stocks throughout your life, you should welcome price declines as a way to add stocks more cheaply to your position.”
“The future is never clear. What we know today is that there are well-managed companies that consistently make money, and the stock market values them periodically at foolishly high or low values.”
Buffett recognizes that he is neither richer nor poorer because of the market’s short-term fluctuations in price, since his holding period is longer term. As Buffett puts it, he would not care if the stock market closed for ten years; it closes every Saturday and Sunday and that has not bothered him yet.
How do we apply the same wisdom to our retirement plan money?
The Fundamentals of Risk, Return and Time

16
We need to first understand the basics: risk, return, and time are the three “engines” driving our financial success as we begin to match our goals and objectives with the investments offered in our retirement plan.
RiskRisk is a measure of the possibility that we might lose money.
The most obvious loss of money is an actual reduction in our account balance during what might be a bad quarter (or bad year) for our investments. This experience will always be difficult for us, even when we know the loss will be only temporary.
Fear of the unknown is always lurking somewhere in the back of our minds. We’re thinking, This time it’s different. This time it really is doomsday!
The key words above are “fear of the unknown.” The more we educate ourselves about investments and how they accomplish their miracles, the less the fear factor will influence our thinking (the less it will “mess with our heads”).
As President Roosevelt once said, “All we have to fear is fear itself.” The underpinnings of risk have more to do with emotion than rational thought. Fortunately, there are some mathematical measurements of risk that can satisfy anyone looking for more than the random “casino atmosphere” offered by stock markets in general.
When investing in stocks, there are two types of risks. The first is the risk that a single company or companies in the same industry may suffer a loss of sales, profits and value. The second is that the entire stock market may be under assault by the herd mentality of people who want to sell in a panic.
Eggs in More Than One BasketThe first risk can be alleviated by spreading investments over several different types of companies and industries. This is called diversification or diversifying. Most mutual funds own as many as two hundred different companies, so while one company might get into financial trouble, the

17
chance of all of them failing is too remote to bother seriously considering. Then, most mutual funds specialize in investing in a certain type of company (i.e., large companies, small companies, foreign companies, etc.). While one type of company may be having trouble, other types will be thriving. We reduce risk by dividing our funds among different types of mutual funds. (Diversification is discussed again later in the book.)
Stock-Market Crashes Lead to Economic StrengthThe second risk is alleviated by just knowing that stock markets have the capability to “snap back.” Since 1970, there have been seven major market crashes with between 25 percent and 50 percent losses. On average, we have seen a rise by 39 percent the first year following a crash and 12 percent the second year. (More on this later when we discuss how to make money on these downdrafts.) Apart from the crashes, there have been many “corrections.” These are “mini-crashes” that occur while the market is generally rising, and they can freak us out because we think that each one is the beginning of another major crash. The mini-crashes last, on average, only about a month before the market gains resume. In stock market history, there has never been a 365-day period that did not have at least one correction of 10 percent or more.
As mentioned in the previous chapter, the average recession, which usually prompts a stock market decline, lasts only sixteen months. Many stock market crashes and “corrections” actually take place during strong periods in the overall economy. We’ll look at this “disconnect” again later in the book.
Other Types of RiskBonds and money market funds also involve risk, even though we are taught to think that money is safe (or safer) in these investments than it would be if it was invested in stocks. The risk is more subtle but can be just as destructive as a stock market crash, which we will see as we learn about different types of investments.

18
Inflation, the Hidden Cost of Taking No RiskA more subtle form of risk is the inflation that eats away at the value of our retirement accounts. As time goes by, the goods and services we buy become more expensive by a few percentage points per year. Those few percentage points of inflation tend to be mirrored, year after year, by the rate of return on money market funds or savings accounts. The rate of return on money that involves no risk tends to be just about same as the annual rate of inflation. Therefore, while cash reserves may seem to be making money each year and offer the guarantee of never experiencing a year of losses, they offer no gains beyond the rate of inflation.
If someone promised to pay us $1,000 per month for the rest of our life, in twenty years that $1,000 would be worth only $400 in today’s dollars, assuming the inflation rate was 4 percent per year during that time. Another way of putting it would be to say that if you could buy a full tank of gas today, you’ll only be able to afford a 40 percent fill-up twenty years from now with that same amount of money. And this example assumes just 4 percent. In the early 1980s, inflation for a few years was at 18 percent per year.
ReturnInvestors receive a return when they own something or loan something. We own something when we invest in stocks. We loan something when we choose funds that invest in bonds. Even money market funds are a form of bond investment, although the “loans” are for very short periods (in many cases, just a few months) and they are called “notes” instead of “bonds.” Making loans in the context of your retirement plan means choosing an investment that invests in bonds or notes.
Owning something in the context of your retirement plan means selecting an investment choice (a mutual fund) that invests in shares of stocks in different companies. When you own stock in a company, your stock represents an ownership share in a business.

19
Any business that makes a profit is free to apply those profits in one or a combination of the following ways:
1. It can pay them out to owners each year in what are called dividends.
2. It can reinvest them back into the company to increase the company’s size and value so that owners can sell the company itself in future years for more than they originally invested. In the stock market, the rising price of the stock from day to day represents the recognition that profits are being made, first of all, and that they are being reinvested to create more business value.
In the end, whether your retirement plan investments are in stocks, bonds, or a combination of both, your return will consist of the following:
YieldThe amount of dividends or interest paid by the stocks and bonds your mutual funds have chosen as investments. This money, paid out either monthly or every six months, is automatically reinvested by purchasing additional mutual fund shares. In retirement plans, because money can’t be removed from the plan, the earnings on stocks or bonds are always automatically reinvested.
Total Annual ReturnThis is the increased value of your account starting with the yield and adding to it any increase in value of the stocks and bonds your mutual funds own. The total increase in value of all these sources will constitute the total annual return of your retirement plan account balance.
The relationship between risk, return, and time?
Why is risk worth taking? Because people who can endure more risk can expect a higher return as long as they have given themselves enough time to recover from periodic market meltdowns. During the past fifty years, the market has dropped at least 10 percent more than forty times. No doubt about it, the market will fluctuate. The following matrix illustrates

20
the amazing degree to which risk-takers, however, can be rewarded over time.
Portfolio value in thousands of dollars with $10,000 annual investment
Rate of Return 10 Years 20 Years 30 Years 40 Years2.5% $ 112 $ 255 $ 439 $ 6745.0% $ 125 $ 330 $ 664 $ 1,2077.5% $ 141 $ 433 $ 1,033 $ 2,272
10.0% $ 159 $ 572 $ 1,644 $ 4,42512.5% $ 179 $ 763 $ 2,659 $ 8,81515.0% $ 203 $ 1,024 $ 4,347 $ 17,790
For example, a portfolio with a 5% annual rate of return will yield roughly $664,000 after 30 years while a more aggressive portfolio earning 10% will yield $1,644,000—$1 million dollars more.
These numbers are all linear. For a $5,000 annual investment, just reduce the above figures by half. For $20,000 per year, they should be doubled, etc.
TimeOf the three “engines,” time is by far the most important.
This is why nailing down goals and the time they will require is a critical step in the investment decision-making process.
Time is to investing what oil is to engines.
We can see from dramatically increasing numbers that accepting some risk will increase returns. Why does more risk yield higher returns over time? Because of human nature, a group of people who want to invest money where it will generate the highest possible returns will have to turn to high-risk investments. So-called “venture capital” offers the highest risk of any investment type; less than one out of ten ventures ever pay off. However, when that one out of ten hits big, the profits can be enormous.

21
As retirement plan investors, we can take risks that will increase our returns and yet not experience a prolonged loss of money. Economic history proves that time reduces the risk of losing money in stock-oriented mutual funds.
The following chart illustrates the power of time in its ability to iron out the volatility of rising and falling markets. This visually illustrates that with rolling ten-year periods, an investor in the American stock market would have had almost no ten-year period of losses. In other words, since 1929, any stock market investment spread across all the stocks sold in the stock market would have earned a positive return if left for ten years.
Understanding the relationships between risk, return, and time is a critical component of any hope for success as an investor. A thorough appreciation for these fundamentals provides the basis for a more “set-it-and-forget-it” or an “automatic pilot” approach to investing, which leads to the best results over a long period.
Let the markets do the heavy lifting. Getting rich is easier than you think.
Unfortunately, it’s sometimes dangerous when we start to think. While the average mutual fund increased in value at a rate of 15 percent per year

22
from 1985 through 1999, the average mutual fund investor gained only 3 percent. Why? Because the average investor chased the previous year’s best-performing investments. Or, they switched in and out of the market at the wrong times.
Terrible investment results are only a symptom; the actual disease is a lack of understanding of the fundamentals: risk, return, and time.
The next key to the vault of investment knowledge is an understanding of the basic types of investments, the tools we need to build financial resources.
3
23
Three Asset Classes: Cash, Bonds, and Stocks
Like the basic food groups, there are three basic categories (or classes) of investment: money market funds (cash), bonds, and stocks. There are other asset classes such as real estate and oil, as well as hard assets like gold. However, the vast majority of retirement plan investments are directed toward the most basic of investment types.
CashThe advantage of this asset class is that we know we will not lose money and that we are guaranteed to make at least something, however small, in interest each year.
We know, however, that inflation robs our savings of any value gained from interest paid by money market funds.
BondsA bond typically pays a higher rate of interest than cash because bonds are “loans” for longer periods of time. A typical bond might have a maturity of ten years, which means that it amounts to a ten-year loan. Because loans of this length involve more risk (something might go wrong in ten years that we can’t anticipate today), interest rates paid on bonds are higher than what the U.S. government would be paying on thirty- to sixty-day notes. A note is just a bond with a very short time period to run before being paid back. This time period is the “maturity” of the bond or note.
So-called “junk bonds” are high-risk bonds (loans) to companies that may not be able to repay the loan. Despite the possibility of losing money,

24
people invest in junk bonds anyway because these bonds pay interest rates that might be as high as 15 percent per year.
The Important Difference between Long-Term Bonds and CashWhile cash involves no risk, the interest rate paid on these very short loans is just about the rate of inflation. The lenders (savers like us) are taking no risk and want to receive only enough interest to keep in line with what would otherwise be the erosion of their money’s value caused by inflation. Inflation, remember, is when today’s $1 loaf of bread costs $2 five years from now. The bread didn’t become more valuable. Instead, the value of the dollar was reduced to half of what it will buy today.
Bonds involve a longer-term commitment and because of this they pay higher interest rates than short-term notes. Bond values are priced every day just like stocks, and the total value of the bond market in the United States is four times larger than the total value of the stock market.
It is possible for a collection of bonds to decrease in value even though all their required interest payments are current and there is no indication that the borrowers would be unable to pay the money back. This happens when interest rates in the open market have risen and the original bonds owned in the fund are paying interest at the old original rate.
The value of the existing bonds will go down in a case where they are compared with brand new bonds that are suddenly offering a higher rate of interest.
By the same mechanism, bond mutual funds can rise in value if interest rates on the open market happen to fall. When market rates fall, those original bonds paying a higher rate are suddenly worth more money if we wanted to sell them.
We can think of this like a rope over a pulley. One side of the rope represents market interest rates (like the ones we read about when, say, we learn that
25
mortgage rates are decreasing). The other side of the pulley represents the capital value of the bonds.
Let’s say we bought a ten-year bond for $1,000 that pays 5 percent interest and will “mature” and pay back the $1,000 in ten years. In the meantime, it will pay us $50 per year, which is the annual interest we earn. If we wanted to sell the bond after just five years, its value would depend on what brand new bonds were paying in interest. If they were paying only 4 percent, our bond might sell for $1,200 and we would have a $200 profit. But if interest rates in the market were now as high as 6 percent, our bond could be unloaded for only $800 because at this price, our $50 annual interest payment would be equivalent to a 6 percent return. As our bond approaches maturity, when the $1,000 payback is guaranteed, what had been a rise or fall of value in the meantime goes away.
Bond mutual funds, just like stock funds, are valued every business day based on the market value of every single bond in the fund. This means that the entire value of the mutual fund can rise or fall based on interest rate changes in the bond markets.
StocksStocks are the pieces of paper or certificates that represent someone’s ownership interest in a company. By saying, “I own stock in that company,” it means that the person has stock certificates or proof of ownership. Over time, the American stock market has yielded rewards that have exceeded those of any other form of investment.
Owning stocks has been a hedge against inflation and is one of the best opportunities for harnessing the “magic” of compound interest.
Owning a share of stock in a company means that we actually own part of that business. A large company can be thought of as a huge pizza, with its ownership divided into as many a 20 million slices. Each slice, known as a share, may sell for $20 today. Tomorrow, however, a share may sell for more or less depending on the demand for that company’s shares, specifically, or the demand for shares in general. Someone buying a share today for

26
$20 may be able to sell it tomorrow for $22 (a 10 percent profit) or it may only be saleable for $18 (a 10 percent loss). Looking back over the last one hundred years, stocks have performed by far the best of all the basic investment groups.
The average stock has generated annual returns that are about 7 percent higher than the average rate of return on savings accounts or thirty-day United States Treasury notes.
Individual stocks and bonds are cumbersome to manage and keep track of, so retirement plans typically use mutual funds as the investment vehicle. What exactly are mutual funds and what advantages do they offer investors?
4
27
Mutual Funds
Where can I find an investment adviser I can afford?
If investments in stocks offer the best approach to long-term success in building a retirement nest egg, the average investor needs access to a means of investing that taps into the know-how of seasoned professional investors. Investment managers with proven track records can be compared against each other. To be practical and cost effective, the services of these advisers need to be available with ease and minimal cost. Mutual funds offer the best access to professional investment assistance.
What are mutual funds?
Mutual funds provide the opportunity to invest in a professionally managed investment pool that purchases stocks in hundreds of different companies. As you contribute money into this pool by buying shares in a mutual fund, you are buying a percentage of all the stocks in the pool.
Each business day, the value of the entire pool is calculated based on the price of every share of stock owned by the pool at the end of that day. The total can be hundreds of millions, if not billions, of dollars. As an investor, you actually own a small percentage of all those stocks. The value of your investment goes up or down on a daily basis as the stocks owned by the pool change in value. If you want to cash in (redeem shares from) your account, the mutual fund company sells enough of the stock it owns to generate the cash needed to cover the check they will be sending you on that day.
The advantage of a mutual fund is that it offers the novice or small investor some access to the best investment managers in the world. It also offers diversification (discussed in detail below) so that even small amounts of money are spread out over hundreds of different stocks. This reduces risk.

28
Protection for the investor comes from the fact that the underlying stocks purchased by the fund secure the investment. The investor’s account is always worth its proportionate share of all the stocks owned by the fund. Every stock owned by the fund would have to drop to zero in value (bankruptcy) before the mutual fund would lose everything. The collection of stocks and/or bonds in a mutual fund is referred to as the fund’s “portfolio.”
How do the returns of stock market mutual funds compare with those of bond funds and money markets?
If you had invested $1,000 in the average stock mutual fund twenty years ago, you would have about $8,000 today, and that period includes two major stock market crashes. The same $1,000 invested in a money market fund over the same period would have grown to just $2,000.
That’s an amazing difference. How do professional managers do it?
Managers review specific industries and monitor prices of the stocks in those industries. They tap vast resources of data not practically available to the small investor. They monitor, for instance, the buying and selling activity of corporate officers (known as “insider sales”), which is public information by law. They also monitor the macroeconomic environment to determine economic swings and to assess how these major moves in the economy will affect stock prices.
In some cases, a diligent money manager will monitor the activity in the parking lot of a new company to see how many employees are working late at night after business hours. This is seen as a measure of the degree to which the company’s success is an obsession of its employees. Obviously, average investors do not have time for this level of hands-on company research; the money investors effectively pay to have mutual fund managers perform activities such as this is probably money spent in the best possible way.
Diversification: It Helps Us Sleep at NightA major factor in overall success is diversification. While one stock may prove to be a loser, the gains from others can more than offset that loss. The

29
individual investor would find it impossible to achieve the diversification offered by participation in a mutual fund. One $20 investment in a single mutual fund share can be spread out over the ownership of hundreds of different companies, creating miniature investments of just a few cents in each company. Our $20 investment would mean that we owned 6 cents worth of some huge company, 2 cents worth of some other huge company, etc., depending on what investments our mutual fund happened to hold.
When a Little Means a Lot
Each additional percentage point of interest earned, over time, can translate into millions of extra dollars in the future. We would all love to make a killing over night, but investment success is more often measured in fractions of a percent over long periods. The following matrix illustrates the extent to which just one more percentage point per year can make a difference. We begin with a common 10 percent example, the difference between earning 9 percent versus 10 percent. We also include a 14 percent versus 15 percent example, because there have been twenty-year periods, (1980 through 1999) when the stock market has averaged 16 percent per year. The first ten years of the new century have been described as “the lost decade” because stock prices were largely flat. However, some mutual funds gained as much as 14 percent per year during this period.
$10,000 per year contributed over twenty-four pay periods
Annual Earning 10 Years 20 Years 30 Years
10% $ 171,178 $ 642,491 $ 1,925,8369% $ 162,568 $ 566,549 $ 1,570,441
Value of extra 1% $ 8,610 $ 75,942 $ 355,395
15% $ 232,057 $ 1,279,641 $ 6,008,78214% $ 215,656 $ 1,079,734 $ 4,541,874
Value of extra 1% $ 16,401 $ 199,907 $ 1,446,908
The stock market historically has averaged a 7 percent per year better rate of return than money market funds. Why, then, would anyone with at least

30
20 years until retirement choose to relegate themselves to a money market fund at 3 percent versus the stock market at, say, 10 percent?
How do mutual funds make money?
Mutual funds subtract their charges on a daily basis from whatever they may be making as their profit or rate of return for the investor. When a mutual fund’s rate of return is expressed in any fund ranking or report to investors, the result is always expressed as “net of fees” which means that the fees have been subtracted before the fund’s rate of return was published.
These expenses are what you, as the investor, pay to get the mutual fund to work for you. The charge is deducted automatically from your account on a daily basis and your annual rate of return will be reduced by whatever the management fees add up to. You will never receive a bill or have to write a check for them. They are just automatically collected.
On the previous page, we pointed out how much a difference of 1 percent can make in long-term investment success. While most actively managed funds charge an annual cost of 1 percent per year, index funds charge about 0.2 percent, an 80 percent discount. Some index funds now charge as little as 0.07 percent (the reason index funds are so cost effective is explained in the next paragraph).
What are “index funds”? Are they different from mutual funds?
Index funds are mutual funds too, but they are a type of mutual fund that is set on “automatic pilot.” This means that there is very little active management of the money along the lines of what was described earlier. Instead, index fund managers buy a broad cross-section of companies that represent a mirror image of the entire stock market or some specific portion of it. After that, no further stock-picking or trading is done. For instance, if a single company represented 5 percent of the country’s stock market value, then an index fund would have 5 percent of its assets invested in that company’s stock. That’s it. No hanging around in parking lots to try to determine the stock market’s next “winner.”

31
A so-called 500 index fund is a cross-section of the largest five hundred companies in the United States. Each stock owned by the fund is owned in proportion to that company’s amount of outstanding stock, in dollars, relative to the total value of the outstanding stock of all five hundred companies. “Outstanding stock” means the amount of stock actually available on stock markets that is owned by investors. About 30 percent of the entire value of a 500 index consists of the outstanding stock of only fifty companies. In other words, while the index includes five hundred companies, a handful of huge companies dominate the fund’s results from day to day.
These largest five hundred companies also make up roughly 70 percent of the entire value of the U.S. stock market. Although there are a total of 6,500 public companies, the remaining 6,000 firms beyond the biggest five hundred amount to only 30 percent of the stock market’s total value.
While the 500 index is the eight-hundred-pound gorilla of the investment world, there are index funds of every stripe that reflect the returns of smaller portions of the stock market. There are more than two hundred different types of index funds ranging from those that invest in small companies to those that invest only in large companies that pay dividends.
The advantage of index funds, and the reason for their popularity, is that they don’t cost very much to operate. There are no investment geniuses earning multi-million dollar annual salaries. There are fewer ongoing trading costs because stocks are not being bought and sold (“churned”) in the portfolio.
The theory behind index fund success is that their lower fees and trading costs will more than compensate for the lack of active management. A theory was developed thirty-five years ago by some Stanford professors who threw darts at the stock page of the Wall Street Journal and bought the stocks that the darts hit. They proved that buying stocks randomly and then not messing with them (a buy-and-hold strategy) would yield results that would outperform 80 percent of all active efforts to manage money (after the fees and costs had been deducted). The theory holds that 70 percent of any one stock’s performance (up or down in value) is a result of what the

32
stock market as a whole is doing. The best and brightest money managers in the world will be looking at a 70 percent probability of losing money if the stock market is headed down. We all want to know which managers will be in that 20 percent group who beat the market, but it is impossible to know, beforehand, who these managers will be. At least some members of the 20 percent club just got lucky.
Meanwhile, the Stanford professors have gone on to win Nobel prizes for discovering the “efficient markets,” “random walk,” and “wisdom of crowds” theories, which all derived from the dart-throwing experiment. More recently, the hypothesis has been retested using a chimpanzee to pick the stocks. The original results have been confirmed.
What Mutual Funds Accomplish
The mutual-fund concept offers a window of opportunity enabling us to invest small amounts of money in giant pools that have even more economic clout than Bill Gates or Warren Buffett. Armed with this valuable tool, investing can become as easy as learning how to swim or drive a car. It’s important to appreciate how just an understanding of the fundamentals will generate better overall investment results than those achieved by others who spend time becoming self-styled investment experts. As Earnest Hemingway once said, “Some intellectuals are the dumbest people I know.” The investment world is littered with people who have “lost sight of the forest for the trees.” Their investment results have been dragged down by indecision or an effort to be too clever.
Applying basic investment fundamentals is much more important than knowing a lot about company finances, or attempting to second-guess what will happen in the stock market or the economy.
All we need for success is to choose an investment mix that offers the maximum returns for the level of risk we can tolerate. As a general rule, the more volatility (higher gains and bigger losses) we can tolerate, the more money we will accumulate in the long run. However, there are some refinements in investment technique that can increase profits without increasing risk. The ideal investment mix incorporates some of these

33
techniques, and the next three sections will help us identify and use these tools as we select our investment mix.

5
34
Adopting the Cornerstones of Intelligent Investing
The key to a successful investment mix starts with a clear understanding of your objectives, and then moves from there to a selection of investments that fits your needs and personality. Since there is no single investment that offers high returns with low risk, your job is to create a mix that meets your desired rate of return at a risk level with which you can live comfortably.
Diversifying or spreading your retirement plan money across different types of investments can reduce your risk and help create your Path of Minimum Regret. In financial circles, this is officially referred to as the Efficient Frontier. It is the point at which you have taken your maximum allowable risk, and your investments are set up to generate the maximum rates of return that can be expected from that risk level.
So much for theory. Which mix of my retirement plan fund choices will best help me reach my goals?
To determine which fund or combination of funds makes the best sense for you, begin by answering the most basic fundamental question:
“When do I plan to need this money?”
Next, review the investment characteristics of the different types of asset classes (cash, bonds, and stocks) along with their risk/return relationships.
Understand how different asset classes meet the needs of different goal time frames.
CashOne- to four-year goals. Money-market funds preserve cash. The money will always be there even though it doesn’t earn much in annual profit.

35
BondsFour- to seven-year goals. Bonds can drop in value, temporarily, but while they present these capital fluctuations, they will generally earn more than cash.
StocksSeven-year-plus goals. Stocks are by far the most profitable of investment classes, but they can lose the most in single years.
Most retirement plan investing is long term. Even after retiring, people still have years of inflation to contend with, so stocks play a large role well into old age.
Never expect too much from stocks as short-term investments. Remember that 70 percent of any one stock or stock mutual fund’s performance is based on what the stock market as a whole is doing. You can have the greatest mutual fund or stock in the world, but if the stock market is dropping in value, there is a 70 percent chance that your great mutual fund (based on past results) will also be dropping in value. This means that if you picked the worst mutual fund available, you would still be doing at least 70 percent as well as the average fund. A falling tide lowers all boats.
Let’s combine some economic and investment fundamentals to see how they apply to real-life situations.
First, we need to ask which of these three levels of risk best describes our basic comfort zone.
1. Conservative Investor: “I need to know that my investments are increasing steadily each year. I realize that this psychological or practical requirement will mean lower returns in the long run.”
2. Moderate Investor: “I am willing to accept occasional losses knowing that accepting this risk is the price I need to pay for higher returns over time.”
3. Aggressive Investor: “I am seeking maximum long-term gains and will not be concerned about short-tem losses.”

36
The following matrix illustrates what we can expect in returns and risk levels from the different percentage combinations of stocks and bonds. These averages are based on the twenty- and thirty-year periods ending in 2010. It may come as a surprise to learn that very similar results are generated using the twenty- and thirty-year time period ending in 1993, nearly two decades ago. That previous period began with the stock market crash of 1973 to 1974.
Can you share a stock market statistic that provides some more reassurance?
We have been through seven major stock market crashes from 1973 to the present. In each case, when we have been able to look back and identify the exact day of the bottom of the market, we find that the average rate of return for the following twelve-month period has been 39 percent. The second twelve-month period following the crash has seen an 12 percent gain. While some of the crashes were more severe than others, these were the averages. The greater the crash, the greater the “snapback.” From 2008 until March 2009, the market lost almost 50 percent, the greatest loss since the Great Depression of the 1930s. The most recent snapback, however, has been 180 percent over four and a half years.
While adding bonds to a stock portfolio can blunt the effect of a stock market crash, they will also reduce what can be expected for a total portfolio return. Review the following matrix carefully, and use this information to develop a sense of what level of short-term “investment pain” you can tolerate in return for longer term gains.

37
Investment Mix
20-Year Average
Return 2002 Loss
Total Return
1/1/2002 to
12/31/2005
Total Return
to 2010 over 20
Years
100% Stocks 11.10% -17.21% 72.79% 820%
80% Stocks 20% Bonds
10.23% -13.75% 63.64% 700%
60% Stocks 40% Bonds
9.35% -9.64% 53.64% 579%
40% Stocks 60% Bonds
8.47% -4.66% 42.69% 508%
20% Stocks 80% Bonds
7.60% 1.50% 30.63% 432%
100% Bonds 6.72% 9.30% 17.30% 367%
This chart illustrates that the conservative portfolio of 80 percent bonds lost less and corrected faster, but over twenty years it accumulated about one-third less money than the 100 percent stock portfolio.
This grid is important to review carefully, and ask yourself how you would feel in a major market downturn. Is it worth it to you to lose 30 percent or more if you stand to have 50 percent more money in twenty years? Do you have twenty years left before retirement?
Like the warning on your car’s rear view mirror, the actual results may be bigger than they appear. The figures illustrated above are based on broad cross-sections and averages of American stocks and bonds. In an actual retirement plan investment selection, there will be a variety of investment types offered that will create more diversity and possibly less risk. A mix of different types of stock market investments (including, for example, an international fund or small-company fund) will generally reduce the amount of loss in a market downturn while maintaining the same gains that would have been expected of the market as a whole.

38
To illustrate this last point, the period from 2001 to 2010 has been describes as “the lost decade.” This refers to the fact that the broad stock market averages, even including reinvested dividends, earned almost exactly zero during this troubled time frame. It has been the worst ten-year period in stock market history. Yet, a combination of specific stock types, such as small-company stocks and foreign stocks, has actually earned an average of about 6 to 7 percent per year over that same period. In the following chapters, we’ll learn how to combine a mix of these different investment styles to improve results over the long term.
A mix of investment types (diversification) can reduce risk and increase returns. Experiencing how each different style performs during periods of an economic cycle can lead to a practice of selling at least some of today’s winners before they become tomorrow’s losers and vice versa.

6
39
The Automatic Pilots of Retirement Plan Investing
What are the differences between different funds, and why do they matter?
Beyond the influence of the stock market itself, the second most important influence on investment success is the investment style of the money manager or mutual fund. Mutual fund managers each adopt different styles of investing. Over extended periods, “every dog will have its day” in the sense that a particular style will do better than others during a portion of a business cycle.
The key is to have several different dogs in the hunt.
Value investors specialize in large companies that have recognizable value in the form of, say, cash or factories or brand recognition. Warren Buffett is the classic example of a value-oriented investor; he says he looks for companies that have relatively little debt, consistent profits, and what he calls a “moat” around them that makes it difficult for other companies to compete.
Growth investors invest in growing companies that borrow as much money as they can and that re-invest every dime of their profits. They hire more people, lease more space, and buy more capital equipment as fast as possible in an effort to grow their share of their market as quickly as possible.
Blend is just what the name implies—a mutual fund that invests in companies that include both value- and growth-oriented companies.
All three of these approaches can be applied to large, medium, and small companies, so we wind up with a style box that we can use to identify the style of the investment.

40
Value Blend Growth
Large
Medium
Small
When this nine-frame box is used to describe a manager’s style, one of the boxes will be filled in to indicate where, on the style grid, the manager’s mutual fund fits.
In addition to these basic styles, we can also have funds with styles best described as “out of the box.” This refers to different types of mutual funds beyond just the style definitions. These different types would be, for example, foreign funds or industry-specific funds such as technology, precious metals, healthcare, emerging markets, real estate, and many other sub-categories of investment types.
Also “out of the box” would be bond funds that are buying loans rather than owning stock in companies. Bond funds also have their own style box, which identifies the level of risk and the average maturity of the bonds they hold.
Why is style and/or investment type important?
We are always moving through economic cycles (see explanation below). They never stop. At any point during an economic cycle, one or two style combinations will be winners over all others. A year or so later, during a different period of the cycle, another style combination will be on top. Just about the time we are reading that small companies and technology companies are “hot,” we will begin to see a period when those investment types start falling out of favor. Instead, large “blue-chip” companies paying generous dividends (“value” stocks) will be rising in price faster than anything else. Since economists themselves can never agree on where we are in an economic cycle, it is impossible to know beforehand what new portion of a cycle we will be moving into next.
41
What are stock market “cycles” and how do we benefit from them?
The stock market historically has had a 10 percent “correction” about once every 365 days and at least a 20 percent “crash” about once every seven years. These figures are historical averages. Over just the last ten years, we have had two occasions, 2001 and 2008, where the stock market lost first 35 percent and then 50 percent of its value.
In fact, we can now look at the past forty years and note that the market has experienced seven major crashes during that time. In each case, however, there has been a substantial snapback effect that has become reasonably predictable.
As previously mentioned, once we determine the absolute bottom of each crash, the day that marked the lowest point, we can see that the average gain in the following twelve-month period has been 39 percent. The second twelve-month period saw average gains of 11 percent, and the third twelve-month period was 4 percent. With these substantial gains following a downturn, the average long-term annual rise for the years immediately following a crash tended to be 13 percent per year rather than the normally expected 10 percent.
With all these crashes and recoveries, how much can we depend on a 10 percent average return?
We like to think that average returns would be normal over the years and that major crashes and recoveries would happen pretty rarely. Actually, the reverse is true. During the past 84 years, stock market returns were more than 20 percent per year for about 40 percent of the years.
The market lost between 0 percent and 10 percent just 14 percent of those years. Significant crashes, like more than 30 percent losses, happened in just 3.6 percent of those eighty-four years.
What we consider to be average returns of somewhere between 0 percent and 20 percent per year happened in just 33 percent of the years. So, only about a third of the time can we expect satisfying, “normal” returns that we generally count on. The other two-thirds of the time, we are experiencing

42
losses that make us nervous, or gains that make us feel much better about our money management abilities and our futures. It all averages out, however, to the 10 percent we like to depend on for future planning.
Dollar-Cost AveragingEven though this might sound goofy, we want to pray that stocks will crash from time to time. When markets decline in value, this is good for voluntary retirement plan investors. Why? Because we are investing continual infusions of new money every pay period (called dollar-cost averaging). When the stock market falls, this money is buying mutual fund shares at cheaper and cheaper prices. Each crash and correction allows us to buy shares at bargain prices, which lowers the average price of all the shares we have purchased. Years later, when we start nibbling away at our retirement plan money to generate income for retirement spending, we will be doing what every successful investor pledges to do: Buy Low and Sell High. Today’s shares bought at low prices will inevitably be sold years later, bit by bit, at far higher prices. History will repeat itself. And anyone who says, “This time it’s different,” will be proven wrong.
RebalancingRebalancing is a variation of dollar-cost averaging. If we choose an investment mix today of, say 40 percent bonds and 60 percent stocks, we should rebalance and go back to those proportions once a year if gains on one side have caused the percentage mix to change from our initial balance. This forces us to sell a few shares of the asset type that has increased in value and buy some shares of the cheaper asset. We are methodically selling high and buying low. Rebalancing is explored in greater detail in the next chapter.
While rebalancing offers a mechanical approach to investing, its real value is psychological. There is a huge temptation for amateur investors to try to second-guess what might happen next in the stock market and make investment changes based on a hunch. Fueled by television’s financial talking heads and the media in general, investors get very bad advice
43
that prompts them to make disastrous short-term investment decisions. Rebalancing is simple. It generates time-tested superior results and helps people feel like they take positive steps from one year to the next without having to become market experts.
Besides, who wants to become a market expert when only 15 percent of the professionals actually beat the market averages over long periods?. We can’t be fooled by those who have beaten the averages recently. They may have been just lucky. There is no way to know who will beat the averages in the future.
The Bottom LineDollar-cost averaging and rebalancing are really capitalizing on the extent to which stocks decline in value. On Wall Street, the saying goes, “More money is made in falling markets than in rising markets.” This is helpful to remember when markets are crashing and we’re still investing, or when one of our funds has been struggling and we’re prompted by rebalancing to add to that temporary loser.
Once we recognize that the stock market will fluctuate, sometimes wildly, we can capitalize on those fluctuations by understanding how to adopt an investment strategy. Choosing an investment allocation or mix is the subject of the next chapter. This is easier than you might think.

7
44
Choosing Your Investment Mix
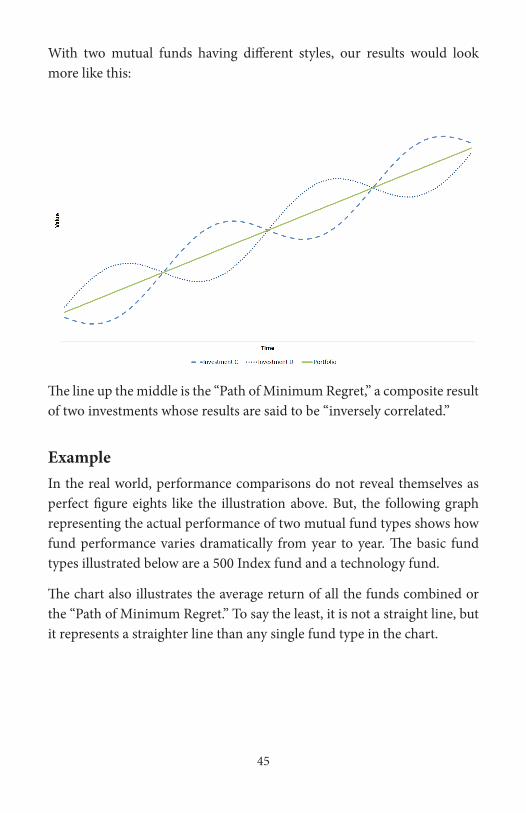
By mixing a combination of investment styles, we can reduce our risk and achieve more consistent long-term results. Once we have determined that funds investing in the stock market are appropriate as a part of our retirement plan investment mix, we need to choose a combination of different investment styles. Why choose different styles? Because diversification is wise—and profitable. With just two mutual funds having the same investment styles, our results would look like this:
45
The line up the middle is the “Path of Minimum Regret,” a composite result of two investments whose results are said to be “inversely correlated.”
ExampleIn the real world, performance comparisons do not reveal themselves as perfect figure eights like the illustration above. But, the following graph representing the actual performance of two mutual fund types shows how fund performance varies dramatically from year to year. The basic fund types illustrated below are a 500 Index fund and a technology fund.
The chart also illustrates the average return of all the funds combined or the “Path of Minimum Regret.” To say the least, it is not a straight line, but it represents a straighter line than any single fund type in the chart.
With two mutual funds having different styles, our results would look more like this:

46
The point: In the world of investing, “every dog will have its day.” It is impossible to predict with any certainty what style will be the next winner. Therefore, you reduce risk by diversifying across a variety of different styles. This concept is called “modern portfolio theory.” It is a technique that reduces risk without necessarily reducing returns.

47
Rebalancing: How to Use the Path of Minimum RegretAs discussed in the previous chapter, rebalancing your investments can help increase returns over long periods. Rebalancing simply means that you sell portions of your winners and buy portions of your losers.
For example, if you started the year with fifty-fifty mix of a tech fund and a 500 Index fund and assuming a $10,000 annual contribution, your balances at the end of the year might find you with $6,000 in the tech fund and $4,000 in the 500 Index fund. In this case, you would sell $1,000 of the tech fund and buy $1,000 of the 500 Index fund to bring them back to the fifty-fifty allocation.
The following chart shows the growth of an account invested in a four-fund combination. Assuming a $10,000 annual contribution rebalanced each year, the advantage in this example adds up to $40,000 in twenty years. In return for a few minutes of time and some simple arithmetic once a year, the advantage is equal to four full years’ worth of contributions.
Fund value with $10,000 annual portfolio contribution (distributed evenly among funds) over twenty-year period:

48
Over time, rebalancing has proven to be probably the best consistently successful investment strategy that investors as a whole have ever developed. We can forget about stock picking (the odds are stacked against us) and/or trying to second-guess where the economy is going next (economists as a group are always famously wrong on that one).
Need more convincing? Let’s extend the graph to forty years and assume that the next twenty years will offer the same ups and downs as the past twenty years. Over this hypothetical forty years, the rebalancing mechanism adds, potentially, half a million dollars to the total account balance. When we say “adds” we mean that selling pieces of our winners and adding that money to losers will increase our total nest egg by that much more than we would have had by just setting an allocation and then forgetting it.
Without Rebalancing With Rebalancing Rebalancing Advantage$479,089 $518,225 $39,136
Market Value of Model Portfolio after Twenty Years (1993 to 2012)

49
Fund value with $10,000 annual portfolio contribution (distributed evenly among funds) over forty-year period:
Without Rebalancing With Rebalancing Rebalancing Advantage$3,653,246 $4,211,530 $558,284
Market Value of Model Portfolio after Forty Years (1993 to 2032)

50
What is the biggest risk facing an investor?
The biggest investment risk for a retirement plan investor is the risk of abandoning a strategy. Once an investor has determined the time required for their retirement plan goals and has chosen an investment mix for those goals, the most important factor generating future success is not deviating from that strategy. In other words, we should hold steady.
People who freaked out in 1987, 2000, or 2008 and moved into money market funds missed out on the opportunity to be even again within, at most, two years. Those who moved to cash typically lost 20 percent and did not return to the market until it was once again poised for the next crash. (Talk about snapping defeat from the jaws of victory!)
A mechanical approach to the market, coupled with confidence in history’s ability to repeat itself, can make anyone a winner in managing their financial future.
When it comes to rebalancing, the positive arithmetic is probably not as important as the psychological value of this exercise. Understanding that successful investors tend to buy losers (when they are relatively cheap) and sell winners (when they become relatively expensive) is an important methodology to incorporate into your investment practices. The all-too-popular but disastrous alternative is to chase last year’s best-performing fund. Yet, studies show that this practice is what most amateur investors do year after year.
Worse yet is the practice of bailing out of the market after watching assets drop by 15 to 20 percent. Moving into cash or money market funds at that point dooms the now-traumatized investor to missing out on the inevitable “snapback.” Anyone fleeing the market will be waiting until they are absolutely certain of the market’s health before tip-toeing back in. Meanwhile, remember that 39 percent average first-year return from the bottom of a crash? Roughly 20 percent of the average 39 percent occurs during the first 4-6 weeks. The train is leaving the station and everyone wants to get on—right now.

51
The primary benefit to a disciplined rebalancing strategy is that it prevents us from making the classic mistake of buying high and selling low.
Adding Bond Funds to the Rebalancing Exercise Further Reduces RiskSo far, we have been rebalancing just different types of stock-invested mutual funds. If we add bond funds to the mix, we can further reduce our risk, and, in wildly fluctuating markets like those of the past ten years, we can actually increase our returns.
An all-stock mix can be expected to gain roughly 10 percent per year over long periods, but two-thirds of the years we are invested in that mix the results will range between a 27 percent gain and a 7 percent loss. (This is referred to as one “standard deviation.”)
If we change the mix to have one-third of the money invested in bond mutual funds and the other two-thirds in stocks, then the expected return for two-thirds of the years we are invested ranges between a gain of 22 percent and a loss of just 2 percent. Instead of an average gain of 10 percent that an all-stock mix would have been providing, we would need to be satisfied with just 9 percent. We give up 1 percent of possible annual gain for the safety of a lower loss.
One-third bonds and two-thirds stocks has proven to be the “sweet spot” of any mix between stocks and bonds. As you move to a greater percentage of bonds, the potential gain drops to 7.5 percent (at a fifty-fifty mix) and the downside protection is not much greater.
Rebalancing a mix between stock funds and bond funds, however, can be more rewarding in some years than just rebalancing an all-stock mix of different styles. Why? Because stock and bond prices often move in opposite directions (they are said to be inversely correlated), and the effect of rebalancing can be more dramatic.

52
We’re Approaching the Finish Line…The exercise of rebalancing annually and eventually folding in some bond funds as retirement looms is a basic investment pattern for a lifetime of investing. The last chapter illustrates how we need to manage our money in retirement, but the last few years of our career give us the opportunity for a “dry run.” Gaining some experience and a comfort level with a mix of stock and bond funds is better accomplished while we’re still working. Adding some bond funds to the mix should start about 10-15 years before that final day at work.
8
53
While most of our money is invested in 401(k)s, 403(b)s, IRAs, and other retirement plans, some Americans are fortunate enough to have so-called “after-tax money.” This is money that is not in tax-free retirement plans. It’s just a prudent result of having managed to save and invest some “take-home” pay. After-tax money can also come from other sources such as inheritances, the sale of a home or business, stock options, divorce settlements, and financial events that don’t involve retirement plans.
These after-tax dollars can be much more difficult to accumulate for two reasons: First, if you started with $1,000 of gross earnings, you would have to pay taxes and then save what is left. For many people, state and federal income taxes on their last $1,000 of earnings can easily be as much as 35 percent combined. That would leave about $650 after taxes to be invested. It gets worse, because then you’re taxed each year on your success as an investor. For these reasons, “after-tax” money is a challenge to grow. As a result, special investment techniques and different types of mutual funds can be brought into play to meet this greater challenge.
Before going further, let’s review one of the basics: The “Rule of 72” describes the fact that money earning 10 percent per year doubles every 7.2 years. Therefore, $1,000 today will be $2,000 in 7.2 years, $4,000 in 14.4 years, $8,000 in 21.6 years, etc. Money earning 7.2 percent by comparison doubles every ten years, so at this rate, $1,000 will be $2,000 in ten years and $4,000 in 20 years. That’s the magic of Compound Interest. The first year’s $1,000 earning 10 percent becomes next year’s $1,100 earning another 10 percent or $110, etc.
Managing “Other Money”

54
Unless an investor is retired, these investment earnings will be accumulating on top of what is already their earned income from a job. So now, let’s review a second basic.
Generally speaking, you don’t pay much in taxes on the first half of your income. Instead, the government chooses to really “sock it to you” on the last half of what you make. It is taxing at an ever-increasing percentage as your income increases.
Remember the last time you received what was supposed to be a $100 raise per paycheck? You probably noticed that your new take-home pay increased by only about $65. The reason the increase was small compared to your gross wage increase was because that raise was the last $100 of your income and was taxed at the highest rate you pay.
The following schedule will help you calculate the tax rate on each additional amount of money you receive in income. These tax percentages are known as your marginal tax rates because they illustrate the rate that you pay at the outer limit of your income.
Approximate “Marginal” Income Tax Percentages(percent tax on the last $1,000 of income)
Includes Both Federal and California State Taxes
Single Persons Married Persons *Taxable Income Tax Taxable Income Tax
$8,925 to $36,250 18% $17,850 to $72,500 20%$36,250 to $87,850 33% $17,500 to $146,400 32%$87,850 to $183,250 37% $146,400 to $223,050 37%
* If your spouse is also working, use your combined income to estimate your marginal income tax brackets
** Remember, for each exemption you claim, subtract $3,950 (in 2014) from your taxable income

55
When income from after-tax investments is reported each year, it gets added to the taxable income of a single person or a couple filing jointly. Unless you plan to quit working, your investment income becomes the “extra” income (just like getting a raise in the example above) that gets taxed at the highest marginal rate. Therefore, a 10 percent return on an after-tax investment might net only about 6.5 percent after taxes. By comparison, the same 10 percent earned in a retirement plan would still be a full 10 percent added to the growing account balance.
Example: Sally and Jim both work and have an Adjusted Gross Income after all deductions and exemptions of $69,000. Sally inherits $200,000 from a relative, and they deposit this into a bond mutual fund that pays interest at a rate of 5 percent, which amounts to $10,000 per year. This $10,000, even if they don’t spend it, raises the couple’s taxable income to $79,000 for the year. We can see from the chart above that all dollars between $68,789 and $86,934 are taxed at 33 percent. This means that Sally and Jim will owe an additional $3,300 in taxes on the $10,000, leaving them with just $6,700 to add to the $200,000 account.
Now you can see why investing after-tax money can be such a challenge. Not all fund earnings, fortunately, are taxed as regular income like the previous example. So-called “Capital Gains” income is taxed at a combined rate (California state and federal) of 25 percent. This is income that comes not from regular interest paid but from the profitable sale of an investment—selling the stock, for instance, at a price higher than the initial purchase.
How Mutual Fund Profits are TaxedWhen mutual funds investing in stocks throughout the year buy and sell different companies, they generate profitable trades (hopefully) that add up to gains that are taxable for the year. Investors in those mutual funds receive a Form 1099 at the end of each year detailing their share of those taxable gains. This information goes on our tax return, and we pay taxes on those amounts accordingly. Then, when we sell a mutual fund years later at a higher price than we paid for it, we calculate the difference in price (for example, we bought it for $1,000 and we’re selling it seven years later

56
for $2,000) and we owe taxes on that profit. However, we are allowed to reduce our profit by all the gains that we paid taxes on over the seven years that we owned the fund. It’s complicated, of course, which explains why most people have much better investment results in their tax-insensitive retirement accounts.
What investment types are most tax friendly?
So, how do we manage to minimize the tax hit on our after-tax money? Index funds, tax-managed mutual funds, and annuities offer some of the best tax-shelters outside of a retirement plan.
Index FundsIndex funds just invest in a broad cross-section of companies within a specific type. For example, a 500 index fund invests in the largest 500 companies in the country. A small cap index fund invests only in a cross-section of small companies. Index funds are “passively” managed, which means that no one is actively trying to find the next super-star company. As a result, these funds have very little “turnover” of buying and selling. A typical amount might be as little as 5 percent of the total portfolio per year. By comparison, some mutual funds have 200 percent turnover, which means they have replaced by June all the companies they owned in January, and by December they have sold once again the new companies they had owned in June.
An index fund that does very little trading generates very little in ongoing annual capital gains profits that would otherwise trigger annual taxable income. Years later, then, when a portion of the fund is sold at a profit, there is little in the way of annual gains that have been reported along the way. What would have been paid in taxes is still sitting in the investment and is part of what becomes the gain that the investor gets to enjoy. The distinction offered by index funds is that the profits are controlled by the investor rather than by the fund company. Taxes are due only on the profit made on the amount of money withdrawn from the fund in a year. Someone nibbling away at their index funds to support themselves in
57
retirement might be paying relatively little in taxes on the distributions from their index funds.
Tax-Managed Mutual Funds and Other Tax-Reduction ProductsTax-managed mutual funds are those that are sensitive to the tax hit, so they solve this problem by selling some stocks at a profit each year while “harvesting losses” that will offset the gains. The net effect is that their investors reviewing their year-end 1099 tax reports from the fund will see that they will not have to come up with more money for taxes.
Some bond funds invest in so-called “tax free muni’s”: municipal bonds that offer interest that is free of federal and state income taxes. Usually, these bonds pay an interest rate that is lower than that of taxable bonds because they recognize that their tax-free treatment gives them an advantage that allows them to pay less interest.
Annuities are insurance products that allow investors to accumulate money in a tax-deferred shelter, just like that of a retirement plan. However, annuities can be very expensive and come loaded with all forms of commissions, death benefits, and something called “contingent deferred sales charges,” which are penalties for withdrawing your money.
ETFs are exchange-traded funds, like index mutual funds, but they are valued minute by minute and traded throughout the day. Traditional mutual funds are valued just once at the end of each day. The advantage is that an investor can control when the stocks in the fund are sold. ETFs are relatively new financial products that are sold through the brokerage industry. You pay an annual expense, as you would with any mutual fund, but you also pay a brokerage or transaction fee to buy the ETF.
Investment Real EstateOwning investment real estate offers a tax shelter because depreciation, mortgage interest, and other expenses are tax deductible. These deductible expenses offset what would have been taxable profits from just collecting

58
rent and paying expenses. Investment real estate involves a tremendous degree of risk and a lot of work if investing requires hands-on managing of the property yourself. Most people who consider buying single-family homes in the aftermath of the housing collapse might be wise to go lie on a beach until that thought goes away. Unlike apartment buildings, which can generate positive cash flow from month to month, most single-family homes make money for the investor only if the rising value is high enough to offset the negative cash flow.
Part-Time BusinessOperating a part-time business can offer an investment opportunity for after-tax dollars. In return for the after-tax investment, the business itself becomes a tax shelter. Here is an example. One of my friends makes fish sculptures out of driftwood and sells them for a total gross income of about $10,000 per year. As a result, he is allowed a write-off, a deduction from income, for the cost of owning his boat. In addition, a business that is profitable can allow its owners a tax-deductible contribution of the first $17,000 of income directly into a 401(k) plan. This is a so-called “solo 401(k)” designed for small businesses. Small businesses offer a multitude of opportunities to characterize what would be normal activities of daily life as legitimate business expenses.
The Mental Challenge of After-Tax MoneyInvesting after-tax money can be complicated. Before taking some profits and investing in another opportunity, we need to ask, “Will making this change compensate for the tax cost that the sale will trigger?” The expense of paying the tax will be a loss with 100 percent certainty. In many cases, staying the course will be a better option.
Further complicating after-tax investing are the discoveries being made in the field of behavioral finance. This is the area of psychology that studies how people make investment decisions, and the results are discouraging. We are our own worst enemies. In simple terms, the greater the number of choices, the less inclined we are to make a decision. It’s known as “the status

59
quo bias” or more commonly, “analysis paralysis.” Sometimes, however, it’s not so bad if it prevents us from making what would have been a bad investment on an impulse.
Fear of loss is a more powerful emotion than the exhilaration we experience from enjoying investment success. We are far more disappointed if we lose money after making an investment change than would have been the case if we hadn’t done anything and lost money as a result. These psychological factors conspire to make it a challenge to manage money. However, psychological factors come into play to a greater degree with after-tax money because the choices are so vast and the decisions are more complex.
The bottom line with after-tax money is to try to make it comparable (as much as possible) to your retirement plan money. Invest in index funds and other investment products outlined above that offer at least some tax shelter. Then rebalance systematically. Rebalancing introduces a mechanical aspect to investing that takes the emotion out of decision-making. The perils of behavioral finance fall by the wayside. Go for runs batted in (RBIs) rather than home runs. The tax hits, when they come, will be incremental and relatively slight from year to year. Those who are content with making money slowly are guaranteed to succeed over time.
9
60
The End Game
When we get to retirement, how will our retirement plan money pay our bills? What will life look like for us, financially?
In simple terms, this is what will happen:
1. Social Security will pay somewhere between $18,000 and $50,000 per year, graded up by cost-of-living increases. Rest assured, this government program won’t go broke. There is a $2.3 trillion surplus right now, which was created in anticipation of retiring baby boomers.
2. Your 401(k) and other retirement money divided equally between bond and stock mutual funds will provide an annual income equal to 5 percent of your total nest egg. Hopefully, this 5 percent figure (about $12,000 per year on a $240,000 balance or $25,000 per year on a $500,000 balance) will be enough—when combined with Social Security to meet your retirement income needs.
3. Working the system involves rolling all of your retirement money into an individual retirement account (IRA) so that you have complete control of the money without having had to pay any taxes or penalties. Having the money all in one place makes it easier to invest purposefully. Moreover, you can direct the financial institution housing your mutual funds to automatically deposit each month’s income (dividends and interest) directly into your checking account.
As a back-up, many people reaching retirement have equity in their homes as well as other savings and investments to draw on in addition to the funds in their retirement accounts.

61
Half Bonds/Half Stocks—Keeping It SimpleAn ideal mix for a newly retired person is a fifty-fifty combination of stock and bond mutual funds. The stock mutual funds (investing in large, value-oriented companies) will typically pay dividends equal to about 4 percent. A combination of bond mutual funds will pay average interest rates of about 6 percent per year. You can do the math. If half of your money is earning 4 percent per year in stock mutual-fund dividends, that would amount to 2 percent of your total investment. If the other half is earning 6 percent in bond mutual-fund interest, that would be 3 percent of your total investment. The combined annual return, paid in cash, for the two halves added together would be 5 percent.
So, if you have $240,000 in a combination of IRAs, 401(k)s, and other retirement plans, you would be earning an annual 5 percent or $12,000 per year in interest and dividends without touching any portion of your principal (otherwise known as your “nest egg”). The basic $240,000 nest egg remains untouched, and all you are spending is the $1,000 per month of the $12,000 annual income. What you are really preserving—critical in the early retirement years—is your golden goose.
Let’s Be PracticalUsing the system successfully involves rolling all of your retirement money into an Individual Retirement Account (IRA) so that you have complete control of the money without having to pay any taxes or penalties. Having the money all in one place makes it easier to invest purposefully. Moreover, you can direct the financial institution housing your mutual funds to automatically deposit each month’s income (dividends and interest) directly into your checking account. Money just automatically flows into the account to supplement Social Security deposits that the government will be wiring into your account.
When to Tap the Nest EggIf you need additional money, you can always pick up the phone and ask the financial institution to wire an additional lump sum into your account.
62
This amounts to plucking a few tail feathers off the goose—not that there’s anything wrong with that. A new car, a new roof, or a vacation trip while everyone’s still healthy can be valid reasons for accessing the principal.
In many cases, the stock mutual-fund portion of the principal may have increased substantially in favorable markets. Remember, stocks in general tend to increase in value by about 10 percent per year. Not every year, certainly, but over time we can expect this to happen. Taking a few chips off the table after a string of good years is not unreasonable.
The greatest mistake a retiree can make is to spend too much of their retirement money in the early years of retirement. Spending money at the time the market itself might also be plummeting amounts to a perfect storm of financial devastation. This is why many so-called “glide path” programs that are set to have you run out of money at age ninety have proven to be such a disaster in the few short years since they have been “invented.” The same would be true of financial advisors that tell retiree clients what the latter want to hear—namely, that future investment results will more than compensate for any invasion of the nest egg.
A Real-Life Look at Retirement Income Sources
Joe Smith worked for forty-five years, and at the end of his career, he was earning $60,000. His wife, Linda, had worked early in their marriage and then stopped working to raise their children. When the kids were grown, she rejoined the work-force and accumulated additional Social Security credits. Between the two spouses, Social Security benefits totaled $35,000 per year or almost $3,000 per month by the time they both retired at age sixty-six.
Combined 401(k) and other retirement plan assets totaled $500,000. Over the years, they had saved about 6 percent of their annual income on average—the last thirty years in 401(k) contributions. A higher balance would have been nice, but college education expenses took priority over effective retirement investing. By the time college costs had been covered, it was too late for the “magic of compound interest” to be of much help with such a short time left until retirement.

63
However, with both spouses working, substantial 401(k) contributions (maximum $23,000 by each) helped to create a last-minute boost of account balances. Because there was no percentage-of-income limitation, Linda was able to deposit over half of her $40,000 salary into her company’s 401(k) plan. (If she had made only $23,000 working part-time, the entire amount could have been contributed into a retirement plan.) Fortunately, their house was now paid for, so that major expense was no longer a factor. With a combined income of $100,000, Joe and Linda’s combined $46,000 contribution cost them only $30,000 in take-home pay. Why? Because about $16,000 consisted of money that the couple would have otherwise owed in additional taxes on their last $46,000 of family income without the 401(k) tax shelter.
Below is what retirement looked like for the Smiths. Their investment mix included the following funds:
Stock Fund—50 percent
• Value index fund. Average dividend paid over the years was approximately 4 percent.
Bond Funds—50 percent split equally
• Short-term investment grade fund. Average interest in recent years was 4.5 percent.
• GNMA fund. Average interest in recent years was 5.5 percent.• High-yield corporate bond. Average interest in recent years was 7.5
percent.
Average for the three bond funds, in round numbers, is 6 percent per year.
$250,000 in the stock fund yielded about $10,000 per year.
$250,000 in bond funds yielded about $15,000 per year.
This $25,000 total, deposited automatically into the Smiths’ checking account and combined with the $35,000 from Social Security, creates a total income of $60,000. This is the same $60,000 that Joe had earned in his last years of work. But wait. There are no social security or Medicare taxes
64
charged to retirement income. This saves Joe and Linda about $6,000 that they used to pay on Joe’s $60,000 of job income.
In take-home pay, this couple is very close to where they were before Linda went back to work. A possible rise in value of the stock portion of their retirement plan and the cost-of-living increases in Social Security help to protect them from inflation. Moreover, they may decide to downsize after rattling around in a house that once sheltered a family of four plus pets, but that decision can come much later in retirement. In the meantime, the house offers yet another buffer against inflation.
Protecting against inflation is critical for the retiree, because the cost of health care will continue to rise faster than Medicare and social security can keep up. In a perfect world, we all want to have the resources to live out our lives in nice surroundings with plenty of care. Getting to that stage with enough resources is the ultimate goal of retirement planning.
Why is the End Game Important to Think about Now?
Understanding the End Game helps you to zero in on what needs to be accomplished between now and your retirement. Excluding the payments you receive from Social Security, each $1,000 a month of retirement income will require about $250,000 in retirement assets. $1 million safely generates about $4,000 a month of income.
While these numbers may seem overwhelming, you may be in better shape than your think. The real magic of compound interest starts to take place toward the end of the period of retirement investing. Take, for instance, the money you have in retirement accounts today, and double the amount every seven years into the future until you reach age 66 or thereabouts. For instance, if you have $50,000 in retirement accounts today and you’re 50 years old, that $50,000 should double twice to $200,000 by the time you reach age 65. Remember: money earning 10 percent per year doubles every 7.2 years.
Then, you have new, inbound contributions. If you’re 50 years old today, a $500 per month contribution for the next 15 years will grow to $250,000 by the time you reach age 65 at a 10 percent earnings rate. $1,000 per

65
month will grow to $500,000. A total of $2,000 per month (as a result of, say, two spouses each contributing to their retirement plan) should grow to $1 million in just 15 years.
Add this “New Money” formed by future contributions to your “Old Money,” which doubles every seven years. The sum of the parts should be a pleasant surprise — and remarkably easy to achieve.
What it’s all about…
In a perfect world, we want to have the resources to enjoy our lives in nice surroundings with independence and care when we need it. Getting to that stage with enough money is the ultimate goal of retirement planning. Planning the work is one thing. Working the plan comes from applying the tools in this booklet and gaining the satisfaction that comes with self-discipline. This “Roadmap to Riches” has shown you how to get there. Go ahead. Fasten your seat belt, hit the ignition, and step on the gas.

Suggested Reading
Common Sense on Mutual Funds
By John Bogle (founder of Vanguard Funds)
A Random Walk Down Wall Street: The Time-Tested Strategy for Successful Investing
By Burton G. Malkiel
Debunkery: Learn It, Do It, and Profit from It - Seeing Through Wall Street’s Money-Killing Myths
By Ken Fisher
Where Are the Customers’ Yachts? A Good Hard Look at Wall Street
By Fred Schwed, Jr.
Do You Want to Make Money or Would You Rather Fool Around?
By John D. Spooner
Your Money & Your Brain: How the New Science of Neuroeconomics Can Help Make You Rich
By Jason Zweig
Spending Your 401(k) - How to Have a Life and Not Outlive Your Resources
By Stephen J. Butler

Stephen J. Butler is the CEO of Pension Dynamics Corporation, a nationally known retirement plan authority and author of 401(k) Today. He has testified at the U.S. Department of Labor and the U.S. Congress on behalf of 401(k) participants and has appeared on NBC Nightly News. His weekly financial column in Bay Area newspapers for over 16 years has helped many readers reach their retirement goals.
2300 Contra Costa Blvd. Suite 400, Pleasant Hill, CA 94523925 956 0505 | www.pensiondynamics.com
Securities offered through Pension Dynamics Securities Corporation, member FINRA.
PENSION DYNAMICSC O R P O R A T I O N