ROAD VERSUS SHORT SEA SHIPPING: COMPARING EMISSIONS AND EXTERNAL … · 9/01/2012 ROAD vs. SSS 1...
32
9/01/2012 ROAD vs. SSS 1 ROAD VERSUS SHORT SEA SHIPPING: COMPARING EMISSIONS AND EXTERNAL COSTS Kris Vanherle Eef Delhaye
Transcript of ROAD VERSUS SHORT SEA SHIPPING: COMPARING EMISSIONS AND EXTERNAL … · 9/01/2012 ROAD vs. SSS 1...

9/01/2012 ROAD vs. SSS 1
ROAD VERSUS SHORT SEA SHIPPING:
COMPARING EMISSIONS AND EXTERNAL COSTS
Kris Vanherle
Eef Delhaye

9/01/2012 ROAD vs. SSS 2
Outline
• Introduction
• Methodology
• Results
• Conclusions

9/01/2012 ROAD vs. SSS 3
Introduction
• Objective: “fair comparison”:
– Same origin-destination
– Real world freight flows
– Taking into account every segment of the route
• Ferry’s
• Feeder transport

9/01/2012 ROAD vs. SSS 4
Sweden
Turkey
Ireland

9/01/2012 ROAD vs. SSS 5
Introduction
• Objective: “fair comparison”:
– Same origin-destination
– Real world freight flows
– Taking into account every segment of the route
– considering real world transport equipment deployed

9/01/2012 ROAD vs. SSS 6
Introduction Lloydsnr. 9355460
YOB 2006
vesseltype Container ship
length 139.6 m
GRT 8.246 ton
DWT 11.159 ton
installed main engine power 8400 kW
main engine type 4 stroke
installed auxiliar engine power 2x 437 kW
auxiliar engine type 4 stroke
Lloydsnr. 9259501
YOB 2004
vesseltype roro
length 199.8 m
GRT 32.289 ton
DWT -
installed main engine power 20.070 kW
main engine type 2 stroke
installed auxiliar engine power 7.330 kW
auxiliar engine type 4 stroke
Lloydsnr. 9155107
YOB 1997
vesseltype Container
length 195.7 m
GRT 29.115 ton
DWT 40.010 ton
installed main engine power 23.920 kW
main engine type 2 stroke
installed auxiliar engine power 4.140 kW
auxiliar engine type 4 stroke

9/01/2012 ROAD vs. SSS 7
Introduction
• Objective: “fair comparison”: – Same origin-destination – Real world freight flows – Taking into account every segment of
the route – Considering real world transport
equipment deployed – Real world load factors
• Emission calculation: – Totals for whole route – Per tkm (crow’s flight)
9/01/2012 ROAD vs. SSS 8
Outline
• Introduction
• Methodology
• Results
• Conclusions

9/01/2012 ROAD vs. SSS 9
Methodology
• Input & assumptions:
–Only direct emissions considered
– Input data supplied by race participants
• ROAD: distances & speeds,
fuel consumption, …
• SSS: sailing times, engine load,
fuel consumption, …

9/01/2012 ROAD vs. SSS 10
Methodology
• Calculation ROAD:
– TREMOVE – COPERT IV methodology
• Truck type
• Emission abatement technology (EURO standards)
• Load factor
• Road gradient
• Speed
– Calculation with model approach + correction to fit with reported fuel consumption figures (10-18% deviation)

9/01/2012 ROAD vs. SSS 11
Methodology
• Calculation SSS:
– EMMOSS formula’s: 1. Energy consumption (kWh) = time (h)
X installed engine power (kW) X engine load (%)
2. Fuel consumption (kg) = energy consumption (kWh) X energy density (kg/kWh) X yield
3. Emissions (kg) = fuel consumption (kg) X emission factor (kg/kg) X correction factor
9/01/2012 ROAD vs. SSS 12
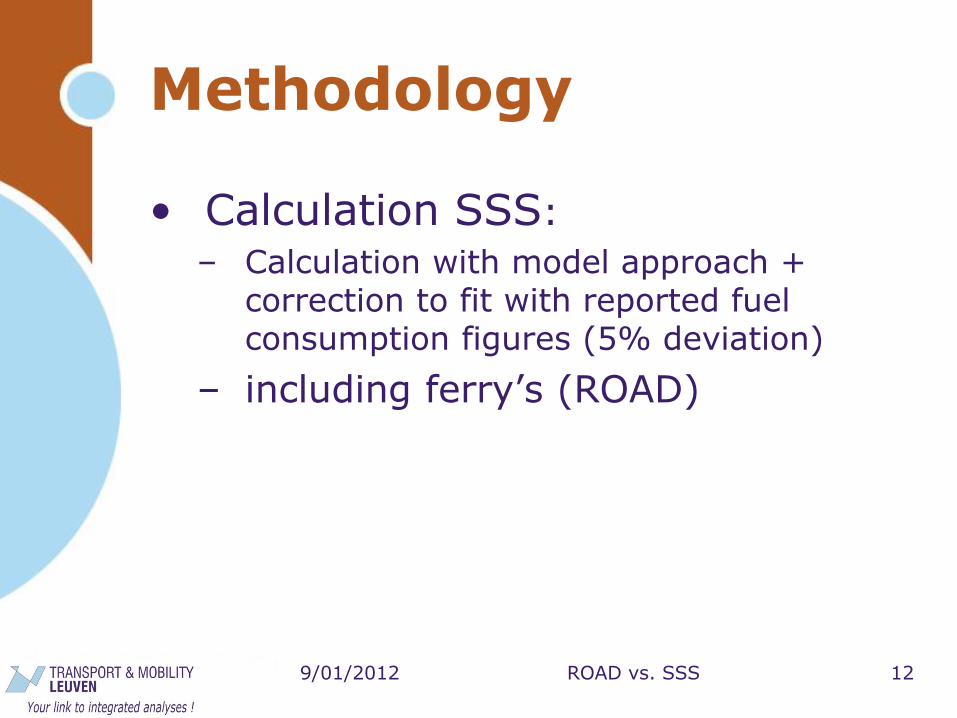
Methodology
• Calculation SSS:
– Calculation with model approach + correction to fit with reported fuel consumption figures (5% deviation)
– including ferry’s (ROAD)

9/01/2012 ROAD vs. SSS 13
Methodology
• External costs SSS:
– Only emissions
– Monetary value attributed to emissions
– Taking into account emission dispersion
• External costs ROAD:
– Emissions: same approach as SSS
– Other cost components (congestion, accidents, noise, infrastructure): indicator values from literature

9/01/2012 ROAD vs. SSS 14
Outline
• Introduction
• Methodology
• Results
• Conclusions
9/01/2012 ROAD vs. SSS 15
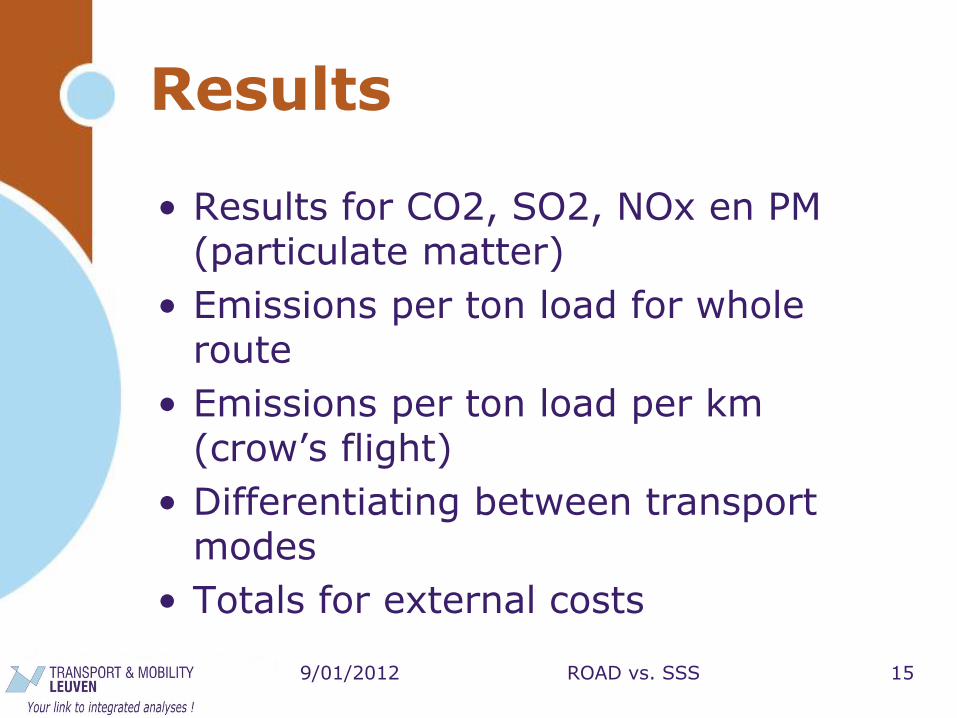
Results
• Results for CO2, SO2, NOx en PM (particulate matter)
• Emissions per ton load for whole route
• Emissions per ton load per km (crow’s flight)
• Differentiating between transport modes
• Totals for external costs

9/01/2012 ROAD vs. SSS 16
Results: CO2 CO2-emissions
0
20
40
60
80
100
120
140
IE-ROAD IE-SSS ZW-
ROAD
ZW-SSS TR-
ROAD
TR-SSS
kg/ton cargo
SSS-ship SSS-truck ROAD-truck ROAD-ship
CO2-emissions per km
0
20
40
60
80
IE-ROAD IE-SSS ZW-
ROAD
ZW-SSS TR-
ROAD
TR-SSS
kg/ton
cargo/1000km
SSS-ship SSS-truck ROAD-truck ROAD-ship

9/01/2012 ROAD vs. SSS 17
Results: CO2
• SSS performce better than road
• SSS: economies of scale –Distance
–Vessel size
• SSS: roro less efficient compared to lolo and container
• ROAD: similar results for 3 routes

9/01/2012 ROAD vs. SSS 18
Results: NOx NOx-emissions
0
0.2
0.4
0.6
0.8
1
1.2
1.4
IE-ROAD IE-SSS ZW-
ROAD
ZW-SSS TR-
ROAD
TR-SSS
kg/ton cargo
SSS-ship SSS-truck ROAD-truck ROAD-ship
NOx-emissions per km
0
200
400
600
800
1000
IE-ROAD IE-SSS ZW-
ROAD
ZW-SSS TR-
ROAD
TR-SSS
g/ton
cargo/1000km
SSS-ship SSS-truck ROAD-truck ROAD-ship

9/01/2012 ROAD vs. SSS 19
Results: NOx
• ROAD performs better than SSS
• Environmental regulation
–ROAD: EURO-standards
–SSS: MARPOL Annex VI
• Nuance: EURO V factor 2.5
better than current fleet average

9/01/2012 ROAD vs. SSS 20
Results: SO2 SO2-emissions
0
100
200
300
400
500
600
700
800
IE-ROAD IE-SSS ZW-
ROAD
ZW-SSS TR-
ROAD
TR-SSS
g/ton cargo
SSS-ship SSS-truck ROAD-truck ROAD-ship
SO2-emissions per km
0
100
200
300
400
IE-ROAD IE-SSS ZW-
ROAD
ZW-SSS TR-
ROAD
TR-SSS
g/ton
cargo/1000km
SSS-ship SSS-truck ROAD-truck ROAD-ship

9/01/2012 ROAD vs. SSS 21
Results: SO2
• ROAD perfoms much better than SSS
• Environmental regulation
–ROAD: 10 ppm S (0.001%)
–SSS: SECA: 1.5%;
other: +/- 2.7%
in SECA’s: difference of
factor 1500

9/01/2012 ROAD vs. SSS 22
Results: PM PM-emissions
0
20
40
60
80
100
120
IE-ROAD IE-SSS ZW-
ROAD
ZW-SSS TR-
ROAD
TR-SSS
g/ton cargo
SSS-ship SSS-truck ROAD-truck ROAD-ship
PM-emissions per km
0
10
20
30
40
50
60
IE-ROAD IE-SSS ZW-
ROAD
ZW-SSS TR-
ROAD
TR-SSS
g/ton
cargo/1000km
SSS-ship SSS-truck ROAD-truck ROAD-ship

9/01/2012 ROAD vs. SSS 23
Results: PM
• ROAD perfoms better than SSS
• Consequence of high S-content of maritime fuels
• High emissions for Turkey SSS-route due to use of heavy fuel
• Nuance: EURO V factor 3.5
better compared to current fleet average

9/01/2012 ROAD vs. SSS 24
Results: External costs

9/01/2012 ROAD vs. SSS 25
Results: External costs
• SSS performs better than ROAD, except for Sweden route
• Non-emission external costs are more important for ROAD
• Non-greenhouse gas emissions are more important than greenhouse gas emissions in terms of external costs

9/01/2012 ROAD vs. SSS 26
Outline
• Introduction
• Methodology
• Results
• Conclusions

9/01/2012 ROAD vs. SSS 27
Conclusions
9/01/2012 ROAD vs. SSS 28
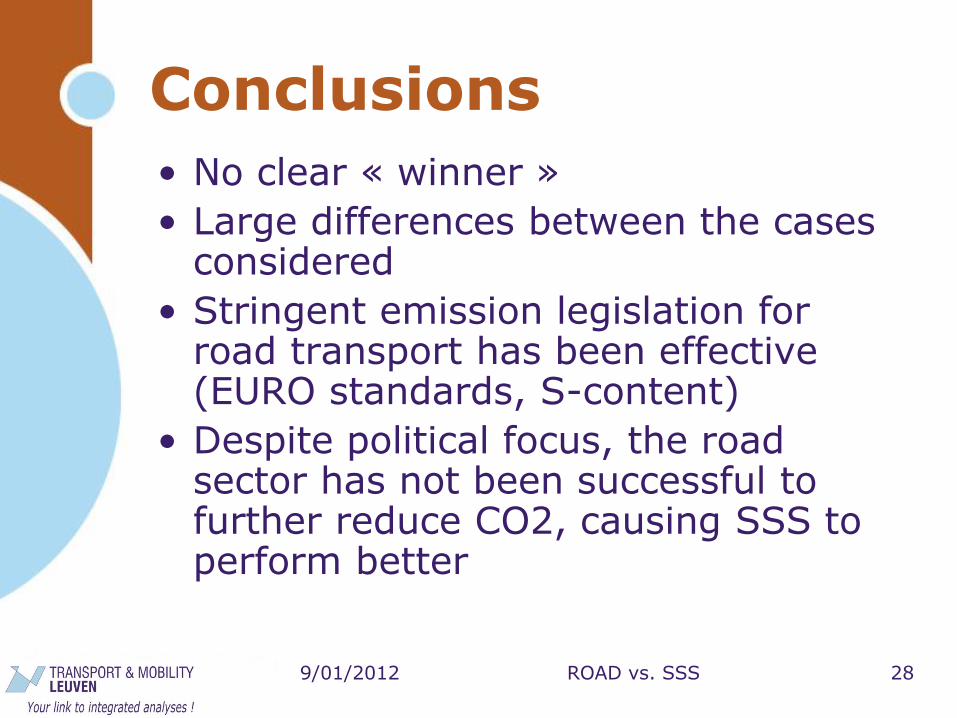
Conclusions
• No clear « winner »
• Large differences between the cases considered
• Stringent emission legislation for road transport has been effective (EURO standards, S-content)
• Despite political focus, the road sector has not been successful to further reduce CO2, causing SSS to perform better

9/01/2012 ROAD vs. SSS 29
Conclusions
• Environmental legislation SSS:
– Low ambition in the past
–Future: proposal IMO dd 04/2008
• Proposal IMO dd 04/2008:
–S-content:
• SECA: 1.5% 0.1% (in 2015)
• Rest: +/- 2.7% 0.5% (in 2020)
–NOx: reduction in 3 steps; reductions up to 80%

9/01/2012 ROAD vs. SSS 30
Conclusions
• SSS is catching up, but for some pollutants, a large gap remains
• Potential for further reduction of transport emissions lies with SSS:
–Engine technologies
–Exhaust gas treatment technologies
–Shore side electricity
–New fuels and propulsion technologies

9/01/2012 ROAD vs. SSS 31

9/01/2012 ROAD vs. SSS 32
Thank you
Transport & Mobility Leuven
+32 16 31 77 38