Road Use Statistics, Great Britain 2016 - gov.uk Use Statistics ... ` Car use per person has fallen...
41
This publication provides an overview of statistics on roads and how they are used. It brings together information previously released by the Department for Transport on vehicles, travel, and traffic. Feedback This is a new publication and we would welcome any feeback to: [email protected] Road Use Statistics Great Britain 2016 RESPONSIBLE STATISTICIANS: Nicola George - Kathryn Kershaw FURTHER INFORMATION: Media: 020 7944 3066 Public: 020 7944 3095 Statistical Release 7 April 2016
Transcript of Road Use Statistics, Great Britain 2016 - gov.uk Use Statistics ... ` Car use per person has fallen...

This publication provides an overview of statistics on roads and how they are used. It brings together information previously released by the Department for Transport on vehicles, travel, and traffic.
FeedbackThis is a new publication and we would welcome any feeback to: [email protected]
Road Use Statistics Great Britain 2016
RESPONSIBLE STATISTICIANS: Nicola George - Kathryn Kershaw
FURTHER INFORMATION: Media: 020 7944 3066 Public: 020 7944 3095
Statistical Release 7 April 2016

Road Use Statistics: Page 2
SummarySection 1: Roads are vital for moving people and goods around the UK page 4
Section 2: Over the long term, road use and licensed vehicles have grown dramatically
Section 3: The most common means of travel is by car for all age, gender, and income groups
page 9
page 17
` Most people’s journeys are made by road and the majority of these are by car or van.
` Roads are vital to the economy, with almost three times more goods moved by roads than by water and rail combined.
` The Strategic Road Network (SRN) accounts for only 2.4% of the road network length but carries a disproportionately large amount of traffic, with HGVs in particular depending on the SRN.
` Road use has grown dramatically since the 1950s, this has been driven by individuals travelling further on average.
` Over the last two decades the rate of car traffic growth has slowed. For an average person, car use fell throughout the 2000s, but this was partially offset by an increase in population using the roads.
` Recent trends show a resumption of traffic growth after the recession. Growth has been strongest on the SRN and for van traffic across all roads.
` Men drive further than women on average, but the distance driven by women is growing, reflecting an increase in licence holding by older women.
` Car use per person has fallen amongst young men, mostly due to a drop in the number of 17-20 year old males gaining a driving licence.
` People in the highest household income group travel more than twice as far by car as people in the lowest income group.
2014
89%All road travel
Other travel
1950 2014
7x more traffic
1995/97 2014
20% increase in distance
driven
Road Use Statistics: Page 3
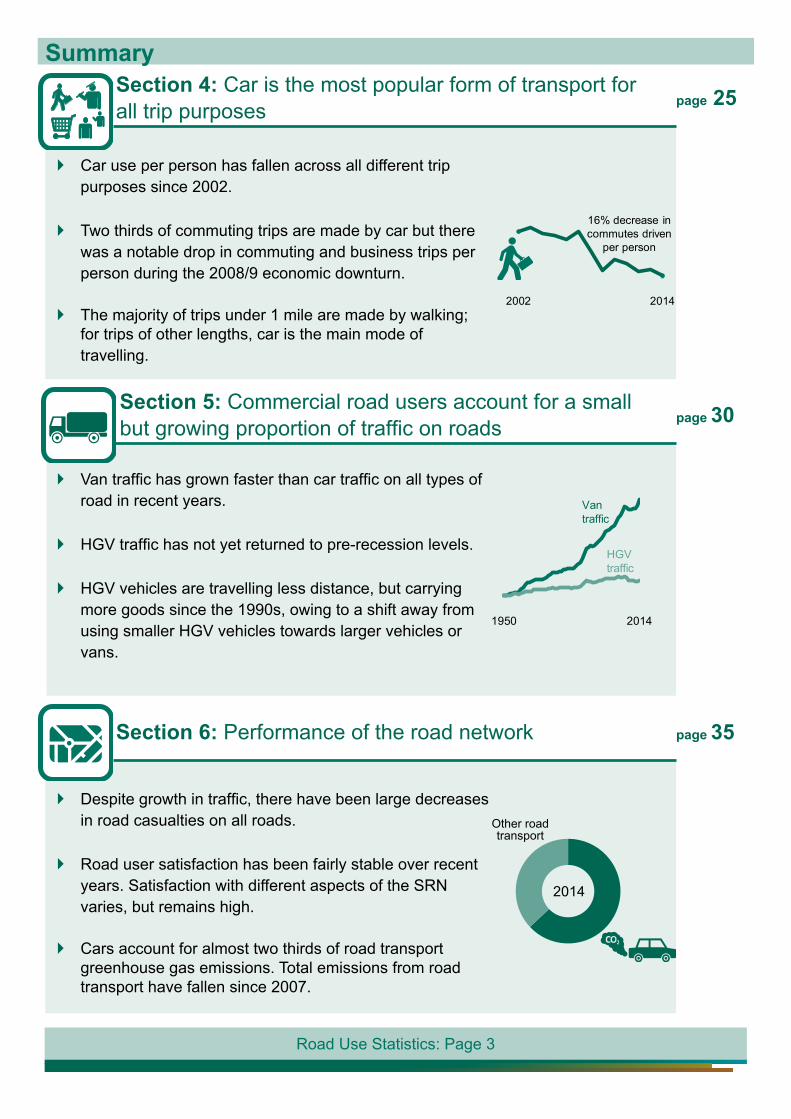
SummarySection 4: Car is the most popular form of transport for all trip purposes page 25
Section 5: Commercial road users account for a small but growing proportion of traffic on roads
Section 6: Performance of the road network
page 30
page 35
` Car use per person has fallen across all different trip purposes since 2002.
` Two thirds of commuting trips are made by car but there was a notable drop in commuting and business trips per person during the 2008/9 economic downturn.
` The majority of trips under 1 mile are made by walking; for trips of other lengths, car is the main mode of travelling.
` Van traffic has grown faster than car traffic on all types of road in recent years.
` HGV traffic has not yet returned to pre-recession levels.
` HGV vehicles are travelling less distance, but carrying more goods since the 1990s, owing to a shift away from using smaller HGV vehicles towards larger vehicles or vans.
` Despite growth in traffic, there have been large decreases in road casualties on all roads.
` Road user satisfaction has been fairly stable over recent years. Satisfaction with different aspects of the SRN varies, but remains high.
` Cars account for almost two thirds of road transport greenhouse gas emissions. Total emissions from road transport have fallen since 2007.
2002 2014
16% decrease in commutes driven
per person
1950 2014
Van traffic
HGV traffic
2014
Other road transport

Road Use Statistics: Page 4
Section 1: An introduction to roadsThis chapter looks at roads in the context of other forms of transport and provides an overview of roads and traffic.
Sources in this chapter
Transport Statistics Great BritainNational Travel SurveyRoad Freight StatisticsRoad Lengths in Great BritainRoad Traffic Statistics
Roads are vital for people’s journeys
Most people’s journeys are made by road and the majority of these are by car or van. This was not always the case, in the 1950s a larger proportion of journeys were made by bus or coach compared to car or van.
Road freight contributes £11bn to the UK economy
Road is the main method of transporting freight across Great Britain, with almost three times more goods moved by road than by water and rail combined.
Traffic is not evenly split by road type or vehicle type
Motorways and ‘A’ roads, whilst making up a relatively small proportion of the total road length in Great Britain, account for a disproportionately large amount of the overall traffic.

Road Use Statistics: Page 5
Section 1: An introduction to roads
201483%
5%
Billion passenger kilometres travelled by mode of transport, TSGB0101
Most people’s journeys are made by road
In 2014, 90% of passenger journeys were by road. This is a similar proportion to 1952, when records began. However, the distance travelled and the vehicles used have changed considerably over the last 60 years. Distance travelled by car or vans has increased by over 1000%.
Roads are vital for moving people and goods around the UK.
195227%
42%
Car is the main mode of travel for most people
of households have access to a car, with 32% having two or more.
of people held a driving licence (adults aged 17 and above); 80% of men, and 67% of women.
Cars, vans & taxis
Buses & coachesOther* *Other includes motorcyles and pedal cycles (which accounted for
14% of traffic in 1952, and 1% in 2014), rail, and air travel.
Proportion of all passenger distance travelled
0
200
400
600
800
1952 1959 1966 1973 1980 1987 1993 2000 2007 2014
UK AirRail
Other RoadCars, vans & taxisBuses & coaches
73%
76%
of all personal trips - which include commuting, shopping, education and leisure travel - were made by car, as a driver or passenger.
64%
of distance travelled per person per year for personal trips was by car.
78%of people in England travelled by private car (as a driver or passenger) at least once or twice a week.84%
In 2014:

Road Use Statistics: Page 6
Section 1: An introduction to roads
Roads also account for over two-thirds of domestic freight carriedBillion tonne kilometres, UK
0
50
100
150
200
250
300
1953 1963 1973 1983 1993 2003 2013
Water
Rail
Road
15%
73%
12%
2007 economic downturn
Percentage of all freight carried in 2014
Road freight contributes £11bn to the UK economy
... there were 36,552 road freight enterprises ...
15% increase on previous year
6% increase on previous year
... with sector level employment of 222,000
individuals ...
... contributing £11.2 billion to the UK economy.
16% increase on previous year
In 2014 within the UK road freight sector...
...151 billion tonne kilometres of freight were transported ...
2% decrease on previous year
Detailed statistics ...on freight transport by mode can be found in chapter 4 of Transport Statistics Great Britain 2015.

Road Use Statistics: Page 7
Section 1: An introduction to roads
The Strategic Road Network (SRN) is made up of the motorways and major trunk ‘A’ roads in England that are managed by Highways England (HE). Accounting for only 2.4% of the road network in length, it carries a disproportionally large and consistently increasing amount of traffic.
Useful LinksStrategic Road Network Statistics DfT report ‘Use of the Strategic Road Network’
Highways England homepage
The Strategic Road Network
4,400 miles Of SRN road in 2014, 2.4% of the English network
33% Of traffic in England was on the SRN in 2014 (87 billion vehicle miles)
9% Of reported road casualties were on the SRN in 2014 (see here)
29 to 60% Increase in traffic on the SRN forecast to 2040 (see here)
© Crown Copyright and database rights 2014. Ordnance Survey Licence Number 100039241 Department for Transport gisu1112j178
Map of the Strategic Road Network in England
A38
A303
A21
A12
A1
M4
M40
M56
M61
A1
A595
M42
A3
A34
A14
A14
M1
M6
M6
A50
A19
A30 A35
M5
A419
M4
M27
M3
A23 A259
M20
M2
A27
A14
A1(M)
M11
M25
A47
A11
A5M50
A40
M54
A49
M40
A38
M60
M62
A46
M1
M180
A180
M18
A69
A66
A64
M6
A1(M)

Road Use Statistics: Page 8
Section 1: An introduction to roads
2.8
2.8
16.0
44.9
244.4
310.9All
Billion vehicle miles travelled, Great Britain, 2014, TRA0101
Minor roads account for the most road length, but major roads carry disproportionately more traffic
Road Definitions:Rural and UrbanDfT defines ‘urban’ roads to be those within a settlement of 10,000 people or more, following the 2001 Communities and Local Government definition of urban settlements. All other roads are defined as ‘rural’.
Minor and MajorMajor roads include motorways and ‘A’ roads. Minor roads comprise ‘B’, ‘C’ and unclassified roads.
Motorway
Urban ‘A’ Roads
Rural ‘A’ Roads
Urban Minor Roads
Rural Minor Roads
1%
3%
9%
33%
54%
21%
16%
29%
21%
14%
245,800 miles of road
length
311billion vehicle miles
of traffic
In 2014, major roads combined (the Strategic Road Network and ‘A’ roads managed by local authorities) accounted for 13% of road length and carried 65% of total road traffic in Great Britain. Minor roads made up 87% of road length but carried 35% of traffic.
Cars account for the majority of traffic on all types of road
In 2014, cars accounted for 79% of all motor vehicle traffic. They were followed by vans and then HGVs, with 14% and 5% of all motor vehicle traffic, respectively.
VehicleDefinitions
Light Goods Vehicle (LGV; a.k.a. van) Goods vehicles not exceeding 3.5 tonnes gross vehicle weight
Heavy Goods Vehicle (HGV; a.k.a. lorry) Includes all goods vehicles over 3.5 tonnes gross vehicle weight
5%
79%
14%
1%
1%
Percentage of all traffic in 2014

Road Use Statistics: Page 9
Section 2: Trends in Road UseThis chapter gives overall trends on roads, including traffic patterns over the long term and in recent years.
These trends are driven by changes in both personal and commercial travel, which are covered in more detail in sections 3 to 5.
Sources in this chapterRoad Traffic StatisticsVehicle Licensing StatisticsRoad network size and condition statisticsNational Travel Survey
Since the 1950s
Over the long term, road use has grown dramatically, dominated by growth in car traffic. This growth reflects increasing household car availability, enabling people to make longer trips, leading to an increase in the distance travelled by individuals on average.
Since the 2000s
The rate of traffic growth slowed over the last two decades, and levels fell for three consecutive years after the 2008/09 economic downturn. At the individual level, car use fell in the 2000s, although this was partially offset by increases in population and households.
Recent years
Recent trends show a resumption of traffic growth as GDP recovers, and provisional statistics suggest that car traffic has returned to pre-recession levels. Traffic on the Strategic Road Network has had the largest growth, and van traffic on all roads has also grown strongly.

Road Use Statistics: Page 10
Section 2: Trends in Road UseOver the long term, road use and licensed vehicles have grown dramatically, but over the past decade growth has slowed.
Traffic and licensed vehicles have seen long term growth
The number of vehicles licensed and the amount of traffic has grown to seven times the amount in 1950, while road length has increased by just under a third.
Growth in car traffic dominated traffic trends in the long term
0
50
100
150
200
250
300
350
1949 1954 1959 1964 1969 1974 1979 1984 1989 1994 1999 2004 2009 2014
Cars andTaxi
Othermotor vehicles
1980s: 50% growth
1990s: 14% growth
2000s: 6% growth
0
200
400
600
800
1000
1950 1958 1966 1974 1982 1990 1998 2006 2014
Traffic (vehicle miles travelled)
Vehicles licensed
Road length
Index (1951 = 100), Great Britain
311 billion
35.6 million
245,800 miles
In 2014
Billion vehicle miles, Great Britain, TRA0101Cars accounted for 79% of all vehicle miles travelled in 2014, compared to 44% in 1949.
37 billion
vehicle miles travelled
vehicles licensed
of road
4.2 million
184,800 miles
In 1951

Road Use Statistics: Page 11
Section 2: Trends in Road Use
1951
1%
86%
13%
Increases in the average distance travelled per person per year occurred in the three decades 1970 to 2000, for personal travel. This was largely due to increases in average trip lengths since the 1970s, which rose over 50% to 7 miles in 2014. However, since the early 2000s average distance and trip length have levelled off.
Trips, distance & time spent travelling (all modes), England, Index: 1972/73 = 100 NTS0101
Compared to the 1970s we are travelling much further on average
Car ownership increases are a key factor in long term traffic trends
Distance
Trips
Time
6,488 miles
921
361 hours
Household car availability, England, NTS0205
The long term trend of growth in traffic has mainly been a result of growth in car ownership. Strong growth in household access to a car between the 1950s and 1970s was followed by growth in households with two or more cars in recent decades.
201424%
43%
32%
20
40
60
80
100
1951 1971 1992/94 2005 2009 20130
80
100
120
140
160
1972/73 1992/94 1997/99 2003 2008 2013
There still appears to be some scope for further growth in ownership; according to the National Travel Survey 2014, 48% of those in the lowest income quintile households are without access to a car.
no car
two or more cars
one car

Road Use Statistics: Page 12
Section 2: Trends in Road Use
Year-on-year growth in motor vehicle traffic in Great Britain, TRA0101
-4
-2
0
2
4
6
8
10
12
14
16
18
1950 1955 1960 1965 1970 1975 1980 1985 1990 1995 2000 2005 2010
High growth in car ownership
Suez crisis
OPEC oil embargo
Strong economic growth
Early 1990s
recession
Fuel protests
Fuel price spike and recent economic
downturn
The rate of traffic growth has slowed over the last two decades
For an average person, car use fell in the 2000s...
Index 2002 = 100
At the individual level, the average distance driven per person has fallen over the last decade or so (though there are different trends for different groups, as shown in section 3). Despite this, overall car traffic levels were broadly stable over the same period, in part due to increasing population.
Percentage change since 2002
9%
0.2%
8%
11%
England Population
Car traffic
Car traffic per capita
Average personal car/
van driver distance
Fluctuations in road traffic levels tend to coincide with events such as changes in the economy (including GDP) and peoples’ disposable incomes, which influence car ownership and the trip behaviour of car owners. In the 2000s, motor vehicle traffic grew by 6%, compared to a 50% increase over the 1980s. Motor vehicle traffic had a pre-recession peak of 314.1 billion vehicle miles in 2007 after which it fell for three consecutive years; the first consecutive falls since traffic records began. Recent trends show a resumption of traffic growth after the recession.
85
90
95
100
105
110
115
2002 2004 2006 2008 2010 2012 2014

Road Use Statistics: Page 13
Section 2: Trends in Road UseRecent trends show resumption of traffic growth after recession
In 2014, car traffic had the largest annual increase since the early 2000s. Provisional 2015 estimates suggest that this trend is continuing. The upward trend in traffic levels is likely to reflect growth in the UK economy (although GDP has been growing from around 2010, the rate of growth was faster from 2013 to 2015). Lower fuel prices, and hence cheaper travel, may also have contributed to increased traffic.
92
96
100
104
108
2007 2008 2010 2012 2014 2015
Rolling annual totals, GB, Index: 2007Q1= 100) TRA2501 Percentage increase since January 2013
GDP
Car Traffic
All motor vehicle traffic
7%
4%
6%
Although the proportion of households with at least one car has remained stable in recent years, the increases in population and number of households are likely to have contributed to the recent growth in licensed cars on the road and to car traffic. However, it is too early to say whether people are driving further on average at the individual level.
Index 2007 = 100
95
100
105
110
2007 2008 2009 2010 2011 2012 2013 2014
England Households
Number of licensed cars
Number of households with at least one car
Proportion of households with at least one car
The number of cars on the road has also increased

Road Use Statistics: Page 14
Section 2: Trends in Road Use
Van traffic has grown strongly in recent years
80
90
100
110
120
130
140
2000 2003 2006 2009 2012
Annual road traffic on all roads, GB, Index: (2000=100), TRA0106 Compared to 2000
38%
All motor vehicles 7%
4%
9%
The recent growth in motor vehicle traffic is also linked to the large increases observed in van traffic. The number of licensed vans have increased strongly, with likely factors affecting this including the changes to taxation rules which may have made them a more attractive option for some people, and the increase in internet shopping and home deliveries.
The Strategic Road Network shows the largest traffic growth
90
95
100
105
110
115
120
2000 2002 2004 2006 2008 2010 2012 2014
Trend in all vehicles traffic by road management, England, Index: (2000=100) TRA4201
HE managed ‘A’ roads14%
HE managed motorways
All roads
LA managed minor roads
LA managed ‘A’ roads
16%
7%
4%
1%
Compared to 2000
Traffic on Highways England managed roads recovered more quickly after the recession, increasing 1.7% between 2013 and 2014. Traffic fell more on local authority (LA) managed roads during the recession and has not yet returned to pre-recession levels.

Road Use Statistics: Page 15
Section 2: Trends in Road Use
85
90
95
100
105
110
115
2000 2002 2004 2006 2008 2010 2012 2014
South WestEast MidlandsEast of EnglandYorkshire and the Humber
South East
West MidlandsNorth West
North East
London
Trend in all vehicles traffic by region, Index: (2000=100) TRA0103
London shows a different trend to other regions in Great Britain
In 2014 traffic increased in all regions of Great Britain compared to 2013. However, levels and trends have varied between the regions.
While traffic in London has increased slightly in the last year, the general trend since the early 2000s has been downwards. This decline in traffic in London reflects growth in surface rail and bus use.
Central London congestion charge
introduced
2 2%
2.3%
2.0%
3.0%
2.2%
2.7%
2.3%
1.9%2.3%
3.1%
1 8%
% change in traffic between 2013 and 2014, by region
Trends in bus use also differ in London
Average number of trips per person per year by public transport modes, England, Index 1995/7 = 100 NTS0303
70
90
110
130
150
170
190
1995/97 2002 2005 2008 2011 2014
Percentage change since 1995/97
71%
29%
20%
Surface rail
Bus in London
Other local bus
Road Use Statistics: Page 16
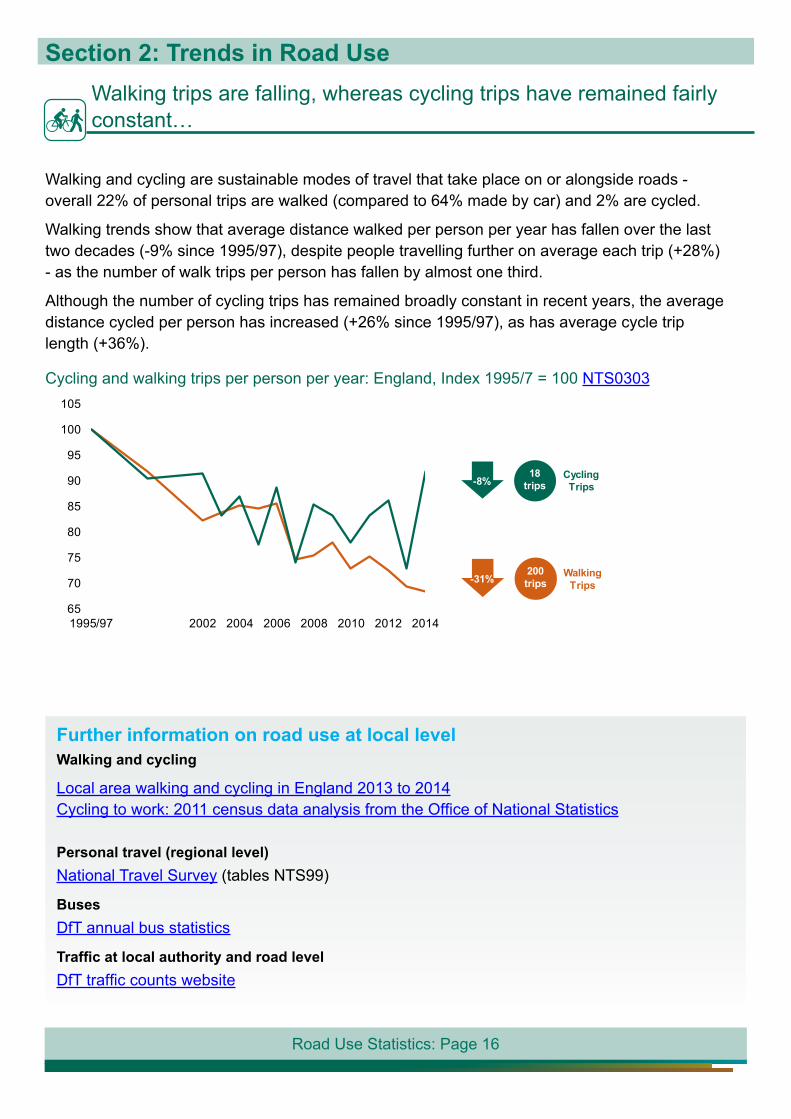
Section 2: Trends in Road UseWalking trips are falling, whereas cycling trips have remained fairly constant…
Cycling and walking trips per person per year: England, Index 1995/7 = 100 NTS0303
Walking and cycling are sustainable modes of travel that take place on or alongside roads - overall 22% of personal trips are walked (compared to 64% made by car) and 2% are cycled.
Walking trends show that average distance walked per person per year has fallen over the last two decades (-9% since 1995/97), despite people travelling further on average each trip (+28%) - as the number of walk trips per person has fallen by almost one third.
Although the number of cycling trips has remained broadly constant in recent years, the average distance cycled per person has increased (+26% since 1995/97), as has average cycle trip length (+36%).
200 trips-31% Walking
Trips
18 trips-8% Cycling
Trips
Further information on road use at local levelWalking and cycling
Local area walking and cycling in England 2013 to 2014 Cycling to work: 2011 census data analysis from the Office of National Statistics
Personal travel (regional level)National Travel Survey (tables NTS99)
BusesDfT annual bus statistics
Traffic at local authority and road levelDfT traffic counts website
65
70
75
80
85
90
95
100
105
1995/97 2002 2004 2006 2008 2010 2012 2014

Road Use Statistics: Page 17
Road use by age and gender
Car travel is the most common means of transport for both men and women from all age groups, including children. However, children make more walking trips than adults.For all age groups, men drive further than women on average.
Recent trends by age and gender
On average over the whole population, individual car mileage has fallen over the last decade. However, as outlined in section 2, this has been offset by increases in population using the roads and so total car traffic levels have shown a different trend over this period.
There are also different trends for different age and gender groups. The distance that women drive is increasing, which in part reflects the increase in the proportion of older women holding driving licences, while the overall reduction in car use is greatest for young men (aged 17-29). There has been a reduction in number of 17 to 20 year olds gaining a driving licence in recent years.
IncomeAlmost half of households in the lowest income quintile have no access to a car, whereas those in the wealthiest households (highest income quintile) travel more than twice as far by car.
Section 3: Who is using the roads?This chapter looks at how road use varies by factors such as age and gender, including trends in car driving over the last decade.
Sources in this chapter
National Travel Survey Driver and Vehicle Standards Agency Vehicle Licensing Statistics

Road Use Statistics: Page 18
Section 3: Who is using the roads?
Most personal trips are made by road
0
200
400
600
800
1,000
1,200
0-16 17-20 21-29 30-39 40-49 50-59 60-69 70+ All ages
0
200
400
600
800
1,000
1,200
0-16 17-20 21-29 30-39 40-49 50-59 60-69 70+ Allages
Average number of trips by gender and age and main mode: England, 2014 , NTS0601Males
Females
Overall 64% of all personal trips are made by car. Car trips account for more than half of all trips for all age groups except 17 to 20 year olds.
Walking accounts for around a third of trips for children and a lower share for adults; overall 22% of trips are made by walking.
17-20 year old women make more trips by bus than any other age group.
On average, men make a higher share of trips as car drivers than women, particularly at older age groups. Women and children (aged 0-16) are more likely to travel as car passengers.
A great majority of personal trips - including to get to work, shops, education or to visit friends - are made by road. In 2014:
National Travel Survey dataThe data for this section comes from the National Travel Survey, which measures personal travel - where the purpose is to reach a destination, rather than to carry goods or passengers. A trip is defined as a one way course of travel having a single main purpose.
Car / van driver or passenger
Other transport
Rail
Buses
Walk / bicycle
Car / van driver or passenger
Other transport
Rail
Buses
Walk / bicycle
The most common means of travel is by car for all age, gender and income groups

Road Use Statistics: Page 19
Section 3: Who is using the roads?
Men drive much further than women on average…
Average car driver distance travelled miles per person per year by age and gender: England, 2014, NTS0605
Males
Females
0
2,000
4,000
6,000
8,000
10,000
0-16 17-20 21-29 30-39 40-49 50-59 60-69 70+ All ages
Average distance travelled (miles per person) by age and mode: England 2014, NTS0605
Distance travelled follows a similar pattern but car travel is even more dominant...
Car / van driver or passenger
Other transport
Rail
Buses
Walk / bicycle
Overall, 78% of distance travelled for personal trips by the average person is by car; on average, most distance is travelled by car for all age groups.
0 1,000 2,000 3,000 4,000 5,000 6,000 7,000 8,000
17-20
21-29
30-39
40-49
50-59
60-69
70+
Road Use Statistics: Page 20
Section 3: Who is using the roads?
… but overall distance driven is growing for women…
75
85
95
105
115
125
135
1995/97 1997/99 1999/01 2002 2004 2006 2008 2010 2012 2014
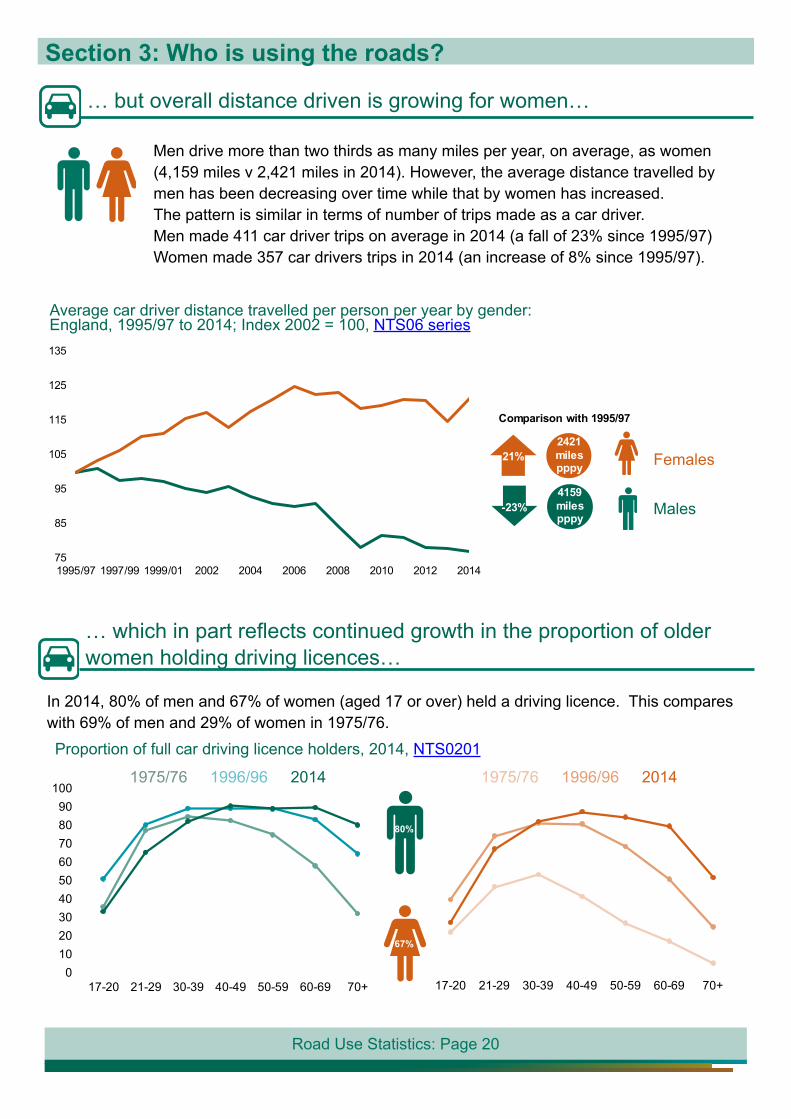
Average car driver distance travelled per person per year by gender: England, 1995/97 to 2014; Index 2002 = 100, NTS06 series
Comparison with 1995/97
-23%4159 miles pppy
21%2421 miles pppy
… which in part reflects continued growth in the proportion of older women holding driving licences…
Proportion of full car driving licence holders, 2014, NTS0201
0102030405060708090
100
17-20 21-29 30-39 40-49 50-59 60-69 70+ 17-20 21-29 30-39 40-49 50-59 60-69 70+
67%
80%
1975/76 1996/96 2014 1975/76 1996/96 2014
Men drive more than two thirds as many miles per year, on average, as women (4,159 miles v 2,421 miles in 2014). However, the average distance travelled by men has been decreasing over time while that by women has increased. The pattern is similar in terms of number of trips made as a car driver. Men made 411 car driver trips on average in 2014 (a fall of 23% since 1995/97)Women made 357 car drivers trips in 2014 (an increase of 8% since 1995/97).
Males
Females
In 2014, 80% of men and 67% of women (aged 17 or over) held a driving licence. This compares with 69% of men and 29% of women in 1975/76.

Road Use Statistics: Page 21
Section 3: Who is using the roads?
55
65
75
85
95
105
115
125
2002 2004 2006 2008 2010 2012 2014 2002 2004 2006 2008 2010 2012 2014
80
90
100
110
120
130
140
2002 2004 2006 2008 2010 2012 2014
80
90
100
110
120
130
140
2002 2004 2006 2008 2010 2012 2014
For both male and female full-time workers, average car driver distance travelled per person per year has fallen since 2002. Male full-time workers have seen a larger decline than females.
Male retired workers, on average, drive almost three times further than female retired workers, though distance travelled by female retired workers has grown 39% since 2002.
Average distance travelled by car has grown by more than a third for retired women since 2002...
Average car driver distance travelled for retired workers by gender: England, 2002 to 2014; Index 2002 = 100
Comparison with 2002
-5%3,819 miles pppy
39%1,395 miles pppy
Comparison with 2002
-18%6,871 miles pppy
-7%4,506 miles pppy
The reduction in car use has been greatest for young males...
Average male car driver distance travelled by age: England, 2002-2014; Index 2002 = 100 NTS0605
40-4917-20 21-29 30-39 70+50-59 60-69
Average car driver distance travelled for full time workers by gender: England, 2002 to 2014; Index 2002 = 100

Road Use Statistics: Page 22
Section 3: Who is using the roads?
There has been a reduction in numbers gaining a driving licence...
Annual practical car test passes (all ages): Great Britain, 2007/08 to 2013/14 (financial years) DRT0203
Annual practical car test passes by age (17-20) and gender: Great Britain, 2007/08 to 2013/14 (financial years) DRT0203
Across all ages, driving test pass rates have remained fairly stable since 2007/8 with just under half of those taking a practical test gaining a driving licence. However, the number of tests taken by men has fallen by 19%, and the number of tests taken by women has fallen by 14%.
Driver and rider test statisticsFurther statistics on driver and rider testing, including pass rates by age and gender, is available via the links below
Driving tests and intructors statistics
Practical car test pass rates
The number of young people passing the driving test has fallen in recent years.This is mainly due to a fall in numbers of practical driving tests taken by 17 to 20 year olds. The number of tests taken by both men and women for this age group has fallen by around 25%.
0
50,000
100,000
150,000
200,000
250,000
2007/08 2009/10 2011/12 2013/14
Males
Females
0
200,000
400,000
600,000
800,000
2007/08 2009/10 2011/12 2013/14

Road Use Statistics: Page 23
Section 3: Who is using the roads?Reduced use of company cars has contributed to the decrease in average car mileage per person…
Driver, private carDriver, company car
Percentage of household cars that are company cars: England NTS0901
…particularly for those aged 30+ outside London…
0500
1,0001,5002,0002,5003,0003,5004,0004,5005,000
2003 2005 2007 2009 2011 2013
Average car distance travelled by non-London residents in England aged 30+, miles per person per year, 2002 to 2014
30+ year olds living outside London travel furthest as a car driver per person per year on average (compared to those under 30, or living in London), and have the highest average company car mileage. Reduction in company car usage has been a key factor in explaining the overall reduction in distance travelled by car for individuals in this group.
In the late 1990s, 10% of cars on the road were company registered cars; this fell to around 8% by the mid-2000s (with changes in taxation likely to have been an explanatory factor) and has remained at broadly this level since then. A similar trend is seen for the proportion of household cars which are company owned, from 6% in 2002 to 3% in 2014.
0
1
2
3
4
5
6
7
2002 2004 2006 2008 2010 2012 2014
Average mileage of company cars is much higher than for other household cars - with annual mileage of 19,500 compared to 7,500 for privately owned cars.
As a result, reduction in the number of company cars is likely to have a disproportionate effect on average household car mileage trends.

Road Use Statistics: Page 24
Section 3: Who is using the roads?
0% 50% 100%
All households
0% 50% 100%
Lowest income level
Second level
Third level
Fourth level
Highest income level
Distance travelled by car by level of household income, England 2014, NTS0705
2,825
3,816
5,194
6,385
7,208 miles per person per year
Lowest real income level
Second level
Third level
Fourth level
Highest real income level
Income influences travel behaviour, with those in the wealthiest households travelling more by car...
Household car availability by household income quintile: England, 2014, NTS0703High income groups are also
much more likely to have more than one household car compared with those with lower income levels.
Car driving is the most frequent mode of travel for people with a car in their households.
People who do not have access to a car in their households travel more often walking and by bus, and travel much less further per person per year on average.
People in the highest quintile household income group travel more than twice as far as people in the lowest. Most of the difference is due to car use, which is related to patterns of household car availability, as illustrated above.
Further information Further information on the topics covered in this section and other factors associated with patterns of car use can be found in the National Travel Survey 2014 and Understanding the Drivers of Road Travel 2015 report. The Department’s segmentation study provides further information on the attitudes and behaviours of different groups of the population, including in relation to car use.
Half of households in the lowest income quintile have access to a car, compared with nearly 90% of those in the highest income quintile...

Road Use Statistics: Page 25
Why people travel
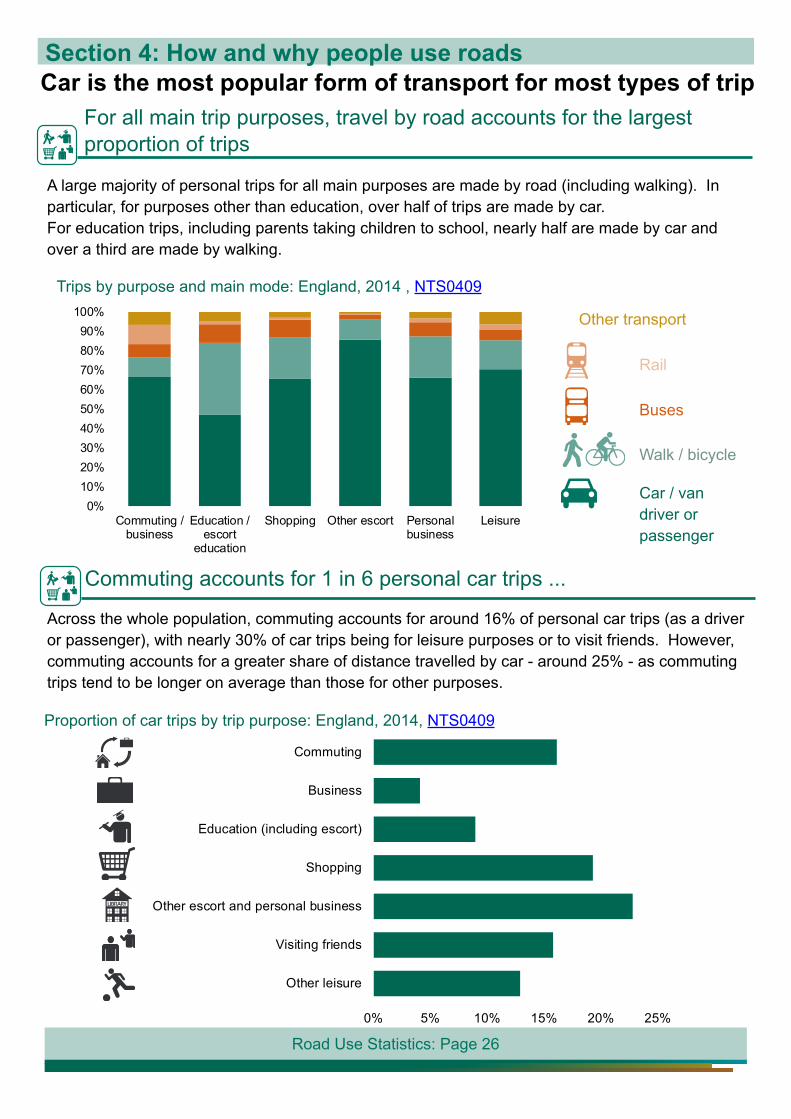
For all the main reasons for travelling - including commuting, shopping and visiting friends - most journeys are made by road, in particular by car. For example, two-thirds of commuting/business journeys are made by car.
Trends in car use for different purposes
On average at the individual level, car use has fallen over the last decade or so, with reductions in the number of trips made by car for commuting, shopping and visiting friends. The total number of trips per person made for these purposes has fallen, which could be associated with increases in online shopping or use of social media.
Trip lengths
The majority of personal trips under 1 mile are made by walking; for trips of other lengths, car is the main mode of travelling, with more than half of car driver trips being under 5 miles. Trips which involve travelling on motorways tend to be longer.
Section 4: How and why people use roadsThis chapter presents information on why people travel by road, in particular by car, and on the pattern of road use in terms of the lengths of car trips.
Sources in this chapterNational Travel SurveyUse of the SRN
Related data sourcesThe Labour Force Survey and the Census both have information on commuting:LFS: https://www.gov.uk/government/statistical-data-sets/tsgb01-modal-comparisonsCensus: http://www.ons.gov.uk/ons/guide-method/census/2011/censusdata/index.html
Road Use Statistics: Page 26
Section 4: How and why people use roads
For all main trip purposes, travel by road accounts for the largest proportion of trips
0% 5% 10% 15% 20% 25%
Other leisure
Visiting friends
Other escort and personal business
Shopping
Education (including escort)
Business
Commuting
Proportion of car trips by trip purpose: England, 2014, NTS0409
Commuting accounts for 1 in 6 personal car trips ...
A large majority of personal trips for all main purposes are made by road (including walking). In particular, for purposes other than education, over half of trips are made by car. For education trips, including parents taking children to school, nearly half are made by car and over a third are made by walking.
0%10%20%30%40%50%60%70%80%90%
100%
Commuting /business
Education /escort
education
Shopping Other escort Personalbusiness
Leisure
Trips by purpose and main mode: England, 2014 , NTS0409
Car / van driver or passenger
Other transport
Rail
Buses
Walk / bicycle
Across the whole population, commuting accounts for around 16% of personal car trips (as a driver or passenger), with nearly 30% of car trips being for leisure purposes or to visit friends. However, commuting accounts for a greater share of distance travelled by car - around 25% - as commuting trips tend to be longer on average than those for other purposes.
Car is the most popular form of transport for most types of trip

Road Use Statistics: Page 27
Section 4: How and why people use roads
There is a declining trend in commuting trips per person...
Shopping and visiting friends are other purposes for which car use has fallen at the individual level…
Average number of commuting trips per person per year: England, 2002 to 2014 (Index: 2002 = 100) NTS0409
708090
100110120130140
708090
100110120130140
708090
100110120130140
2002 2014708090
100110120130140
2002 2014
Overall, the average number of commuting trips per person1 per year declined by 10% between 2002 and 2014.
The average number of car / van driver commuting trips fell 16% over this period, whereas commuting by surface rail increased by 56%. However, rail still represents a small share - in 2014 only 7% of all commuting trips were made by surface rail.
70
80
90
100
110
120
70
80
90
100
110
120
70
80
90
100
110
120
70
80
90
100
110
120
2002 201470
80
90
100
110
120
2002 201470
80
90
100
110
120
2002 2014
Average car distance travelled per person per year by purpose 2002 to 2014; Index 2002 = 100
In terms of distance travelled by car (as a driver or passenger), the purposes for which car use declined most between 2002 and 2014 in terms of average mileage per person were non-food shopping (down 24%), visiting friends at their home (down 17%) followed by commuting (down 12%).
Surface rail
All modes
Car / van passenger
Car / van driver
Non-food shoppingCommuting
Business Other trip purposesVisit friend’s private home
Food shopping
1Note that this figure is an average over the whole population, which includes some people that don’t make any commuting trips
Road Use Statistics: Page 28
Section 4: How and why people use roads
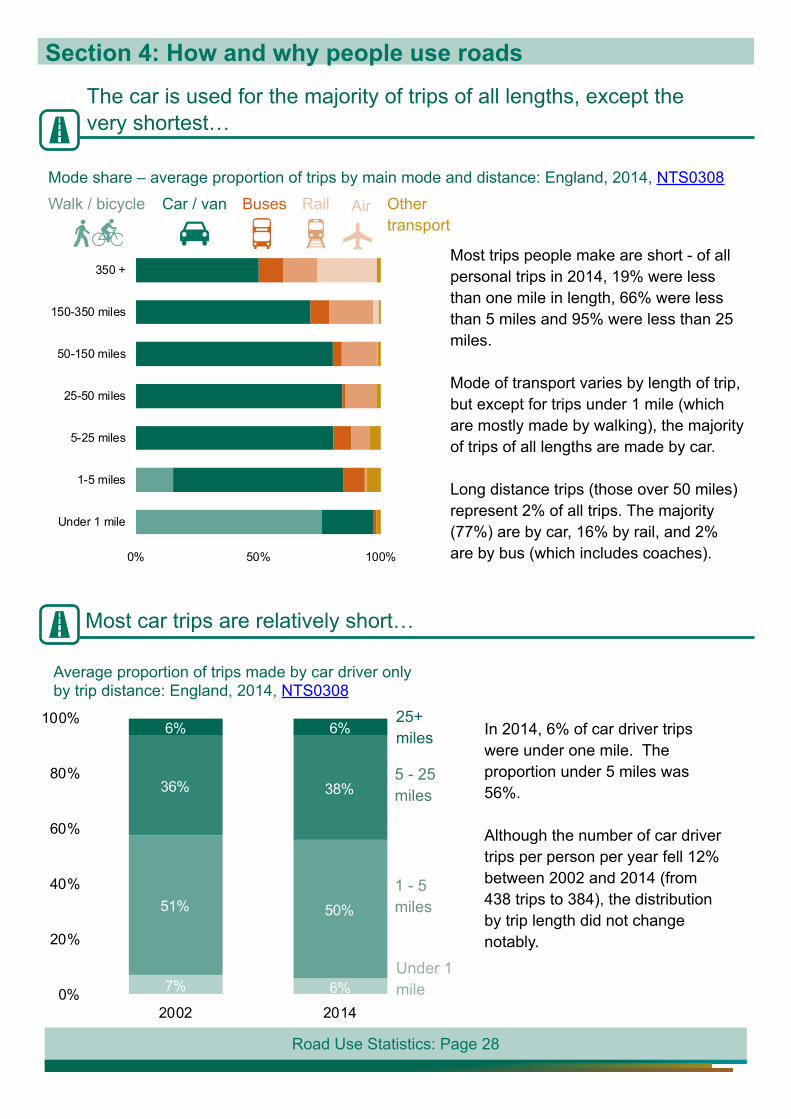
Most car trips are relatively short…
7% 6%
51% 50%
36% 38%
6% 6%
0%
20%
40%
60%
80%
100%
2002 2014
Mode share – average proportion of trips by main mode and distance: England, 2014, NTS0308
The car is used for the majority of trips of all lengths, except the very shortest…
0% 50% 100%
Under 1 mile
1-5 miles
5-25 miles
25-50 miles
50-150 miles
150-350 miles
350 +Most trips people make are short - of all personal trips in 2014, 19% were less than one mile in length, 66% were less than 5 miles and 95% were less than 25 miles.
Mode of transport varies by length of trip, but except for trips under 1 mile (which are mostly made by walking), the majority of trips of all lengths are made by car.
Long distance trips (those over 50 miles) represent 2% of all trips. The majority (77%) are by car, 16% by rail, and 2% are by bus (which includes coaches).
Average proportion of trips made by car driver only by trip distance: England, 2014, NTS0308
In 2014, 6% of car driver trips were under one mile. The proportion under 5 miles was 56%.
Although the number of car driver trips per person per year fell 12% between 2002 and 2014 (from 438 trips to 384), the distribution by trip length did not change notably.
Car / van Other transport
RailBusesWalk / bicycle
25+ miles
5 - 25 miles
1 - 5 miles
Under 1 mile
Air

Road Use Statistics: Page 29
Section 4: How and why people use roads
64%
15%
30%
40%
18%
28%
21%
50%
28%
17%
26%
12%
44%
60
70
80
90
100
110
2002 2004 2006 2008 2010 2012 2014
Car driver trip rates by trip length: England, 2002 to 2014; Index: 2002 = 100 NTS0308
The reduction in car driver trips is spread across trips of all lengths…
Car driver trips of all lengths have fallen. Those under one mile have fallen the most, however these only make up 6% of all car driver trips. The proportion of trips made in each distance band has remained broadly constant since 2002.
...although trips involving motorways tend to be longer…
Overall, although car trips over 25 miles only account for a small proportion of trips, they also account for almost half the distance travelled.Trips which involve some travel on strategic road network motorways tend to be longer on average, with a higher proportion of longer trips.
Share of car trips and vehicle miles by trip length, Sep 2011 to Aug 2012 in Great Britain
On SRN motorways
50+ miles
25 - 50 miles5 - 25 miles
Under 5 miles
% Trips % Miles% Miles% Trips
25 - 50 miles
5 - 25 miles
1 - 5 miles
Under 1 mile
50+ miles
On all roadsGPS data sourceThe data for this section comes from DfT in-vehicle GPS data, for trips between Sep 2011 and Aug 2012. Figures relate to GB vehicles (cars only) on roads in England.
These figures differ from those in the previous section which come from the Department’s National Travel Survey which explains why the figures for all roads are slightly different to those shown previously.
-29% 6% of trips
-8% 38% of trips
Comparison with 2002
-10%4% of trips
50% of trips
-17%2% of trips
-13%

Road Use Statistics: Page 30
Section 5: Commercial road usersThis chapter outlines the contribution of vans and HGVs to traffic trends.
Sources in this chapterRoad traffic statisticsVehicle licensing statisticsRoad Freight statistics2008 DfT Van survey
Van traffic has grown faster then car traffic in recent years. In 2014 van traffic reached the highest ever level at 45 billion vehicle miles.
The proportion of traffic accounted for by vans has increased over the past 30 years, from 9% in 1984 to 14% in 2014.
HGV traffic increased between 2013 and 2014 to 16 billion vehicle miles. However, this was still 12% below the pre-recession peak level in 2004.
HGV vehicles are the most intensively used vehicles, travelling further on average than cars or vans. HGV vehicles are travelling less distance but carrying more goods since the 1990s, owing to a shift away from using smaller HGV vehicles towards larger vehicle or vans.
£11bn contribution to the UK economy
Road is the main method of transporting freight across Great Britain, with almost three times more goods moved by road than by water and rail combined.

Road Use Statistics: Page 31
Section 5: Commercial road users
1950 1960 1970 1980 1990 2000 2010
HGV traffic
HGVs licensed
Commercial road users account for a growing proportion of traffic.
Long term trend in commercial vehicles
Commercial vehicles made up 20% of traffic in 2014. Three-quarters of this traffic was by vans and the remainder was by Heavy Goods Vehicles (HGVs).Vans accounted for 10% of all licensed vehicles in 2014. There were fewer HGVs licensed in 2014 than in 1950, although HGV vehicle miles more than doubled over the same period.
80
85
90
95
100
105
110
115
120
125
2007 2008 2009 2010 2011 2012 2013 2014 2015
Rolling annual totals, GDP and traffic, Index: (2007Q4=100) TRA2501
0
100
200
300
400
500
600
700
800
900
1000
1950 1960 1970 1980 1990 2000 2010
Van traffic
Vans licensed
Trends in commercial vehicles and miles travelled, GB, Index: (1950=100)
0% 20% 40% 60% 80% 100%
Van traffic
HGV traffic
All Motor vehicletraffic
Highways England
managed roads
Local Authority managed
major roads
Minor roads(Local authority
managed)
The rise in van traffic has been seen across the country.
HGV traffic began to rise in early 2013, after steady falls since the mid 2000s. HGV traffic relies more heavily on the Strategic Road Network than other traffic, with two thirds of all HGV traffic on the SRN.
Van traffic
GDP
Car traffic
HGV traffic
12%
5%
4%
3%
Percentage increase since January 2013
Traffic by road management, 2014
Van traffic is growing faster than car traffic

Road Use Statistics: Page 32
Section 5: Commercial road usersVan traffic grew on all types of road, with strongest growth on the SRN
90
100
110
120
130
140
150
160
2000 2002 2004 2006 2008 2010 2012 2014
HE managed ‘A’ roads
HE managed motorways
All roads
LA managed minor roads
LA managed ‘A’ roads
Annual van traffic on all roads, by management status, England Index: (2000=100) TRA4201
53%
51%
38%
35%
30%
Percentage increase since 2000
Compared to other vehicle types, van traffic saw the largest percentage increase (5.6%) in 2014 to reach the highest ever figure of 45 billion vehicle miles.
Factors that may have affected the increases in van traffic over the last decade include: the growth in internet shopping and home deliveries; changes to taxation rules for vans and cars may have made vans a more attractive option for some people; costs and regulation for vans tend to be less than for HGVs, which may encourage businesses to substitute vans for HGVs.
60
70
80
90
100
110
2000 2002 2004 2006 2008 2010 2012 2014
Annual HGV traffic on all roads in England by road management, Index: (2000=100), TRA4201
HA managed ‘A’ roads
HA managed motorways
All roads
LA managed minor roads
LA managed ‘A’ roads
Compared to 2000
1%
5%
9%
15%
32%
HGV traffic peaked prior to the economic downturn
HGV traffic was more affected by the recession than any other vehicle type, with particularly large decreases on minor roads. Although HGV traffic is beginning to recover on the Strategic Road Network (managed by Highways England), it is yet to return to the pre-recession peak in 2004.

Road Use Statistics: Page 33
Section 5: Commercial road users
Carriage of Equipment
53%Delivery/
collection of goods 26%
Providingtransport to others 3%
Private and domestic 9%
Not stated 9%
Carriage of Equipment
52%Delivery/ collection of goods 21%
Providingtransport to others 2%
Private and domestic
18%
Not stated 7%
Most vans are commercially owned
In 2008, almost three-quarters of vans were commercially owned. Commercially owned vehicles had around twice the annual mileage of privately owned vans, and so accounted for over 80% of the distance travelled by vans.
% distance travelled by ownership type
Average yearly mileage travelled per van by ownership, 2008
Around half of vans are used to carry equipment
Business61%Hire/Lease
11%
Private 28%
Not Stated <1%
Private 17%
Not Stated <1%
Business67%
Hire/Lease16%
Percentage of registered vans by primary use
Share of distance travelled by primary use
The 2008 survey also recorded wide variations in the main purpose that the van was used for. The largest single category was business owned vans used for the carriage of equipment, accounting for 52% of vehicles and 53% of distance travelled. Vans used primarily forprivate and domestic purposes represented 18% of vehicles but only 9% of distance travelled.
Van Survey 2008All of the figures on this page come from the DfT Van Activity Baseline Survey in 2008. This was a postal survey of vans, defined as those vehicles that can carry goods and have gross vehicle weights of 3.5 tonnes or less. Only vans registered to the UK, as recorded by the DVLA, were included.
0 10,000 20,000 30,000 40,000
Hire or Lease
Business
Not Stated
Private
All Vans average
0 10,000 20,000 30,000 40,000
All Vans average
Not Stated
Private
Delivery / Collection of goods
Providing transport to others
Carriage of equipment
Average yearly mileage travelled per vehicle by primary use, 2008
% of registered vans by ownership type

Road Use Statistics: Page 34
Section 5: Commercial road users
60
70
80
90
100
110
120
1990 1993 1996 1999 2002 2005 2008 2011 2014
HGVs are the most intensively used vehicles, travelling further on average than cars or vans. There are currently fewer HGVs than in the 1950s but vehicle mileage has more than doubled. Over the past decade, however, all vehicle types have seen a decline in mileage per vehicle.
HGV vehicles are travelling less distance but carrying more goods since the 1990s, owing to a shift away from using smaller HGV vehicles towards larger vehicle or vans.
Good moved, goods lifted and vehicle kilometres by GB-registered HGVs, index 2000 = 100
Recent trends suggest a decline in how intensively HGVs are used
Goods lifted 1.49 billion tonnes
Goods moved136 billion tonne
kilometres
Vehicle distance16.9 billion kilometres
De initionsGood lifted: the weight of goods carried measured in tonnes.Goods moved: a measure of activity taking into account the weight of the load and the distance hauled.
Since the 1990s annual growth in the amount of goods moved has generally been slower than growth in GDP
3%
7%
2%
1%
Change 2002-2014
Change 2013-2014
Index 2002=100
87
92
97
102
2002 2004 2006 2008 2010 2012 2014
Van traffic per licensed van
HGV traffic per licensed HGV

Road Use Statistics: Page 35
Section 6: Performance of the road networkThis chapter outlines factors relating to the performance of roads including congestion, road surface conditions, user satisfaction and accidents.
Sources in this chapterHighways England Road User Satisfaction SurveyRoad congestion and reliability statisticsRoad accident and safety statisticsConnectivity travel time indicatorsTransport energy and environment statisticsTransport Statistics Great Britain
89%89% of strategic road users were satisfied with their latest journey in 2014/15. Road user satisfaction has been fairly stable over recent years. Satisfaction with different aspects of the SRN varies, but remains high.
87% of users were satisfied with journey time on the SRN. Congestion measured by average delay on the SRN in England was 9.4 seconds in October 2015.
Road conditions have been fairly stable in recent years. In 2014/15, 4% of the principal ‘A’ road network should have been considered for maintenance, the same as the previous year.
Despite growth in traffic, road casualties have decreased drastically on all roads.
Total domestic greenhouse gas emissions from road transport has decreased every year since 2007, from 121 million tonnes to 108 million tonnes in 2014, following the recession and developments in fuel efficiencies.

Road Use Statistics: Page 36
Section 6: Performance of the road network
The average delay on the SRN in England was 9.4 seconds per vehicle mile in October and 10.2 seconds per mile in November 2015.
Average delay on the SRN varies greatly by link and region
Average delayDefinition
Delay (or ‘time lost’) is calculated by subtracting derived ‘free flow’ traveltimes from observed travel times for individual road sections.More information is available via the congestion and reliability statistics series.
91 91 90 89
60
65
70
75
80
85
90
95
2011/12 2012/13 2013/14 2014/15
Strategic Road User Satisfaction Survey- Journey satisfaction score*% very or fairly satisfied with the following on their latest journey
92%
90%
89%
87%
67%
Safety
Upkeep
Info Provision
Journey Time
Roadworks management
Road user satisfaction is high and fairly stable over recent years
*Satisfaction score is a composite measure of satisfaction with journey time, roadworks management, upkeep, information provision and safety on motorways and trunk roads in England.
0 to less than 2 seconds2 to less than 11 seconds11 to less than 20 secondsMore than 20 secondsInsufficient data
Network performance can be measured by infrastructure improvements, user satisfaction and environmental impact.
Further information
These figures relate to the SRN. Satisfaction with local authority managed roads is collected by the National Highways & Transport Network

Road Use Statistics: Page 37
Section 6: Performance of the road network
2000
2013
2007
108 million
117 million121 million Recession and
developments in fuel efficiencies
Despite growth in traffic, road casualties have decreased
Greenhouse gas emissions from road transport have fallen since 2007
Increases in traffic lead to greater numbers of vehicles on the road network, greater numbers of interactions of vehicles and pedestrians and therefore increases the likelihood of accidents occurring. However, the fatality rate per billion vehicle miles (bvm) has fallen almost every year from a peak of 165 deaths per bvm in 1949 to the lowest level of 5.6 deaths per bvm in 2013 and 5.7 deaths per bvm in 2014.
There are a range of reasons for the fall in fatality rates, including: improvements in education and training; improvements in vehicle technology and highway engineering; the introduction of road safety policies, such as speed limits; enforcement of legislation; and behavioural change.
Total domestic greenhouse gas emissions from road transport (tonnes), UK
0
4000
8000
12000
16000
20000
2000 2002 2004 2006 2008 2010 2012 2014
Number killed or seriously injured, by transport type, 2014, RAS30001
5,628
3,514
Other
8,832
5,509
1,099
The number of ultra low emissions vehicles registered for the first time increased 264% in 2014.
Lead and Sulphur Dioxide were removed from fuel in 2007 and have since fallen dramatically (26% and 72% respectively), accounting for 5% of domestic transport emissions in 2013.
Road Use Statistics: Page 38
Section 6: Performance of the road network
0 20 40 60 80 100
Percentage of working age population
None
Up to 3Up to 1
Up to 7Up to 10
0 20 40 60 80 100
Percentage of working age population
None
Up to 3Up to 1
Up to 7Up to 10
Very little of the country is very remote from employment opportunities by car…
Average number of large employment centres accessible within 45 minutes, Journey time statistics
0
20
40
60
80
2000 2002 2004 2006 2008 2010 2012 2014
17%
Million tonnes of CO2 equivalent by vehicle type, ENV0201
33%
30%
16%
4%
1%
% of total in 2014
Other
Cars account for almost two thirds of road transport greenhouse gas emissions
...by public transport ...by car
Petrol
Diesel
The bars below show that while 80% of the working age population can reach 7 or more large employment centres by car, this is true of only 20% by public transport.

Road Use Statistics: Page 39
Section 6: Performance of the road network
£641m
£520m
£1,171m
£760m
£306m
In recent years, road conditions have been fairly stable
Structure treatments on ‘A’ roads
Routine and other treatments on ‘A’ roads
Structure treatments on minor roads
Routine and other treatments on minor roads
Highways maintenance policy, planning and strategy for all local authority managed roads
Maintenance expenditure on Roads in England, 2014 RDC0310
Capital spend makes up the majority of spending on roads
National roads18%
Local Roads 27%
Local Public
Transport 14%
Railways 37%
Other 5%
£20.6 billiontotal transport expenditure in
2014/15
£5.5billion
£3.7billion£3.4billion
£2.0billion
2000/01 2014/15
Expenditure on roads in GB, £ billion outturn, TSGB1301
Local Roads
National Roads
Of the £9.2billion spent on roads in Great Britain, 70% was capital spend and the remaining 30% was on current repair and maintenance work. The proportion of the total spent on roads that is accounted for by capital spending has increased steadily over time.
Roads spending made up 45% of expenditure on transport in 2014/15.
4% of the principal ‘A’ road network in England should have been considered for maintenance in 2014/15, the same as in the previous year.
London region had the highest proportion of its principle network that should be considered for maintenance at 12%.

Road Use Statistics: Page 40
Further information
About this publication and request for feedback
Links to data sources used throughout this publication and related information.
Data sources used in this publication
This is a new publication, which brings together information on roads from a range of statistical publications produced by DfT and other sources. It aims to provide a high-level narrative on roads and how they are used. Feedback on the publication and any suggestions for improvements to any future updates are welcome, by email to [email protected].
The following are the key sources of statistics on roads which are used in this publication. Full details of the way the statistics are produced, details of definitions and coverage, and strengths and limitations, can be found by following the links below.
► Road traffic statistics monitor trends in traffic by road and vehicle type in Great Britain based on a network of automatic and manual traffic counts https://www.gov.uk/government/collections/road-traffic-statistics
► The National Travel Survey is a large household survey of residents of England which provides a key source of information on how and why people travel. It covers personal travel by all modes, but not commerical traffic (which includes most van use and HGVs) https://www.gov.uk/government/statistics/national-travel-survey-2014
► Transport Statistics Great Britain is the main compendium of transport statistics updated annuallly, covering all forms of transport including roads https://www.gov.uk/government/collections/transport-statistics-great-britain
► Road freight statistics cover the activity of Heavy Goods Vehicles within Great Britain including details of goods transported, based on returns from a sample of freight operators https://www.gov.uk/government/collections/road-freight-domestic-and-international-statistics
► Road accident statistics contain detailed data on road accidents and casualties, collated from police accident recording https://www.gov.uk/government/collections/road-accidents-and-safety-statistics
► Journey time statistics provide estimates of travel times to key services by car and by public transport based on journey planning tools https://www.gov.uk/government/collections/journey-time-statistics
► Vehicle licensing statistics provide regular information on the vehicle stock and newly registered vehicles https://www.gov.uk/government/collections/vehicles-statistics

Road Use Statistics: Page 41
Related data sourcesIn addition to the sources listed above, infomation on roads and their use is available from other statistical sources, produced by DfT and others. These include:
► Labour Force Survey https://www.gov.uk/government/statistical-data-sets/tsgb01-modal-comparisons
► Census http://www.ons.gov.uk/ons/guide-method/census/2011/censusdata/index.html
► Summary of statistics on the Strategic Road Network https://www.gov.uk/government/statistics/use-of-the-strategic-road-network
► Local area walking and cycling statistics for England https://www.gov.uk/government/statistics/local-area-walking-and-cycling-in-england-2013-to-2014
► Highways England satisfaction survey https://www.gov.uk/government/publications/national-road-users-satisfaction-survey-nruss
► Transport energy and environment statistics provide statistics on the impact of transport on energy consumption, greenhouse gas emissions from transport and pollution from transport https://www.gov.uk/government/collections/energy-and-environment-statistics
► Road network size and condition provides estimates of the length of road maintained at public expense and the condition of those roads by road category https://www.gov.uk/government/collections/road-network-size-and-condition
► Road congestion and reliability statistics provide an estimate of average speed, average delay and the reliability of travel times on the SRN and local A roads https://www.gov.uk/government/collections/road-congestion-and-reliability-statistics