Road Traffic Crashes in Queensland - Home (Department …/media/Safety/Transport and road...
84
Transcript of Road Traffic Crashes in Queensland - Home (Department …/media/Safety/Transport and road...


2002
Road Traffic Crashes in
QueenslandA report on the road toll
Released December 2003 updated August 2004
www.roadsafety.qld.gov.au

For further information contact:
ManagerData Analysis Unit
Land Transport and Safety Division Queensland Transport
6th Floor Transport House 230 Brunswick Street
Fortitude Valley Qld 4006
Tel: (07) 3253 4242 Fax: (07) 3253 4410
or visit Statistics at www.roadsafety.qld.gov.au

Road Traffic Crashes in Queensland: 2002 Page iii
CONTENTS
INTRODUCTION IVBackground ivMain features of road traffic crashes in Queensland 2002 vRoad Crash Database vi
1 ROAD TOLL IN CONTEXT 71.1 Road fatality trends 71.2 Road casualty trends 81.3 Trends in total reported crashes 91.4 Queensland in relation to Australia 101.5 The major contributors to fatal and hospitalisation crashes in 2002 111.6 Proposed next steps 11
2 CHARACTERISTICS OF ROAD USERS INVOLVED IN CRASHES 132.1 Introduction 132.2 Gender and age 132.3 Types of road users 152.4 Child road users 162.5 Young adult road users 172.6 Mature adult road users 192.7 Senior adult road users 21
3 UNITS IN CRASHES 243.1 Introduction 243.2 Fatal crash involvement by unit type 26
3.2.1 Cars 263.2.2 Heavy freight vehicles 273.2.3 Buses 273.2.4 Motorcycles 283.2.5 Bicycles 283.2.6 Pedestrians 29
4 CHARACTERISTICS OF CRASHES 304.1 Introduction 304.2 Overall trends 304.3 Multi-vehicle crashes 314.4 Single vehicle crashes 334.5 Crashes by time of day 344.6 Crashes by day of week 354.7 Spatial location of crashes 36
5 FACTORS CONTRIBUTING TO CRASHES 385.1 Introduction 385.2 Trends 395.3 Alcohol and road fatalities 395.4 Speed as a contributing factor to fatalities 415.5 Fatigue as a contributing factor 425.6 Seat belt usage 43
APPENDIX 1 GLOSSARY 1
APPENDIX 2 KEY SUMMARY TABLES 1

Page iv Road Traffic Crashes in Queensland: 2002
INTRODUCTION
This report presents an overview of reported road traffic crashes in Queensland for the year ended 31 December 2002 in the context of the previous five years, based on data contained in the Queensland Road Crash Information System maintained by Queensland Transport's Land Transport and Safety Division.
Chapter 1 analyses 2002 crash outcomes in terms of past trends, other states of Australia, and the increase in population and vehicles, and outlines the key road safety initiatives and future directions of the Queensland Road Safety Action Plan. Chapter 2 provides information on serious casualties in terms of their gender, age and the type of road user. Chapter 3 looks at the various units involved in crashes. Chapter 4 looks at crash outcomes in terms of what happened, the nature of crashes, single and multi-vehicle type crashes, the time of day and day of the week crashes occurred. Chapter 5 explores the factors that contributed to crashes and their severity, including alcohol, speed, fatigue and seat belt usage.
Background
Queensland Transport has been the official source for road traffic crash statistics since 1991. Additional data supplied by the Queensland Government Chemical Laboratory are used for the analysis of alcohol involvement in road crashes, in particular those involving a fatality. Validation and enhancement of the raw data which originates from the Queensland Police Service Traffic Incident Report System (TIRS) are completed by the Road Crash Database Group in the Queensland Treasury Office of Economic and Statistical Research.
Implementation of the Australian Road Rules in Queensland in December 1999 has affected the figures in this report. In particular, the definition of a ‘property damage only’ crash was altered to include crashes where the damage was greater than $2500 to property other than vehicles or at least one vehicle was towed away.
Amendments in 2000 to the Motor Accident Insurance Act (MAIA) 1994 have also affected the figures in this report. The amendments changed the requirement for notification of crashes. Prior to October 2000, a motor accident insurance claimant in a road crash involving an injury was not required, under the MAIA 1994, to report the crash to police. The 2000 amendment required reporting in line with the Transport Operations (Road Use Management – Road Rules) Regulation 1999.
There was a significant increase in the number of reported crashes in the categories of minor injury, medical treatment and hospitalised in 2001 as a result of the MAIA amendments. This meant that there was a series break between 2000 and 2001 for these crash categories. Comparisons of numbers of crashes and injured people between 2002 or 2001 and previous years may not be reliable.
Dates of crashes and casualties in this report are actual crash dates. Because of this and the fact that some non-fatal crashes may take 12 months or longer for validation, crash data for prior years will contain a percentage of changed data as late reports continue to be entered.
Figures presented in this report are based on the crashes validated in the Queensland Road Crash Information System at 15 August 2003.

Road Traffic Crashes in Queensland: 2002 Page v
Main features of road traffic crashes in Queensland 2002
The Queensland road toll for 2002 was 322 fatalities. This is 2 (0.6 per cent) fewer than in 2001 (n=324) and 3 (0.9 per cent) more than the average for the previous five years (n=319).
The Australian road toll for 2002 was 1,714, a decrease of 2 per cent (n=42) on 2001. Queensland’s fatality rate, of 8.7 per 100,000 population, or 1.3 per 10,000 registered vehicles, is equal to the national average.
Road users aged between 17 and 24 years accounted for 30 per cent of the road toll, however they represented 11 per cent of Queensland’s population. In 2002, the road fatality rate for 17 – 20 year-olds was three times the fatality rate for the entire population. The road fatality rate for 21 – 24 year olds was two-and-a-half times the fatality rate for the entire population.
There were 53 motorcycle rider and pillion fatalities in 2002, an increase of 83 per cent on 2001 (n=29) and 56 per cent above the average for the previous five years (n=34).
In 2002, there were 37 pedestrian fatalities. The pedestrian was considered most at fault in 72 per cent (n=26) of the 36 fatal crashes involving a pedestrian.
Of the 22,081 reported crashes in Queensland in 2002, 62 per cent (n=13,621) were multi-vehicle and 33 per cent (n=7,186) were single-vehicle type crashes.
Of all fatal single vehicle crashes, vehicles hitting objects accounted for 66 per cent (n=86), consistent with the average for the previous five years.
More severe crashes were more likely to occur on Friday, Saturday or Sunday, with 53 per cent (n=150) of fatal crashes and 46 per cent (n=2,045) of hospitalisation crashes occurring on these days. Fewest fatal crashes occurred on Mondays (10 per cent) and fewest crashes overall occurred on Sundays (11 per cent).
While there were more crashes in urban areas in 2002, there were more fatal crashes outside urban areas; 47 per cent (n=133) of fatal crashes occurred outside urban areas, compared with 22 per cent (n=4,948) of all crashes. While 28 per cent (n=6,241) of all crashes occurred in Brisbane City in 2002, only 13 per cent (n=36) of fatal crashes occurred in Brisbane City.
Based on police assessment, failure to obey traffic rules was the largest contributor to fatal and all reported crashes. This contributed in 34 per cent (n=96) of fatal crashes and 39 per cent (n=8,653) of all crashes.
Alcohol or drug use contributed in 29 per cent (n=82) of fatal crashes and 13 per cent (n=2,840) of all crashes.
Speed contributed in 17 per cent (n=48) and fatigue contributed in 15 per cent (n=42) of fatal crashes. Speed and fatigue each contributed in 5 per cent (n=1,154 and n=1,141 respectively) of all crashes.

Page vi Road Traffic Crashes in Queensland: 2002
Road Crash Database
The Road Crash Database plays a major role in road safety action planning in Queensland. Crash data are used to develop and evaluate the effectiveness of major counter-measures (see Chapter 1 of this report for details).The Department of Main Roads takes core data from the road crash data system operated by Queensland Transport and adds further site information to enable better planning for road safety engineering. Queensland Transport also provides a range of analysis services using road crash data, including crash profile reports on specific crash categories which can be provided on request.

Road Traffic Crashes in Queensland: 2002 Page 7
1 ROAD TOLL IN CONTEXT This chapter provides an analysis of road traffic crashes and their outcomes in Queensland for 2002 in terms of past trends, other states of Australia, and increases in population and vehicles. The chapter also outlines the key road safety initiatives and future directions of the Queensland Road Safety Action Plan.
1.1 Road fatality trends
The Queensland road toll for 2002 was 322 fatalities. This is 2 (0.6 per cent) fewer than in 2001 (n=324) and 3 (0.9 per cent) more than the average for the previous five years (n=319).
Figure 1.1 shows the longer-term trend in Queensland's road toll. Since the mid 1970's the road toll has decreased by 44 per cent overall. By 1989, the number of fatalities had decreased to 428, a level not experienced since the early 1960s. From then until 1995, fatalities increased and decreased within a range, with a low of 395 in 1991 and a high of 456 in 1995. From 1995, the road toll decreased again, with the toll in 1998 (n=279) the lowest since 1955.
Fig. 1.1: Annual road tollQueensland 1972-2002
0
100
200
300
400
500
600
700
72 77 82 87 92 97 02
Figure 1.2 shows trends in the road toll against trends in vehicle registrations since 1972. While fatalities were 44 per cent lower by 2002, vehicle registrations were 216 per cent higher.
Fig. 1.2: Road toll and motor vehicle registration trendsQueensland 1972-2002
0
100
200
300
400
500
600
700
72 77 82 87 92 97 02
Inde
x 19
62 =
100
Registrations Road toll
Table 1.1 shows fatality rates per capita and per vehicles registered in Queensland since 1972. A fatality rate of 29.7 per 100,000 population was experienced in 1972, compared with 8.7 per 100,000 population in 2002, a decrease of over 70 per cent. A fatality rate of 7.4 per 10,000 Queensland-registered vehicles was experienced in 1972, compared with 1.3 per 10,000 Queensland-registered vehicles in 2002, a decrease of over 80 per cent.

Page 8 Road Traffic Crashes in Queensland: 2002
Table 1.1: Fatality rates per 100,000 population and per 10,000 vehicles registeredQueensland 1972-2002
Fatality rate Vehicles onYear Road Toll Population* per 100,000 register ** Fatality rate per
('000) population ('000) 10,000 vehicles1972 572 1924.7 29.7 774.0 7.41977 572 2151.0 26.6 1067.2 5.41982 602 2456.5 24.5 1439.5 4.21987 442 2703.4 16.3 1575.3 2.81992 416 3030.5 13.7 1832.8 2.31997 360 3440.2 10.5 2232.9 1.62002 322 3707.2 8.7 2445.5 1.3
* ABS Cat. No. 3201.0
** ABS Cat. No. 9309.0
1.2 Road casualty trends
There were 18,155 casualties from crashes on Queensland roads in 2002, a decrease of 1 per cent (n=197) on 2001. Casualties as a result of road crashes are categorised by level of severity. These are, in order of severity fatal, hospitalised, medical treatment, and other injury (not requiring medical treatment).
Table 1.2 shows that the proportion of casualties in each severity category has remained relatively constant over a five-year period. In 2002, almost a third (32 per cent, n=5,877) of casualties were fatal or required hospitalisation.
Table 1.2: Severity of road crash casualtiesQueensland 1997-2002
Severity 1997 1998 1999 2000 2001 2002No. % No. % No. % No. % No. % No. %
Fatal 360 2% 279 2% 314 2% 317 2% 324 2% 322 2%Hospitalisation 4146 28% 4397 29% 4503 30% 4790 31% 5314 29% 5555 31%Medical treatment required 6483 43% 6325 42% 6252 42% 6446 42% 7884 43% 7544 42%Other injury 3928 26% 4007 27% 3840 26% 3934 25% 4830 26% 4734 26%Total 14917 100% 15008 100% 14909 100% 15487 100% 18352 100% 18155 100%
Figure 1.3 shows hospitalisations as a result of road crashes in the context of Queensland’s population since 1980. While the state’s population has increased throughout the period, during the 1980s and early 1990s, the number of hospitalisations decreased or remained constant. In 1994, the number of hospitalisations from crashes increased, and at a faster rate than the population increased. While this was reversed for the following three years, with the number of hospitalisations decreasing again, hospitalisations increased between 1998 and 2002, at a faster rate than the population increased.

Road Traffic Crashes in Queensland: 2002 Page 9
Fig. 1.3: Road user hospitalisation and population trendsQueensland 1980-2002
0
1
2
3
4
5
6
7
8
80 85 90 95 00
Peo
ple
hosp
italis
ed (
'000
)
0
500
1000
1500
2000
2500
3000
3500
4000
Population ('000)
Hospitalised Population
1.3 Trends in total reported crashes
There were 22,081 road traffic crashes reported on Queensland roads in 2002, an increase of 0.3 per cent (n=68) on 2001.
Table 1.3 shows severity of crashes in Queensland 1997 to 2002. There were 283 fatal crashes in 2002, a decrease of 4 per cent (n=13) on 2001 and a decrease of 0.5 per cent (n=1) on the average for the previous five years. The proportion of crashes in each severity category remained relatively constant over the period. The fatality rate per 100 crashes dropped from 1.7 in 1997 to 1.3 in 2002.
Table 1.3: Severity of road crashesQueensland 1997-2002
Severity 1997 1998 1999 2000 2001 2002No. % No. % No. % No. % No. % No. %
Fatal 321 2% 257 1% 273 1% 275 1% 296 1% 283 1%Hospitalisation 3328 17% 3518 18% 3567 18% 3822 19% 4230 19% 4439 20%Medical treatment required 4762 25% 4613 24% 4572 23% 4790 24% 5920 27% 5611 25%Other injury 2697 14% 2756 14% 2626 13% 2738 14% 3411 15% 3301 15%Property damage only 8235 43% 8417 43% 8504 44% 8310 42% 8156 37% 8447 38%Total 19343 100% 19561 100% 19542 100% 19935 100% 22013 100% 22081 100%
Table 1.4 shows the extent of vehicle damage in crashes 1997 to 2002. The proportion of vehicles in each damage category has remained relatively constant over the period. In 80 per cent of reported 2002 crashes, damage was extensive enough for at least one vehicle to be towed away.
Table 1.4: Extent of vehicle damage in road crashes*Queensland 1997-2002
Overall damage 1997 1998 1999 2000 2001 2002No. % No. % No. % No. % No. % No. %
Vehicle towed away 15865 82% 15957 82% 16083 82% 16379 82% 17407 79% 17730 80%Minor damage 2545 13% 2606 13% 2553 13% 2595 13% 3470 16% 3295 15%No damage 628 3% 671 3% 626 3% 662 3% 734 3% 721 3%Unit not a vehicle 251 1% 255 1% 229 1% 240 1% 307 1% 259 1%Not stated 54 0% 72 0% 51 0% 59 0% 95 0% 76 0%Total 19343 100% 19561 100% 19542 100% 19935 100% 22013 100% 22081 100%* Based on the most severe vehicle damage in each crash

Page 10 Road Traffic Crashes in Queensland: 2002
A further breakdown of vehicles in each damage category arising from reported crashes in 2002 is shown in Table 1.5.
Table 1.5: Extent of vehicle property damage in road crashes*Queensland 2002
No. %Extensive, unrepairable 2877 13%Major - towed away 6313 29%Moderate - towed away 8540 39%Moderate - vehicle driveable 1507 7%Minor damage 1788 8%No damage 721 3%Unit not a vehicle 259 1%Not stated 76 0%Total 22081 100%* Based on the most severe vehicle damage in each crash
1.4 Queensland in relation to Australia
The Australian road toll for 2002 was 1,714, a decrease of 2 per cent (n=42) on 2001. Queensland’s fatality rate, of 8.7 per 100,000 population, or 1.3 per 10,000 registered vehicles, is equal to the national average.
Table 1.6 shows road tolls in Australian states and territories for 2001 and 2002. Queensland experienced the fourth highest road toll in 2002, both per capita and per 10,000 vehicles on register. The Australian Capital Territory experienced the lowest per capita road toll (3.1 per 100,000 population) and the Northern Territory, the highest (27.8 per 100,000 population).
Table 1.6: Road toll in 2002 compared with 2001States and territories of Australia
Fatalities Fatality rate2002 2001 Variation Variation per 100,000 per 10,000No. No. No. per cent population* vehicles on
register**New South Wales 561 537 24 4% 8.4 1.5Queensland 322 324 -2 -1% 8.7 1.3Victoria 397 451 -54 -12% 8.1 1.2Western Australia 179 164 15 9% 9.3 1.3South Australia 154 153 1 1% 10.1 1.4Tasmania 36 61 -25 -41% 7.6 1.1Northern Territory 55 50 5 10% 27.8 5.3Australian Capital Territory 10 16 -6 -38% 3.1 0.5Australia 1714 1756 -42 -2% 8.7 1.3* ABS Cat. No. 3201.0
** ABS Cat. No. 9309.0
Figure 1.4 shows annual road fatalities by State for the period 1986 to 2002. Road tolls in South Australia, Western Australia and Tasmania have remained relatively static throughout the period. New South Wales and Victoria experienced marked improvements in the late 1980s and early 1990s. Queensland experienced some improvements during this period, as well as further decreases between 1995 and 1998.

Road Traffic Crashes in Queensland: 2002 Page 11
Fig. 1.4: Annual road fatalities by state1986-2001
0
200
400
600
800
1000
1200
86 87 88 89 90 91 92 93 94 95 96 97 98 99 00 01 02
Fat
aliti
es
Qld NSW Vic SA WA Tas
1.5 The major contributors to fatal and hospitalisation crashes in 2002
In order to help understand the road toll, police report factors that were assessed as having contributed to a crash. Figure 1.5 provides a ranking of the top ten such contributing factors for fatal and hospitalisation crashes in 2002.
Fig. 1.5: Top ten contributing factors in fatal and hospitalisation crashes, Queensland 2002
0%
5%
10%
15%
20%
25%
30%
Inattention Inexperience AlcoholRelated
IllegalManoeuvre
Fail to GiveWay or Stop
FatigueRelated
SpeedRelated
Age (Lack ofPerception)
Rain/WetRoad
Roadconditions
Per
cen
t of c
rash
es
2002 Average 1997 - 2001
In 2002:
Inattention contributed in 26 per cent (n=1,251) of fatal and hospitalisation crashes, consistent with the average for the previous five years.
Inexperience contributed in 20 per cent (n=971) of fatal and hospitalisation crashes, compared with the average for the previous five years of 21 per cent (n=932).
Alcohol contributed in 19 per cent (n=913) of fatal and hospitalisation crashes, compared with the average for the previous five years of 17 per cent (n=749).
1.6 Proposed next steps
During the 1970s and 1980s, Queensland’s road toll decreased, relative to population growth and also in real terms. During the 1990s and early 2000s, Queensland has continued to experience rapid population and strong economic growth. The road toll has increased during this period, but by proportionately less than population increases.

Page 12 Road Traffic Crashes in Queensland: 2002
A number of road safety initiatives have been introduced since 1972, including:
compulsory seat belt wearing for occupants of cars (1972)
reduction of blood alcohol limit to 0.05 per cent (1982)
introduction of Random Breath Testing (1988)
introduction of Random Road Watch (1991)
compulsory helmet wearing for bicyclists (1992)
introduction of Speed Cameras (1997)
introduction of 50 km/h speed limits on local streets in south-east Queensland (1999).
Despite the benefits of these and other programs, the road toll remains high. Furthermore, hospitalisations continue to increase. Following the success of the 2000/2001 Road Safety Action Plan, the Queensland Government developed the 2002/2003 Queensland Road Safety Action Plan to enhance the measures which were proven to work and to introduce further effective programs.
The 2002/2003 Queensland Road Safety Action Plan prioritises strategies and programs in terms of
the extent to which they target the total road toll
their ability to reduce crashes
their value for money.
The top ten priorities of the plan are included in Table 1.7
Table 1.7: Queensland Road Safety Action Plan - Top 10 actions in priorty order
ActionType of crash
addressedCoverage of road
tollProven crash
reductionsValue for money
scoreTarget group
Improve partnerships between road safety stakeholders
All crashes Medium Y High All road users
Implement the Driver Safety and Education Strategy
All crashes High Y High Drivers
Enhanced Speed Management Strategy
Speed-related crashes Medium Y High Drivers
More effective penalties and sanctions
All crashes Medium Y High All road users
Enhanced drink driving deterrence
All crashes High Y Medium All road users
Road safety engineering works All crashes Low Y Medium All road users
Targeted public education and enforcement campaigns
All crashes Low Y Medium All road users
Enhance the application of random deterrence-oriented practices
All crashes High Y High All road users
Promote road safety research All crashes High Y Medium All road users
Improve compliance levels with road rules
All crashes High Y High All road users

Road Traffic Crashes in Queensland: 2002 Page 13
2 CHARACTERISTICS OF ROAD USERS INVOLVED IN CRASHES
2.1 Introduction
This chapter provides information on road user fatalities and hospitalised casualties as a result of road traffic crashes in 2002 in terms of their gender, age and the type of road user they were at the time of the crash. The chapter focuses primarily on fatalities and draws on some of the data reported later (Chapters 4 and 5) to describe aspects of crashes for the common age groupings of child road users, young adult road users, mature adult road users and senior adult road users.
For all age groupings, details are provided on gender, fatalities by type of road user, and on seat belt wearing. For child road user fatalities, details of the time of day of crashes are also provided. For young adult road user fatalities, whose fatality rate is relatively high, details of blood alcohol levels, time of day and day of week of crashes are provided. For mature adult road user fatalities, details of blood alcohol level and day of week are provided. For senior adult road user fatalities, details of time of day and responsibility for fatal crashes are provided.
2.2 Gender and age
Table 2.1 shows Queensland road fatalities by gender and age groupings from 1993 to 2002. Table 2.1: Annual trends in fatalities by age group and gender
Queensland 1993-2002
1993 1994 1995 1996 1997 1998 1999 2000 2001 2002All fatalities0-11 years* 19 22 25 20 21 17 18 12 14 1812-16 years 18 18 21 20 17 14 19 16 13 1017-24 years 122 103 121 107 113 79 77 61 84 9725-59 years 174 194 208 172 155 121 143 166 147 15060 years+ 63 85 81 66 54 48 57 62 66 47Total 396 422 456 385 360 279 314 317 324 322
Female fatalities 0-11 years** 9 8 12 8 5 4 8 4 6 712-16 years 9 6 8 5 3 6 7 4 3 417-24 years 25 29 29 19 39 18 17 13 13 3025-59 years 40 46 63 55 41 36 36 37 45 3460 years+ 23 38 32 30 21 17 20 26 20 19Total 106 127 144 117 109 81 88 84 87 94
Male fatalities 0-11 years** 10 14 13 12 16 12 8 8 7 1012-16 years 9 12 13 15 14 8 12 12 10 617-24 years 97 74 92 88 74 61 60 48 71 6725-59 years 134 148 145 117 114 85 107 129 102 11660 years+ 40 47 49 36 33 31 37 36 46 28Total 290 295 312 268 251 197 224 233 236 227* Includes fatalites of unknown age and/or gender
** Includes fatalit ies of unknown age
Male fatalities accounted for 70 per cent (n=227) of Queensland’s 2002 road toll, a decrease of 3 per cent (n=9) on 2001. Female fatalities accounted for 29 per cent (n=94) of the 2002 road toll, an increase of 8 per cent (n=7) on 20011. Both male and female fatalities had increased overall between 1998 and 2001, but the increases had been proportionately higher for males, with
1 There was one fatality where the gender was not recorded.

Page 14 Road Traffic Crashes in Queensland: 2002
fatalities 20 per cent (n=39) higher for males and 7 per cent (n=6) higher among females by 2001.
Table 2.2 shows fatalities within gender and age groupings as a proportion of the total 2002 road toll. For some age groupings (17 – 39 year-olds and over 79 year-olds), the proportion of road fatalities was higher than the proportion in the population. In 2002 road users aged between 17 and 24 years accounted for 30 per cent of the road toll, however they represented 11 per cent of Queensland’s population. In 2002, the road fatality rate for 17 – 20 year-olds was three times the fatality rate for the entire population. The road fatality rate for 21 – 24 year olds was almost two-and-a-half times the fatality rate for the entire population. See later section 2.5 for discussion of relevant crash characteristics involving people within this age group.
Table 2.2: Age and gender of fatalitiesQueensland 2002
Age group Male Female Total Proportion of Proportion of Fatalities perroad toll population 100,000 persons*
0-4 years** 4 3 8 2% 7% 3.2 5-11 years 6 4 10 3% 10% 2.712-16 years 6 4 10 3% 7% 3.817-20 years 35 20 55 17% 6% 25.621-24 years 32 10 42 13% 5% 20.725-29 years 33 8 41 13% 7% 15.930-39 years 43 11 54 17% 15% 9.840-49 years 23 9 32 10% 15% 5.950-59 years 17 6 23 7% 12% 5.060-69 years 14 4 18 6% 8% 6.370-79 years 8 6 14 4% 5% 6.980 years and over 6 9 15 5% 3% 13.8Total 227 94 322 100% 100% 8.7* ABS Cat. No. 3201.0
** Includes fatalities of unknown gender
Table 2.3 compares fatalities within gender and age groupings for 2002 with those in 2001. In 2002, the largest percentage decrease in fatalities were in the 60 to 69 year-old age group (30 to 18 fatalities, a decrease of 40 per cent). For males, the largest decrease was 80 year olds and over (11 to 6 fatalities, a decrease of 45 per cent) and for females, 50 to 59 year-olds (17 to 6 fatalities, a decrease of 67 per cent).
In 2002, the largest percentage increase in fatalities was the 0-4 year-olds (4 to 7 fatalities, an increase of 75 per cent). For males, the largest percentage increase was the 0-4 year-olds (2 to 4 fatalities, an increase of 100 per cent). For females, the largest increase were the 25 to 29 year-olds (2 to 8 fatalities, an increase of 300 per cent).

Road Traffic Crashes in Queensland: 2002 Page 15
Table 2.3: Age and gender of fatalitiesQueensland 2002 compared to 2001
Male FemaleAge group 2002 2001 Variation 2002 2001 Variation 0-4 years 4 2 100% 3 2 50% 5-11 years 6 5 20% 4 4 0%12-16 years 6 10 -40% 4 3 33%17-20 years 35 42 -17% 20 9 122%21-24 years 32 29 10% 10 4 150%25-29 years 33 27 22% 8 2 300%30-39 years 43 33 30% 11 10 10%40-49 years 23 29 -21% 9 16 -44%50-59 years 17 13 31% 6 17 -65%60-69 years 14 21 -33% 4 9 -56%70-79 years 8 14 -43% 6 7 -14%80 years and over 6 11 -45% 9 4 125%Total 227 236 -4% 94 87 8%
2.3 Types of road users
In 2002, 42 per cent (n=135) of road fatalities in Queensland were drivers. Passengers accounted for a further 29 per cent (n=92). Drivers made up 48 per cent (n=2,642) of hospitalisations. Passengers made up 27 per cent (n=1,475) of hospitalisations. This is consistent with longer term trends.
There were 53 motorcycle rider and pillion fatalities in 2002, an increase of 83 per cent on 2001 (n=29) and 56 per cent above the average for the previous five years (n=34). There was also a 24 per cent increase in motorcycle rider and pillion hospitalised in 2002 compared with 2001. This is the largest proportional increase in motorcycle rider and pillion fatalities and hospitalisations in at least 15 years.
Figure 2.1 shows all fatalities by type of road user.
Fig. 2.1: Road toll by road user typeQueensland 2002
Drivers 42%
Passengers 29%Motorcyclists 16%
Bicyclists 2%
Pedestrians 11%
Other 0%
Tables 2.4 and 2.5 show fatalities and hospitalisations2 respectively by type of road user for 1997 to 2002.
2 In terms of level of severity in casualty outcomes, hospitalised is the category that follows fatality.

Page 16 Road Traffic Crashes in Queensland: 2002
Table 2.4: Fatalities by road user typeQueensland 1997-2002
Road user type 1997 1998 1999 2000 2001 2002No. % No. % No. % No. % No. % No. %
Drivers 158 44% 121 43% 128 41% 157 50% 150 46% 135 42%Passengers 88 24% 75 27% 87 28% 82 26% 78 24% 92 29%Motorcyclists 43 12% 25 9% 41 13% 33 10% 29 9% 53 16%Bicyclists 12 3% 9 3% 9 3% 6 2% 15 5% 5 2%Pedestrians 59 16% 48 17% 49 16% 39 12% 51 16% 37 11%Other 0 0% 1 0% 0 0% 0 0% 1 0% 0 0%Total 360 100% 279 100% 314 100% 317 100% 324 100% 322 100%
Table 2.5: Hospitalised casualties by road user typeQueensland 1997-2002
Road user type 1997 1998 1999 2000 2001 2002No. % No. % No. % No. % No. % No. %
Drivers 1841 44% 1998 45% 2145 48% 2260 47% 2607 49% 2642 48%Passengers 1131 27% 1173 27% 1199 27% 1292 27% 1412 27% 1475 27%Motorcyclists 546 13% 590 13% 532 12% 528 11% 592 11% 734 13%Bicyclists 253 6% 240 5% 241 5% 277 6% 276 5% 290 5%Pedestrians 373 9% 393 9% 385 9% 426 9% 423 8% 413 7%Other 2 0% 3 0% 1 0% 6 0% 4 0% 1 0%Total 4146 100% 4397 100% 4503 100% 4789 100% 5314 100% 5555 100%
2.4 Child road users
A total of 28 child road users were killed in 2002, an increase of 4 per cent (n=1) on 2001. Fatalities among children, who comprised 24 per cent of Queensland’s population in 2002, accounted for 9 per cent of all 2002 road fatalities.
Figure 2.2 shows fatalities among children by type of road user. Table 2.6 shows child fatalities grouped by type of road user and age sub-groupings for 2002.
Fig. 2.2: Child fatalities by road user typeQueensland 2002
Motorcyclists 7%
Bicyclists 4%
Pedestrians 18%
17 - 24 yrs 30%
25 - 59 yrs 47%
60+ yrs 15%
Passengers 71%
Drivers 0%
0 - 16 yrs 9%
Table 2.6: Child fatalities by road user type and age groupQueensland 2002
Age group Drivers Passengers Motorcyclists Bicylists Pedestrians Total
0-4 years* 0 8 0 0 0 8 5-11 years 0 6 0 0 4 1012-16 years 0 6 2 1 1 10Total 0 20 2 1 5 28* Includes fatalites of unknown age and/or gender

Road Traffic Crashes in Queensland: 2002 Page 17
In 2002, 71 per cent (n=20) of child road user fatalities were passengers, compared with 48 per cent in 2001 (n=13). All 0-4 year-old fatalities in 2002 (n=8) were passengers, compared with 60 per cent (n=3) in 2001.
In 2002, 18 per cent (n=5) of child road user fatalities were pedestrians, compared with 30 per cent in 2001 (n=8). Of the 5 children pedestrian fatalities in 2002, 80 per cent (n=4) were of primary school age, compared with 63 per cent (n=5) in 2001.
Table 2.7 shows that in cases where seat belt use is known, 27 per cent (3 of 11) of the child vehicle occupant fatalities in 2002 were not wearing seat belts. This compares with 30 per cent (46 of 155) among all vehicle occupant fatalities for 2002. In 2001, 50 per cent (4 of 8) child vehicle occupant fatalities and 30 per cent of all vehicle occupant fatalities (48 of 161) were not wearing seat belts.
Table 2.7: Non-seat belt wearing of child vehicle occupant fatalitiesQueensland 2002
Age group Seat belt not Total vehicle Proportion ofworn occupants killed * occupants unrestrained
0-4 years 0 7 0% 5-11 years 1 2 50%12-16 years 2 2 100%Total 3 11 27%All vehicle occupants 46 155 30%* Where restraint use could be determined
Table 2.8 shows that 54 per cent (n=15) of child road user fatalities in 2002 were involved in crashes that occurred between 8 am and 4 pm. A further 18 per cent (n=5) were involved in crashes that occurred after dark, with 1 per cent (n=2) involved in crashes that occurred between 6 pm and 12 midnight.
Table 2.8: Child road user fatalities by time of dayQueensland 2002
Age group 12am-6am 6am-8am 8am-2pm 2pm-4pm 4pm-6pm 6pm-12mn Total 0-4 years* 0 1 4 1 2 0 8 5-11 years 0 0 1 4 3 2 1012-16 years 3 0 3 2 2 0 10Total 3 1 8 7 7 2 28* Includes fatalites of unknown age and/or gender
Most fatalities among child road users in 2002 were caused by crashes that occurred from Monday to Friday (74 per cent), in daylight hours (85 per cent) and at mid-block locations (70 per cent). Most (76 per cent) of the units involved were cars. Compared with all road crash fatalities in 2002, fatalities among child road users were 124 per cent more likely to occur at uncontrolled intersections. See Chapter 4 for details of crashes by time of day, day of week and kind of crash.
2.5 Young adult road users
There was a total of 97 young adult road user fatalities as a result of road crashes in Queensland 2002, an increase of 15 per cent (n=13) on 2001. Young adult fatalities accounted for 30 per cent of the 2002 road toll, however young adults represented 11 per cent of Queensland’s population. In 2002, 57 per cent (n=55) of young adult road user fatalities were 17-20 years-old, compared with 60 per cent (n=51) during 2001.
Figure 2.3 shows young adult fatalities grouped by road user type. Table 2.9 shows young adult fatalities grouped by type of road user and age sub-groupings for 2002.

Page 18 Road Traffic Crashes in Queensland: 2002
Fig. 2.3: Young adult fatalities by road user typeQueensland 2002
0 - 16 yrs 9%
25 - 59 yrs 47%
60+ yrs 15%
Drivers 42%
Pedestrians 6%
Passengers 39%
Bicyclists 1%
Motorbike riders& pillions 11%
17 - 24 yrs 30%
Table 2.9: Young adult fatalities by road user type and age groupQueensland 2002
Age group Drivers Passengers Motorcyclists Bicylists Pedestrians Total
17-20 years 20 26 4 0 5 5521-24 years 21 12 7 1 1 42Total 41 38 11 1 6 97
Most (81 per cent, n=79) of the young adult road user fatalities in 2002 were vehicle occupants and just over half (52 per cent, n=41) of these were drivers. Among 21 – 24 year-olds, 64 per cent (n=21) of vehicle occupant fatalities were drivers.
Pedestrian fatalities made up for 6 per cent (n=6) of young adult road user fatalities in 2002, compared with 8 per cent (n=7) in 2001.
Table 2.10 shows that, in cases where seat belt use is known, 31 per cent (18 of 58) of the young adult vehicle occupant fatalities in 2002 were not wearing seat belts. This compares with 30 per cent (46 of 155) among all vehicle occupant fatalities for 2002. In 2001, 35 per cent (15 of 43) of the young adult road user vehicle occupant fatalities and 30 per cent (48 of 161) of all vehicle occupant fatalities were not wearing seat belts.
Table 2.10: Non-seat belt wearing by young adult vehicle occupant fatalitiesQueensland 2002
Age group Seat belt Total vehicle Proportion ofnot worn occupants killed * occupants unrestrained
17-20 years 7 36 19%21-24 years 11 22 50%Total 18 58 31%All vehicle occupants 46 155 30%* Where restraint use could be determined
Table 2.11 shows that in 2002, 28 per cent (n=13) of the 47 alcohol-tested young adult driver and motorcycle rider fatalities had blood alcohol levels of 0.05 per cent or greater, compared with 25 per cent (n=41) for all tested driver and rider fatalities. In 2001, 31 per cent (n=13) of tested young adult driver and rider fatalities had blood alcohol levels of 0.05 per cent or greater.

Road Traffic Crashes in Queensland: 2002 Page 19
Table 2.11: Alcohol involvement of young adult driver and rider fatalitiesQueensland 2002
Age group Tested BAC 0.05% or Proportiongreater
17-20 years 20 5 25%21-24 years 27 8 30%Total 47 13 28%All drivers and riders 167 41 25%
Table 2.12 and Figure 2.4 show fatalities among young adult road users by day of the week and time of day respectively. In 2002, 59 per cent (n=57) of the young adult road user fatalities were involved in crashes that occurred on a Friday, Saturday or Sunday, compared with 62 per cent (n=52) in 2001. Nearly a third (n=28) were in crashes that occurred between 6pm and midnight, and a further quarter (n=24) were in crashes that occurred between midnight and 6am.
Table 2.12: Young adult road user fatalities by day of weekQueensland 2002
Age group Sunday Monday Tuesday Wednesday Thursday Friday Saturday Total17-20 years 7 4 4 10 7 6 17 5521-24 years 6 3 4 6 2 13 8 42Total 13 7 8 16 9 19 25 97
Fig. 2.4: Young adult road user fatalities by time of dayQueensland 2002
0
2
4
6
8
10
12
14
16
18
12am-5am 6am-7am 8am-1pm 2pm-3pm 4pm-5pm 6pm-11pm
Fat
aliti
es
17-20 years 21-24 years
Most fatalities among young adult road users in 2002 were in crashes that occurred from Monday to Friday (64 per cent), after dark (53 per cent) and at mid-block locations (85 per cent). Most (70 per cent) of the units involved were cars, and just over half (53 per cent) of the crashes involved a single vehicle.
Compared with all road crash fatalities in 2002, fatalities among young adult road users were 80 per cent more likely to involve inexperience, 43 per cent more likely to involve speed, 27 per cent more likely to involve alcohol and 26 per cent more likely to occur after dark. Chapters 4 and 5 provide details about crashes and the factors that contribute to them.
2.6 Mature adult road users
There was a total of 150 mature adult road user fatalities as a result of road crashes in Queensland 2002, an increase of 2 per cent (n=3) on 2001. Mature adult fatalities accounted for 49 per cent of the 2002 road toll, however mature adults represented 49 per cent of Queensland’s population. 25 – 29 year-olds, who represented 7 per cent of the population in 2002, accounted for 17 per cent of the 2002 road toll whereas 40 – 59 year-olds, who represented 27 per cent of the population, accounted for only 17 per cent of the road toll.

Page 20 Road Traffic Crashes in Queensland: 2002
Figure 2.5 shows mature adult fatalities grouped by type of road user. Table 2.13 shows mature adult fatalities grouped by type of road user and age sub-groupings for 2002.
Fig. 2.5: Mature adult fatalities by road user typeQueensland 2002
Motorcycle 25%
Bicyclists 1%
Pedestrians 10%
0 - 16 yrs 9%
17 - 24 yrs 30%
60+ yrs 15%
25 - 59 yrs 47%
Drivers 45%
Passengers 18%
Table 2.13: Mature adult road user fatalities by type and age groupQueensland 2002
Age group Drivers Passengers Motorcyclists Bicylists Pedestrians Total
25-29 years 20 10 6 1 4 4130-39 years 21 10 19 1 3 5440-49 years 15 5 8 0 4 3250-59 years 12 2 5 0 4 23Total 68 27 38 2 15 150
Most (63 per cent, n=95) mature adult road user fatalities in 2002 were vehicle occupants and 72 per cent (n=68) of those were drivers.
Motorcyclist fatalities among mature adult road users were twice as high in 2002 (n=38) as they were in 2001 (n=19).
Table 2.14 shows that in cases where seat belt use is known, 38 per cent (23 of 61) of the mature adult vehicle occupant fatalities in 2002 were not wearing seat belts. This compares with 30 per cent (46 of 155) among all vehicle occupant fatalities for 2002. In 2002, failure to wear a seat belt was most common among 30 – 39 year-old vehicle occupant fatalities (with 47 per cent not wearing seat belts). In 2001, 29 per cent (22 of 75) of mature adult vehicle occupant fatalities and 40 per cent (8 of 20) of 30 – 39 year-olds vehicle occupant fatalities were not wearing seat belts, compared with 30 per cent (48 of 161) of all vehicle occupant fatalities who were not wearing seat belts.
Table 2.14: Non-seat belt wearing of mature adult vehicle occupant fatalitiesQueensland 2002
Age group Seat belt not Total vehicle Proportion ofworn occupants killed * occupants unrestrained
25-29 years 5 15 33%30-39 years 9 19 47%40-49 years 4 16 25%50-59 years 5 11 45%Total 23 61 38%All vehicle occupants 46 155 30%* Where restraint use could be determined

Road Traffic Crashes in Queensland: 2002 Page 21
Table 2.15 shows that 28 per cent (n=27) of the 95 alcohol-tested mature adult driver and motorcycle rider fatalities in 2002 had blood alcohol levels of 0.05 per cent or greater, compared with 25 per cent (n=41) of all driver and motorcycle rider fatalities who were tested. Among 25 – 29 year olds, 39 per cent (n=9) of tested driver and motorcycle rider fatalities had a blood alcohol level of 0.05 per cent or greater. In 2001, 28 per cent (n=25) of tested mature adult driver and motorcycle rider fatalities and 38 per cent (n=8) of tested 25 – 29 year-old driver and motorcycle rider fatalities found to have had blood alcohol levels of 0.05 per cent or greater, compared with 25 per cent (39 of 156) of all those killed who were tested.
Table 2.15: Alcohol involvement of mature adult driver and rider fatalitiesQueensland 2002
Age group Tested BAC 0.05% or Proportiongreater
25-29 years 23 9 39%30-39 years 38 9 24%40-49 years 20 5 25%50-59 years 14 4 29%Total 95 27 28%All drivers and riders 167 41 25%
Table 2.16 shows that fatalities among mature adult road users in 2002 tended to be spread throughout days of the week.
Table 2.16: Mature adult road users fatalities by day of weekQueensland 2002
Age group Sunday Monday Tuesday Wednesday Thursday Friday Saturday Total25-29 years 8 7 1 2 4 10 9 4130-39 years 11 3 7 3 11 11 8 5440-49 years 6 2 5 3 4 3 9 3250-59 years 2 3 5 2 4 2 5 23Total 27 15 18 10 23 26 31 150
Most mature adult road user fatalities in 2002 were involved in crashes that occurred from Monday to Friday (62 per cent), in daylight hours (54 per cent) and at mid-block locations (85 per cent). Just over half (54 per cent) of the units involved were cars. Compared with all fatalities in 2002, fatalities among mature adult road users were 57 per cent more likely to involve inattention, 27 per cent more likely to involve alcohol, 48 per cent more likely to involve a motorcycle and 39 per cent more likely to involve a heavy vehicle.
2.7 Senior adult road users
There was a total of 47 senior adult road user fatalities as a result of road crashes in Queensland 2002, a decrease of 29 per cent (n=19) on 2001. Senior adult fatalities accounted for 15 per cent of the 2002 road toll, however senior adults represented 16 per cent of Queensland’s population. Most (62 per cent, n=29) senior adult fatalities during 2002 were aged 70 years or older.
Table 2.17 shows fatalities among senior adults by type of road user and age sub-groupings for 2002. Figure 2.6 shows fatalities among senior adults by type of road user.

Page 22 Road Traffic Crashes in Queensland: 2002
Fig. 2.6: Senior adult fatalities by road user typeQueensland 2002
0 - 16 yrs 9%
17 - 24 yrs 30%
25 - 59 yrs 47%
Drivers 55%
Pedestrians 23%
Passengers 15%
Bicyclists 2%
Motorbike riders& pillions 4%
60+ yrs 15%
Table 2.17: Senior adult road user fatalities by type and age groupQueensland 2002
Age group Drivers Passengers Motorcyclists Bicylists Pedestrians Total
60-69 years 12 0 2 0 4 1870-79 years 8 3 0 1 2 1480 years and over 6 4 0 0 5 15Total 26 7 2 1 11 47
Most (70 per cent, n=33) senior adult road user fatalities in 2002 were vehicle occupants and 79 per cent (n=26) of those were drivers. There were 7 passenger fatalities among senior adult road users in 2002, a 56 per cent decrease on 2001 (n=9).
There were 11 fatalities among senior adult pedestrians in 2002, a 35 per cent decrease on 2001 (n=6).
Table 2.18 shows that in cases where seat belt use is known, 8 per cent (n=2) of the senior vehicle occupant fatalities in 2002 were not wearing seat belts. This compares with 30 per cent (46 of 155) among all vehicle occupant fatalities for 2002. In 2001, 21 per cent (7 of 34) of senior adult vehicle occupant fatalities were not wearing seat belts, compared with 30 per cent (48 of 161) of all vehicle occupant fatalities who were not wearing seat belts.
Table 2.18: Non-seat belt wearing of senior adult vehicle occupant fatalitiesQueensland 2002
Age group Seat belt Total vehicle Proportion ofnot worn occupants killed * occupants unrestrained
60-69 years 1 8 13%70-79 years 1 9 11%80 years + 0 8 0%Total 2 25 8%All vehicle occupants 46 155 30%* Where restraint use could be determined
Table 2.19 shows responsibility for fatal crashes involving senior adult drivers and pedestrians, compared with responsibility for fatal crashes among all drivers and pedestrians. For each crash, responsibility is indicated by the reporting police officer who makes an informed assessment as to the circumstances at the time of the crash investigation.

Road Traffic Crashes in Queensland: 2002 Page 23
Table 2.19: Responsibility for fatal crashes involving senior adult drivers or pedestriansQueensland 2002
Drivers PedestriansAge group Responsible Total % Responsible Total %60-69 years 16 23 70% 3 4 75%70-79 years 11 16 69% 2 2 100%80 years and over 5 6 83% 3 5 60%Total 32 45 71% 8 11 73%All age groups 215 355 61% 26 41 63%
Senior adult drivers were assessed most responsible in 71 per cent (n=32) of the fatal crashes in which they were involved during 2002, compared with 61 per cent (n=215) for all drivers. Drivers aged 80 years and over were assessed most responsible for 83 per cent (n=5) of the fatal crashes in which they were involved.
Senior adult pedestrians were assessed most responsible in 73 per cent (n=8) of the fatal crashes in which they were involved in 2002, compared with 63 per cent (n=26) for all pedestrians.
Table 2.20 shows senior adult road user fatalities by time of day. Most (79 per cent, n=37) occurred between 8 am and 6 pm.
Table 2.20: Senior adult road user fatalities by time of dayQueensland 2002
Age group 6am-8am 8am-10am 10am-12pm 12pm-2pm 2pm-4pm 4pm-6pm 6pm-6am Total60-69 years 2 1 3 0 3 4 5 1870-79 years 0 2 3 3 2 3 1 1480 years and over 0 5 1 0 3 4 2 15Total 2 8 7 3 8 11 8 47
Most senior adult road user fatalities in 2002 were involved in crashes that occurred from Monday to Friday (78 per cent), in daylight hours (83 per cent), and at mid-block locations (65 per cent). Compared with all fatalities in 2002, senior adult road user fatalities were 129 per cent more likely to occur at roundabouts and 69 per cent more likely to involve the disobeying of traffic rules.

Page 24 Road Traffic Crashes in Queensland: 2002
3 UNITS IN CRASHES
3.1 Introduction
This chapter looks at the various units involved in road crashes in Queensland in 2002, including vehicles and pedestrians. It compares 2002 with past trends.
There were 40,820 units involved in the 22,081 reported road traffic crashes on Queensland roads during 2002, a crash rate of 1.85 units per crash. For more severe crashes, the number of units per crash was lower (fatal 1.65 units per crash; hospitalisation 1.75 units per crash).
Table 3.1 shows the involvement of different types of units in crashes at various crash severity levels in 2002.
Table 3.1: Units involved in crashes by severity of crashQueensland 2002
Fatal Hospitalisation All crashesUnit type No. % No. % No. %Car 205 44% 4567 59% 28006 69%Utility/van 36 8% 801 10% 4479 11%4-w heel drive 49 10% 477 6% 2495 6%Rigid truck 24 5% 167 2% 896 2%Articulated truck 17 4% 111 1% 549 1%Road Train/B-double 7 1% 33 0% 157 0%Bus 6 1% 75 1% 317 1%Motorcycle 57 12% 724 9% 1482 4%Tractor 11 2% 34 0% 204 0%Tow ed device 1 0% 7 0% 30 0%Bicycle 7 1% 297 4% 901 2%Pedestrian 41 9% 419 5% 950 2%Animal - ridden 0 0% 1 0% 4 0%Animal - stock 2 0% 31 0% 171 0%Animal - other 2 0% 22 0% 84 0%Railw ay stock 2 0% 5 0% 29 0%Other 0 0% 7 0% 66 0%
Total 467 100% 7778 100% 40820 100%
In 2002:
Cars made up 44 per cent (n=205) of the units involved in fatal crashes and 69 per cent (n=28,006) of the units involved in all crashes.
Unprotected road users (motorcyclists, bicyclists and pedestrians) made up 22 per cent (n=105) of the units involved in fatal crashes and 8 per cent (n=3,333) of the units involved in all crashes.
Heavy freight vehicles made up 10 per cent (n=48) of the units involved in fatal crashes and 4 per cent (n=1,602) of the units involved in all crashes.
Table 3.2 shows the involvement of different types of units in fatal crashes from 1997 to 2002.

Road Traffic Crashes in Queensland: 2002 Page 25
Table 3.2: Units involved in fatal crashes by yearQueensland 1997-2002
Type of vehicle 1997 1998 1999 2000 2001 2002Car 286 209 232 210 243 205Utility/van 78 75 73 56 59 364-wheel drive* N/A N/A N/A 37 33 49Rigid truck 24 17 17 31 17 24Articulated truck 31 29 31 22 26 17Road Train/B-double** N/A N/A N/A 8 6 7Bus 2 7 12 5 4 6Motorcycle 44 25 44 34 29 57Tractor 6 3 5 3 4 11Towed device 0 1 1 0 0 1Bicycle 12 10 10 6 16 7Pedestrian 61 48 52 43 65 41Animal - ridden 0 2 0 0 1 0Animal - stock 5 3 1 0 2 2Animal - other 0 2 0 0 2 2Railway stock 3 4 0 2 1 2Other 3 2 5 0 2 0Total 555 437 483 457 510 467* Was included in 'Car' prior to 2000
** Was included in 'Articulated truck' prior to 2000
Figure 3.1 illustrates the relative involvement of unit types in fatal crashes, Queensland 2002.
Fig. 3.1: Unit involvement in fatal crashesQueensland 2002
Car 44%
Utility/van 8%
Rigid truck 5%
Art. truck 4%
Road Train etc. 1%
Bus 1%
Motorcycle 12%
Bicycle 1%
Pedestrian 9%Other 4%
4-wheel drive 10%
Figure 3.2 shows the involvement of major unit types in fatal crashes since 1986.
Fig. 3.2: Unit involvement trend for fatal crashesQueensland 1986-2002
0
0.5
1
1.5
2
86 87 88 89 80 91 92 93 94 95 96 97 98 99 00 01 02
Inde
x 1
= 1
986
Artic. truck Bicycle Car Motorcycle Pedestrian Rigid truck

Page 26 Road Traffic Crashes in Queensland: 2002
In 2002:
The number of motorcycles involved in fatal crashes was 97 per cent (n=28) higher than in 2001 and 62 per cent (n=22) higher than the average for the previous five years.
The number of rigid trucks involved in fatal crashes was 41 per cent (n=7) higher than in 2001 and 13 per cent (n=3) higher than the average for the previous five years.
The number of utilities and vans involved in fatal crashes was 37 per cent (n=23) lower than in 2001 and 49 per cent (n=32) lower than the average for the previous five years.
The number of pedestrians involved in fatal crashes was 37 per cent (n=24) lower than in 2001 and 24 per cent (n=13) lower than the average for the previous five years.
3.2 Fatal crash involvement by unit type
3.2.1 Cars
Table 3.3 shows the number of cars involved in fatal crashes from 1993 to 2002.
Table 3.3: Annual trends in fatal crash involvement of cars and variantsQueensland 1993-2002
1993 1994 1995 1996 1997 1998 1999 2000 2001 2002Car 313 335 347 292 286 209 229 210 243 205Utility/Van 72 85 107 84 78 75 73 56 59 364-wheel drive* N/A N/A N/A N/A N/A N/A N/A 37 33 49* Was included in 'Car' prior to 2000
In 2002, 290 cars were involved in fatal crashes, 13 per cent (n=45) less than in 2001 and 19 per cent (n=68) less than the average for the previous nine years. The car driver was considered most at fault by police assessment in 82 per cent (n=192) of the 233 fatal crashes involving a car, and 44 per cent (n=103) of these fatal crashes were single vehicle crashes.
Car drivers were considered most at fault in 68 per cent (n=192) of all fatal crashes in 2002.
Most fatal crashes involving cars in 2002 occurred at mid-block locations (81 per cent), from Monday to Friday (65 per cent) and in daylight hours (58 per cent).
Table 3.4 shows that utilities and vans had a lower fatal crash involvement rate than 4-wheel drives and other cars in 2002.
Table 3.4: Comparison of fatal crash involvement for cars and variantsQueensland 2002
% of units in fatal % of total vehicle Fatal crashVehicle type crashes registrations rate/10,000 vehiclesCar/4-wheel drive 54% 75% 1.4Utility/Van 8% 17% 0.9Total cars 62% 92% 1.3

Road Traffic Crashes in Queensland: 2002 Page 27
3.2.2 Heavy freight vehicles
Table 3.5 shows the number of heavy freight vehicles involved in fatal crashes from 1993 to 2002.
Table 3.5: Annual trends in fatal crash involvement of heavy vehiclesQueensland 1993-2002
1993 1994 1995 1996 1997 1998 1999 2000 2001 2002Rigid truck 34 31 28 24 24 17 17 31 17 24Articulated truck 41 38 49 34 31 29 31 22 26 17Road Train/B-double* N/A N/A N/A N/A N/A N/A N/A 8 6 7* Was included in 'Articulated truck' prior to 2000
In 2002, 48 heavy freight vehicles were involved in fatal crashes, 2 per cent (n=1) less than in 2001 and 20 per cent (n=12) less than the average for the previous nine years. The heavy freight vehicle driver was considered most at fault by police in 41 per cent (n=18) of the 44 fatal crashes involving a heavy freight vehicle, and 56 per cent (n=10) of these fatal crashes were single vehicle crashes.
Heavy freight vehicle drivers were considered most at fault in 6 per cent (n=18) of all fatal crashes in 2002.
Most fatal crashes involving heavy freight vehicles in 2002 occurred from Monday to Friday (84 per cent), at mid-block locations (75 per cent) and during daylight hours (66 per cent).
Compared with all fatal crashes in 2002, fatal crashes involving heavy vehicles were 50 per cent more likely to be as a result of traffic rules being disobeyed.
Table 3.6 shows that heavy freight vehicles had a fatal crash rate of 14 times that of cars in 2002.
Table 3.6: Comparison of fatal crash involvement for cars and heavy freight vehiclesQueensland 2002
% of units in fatal % of total vehicle Fatal crashVehicle type crashes registrations rate/10,000 vehiclesTotal cars 62% 92% 1.3Rigid trucks 5% 3% 3.5Articulated trucks/Road Trains/B-doubles 5% 1% 18.2
3.2.3 Buses
Table 3.7 shows the number of buses involved in fatal crashes from 1993 to 2002.
Table 3.7: Annual trends in fatal crash involvement of busesQueensland 1993-2002
1993 1994 1995 1996 1997 1998 1999 2000 2001 2002Bus 7 7 6 6 2 7 12 5 4 6
In 2002, 6 buses were involved in fatal crashes, 50 per cent (n=2) more than in 2001 and equal to the average for the previous nine years. The bus driver was considered most at fault by police in 17 per cent (n=1) of the 6 fatal crashes involving a bus, and 100 per cent (n=1) of these fatal crashes was a single vehicle crash.
Bus drivers were considered most at fault in 0.3 per cent (n=1) of all fatal crashes in 2002.
Most fatal crashes involving buses in 2002 occurred after dark (67 per cent).

Page 28 Road Traffic Crashes in Queensland: 2002
Table 3.8 shows that buses had a fatal crash rate of three times that of cars in 2002.
Table 3.8: Comparison of fatal crash involvement for cars and busesQueensland 2002
% of units in fatal % of total vehicle Fatal crashVehicle type crashes registrations rate/10,000 vehiclesTotal cars 62% 92% 1.3Buses 1% 1% 4.0
3.2.4 Motorcycles
Table 3.9 shows the number of motorcycles involved in fatal crashes from 1993 to 2002.
Table 3.9: Annual trends in fatal crash involvement of motorcyclesQueensland 1993-2002
1993 1994 1995 1996 1997 1998 1999 2000 2001 2002Motorcycle 47 46 57 44 44 25 44 34 29 57
In 2002, 57 motorcycles were involved in fatal crashes, 97 per cent (n=28) more than in 2001 and 67 per cent (n=16) more than the average for the previous nine years. In 2002, 51 motorcycle riders and 2 pillion passengers were killed in crashes. The motorcycle rider was considered most at fault by investigating police in 72 per cent (n=39) of the 54 fatal crashes involving a motorcycle, and 28 per cent (n=15) of these fatal crashes were single vehicle crashes.
Motorcycle riders were considered most at fault in 14 per cent (n=39) of all fatal crashes in 2002.
Most fatal motorcycle crashes in 2002 occurred during daylight hours (61 per cent), from Monday to Friday (56 per cent). Compared with all fatal crashes in 2002, fatal crashes involving motorcycles were 62 per cent more likely to occur at intersections, 39 per cent more likely to involve speed and 33 per cent more likely to be a result of rules being disobeying traffic rules.
Table 3.10 shows that motorcycles had a fatal crash rate of more than 5 times that of cars in 2002.
Table 3.10: Comparison of fatal crash involvement for cars and motorcyclesQueensland 2002
% of units in fatal % of total vehicle Fatal crashVehicle type crashes registrations rate/10,000 vehiclesTotal cars 62% 92% 1.3Motorcycles 12% 3% 7.3
3.2.5 Bicycles
Table 3.11 shows the number of bicycles involved in fatal crashes from 1993 to 2002.
Table 3.11: Annual trends in fatal crash involvement of bicyclesQueensland 1993-2002
1993 1994 1995 1996 1997 1998 1999 2000 2001 2002Bicycle 10 12 10 11 12 10 10 6 16 7
In 2002, 7 bicycles were involved in fatal crashes, 56 per cent (n=9) less than in 2001 and 36 per cent (n=4) less than the average for the previous nine years. In 2002, 5 pedal cyclists were killed in crashes. The bicycle rider was considered most at fault by investigating police in 50 per cent (n=3) of the six fatal crashes involving a bicycle.

Road Traffic Crashes in Queensland: 2002 Page 29
Bicycle riders were considered most at fault in 1 per cent (n=3) of all fatal crashes in 2002.
Most fatal bicycle crashes in 2002 occurred from Monday to Friday (83 per cent), during daylight hours (83 per cent) and at mid-block locations (67 per cent).
3.2.6 Pedestrians
Table 3.12 shows the number of pedestrians involved in fatal crashes from 1993 to 2002.
Table 3.12: Annual trends in fatal crash involvement of pedestriansQueensland 1993-2002
1993 1994 1995 1996 1997 1998 1999 2000 2001 2002Pedestrian 56 86 96 59 61 48 52 43 65 41
In 2002, 41 pedestrians were involved in fatal crashes, 37 per cent (n=24) less than in 2001 and 35 per cent (n=22) less than average for the previous nine years.
In 2002, there were 37 pedestrian fatalities. The pedestrian was considered most at fault in 72 per cent (n=26) of the 36 fatal crashes involving a pedestrian.
Pedestrians were considered most at fault in 9 per cent (n=26) of all fatal crashes in 2002.
Table 3.13 shows that 59 per cent (n=22) of the pedestrian fatalities occurred while attempting to cross a road. Of these, 77 per cent (n=17) occurred on roads with no traffic controls, and 10 per cent (n=2) occurred at traffic lights.
Table 3.13: Attempted action of pedestrians killed in fatal crashesQueensland 2002
Attempted action No. of fatalities % involvement in fatalpedestrian crashes
Crossing carriageway - Traffic lights 2 5%Crossing carriageway - Pedestrian Crossing 2 5%Crossing carriageway - No traffic control 17 46%Crossing carriageway - Other 1 3%Remain stationary 9 24%Walk against traffic 1 3%Walk with traffic 3 8%Work on vehicle 1 3%Playing 1 3%Total 37 100%
Most fatal crashes involving pedestrians in 2002 occurred at mid-block locations (84 per cent), from Monday to Friday (76 per cent) and after dark (57 per cent).

Page 30 Road Traffic Crashes in Queensland: 2002
4 CHARACTERISTICS OF CRASHES
4.1 Introduction
This chapter analyses crash outcomes for 2002 in terms of the crash nature, single or multi-vehicle crash types, the time of day and day of the week crashes occurred. It compares 2002 with past trends.
4.2 Overall trends
Of the 22,081 reported crashes in Queensland in 2002, 62 per cent (n=13,621) were multi-vehicle and 33 per cent (n=7,186) were single-vehicle type crashes.
Table 4.1 shows trends in fatal crashes from 1993 to 2002 in terms of the crash nature. Compared with the average for the previous nine years, in 2002 there were 38 per cent (n=21) fewer hit pedestrian type crashes, 13 per cent (n=7) fewer angle crashes, 14 per cent (n=5) fewer overturned vehicles and 49 per cent (n=5) fewer rear-end crashes that resulted in fatalities. There were 16 per cent more fatal angle crashes in 2002 (n=43) than in 2001 (n=37).
Table 4.1: Annual trends in the nature of fatal crashesQueensland 1993-2002
1993 1994 1995 1996 1997 1998 1999 2000 2001 2002Hit object 101 93 105 93 95 80 65 79 89 86Hit pedestrian 44 73 88 55 55 46 47 37 47 34Head-on 55 62 70 46 48 23 47 47 44 52Angle 71 60 50 60 54 44 36 34 37 43Overturned 53 35 47 45 25 24 27 40 38 32Rear-end 7 11 16 10 8 8 12 6 10 5Fall from vehicle* 9 10 11 13 11 8 12 12 8 10Sidesw ipe 7 10 10 9 16 11 19 13 17 13Hit parked vehicle 2 6 7 4 3 6 5 6 0 3Hit animal 7 4 3 3 5 6 1 0 4 3Other 1 4 1 0 1 1 2 1 2 2* Vehicle includes motor or pedal cycle
Figure 4.1 shows crashes in terms of overall types – single or multi-vehicle, pedestrian or others for 2002.
Fig. 4.1: Type of road crashesQueensland 2002
Single vehicle 33%
Multi vehicle 62%
Pedestrian 4%
Others 2%
Figure 4.2 compares the severity of crash outcome for single-vehicle and multi-vehicle crashes. Of the 283 fatal crashes in 2002, 46 per cent (n=131) were single-vehicle and 40 per cent

Road Traffic Crashes in Queensland: 2002 Page 31
(n=113) were multi-vehicle type crashes.
Fig. 4.2: Type of road crash by severityQueensland 2002
0%
10%
20%
30%
40%
50%
60%
70%
80%
Fatal Hospitalised Med. Treatment Minor Injury Prop. Damage
Per
Cen
t of
Cra
shes
Single vehicle Multi vehicle
Table 4.2 provides a more detailed analysis of the nature of crashes in Queensland in 2002 grouped by the severity of crash.
Table 4.2: Crashes by nature of crash and severityQueensland 2002
Fatal Hospitalisation All crashesNature of crash No. % No. % No. %Hit object 86 30% 1066 24% 4678 21%Head-on 52 18% 179 4% 451 2%Angle 43 15% 1324 30% 6867 31%Hit pedestrian 34 12% 385 9% 861 4%Overturned 32 11% 364 8% 1326 6%Sideswipe 13 5% 194 4% 1115 5%Fall from vehicle * 10 4% 204 5% 389 2%Rear-end 5 2% 538 12% 5188 23%Hit animal 3 1% 54 1% 258 1%Hit parked vehicle 3 1% 98 2% 793 4%Other 2 1% 33 1% 155 1%Total 283 100% 4439 100% 22081 100%* Vehicle includes motor or pedal cycle
In 2002:
Vehicles hitting objects accounted for 30 per cent (n=86) of fatal crashes and 21 per cent (n=4,678) of all crashes.
Head-ons accounted for 18 per cent (n=52) of fatal crashes and 2 per cent (n=451) of all crashes.
Vehicles hitting pedestrians accounted for 12 per cent (n=34) of fatal crashes and 4 per cent (n=861) of all crashes.
54 per cent (n=2,390) of crashes with hospitalisation outcomes were angle crashes or vehicles hitting objects.
55 per cent (n=12,055) of all crashes were angle or rear-end crashes.
4.3 Multi-vehicle crashes
Table 4.3 shows fatal multi-vehicle crashes from 1997 to 2002 by the nature of the crash. There were 113 fatal multi-vehicle crashes in 2002, 5 per cent (n=5) more than in 2001 and 6 per cent (n=6) more than the average for the previous five years.

Page 32 Road Traffic Crashes in Queensland: 2002
Table 4.3: Multi-vehicle fatal crashes by nature of crashQueensland 1997-2002
Nature of crash 1997 1998 1999 2000 2001 2002No. % No. % No. % No. % No. % No. %
Angle 54 43% 44 51% 36 32% 34 34% 37 34% 43 38%Head-on 48 38% 23 27% 47 41% 47 47% 44 41% 52 46%Rear-end 8 6% 8 9% 12 11% 6 6% 10 9% 5 4%Sideswipe 16 13% 11 13% 19 17% 13 13% 17 16% 13 12%Total 126 100% 86 100% 114 100% 100 100% 108 100% 113 100%
Of all fatal multi-vehicle crashes in 2002:
Angle crashes accounted for 38 per cent (n=43), consistent with the average for the previous five years.
Head-on crashes accounted for 46 per cent (n=52), compared with the average for the previous five years of 39 per cent (n=42).
Sideswipe crashes accounted for 12 per cent (n=13), compared with the average for the previous five years of 14 per cent (n=15).
Most fatal multi-vehicle crashes in 2002 occurred during daylight hours (77 per cent), from Monday to Friday (74 per cent) at mid-block locations (68 per cent).
Compared with all fatal crashes in 2002, fatal multi-vehicle crashes were 121 per cent more likely to occur at intersections controlled by Give Way/Stop signs and 89 per cent more likely to be a result of disobeying traffic rules. Fatal multi-vehicle crashes were 64 per cent less likely to involve fatigue and 31 per cent less likely to involve speed than all fatal crashes.
Table 4.4 shows hospitalisation multi-vehicle crashes by the nature of the crash from 1997 to 2002. In 2002, there were 2,235 hospitalisation multi-vehicle crashes, 7 per cent more than in 2001 (n=2,085) and 27 per cent more than the average for the previous five years (n=1,765).
Table 4.4: Multi-vehicle crashes involving hospitalisation by nature of crashQueensland 1997-2002
Nature of crash 1997 1998 1999 2000 2001 2002No. % No. % No. % No. % No. % No. %
Angle 976 63% 999 61% 1039 60% 1125 62% 1240 59% 1324 59%Head-on 165 11% 178 11% 166 10% 141 8% 140 7% 179 8%Rear-end 279 18% 325 20% 368 21% 381 21% 525 25% 538 24%Sideswipe 141 9% 145 9% 147 9% 164 9% 180 9% 194 9%Total 1561 100% 1647 100% 1720 100% 1811 100% 2085 100% 2235 100%
Of all multi-vehicle crashes that led to hospitalisations but not fatalities in 2002:
Angle crashes accounted for 59 per cent (n=1,324), compared with the average for the previous five years of 61 per cent (n=1,076).
Head-on crashes accounted for 8 per cent (n=179), compared with the average for the previous five years of 9 per cent (n=158).
Rear-end crashes accounted for 24 per cent (n=538), compared with the average for the previous five years of 21 per cent (n=376).
Sideswipe crashes accounted for 9 per cent (n=194), consistent with the average for the previous five years.

Road Traffic Crashes in Queensland: 2002 Page 33
4.4 Single vehicle crashes
Table 4.5 shows fatal single-vehicle crashes by the nature of the crash from 1997 to 2002. There were 131 fatal single-vehicle crashes in 2002, 4 per cent less than in 2001 (n=137) and 2 per cent more than the average for the previous five years (n=127).
Table 4.5: Single-vehicle fatal crashes by nature of crashQueensland 1997-2002
Nature of crash 1997 1998 1999 2000 2001 2002No. % No. % No. % No. % No. % No. %
Hit object 95 71% 80 68% 65 60% 79 58% 89 66% 86 66%Overturned 25 19% 24 20% 27 25% 40 29% 38 28% 32 24%Hit parked vehicle 3 2% 6 5% 5 5% 6 4% 0 0% 3 2%Fall from vehicle * 11 8% 8 7% 12 11% 12 9% 8 6% 10 8%Total 134 100% 118 100% 109 100% 137 100% 135 100% 131 100%* Vehicle includes motor or pedal cycle
Of all fatal single-vehicle crashes in 2002:
Vehicles hitting objects accounted for 66 per cent (n=86), consistent with the average for the previous five years.
Vehicles overturning accounted for 24 per cent (n=32), consistent with the average for the previous five years.
Most fatal single-vehicle crashes in 2002 occurred at mid-block locations (90 per cent), from Monday to Friday (55 per cent) and after dark (53 per cent). Cars comprised 71 per cent of the units involved.
Compared with all fatal crashes in 2002, fatal single-vehicle crashes were 105 per cent more likely to involve alcohol, 62 per cent more likely to involve fatigue and 62 per cent more likely to involve speed.
Table 4.6 shows hospitalisation single-vehicle crashes from 1997 to 2002 by the nature of the crash. There were 1,736 hospitalisation single-vehicle crashes in 2002, 3 per cent (n=57) more than in 2001 and 16 per cent more than the average for the previous five years (n=1,491).
Table 4.6: Single-vehicle crashes involving hospitalisation by nature of crashQueensland 1997-2002
Nature of crash 1997 1998 1999 2000 2001 2002No. % No. % No. % No. % No. % No. %
Hit object 861 64% 902 62% 907 64% 916 59% 1069 64% 1069 62%Overturned 313 23% 327 22% 292 21% 386 25% 377 22% 364 21%Hit parked vehicle 61 5% 87 6% 86 6% 96 6% 71 4% 98 6%Fall from vehicle * 120 9% 142 10% 133 9% 145 9% 162 10% 205 12%Total 1355 100% 1458 100% 1418 100% 1543 100% 1679 100% 1736 100%* Vehicle includes motor or pedal cycle
Of the hospitalisation single-vehicle crashes in 2002:
Vehicles hitting objects accounted for 62 per cent (n=1,069), consistent with the average for the previous five years.
Vehicles overturning accounted for 21 per cent (n=364), compared with the average for the previous five years of 23 per cent (n=339).

Page 34 Road Traffic Crashes in Queensland: 2002
Motorcycle riders and pillion passengers, bicyclists or other vehicle occupants falling from vehicles accounted for 12 per cent (n=205), compared with the average for the previous five years of 10 per cent (n=140).
4.5 Crashes by time of day
Table 4.7 shows fatal crashes after dark compared with all fatal crashes 1993 to 2002.
Table 4.7: Annual trends in the nature of fatal crashes occuring after darkQueensland 1993-2002
1993 1994 1995 1996 1997 1998 1999 2000 2001 2002Fatal crashes after dark 150 154 171 142 152 102 124 111 118 119All fatal crashes 357 368 408 338 321 257 273 275 296 283% after dark 42% 42% 42% 42% 47% 40% 45% 40% 40% 42%
Figure 4.3 shows fatal multi-vehicle and single-vehicle crashes by time of day in 2002. Fatal multi-vehicle crashes occurred most frequently during day-time periods, while fatal single-vehicle crashes occurred more often after dark.
Fig. 4.3: Fatal crashes by time of dayQueensland 2002
0
5
10
15
20
25
00 - 01 02 - 03 04 - 05 06 - 07 08 - 09 10 - 11 12 - 13 14 - 15 16 - 17 18 - 19 20 - 21 22 - 23
Fat
al c
rash
es
Single vehicle Multi vehicle
In 2002:
42 per cent (n=48) of fatal multi-vehicle crashes occurred during morning and afternoon commuting periods (6 to 10 am and 4 to 6 pm) compared with 23 per cent (n=30) of single-vehicle fatal crashes.
35 per cent (n=39) of fatal multi-vehicle crashes occurred from 10 am to 4 pm, compared with 24 per cent (n=31) of fatal single-vehicle crashes.
23 per cent (n=26) of fatal multi-vehicle crashes occurred after dark (between 6 pm and 6 am), compared with 53 per cent (n=70) of fatal single-vehicle crashes.
Table 4.8 shows crashes by time of day and severity of outcome for 2002.
Table 4.8: Crashes by time of day by severityQueensland 2002
Fatal Hospitalisation All crashesTime period No. % No. % No. %Midnight - 6 am 53 19% 430 10% 1822 8%6 am - 10 am 44 16% 755 17% 4121 19%10 am - 4 pm 77 27% 1629 37% 8144 37% 4 pm - 6 pm 43 15% 692 16% 3659 17% 6 pm - midnight 66 23% 933 21% 4335 20%Total 283 100% 4439 100% 22081 100%

Road Traffic Crashes in Queensland: 2002 Page 35
A higher proportion of fatal crashes occur after dark, with 42 per cent (n=119) of fatal crashes occurring after dark (6 pm to 6 am), compared with 28 per cent (n=6,157) of all crashes. Between midnight and 6 am the proportion of fatal crashes (19 per cent) was more than double that of all crashes (8 per cent). In the middle of the day, the reverse was the case, with 27 per cent (n=77) of fatal crashes occurring between 10 am and 4 pm, compared with 37 per cent (n=8,144) of all crashes.
4.6 Crashes by day of week
Table 4.9 shows fatal crashes by day of week from 1993 to 2002. Table 4.10 shows fatal crashes by day of the week and severity of outcome for 2002.
Table 4.9: Annual trends in fatal crashes by day of weekQueensland 1993-2002
1993 1994 1995 1996 1997 1998 1999 2000 2001 2002Monday 41 42 45 36 30 31 33 31 30 29Tuesday 41 43 43 48 44 25 24 36 39 33Wednesday 45 54 58 34 45 32 29 35 36 32Thursday 45 50 52 46 42 36 35 41 42 39Friday 59 65 74 53 56 39 57 46 46 53Saturday 65 59 67 60 64 55 50 49 61 51Sunday 61 55 69 61 40 39 45 37 42 46
Table 4.10: Crashes by day of week by severityQueensland 2002
Fatal Hospitalisation All crashesDay of week No. % No. % No. %Monday 29 10% 556 13% 2917 13%Tuesday 33 12% 582 13% 3068 14%Wednesday 32 11% 621 14% 3153 14%Thursday 39 14% 635 14% 3294 15%Friday 53 19% 739 17% 3866 18%Saturday 51 18% 726 16% 3273 15%Sunday 46 16% 580 13% 2510 11%Total 283 100% 4439 100% 22081 100%
More severe crashes were more likely to occur on Friday, Saturday or Sunday, with 53 per cent (n=150) of fatal crashes and 46 per cent (n=2,045) of hospitalisation crashes occurring on these days. Fewest fatal crashes occurred on Mondays (10 per cent) and fewest crashes overall occurred on Sundays (11 per cent).
Figure 4.4 shows fatal crashes by time of day and day of week for 2002. Crashes generally peaked in the late afternoon hours in 2002.

Page 36 Road Traffic Crashes in Queensland: 2002
Fig. 4.4: Fatal crashes by time of day & day of weekQueensland 2002
0
1
2
3
4
5
6
7
8
9
10
Monday Tuesday Wednesday Thursday Friday Saturday Sunday
Fat
al c
rash
es
4.7 Spatial location of crashes
Table 4.11 shows location and severity of crashes for 2002. Most crashes occurred in cities. Crashes in the greater Brisbane urban area accounted for 46 per cent (n=10,051) of all reported crashes, and crashes in provincial cities accounted for a further 32 per cent (n=7,082).
Table 4.11: Location of crashes by severityQueensland 2002
Fatal Hospitalisation All crashesLocation No. % No. % No. %Brisbane City 36 13% 1130 25% 6241 28%Rest of BSD* 42 15% 725 16% 3810 17%Provincial cities 72 25% 1359 31% 7082 32%Rest of state 133 47% 1225 28% 4948 22%Total 283 100% 4439 100% 22081 100%* Brisbane Statistical Division
While there were more crashes in urban areas in 2002, there were more fatal crashes outside urban areas; 47 per cent (n=133) of fatal crashes occurred outside urban areas, compared with 22 per cent (n=4,948) of all crashes. While 28 per cent (n=6,241) of all crashes occurred in Brisbane City in 2002, only 13 per cent (n=36) of fatal crashes occurred in Brisbane City.
Table 4.12 shows fatal crashes by location 1997 to 2002.
Table 4.12: Location of fatal crashesQueensland 1997-2002
Location 1997 1998 1999 2000 2001 2002No. % No. % No. % No. % No. % No. %
Brisbane City 39 12% 34 13% 39 14% 35 13% 39 13% 36 13%Rest of BSD* 49 15% 29 11% 40 15% 38 14% 41 14% 42 15%Provincial cities 87 27% 78 30% 69 25% 72 26% 76 26% 72 25%Rest of state 146 45% 116 45% 125 46% 130 47% 140 47% 133 47%Total 321 100% 257 100% 273 100% 275 100% 296 100% 283 100%* Brisbane Statistical Division
Of all fatal crashes in 2002:
13 per cent (n=36) occurred in Brisbane City, consistent with the average for the previous five years.
15 per cent (n=42) occurred in the remainder of the greater Brisbane urban area, compared with the average for the previous five years of 14 per cent (n=39).

Road Traffic Crashes in Queensland: 2002 Page 37
Table 4.13 shows location and severity of crashes by district.
Table 4.13: Location of crashes by severityQueensland 2002
Main Roads Fatal Hospitalisation All crashesDistrict location No. % No. % No. %Barcaldine 0 0% 22 0% 75 0%Bundaberg 26 9% 242 5% 1054 5%Cairns 19 7% 297 7% 1316 6%Cloncurry 6 2% 71 2% 231 1%Emerald 2 1% 63 1% 210 1%Gympie 37 13% 434 10% 2457 11%Mackay 17 6% 143 3% 701 3%Metropolitan Brisbane 65 23% 1680 38% 9184 42%Nerang 34 12% 632 14% 2822 13%Rockhampton 14 5% 211 5% 998 5%Roma 9 3% 42 1% 135 1%Toowoomba 24 8% 267 6% 1463 7%Townsville 22 8% 242 5% 1141 5%Warwick 8 3% 93 2% 294 1%Total 283 100% 4439 100% 22081 100%
Metropolitan Brisbane, Nerang and Gympie districts accounted for 66 per cent (n=14,463) of reported crashes and 48 per cent (n=136) of fatal crashes in 2002. Metropolitan Brisbane experienced more crashes than any other district and more fatal crashes than any other district. In numbers of fatal crashes, Brisbane was followed by Gympie and then Nerang.

Page 38 Road Traffic Crashes in Queensland: 2002
5 FACTORS CONTRIBUTING TO CRASHES
5.1 Introduction
This chapter explores the factors that contribute to crashes and their severity, including alcohol, speed, fatigue and failure to wear seat belts.
A crash is a complex combination of contributing and causal factors. This means that a factor is one of many that have occurred and have contributed to a crash event. A road crash event has one or more units involved, and each unit involved may be assigned contributing factors.
Table 5.1 provides an indicative ranking of factors contributing to crashes in 2002 as assessed by police. Police assessments are normally collected within 24 hours of a crash and later more comprehensive investigations can lead to a modified assessment.
Table 5.1: Assessed contributing factors to crashes*Queensland 2002
Fatal crashes All reported crashesNo. Proportion of No. Proportion of all
fatal crashes reported crashesDisobeyed traffic rules** 96 34% 8653 39%Alcohol/drugs 82 29% 2840 13%Inattention 71 25% 6946 31%Inexperience 54 19% 4746 21%Speed 48 17% 1154 5%Fatigue 42 15% 1141 5%Other 26 9% 2961 13%Age 22 8% 1230 6%Other driver conditions*** 17 6% 1305 6%Negligence 13 5% 478 2%Rain/wet road 10 4% 1569 7%Road conditions 6 2% 987 4%Vehicle defects 5 2% 669 3%No street lighting 3 1% 76 0%Total crashes 283 100% 22081 100%* More than one contributing factor could be attributed to a crash and therefore this table may not reflect crash totals
** Disobeyed traffic rules does not include Alcohol/Drugs, Inexperience, Speed and Inattention
*** Driver conditions do not include Inattention, Negligence, Inexperience, Fatigue or Age
Based on police assessments, in 2002:
Failure to obey traffic rules contributed in 34 per cent (n=96) of fatal crashes and 39 per cent (n=8,653) of all crashes.
Alcohol or drug use contributed in 29 per cent (n=82) of fatal crashes and 13 per cent (n=2,840) of all crashes.
Inattention contributed in 25 per cent (n=71) of fatal crashes and 31 per cent (n=6,946) of all crashes.
Speed contributed in 17 per cent (n=48) and fatigue contributed in 15 per cent (n=42) of fatal crashes. Speed and fatigue each contributed in 5 per cent (n=1,154 and n=1,141 respectively) of all crashes.
Other factors (such as a medical condition, some atmospheric and lighting conditions) contributed in 9 per cent (n=26) of fatal crashes and 13 per cent (n=2,961) of all crashes.

Road Traffic Crashes in Queensland: 2002 Page 39
Fatigue and negligence are difficult to assess and may be under or over-stated in the data.
5.2 Trends
Table 5.2 shows factors contributing to fatal crashes as assessed by police from 1993 to 2002.
Table 5.2: Annual trends in contributing circumstances in fatal crashesQueensland 1993-2002
1993 1994 1995 1996 1997 1998 1999 2000 2001 2002Disobeyed traffic rules* 125 125 128 115 110 73 97 95 83 96Alcohol/drugs 98 103 132 101 101 86 85 94 83 82Inexperience 57 82 102 91 95 62 52 41 72 54Speed 80 51 46 48 51 30 40 50 50 48Other driver conditions** 51 42 50 32 26 31 24 27 25 17Age 35 36 41 30 28 25 28 33 24 22Rain/wet road 25 35 41 22 16 29 10 14 13 10Negligence 15 31 25 14 17 19 18 18 18 13Inattention 15 24 41 26 26 28 47 38 48 71Road conditions 35 23 29 26 9 14 15 13 10 6Other 21 23 41 31 36 22 33 35 41 26Vehicle defects 21 11 17 13 7 13 14 11 7 5Fatigue 50 34 48 54 45 30 26 28 40 42No street lighting 3 6 7 5 9 9 1 4 3 3* Disobeyed traffic rules does not include Alcohol/Drugs, Inexperience, Speed and Inattention
** Driver conditions do not include Inattention, Negligence, Inexperience, Fatigue or Age
Failure to obey traffic rules contributed in 34 per cent (n=96) of fatal crashes in 2002, compared with 28 per cent (n=83) in 2001, and the average for the previous nine years of 33 per cent (n=106).
5.3 Alcohol and road fatalities
Alcohol use is considered to be a substantial contributor to more severe crashes, especially those involving a fatality (see Table 5.1). Drivers, motorcycle and bicycle riders and pedestrians affected by alcohol play a major role in road crashes.
Table 5.3 shows the extent of post-mortem testing of driver and motorcycle rider fatalities from 1997 to 2002, and the blood alcohol content (BAC) of those tested.
Table 5.3: Blood alcohol content of driver and motorcycle rider fatalities*Queensland 1997-2002
1997 1998 1999 2000 2001 2002No. % No. % No. % No. % No. % No. %
Untested 26 13% 15 10% 21 12% 22 12% 21 12% 19 10%Tested 172 87% 129 90% 151 88% 165 88% 157 88% 167 90%Total fatalities 198 100% 144 100% 172 100% 187 100% 178 100% 186 100%BAC results for those testedNil 113 66% 87 67% 113 75% 106 64% 113 72% 120 72%0.01 - 0.04 13 8% 8 6% 6 4% 13 8% 5 3% 6 4%0.05 - 0.14 21 12% 15 12% 15 10% 13 8% 14 9% 15 9%0.15 - 0.24 15 9% 14 11% 8 5% 23 14% 23 15% 23 14%0.25 and over 10 6% 5 4% 9 6% 10 6% 2 1% 3 2%
BAC 0.05% or more 46 27% 34 26% 32 21% 46 28% 39 25% 41 25%BAC 0.15% or more 25 15% 19 15% 17 11% 33 20% 25 16% 26 16%* Based on post-mortem tests

Page 40 Road Traffic Crashes in Queensland: 2002
Figure 5.1 shows blood alcohol testing results for all drivers and motorcycle rider fatalities in crashes in 2002.
Fig. 5.1: Blood alcohol level for driver & motorcycle rider fatalities, Queensland 2002
Nil BAC 65%
Not tested 10%
.01-.04% BAC 13%
.15-.24% BAC 49%
.25% + BAC 6%
Positive BAC 25%
.05-.14% BAC 32%
Of 186 driver and motorcycle rider fatalities in 2002:
90 per cent (n=167) were given a post-mortem blood alcohol test.
25 per cent (n=41) of those tested had a BAC of 0.05 per cent or greater.
16 per cent (n=26) of those tested had a BAC of 0.15 per cent or greater (three times the legal limit for most open license holders).
Table 5.4 shows the age group of drivers and motorcycle rider fatalities in crashes by year and age group who were tested and who had a BAC of 0.05 per cent or greater for the period 1997 to 2002.
Table 5.4: Age of drivers and motorcycle rider fatalities with a BAC of 0.05% or greater*Queensland 1997-2002
Age group 1997 1998 1999 2000 2001 2002No. % No. % No. % No. % No. % No. %
0 - 16 years** 2 4% 0 0% 2 6% 0 0% 1 3% 0 0%17 - 24 years 14 30% 11 32% 7 22% 8 17% 13 33% 13 32%25 - 59 years 30 65% 22 65% 21 66% 37 80% 25 64% 27 66%60 years and over 0 0% 1 3% 2 6% 1 2% 0 0% 1 2%Total 46 100% 34 100% 32 100% 46 100% 39 100% 41 100%* Based on post-mortem tests ** Includes casualties of unkown age
17 – 24 year-old drivers and motorcycle riders represented 32 per cent (n=13) of fatalities with a BAC of 0.05 per cent or greater in 2002, compared with the average for the previous five years of 28 per cent (n=11). 25 to 59 year-olds represented 66 per cent (n=27), compared with the average for the previous five years of 69 per cent (n=27).
Table 5.5 shows fatalities for the main controller road user types (drivers, motorcycle riders, bicyclists and pedestrians) who had a BAC of 0.05 per cent or greater from 1997 to 2002.
Table 5.5: Road user fatalities with BAC of 0.05% or greater*Queensland 1997-2002
Roaduser type 1997 1998 1999 2000 2001 2002No. % No. % No. % No. % No. % No. %
Bicycle rider 0 0% 0 0% 0 0% 0 0% 1 2% 0 0%Driver 38 57% 29 53% 26 54% 36 62% 34 62% 30 56%Motorcycle rider 8 12% 5 9% 6 13% 10 17% 5 9% 11 20%Pedestrian 21 31% 21 38% 16 33% 12 21% 15 27% 13 24%Total 67 100% 55 100% 48 100% 58 100% 55 100% 54 100%* Based on post-mortem tests

Road Traffic Crashes in Queensland: 2002 Page 41
In 2002:
Drivers represented 56 per cent (n=30) of fatalities tested who had a BAC of 0.05 per cent or greater, compared with the average for the previous five years of 58 per cent (n=33).
Pedestrians represented 24 per cent (n=13) of fatalities tested who had a BAC of 0.05 per cent or greater, compared with the average for the previous five years of 30 per cent (n=17).
Motorcycle riders represented 20 per cent (n=11) of fatalities tested who had a BAC of 0.05 per cent or greater, compared with 9 per cent (n=5) in 2001 and the average for the previous five years of 12 per cent (n=7).
Figure 5.2 shows that single vehicle crashes, crashes after dark and crashes on weekends were more likely to be alcohol-related than other crashes in 2002.
Fig. 5.2: Crashes involving alcohol by selected variablesQueensland 2002
0%
20%
40%
60%
80%
100%
120%
140%
160%
Single vehicle After dark Weekends
Per
cen
t of c
rash
es
Fatal crashes Alcohol related fatal crashes
5.4 Speed as a contributing factor to fatalities
Table 5.6 shows the number of crashes in which speed was assessed as a contributing factor in terms of crash severity from 1997 to 2002.
Table 5.6: Severity of crashes to which speed was a contributing factorQueensland 1997-2002
Severity 1997 1998 1999 2000 2001 2002No. % No. % No. % No. % No. % No. %
Fatal 51 6% 30 4% 40 5% 50 5% 50 5% 48 4%Hospitalisation 177 22% 215 25% 211 25% 240 25% 281 26% 294 25%Other injury 228 28% 233 27% 210 25% 259 27% 309 28% 288 25%Property damage 348 43% 378 44% 393 46% 401 42% 449 41% 524 45%Total 804 100% 856 100% 854 100% 950 100% 1089 100% 1154 100%
Speed was a contributing factor in 17 per cent (n=48) of fatal crashes in 2002, compared with the average for the previous five years of 15 per cent (n=50). Speed ranked fifth highest contributing factor to fatal crashes overall during 2002 (see Table 5.1)
Table 5.7 shows the number of fatalities by age group for which speed was a contributing factor for the period 1997 to 2002.

Page 42 Road Traffic Crashes in Queensland: 2002
Table 5.7: Age of fatalities in crashes to which speed was a contributing factorQueensland 1997-2002
Age group 1997 1998 1999 2000 2001 2002No. % No. % No. % No. % No. % No. %
0 - 16 years** 1 2% 4 12% 5 11% 2 4% 2 4% 0 0%17 - 24 years 30 52% 19 56% 13 30% 19 33% 22 41% 25 46%25 - 59 years 27 47% 11 32% 24 55% 36 63% 30 56% 28 52%60 years and over 0 0% 0 0% 2 5% 0 0% 0 0% 1 2%Total 58 100% 34 100% 44 100% 57 100% 54 100% 54 100%
46 per cent (n=25) of speed-related fatalities in 2002 were 17 – 24 year-olds, compared with 41 per cent (n=22) in 2001 and the average for the previous five years of 43 per cent (n=21).
5.5 Fatigue as a contributing factor
Table 5.8 shows fatal crashes in which fatigue was considered to be a contributing factor from 1997 to 2002. Because fatigue is difficult to determine, particularly in more severe crashes, for the purpose of this report, the numbers based on police assessment have been augmented to include single-vehicle crashes (such as roll-overs or hit objects), on open roads, during high-risk times for fatigue (that is 2 pm to 4 pm and 10 pm to 6 am). While this approach may still understate the contribution of fatigue (it ignores crashes at other times of day, crashes in urban areas and multi-vehicle crashes such as head-on crashes unless positively identified as fatigue-related by police), it does isolate the common factors of fatigue-related crashes and will allow for consistent analysis over time.
Table 5.8: Severity of fatigue related crashes*Queensland 1997-2002
Severity 1997 1998 1999 2000 2001 2002No. % No. % No. % No. % No. % No. %
Fatal 45 4% 30 3% 26 2% 28 2% 40 3% 42 4%Hospitalisation 335 28% 316 28% 289 26% 295 26% 349 30% 335 29%Other injury 343 29% 300 27% 351 31% 347 30% 334 29% 333 29%Property damage 458 39% 474 42% 461 41% 479 42% 423 37% 431 38%Total 1181 100% 1120 100% 1127 100% 1149 100% 1146 100% 1141 100%* Single vehicle-type crashes in 100km/h and over zones during typical fatigue times (2-4pm, 10pm-6am) or where police considered fatigue was a contributing factor
There were 42 fatigue-related fatal crashes in 2002, 5 per cent more (n=2) than in 2001 and 24 per cent (n=8) more than the average for the previous five years.
Table 5.9 shows fatigue-related fatalities by age 1997 to 2002. Table 5.9: Fatalities by age group: fatigue related crashes*
Queensland 1997-2002
Age group 1997 1998 1999 2000 2001 2002No. % No. % No. % No. % No. % No. %
0 - 16 years** 5 10% 2 6% 6 18% 1 3% 6 13% 5 10%17 - 24 years 20 42% 18 50% 7 21% 14 36% 10 22% 12 24%25 - 59 years 21 44% 15 42% 19 58% 18 46% 21 46% 27 55%60 years and over 2 4% 1 3% 1 3% 6 15% 9 20% 5 10%Total 48 100% 36 100% 33 100% 39 100% 46 100% 49 100%* Single vehicle-type crashes in 100km/h and over zones during typical fatigue times (2-4pm, 10pm-6am) or where police considered fatigue was a contributing factor
** Includes casualties of unkown age
In 2002:
55 per cent (n=27) of fatigue-related fatalities were 25 – 59 year-olds, compared with the average for the previous five years of 48 per cent (n=19).

Road Traffic Crashes in Queensland: 2002 Page 43
24 per cent (n=12) of fatigue-related fatalities were 17 – 24 year-olds, compared with 22 per cent (n=10) in 2001 and the average for the previous five years of 35 per cent (n=14).
Figure 5.3 shows all fatigue-related crashes by day of week for 2002.
Fig. 5.3: Fatigue-related crashes by day of weekQueensland 2002
0%
5%
10%
15%
20%
25%
Monday Tuesday Wednesday Thursday Friday Saturday Sunday
Per
cen
t of c
rash
es
Fatigue-related crashes were most likely to occur on Friday, Saturday and Sunday in 2002.
5.6 Seat belt usage
Figure 5.4 shows seat belt usage of vehicle occupant casualties in terms of crash severity for 2002. The greater the severity of a crash, the higher the proportion of unrestrained casualties.
Fig. 5.4: Proportion of unrestrained vehicle occupant casualities, Queensland 2002
0%
5%
10%
15%
20%
25%
Fatal Hospitalised Med. treatment Minor injury
Per
cen
t unr
estr
aine
d
2002 Average 1997-2001
In 2002:
22 per cent (n=64) of all vehicle occupant casualties in fatal crashes were not wearing seat belts, consistent with the average for the previous five years.
8 per cent (n=342) of all vehicle occupant casualties in hospitalisation crashes were not wearing seat belts, consistent with the average for the previous five years.

Page 44 Road Traffic Crashes in Queensland: 2002
Table 5.10 shows seat belt usage for vehicle occupant fatalities from 1997 to 2002.
Table 5.10: Fatalities by seat belt usageQueensland 1997-2002
1997 1998 1999 2000 2001 2002No. % No. % No. % No. % No. % No. %
Occupants:Not determined 88 36% 62 32% 66 31% 63 27% 65 29% 65 30%Total determined 155 64% 131 68% 145 69% 172 73% 161 71% 155 70%Total vehicle occupants 243 100% 193 100% 211 100% 235 100% 226 100% 220 100%Of those occupants where restraint use could be determined: Restrained 110 71% 97 74% 98 68% 115 67% 114 71% 109 70%Unrestrained 45 29% 34 26% 47 32% 57 33% 47 29% 46 30%Drivers:Not determined 49 31% 37 31% 36 29% 39 25% 45 30% 38 29%Total determined 107 69% 83 69% 89 71% 116 75% 105 70% 93 71%Total drivers 156 100% 120 100% 125 100% 155 100% 150 100% 131 100%Of those drivers where restraint use could be determined:Restrained 75 70% 63 76% 65 73% 77 66% 80 76% 65 70%Unrestrained 32 30% 20 24% 24 27% 39 34% 25 24% 28 30%Passengers:Not determined 39 45% 25 34% 30 35% 24 30% 20 26% 27 30%Total determined 48 55% 48 66% 56 65% 56 70% 56 74% 62 70%Total vehicle passengers 87 100% 73 100% 86 100% 80 100% 76 100% 89 100%Of those passengers where restraint use could be determined:Restrained 35 73% 34 71% 33 59% 38 68% 34 61% 44 71%Unrestrained 13 27% 14 29% 23 41% 18 32% 22 39% 18 29%
In 2002:
Seat belt use could not be determined for 30 per cent (n=65) of the driver and passenger fatalities.
When restraint use was determined 30 per cent (n=46) of the driver and passenger fatalities were not wearing seat belts, consistent with the average for the previous five years.
Table 5.11 shows vehicle occupant fatalities who weren’t wearing seat belts, compared with all vehicle occupant fatalities, by age from 1997 to 2002.
Table 5.11: Unrestrained vehicle occupant fatalities by age groupQueensland 2002 compared with average (1997-2001)*
2002 Average 1997-2001Age group Unrestrained Total % Unrestrained Total %0 - 16 years** 3 11 27% 5 13 38%17 - 24 years 18 58 31% 12 42 29%25 - 39 years 14 34 41% 15 36 42%40 - 59 years 9 27 33% 8 33 24%60 years and over 2 25 8% 5 29 17%Total 46 155 30% 45 153 29%* Where restraint use could be determined ** Includes casualties of unkown age
In 2002:
41 per cent (n=14) of the 25 – 39 year-old vehicle occupant fatalities were not wearing a seat belt.

Road Traffic Crashes in Queensland: 2002 Page 45
33 per cent (n=9) of the 40 – 59 year-old vehicle occupant fatalities were not wearing a seat belts.
27 per cent (n=3) of the under 17 year-old vehicle occupant fatalities were not wearing a seat belts, compared with the average for the previous five years of 38 per cent (n=5).
8 per cent (n=2) of the over 59 year-old vehicle occupant fatalities were not wearing a seat belts, compared with the average of the previous five years of 17 per cent (n=5).
Figure 5.5 compares the proportion of unrestrained vehicle occupant fatalities in 2002 with the proportional average of the previous five years by age group.
Fig. 5.5: Proportion of unrestrained vehicle occupant fatalities by age, Queensland 2002
0%
5%
10%
15%
20%
25%
30%
35%
40%
45%
0 - 16 years** 17 - 24 years 25 - 39 years 40 - 59 years 60 years and over
Per
cen
t unr
estr
aine
d
2002 Average 1997-2001


Appendix 1: Glossary Page A1-1
APPENDIX 1 GLOSSARY Road users are defined as: drivers of motor vehicles motorcycle riders bicycle riders horse riders passengers of the above pedestrians
A vehicle is a device upon which any person or property may be transported or drawn upon a road.
A unit is the classification into which all road conveyances are categorised, e.g. car, bus, truck, pedestrian, animal etc.
A road traffic crash is an incident reported to police which resulted from the movement of at least one road vehicle on a road and involving death or injury to any person, or property damage.
A property damage only crash is a crash where at least one vehicle is towed away or the damage cost is greater than $2,500 (or $1,000 prior to 1 December 1991).
An angle crash is a crash in which vehicles collide at any angle other than side swipe, rear-end or head-on.
The road toll is the number of fatalities (excluding injuries) resulting from road traffic crashes.
A fatality is recorded when any person dies within 30 days as a result of injuries sustained in a road traffic crash.
An injury is recorded when any person involved in a road traffic crash: (a) requires hospitalisation; (b) requires medical treatment; or (c) receives a minor injury (i.e. first aid treatment only).
A serious injury is any person involved in a road traffic crash: (a) requires hospitalisation (i.e. is admitted to hospital) or (b) requires medical treatment.
A casualty is a fatality or injury.
A serious casualty is a fatality or hospitalised casualty.
A single vehicle crash is an incident in which only one moving vehicle is involved in the initial event, either in a collision (e.g. with a roadside pole) or a non-collision (e.g. a roll over). A collision with a parked car is considered a single vehicle crash because the characteristics of this type of crash are similar to crashes where a vehicle collides with a roadside object.
A multi-vehicle crash is an incident which involves an initial collision between any two (or more) moving vehicles.
A blood alcohol content (BAC) reading is a measure of the proportion of alcohol in a person’s blood. This reading is typically obtained using a breathalyser or by conducting a blood test. Where a breathalyser has been used the results have been recorded as a proportion of alcohol in a person's blood. Where possible, a post-mortem blood analysis is carried out on a fatally injured road user.
A controller is a road user who exercises control over their movements at the time of a crash (i.e. driver, rider or pedestrian). Passengers are not regarded as controllers.
A child road user is a person aged under 17 years.
A young adult is a person aged from 17 to 24 years.
A mature adult is a person aged from 25 to 59 years.
A senior adult is a person aged 60 years or over.
Cars include 4-wheel drives, utilities and vans.
Heavy freight vehicle is a rigid truck, articulated truck or a road train/bdouble/triple.
A vehicle occupant is a person travelling in a car, bus, truck or tractor at the time of a crash.
A driver is any person in control of a car, truck, bus or tractor at the time of a crash. (Includes motorised wheel chair, excludes controllers of motorcycles, mopeds or bicycles)
A passenger is a person other than the driver travelling in or on a car, truck, bus or tractor.
A rider is any person in control of a motorcycle, moped, or bicycle.
A motorcyclist is either the rider or pillion passenger of a motorcycle.
A pedal cyclist is either the rider or pillion passenger of a bicycle.
A pedestrian is either an ordinary pedestrian or a person on skates, rollerblades or a skateboard.
A peak commuter period refers to that time of day when most commuters are either travelling to or returning from work. For this report it is considered to cover the periods from 6 am to 10 am and 4 pm to 6pm, Monday to Friday.
The provincial cities are: Bundaberg, Cairns, Caloundra, Charters Towers, Cooloola, Gladstone, Gold Coast, Hervey Bay, Mackay, Maryborough, Mount Isa, Rockhampton, Thuringowa, Toowoom-ba and Townsville.


Appendix 2: Key summary tables Page A2- 1
APPENDIX 2 KEY SUMMARY TABLES In this section, major characteristics of road traffic crashes in Queensland during 2002 are presented as a series of more detailed cross-tabulations from the Queensland Road Crash System maintained by Queensland Transport’s Land Transport and Safety Division. A list of summary tables contained in this section is presented below.
Table
No.Details
Page
No.
1 Casualties by road user type, 1997 to 2002 2
2A Casualties by road user type and age group: males killed 2002 3
2B Casualties by road user type and age group: females killed 2002 3
2C Casualties by road user type and age group: persons killed 2002 4
2D Casualties by road user type and age group: males injured 2002 4
2E Casualties by road user type and age group: females injured 2002 5
2F Casualties by road user type and age group: persons injured 2002 5
3A Casualties by road user type, age group and sex : persons killed 2002 6
3B Casualties by road user type, age group and sex : persons injured 2002 7
4A Restraint details by age group: persons killed 2002 8
4B Restraint details by age group: persons injured 2002 8
5A Seat belt usage by age group: persons killed 2002 9
5B Seat belt usage by age group: persons seriously injured 2002 9
6 Seat belt and helmet wearing details by injury severity 2002 10
7 Casualties by road user type and most severe injury sustained: persons killed 2002 11
8A Controller most responsible for a crash by road user type and age group: males only 2002 12
8B Controller most responsible for a crash by road user type and age group: females only 2002 13
8C Controller most responsible for a crash by road user type and age group: all persons 2002 14
9A Blood alcohol analysis of controllers killed in crashes: 2002 15
9B Blood alcohol analysis of controllers injured in crashes: 2002 15
10A Blood alcohol analysis of controllers killed in crashes by age group: 2002 16
10B Blood alcohol analysis of controllers not killed but may have been injured in crashes by age group: 2002 16
11A Crashes by time of day and day of week: total crashes 2002 17
11B Crashes by time of day and day of week: casualty crashes 2002 17
11C Crashes by time of day and day of week: persons killed 2002 18
11D Crashes by time of day and day of week: persons injured 2002 18
12 Casualties by road user, vehicle type and severity: 2002 19
13 Crashes by type of unit most responsible and crash severity: 2002 20
14 Single vehicle crashes by vehicle type and crash severity: 2002 21
15 Crashes and casualties by roadway feature and traffic control: 2002 21
16A Crashes by roadway feature and crash severity: Queensland 2002 22
16B Crashes by roadway feature and crash severity: Brisbane Statistical Division 2002 22
17 Crashes and casualties by location, crash severity and sex: 2002 23
18 Crashes and casualties by Local Government Area: 2002 24 to 26
19 Annual road toll, population and motor vehicles on register: Queensland 1953 to 2002 27
20 Annual trend data: Queensland 1993-2002 28 to 34

Page A2-2 Appendix 2: Key summary tables
Table 1: Road traffic casualties by road user typeQueensland 1997-2002
Car, Truck, Bus Motorcycle Driver Passenger Rider Pillion
Year K H M K H M K H M K H M1997 157 1832 3328 88 1128 1891 40 504 406 3 42 441998 120 1991 3281 75 1169 1840 23 535 383 2 55 351999 125 2135 3316 87 1195 1841 39 490 395 2 42 232000 155 2252 3476 82 1287 1862 30 490 357 3 38 282001 150 2592 4343 77 1407 2300 28 543 465 1 49 402002 131 2634 4273 90 1473 2087 51 684 438 2 50 24
Pedestrian Pedal Cyclist Other All Road UsersYear K H M K H M K H M K H M1997 59 373 375 12 253 420 1 14 18 360 4146 64821998 48 393 336 9 240 427 2 14 22 279 4397 63241999 49 385 319 9 241 336 3 15 22 314 4503 62522000 39 426 349 6 277 356 2 19 18 317 4789 64462001 51 423 343 15 276 372 2 24 21 324 5314 78842002 37 413 334 5 290 358 6 11 30 322 5555 7544
Legend:K = Killed, H = Admitted to hospital, M = Received medical treatment

Appendix 2: Key summary tables Page A2- 3
Table 2A: Road traffic casualties by road user type and age groupQueensland 2002
Males killed by age goupRoad user type 0-4 5-16 17-20 21-25 26-29 30-39 40-49 50-59 60 & Not
years years years years years years years years years stated TotalDrivers 0 0 14 15 17 17 9 8 18 0 98 % 0.0% 0.0% 14.3% 15.3% 17.3% 17.3% 9.2% 8.2% 18.4% 0.0% 100.0%Passengers 4 6 17 9 6 4 3 0 3 0 52 % 7.7% 11.5% 32.7% 17.3% 11.5% 7.7% 5.8% 0.0% 5.8% 0.0% 100.0%Pedestrians 0 3 0 3 1 2 4 4 5 0 22 % 0.0% 13.6% 0.0% 13.6% 4.5% 9.1% 18.2% 18.2% 22.7% 0.0% 100.0%Motorcycle riders 0 2 4 9 3 19 7 5 1 0 50 % 0.0% 4.0% 8.0% 18.0% 6.0% 38.0% 14.0% 10.0% 2.0% 0.0% 100.0%Motorcycle pillions 0 0 0 0 0 0 0 0 0 0 0 % 0.0% 0.0% 0.0% 0.0% 0.0% 0.0% 0.0% 0.0% 0.0% 0.0% 100.0%Bicycle riders 0 1 0 1 1 1 0 0 1 0 5 % 0.0% 20.0% 0.0% 20.0% 20.0% 20.0% 0.0% 0.0% 20.0% 0.0% 100.0%Bicycle pillions 0 0 0 0 0 0 0 0 0 0 0 % 0.0% 0.0% 0.0% 0.0% 0.0% 0.0% 0.0% 0.0% 0.0% 0.0% 100.0%
Total killed 4 12 35 37 28 43 23 17 28 0 227% of total 1.8% 5.3% 15.4% 16.3% 12.3% 18.9% 10.1% 7.5% 12.3% 0.0% 100.0%
Table 2B: Road traffic casualties by road user type and age groupQueensland 2002
Females killed by age goupRoad user type 0-4 5-16 17-20 21-25 26-29 30-39 40-49 50-59 60 & Not
years years years years years years years years years stated TotalDrivers 0 0 6 8 1 4 6 4 8 0 37 % 0.0% 0.0% 16.2% 21.6% 2.7% 10.8% 16.2% 10.8% 21.6% 0.0% 100.0%Passengers 3 6 9 3 4 6 2 2 4 0 39 % 7.7% 15.4% 23.1% 7.7% 10.3% 15.4% 5.1% 5.1% 10.3% 0.0% 100.0%Pedestrians 0 2 5 0 1 1 0 0 6 0 15 % 0.0% 13.3% 33.3% 0.0% 6.7% 6.7% 0.0% 0.0% 40.0% 0.0% 100.0%Motorcycle riders 0 0 0 0 0 0 0 0 1 0 1 % 0.0% 0.0% 0.0% 0.0% 0.0% 0.0% 0.0% 0.0% 100.0% 0.0% 100.0%Motorcycle pillions 0 0 0 0 1 0 1 0 0 0 2 % 0.0% 0.0% 0.0% 0.0% 50.0% 0.0% 50.0% 0.0% 0.0% 0.0% 100.0%Bicycle riders 0 0 0 0 0 0 0 0 0 0 0 % 0.0% 0.0% 0.0% 0.0% 0.0% 0.0% 0.0% 0.0% 0.0% 0.0% 100.0%Bicycle pillions 0 0 0 0 0 0 0 0 0 0 0 % 0.0% 0.0% 0.0% 0.0% 0.0% 0.0% 0.0% 0.0% 0.0% 0.0% 100.0%Total killed 3 8 20 11 7 11 9 6 19 0 94% of total 3.2% 8.5% 21.3% 11.7% 7.4% 11.7% 9.6% 6.4% 20.2% 0.0% 100.0%

Page A2-4 Appendix 2: Key summary tables
Table 2C: Road traffic casualties by road user type and age group*Queensland 2002
Persons killed by age goupRoad user type 0-4 5-16 17-20 21-25 26-29 30-39 40-49 50-59 60 & Not
years years years years years years years years years stated TotalDrivers 0 0 20 23 18 21 15 12 26 0 135 % 0.0% 0.0% 14.8% 17.0% 13.3% 15.6% 11.1% 8.9% 19.3% 0.0% 100.0%Passengers 8 12 26 12 10 10 5 2 7 0 92 % 8.7% 13.0% 28.3% 13.0% 10.9% 10.9% 5.4% 2.2% 7.6% 0.0% 100.0%Pedestrians 0 5 5 3 2 3 4 4 11 0 37 % 0.0% 13.5% 13.5% 8.1% 5.4% 8.1% 10.8% 10.8% 29.7% 0.0% 100.0%Motorcycle riders 0 2 4 9 3 19 7 5 2 0 51 % 0.0% 3.9% 7.8% 17.6% 5.9% 37.3% 13.7% 9.8% 3.9% 0.0% 100.0%Motorcycle pillions 0 0 0 0 1 0 1 0 0 0 2 % 0.0% 0.0% 0.0% 0.0% 50.0% 0.0% 50.0% 0.0% 0.0% 0.0% 100.0%Bicycle riders 0 1 0 1 1 1 0 0 1 0 5 % 0.0% 20.0% 0.0% 20.0% 20.0% 20.0% 0.0% 0.0% 20.0% 0.0% 100.0%Bicycle pillions 0 0 0 0 0 0 0 0 0 0 0 % 0.0% 0.0% 0.0% 0.0% 0.0% 0.0% 0.0% 0.0% 0.0% 0.0% 100.0%Total killed 8 20 55 48 35 54 32 23 47 0 322% of total 2.5% 6.2% 17.1% 14.9% 10.9% 16.8% 9.9% 7.1% 14.6% 0.0% 100.0%* Includes fatalities of unknown gender
Table 2D: Road traffic casualties by road user type and age groupQueensland 2002
Males injured by age goupRoad user type 0-4 5-16 17-20 21-25 26-29 30-39 40-49 50-59 60 & Not
years years years years years years years years years stated TotalDrivers 1 34 850 689 491 964 729 547 628 5 4938 % 0.0% 0.7% 17.2% 14.0% 9.9% 19.5% 14.8% 11.1% 12.7% 0.1% 100.0%Passengers 109 439 382 248 130 205 121 84 97 44 1859 % 5.9% 23.6% 20.5% 13.3% 7.0% 11.0% 6.5% 4.5% 5.2% 2.4% 100.0%Pedestrians 20 129 46 56 45 84 53 45 63 15 556 % 3.6% 23.2% 8.3% 10.1% 8.1% 15.1% 9.5% 8.1% 11.3% 2.7% 100.0%Motorcycle riders 0 20 144 223 165 332 242 98 32 4 1260 % 0.0% 1.6% 11.4% 17.7% 13.1% 26.3% 19.2% 7.8% 2.5% 0.3% 100.0%Motorcycle pillions 0 5 8 3 0 1 0 2 0 1 20 % 0.0% 25.0% 40.0% 15.0% 0.0% 5.0% 0.0% 10.0% 0.0% 5.0% 100.0%Bicycle riders 1 228 60 75 50 127 94 54 38 15 742 % 0.1% 30.7% 8.1% 10.1% 6.7% 17.1% 12.7% 7.3% 5.1% 2.0% 100.0%Bicycle pillions 1 2 0 0 0 0 0 0 0 0 3 % 33.3% 66.7% 0.0% 0.0% 0.0% 0.0% 0.0% 0.0% 0.0% 0.0% 100.0%Total injured 132 857 1490 1294 881 1713 1239 830 858 84 9378% of total 1.4% 9.1% 15.9% 13.8% 9.4% 18.3% 13.2% 8.9% 9.1% 0.9% 100.0%

Appendix 2: Key summary tables Page A2- 5
Table 2E: Road traffic casualties by road user type and age groupQueensland 2002
Females injured by age goupRoad user type 0-4 5-16 17-20 21-25 26-29 30-39 40-49 50-59 60 & Not
years years years years years years years years years stated TotalDrivers 0 22 754 726 473 1087 812 559 434 6 4873 % 0.0% 0.5% 15.5% 14.9% 9.7% 22.3% 16.7% 11.5% 8.9% 0.1% 100.0%Passengers 114 508 479 281 158 356 265 266 411 52 2890 % 3.9% 17.6% 16.6% 9.7% 5.5% 12.3% 9.2% 9.2% 14.2% 1.8% 100.0%Pedestrians 13 85 28 42 20 37 32 31 58 6 352 % 3.7% 24.1% 8.0% 11.9% 5.7% 10.5% 9.1% 8.8% 16.5% 1.7% 100.0%Motorcycle riders 0 0 11 20 8 32 16 10 4 0 101 % 0.0% 0.0% 10.9% 19.8% 7.9% 31.7% 15.8% 9.9% 4.0% 0.0% 100.0%Motorcycle pillions 0 4 9 7 3 16 16 6 1 3 65 % 0.0% 6.2% 13.8% 10.8% 4.6% 24.6% 24.6% 9.2% 1.5% 4.6% 100.0%Bicycle riders 1 35 11 21 21 28 12 8 6 0 143 % 0.7% 24.5% 7.7% 14.7% 14.7% 19.6% 8.4% 5.6% 4.2% 0.0% 100.0%Bicycle pillions 0 0 0 0 0 0 0 0 0 0 0 % 0.0% 0.0% 0.0% 0.0% 0.0% 0.0% 0.0% 0.0% 0.0% 0.0% 100.0%Total injured 128 654 1292 1097 683 1556 1153 880 914 67 8424% of total 1.5% 7.8% 15.3% 13.0% 8.1% 18.5% 13.7% 10.4% 10.8% 0.8% 100.0%
Table 2F: Road traffic casualties by road user type and age group*Queensland 2002
Persons injured by age goupRoad user type 0-4 5-16 17-20 21-25 26-29 30-39 40-49 50-59 60 & Not
years years years years years years years years years stated TotalDrivers 1 56 1604 1415 964 2051 1541 1106 1062 13 9813 % 0.0% 0.6% 16.3% 14.4% 9.8% 20.9% 15.7% 11.3% 10.8% 0.1% 100.0%Passengers 224 947 861 529 288 561 386 350 508 115 4769 % 4.7% 19.9% 18.1% 11.1% 6.0% 11.8% 8.1% 7.3% 10.7% 2.4% 100.0%Pedestrians 33 214 74 98 65 121 85 76 121 22 909 % 3.6% 23.5% 8.1% 10.8% 7.2% 13.3% 9.4% 8.4% 13.3% 2.4% 100.0%Motorcycle riders 0 20 155 243 173 364 258 108 36 10 1367 % 0.0% 1.5% 11.3% 17.8% 12.7% 26.6% 18.9% 7.9% 2.6% 0.7% 100.0%Motorcycle pillions 0 9 17 10 3 17 16 8 1 5 86 % 0.0% 10.5% 19.8% 11.6% 3.5% 19.8% 18.6% 9.3% 1.2% 5.8% 100.0%Bicycle riders 2 263 71 96 71 155 106 62 44 16 886 % 0.2% 29.7% 8.0% 10.8% 8.0% 17.5% 12.0% 7.0% 5.0% 1.8% 100.0%Bicycle pillions 1 2 0 0 0 0 0 0 0 0 3 % 33.3% 66.7% 0.0% 0.0% 0.0% 0.0% 0.0% 0.0% 0.0% 0.0% 100.0%Total injured 261 1511 2782 2391 1564 3269 2392 1710 1772 181 17833% of total 1.5% 8.5% 15.6% 13.4% 8.8% 18.3% 13.4% 9.6% 9.9% 1.0% 100.0%* Includes casualties of unknown gender

Page A2-6 Appendix 2: Key summary tables
Table 3A: Road traffic casualties by road user type, age group and sex: persons killedQueensland 2002
Drivers Motorcyclists Pedal cyclists
Age group Male FemaleNot
statedMale Female
Notstated
Male FemaleNot
stated0-4 years 0 0 0 0 0 0 0 0 05-16 years 0 0 0 2 0 0 1 0 017-20 years 14 6 0 4 0 0 0 0 021-25 years 15 8 0 9 0 0 1 0 026-29 years 17 1 0 3 1 0 1 0 030-34 years 10 2 0 11 0 0 0 0 035-39 years 7 2 0 8 0 0 1 0 040-49 years 9 6 0 7 1 0 0 0 050-59 years 8 4 0 5 0 0 0 0 060 years and over 18 8 0 1 1 0 1 0 0Not stated 0 0 0 0 0 0 0 0 0Total killed 98 37 0 50 3 0 5 0 0
Pedestrians Passengers Total
Age group Male FemaleNot
statedMale Female
Notstated
Male FemaleNot
stated0-4 years 0 0 0 4 3 1 4 3 15-16 years 3 2 0 6 6 0 12 8 017-20 years 0 5 0 17 9 0 35 20 021-25 years 3 0 0 9 3 0 37 11 026-29 years 1 1 0 6 4 0 28 7 030-34 years 1 0 0 1 3 0 23 5 035-39 years 1 1 0 3 3 0 20 6 040-49 years 4 0 0 3 2 0 23 9 050-59 years 4 0 0 0 2 0 17 6 060 years and over 5 6 0 3 4 0 28 19 0Not stated 0 0 0 0 0 0 0 0 0Total killed 22 15 0 52 39 1 227 94 1

Appendix 2: Key summary tables Page A2- 7
Table 3B: Road traffic casualties by road user type, age group and sex: persons injuredQueensland 2002
Drivers Motorcyclists Pedal cyclists
Age group Male FemaleNot
statedMale Female
Notstated
Male FemaleNot
stated0-4 years 1 0 0 0 0 0 2 1 05-16 years 34 22 0 25 4 0 230 35 017-20 years 850 754 0 152 20 0 60 11 021-25 years 689 726 0 226 27 0 75 21 026-29 years 491 473 0 165 11 0 50 21 030-34 years 556 575 0 185 21 0 70 16 035-39 years 408 512 0 148 27 0 57 12 040-49 years 729 812 0 242 32 0 94 12 050-59 years 547 559 0 100 16 0 54 8 060 years and over 628 434 0 32 5 0 38 6 0Not stated 5 6 2 5 3 7 15 0 1Total injured 4938 4873 2 1280 166 7 745 143 1
Pedestrians Passengers Total
Age group Male FemaleNot
statedMale Female
Notstated
Male FemaleNot
stated0-4 years 20 13 0 109 114 1 132 128 15-16 years 129 85 0 439 508 0 857 654 017-20 years 46 28 0 382 479 0 1490 1292 021-25 years 56 42 0 248 281 0 1294 1097 026-29 years 45 20 0 130 158 0 881 683 030-34 years 44 25 0 130 193 0 985 830 035-39 years 40 12 0 75 163 0 728 726 040-49 years 53 32 0 121 265 0 1239 1153 050-59 years 45 31 0 84 266 0 830 880 060 years and over 63 58 0 97 411 0 858 914 0Not stated 15 6 1 44 52 19 84 67 30Total injured 556 352 1 1859 2890 20 9378 8424 31

Page A2-8 Appendix 2: Key summary tables
Table 4A: Road traffic casualties:Restraint details by age group: persons killed
Queensland 2002
0 - 4 5 - 16 17 - 20 21 - 25 26 - 29 30 - 39 40 - 49 50 - 59 60 years NotRestraint details years years years years years years years years & over stated TotalFitted: Worn 7 1 29 12 9 10 12 6 23 0 109 Not worn 0 0 6 11 3 9 3 4 1 0 37 Unknown if worn 0 2 6 5 5 4 0 1 6 0 29Not fitted 0 3 1 1 1 0 1 1 1 0 9Unknown 1 6 4 6 6 8 4 0 2 0 37Not applicable 0 8 9 13 11 23 12 11 14 0 101Total killed 8 20 55 48 35 54 32 23 47 0 322
Table 4B: Road traffic casualties:Restraint details by age group: persons injured
Queensland 2002
0 - 4 5 - 16 17 - 20 21 - 25 26 - 29 30 - 39 40 - 49 50 - 59 60 years NotRestraint details years years years years years years years years & over stated TotalFitted: Worn 194 798 2027 1543 981 2111 1591 1223 1342 47 11857 Not worn 13 38 81 72 54 96 54 33 25 4 470 Unknown if worn 6 45 161 136 83 161 116 78 75 22 883Not fitted 4 39 29 15 7 29 23 16 14 0 176Unknown 8 82 164 173 121 200 132 101 106 53 1140Not applicable 36 509 320 452 318 672 476 259 210 55 3307Total injured 261 1511 2782 2391 1564 3269 2392 1710 1772 181 17833
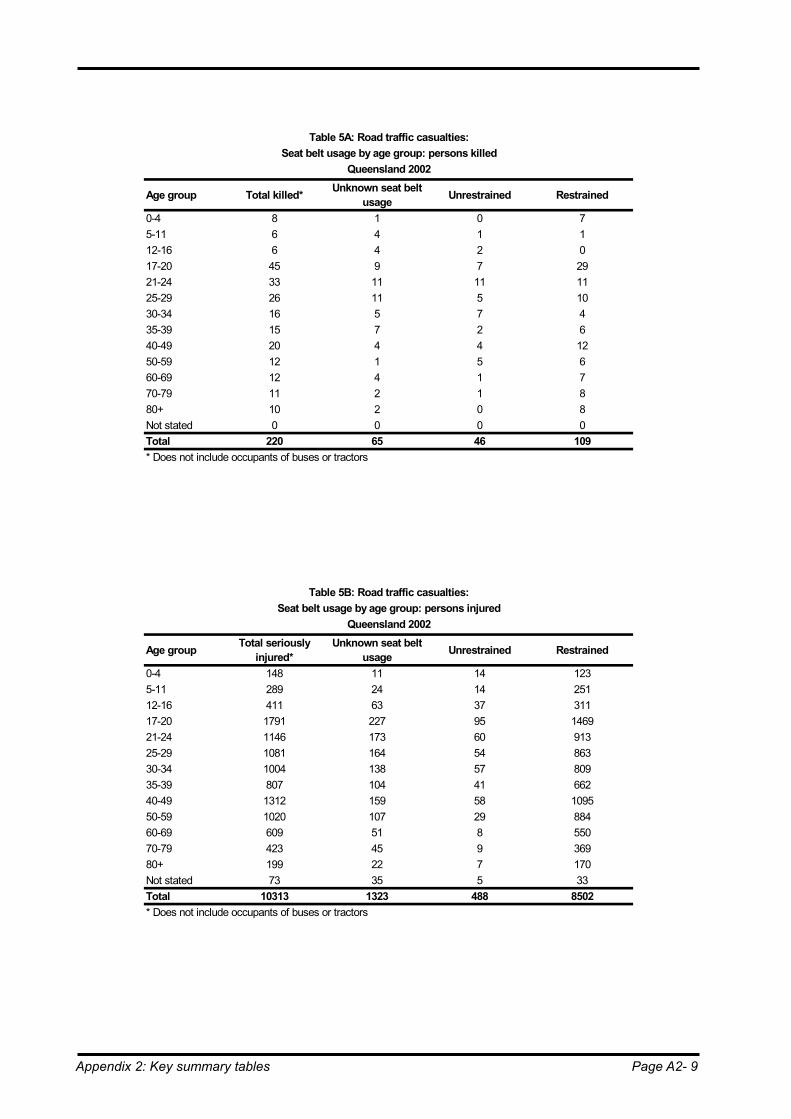
Appendix 2: Key summary tables Page A2- 9
Table 5A: Road traffic casualties:Seat belt usage by age group: persons killed
Queensland 2002
Age group Total killed*Unknown seat belt
usageUnrestrained Restrained
0-4 8 1 0 75-11 6 4 1 112-16 6 4 2 017-20 45 9 7 2921-24 33 11 11 1125-29 26 11 5 1030-34 16 5 7 435-39 15 7 2 640-49 20 4 4 1250-59 12 1 5 660-69 12 4 1 770-79 11 2 1 880+ 10 2 0 8Not stated 0 0 0 0Total 220 65 46 109* Does not include occupants of buses or tractors
Table 5B: Road traffic casualties:Seat belt usage by age group: persons injured
Queensland 2002
Age groupTotal seriously
injured*Unknown seat belt
usageUnrestrained Restrained
0-4 148 11 14 1235-11 289 24 14 25112-16 411 63 37 31117-20 1791 227 95 146921-24 1146 173 60 91325-29 1081 164 54 86330-34 1004 138 57 80935-39 807 104 41 66240-49 1312 159 58 109550-59 1020 107 29 88460-69 609 51 8 55070-79 423 45 9 36980+ 199 22 7 170Not stated 73 35 5 33Total 10313 1323 488 8502* Does not include occupants of buses or tractors

Page A2-10 Appendix 2: Key summary tables
Table 6: Road traffic casualties:Seat belt and helmet wearing details by injury severity
Queensland 2002
Road user type/safety device used Killed Seriously injured Other injury TotalDriver: Restraint worn 65 5752 2318 8135 Fitted but not worn 25 225 40 290 No restraint fitted 3 27 6 36 Not stated 38 903 509 1450Sub total driver 131 6907 2873 9911Passenger: Restraint worn 44 2789 998 3831 Fitted but not worn 12 184 21 217 No restraint fitted 6 118 25 149 Not stated 28 467 143 638Sub total passenger 90 3558 1187 4835Total vehicle occupants 221 10465 4060 14746Pedal cycle rider & pillion: Helmet worn 4 512 143 659 No helmet worn 0 85 23 108 Not stated 1 51 75 127Total pedal cycle rider & pillion 5 648 241 894Motorcycle rider & pillion: Helmet worn 48 1122 171 1341 No helmet worn 3 28 5 36 Not stated 2 46 81 129Total motorbike rider & pillion 53 1196 257 1506

Appendix 2: Key summary tables Page A2- 11
Table 7: Road traffic casualties by road user type and most severe injury sustained: persons killedQueensland 2002
Nature of injury Drivers*Motorcycle
ridersBicycleriders
Other Pedestrians Passengers** Total
FracturesSkull & Face 0 1 1 0 0 1 3Spine & Trunk 4 2 0 0 0 1 7Upper Limbs 0 0 0 0 0 0 0Lower Limbs & Mult 1 1 0 0 1 2 5Sub-Total 5 4 1 0 1 4 15LacerationsHead & Face 0 0 0 0 0 0 0Neck & Trunk 0 1 0 0 0 0 1Upper Limbs 0 0 0 0 0 0 0Lower Limbs 0 0 0 0 0 0 0Sub-Total 0 1 0 0 0 0 1OtherIntracranial 27 16 4 0 7 24 78Concussion 0 0 0 0 0 0 0Internal 100 30 0 0 28 66 224Nerve/Spinal Cord Injury 0 0 0 0 0 0 0Crush Injury 0 0 0 0 1 0 1Blood Vessel Injury 0 0 0 0 0 0 0Foreign Matter in Orifice 0 0 0 0 0 0 0Burn 3 0 0 0 0 0 3Dislocation 0 0 0 0 0 0 0Sprain/Strain 0 0 0 0 0 0 0Abrasions 0 0 0 0 0 0 0Contusion 0 0 0 0 0 0 0Shock 0 0 0 0 0 0 0Other 0 0 0 0 0 0 0Sub-total 130 46 4 0 36 90 306Total fatalities 135 51 5 0 37 94 322* Includes horse riders** Includes pillion passengers

Page A2-12 Appendix 2: Key summary tables
Table 8A: Road traffic crashes:Involved controllers by road user type and age group: males only
Queensland 2002
Driver Motorcycle rider Bicycle riderAge group Inv Resp Inv Resp Inv Resp0-4 1 1 0 0 1 15-7 0 0 0 0 10 88-12 0 0 1 1 77 6113-15 43 41 13 12 117 8716-19 3111 2217 104 69 76 5020-24 3455 2106 248 146 75 3225-29 2581 1383 219 115 66 3030-34 2192 1037 205 122 71 1935-39 1868 882 160 89 58 1440-49 3306 1383 261 154 95 2750-59 2558 1144 110 67 54 1260-69 1379 672 27 14 22 670+ 1131 738 6 5 17 10Not stated 283 219 7 6 17 12Total 21908 11823 1361 800 756 369
Pedestrian Other road user TotalAge group Inv Resp Inv Resp Inv Resp0-4 20 14 0 0 22 165-7 26 22 0 0 36 308-12 59 50 0 0 137 11213-15 36 24 0 0 209 16616-19 43 28 1 1 3335 249120-24 65 41 13 8 3856 248025-29 54 33 21 13 2941 172230-34 45 24 16 5 2529 134535-39 41 23 28 14 2155 111140-49 58 26 47 32 3767 179250-59 49 20 33 15 2804 138960-69 27 15 17 7 1472 79170+ 41 24 5 2 1200 821Not stated 15 14 3 2 325 273Total 579 358 184 99 24788 14539
Legend:Inv = Number of controllers* involved in a crashResp = The controller considered most responsible for the crash by police
* Controller - see definitions, Appendix 1

Appendix 2: Key summary tables Page A2- 13
Table 8B: Road traffic crashes:Involved controllers by road user type and age group: females only
Queensland 2002
Driver Motorcycle rider Bicycle riderAge group Inv Resp Inv Resp Inv Resp0-4 0 0 0 0 1 15-7 0 0 0 0 3 38-12 0 0 0 0 16 1013-15 11 11 0 0 14 1316-19 1681 1082 9 5 11 320-24 2156 1090 20 12 22 825-29 1549 633 11 4 22 830-34 1541 613 12 4 16 435-39 1356 524 20 12 12 240-49 2352 894 16 11 12 350-59 1454 607 10 4 8 560-69 640 345 5 5 3 170+ 512 376 0 0 3 2Not stated 103 59 0 0 0 0Total 13355 6234 103 57 143 63
Pedestrian Other road user TotalAge group Inv Resp Inv Resp Inv Resp0-4 13 9 0 0 14 105-7 23 22 0 0 26 258-12 22 14 0 0 38 2413-15 29 19 0 0 54 4316-19 35 17 1 0 1737 113820-24 43 17 1 0 2242 118025-29 33 15 1 0 1616 72430-34 25 8 1 0 1595 69835-39 13 4 0 0 1401 61440-49 32 14 4 1 2416 101350-59 30 5 2 1 1504 66560-69 26 12 1 1 675 38170+ 38 19 2 1 555 405Not stated 6 6 0 0 109 67Total 368 181 13 4 13982 6987
Legend:Inv = Number of controllers* involved in a crashResp = The controller considered most responsible for the crash by police
* Controller - see definitions, Appendix 1

Page A2-14 Appendix 2: Key summary tables
Table 8C: Road traffic crashes:Involved controllers by road user type and age group: all persons
Queensland 2002
Driver Motorcycle rider Bicycle riderAge group Inv Resp Inv Resp Inv Resp0-4 1 1 0 0 2 25-7 0 0 0 0 13 118-12 0 0 1 1 93 7113-15 54 52 13 12 131 10016-19 4792 3299 113 74 87 5320-24 5611 3196 268 158 97 4025-29 4130 2016 230 119 88 3830-34 3733 1650 217 126 87 2335-39 3224 1406 180 101 70 1640-49 5658 2277 277 165 107 3050-59 4012 1751 120 71 62 1760-69 2019 1017 32 19 25 770+ 1643 1114 6 5 20 12Not stated 946 685 14 13 19 13Total 35823 18464 1471 864 901 433
Pedestrian Other road user TotalAge group Inv Resp Inv Resp Inv Resp0-4 33 23 0 0 36 265-7 49 44 0 0 62 558-12 81 64 0 0 175 13613-15 65 43 0 0 263 20916-19 78 45 2 1 5072 362920-24 108 58 14 8 6098 366025-29 87 48 22 13 4557 244630-34 70 32 17 5 4124 204335-39 54 27 28 14 3556 172540-49 90 40 51 33 6183 280550-59 79 25 35 16 4308 205460-69 53 27 18 8 2147 117270+ 79 43 7 3 1755 1226Not stated 23 22 4 2 1006 782Total 949 541 198 103 39342 21968
Legend:Inv = Number of controllers* involved in a crashResp = The controller considered most responsible for the crash by police
* Controller - see definitions, Appendix 1

Appendix 2: Key summary tables Page A2- 15
Table 9A: Blood alcohol analysis:Controllers* killed in road traffic crashes
Queensland 2002
Blood alcohol analysis DriversMotorcycle
ridersBicycle riders
Pedestrians Other Total
No blood analysis 16 3 1 10 0 30Negative 85 35 4 13 0 137Positive .01 - .04 4 2 0 1 0 7 .05 - .07 1 1 0 0 0 2 .08 - .14 11 2 0 1 0 14 .15 - .19 5 4 0 3 0 12 .20 - .24 10 4 0 3 0 17 .25 & over 3 0 0 6 0 9Total positive 34 13 0 14 0 61Total controllers 135 51 5 37 0 228Total tested 119 48 4 27 0 198% positive 28.6% 27.1% 0.0% 51.9% 0.0% 30.8%* Controller - see definitions, Appendix 1
Table 9B: Blood alcohol analysis:Controllers* injured in road traffic crashes
Queensland 2002
Blood alcohol analysis DriversMotorcycle
ridersBicycle riders
Pedestrians Other Total
No test required 4975 758 745 864 4 7346Refused test 34 1 2 2 0 39Negative 3993 516 127 40 2 4678Positive .01 - .04 43 7 0 1 0 51 .05 - .07 33 2 1 0 0 36 .08 - .14 198 24 2 1 0 225 .15 - .19 163 15 1 1 0 180 .20 - .24 89 12 2 0 0 103 .25 & over 285 32 6 0 0 323Total positive 811 92 12 3 0 918Total controllers 9813 1367 886 909 6 12981Total tested 4804 608 139 43 2 5596% positive 16.9% 15.1% 8.6% 7.0% 0.0% 16.4%* Controller - see definitions, Appendix 1

Page A2-16 Appendix 2: Key summary tables
Table 10A: Blood alcohol analysis by age group:Controllers* killed in road traffic crashes
Queensland 2002
Blood or breathalcohol analysis
Under 17 years
17 - 20 years
21 - 24 years
25 - 29 years
30 - 39 years
40 - 49 years
50 years & over
Total
Failure to supply 0 0 0 0 0 0 0 0Negative 2 17 22 12 31 15 38 137Positive .01 - .04 0 0 1 0 1 1 4 7 .05 - .07 0 0 0 0 1 1 0 2 .08 - .14 0 4 7 1 0 2 0 14 .15 - .19 0 1 1 4 3 0 3 12 .20 - .24 0 1 3 4 4 3 2 17 .25 & over 0 1 1 1 2 1 3 9Total positive 0 7 13 10 11 8 12 61Total tested 2 24 35 22 42 23 50 198% positive 0.0% 29.2% 37.1% 45.5% 26.2% 34.8% 24.0% 30.8%* Controller - see definitions, Appendix 1
Table 10B: Blood alcohol analysis by age group:Controllers* not killed but may have been injured in road traffic crashes
Queensland 2002
Blood or breathalcohol analysis
Under 17 years
17 - 20 years
21 - 24 years
25 - 29 years
30 - 39 years
40 - 49 years
50 years & over
Total
Failure to supply 1 9 19 14 23 7 7 80Negative 138 3243 2620 1557 3410 2911 3800 17679Positive .01 - .04 4 45 30 18 43 26 30 196 .05 - .07 2 42 28 17 22 13 13 137 .08 - .14 7 181 147 79 93 46 47 600 .15 - .19 3 71 102 71 94 44 40 425 .20 - .24 0 23 38 34 68 34 21 218 .25 & over 8 174 190 103 262 187 248 1172Total positive 24 536 535 322 582 350 399 2748Total tested 162 3779 3155 1879 3992 3261 4199 20427% positive 14.8% 14.2% 17.0% 17.1% 14.6% 10.7% 9.5% 13.5%* Controller - see definitions, Appendix 1

Appendix 2: Key summary tables Page A2- 17
Table 11A: Road traffic crashes:Time of day and day of week: Total crashes
Queensland 2002
Time Monday Tuesday Wednesday Thursday Friday Saturday Sunday TotalMidnight - 2am 44 47 51 91 100 182 176 6912am - 4am 36 34 41 54 56 163 131 5154am - 6am 73 76 69 58 91 128 121 6166am - 8am 249 295 278 238 239 152 111 15628am - 10am 388 435 411 431 414 303 177 255910am - noon 311 328 312 315 378 434 359 2437Noon - 2pm 355 331 336 354 381 410 324 24912pm - 4pm 461 450 462 506 593 405 339 32164pm - 6pm 569 567 565 600 671 359 328 36596pm - 8pm 236 266 326 314 428 283 227 20808pm - 10pm 120 146 157 200 272 218 128 124110pm - Midnight 75 93 145 133 243 236 89 1014Total 2917 3068 3153 3294 3866 3273 2510 22081
Table 11B: Road traffic crashes:Time of day and day of week: Casualty crashes
Queensland 2002
Time Monday Tuesday Wednesday Thursday Friday Saturday Sunday TotalMidnight - 2am 21 25 25 39 47 88 100 3452am - 4am 15 11 14 23 29 93 75 2604am - 6am 38 44 42 38 52 76 65 3556am - 8am 175 196 194 161 159 87 71 10438am - 10am 230 271 274 264 258 184 114 159510am - noon 190 209 183 207 243 283 237 1552Noon - 2pm 218 232 224 221 238 266 214 16132pm - 4pm 297 283 309 317 348 262 224 20404pm - 6pm 374 359 351 397 440 227 199 23476pm - 8pm 151 157 205 211 255 164 128 12718pm - 10pm 69 81 86 118 145 113 71 68310pm - Midnight 43 57 72 62 133 123 40 530Total 1821 1925 1979 2058 2347 1966 1538 13634

Page A2-18 Appendix 2: Key summary tables
Table 11C: Road traffic crashes:Time of day and day of week: Persons killed
Queensland 2002
Time Monday Tuesday Wednesday Thursday Friday Saturday Sunday TotalMidnight - 2am 1 0 2 4 1 3 5 162am - 4am 0 0 0 2 1 9 8 204am - 6am 2 3 3 2 7 7 4 286am - 8am 3 6 3 5 6 3 2 288am - 10am 1 0 5 3 4 2 4 1910am - noon 3 7 5 4 5 9 7 40Noon - 2pm 1 2 2 1 2 4 2 142pm - 4pm 10 6 1 5 9 3 7 414pm - 6pm 7 5 6 4 9 9 5 456pm - 8pm 0 2 2 7 7 3 2 238pm - 10pm 2 1 3 2 5 10 3 2610pm - Midnight 3 5 4 4 4 1 1 22Total 33 37 36 43 60 63 50 322
Table 11D: Road traffic crashes:Time of day and day of week: Persons injured
Queensland 2002
Time Monday Tuesday Wednesday Thursday Friday Saturday Sunday TotalMidnight - 2am 22 26 27 43 54 143 142 4572am - 4am 24 16 17 26 38 111 94 3264am - 6am 48 48 42 40 61 96 101 4366am - 8am 211 232 221 192 194 102 98 12508am - 10am 302 346 380 361 334 246 141 211010am - noon 261 266 236 262 323 386 348 2082Noon - 2pm 279 296 282 285 298 349 312 21012pm - 4pm 395 362 385 410 469 373 321 27154pm - 6pm 500 435 429 507 575 316 290 30526pm - 8pm 204 203 266 267 343 224 187 16948pm - 10pm 91 110 117 161 200 150 84 91310pm - Midnight 54 70 91 75 171 186 50 697Total 2391 2410 2493 2629 3060 2682 2168 17833

Appendix 2: Key summary tables Page A2- 19
Table 12: Road traffic casualties:Road users by vehicle type and injury severity
Queensland 2002
Road user type KilledAdmitted to
hospitalMedical
treatmentOther injury Total casualties
Driver: Car, station wagon 95 2029 3539 2299 7962 Utility, panel van 15 316 404 328 1063 4-wheel drive 10 171 222 166 569 Rigid truck 3 35 50 32 120 Articulated truck 6 49 34 27 116 Road train/Bdouble/triple 2 20 8 7 37 Bus 0 14 16 14 44 Other motor vehicle 4 8 15 10 37Sub-total 135 2642 4288 2883 9948Motorcycle rider 51 684 438 245 1418Pedal cycle rider 5 289 357 240 891Other/not stated 0 1 2 3 6Sub-total 56 974 797 488 2315Passenger: Car, station wagon 59 1116 1641 947 3763 Utility, panel van 6 175 172 100 453 4-wheel drive 22 143 151 90 406 Rigid truck 1 10 15 13 39 Articulated truck 1 4 7 0 12 Road train/Bdouble/triple 0 2 0 4 6 Bus 1 23 101 33 158 Other motor vehicle 2 2 12 1 17Sub-total 92 1475 2099 1188 4854Motorcycle pillion 2 50 24 12 88Pedal cycle pillion 0 1 1 1 3Other/not stated 0 0 1 0 1Sub-total 2 51 26 13 92Pedestrian sub-total 37 413 334 162 946Total casualties 322 5555 7544 4734 18155

Page A2-20 Appendix 2: Key summary tables
Table 13: Road traffic casualties:Type of unit most responsible by crash severity
Queensland 2002
Crash severity
Type of unit F % H % M % O % All crashes %
Car/station wagon 143 50.5 2604 58.7 3763 67.1 2177 65.9 15060 68.2Utility, panel van 21 7.4 447 10.1 575 10.2 382 11.6 2415 10.9Rigid truck 7 2.5 94 2.1 125 2.2 77 2.3 517 2.3Articulated vehicle 6 2.1 67 1.5 73 1.3 53 1.6 368 1.7Omnibus 1 0.4 28 0.6 69 1.2 33 1.0 162 0.7Motorcycle 39 13.8 453 10.2 234 4.2 134 4.1 865 3.9Tractor 4 1.4 14 0.3 37 0.7 15 0.5 102 0.5Towed device (Caravan) 0 0.0 2 0.0 0 0.0 1 0.0 15 0.1Bicycle 3 1.1 164 3.7 154 2.7 112 3.4 433 2.0Pedestrian 26 9.2 267 6.0 172 3.1 76 2.3 541 2.5Animal - ridden 0 0.0 1 0.0 1 0.0 0 0.0 2 0.0Animal - stock 0 0.0 0 0.0 0 0.0 0 0.0 0 0.0Animal - other 0 0.0 0 0.0 0 0.0 0 0.0 0 0.0Railway rolling stock 0 0.0 0 0.0 0 0.0 0 0.0 0 0.04-wheel drive 28 9.9 270 6.1 386 6.9 229 6.9 1462 6.6Road train/Bdouble/triple 5 1.8 22 0.5 14 0.2 9 0.3 106 0.5Other 0 0.0 0 0.0 0 0.0 0 0.0 0 0.0Not stated 0 0.0 6 0.1 8 0.1 3 0.1 33 0.1Total 283 100.0 4439 100.0 5611 100.0 3301 100.0 22081 100.0
Injury severity
Type of unit K % Hl % Ml % Mm %Total
casualties%
Car/station wagon 171 53.1 3402 61.2 5171 68.5 3238 68.4 11982 66.0Utility, panel van 24 7.5 571 10.3 769 10.2 517 10.9 1881 10.4Rigid truck 7 2.2 103 1.9 152 2.0 105 2.2 367 2.0Articulated vehicle 7 2.2 75 1.4 102 1.4 74 1.6 258 1.4Omnibus 1 0.3 35 0.6 114 1.5 54 1.1 204 1.1Motorcycle 40 12.4 489 8.8 266 3.5 159 3.4 954 5.3Tractor 5 1.6 15 0.3 53 0.7 22 0.5 95 0.5Towed device (Caravan) 0 0.0 3 0.1 0 0.0 3 0.1 6 0.0Bicycle 3 0.9 166 3.0 157 2.1 119 2.5 445 2.5Pedestrian 26 8.1 274 4.9 185 2.5 89 1.9 574 3.2Animal - ridden 0 0.0 1 0.0 2 0.0 0 0.0 3 0.0Animal - stock 0 0.0 0 0.0 0 0.0 0 0.0 0 0.0Animal - other 0 0.0 0 0.0 0 0.0 0 0.0 0 0.0Railway rolling stock 0 0.0 0 0.0 0 0.0 0 0.0 0 0.04-wheel drive 33 10.2 387 7.0 541 7.2 338 7.1 1299 7.2Road train/Bdouble/triple 5 1.6 28 0.5 22 0.3 13 0.3 68 0.4Other 0 0.0 0 0.0 0 0.0 0 0.0 0 0.0Not stated 0 0.0 6 0.1 10 0.1 3 0.1 19 0.1Total 322 100.0 5555 100.0 7544 100.0 4734 100.0 18155 100.0
Legend:
F = worst casualty fatal K = KilledH = worst casualty admitted to hospital HI = admitted to hospitalM = worst casualty required medical treatment MI = required medical treatmentO = worst casualty minor injury (first-aid or no treatment) Mm = minor injury (first-aid or no treatment)

Appendix 2: Key summary tables Page A2- 21
Table 14: Single vehicle crashes by vehicle type and crash severityQueensland 2002
Vehicle type Fatal crashes Serious injury Other injuryProperty
damage onlyTotal crashes
Car/station wagon 69 1823 467 2434 4793Utility/panel van 12 349 73 391 825Truck 2 51 12 68 133Articulated vehicle 5 74 22 76 177Omnibus 1 15 2 7 25Motorcycle 15 388 76 1 480Bicycle 0 58 13 0 714-wheel drive 22 241 67 223 553Road train/Bdouble/triple 3 23 7 41 74Other vehicle 2 13 3 23 41Total 131 3035 742 3264 7172
Table 15: Road traffic crashes and casualties by roadway feature and traffic controlQueensland 2002
Road feature/traffic control
Total crashes
Casualty crashes
Persons killed
Persons injured
IntersectionCross-roads controlled by: - person 3 2 0 2
- traffic lights 1971 1211 6 1671- stop/give way signs 1245 699 12 973- pedestrian crossing 17 13 0 17- uncontrolled/other 642 374 5 491
T-junction controlled by: - person 4 3 0 3- traffic lights 1077 690 4 932- stop/give way signs 907 607 8 817- pedestrian crossing 22 18 0 22- uncontrolled/other 2594 1598 25 2092
Y-junction controlled by: - person 0 0 0 0- traffic lights 4 3 0 3- stop/give way signs 4 2 0 4- pedestrian crossing 0 0 0 0- uncontrolled/other 19 13 0 19
Other intersections controlled by: - person 6 5 0 6- traffic lights 165 97 0 130- stop/give way signs 984 623 1 738- pedestrian crossing 4 3 0 3- uncontrolled/other 396 221 2 267
Railway level crossing controlled by: - lights 29 12 1 13- signs 18 10 1 10- uncontrolled/other 2 2 0 3
Other roadway features:Bridge-culvert-causeway 324 189 3 268Foresty/National Park Road 14 10 0 12Bikeway 3 3 0 4Median opening 70 42 2 45Merge lane 48 35 0 50Straight road controlled by: - person 30 21 0 29
- traffic lights 78 61 1 70- stop/give way signs 60 35 1 36- pedestrian crossing 75 68 2 76- uncontrolled/other 8290 5168 148 6656
Curved road controlled by: - view open 2061 1246 77 1647- view obscured 915 550 23 724
Total crashes 22081 13634 322 17833

Page A2-22 Appendix 2: Key summary tables
Table 16A: Road traffic crashes:Roadway features by crash severity
Queensland 2002
Crash severity
Road way feature FatalAdmitted to
hospital
Received medical
treatmentOther injury Non-injury Total
Cross 19 701 1017 562 1579 3878T junction 33 828 1331 724 1688 4604Y junction 0 4 11 3 9 27Multiple road 0 12 18 5 24 59Interchange 2 96 155 107 213 573Roundabout 1 138 225 190 369 923Bridge, causeway 3 66 79 41 135 324Railway crossing 2 6 12 4 25 49Median opening 2 10 14 16 28 70Merge lane 0 12 14 9 13 48Bikeway 0 3 0 0 0 3Forestry/National park road 0 7 1 2 4 14No special features 221 2556 2734 1638 4360 11509Total crashes 283 4439 5611 3301 8447 22081
Table 16B: Road traffic crashes:Roadway features by crash severityBrisbane Statistical Division 2002
Crash severity
Road way feature FatalAdmitted to
hospital
Received medical
treatmentOther injury Non-injury Total
Cross 7 338 498 288 636 1767T junction 15 458 772 439 875 2559Y junction 0 1 9 2 6 18Multiple road 0 8 13 5 15 41Interchange 2 77 120 94 160 453Roundabout 0 49 90 81 135 355Bridge, causeway 0 19 29 12 43 103Railway crossing 0 0 0 1 1 2Median opening 1 4 4 13 12 34Merge lane 0 7 9 4 6 26Bikeway 0 2 0 0 0 2Forestry/National park road 0 2 0 0 0 2No special features 53 890 1241 797 1708 4689Total crashes 78 1855 2785 1736 3597 10051

Appendix 2: Key summary tables Page A2- 23
Table 17: Road traffic crashes and casualties by region, crash severity and genderQueensland 2002
Crashes and casualties Brisbane City Rest of BSD* Provincial cities Rest of Qld Total QldCrashesFatal crashes 36 42 72 133 283Serious injury crashes 1130 725 1359 1225 4439Other injury crashes 2907 1614 2759 1632 8912Total casualty crashes 4073 2381 4190 2990 13634Property damage only crashes 2168 1429 2892 1958 8447Total crashes 6241 3810 7082 4948 22081CasualtiesFatalities Males 31 29 56 111 227 Females 7 18 25 44 94 Not stated 1 0 0 0 1Total fatalities 39 47 81 155 322Seriously injured Males 1767 1133 2061 1851 6812 Females 1845 1117 1950 1364 6276 Not stated 3 2 5 1 11Total seriously injured 3615 2252 4016 3216 13099Other injured Males 837 447 790 492 2566 Females 709 456 627 356 2148 Not stated 5 3 9 3 20Total other injured 1551 906 1426 851 4734Total casualties Males 2635 1609 2907 2454 9605 Females 2561 1591 2602 1764 8518 Not stated 9 5 14 4 32Total casualties 5205 3205 5523 4222 18155* Brisbane Statistical Division

Page A2-24 Appendix 2: Key summary tables
Table 18: Road traffic crashes and casualties by Local Government AreaQueensland 2002
Crashes Persons
Local Government AreaDrivers and passengers
PedestriansMotor
cyclistsPedal
cyclistsOthers
Total reported
Involving casualties
K I K I K I K I K I
Aramac Shire Council 5 3 0 4 0 0 0 1 0 0 0 0
Atherton Shire Council 55 41 3 41 0 7 0 2 0 2 0 0Aurukun Shire Council 1 0 0 0 0 0 0 0 0 0 0 0Balonne Shire Council 21 15 1 16 0 0 0 0 0 0 0 0Banana Shire Council 73 34 1 31 0 2 0 4 0 3 0 0Barcaldine Shire Council 6 3 0 4 0 1 0 0 0 0 0 0Barcoo Shire Council 3 1 0 1 0 0 0 0 0 0 0 0Bauhinia Shire Council 26 13 0 20 0 0 0 0 0 0 0 0Beaudesert Shire Council 216 148 2 174 0 8 2 23 0 0 0 0Belyando Shire Council 32 23 1 29 0 0 0 2 0 1 0 0Bendemere Shire Council 7 7 1 8 0 0 0 0 0 0 0 0Biggenden Shire Council 11 8 0 7 0 0 0 1 0 0 0 0Blackall Shire Council 8 6 0 7 0 0 0 0 0 1 0 0Boonah Shire Council 65 38 2 63 0 0 0 2 0 0 0 0Booringa Shire Council 10 6 1 8 0 0 0 0 0 0 0 0Boulia Shire Council 6 6 0 10 0 0 0 0 0 0 0 0Bowen Shire Council 81 51 4 71 0 3 0 3 1 1 0 0Brisbane City Council 6241 4073 22 4201 7 333 9 390 1 242 0 0Broadsound Shire Council 40 22 4 33 0 0 0 0 0 0 0 0Bulloo Shire Council 6 5 0 5 0 0 0 2 0 0 0 0Bundaberg City Council 299 175 2 180 0 16 1 17 0 27 0 0Bungil Shire Council 16 9 1 11 0 1 0 0 0 0 0 0Burdekin Shire Council 95 50 1 57 0 2 1 7 0 1 0 0Burke Shire Council 19 15 0 34 0 0 0 0 0 0 0 0Burnett Shire Council 68 40 0 44 0 1 1 3 0 1 0 0Caboolture Shire Council 652 419 8 512 0 22 4 39 1 22 0 1Cairns City Council 782 423 2 401 2 33 1 64 0 60 0 0Calliope Shire Council 89 61 2 90 0 2 0 8 0 1 0 0Caloundra City Council 487 254 1 296 0 16 1 29 0 11 0 0Cambooya Shire Council 18 6 0 9 0 0 0 0 0 0 0 0Cardwell Shire Council 43 25 3 26 0 0 0 1 0 2 0 0Carpentaria Shire Council 21 14 1 18 0 3 0 0 0 0 0 0Charters Towers City Council 30 10 0 11 0 0 1 1 0 0 0 0Chinchilla Shire Council 24 16 0 24 0 0 0 1 0 1 0 0Clifton Shire Council 9 6 0 5 0 0 0 2 0 0 0 0Cloncurry Shire Council 26 12 0 14 0 0 0 1 0 0 0 0Cook Shire Council 66 43 1 65 0 2 0 4 0 1 0 0Cooloola Shire Council 213 114 3 132 0 5 0 8 0 2 0 0Crows Nest Shire Council 62 33 0 53 0 1 0 4 0 1 0 0Croydon Shire Council 2 0 0 0 0 0 0 0 0 0 0 0Dalby Town Council 42 28 0 22 0 4 0 5 0 5 0 0Dalrymple Shire Council 50 35 3 45 1 1 0 3 0 0 0 0Diamantina Shire Council 6 5 0 5 0 0 0 1 0 0 0 0Douglas Shire Council 86 52 1 51 1 2 0 11 0 3 0 0Duaringa Shire Council 46 29 1 42 0 1 0 2 0 1 0 0
Legend:K = Killed, I = Injured

Appendix 2: Key summary tables Page A2- 25
Table 18: Road traffic crashes and casualties by Local Government Area (cont'd)Queensland 2002
Crashes Persons
Local Government AreaDrivers and passengers
PedestriansMotor
cyclistsPedal
cyclistsOthers
Total reported
Involving casualties
K I K I K I K I K I
Eacham Shire Council 36 16 0 15 0 1 0 3 0 0 0 0
Eidsvold Shire Council 17 13 1 18 0 0 0 1 0 0 0 0Emerald Shire Council 75 37 0 31 0 2 0 8 0 3 0 0Esk Shire Council 140 88 11 99 0 0 0 11 0 1 0 0Etheridge Shire Council 14 8 0 7 0 0 0 1 0 0 0 0Fitzroy Shire Council 57 35 2 38 0 0 0 3 0 3 0 0Flinders Shire Council 23 12 0 17 0 0 0 0 0 0 0 0Gatton Shire Council 120 63 1 69 1 4 3 10 0 3 0 0Gayndah Shire Council 15 12 0 11 0 0 1 3 0 0 0 0Gladstone City Council 165 98 3 77 1 7 0 22 0 14 0 0Gold Coast City Council 2541 1755 14 1842 7 133 7 162 1 134 0 0Goondiwindi Town Council 15 9 0 10 0 1 0 0 0 0 0 0Herberton Shire Council 36 23 1 28 0 0 0 5 0 0 0 0Hervey Bay City Council 237 153 7 177 0 10 2 13 0 11 0 0Hinchinbrook Shire Council 71 38 3 53 1 2 0 3 0 1 0 0Ilfracombe Shire Council 2 1 0 1 0 0 0 0 0 0 0 0Inglewood Shire Council 19 11 0 13 0 0 0 1 0 0 0 0Ipswich City Council 843 474 5 534 0 30 3 42 0 20 0 0Isis Shire Council 69 43 2 48 0 0 2 5 0 1 0 0Isisford Shire Council 1 1 0 1 0 0 0 0 0 0 0 0Jericho Shire Council 9 3 0 3 0 0 0 0 0 0 0 0Johnstone Shire Council 93 61 5 63 0 4 0 7 0 4 0 0Jondaryan Shire Council 60 31 4 39 0 1 2 1 0 0 0 0Kilcoy Shire Council 35 20 1 21 0 0 0 2 0 3 0 0Kilkivan Shire Council 37 17 0 18 0 0 0 3 0 0 0 0Kingaroy Shire Council 79 42 1 52 1 0 0 5 0 2 0 0Kolan Shire Council 56 32 2 67 0 0 1 3 0 2 0 0Laidley Shire Council 70 46 0 58 0 1 0 6 0 1 0 0Livingstone Shire Council 134 89 1 110 0 5 0 11 0 2 0 0Logan City Council 978 620 11 686 4 34 4 55 0 29 0 1Longreach Shire Council 24 11 0 8 0 1 0 3 0 1 0 0Mackay City Council 462 271 9 261 2 22 1 45 1 20 0 0Mareeba Shire Council 131 83 1 101 0 5 0 14 0 2 0 0Maroochy Shire Council 850 490 11 512 1 37 1 58 0 30 0 0Maryborough City Council 137 81 0 84 0 5 0 13 0 8 0 0Mckinlay Shire Council 17 10 1 19 0 0 0 0 0 0 0 0Millmerran Shire Council 26 18 0 24 0 0 0 0 0 0 0 0Mirani Shire Council 33 21 1 20 0 0 1 7 0 0 0 0Miriam Vale Shire Council 37 27 4 33 0 1 0 0 0 1 0 0Monto Shire Council 15 4 0 4 0 0 0 0 0 0 0 0Mornington Shire Council 5 5 0 6 0 1 0 0 0 0 0 0Mount Isa City Council 111 63 2 54 2 9 0 9 0 5 0 0Mount Morgan Shire Council 7 3 0 3 0 0 0 0 0 1 0 0Mundubbera Shire Council 22 12 1 11 1 1 0 0 0 0 0 0Murgon Shire Council 14 8 0 10 0 2 0 1 0 0 0 0
Legend:K = Killed, I = Injured

Page A2-26 Appendix 2: Key summary tables
Table 18: Road traffic crashes and casualties by Local Government Area (cont'd)Queensland 2002
Crashes Persons
Local Government AreaDrivers and passengers
PedestriansMotor
cyclistsPedal
cyclistsOthers
Total reported
Involving casualties
K I K I K I K I K I
Murilla Shire Council 13 8 4 11 0 0 0 0 0 0 0 0Murweh Shire Council 15 9 0 11 0 0 0 2 0 0 0 0Nanango Shire Council 51 36 0 50 0 1 0 2 0 1 0 0Nebo Shire Council 29 17 3 17 0 0 0 0 0 0 0 0Noosa Shire Council 220 132 6 119 1 15 1 13 0 17 0 0Paroo Shire Council 10 8 3 3 0 1 0 2 0 1 0 0Peak Downs Shire Council 22 13 0 15 0 0 0 0 0 0 0 0Perry Shire Council 5 5 0 5 0 0 0 1 0 0 0 0Pine Rivers Shire Council 465 310 3 317 1 17 1 48 0 18 0 0Pittsworth Shire Council 31 17 2 17 0 0 0 1 0 1 0 0Quilpie Shire Council 9 7 1 7 0 1 1 0 0 0 0 0Redcliffe City Council 247 149 0 152 1 8 0 17 0 17 0 0Redland Shire Council 410 267 1 311 0 5 0 16 0 20 0 0Richmond Shire Council 9 6 0 6 0 1 0 0 0 0 0 0Rockhampton City Council 436 209 2 189 0 14 0 29 0 24 0 0Roma Town Council 26 12 0 7 0 2 0 3 0 1 0 0Rosalie Shire Council 32 19 0 20 0 1 0 4 0 0 0 0Sarina Shire Council 54 33 2 34 0 2 0 8 0 4 0 0Stanthorpe Shire Council 57 37 1 36 1 1 0 2 0 0 0 0Tambo Shire Council 3 1 0 1 0 0 0 0 0 0 0 0Tara Shire Council 25 13 1 18 0 1 0 0 0 1 0 0Taroom Shire Council 16 9 0 12 0 1 0 0 0 0 0 0Thuringowa City Council 159 92 1 101 0 3 0 16 0 11 0 0Tiaro Shire Council 45 26 3 29 0 1 1 4 0 0 0 0Toowoomba City Council 646 296 3 312 0 19 0 28 0 17 0 0Torres Shire Council 14 12 3 10 0 0 0 2 0 1 0 0Townsville City Council 612 353 3 293 1 25 0 59 0 59 0 0Waggamba Shire Council 43 34 2 39 0 0 0 4 0 0 0 0Wambo Shire Council 32 16 2 24 0 0 0 0 0 0 0 0Warroo Shire Council 7 3 0 3 0 1 0 0 0 0 0 0Warwick Shire Council 105 69 2 93 0 2 0 5 0 2 0 0Whitsunday Shire Council 83 49 1 40 0 2 0 9 0 3 0 0Winton Shire Council 11 6 0 9 0 0 0 0 0 0 0 0Wondai Shire Council 16 12 0 14 0 0 0 0 0 0 0 0Woocoo Shire Council 21 14 1 19 0 0 0 1 0 0 0 0
Total for Queensland 22081 13634 227 14580 37 909 53 1453 5 889 0 2
Legend:K = Killed, I = Injured

Appendix 2: Key summary tables Page A2- 27
Table 19: Annual road toll, population and vehicles on registerQueensland 1953-2002
Persons killed
Year Driver*Motor cyclist
Pedalcyclist
Pedestrian Passenger Total killedPopulation
('000)Motor vehicles
('000)
1953 45 60 16 64 91 276 1298.4 266.21954 46 60 18 64 85 273 1322.8 284.21955 55 52 17 76 77 277 1350.7 307.71956 68 43 15 89 108 323 1378.9 326.61957 80 47 30 62 104 323 1420.5 345.11958 92 41 29 89 102 353 1449.3 365.21959 106 32 23 92 100 353 1477.2 383.81960 103 31 17 78 117 346 1502.3 406.71961 102 28 18 91 98 337 1540.3 321.71962 131 32 21 100 119 403 1562.8 453.31963 139 20 32 96 111 398 1595.4 459.01964 164 25 12 115 145 461 1626.5 497.41965 183 18 19 101 146 467 1659.4 536.11966 181 20 20 102 143 466 1687.1 563.41967 201 13 20 110 158 502 1715.8 588.51968 197 16 9 82 173 477 1747.7 620.91969 226 19 18 109 184 556 1779.7 649.91970 223 22 13 111 158 527 1812.8 686.11971 255 44 24 78 193 594 1874.9 726.51972 217 55 18 98 184 572 1924.7 774.01973 219 71 19 121 208 638 1981.6 827.01974 215 83 10 107 174 589 2033.0 889.71975 225 72 22 107 209 635 2072.3 917.01976 196 83 16 89 185 569 2110.4 1012.21977 215 97 27 92 141 572 2151.0 1067.21978 237 70 15 92 198 612 2191.6 1129.61979 242 94 13 95 172 616 2239.7 1183.41980 211 87 14 87 158 557 2301.7 1256.91981 237 92 16 66 183 594 2387.9 1355.61982 255 94 18 71 164 602 2456.5 1439.51983 178 92 19 61 160 510 2503.3 1496.11984 192 74 16 66 157 505 2547.1 1533.51985 201 77 20 72 132 502 2597.1 1546.11986 186 75** 15** 65 140*** 481 2648.5 1567.41987 165 55 14 73 135 442 2703.4 1575.31988 225 53 21 78 162 539 2780.7 1616.21989 173 47 19 68 121 428 2864.6 1693.41990 153 50 18 65 113 399 2932.2 1751.91991 163 41 16 66 109 395 2999.9 1787.01992 167 43 18 75 113 416 3030.5 1832.81993 189 47 10 49 101 396 3112.6 1847.21994 177 45 13 79 108 422 3116.0 1975.51995 180 54 10 92 120 456 3277.3 2038.91996 174 41 10 55 105 385 3354.7 2171.91997 159 43 12 59 87 360 3440.2 2232.91998 122 25 9 48 75 279 3456.3 2307.51999 128 41 9 49 87 314 3525.6 2385.62000 157 30 6 40 85 317 3556.4 2428.62001 151 29 15 51 78 324 3642.4 2495.62002 135 53 5 37 92 322 3707.2 2445.5
* Includes horse riders** Includes pillions from 1986*** Includes pillions prior to 1986

Page A2-28 Appendix 2: Key summary tables
Table 20: Annual trend dataQueensland 1993-2002
1993 1994 1995 1996 1997 1998 1999 2000 2001 2002Casualties by severity
Fatalities 396 422 456 385 360 279 314 317 324 322Hospitalised 4052 4600 4636 4481 4146 4397 4503 4790 5314 5555Medical treatment 5876 6207 6692 6836 6483 6325 6252 6446 7884 7544Minor injury 3131 3587 3932 4131 3928 4007 3840 3934 4830 4734Total 13455 14816 15716 15833 14917 15008 14909 15487 18352 18155
Fatalities by age group0-11 years* 19 22 25 20 21 17 18 12 14 1812-16 years 18 18 21 20 17 14 19 16 13 1017-24 years 122 103 121 107 113 79 77 61 84 9725-59 years 174 194 208 172 155 121 143 166 147 15060 years and over 63 85 81 66 54 48 57 62 66 47Total 396 422 456 385 360 279 314 317 324 322
Fatalities by age group: female0-11 years** 9 8 12 8 5 4 8 4 6 712-16 years 9 6 8 5 3 6 7 4 3 417-24 years 25 29 29 19 39 18 17 13 13 3025-59 years 40 46 63 55 41 36 36 37 45 3460 years and over 23 38 32 30 21 17 20 26 20 19Total 106 127 144 117 109 81 88 84 87 94
Fatalities by age group: male0-11 years** 10 14 13 12 16 12 8 8 7 1012-16 years 9 12 13 15 14 8 12 12 10 617-24 years 97 74 92 88 74 61 60 48 71 6725-59 years 134 148 145 117 114 85 107 129 102 11660 years and over 40 47 49 36 33 31 37 36 46 28Total 290 295 312 268 251 197 224 233 236 227
Fatalities by road userDrivers 189 177 181 174 158 122 128 157 151 135Passengers 101 108 119 105 88 75 87 82 78 92Motorcyclists 47 45 54 41 43 25 41 33 29 53Bicyclists 10 13 10 10 12 9 9 6 15 5Pedestrians 49 79 92 55 59 48 49 39 51 37Total 396 422 456 385 360 279 314 317 324 322
Fatalities by driver/rider blood alcohol contentTested 182 164 194 170 171 128 127 163 154 167Untested 50 53 36 41 26 15 39 22 21 19Total 232 217 230 211 197 143 166 185 175 186Nil 123 103 112 105 112 86 89 104 110 1200.01 - 0.04 7 10 18 5 13 8 6 13 5 60.05 - 0.14 14 20 20 19 21 15 15 13 14 150.15 - 0.24 32 23 31 31 15 14 8 23 23 230.25 and over 6 8 13 10 10 5 9 10 2 3Total 182 164 194 170 171 128 127 163 154 167
* Includes fatalites of unknown age and/or gender** Includes fatalities of unknown age

Appendix 2: Key summary tables Page A2- 29
Table 20: Annual trend data (cont'd)Queensland 1993-2002
1993 1994 1995 1996 1997 1998 1999 2000 2001 2002Fatalities by seat belt usage
Not determined 105 89 105 89 88 62 66 63 65 65Restrained 110 139 141 137 110 97 98 115 114 109Unrestrained 69 40 46 45 45 34 47 57 47 46Total 284 268 292 271 243 193 211 235 226 220
Fatalities by helmet usageNot determined 1 2 3 5 2 7 3 4 0 3Worn 51 51 52 35 44 23 38 33 39 52Not worn 5 5 9 11 9 4 9 2 5 3Total 57 58 64 51 55 34 50 39 44 58
Injuries by age group0-11 years* 863 850 930 935 887 858 874 852 892 88512-16 years 829 899 1035 979 927 954 870 845 925 88717-24 years 4202 4633 4611 4572 4145 4201 4063 4176 4885 477025-59 years 5806 6583 7178 7379 7089 7167 7293 7769 9476 933860 years and over 1293 1384 1443 1525 1437 1471 1400 1420 1702 1772Unstated 66 45 63 58 72 78 95 108 148 181Total 13059 14394 15260 15448 14557 14729 14595 15170 18028 17833
Injuries by age group: female0-11 years** 353 373 434 381 367 372 392 369 392 39112-16 years 358 371 439 437 397 408 369 395 441 39117-24 years 1742 1938 1959 1963 1767 1863 1802 1917 2223 221225-59 years 2561 2905 3228 3351 3281 3377 3333 3643 4558 444960 years and over 686 747 725 792 777 757 722 762 853 914Unstated 30 20 21 24 16 21 30 36 47 67Total 5730 6354 6806 6948 6605 6798 6648 7122 8514 8424
Injuries by age group: male0-11 years** 510 477 496 553 520 486 482 483 500 49312-16 years 471 528 596 542 530 546 501 450 484 49617-24 years 2460 2695 2652 2609 2378 2338 2259 2258 2662 255825-59 years 3245 3678 3950 4028 3806 3789 3959 4126 4918 488960 years and over 607 637 718 733 660 714 678 658 849 858Unstated 23 14 27 26 38 34 46 41 66 84Total 7316 8029 8439 8491 7932 7907 7925 8016 9479 9378
Injuries by road user typeDrivers 6149 7057 7677 7725 7458 7634 7743 8179 9977 9817Passengers 3917 4250 4402 4434 4090 4113 4093 4213 4922 4763Motorcyclists 1340 1374 1357 1396 1204 1221 1118 1085 1324 1453Bicyclists 798 795 828 928 920 882 772 792 871 889Pedestrians 854 918 994 963 884 877 869 899 933 909Other 1 0 1 0 0 0 0 1 1 2Total 13059 14394 15259 15446 14556 14727 14595 15169 18028 17833
* Includes injuries of unknown age and/or gender** Includes injuries of unknown age

Page A2-30 Appendix 2: Key summary tables
Table 20: Annual trend data (cont'd)Queensland 1993-2002
1993 1994 1995 1996 1997 1998 1999 2000 2001 2002Injuries by blood alcohol content of driver/rider
Tested 1659 1873 1999 2158 2232 2654 3035 3680 4347 4605Untested 5017 5721 6127 6063 5582 5294 4940 4721 5799 5329Total 6676 7594 8126 8221 7814 7948 7975 8401 10146 9934Nil 1194 1352 1438 1560 1729 2176 2548 3170 3756 39920.01 - 0.04 28 32 41 30 33 42 34 45 51 480.05 - 0.14 181 200 228 231 222 220 189 223 250 2550.15 - 0.24 215 253 251 302 222 191 230 222 261 2750.25 and over 41 36 41 35 26 25 34 20 29 35Total 1659 1873 1999 2158 2232 2654 3035 3680 4347 4605
Injuries by seat belt usageNot determined 1381 1529 1702 1793 1874 1850 1740 1678 2017 1948Restrained 8019 9103 9685 9684 9047 9222 9478 9955 11969 11811Unrestrained 518 508 534 517 482 453 446 533 570 567Total 9918 11140 11921 11994 11403 11525 11664 12166 14556 14326
Injuries by helmet usageNot determined 75 100 108 129 136 154 133 142 195 253Worn 1905 1876 1889 1939 1779 1766 1586 1579 1846 1948Not worn 157 193 188 256 209 183 171 156 154 141Total 2137 2169 2185 2324 2124 2103 1890 1877 2195 2342
Crashes by severityFatal 357 368 408 338 321 257 273 275 296 283Hospitalisation 3204 3612 3654 3559 3328 3518 3567 3822 4230 4439Medical treatment 4172 4471 4800 4936 4762 4613 4572 4790 5920 5611Minor injury 2170 2469 2800 2872 2697 2756 2626 2738 3411 3301Property damage 9667 9910 9602 9211 8235 8417 8504 8310 8156 8447Total 19570 20830 21264 20916 19343 19561 19542 19935 22013 22081
Fatal crashes - crash natureHit object 101 93 105 93 95 80 65 79 89 86Hit pedestrian 44 73 88 55 55 46 47 37 47 34Head-on 55 62 70 46 48 23 47 47 44 52Angle 71 60 50 60 54 44 36 34 37 43Overturned 53 35 47 45 25 24 27 40 38 32Rear-end 7 11 16 10 8 8 12 6 10 5Fall from vehicle* 9 10 11 13 11 8 12 12 8 10Sideswipe 7 10 10 9 16 11 19 13 17 13Hit parked vehicle 2 6 7 4 3 6 5 6 0 3Hit animal 7 4 3 3 5 6 1 0 4 3Other 1 4 1 0 1 1 2 1 2 2Total 357 368 408 338 321 257 273 275 296 283
* Vehicle includes motor or pedal cycle

Appendix 2: Key summary tables Page A2- 31
Table 20: Annual trend data (cont'd)Queensland 1993-2002
1993 1994 1995 1996 1997 1998 1999 2000 2001 2002Fatal crashes - traffic control
Police 1 1 0 0 0 0 0 0 0 0Road/Rail worker 2 0 0 0 0 0 2 0 0 0Operating traffic lights 14 26 24 23 10 12 13 20 17 8Railway-lights only 2 2 1 0 1 0 0 1 0 1Railway-lights & boom gate 0 2 1 0 1 2 0 1 0 0Stop sign 13 5 9 10 16 9 8 4 6 7Give way sign 14 14 17 14 10 12 14 11 14 13Railway crossing sign 3 0 1 4 0 2 0 0 1 0Pedestrian crossing sign 0 3 5 3 3 1 2 1 2 2Miscellaneous 0 0 0 0 0 0 0 0 0 0No traffic control 308 315 350 284 280 219 234 237 256 252
Fatal crashes - speed limit0-50 km/h 1 5 3 7 1 6 10 15 16 960 km/h 136 148 152 142 115 75 84 77 88 7470-90 km/h 41 49 46 39 42 46 62 52 51 60100km/h and over 179 166 207 150 163 130 117 131 141 140
Fatal crashes after darkTotal 150 154 171 142 152 102 124 111 118 119
Fatal crashes - roadway featureWet road 0 0 0 11 31 48 42 45 39 31Crossroad 45 36 44 47 27 25 31 30 23 19Roundabout 0 2 2 3 1 2 0 3 2 1Other intersection 50 54 59 55 48 31 35 29 45 35Bridge/causeway 9 12 16 7 12 11 3 8 6 3
Fatal crashes - day of weekMonday 41 42 45 36 30 31 33 31 30 29Tuesday 41 43 43 48 44 25 24 36 39 33Wednesday 45 54 58 34 45 32 29 35 36 32Thursday 45 50 52 46 42 36 35 41 42 39Friday 59 65 74 53 56 39 57 46 46 53Saturday 65 59 67 60 64 55 50 49 61 51Sunday 61 55 69 61 40 39 45 37 42 46
Fatal crashes - locationBrisbane City 50 53 58 50 39 34 39 35 39 36Rest of BSD* 50 60 43 42 49 29 40 38 41 42Provincial cities 101 109 124 120 87 78 69 72 76 72Rest of state 156 146 183 126 146 116 125 130 140 133Total 357 368 408 338 321 257 273 275 296 283
* Brisbane Statistical Division

Page A2-32 Appendix 2: Key summary tables
Table 20: Annual trend data (cont'd)Queensland 1993-2002
1993 1994 1995 1996 1997 1998 1999 2000 2001 2002Fatal crashes - contributing factors
Disobeyed traffic rules* 125 125 128 115 110 73 97 95 83 96Alcohol/drugs 98 103 132 101 101 86 85 94 83 82Inexperience 57 82 102 91 95 62 52 41 72 54Speed 80 51 46 48 51 30 40 50 50 48Other driver conditions** 51 42 50 32 26 31 24 27 25 17Age 35 36 41 30 28 25 28 33 24 22Rain/wet road 25 35 41 22 16 29 10 14 13 10Negligence 15 31 25 14 17 19 18 18 18 13Inattention 15 24 41 26 26 28 47 38 48 71Road conditions 35 23 29 26 9 14 15 13 10 6Other 21 23 41 31 36 22 33 35 41 26Vehicle defects 21 11 17 13 7 13 14 11 7 5Fatigue 50 34 48 54 45 30 26 28 40 42No street lighting 3 6 7 5 9 9 1 4 3 3
Fatal crashes - units involvedCar 313 335 347 292 286 209 229 210 243 205Utility/van 72 85 107 84 78 75 73 56 59 364-wheel drive 0 0 0 0 0 0 3 37 33 49Rigid Truck 34 31 28 24 24 17 17 31 17 24Articulated truck 41 38 49 34 31 29 31 22 26 17Road train/bdouble/triple 0 0 0 0 0 0 0 8 6 7Bus 7 7 6 6 2 7 12 5 4 6Motorcycle 47 46 57 44 44 25 44 34 29 57Tractor 5 5 7 7 6 3 5 3 4 11Bicycle 10 12 10 11 12 10 10 6 16 7Towed device 2 0 0 1 0 1 1 0 0 1Pedestrian 56 86 96 59 61 48 52 43 65 41Animal - ridden 1 0 0 0 0 2 0 0 1 0Animal - stock 5 4 2 2 5 3 1 0 2 2Animal - other 2 0 1 1 0 2 0 0 2 2Railway stock 5 4 4 4 3 4 0 2 1 2Other 0 0 2 0 3 2 5 0 2 0Total 600 653 716 569 555 437 483 457 510 467
Fatal crashes - units towingTotal 17 17 25 32 39 37 36 46 42 32
Fatal crashes - driver involvement by licence typeOpen 377 398 408 344 325 251 284 288 272 285Provisional 59 79 91 64 74 46 57 50 70 52Learner 7 9 16 14 14 14 14 10 15 17Not licensed 68 55 69 57 50 43 49 47 52 49Inappropriate/restricted 3 1 7 7 4 3 4 3 8 5Total 514 542 591 486 467 357 408 398 417 408
* Disobeyed traffic rules does not include Alcohol/Drugs, Inexperience, Speed and Inattention** Driver conditions do not include Inattention, Negligence, Inexperience, Fatigue or Age

Appendix 2: Key summary tables Page A2- 33
Table 20: Annual trend data (cont'd)Queensland 1993-2002
1993 1994 1995 1996 1997 1998 1999 2000 2001 2002Injury crashes - crash nature
Hit object 1724 1877 1951 2037 2064 2014 2057 2062 2336 2315Hit pedestrian 781 835 903 886 827 796 782 824 834 827Head-on 371 392 473 452 299 321 317 262 269 296Angle 3155 3521 3723 3661 3570 3535 3445 3554 4127 4088Overturned 867 885 978 869 764 741 687 815 847 797Rear-end 1521 1844 1972 2119 2053 2187 2208 2571 3677 3465Fall from vehicle 284 292 252 323 271 282 268 290 350 378Sideswipe 465 506 561 567 516 583 532 527 651 661Hit parked vehicle 247 271 293 296 259 276 291 276 228 289Hit animal 118 104 120 120 124 87 122 86 120 135Other 13 25 28 37 40 65 56 83 122 100
Injury crashes - traffic controlPolice 15 14 16 9 2 9 5 11 5 10Road/Rail worked 12 18 12 26 24 24 21 13 19 21Supervised school crossing 6 6 5 3 2 1 2 2 3 3Operating traffic lights 1136 1348 1479 1497 1502 1521 1586 1740 2167 2031Flashing amber lights 4 1 9 1 1 2 2 3 3 1Railway-lights only 14 21 10 12 18 13 11 7 9 11Railway-lights & boom gate 7 4 9 9 5 3 1 3 9 3Stop sign 469 468 558 491 472 441 439 451 510 514Give way sign 857 999 1139 1154 1058 1089 1020 1166 1462 1450Railway crossing sign 7 12 7 11 5 3 3 3 6 5Pedestrian crossing sign 100 118 117 127 95 110 96 100 109 105School crossing - flags 1 1 0 2 1 0 0 0 2 3Miscellaneous 4 1 0 0 0 0 1 0 1 0No traffic control 6914 7541 7893 8025 7602 7671 7578 7851 9256 9194
Injury crashes - speed limit0-50 km/h 105 133 162 164 174 205 877 1164 1345 132660 km/h 6398 7024 7644 7686 7335 7320 6249 6423 7906 773670-90 km/h 882 1024 1016 1094 1019 1235 1433 1628 1929 1965100km/h and over 2161 2371 2432 2423 2259 2127 2206 2135 2381 2324
Injury crashes after darkTotal 2600 2909 3205 3228 2873 2886 2932 3007 3441 3325
Injury crashes - roadway featureWet road 0 0 1 489 1554 1787 1967 1885 1771 1514Crossroad 1985 2201 2291 2228 2068 1997 2008 2078 2413 2280Roundabout 252 256 308 319 335 354 363 414 512 553Other intersection 2255 2520 2784 2853 2710 2722 2532 2753 3450 3294Bridge/causeway 150 166 207 200 120 170 156 167 223 0
Injury crashes - day of weekMonday 1308 1434 1529 1505 1405 1501 1478 1534 1822 1792Tuesday 1318 1420 1486 1595 1513 1451 1438 1560 1947 1892Wednesday 1354 1449 1590 1625 1665 1638 1528 1644 2008 1947Thursday 1425 1588 1668 1701 1655 1696 1623 1772 2025 2019Friday 1615 1794 1897 1906 1721 1847 1905 1841 2381 2294Saturday 1421 1681 1675 1728 1590 1447 1572 1618 1892 1915Sunday 1105 1186 1409 1307 1238 1307 1221 1381 1486 1492

Page A2-34 Appendix 2: Key summary tables
Table 20: Annual trend data (cont'd)Queensland 1993-2002
1993 1994 1995 1996 1997 1998 1999 2000 2001 2002Injury crashes - location
Brisbane City 2603 3005 3198 3146 2987 3028 2946 3229 4260 4037Rest of BSD* 1638 1768 1929 1943 1821 1960 1806 2009 2377 2339Provincial cities 2943 3200 3459 3529 3387 3327 3245 3464 4125 4118Rest of state 2356 2572 2666 2749 2591 2572 2767 2647 2799 2857
Injury crashes - contributing factorsDisobeyed traffic rules** 3865 4350 4578 4604 4316 4394 4268 4290 5022 5144Alcohol/drugs 858 934 1045 1035 979 938 880 966 1326 1585Inexperience 1851 2437 2726 2823 2818 2601 2301 2453 2683 2678Speed 369 438 451 436 405 448 421 499 590 582Other driver conditions*** 951 869 889 1023 912 844 638 758 788 844Age 420 456 522 580 611 670 535 546 755 746Rain/wet road 1037 1163 1317 1146 781 1011 938 759 874 827Negligence 187 242 209 177 214 297 391 337 383 445Inattention 2290 2812 2657 2701 2850 3340 3560 3627 4674 4331Road conditions 682 709 909 857 586 594 567 506 590 575Other 897 923 1136 1400 1565 1435 1365 1490 1853 1760Vehicle defects 412 460 450 425 418 421 372 318 352 353Fatigue 594 683 681 704 678 616 640 642 683 668No street lighting 63 77 83 69 42 63 54 55 52 45
Injury crashes - units involvedCar 11407 13103 14091 14130 13566 13827 13746 13923 17145 16601Utility/van 2252 2447 2672 2659 2450 2474 2471 2262 2672 26104-wheel drive N/A N/A N/A N/A N/A N/A N/A 1106 1380 1510Rigid Truck 451 546 559 490 474 454 480 508 510 514Articulated Truck 299 370 369 377 344 377 392 290 325 294Road train/bdouble/triple N/A N/A N/A N/A N/A N/A N/A 57 84 75Bus 116 122 150 169 177 159 182 201 262 237Motorcycle 1318 1361 1347 1383 1194 1191 1122 1072 1311 1463Tractor 57 73 63 77 91 94 100 93 129 130Bicycle 823 811 840 944 945 899 797 807 901 900Towed device 11 17 10 5 3 9 11 8 12 9Pedestrian 906 998 1090 1022 945 929 923 941 986 950Animal - ridden 5 4 2 6 4 4 1 6 4 4Animal - stock 69 65 84 79 91 64 89 44 66 88Animal - other 54 42 39 39 38 27 34 41 57 48Railway stock 27 30 22 25 19 18 20 8 13 14Other 29 39 34 55 33 34 42 27 37 38Total 17824 20028 21372 21460 20374 20560 20410 21394 25894 25485
Injury crashes - units towingTotal 269 330 376 470 530 554 554 558 668 646
Injury crashes - driver involvement by licence typeOpen 11575 12721 13472 13818 13186 13322 13256 14034 17270 17053Provisional 2179 2914 3079 2829 2546 2663 2589 2851 3485 3387Learner 323 287 321 357 375 431 433 459 587 620Not licensed 996 1202 1356 1377 1357 1431 1430 1369 1675 1547Inappropriate/restricted 58 54 83 65 48 47 40 53 66 64Total 15131 17178 18311 18446 17512 17894 17748 18766 23083 22671
* Brisbane Statistical Division** Disobeyed traffic rules does not include Alcohol/Drugs, Inexperience, Speed and Inattention*** Driver conditions do not include Inattention, Negligence, Inexperience, Fatigue or Age