
ROAD RESEARCH LABORATORY · road research laboratory department of the environment rrl report lr...
43
Transcript of ROAD RESEARCH LABORATORY · road research laboratory department of the environment rrl report lr...


ROAD RESEARCH LABORATORY
Department of the Environment
RRL REPORT LR 393
INVESTIGATION OF THE STABILITY OF EARTHWORK CONSTRUCTION
ON THE ORIGINAL LINE OF SEVENOAKS BY-PASS, KENT
by
I.F. Symons, B.SC., A.M. Inst. H.E.
and
Al. Booth, B.SC.
Earthworks and Foundations Section
Road Research Laboratory
Crowthorne, Berkshire
1971

CONTENTS
Abstract
1.
2.
3.
4.
5.
6.
7.
8.
9.
10.
Introduction
Site description
Material types
3.1 Weald Clay
3.2 Atherfield Clay
3.3 Hythe Beds
3.4 Superficial Deposits
Location and description of the unstable areas
4.1 Area A
4.2 Area D
4.3 Other areas
Field investigations
5.1 Mudflow A
5.2 Mudflow G
5.3 Trial Embankment
5.4 Mudflow F
5.4.1 Structure of mudflow
5.4.2 Piezometer observations
5.5 Mudflow D
5.6 Conclusions from the field investigations
bboratory strength tests
Assessment of earthwork stability
7.1 Considerations of limiting stability
7.2 Stability of embankment construction on the mudflow
7.3 Stability of cuttings in the mudflows
Conclusions
Acknowledgements
References
11. Appendix 1
11.1 Determination of the shear strength parameters along major slip surfaces
located within the mudflows
11.2 Determination of the shear strength parameters from an analysis of the
embankment failures in Area A
Page
1
1
2
2
2
2
2
2
3
3
3
3
4
4
5
5
6
6
7
7
7
8
8
8
8
11
12
12
12
13
13
14
CONTENTS (Continued)
I i.3 Stability of embankment construction on the mudflows
oC CROWN COPYRIGHT 1971
Extracts from the text may be reproduced
provided the source is ackno wledged
Page
15

INVESTIGATION OF THE STABILITY OF EARTHWORK CONSTRUCTION
ON THE ORIGINAL LINE OF SEVENOAKS BY-PASS, KENT
ABSTRACT
Instability developed early in 1965 during the construction of earthworks
on the southern length of the Sevenoaks By-pass, Kent. The By-pass was
subsequently realigned over this length. This Report describes some of
the investigations carried out along the line of the original route and con-
siders the stability of the earthworks.
The investigations revealed eight areas where some history of
instability was indicated. The materials within these areas were found to
contain natural slip surfaces running approximately parallel with the
ground surface. The main factor governing the feasibility of earthwork
construction across these areas was the requirement that the water table
in the unstable areas be depressed to a level below that of the main slip
surface and maintained at that position. If this could be achieved, pre-
liminary stability calculations showed that an embankment about 5 m
in height could be constructed using light-weight fill and side-slopes of
1 in 4.
1. INTRODUCTION
Early in 1965 instability developed at two sites during the construction of the southern section of the
Sevenoaks By-pass in Kent. An examination of the proposed route of the By-pass over this length revealed
that much of the route was situated on potentially unstable ground.
In April 1965 the Road Research Laboratory was asked by Kent County Council to assist them in a
site investigation to be carried out in collaboration with Imperial College. The main aims of the investigation
were to determine the extent of the problem, to establish the type and causes of the instability, and to
consider the stability of further earthwork construction, along the route of the By-pass. As a result of this
investigation the By-pass was regraded and rerouted through less unstable areas.
The object of this Report is to describe the first part of the investigations which were undertaken at
Sevenoaks in which the staff of the Laboratory participated and which were carried out along the line of
the original route. The Report also considers the stability of earthwork construction along this length of
1

the By-pass. The work carried out by Imperial College and Kent County Council has been described
elsewhere 1’2’ 3.
2. SITE DESCRIPTION
The Sevenoaks By-pass is a two-lane dual carriageway approximately 10 kilometres in length running to
the west of Sevenoaks (Fig. 1). Instability was encountered during the construction of earthworks on a
2%-kilometre length at the southern end. Along this length the road passes over three main geological
strata (Fig. 1). These are the Hythe Beds, the Atherfield Clay and the Weald Clay. The original line of the
By-pass ran southwards in cutting through the Hythe beds then turned eastwards on embankment and
cutting in sidelong ground across the Atherfield and Weald Clays to the southern terminal roundabout on
the existing Sevenoaks–Tonbridge road (A21 ).
3. MATERIAL TYPES
Apart from the superficial deposits, the three main materials found in the area under consideration are
Cretaceus in age and comprise the Weald Clay, the Atherfield Clay and the Hythe beds4.
3.1 Weald Clay
This is a heavy blue clay having a mean liquid limit of about 45 per cent and plastic limit of about
20 per cent. Near the ground surface it is often weathered to give a brown mottled plastic material and at
depth it is frequently laminated and consolidated to form soft shales and mudstones. Thin bands of
fossiliferous limestones and sandstones occur at intervals throughout the formation. .
3.2 Atherfield Clay
In general the Atherfield Clay is said to be more sandy and silty than the Weald Clay. In practice,
because of the rarity of fossils and the rather imprecise textural definitions of the formations, it proved
impossible to distinguish between the Weald and Atherfield clay in samples from boreholes and trial pits
put down during the investigation.
3.3 Hythe Beds
These beds are quite variable in character and are composed of alternating beds of Ragstone and
Hassock. Ragstone is a hard yellow-grey sandy limestone and Hassock is an argillaceous, calcareous sand-
stone, often speckled with glauconite which gives the rock a pale green colour. Some of the beds are
extremely tough and impermeable because of the deposition of silica in the pore spaces and in these beds
drainage occurs mainly through fissures.
3.4 Superficial Deposits
The predominant superficial deposits found in the area are classified under the general term of
“Head”. They were formed mainly during the last ice age but in an area which although not covered by
ice was subject to freezing and thawing. The main agent in the formation of the deposits appears to have
been breakdown and transport of material from the older strata by a process of solifluxion, that is, the
mechanical displacement and movement of materials down gentle slopes caused by volume changes of
repeated freezing and thawing cycles.
2

In other parts of Britain and elsewhere these solifiuxion deposits are associated with extensive
cambering and landslipping, for example in the Northamptonshire Ironfields 5. At Sevenoaks the rock
fragments found in the superficial deposits are mostly calcareous and silicified sandstones typical of the
. Hythe Beds but local accumulations of flint fragments are also found, presumably derived by erosion from
the more recent overlying deposits.
4. LOCATION AND DESCRIPTION OF THE UNSTABLE AREAS
The two areas (A and D) where instability occurred during construction are shown in Figure 2 together
with other areas (B, C, E, F, G and H) which, by their topographical features, indicated some history of
instability.
4.1 Area A
Instability developed at this site in April 1965 during the construction of a 13 m-high embankment
founded on the Hythe and Atherfield beds. The ground surface at this point dips towards the south at an
angle of about 8 degrees to the horizontal and to the north the ground rises sharply over the scarp of the
Hythe beds.
When the embankment had reached a maximum height of approximately 5 m, crescent-shaped
tension cracks developed in the outer 9 m of the embankment. Vertical movements subsequently occurred
along these cracks causing the southern half of the embankment to be depressed by about 1 m. Below the
embankment, ridges up to 1.5 m in height formed producing hummocky ground extending to the south
(see Plate 1). Observations made at the toe of the embankment showed that a horizontal movement of
about 2.5 m had occurred within a period of one week. The relative magnitudes of these movements
suggested that the failure was not of the purely rotational type, but had occurred along some composite
failure surface. This failure affected a length of about 45 m of the 150 m-long embankment. Figure 3,
Case 1 shows a cross-section through the embankment at the time of failure together with the proposed
final profile.
4.2 Area D
Early in 1965 an excavation was made to a maximum depth of 4 – 5 m into the Weald Clay for the
construction of a subway at this point. Concrete was placed over the floor of the excavation to form the
base of the foundation slab. The surface of the natural ground dips towards the south at an angle of about
7 degrees to the horizontal and hummocky ground was visible over a wide area. A clearly defined slip
surface, running parallel to and about 2 m below the ground surface, was encountered in the eastern face
of the excavation (see Plate 2). Where this slip surface intersected the base of the subway, cracking occurred
in the concrete across the full width of the slab. Further cracking and differential movements of the
concrete developed subsequently and water flooded the southern end of the excavation.
4.3 Other areas
Although problems of instability were only encountered in Areas A and D, inspection of the route of
the By-pass over the southern length together with an examination of the borehole records revealed add-
itional areas where some history of instability was indicated. All the areas shown in Figure 2 could be
identified from aerial photographs or detailed contoured maps of the site and had been briefly referred to
in a report on the site investigation carried out by Kent County Council in 1959.
3

For the purposes of the present Report the unstable areas will also be referred to as mudflows. This
term describes their general shape and reflects their probable mode of formation.
5. FIELD INVESTIGATIONS
To obtain information on the mudflows and the sections of the route between them, detailed ground
profiles were drawn, boreholes put down, and trial pits excavated. Most of the investigations were
restricted to the areas marked A, D, F and G and to the area between F and G where the construction of
a trial embankment was attempted.
The main aspects of the investigateions were :–
(i)
(ii)
(iii)
(iv)
A detailed survey of the unstable areas, shown in Figure 2.
Investigations of the ground-water conditions and the effect of counterfort drainage.
The recovery of samples containing established slip planes for laboratory strength tests.
Description and classification of the materials found within the mudflows and the determination
of the vertical and horizontal variation in their physical properties.
5.1 Mudflow A
The position of this mudflow is shown in Figure 2 and a sketch plan and block diagram to indicate
the geology are shown in Figures 4 and 5. Following the development of instability numerous boreholes
were put down in this area and both field and laboratory tests made to classify the main soil types and to
determine their strength parameters.
The positions of three of these boreholes, which were carefully augered by hand to search for slip
planes, are shown in Figure 4. After augering through the top soil a continuous sampling method was
adopted to locate the slip planes. This consisted of taking a sample in a sampling tube 150 mm long by
38 mm diameter, cleaning out the hole to the bottom of the sample and then repeating the procedure.
The samples were extruded from the tubes and scrutinised for slip planes as the work progressed. The
technique proved difficult below the water table but nevertheless a high proportion of samples was
recovered. When the boreholes had reached a depth of about 1.2 m water was encountered and rose to
within 0.5 m of the ground surface. A record of the materials found in these boreholes with their moisture
contents and the results of in-situ strength measurements using the shear-vane apparatus are shown in
Figures 6 and 7.
To locate the failure zone beneath the fill material, slip indicators were installed at a number of
positions across the partly+ ompleted embankment. Four lines of pegs were also installed on a 9-m grid at
the toe of the embankment as shown in Figure 4. Material was then imported and spread to provide an
additional 0.6 m of fill over the failed area of the embankment and the movements of the pegs and slip
indicators recorded. Movement of the lines of pegs commenced immediately additional filling was placed
and continued until loading had ceased. Large horizontal displacements of up to 500 mm were observed
for the line of pegs adjacent to the toe of the embankment. The accompanying vertical movements were
4

much smaller ‘(a maximum of 100 mm). Two days after the loading commenced the slip zones shown in
Figure 3, Case 1, were recorded by the slip indicators. The relative magnitude of the horizontal and
vertical movements of the peg lines together with the location of the slip zones confirmed that the initial
failure which had developed at this site was not of a purely rotational type.
A trench was then cut through the southern edge of the embankment (see Figure 4) to obtain further
information on the foundation materials and to search for established slip surfaces. A well developed slip
surface running approximately parallel to the ground surface was located over a limited length near the
base of the trench at a depth of 3.3 m, as shown in Figure 8.
5.2 Mudflow G
Information on the structure and composition of the mudflows was obtained from an excavation
made along the original line of the road in Mudflow G as part of a drainage trial (Fig. 9). The mudflow
materials were excavated to a firm foundation over a width of about 30 m, in short sections working from
east to west using dragline excavators to produce near-vertical sides. As the work progressed porous drains
and a drainage blanket one metre thick were placed in the base of the excavation and the original materials
recompacted over this layer. A process of progressive excavation and backfilling was used to restrict the
size of the works at any time and thereby to inhibit the development of failures in the northern face of
the excavation. A line of slip indicators was placed to the north of the excavation to give prior warning of
any major movements along this face and open-tube piezometers were installed to monitor the ground-
water conditions. Unfortunately many of these instruments were destroyed by construction traffic.
The work was hampered by small failures which continually occurred along the main western face of
the excavation. When the work was about two-thirds complete, tension cracks appeared in the higher
ground to the north and a failure developed over a section of the north face of the excavation (see Plate 3).
The instability was probably contributed to by the fact that at the time the excavation works had out-
stripped the backfilling and exceptionally high rainfall for the time of year occurred during the period of
the works.
Representative sections through the excavation and a key to their positions are shown in Figures 9 –
12. As can be seen from these figures the relations between the various beds are extremely complex. They
appear to be typical solifluxion deposits, showing signs of disruption by freezing and thawing and containing
large blocks of shattered chert and calcareous sandstone. As would be expected many of the beds attenuate
towards the south (downslope) resulting in differing dips to the top and bottom of the individual beds.
As a rule, however, the major slip planes observed in the sides of the excavation ran approximately parallel
to the ground surface.
As the excavation proceeded samples were taken for laboratory strength and classification tests and
records kept of the variation of moisture content and shear strength with depth.
5.3 Trial embankment
To obtain information on the stability of earthworks in the areas between the mudflows, the
construction of a trial embankment was attempted between Mudflows F and G. An inspection trench was
first dug in this area to obtain samples of the main material types and to search for established slip planes.
Records of the main material types encountered and the moisture-content and shear-strength profiles

(the latter measured using a field vane) are shown in Figure 13. Water began to enter this trench at a
depth of about 2.4 metres below the ground surface. No established slip surfaces were observed in the
inspection trench although the coarse materials in the upper layers showed many of the features of the
solifluxion deposits which comprise the mudflows. These coarse materials, which appeared to be less
disturbed than the materials observed in the upper layers of the mudflows, may form part of an older and
more extensive solifluxion sheet.
Before the construction of the embankment, piezometers were installed together with slip indicators,
settlement gauges, and lines of pegs, to record movements if a failure developed. The layout of the
instrumentation is shown in Figure 14. Embankment construction then commenced but had to be
abandoned in November 1965 when the fill had reached a height of 2.4 m because of adverse weather
conditions which rendered the site impassable to construction traffic. The instruments continued to be
read however until January 1966 when the piezometer installations were damaged by frost. Readings of
the instruments was then resumed in April 1966.
From the results the following general information was obtained on the changes in pore-water
pressure caused by embankment construction :–
1. A free water surface existed at a depth of about 2.1 m beneath the embankment area, before
construction commenced.
2. The increase in pore-water pressures caused by embankment construction was small to a depth
of about 3 – 4 m and these pore pressures dissipated fairly rapidly.
3. Below this level the magnitude of the pore-water pressures caused by the construction works
increased appreciably with depth and the rate of dissipation of these pore pressures decreased
with depth.
Figures 15 and 16 show examples of the relations between pore pressure and time and between the
excess pore pressure and depth.
5.4 Mudflow F
Mudflow F was chosen for a piezometer installation to record the ground-water conditions because
of its well defined physical limits and its relatively undisturbed condition.
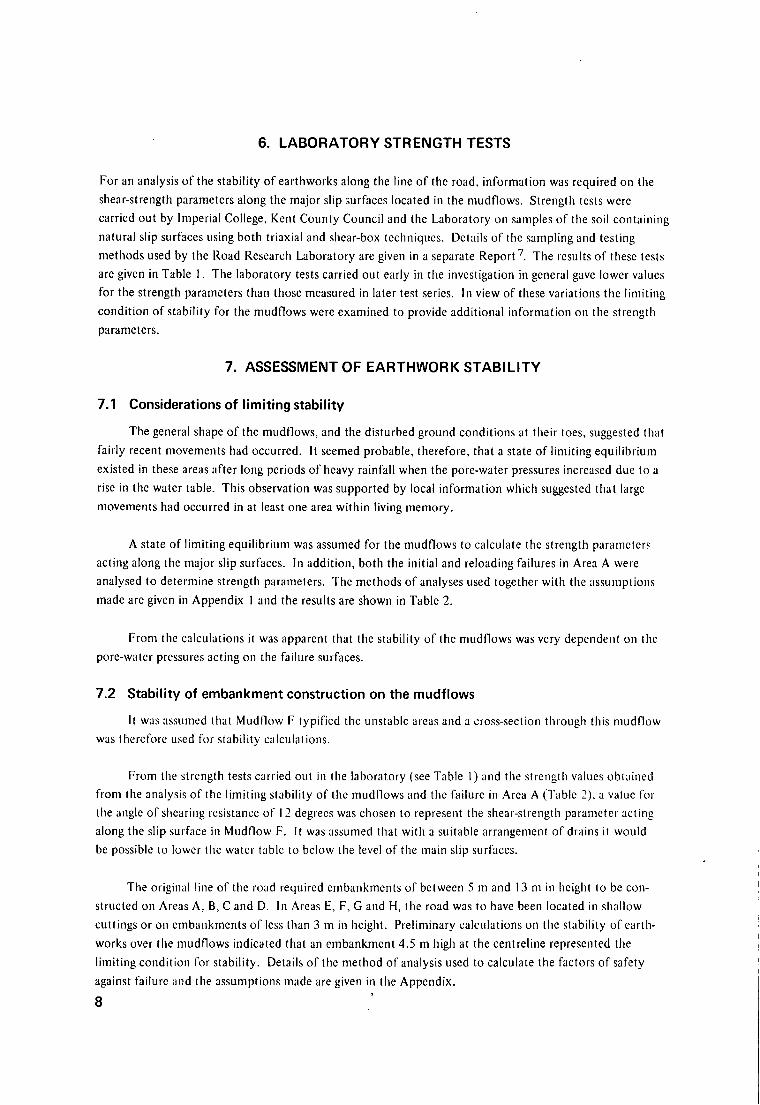
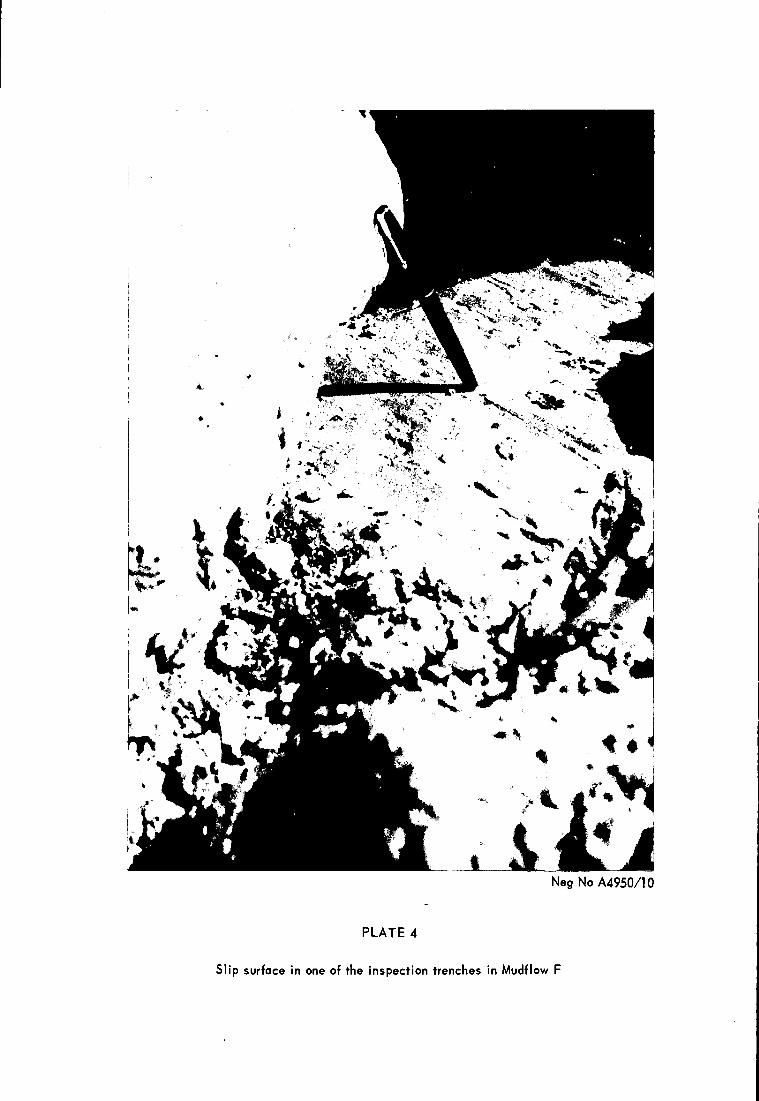
5.4.1 Structure of mudflow. An examination of the materials in trenches and trial pits excavated
into the mudflow showed them to have been extensively sheared with multiple slip-planes orientated in
many directions. A typical slip surface is shown in Plate 4. The detailed relations between the various
beds were obscure, as can be seen from the section through one of the trial pits shown in Figure 17.
Nevertheless some important features could be identified. A major shear zone having a dip of about
9 degrees to the horizontal was continuous across the section and detailed examination of this zone
revealed the presence of at least three slip surfaces.
Below the shear zone there was a plastic clay which overlaid what appeared to have been an old ground
surface. The dark organic clay shown in Figure 17 represented the top of the original soil profile.

5.4.2 Piezorneter observations. Open-tube piezometers were installed at 15 m intervals along the
centreline of the mudflow to alternate depths of 3.7 m and just above the level of the blue clay, which
ranged between 5 m and 9 m below the ground surface. Readings on the piezometers were commenced in
October 1965 and were continued throughout the following winter. The results showed that a water table
rose to within about 1 metre of the ground surface after long periods of heavy rain.
5.5 Mudlfow D
This area was selected for a trial to assess the reduction in the level of the water table which could
be achieved by installing counterfort drains. Open-tube piezometers were installed along the centreline
and at intervals across the mudflow (Figure 18). When reliable readings of the ground-water conditions
had been obtained from these piezometers, two counterfort drains, 18 m apart, were excavated on either
side of the main profile of piezometers. Each drain consisted of a trench 5 m deep by 0.9 m wide back-
filled with free-draining granular material. Construction commenced in mid-November 1965 on the
western drain, working from north to south down the mudflow. This drain was completed by the end of
December 1965 and work was then started on the eastern counterfort working from south to north. This
second drain was completed by the beginning of February 1966.
Reading of the piezometers was continued until the completion of the construction of the By-pass
in 1968. Figure 19 shows the distribution of pore pressure along the centre line of Mudflow D before and
after the construction of the counterfort drains. Some reduction in pore-water pressure was recorded by
piezometers at both depths during the period November 1965 to February 1966. Over the same winter
period an average increase in pore-water pressure of 0.5 m was measured on piezometers installed at similar
depths in Mudflow F. As would be expected from the timing of the construction of the drains the largest
changes in pore-water pressure were observed towards the southern end of the mudflow. The low pore-
water pressures measured in the central portion of the mudflow were probably caused by the earlier
construction of a cut-off drain on the southern side of the proposed line of the road and the excavation
for the subway mentioned in Section 4.2.
A detailed assessment of the long-term performance of these drains has been made by Kent County
Council 6. This showed that the drains were effective in reducing the fluctuations in water level at depths
in excess of 3 m and that they produced an average reduction in”pore-water pressure equivalent to 2 m of
water at depths of between 3 m and 4.5 m.
5.6 Conclusions from the field investigations
The information obtained during the field investigations showed that the mudflows were composed
of typical solifluxion deposits. Major slip surfaces running approximately parallel with the ground surface
were located in many of the excavations and in addition minor slip surfaces orientated more randomly
were observed in the materials above the major slip surfidce. Textural differences were noted between the
soil in which the slip surfaces were formed and the overlying soil.
Measurements in the unstable areas showed considerable longitudinal and vertical variations in the
pore-water pressures. In the upper 5 m of the mudflows the water table varied between I m and 4 m below
the ground surface. A trial of counterfort drainage installed at a depth of 5 m suggested that this would be
an effective method of reducing the level of the water table in the unstable mass.
6. LABORATORY STRENGTH TESTS
For an analysis of the stability of earthworks along the line of the road. information was required on the
shear-strength parameters along the major slip surfaces located in the mudflows. Strength tests were
carried out by Imperial College, Kent County Council and the Laboratory on somples of the soil containing
natural slip surfaces using both triaxial and shear-box techniques. Details of the sampling and testing
methods used by the Road Research Laboratory arc given in a separate Report 7. The results of these tests
are given in Table 1. The laboratory tests carried out early in the investigation in general gave lower values
for the strength parameters than those measured in later test series. In view of these variations the limiting
condition of stability for the mudflows were examined to provide additional information on the strength
parameters.
7. ASSESSMENT OF EARTHWORK STABILITY
7.1 Considerations of limiting stability
The general shape of the mudflows, and the disturbed ground conditions at their toes, suggested that
fairly recent movements had occurred. It seemed probable, therefore, that a state of limiting equilibrium
existed in these areas after long periods of heavy rainfall when the pore-water pressures increased due to a
rise in the w~ter table. This observation was supported by local information which suggested that Iargc
movements had occurred in at least one area within living memory.
A state of limiting equilibrium was assumed for the mudflows to calculate the strength parameters
acting along the major slip surfaces. In addition, both the initial and reloading failures in Area A were
analysed to determine strength parameters. The methods of analyses used together with the assumptions
made are given in Appendti I and the results are shown in Table 2.
From the calculations it was apparent that the stability of the mudllows was very dependent on the
pore-water pressures acting on the failure surFdces.
7.2 Stability of embankment construction on the mudflows
It was assumed that Mudflow F typified the unstable ~rcas and a cross-sec(ion through this mudflow
was therefore used for stability ctilculations.
From the strength tests carried out in the laboratory (see Table I ) and the strength values obttiincd
from the analysis of the limiting stability of the mudflows and the failure in Areu A (Table 2). a value fol
the angle of shearing resistance of 12 degrees was chosen to represent the shear-strength parameter ticting
along the slip surface in Mudflow F. It was tissumed that with a suitable arrangement of drains it would
be possible to Iowcr the water tublc to below [he level of the main slip surfi~ces.
The original line of the rotid required embankments of between 5 m and 13 m in height to be con-
structed on Areas A, B, C and D. In Areas E, F, G and H, the road was to have been located in shallow
cuttings or on embankments of less than 3 m in height. Preliminary calculations on the stability of earth-
works over the mudflows indicated that tin embankment 4.5 m high at the centreline represented the
limiting condition for stability. Details of the method of analysis used to calculate the factors of safety
against Fdilurc al]d the assumptions made are given in the Appendix.
8

Tests on ~~mples containing natur~l slip planes1 1
m
Sourcearea
F
G
G
G
G
G
B
F
MoisturecontentPer cent
37
41
DrydensityMg/m 3
Coefficient ofconsolidation
M ?/yr
ReferenceNo
R
L
RemarksTest typeand source
Three types ofclay; lightbrown, darkbrown, dnd grey
=1
Grey mottledbrown plasticclay
Blue-grey clayR.R.L.Triaxial
Grev mottled
I .33
l,~s
0.47 ~)
L6
— ___
0.30
0.78
10 I 7
B 37 I .30
K
M
3,)
38
1.30 0.30
*
1.31 0.27
0.34P Light b!ue-grey clay IJ
37
34
27
I .30
T
F?
t )
31 71 i S8I .3’) 0.20
+t
Atherfield clay
Weald (IuyImperialCollegeTriaxial
Weald Clay
317H
300HI I
WBl 36 Atherficld Clay
}
ImperialCollege
Atberfield Clay Shearbox
——— __ I——>
,
30
41 kAbove slip
28 73plane 4°
Below slippkrne S8
A
D
c
I .22 x o
414 0
r
Above slip- Above slip Above sli[plane 24 plane 4 I plane i 7
Below slip Below slip Below sliFplane 27 plane S7 plane 34
Above sli~
~c) 5xp[~nc 3 I
Below slippltine I 7
Above slit
46 1.24KentCountyCouncilShearbox
34 1.41
1.28 T14 0?4 I 73+
plane SS “
Below slipE 40
I I plane 48 ~
.. ,, ,, ,., ,, .,,“, ,,, . .,, ,, .. ,,, ,,.,,, ““, . . . .... .

TABLE 2
Angles of shearing resistance from considerations of limiting equilibrium
Analysis of mudflowsAnalysis of
embankment failures
Initial ReloadingUnstable areas D E F G Gt H failure failure
A A
Average ground
slope a from 7.5 6 6.5 5.3 5.8 8maps – degrees
0‘ – degrees 15 12 12.5 I0.5 11.5 16 13 11.5
f Analysis of failure during excavation
Figure 20 shows details of the cross section used and includes sixteen of the failure surfaces which were
considered. The results of the analyses are given in Table 3, Column 3.
The analyses assumed a composite failure surface, the central portion of which was coincident with
a major slip plane and parallel to the ground surface. The ends of the failure surface from the major slip
plane to the ground surface were arbitrarily chosen as two straight lines of fixed inclination to the horizontal
for all cases considered. The general shape of the failure surfaces, although consistent with the locations of
the failure surface given by the slip indicators in Area A, may not, therefore, represent the critical surfaces
along which a failure could develop. Although the assumptions are considered satisfactory for a preliminary
assessment of the stability, more rigorous analytical methods8 would be required for detailed design
purposes. The assumptions used in the analyses enabled examinations to be made both of failures causing
disruption within the embankment and of failures confined to the subsoil beneath the embankment.
The field investigations revealed that, although minor slip surfaces were present in the upper 5 m, the
materials in this zone were generally coarser in texture than the materials in which the major slip surface
had been formed. To take some account of this further stability calculations were performed using values
of the shear-strength parameters acting over the end surfaces different from those assumed for the central
portion of the slip surface. The results of stability calculations based on a 0‘ value of 14” acting over the
ends of the slip surface and a 0‘ value of 12” acting over the central portion are shown in Column 4 of
Table 3.
The results of the stability calculations indicated that an embankment 4.5 m high at the centre line
with side slopes of I in 2 would be close to a condition of limiting equilibrium. Further calculations
indicated that for a factor of safety of 1.3 the maximum height of embankment would have to be reduced
to about 2 m. Consideration was therefore given in the analysis to two construction expedients which
would provide an increase in the stability. These were slope-flattening and embankment construction
using light-weight fill. The assumptions and methods of analysis used are given in the Appendix and the
results are shown in Table 3 (Lower half of the Table and Column 5 ).
10

The results indicutc that an cmbfinkment 4.5 m high should have an adequate factor of safety if
constructed of light-weight fill with side-slopes of 1 in 4. The construction would also require an effective
druinage installation to lower the water-table to below the major slip surFdce. The cost of implementing
these measures would btive been very considerable and the further investigations required to assess the
validity of the assumptions would have considerably delayed the construction. Moreover embankments
greatly in excess of this height were required on the unstable areas to the west of Mudflow D. The most
economic and practical solution, therefore, was to realign the length of the By-pass affected by the
instability
TABLE 3
Results of stability analyses for a bank 4.5 m high at the centre line
Referencenumber
of analysis
III12
I617
Slicesincluded
in theanalysis
24–32~~_3~
20–3218–3216–3214–3212–32I0–327–32
3–3224–35~4_39
24–66
3–66
24–3224—35~4_39
26–35~~_35
Factorof safety
o’1=0’~=12”
0.901.101.251.401.551.65I .852~o
2.152.05
1.00] .~o
1.351.90
I .551.301.50
1.35I .40
Factorof safety.
0’1=12
0’~= 14°
I .00l-~o
1.351.501.60I .70I .902.25
2.152.10I.lo
1.30I .40I .90
1.751.451.(30
1.50I .55
—____
Factorof safety
for constructionin P.F.A. /
0’1=0’2=]q0
1.051.251.401.551.651.75I .90~.~5
~.15~.lo
1.151.40
I .451.90
1.651.45I .65
I .451.45
Southsideslope
lin2
lin4
{ Assumed bulk density : 1.5 Mg/m ~
7.3 Stability of cuttings in the mudflows
The stability of cuttings was not considered in the analyses as construction was to have been largely
on embtinkment over the length of the road under consideration. From general observations however it
would have been necess~ry to limit the construction of cuttings to very shallow depths. The stability would
then largely depend on the shear-strength parameters along the minor slip surfaces within the mudtlows.
11

The analyses of the overall stability of the mudflows indicated that an effective drainage installation would
be required before any permanent cutting could be made.
8. CONCLUSIONS
1. The original route of the Sevenoaks By-pass ctossed eight areas which showed signs of previous
instability within a 21Akm length at the southern end. These areas, which resembled mudflows in
their general shape, were composed of solifluxion deposits derived from the Hythe Beds and the
Weald and Atherfield clays.
2. Contained within the solifluxion materials were pre-existing slip surfaces running approximately
parallel with the natural ground surface. The shear-strength parameters along these slip surfaces
were at the residual value.
3. A major factor governing the feasibility of earthwork construction over these potentially unstable
areas is the requirement that the water table be depressed to a level below that of the main slip
surfaces. If this could have been achieved, an assessment of the stability indicated that embankments
of up to 4.5 m in height could have been constructed using lightweight fill together with reduced
side slopes.
4. The original alignment required embankments in excess of 5 m to be constructed on four of the
potentially unstable areas. The most economic and practical solution, therefore, was to relocate
the By-pass over the length affected by the instability.
9. ACKNOWLEDGEMENTS
The authors are grateful to the County Surveyor and staff of Kent County Council for their cooperation
and assistance during the site investigations. Thanks are also extended to Professor A.W. Skempton and
Dr. N. Morgenstern for the many helpful suggestions on the stability analyses. This work was carried out
in the Earthworks and Foundations Section of the Construction Division under the direction of W.A.
Lewis and the members of the research team who took part in the investigations were Dr. M.J. Dumbleton,
G. Margason, I.F. Symons, D. Farrar, G. West, A.I. Booth, M. Ryley, W. Cross and S. Maden (N.A.T,O.
scholar at RRL).
10. REFERENCES
1. MORGENSTERN, N.R. and J.S. Tchalenko. Microstructural observations on shear zones from slips
in natural clays. Proc. Geotechnical Conference, Oslo, 1967, Vol.1 pp. 147 – 152, Oslo, 1968.
@orwegian Geotechnical Institute).
2. SKEMPTON, A.W. and D.J. PETLEY. The strength along structural discontinuities in stiff clays.
Proc. Geotechnical Conference, OS1O, ] 967, Vol. 11 pp. 29 – 46 Oslo, 1968. Norwegian Geotechnical
Institute).
3. WEEKS, A.G. The stability of natural slopes in South East England as affected by periglacial activity.
Quart. J1. Engng. Geol. 1969 2,(1).
12

4.
5.
6.
7.
8.
9.
GALLOIS, R.W. British Regional Geology – The Wealden District. London 1965. @.M. Stationery
0ffice),4th edition.
HOLLINCSWORTH, S.E., TAYLOR J.H. and KELLOWAY G.A. Superficial structures of the
No[thamptonshire Ironfield. Quart. Journal Geol. Sot. 1944 pp. 1 – 44.
WEEKS, A.G. Effects of Counterfort Drains on the Sevenoaks By-pass. Civil Eng. and Public Works
Rev., 1969,64 (759) 991 – 3.
SYMONS, I.F. and M.R. CROSS. The determination of the shear strength parameters along natural
slip surfaces encountered during the Sevenoaks By-pass investigations. Ministry of Transport RRL
Report LR 139, Crowthorne, 1968,(Road Research bboratory ).
MORGENSTERN, N.R. and V.E. PRICE. The analysis of general slip surfaces. Geotechnique, 1965,
15(1),79–94.
JANBU, N., L. BJERRUM and B. KJAERNSLI. Stability calculations for fills, cuts and natural
slopes. Norwegian Geotechnical Institute, Publication No. 16, Oslo 1956 (Norwegian Geotechnical
Institute).
11. APPENDIX 1
11.1 Determination of the shear strength parameters along major slip surfaces located
within the mudflows
Assumptions
1. A slip surface parallel to the ground surface existed in Areas D, E, F, G and H.
2. The limiting stability condition (factor of safety= 1) occurred when the water table approached the
ground surface.
3. No artesian pressures existed below the level of the slip surface.
Method of analysis
The overall stability of the mudflows could be determined from the following expression: –
tan 4’(1 –ru Sec2a)F=—
tan a
where @‘ is the angle of shearing resistance,
a is the angle of inclination of the slip surface to the horizontal
‘u is the average pore-pressure ratio
F is the factor of safety against failure
From a contour map of the site the average angle of inclination of the ground surface to the
horizontal has been calculated for each of the areas of instability. From the range of the measured values
of the angle u and the available information on the ground-water conditions, ru Sec 2 ~ will be close to
13

0.5 for the critical conditions of stability.
tan @’x0.5F= —
tan ;
The expression for the factor of safety therefore rcduccs to:
and for a factor of safety equal to 1 the $’ value may be determined from the expression
tan ,+ = 2 tan ~
Using this expression the average values of $’ for the mudflows have been calculated for a limiting
condition of the stability. The results are shown in Table 2. The failure which occurred into Mudflow G
during the excavation has also been analysed in a similar manner to determine the strength v~lues along the
major slip surface. The same value of ru was used to take account of the excessively high rainfidtl which
occurred during the period of the excavation. The precipitation corresponded to a mean frequency of
occurrence of less than once in 100 years.
11.2 Determination of the shear strength parameters from an analysis of the embankment
failures in Area A
Assumptions
1.
9k.
3.
4.
5.
6.
7.
A tension crack existed through the fill material.
The failure occurred along a composite slip surface, the main part of which runs parallel to the
ground surface at a depth of about 3 m.
A natural water-table existed at a depth of 0.6 m below the original ground surface.
Embankment construction caused an excess pore pressure to be set up along the slip surface. The
ratio of this excess pore pressure to the pressure of the fill material was O.1.
The bulk density of the fill material was assumed to be 2.25 Mg/m 3. The bulk density of the
foundation material was assumed to be 1.90 Mg/m 3.
At failure the factor of safety was equal to 1.
No cohesion existed over the slip surface and the strength can be expressed solely in terms of the
angle of shearing resistance ( @).
Method of analysis
The method of analysis given by N. Janbu g has been used for these calculations. In this method the
cross section to be analysed is divided into a number of slices as shown in Figure 3 (Case I).
The assumptions made regarding the pore pressures along the major slip surface are consistent with
the”results obtained from the trial embankment area. The material types encountered in these two areas
show a general similarity.
A second analysis was carried out in Area A to consider the stability of the embankment on reloading.
The cross-section is shown in Figure 3 (Case 2). The same method of analysis was used as before and the
assumptions were the same except that the excess pore pressure due to the weight of the original fill was
assumed to have dissipated. A small excess pore pressure due to the additional fill was assumed and for
this a pore pressure ratio of 0.5 was chosen. The ~’ values obtained from these two analyses in Area A
are shown in Table 2.
14

11.3 Stability of embankment construction on the mudflows
Assumptions
1.
2.
3.
4.
5.
‘6.
7.
8.
A major slip surface existed parallel to the ground surface as shown in Figure 3.
Failure occurred along composite slip surfaces as shown in Figure 3.
The bulk density of the fill material was 2.25 Mg/m 3.
The bulk density of the foundation material was 1.90 Mg/m 3.
The cross -section was as shown in Figure 21 with an embankment height of 4.5 m at the centreline
of the road. The width of the embankment was assumed to be 34 m and the embankment had 1 in 2
side slopes.
No pore-water pressures acted on the assumed failure surface.
A constant $‘ value of 12” operated over the entire failure surface with no cohesion acting on this
surface.
A tension crack existed through the fill material.
Method of analysis
The method of analysis is the same as was used in Area A (Janbu’s method).
15

upper greensand (i . \
///,~,,, ,
~__________
Lower greensand
)V
V*
(Hythe beds and ~\
Atherfield clay)7
4%@
Sca[e 1:42240
A21I
Area of instability 1II‘(along original route
\
.’ .:.. . . . . . . . . . . .. .,..., ,.. .. . . . . . . . . .
. . . . ,. . . . “.. .. .,. .’. . .
. ..- . . . . . . . ..~... . .. . . . .. . . . . . . . . . . . . . . . . .
I.-
. . . . . . .. . .
I: 1!” ~
.... .............. ..wea[dclay........~~... ::~’,”;.....’..... . .. . . . . . .. . . . . . . . “.. ” . .
.,. . . . . . . . . . . . . ~... . . . . . . . .,,. . . . . . . . . . . . .. . . . . . .. . .“. . . . . .. . . . . . . . . ..” j.. . . . . . . .
. . . . . . . ..”. . . . . .. . . . . . .. . . . . . . . . . . ...” . ,.
,.’ .. .. . . . . . . .. . . .. . .
. . . . .. . . . ,. .,. .,. . . . . . . . . . . . . .,., . . 1To: .. .” ...:....,
.’. . . . . . . . . . . . . . . . . . . . . .. . . . . . .. . Ton bridge .. J ...,...... . . . . . . . . .. . . . . .. . . . . ...”, .
. . . . ..’. ..-. . . . . . . . . . . . . .“. . . .
Fig.1 PLAN OF SEVENOAKSBV-PASS SHOWINGSITEOF INSIABILITV ANO GENERALGEOLOCV

o0mb. .
I
w
i
w
w
mu

I/
/II//

Fig. L. $KEICH PLAN OF UNSTAELEAREA Al CHAINAOE 280 ( Mudflow A)
Proposed position
.- /.
Fig.5. BLOCK DIAGRAM TO SHOW RELATION OF MUOFLOW TO STRUCTURE ANO TOPOGRAPHY

Ground level 150”4 m above O.D,---- ---- - -—Topsoil I---— ---— _ 1
mattied brown .with some stones
----- ---
Grey claymottled brown
Sandy, silty qreyclay
k
-“
Moisture content (per cent )25 35 45 55
I 1 I
o 20 40 60 80
Shear strength (kN/m2)
BORE HOLE I
Moisture content (percent)
Ground level 149.9m above O.D. 20 30 40 50 60 70 80 9(--—- ——-- ---I I I I I
Topsoil-— --- ---- -
k
Grey sandy silty claywith some stones
(stones are predominantly‘ hassock’)
---- ---- -
Grey plastic clay
L
-——- —--— --
Blue grey plastic clay
---- --—- --
Blue grey claymottled brown
u
~1
J
Q
I 1 I I
20 40 60 80Shear strength (kN/m2)
BOREHOLE 3
Fig.6. MAIN SOIL TYPES FOUND IN BOREHOLES 1 AN03 IN AREA ~ TOGETHER WITH
SHEAR-STRENGTH ANO MOISTURE-CONTENT PROFILES

Moisture content (percent )
Ground level 1507m above 0.0.---- ------–n
Topsoil—— -- -——- --—
kGrey sandy silty clay
with stonesWater ~
Blue grey claymottled brown
k—-— ——- ———rFragmented laminated
blue clay
-—- -—-— ——-
Stiff blue clay
t
0 20 40 60 80 100
Shear strength (kN/m2)
BOREHOLE 2
Fig.7. MAIN SOIL TVPES FOUNO IN BOREHOLE 2 IN AR EA’A’TOGETHER WITH
SHEAR-STRENGTH ANO MOISTURE-CONTENT PROFILES “

3m
[
Approximate
-Fill Toe of
3
Fig. 8. SKETCH SECTION THROUGH EASTERN FACE OF TRENCH IN AREA ●A’
SHOWING MAIN MATERIAL TYPES ANO MAJOR SLIP PLANE

Approximate
o 10 20 mI I 1
E c----— ---- --—- -——— -
Line of road origina[
G
\/ --/ =--
/
---- ---- --P F D
~’~
Undulating ground
Fig. 9. PLAN OF MUOFLOW G POSITIONS OF
ME ASUREO DURING EXCAVATION
SECTIONS ANO PROFILES
(See Figs 10-12)

North Topsoil,
Original ground levelSandy s~t~c~y ;i~ many rock fragments
——_ ___ South
Light brown mottled grey plastic clay———— ———— ——-Stiff brown fissured~-——_ ____ __
fissured clay (Weald clafi
East face of excavation (section A-B)
west.. -—.
East Slip planes
\61ue grey clay with some stones _ _- 335m
Brown sandy silty clay with some stones
Fissured blue claY
South face of excavation (Smtion B-D)
Disturbed
gound
BrownPtastic c[ay
~Blue ctay
Blue-greyclay with
shp plones
lro~ ~asti~clay
-PeatyEm
brown clay
I
proti[e at locality p
Fig 10 MUOFLOW G. (Chainage 333) - MATERIAL TYPES ENCOUNTERED IN THE EXCAVATION
A proximate
,,’,,’ “
—- –,.’

southOrigina( ground level
Siope approx 5 degrees
Mixture of topsoil and light brown clay_-—
Blue mottled brown fragmented clay ------
Light blue-grey fissured clay _—-— ——— -———— ——— —-—— —-
Chocolate brown C[aywith blocky jron stone
[
Em
at the base
Approximate
West face of excavdion( Section C-D)No slip planes detected in this section
o~
Ftg.11. MUDFLOW G (Choinoge 333) MATERIAL TYPES
ENCOUNTERED IN THE EXCAVATION

West East
Topsoil ___________– _--——— ———---
---- ———- —.
—--— ——-——
—-—— —---Light blue fissured clay
Part of north face of excavation (Section E-C)
West
Iron stone band Topsoil removed
East Brown and grey clayBrown clay s[,~—— __
E
1~
————-——- ———-- —__ ____ ——_ ___———_ ____ ~~a~e——— —— __m
Brown clay
Fil[
oEDrainageo 5m
South face of excavation (Section F-D)
layer
North
Dark brownMinor slip planes Zone of multiple slip ptanes
peaty claySandy stony
South clayGrey plasticclay
Red - brown
siliceous band
Grey and bro~plastic c[ay
Stiff blue
West face of excavation (Section E-F)
Fig.12 SECTIONS SHOWINGMATERIAL TYPES ENCOUNTERED
THE EXCAVATION IN MUOFLOW L. (Chainage 333)
fissured clay
IN

m
u
-&
L

~ Groups of c[osed-tube piezorneterso Open-tube slip indicators
+ Settlement gaugesJ K slip indicator pegs
o 20m
E G~~pCut off drain
Fenceditch
-/,.
06 05 o~
Section ‘C’
—— — _ I— —
~:—— — _
Section ‘B’ , Section ’0’I
I Section ~I 4 I
ABC”
Note: Section ‘O;A;B;C;’D are fill zones
Fig. 14 PLAN Of THE TRIAL EMBANKMENT SHOWING THE LAVOUT OF THE INSTRUMENTATION
.,. ,,, ,,,,, ,, .,, ,,, ,,, ,,, ,,, ,, ,,. ,,.

Oct. Nov. Dec. 1965 Jan. 19663.0
20
1’0
0
I
I
I I
I II I
I
I I
8.0 - I I IDepth of piezometer 7.9m
70 - I
II I
? 60 -I
I
I In I.- A2
I—._ —________ ,, . . . .I
;
1,
Depth of piezometer 6.1 moN I‘: &o -
A 18I
co
Depth of piezometer 5.5m. A17
/
3 <~w
.——. Depth of piezometer L9mo
; 2“0 - I I
zAIL I
4P —— . -.—-__;w I I
!$O- I IDepth of piezometer 3,7m
I
Fig. 15, REL4TIONS BETWEEN POREpRE$SUREAND TIME FOR PIEZOMETERS IN GROUPA’
BENEATH THE TRIAL EMBANKMENT IN SEC TIOH.O’

2
3
4
5
6
7
8
9
.Ground level
For height of fill onSection ‘0 see Fig. 15
k
4
Excess pore pressure ( metres of water)
Fig. 16. RELATION BETWEEN EXCESS PORE PRESSURE ANO OEPTH FOR PIEZOMETERS
IN GROUP ‘E’ BENEATH THE TRIAL EMBANKMENT IN SECTION ‘O’

South
North
@
Comp~ex of sitty c[ays, silts,sands and stony material
soft
@
I@
@1
grey c[ay
Origin of measurements130.L m above O.D.
Ironstone band
Soft khaki clay
East faceof Tr;a[ Pit uDark blue clay in boreholeat depth of 18m
Fig, 17. MUOFLOW F TRIAL PIT F2

+ 230( 106mdeep)
231 ●
;T o 229RFORT
232 ●EAST
COUNT ERFORT.
0228
233 ●
O 227
2180 2200 2223
A 217 A 219 A’221
2160
23L ●
~ 201 Proposed—. .—2030 2020
A 207 A 20L235 ●
I
o L5m
Fig. 18 PLAN
O 208
211 0 2090
A212 A 210
213 0
● 236
2230
● 237
22L o
● 23a
2250
● 23g
2260
2050 routeA 206
2150
A 214
.
Stream ~
OF PIE20METER INSTALLATION IN MUOFLOW O

01 I I
o ~ o 0m &
(Ja]DMJo saJ]aw) aJnssaJd Ja]aWOZ~!d
mN
.-L

Eo
m
o‘1
II
\
(748) Dd 635271 2,500 6/71 H.P. Ltd., G1915


Slip plan
Neg No B2630/65
PLATE 2
Eastern face of subway excavation - Mudflow D
——— —

I
II
.
I,
&
Neg No A4950/10
PLATE 4
Slip surface inoneof the inspection trenches in Mudflow F

ABSTRACT
Investigation of the stability of earthwork construction on the original line of Sevenoaks
by-pass, [(ent: I. F. SYMONS, 3.SC., A. M.Inst. H. E., and A. 1. BOOTH, B.SC.: Depart-ment of the Environment, RRL Report LR 393: Crowthorne, 1971 (Road Research Labora-tory). Instability developed early in 1965 during the construction of earthworks on thesouthern length of the Sevenoaks By-pass, Kent. The By-pass was subsequently realignedover this length. This Report describes some of the investigations carried out along theline of the original route and considers the stability of the earthworks.
The investigations revealed eight areas where some history of instability was indi-cated. The materials within these areas were found to contain natural slip surfaces runningapproximately parallel with the ground surface. The main factor governing the feasibilityof earthwork construction across these areas was the requirement that the water table inthe unstable areas be depressed to a level below that of the main slip surface and main-tained at that position. If this could be achieved, preliminary stability calculations showedthat an embankment about 5 m in height could be constructed using light-weight fill andside-slopes of 1 in 4.
ABSTRACT
Investigation of the stability of earthwork construction on the original line of Sevenoaksby-pass, l(ent: 1. F. SYMONS, 3.SC,, A.h!,Inst.fi. E., and A. 1. 300TH, 3.SC.: Depart-ment of the Environment, RRL Report LR 393: Crowthorne, 1971 (Road Research Labora-tory). Instability developed early in 1965 during the construction of earthworks on thesouthern length of the Sevenoaks 3y-pass, Kent. The ~y-pass was subsequently realigned
over this length. This Report describes some of the investigations carried out along theline of the original route and considers the stability of the earthworks.
The investigations revealed eight areas where some history of instability was indi-cated. The materials within these areas were found to corltain natural slip surfaces runningapproximately parallel with the ground surface. The main factor governing the feasibilityof earthwork construction across these areas was the requirement that the water table inthe unstable areas be depressed to a level below that of the main slip surface and main-tained at that position. If this could be achieved, preliminary stability calculations showedthat an embankment about 5 m in height could be constructed using light-weight fill andside-slopes of 1 in 4.


