Community development, transformation and deprived communities

RNA-Seq Analysis of Sulfur-Deprived Chlamydomonas CellsReveals Aspects of Acclimation Critical for Cell Survival W
David Gonzalez-Ballester,a,1 David Casero,b Shawn Cokus,b Matteo Pellegrini,b,c Sabeeha S. Merchant,c,d
and Arthur R. Grossmana
a Department of Plant Biology, Carnegie Institution for Science, Stanford, California 94305b Department of Molecular, Cell, and Developmental Biology, University of California, Los Angeles, California 90095-1606c Institute of Genomics and Proteomics, University of California, Los Angeles, California 90095d Department of Chemistry and Biochemistry, University of California, Los Angeles, California 90095-1569
The Chlamydomonas reinhardtii transcriptome was characterized from nutrient-replete and sulfur-depleted wild-type and
snrk2.1 mutant cells. This mutant is null for the regulatory Ser-Thr kinase SNRK2.1, which is required for acclimation of the
alga to sulfur deprivation. The transcriptome analyses used microarray hybridization and RNA-seq technology. Quantitative
RT-PCR evaluation of the results obtained by these techniques showed that RNA-seq reports a larger dynamic range of
expression levels than do microarray hybridizations. Transcripts responsive to sulfur deprivation included those encoding
proteins involved in sulfur acquisition and assimilation, synthesis of sulfur-containing metabolites, Cys degradation, and
sulfur recycling. Furthermore, we noted potential modifications of cellular structures during sulfur deprivation, including the
cell wall and complexes associated with the photosynthetic apparatus. Moreover, the data suggest that sulfur-deprived
cells accumulate proteins with fewer sulfur-containing amino acids. Most of the sulfur deprivation responses are controlled
by the SNRK2.1 protein kinase. The snrk2.1 mutant exhibits a set of unique responses during both sulfur-replete and sulfur-
depleted conditions that are not observed in wild-type cells; the inability of this mutant to acclimate to S deprivation
probably leads to elevated levels of singlet oxygen and severe oxidative stress, which ultimately causes cell death. The
transcriptome results for wild-type and mutant cells strongly suggest the occurrence of massive changes in cellular
physiology and metabolism as cells become depleted for sulfur and reveal aspects of acclimation that are likely critical for
cell survival.
INTRODUCTION
The dominant form of sulfur (S) in terrestrial and aquatic habitats
is usually the sulfate anion (SO422), the most oxidized form of S.
Animals do not have the enzymatic machinery needed for re-
ducing SO422 to sulfide (S22), which is required to synthesize
most S-containing compounds. Plants and microbes have spe-
cific transporters that efficiently import SO422 into cells, where
it is activated and then reduced to S22 for incorporation into
S-containing amino acids and other molecules, such as
S-adenosylmethionine (SAM),GSH, FeSclusters, thionucleosides,
sulfolipids, vitamins, and enzyme cofactors, such as CoA (CoA),
molybdopterin, thiamine, or biotin. However, most organisms
have a low capacity to store S and thus have developed diverse
acclimation strategies that optimize S use and balance the rate of
S metabolism with S availability. These processes allow organ-
isms to remain viable even when S is severely limiting to growth.
The alga Chlamydomonas reinhardtii (Chlamydomonas
throughout) has been used as a model organism for studying
responses of photosynthetic eukaryotes to S deprivation. S-
responsive processes in this alga include rapid changes in cell
size (Zhang et al., 2002), elevated production of hydrolytic
extracellular enzymes (de Hostos et al., 1989; Takahashi et al.,
2001), alterations in cell wall structure (Takahashi et al., 2001),
changes in the activities and composition of the photosynthetic
apparatus (Collier and Grossman, 1992; Wykoff et al., 1998;
Zhang et al., 2004), elevated SO422 transport activity (Yildiz et al.,
1994; Pootakham et al., 2010), and the synthesis of enzymes
(plus the encoding transcripts) required for efficient S assim-
ilation (Ravina et al., 1999, 2002; Gonzalez-Ballester and
Grossman, 2009). Moreover, in the last 5 years, S-depleted
Chlamydomonas cells have been used for microarray-based
RNA abundance studies (Zhang et al., 2004; Nguyen et al., 2008),
determination of metabolite profiles (Bolling and Fiehn, 2005),
and sustained production of H2 (Ghirardi et al., 2007). Many
studies of S-deprived plants have also been performed
(Lewandowska and Sirko, 2008; Kopriva et al., 2009); some of
these studies include determinations of transcript levels and
metabolite profiles (Hirai et al., 2003; Maruyama-Nakashita et al.,
2003; Nikiforova et al., 2003, 2005a, 2005b; Lunde et al., 2008).
A number of regulatory elements controlling S deprivation re-
sponses in Chlamydomonas have been identified. The sulfur accli-
mation gene SAC1 encodes a polypeptide with homology to Na+/
SO422 transporters (SLC13 family). However, the protein appears to
function as a sensor that responds to extracellular SO422 levels
1 Address correspondence to [email protected] author responsible for distribution of materials integral to thefindings presented in this article in accordance with the policy describedin the Instructions for Authors (www.plantcell.org) is: Arthur R. Grossman([email protected]).WOnline version contains Web-only data.www.plantcell.org/cgi/doi/10.1105/tpc.109.071167
The Plant Cell, Vol. 22: 2058–2084, June 2010, www.plantcell.org ã 2010 American Society of Plant Biologists

rather than as a transporter (Davies et al., 1996; Moseley and
Grossman, 2009). The sac1 mutant exhibits marked reduction in
accumulation of many transcripts encoding proteins associated
with S acclimation responses (Takahashi et al., 2001; Ravina et al.,
2002; Zhang et al., 2004) and rapidly loses viability following
exposure to S deprivation; the loss of viability is a consequence of
the inability of the cells to decrease photosynthetic electron trans-
port activity (Wykoff et al., 1998). However, transcription from some
S-responsive genes does not show an absolute dependence on
SAC1. For example, the sac1 mutant still develops a considerable
level of high affinity SO422 transport activity (Davies et al., 1996) and
accumulates transcripts encoding SO422 transporters in response
to S deprivation (Gonzalez-Ballester et al., 2008).
Two other genes encoding regulatory proteins that control S
deprivation responses have been extensively characterized; they
are the plant-specific SNF-1 related kinases SNRK2.1 and
SNRK2.2 (the latter is also known as SAC3) (Davies et al., 1999;
Gonzalez-Ballester et al., 2008). SNRK2.2 is responsible for re-
pression of S-inducible genes when cells are replete for S (Davies
et al., 1999; Ravina et al., 2002; Gonzalez-Ballester et al., 2008). It
may also be involved in repression of chloroplast transcription
during S deprivation (Irihimovitch and Stern, 2006). The SNRK2.1
kinase is required for most S-responsive gene expression and for
maintaining cell viability during S deprivation. S-responsive gene
expression and cell viability are more severely impacted in snrk2.1
than in the sac1mutant during S deprivation (Pollock et al., 2005;
Gonzalez-Ballester et al., 2008). Moreover, while SAC1 and
SNRK2.2 do not show a clear epistatic relationship, SNRK2.1 is
epistatic to SNRK2.2. Recently, it has been suggested that SAC1
may act as a negative modulator of SNRK2.2 activity during S
deprivation (Moseley et al., 2009). Figure 1 shows a simplified
diagram of the relationship among the different regulatory factors
and the putative interactions associated with the acclimation of
Chlamydomonas cells to S deprivation.
The recently developedRNA-seq technology (Wanget al., 2009)
has made genome-wide transcript analyses both sensitive and
quantitative. Here, we report on the use of RNA-seq technology to
evaluate the responses of wild-type (the parental strain of the
mutant) and the snrk2.1 mutant of Chlamydomonas to S depri-
vation. A comparison of RNA-seq, microarray, and quantitative
RT-PCR (qRT-PCR) results demonstrated reduced sensitivity of
microarray analyses for estimating changes in mRNA abundance,
especially for low abundance transcripts, relative to the RNA-seq
platform. Furthermore, these RNA-seq studies have yielded large,
quantitative data sets for transcript abundance in wild-type and
snrk2.1mutant cells, both during S starvation and nutrient-replete
growth. The data strongly suggest the occurrence of novel
changes in cellular structures and metabolic pathways as wild-
type cells acclimate to S deprivation. The data also define detailed
responses of the snrk2.1 mutant to S deprivation.
RESULTS AND DISCUSSION
Design, Statistical, and Comparative Analyses
We examined genome-wide transcript abundance in Chlamydo-
monas wild-type and snrk2.1 mutant cells during growth in both
nutrient-replete (designated +S) and S-depleted (2S) conditions.
RNA-seq and microarray profiling were used to determine the
abundance of transcripts associated with eachChlamydomonas
gene model (based on Joint Genome Institute [JGI] Chlre v.3.1)
for each experimental condition (wt +S, wt –S, snrk2.1 +S, and
snrk2.1 –S). The abundance of selected transcripts was also
determined by qRT-PCR. Total RNA isolated from cells 6 h after
they were transferred to2S and +S medium was used for RNA-
seq. By 6 h after the cells were placed in –S conditions, the
abundances of most of the induced transcripts had peaked. The
sameRNA preparations were also used for bothmicroarrays and
qRT-PCR analyses. Microarray hybridizations were also per-
formed with RNA isolated from cells that were transferred from
+S to both –S and +S conditions for 1 and 24 h. Genome-wide
RNA-seq coverage graphs are available on a public installation of
the UCSC genome browser at http://genomes.mcdb.ucla.edu/
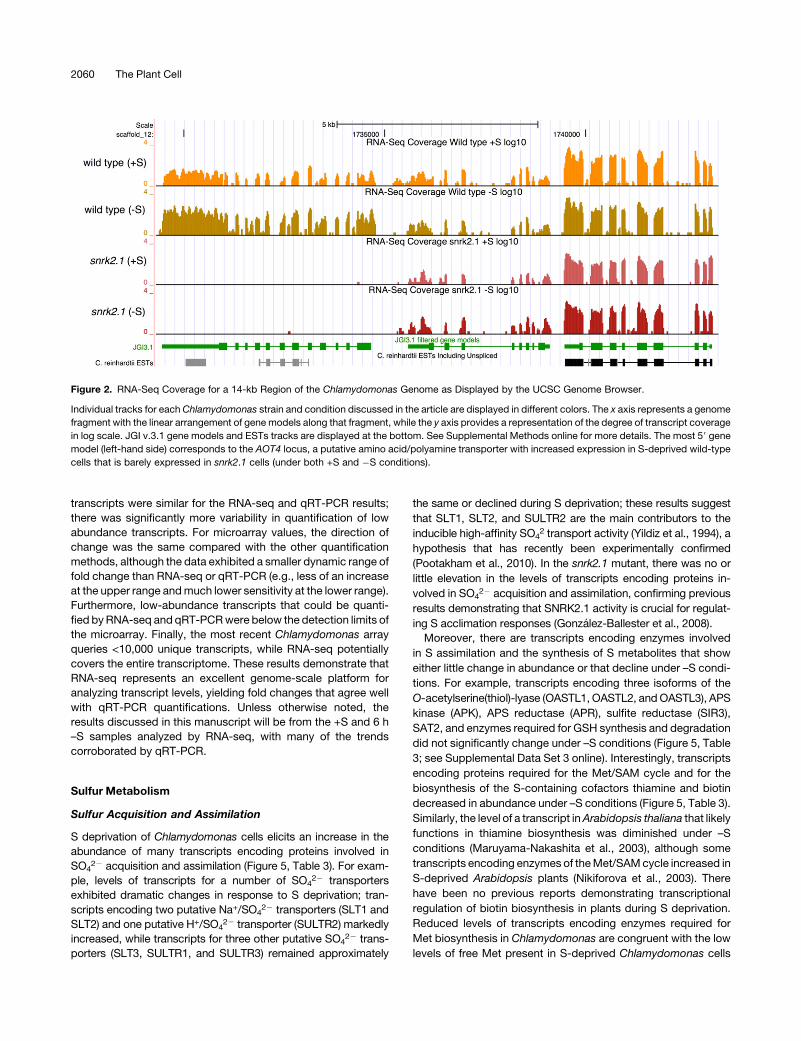
CreSulfur/. A browser image of a 14-kb region of the Chlamydo-
monas genome is shown in Figure 2.
Fold changes in transcript abundances using each of the
techniques are presented in Supplemental Data Set 1 online.
Transcripts with significant fold changes, as determined by RNA-
seq, are grouped into categories, as shown in Figure 3 and
Supplemental Data Set 2 online. An overview of the physiological
functions related to these transcript categories is presented in
Table 1, with an emphasis on differences between wild-type and
snrk2.1 mutant cells. Finally, some genes have been grouped
according to their putative functionalities, independent of their
relative expression levels (Supplemental Data Set 3 online).
Table 2 and Figure 4 show the correlations as fold change of
transcript abundance for cells transferred from +S to –S condi-
tions measured by RNA-seq, microarray hybridizations, and
qRT-PCR. The levels of moderate and high abundance
Figure 1. Model for S Deprivation–Responsive Gene Regulation.
(A) and (B) Simplified diagrams of gene regulation in wild-type cells in +S
and –S conditions, respectively.
(A) In the presence of S, SAC1 is inactive and SNRK2.2 inhibits
SNRK2.1-activated expression of S-responsive genes, leading to basal
level expression.
(B) In S-deficient conditions, active SAC1 blocks SNRK2.2 inhibition of
SNRK2.1, allowing full expression of S-responsive genes. This model is
based on one previously developed by Moseley et al. (2009).
Chlamydomonas S-Deprived Transcriptome 2059
transcripts were similar for the RNA-seq and qRT-PCR results;
there was significantly more variability in quantification of low
abundance transcripts. For microarray values, the direction of
change was the same compared with the other quantification
methods, although the data exhibited a smaller dynamic range of
fold change than RNA-seq or qRT-PCR (e.g., less of an increase
at the upper range andmuch lower sensitivity at the lower range).
Furthermore, low-abundance transcripts that could be quanti-
fied byRNA-seq and qRT-PCRwere below the detection limits of
the microarray. Finally, the most recent Chlamydomonas array
queries <10,000 unique transcripts, while RNA-seq potentially
covers the entire transcriptome. These results demonstrate that
RNA-seq represents an excellent genome-scale platform for
analyzing transcript levels, yielding fold changes that agree well
with qRT-PCR quantifications. Unless otherwise noted, the
results discussed in this manuscript will be from the +S and 6 h
–S samples analyzed by RNA-seq, with many of the trends
corroborated by qRT-PCR.
Sulfur Metabolism
Sulfur Acquisition and Assimilation
S deprivation of Chlamydomonas cells elicits an increase in the
abundance of many transcripts encoding proteins involved in
SO422 acquisition and assimilation (Figure 5, Table 3). For exam-
ple, levels of transcripts for a number of SO422 transporters
exhibited dramatic changes in response to S deprivation; tran-
scripts encoding two putative Na+/SO422 transporters (SLT1 and
SLT2) and one putative H+/SO422 transporter (SULTR2) markedly
increased, while transcripts for three other putative SO422 trans-
porters (SLT3, SULTR1, and SULTR3) remained approximately
the same or declined during S deprivation; these results suggest
that SLT1, SLT2, and SULTR2 are the main contributors to the
inducible high-affinity SO42 transport activity (Yildiz et al., 1994), a
hypothesis that has recently been experimentally confirmed
(Pootakham et al., 2010). In the snrk2.1 mutant, there was no or
little elevation in the levels of transcripts encoding proteins in-
volved in SO422 acquisition and assimilation, confirming previous
results demonstrating that SNRK2.1 activity is crucial for regulat-
ing S acclimation responses (Gonzalez-Ballester et al., 2008).
Moreover, there are transcripts encoding enzymes involved
in S assimilation and the synthesis of S metabolites that show
either little change in abundance or that decline under –S condi-
tions. For example, transcripts encoding three isoforms of the
O-acetylserine(thiol)-lyase (OASTL1, OASTL2, andOASTL3), APS
kinase (APK), APS reductase (APR), sulfite reductase (SIR3),
SAT2, and enzymes required for GSH synthesis and degradation
did not significantly change under –S conditions (Figure 5, Table
3; see Supplemental Data Set 3 online). Interestingly, transcripts
encoding proteins required for the Met/SAM cycle and for the
biosynthesis of the S-containing cofactors thiamine and biotin
decreased in abundance under –S conditions (Figure 5, Table 3).
Similarly, the level of a transcript inArabidopsis thaliana that likely
functions in thiamine biosynthesis was diminished under –S
conditions (Maruyama-Nakashita et al., 2003), although some
transcripts encoding enzymes of theMet/SAMcycle increased in
S-deprived Arabidopsis plants (Nikiforova et al., 2003). There
have been no previous reports demonstrating transcriptional
regulation of biotin biosynthesis in plants during S deprivation.
Reduced levels of transcripts encoding enzymes required for
Met biosynthesis in Chlamydomonas are congruent with the low
levels of free Met present in S-deprived Chlamydomonas cells
Figure 2. RNA-Seq Coverage for a 14-kb Region of the Chlamydomonas Genome as Displayed by the UCSC Genome Browser.
Individual tracks for each Chlamydomonas strain and condition discussed in the article are displayed in different colors. The x axis represents a genome
fragment with the linear arrangement of gene models along that fragment, while the y axis provides a representation of the degree of transcript coverage
in log scale. JGI v.3.1 gene models and ESTs tracks are displayed at the bottom. See Supplemental Methods online for more details. The most 59 gene
model (left-hand side) corresponds to the AOT4 locus, a putative amino acid/polyamine transporter with increased expression in S-deprived wild-type
cells that is barely expressed in snrk2.1 cells (under both +S and �S conditions).
2060 The Plant Cell

(Bolling and Fiehn, 2005), while Met levels in Arabidopsis plants
subjected to S deprivation do not decline (Nikiforova et al.,
2005b).
Like the transcriptional regulator SLIM1 from Arabidopsis
(Maruyama-Nakashita et al., 2006), the Chlamydomonas
SNRK2.1 kinase controls expression of many genes encoding
proteins critical for SO42 uptake, reductive assimilation of SO4
22
to Cys, and S recycling (see section below: Redistribution and
Recycling of S). However, transcriptional regulation of thiamine
biosynthesis and Met/SAM cycle genes does not appear to be
directly controlled by SNRK2.1, and there is no evidence
suggesting that SLIM1 controls these genes in Arabidopsis
(Maruyama-Nakashita et al., 2006); the activity of these genes
may be impacted by the levels of S metabolites in both
Chlamydomonas and Arabidopsis.
Despite the finding that Met levels in Arabidopsis do not
decrease during S deprivation, SAM levels in Arabidopsis do
decline (Nikiforova et al., 2005b); we would also expect the SAM
levels in Chlamydomonas to decline, although they were not
directly measured. SAM potentially represents a large drain on
theMet pool; 80% of theMet synthesized in Lemna paucicostata
cells may be consumed in the SAM pathway, with only ;20%
routed to protein synthesis (Giovanelli et al., 1985). Hence,
reduced levels of SAM may impact several metabolic pathways
including those responsible for the synthesis of thiamine, chlo-
rophyll, polyamines, and lipids. Therefore, not unexpectedly and
as previously observed in plants (Hirai et al., 2003; Maruyama-
Nakashita et al., 2003; Nikiforova et al., 2003), the levels of
numerous transcripts encoding proteins associated with these
biosynthetic pathways in Chlamydomonas were significantly
affected during S deprivation (see Supplemental Data Set 2
online).
In this study, we also identified two transcripts encoding
putative amino acid/polyamine transporters (AOT2 and AOT4)
that increased in S-deprived wild-type cells. The absolute abun-
dance of the AOT4 transcript was;8.5 times higher than that of
AOT2. Interestingly, the AOT4 transcript was almost undetect-
able in snrk2.1 cells maintained in either +S or –S conditions
(Figure 2, Table 3), indicating that this gene is under stringent
SNRK2.1 control. An increase in theAOT4 transcript level did not
occur in phosphorous-depleted (2P) or nitrogen-depleted (2N)
cells (Figure 6A). Although the only amino acid–specific transport
activity that has been demonstrated inChlamydomonas is for Arg
(Kirk and Kirk, 1978), the existence of additional amino acid
transporters has been proposed (Perez-Alegre and Franco,
1998), and recently we demonstrated that wild-type Chlamydo-
monas cells, unlike the snrk2.1mutant, were able to grow slowly
Figure 3. Cluster Diagrams Depicting the Fold Change in Transcript
Levels Determined by RNA-Seq.
The log2 relative expression values of 1.5 and �1.5 were selected as the
thresholds to designate the categories of transcripts that accumulate (or
are more abundant) and decline (or are less abundant), respectively, for
wild type –S/wild type +S (I) and snrk2.1 –S/wild type –S (II) conditions.
For more details about each of the categories, see Methods. The number
of different transcripts in each category is indicated in the appropriate
sector. Areas are proportional to the numbers of genes within the specific
category. A short description of each category is given below. A,
transcripts that accumulate in wild-type cells in –S conditions; A1,
transcripts that accumulate in wild-type cells in –S conditions and that
are relatively less abundant in the mutant in –S conditions; A2, transcripts
that accumulate in wild-type cells in –S conditions and that are relatively
more abundant in the mutant in –S conditions; A3, transcripts that
accumulate in wild-type cells to approximately the same extent as in
mutant cells in –S conditions; B, transcripts that decline in wild-type cells
in –S conditions; B1, transcripts that decline in wild-type cells in –S
conditions and that are relatively more abundant in mutant cells in –S
conditions; B2, transcripts that decline in wild-type cells in –S conditions
and that are relatively less abundant in mutant cells in –S conditions; B3,
transcripts that decline in wild-type cells and decline to approximately
the same extent in mutant cells in –S conditions; C1, transcripts that are
more abundant in mutant cells than in wild-type cells in –S conditions
and that do not change significantly in wild-type cells in –S conditions;
C2, transcripts that are less abundant in mutant cells than in wild-type
cells in –S conditions and that do not change significantly in wild-type
cells in –S conditions. Additional information for all genes included in this
figure can be found in Table 1 and Supplemental Data Set 2 online.
Chlamydomonas S-Deprived Transcriptome 2061

with Cys, but not with Met, taurine, or homocysteine, as a sole S
source (see Supplemental Figure 1 online). These results raise the
possibility that the AOT2 and AOT4 transporters function in the
uptake of Cys from the environment. Alternatively, they may par-
ticipate in the redistribution of internal S-containing amino acids
and/or polyamines among the different cellular compartments.
Redistribution and Recycling of S
Several proteins encoded by transcripts that accumulated dur-
ing –S conditions may be related to Cys degradation and/or to
the recycling and redistribution of intracellular S (Figure 7). Cys
dioxygenase (CDO) catalyzes the conversion of Cys to 3-sulfi-
noalanine (Figure 7), a key metabolite implicated in the control of
Cys homeostasis and taurine biosynthesis in animal cells. The
transcript from a putative CDO1 gene increased in Chlamydo-
monas wild-type cells by ;28-fold during –S conditions (Table
3). Despite the potential importance of recycling S-containing
amino acids, there are no reports to our knowledge that dem-
onstrate CDO activity in plants, and the CDO gene has only
recently been identified in bacteria (Dominy et al., 2006). Inter-
estingly, theCDO1 gene ofChlamydomonas is clustered in a tail-
to-tail orientation with the PWR1 gene (Pro-Trp-Arg motif) of
unknown function whose transcript increased in abundance by
;76-fold during –S conditions. The levels of transcripts for both
CDO1 and PWR1 are under the control of the SNRK2.1 kinase.
Taurine/a-ketoglutarate dioxygenase (TAUD), which catalyzes
the conversion of taurine to SO322 and aminoacetaldehyde, may
also be integral to the Cys degradation pathway (Figure 7). Two
putative TAUD genes (TAUD1 and TAUD2) were found on the
Chlamydomonas genome; the transcripts from these genes
increased by 142- and 37-fold, respectively, in S-deprived
wild-type cells (Table 3). Exposure of the cells to 2P and –N
conditions did not alter TAUD1 or TAUD2 transcript levels (Figure
6B). The TAUD1 and TAUD2 genes are clustered together with
another gene of unknown function (ID: 143415) that is also
responsive to S levels; S deprivation elicited a 128-fold increase
in the transcript from the latter gene. Furthermore, all three of the
transcripts are under SNRK2.1 kinase control. While no TAUD
homologs have been identified in plants or animals, the putative
TAUD proteins of Chlamydomonas have significant similarity to
bacterial and fungal TAUD/TfdA family proteins (;19 to 35%
identity), as shown in Supplemental Figure 2 online. Moreover,
the Escherichia coli TauD, the Saccharomyces cerevisiae
YLL057c, and the Pseudomonas syringae AtsK a-ketoglutarate
dioxygenases can efficiently metabolize various sulfonates in
addition to taurine (Eichhorn et al., 1997; Hogan et al., 1999;
Kahnert et al., 2000). Similarly, the putative TAUD proteins of
Chlamydomonas might use alkanesulfonates other than taurine.
For example, it is possible that TAUD functions in degrading
chloroplast sulfolipids such as sulfoquinovosyl diacylglycerol
(SQDG) (Figure 7); much of the sulfolipid may represent an S
Table 1. General Overview of Metabolic Pathways and Cellular Processes for Which Related Transcripts Accumulate or Decline in Wild-Type and
snrk2.1 Mutant Cells during –S Conditions
Specific in the Wild Type Common in the Wild Type and snrk2.1 Mutant Specific in snrk2.1 Mutant
Upregulated
A1 A2+A3 C1
S acquisition and assimilation (to Cys)
Routing and recycling of S
Remodeling of PSII antenna (LHCBM9)
Cell wall and periplasmic proteins
(HAPs, ARSs, and ECPs)
SQDG synthesis
Oxidative pentose phosphate pathway
CAH9
Others
Stress-related LHC proteins
Others
Oxidative stress (singlet oxygen)
Proteolysis-related genes
Vacuolar and vesicular transport
Apoptosis
Lipid degradation
Pro degradation
Putrescine biosynthesis
Low CO2-inducible genesa
Shikimate biosynthesis (SHKG1)
CoA biosynthesis
Others
Downregulated
B1 B2+B3 C2
tRNA biosynthesisb
Transcription and translation processesb
Polyamine biosynthesis
Others
Met, SAM, thiamine, and biotin biosynthesis
Photosynthesis and chlorophyll biosynthesis
Carbon and folate metabolism
Plastid ribosomesc
Amino acid biosynthesisc
Lipid metabolism
Purine and pyrimidine metabolism
Others
S assimilation (APK and APR)
Urea/Arg cycle
Carbon fixation
Others
A1, A2, A3, B1, B2, B3, C1, and C2 designate the same group categories described in Figure 3 and Supplemental Data Set 2 online. Footnotes
indicate exceptions.aSome transcripts were more abundant in snrk2.1 mutant relative to wild-type cells in +S conditions.bSome transcripts were also diminished in snrk2.1 mutant cells.cSome transcripts were not diminished in snrk2.1 mutant cells.
2062 The Plant Cell
storage compound that can be rapidly mobilized when cells
become S limited (Sugimoto et al., 2007). However, neither CDO
nor TAUD polypeptides of Chlamydomonas appear to have
presequences, suggesting that they function in the cytosol.
TheChlamydomonas genome also contains a number of other
genes encoding putative sulfurtransferases that may be involved
in the turnover of S compounds in the cell or in synthesizing new
S-containing compounds. The rhodaneses are sulfurtransfer-
ases thought to be involved in the synthesis of a diverse set of
compounds, including molybdopterin, thiamin, CoA, biotin,
lipoic acid, and iron-sulfur clusters (Kessler, 2006). Chlamydo-
monas has three genes (RDP1, 2, and 3) encoding small poly-
peptides that are part of a relatively poorly characterized family of
rhodanese proteins (Bordo and Bork, 2002). TheRDP3 transcript
rapidly and specifically accumulateswhen cells are deprived of S
(;17-fold increase); this response is SNRK2.1 dependent (Table
3, Figure 6C). Moreover, Cys degradation can also occur
via a 3-sulfinoalanine–independent pathway that generates a
3-mercaptopyruvate intermediate, which can be reduced by a
mercaptopyruvate sulfotransferase (MST; designated TST in
Chlamydomonas) (Figure 7). MST activity may also be part of
the mechanism involved in detoxification of H2S in Arabidopsis
(Riemenschneider et al., 2005). The MSTs/TSTs are related
to rhodaneses, with common sequence motifs and similar
physicochemical properties (Colnaghi et al., 2001; Bordo and
Bork, 2002), raising the possibility that RDP3 is involve in the
3-sulfinoalanine–independent metabolism (Figure 7).
Cys desulfurases (CSDs), like the rhodanases, have also been
proposed to act as sulfurtransferases. Like RDP3, the Chlamy-
domonas CSD2 transcript increasedwhen cells were deprived of
S; this increasewas SNRK2.1 dependent (Table 2). Hence, RDP3
and CSD2 may both be associated with redistribution of S
among pools of metabolites, which could be crucial under
conditions in which cells are limited for S.
Alternatively, rhodaneses and CSDs, which are able to bind
selenium, may function in the detoxification of selenate or as
selenium delivery proteins for the synthesis of selenocysteine, as
has been suggested by others (Ogasawara et al., 2005; Mueller,
2006). The link between selenium and S homeostasis is sup-
ported by the findings that transcripts encoding several seleno-
proteins, including SELW1, MSP1, and two selenium binding
proteins, accumulated in Chlamydomonas cells deprived of S
and that this accumulation was dependent on SNRK2.1 (see
Supplemental Data Set 2A online).
A major S-containing metabolite generated by pathways that
recycle S from Cys is SO32, which at high concentrations is
cytotoxic. However, SO322 can be detoxified by oxidization to
SO422 by sulfite oxidase (SUOX), as has been suggested for
Arabidopsis SUOX (Hansch et al., 2007). Chlamydomonas has a
SUOX gene that encodes an animal-type enzyme with a putative
mitochondrial targeting sequence. Increased accumulation of
the SUOX transcript during –S conditions supports the hypoth-
esis that S deprivation in Chlamydomonas promotes the degra-
dation of Cys and other S-containing metabolites. The SO422
generated by SUOX could be routed back into chloroplasts
where it can be either incorporated into Cys by reductive assim-
ilation or directly used for sulfation of molecules through the
PAPS pathway. SUOX activity allows for SO422 regeneration in
S-depleted cells and therefore may be required to maintain
PAPS-dependent metabolism during –S conditions (Figure 7).
Although the substrate specificities of CDO1, TAUD1, TAUD2,
RDP3, CSD2, and SUOX1 need to be clarified, the coordinated
increases in their transcript levels in wild-type cells experiencing
S deprivation indicates the critical nature of this group of
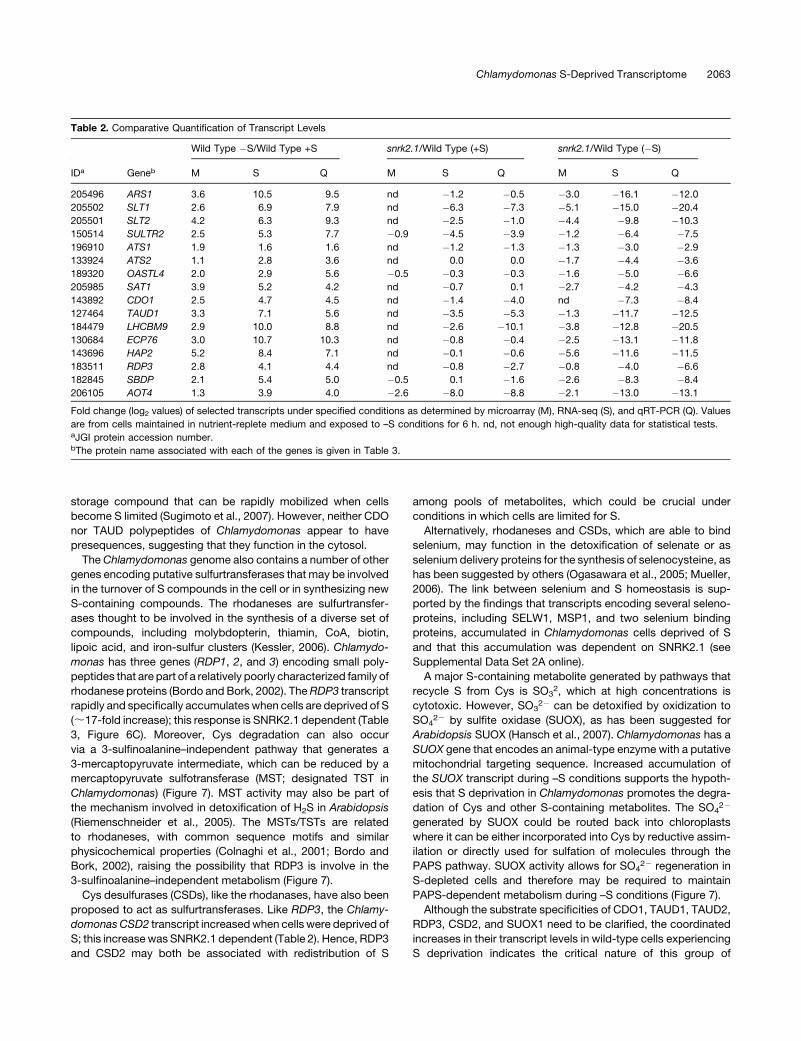
Table 2. Comparative Quantification of Transcript Levels
Wild Type �S/Wild Type +S snrk2.1/Wild Type (+S) snrk2.1/Wild Type (�S)
IDa Geneb M S Q M S Q M S Q
205496 ARS1 3.6 10.5 9.5 nd �1.2 �0.5 �3.0 �16.1 �12.0
205502 SLT1 2.6 6.9 7.9 nd �6.3 �7.3 �5.1 �15.0 �20.4
205501 SLT2 4.2 6.3 9.3 nd �2.5 �1.0 �4.4 �9.8 �10.3
150514 SULTR2 2.5 5.3 7.7 �0.9 �4.5 �3.9 �1.2 �6.4 �7.5
196910 ATS1 1.9 1.6 1.6 nd �1.2 �1.3 �1.3 �3.0 �2.9
133924 ATS2 1.1 2.8 3.6 nd 0.0 0.0 �1.7 �4.4 �3.6
189320 OASTL4 2.0 2.9 5.6 �0.5 �0.3 �0.3 �1.6 �5.0 �6.6
205985 SAT1 3.9 5.2 4.2 nd �0.7 0.1 �2.7 �4.2 �4.3
143892 CDO1 2.5 4.7 4.5 nd �1.4 �4.0 nd �7.3 �8.4
127464 TAUD1 3.3 7.1 5.6 nd �3.5 �5.3 �1.3 �11.7 �12.5
184479 LHCBM9 2.9 10.0 8.8 nd �2.6 �10.1 �3.8 �12.8 �20.5
130684 ECP76 3.0 10.7 10.3 nd �0.8 �0.4 �2.5 �13.1 �11.8
143696 HAP2 5.2 8.4 7.1 nd �0.1 �0.6 �5.6 �11.6 �11.5
183511 RDP3 2.8 4.1 4.4 nd �0.8 �2.7 �0.8 �4.0 �6.6
182845 SBDP 2.1 5.4 5.0 �0.5 0.1 �1.6 �2.6 �8.3 �8.4
206105 AOT4 1.3 3.9 4.0 �2.6 �8.0 �8.8 �2.1 �13.0 �13.1
Fold change (log2 values) of selected transcripts under specified conditions as determined by microarray (M), RNA-seq (S), and qRT-PCR (Q). Values
are from cells maintained in nutrient-replete medium and exposed to –S conditions for 6 h. nd, not enough high-quality data for statistical tests.aJGI protein accession number.bThe protein name associated with each of the genes is given in Table 3.
Chlamydomonas S-Deprived Transcriptome 2063

enzymes for the catabolism of Cys and/or sulfolipids, and redis-
tributing intracellular S as the cells achieve a new homeostasis.
Furthermore, the redistribution and recycling of S-containing
molecules is likely under SNRK2.1 control since CDO1, TAUD1,
TAUD2, SUOX1, RDP3, and CSD2 transcripts are significantly
diminished in the snrk2.1 mutant relative to wild-type cells
(Table 3).
Sulfolipid Degradation and Synthesis
Whereas there is a rapid decline in the SQDG level in S-deprived
Chlamydomonas cells (Sugimoto et al., 2007), the enzymes that
catalyze SQDG degradation have not been identified, although
they appear to be synthesized de novo after the cells are
deprived of S (Sugimoto et al., 2009). The genes involved in
this process may be under SNRK2.1 control and among those
placed in category A1 in Figure 3 and in Supplemental Data Set 2
online. Transcripts potentially involved in sulfolipid degradation
during exposure of Chlamydomonas to –S conditions encode
TAUD1, TAUD2 (discussed above), and a putative lipase (JGI ID:
144554) (Table 3), although this possibility will require experi-
mental validation.Arabidopsis plants also show some increase in
the catabolism of sulfolipids during S deprivation. However, this
degradation may reflect a general increase in lipid catabolism
rather than a specificmechanism for recycling S (Nikiforova et al.,
2005b); indeed, the SQDG levels in Arabidopsis plants trans-
ferred to –S conditions do not significantly decline (Okazaki et al.,
2009). Instead, in Arabidopsis and other members of the Brassi-
caceae, glucosinolates may serve as an intracellular S reserve
that can be rapidly catabolized under conditions of S limitation
(Maruyama-Nakashita et al., 2003; Nikiforova et al., 2005b).
Surprisingly, S deprivation elicited an increase in three tran-
scripts that have been associated with SQDG synthesis: SQD1,
SQD2, and LPB1 (Figure 7, Table 3). Increases in these tran-
scripts were not observed in the snrk2.1 mutant (this work); an
increase in SQD1mRNA was also demonstrated to be impacted
by both the sac1 and sac3 lesions (Zhang et al., 2004; Sugimoto
et al., 2009). SQD1 and SQD2 encode UDP-sulfoquinovose
synthase and sulfolipid synthase, respectively (Sato et al., 1995).
LPB1 (for Low Phosphate Bleaching protein) (Chang et al., 2005)
is similar to UDP-glucose pyrophosphorylase 3 of Arabidopsis,
which is involved in the synthesis of UDP-glucose, the precursor
of sulfolipids (Okazaki et al., 2009). The LPB1 transcript was
elevated in cells exposed to2S, but not in cells exposed to2Por
–N conditions (Figure 6D). Elevated levels of SQD1, SQD2, and
LPB1 transcripts during –S conditions are congruent with the
increased capacity for SQDG biosynthesis previously observed
in S-deprived Chlamydomonas cells (Sugimoto et al., 2009).
Photosynthesis
S-deprived Chlamydomonas cells exhibit a marked decline in
photosynthetic electron transport that has been associated with
a SAC1-dependent decrease in photosystem II (PSII) activity
(Wykoff et al., 1998). Moreover, sac1 and snrk2.1 mutants
photobleach and die after ;3 to 6 d of being transferred to
medium devoid of S, while wild-type cells can survive for signif-
icantly longer periods (Davies et al., 1996; Gonzalez-Ballester
et al., 2008). These results suggest that both SAC1 and SNRK2.1
are important for tuning photosynthetic activitywhen the cells are
starved for S and that this tuning is critical for cell viability.
Many transcripts encoding proteins associated with PSII,
photosystem I (PSI), light-harvesting complexes (LHC) of PSI
(LHCA) and PSII (LHCB), subunits of the cytochrome b6f com-
plex, photosynthetic electron transport, and chlorophyll biosyn-
thesis declined when Chlamydomonas was exposed to 2S
Figure 4. A Comparison of Fold Change (Log2) Values of Transcript
Levels Measured by RNA-Seq, Microarrays, and qRT-PCR.
(A) Fold change (log2) values for individual transcripts between two
experimental conditions in which the RNA levels were quantified by
microarray analyses (x axis) and were then compared with corresponding
values calculated from RNA-seq experiments (y axis).
(B) Fold change (log2) values for individual transcripts between two
experimental conditions in which the RNA levels were quantified by qRT-
PCR analyses (x axis) and then compared with corresponding values
obtained by RNA-seq experiments (y axis). The pairs of experimental
conditions compared include wild type �S/wild type +S; snrk2.l –S/wild
type –S; snrk2.1 +S/wild type +S, with all time points for –S correspond-
ing to 6 h after the onset of S deprivation.
2064 The Plant Cell

conditions (see Supplemental Data Sets 2B and 3 online). A
similar decrease in chlorophyll content and transcripts encoding
proteins of the photosynthetic apparatus also occur in plants.
Among the transcriptsmost sensitive to S deprivation were those
encoding highly conserved members of the LHCBM protein
family (Elrad and Grossman, 2004) that comprise the bulk of the
peripheral PSII antennae. The mRNAs encoding LHCBM1-8
polypeptides declined after 6 h of S deprivation, with a more
severe decline after 24 h (Figure 8A, Table 3). Levels of these
transcripts were even lower in the snrk2.1 mutant than in wild-
type cells (Figure 8B, Table 3). By contrast, the LHCBM9 tran-
script, which was barely detectable when Chlamydomonas cells
were grown in +S medium, increased by >1000-fold during S
deprivation (see Supplemental Data Set 2 online) and was the
second most abundant mRNA in wild-type S-depleted cells (see
Supplemental Data Set 1 online). Recently, an increase in the
LHCBM9 transcript level during S deprivation was noted by
others (Nguyen et al., 2008). This –S-dependent increasewas not
observed in the snrk2.1 or sac1 mutants (Figure 8C), suggesting
that LHCBM9 is a direct target of the S-sensing regulatory
pathway; there was no increase in LHCBM9 mRNA when wild-
type cells were exposed to 2P or –N conditions (Figure 6E).
Figure 5. Pathways for S Acquisition and Assimilation.
Genes encoding the proteins of these pathways are labeled with colors, indicating the fold change (log2) of their transcript levels under S deprivation
relative to nutrient-replete conditions for wild-type cells based on RNA-seq data (color code is given in the figure). The proteins encoded by each of
the genes represented in the pathway diagram are given in Table 3. Dashed lines represent multiple metabolic steps. Asterisks represent genes
that showed altered expression in snrk2.1 mutant relative to wild-type cells upon S deprivation. APS, adenosine 59-phosphosulfate; PAPS, adenosine
39-phosphate 59-phosphosulfate; S2�, sulfide; OAS, O-acetyl-serine; OPH, O-phosphohomoserine; SAH, S-adenosyl-homocysteine; S-a.a, sulfur-
containing amino acids.
Chlamydomonas S-Deprived Transcriptome 2065

Table 3. Expression Levels of Selected S-Regulated Genes
Fold Change Expression (Log2)
Wild Type �S/Wild Type +S
snrk2.1/Wild Type(+S)
snrk2.1/Wild Type(�S)
Transcript Abundance (RPKM)a
ID Name/Description S Q S Q S QWildType �S
WildType +S
snrk2.1�S
snrk2.1+S
Sulfur acquisition and assimilation
205496 ARS1, arylsulfatase (ext) 10.5 9.5 �1.2 �0.5 �16.1 �12.0 2717 2 0 1
55757 ARS2, arylsulfatase (ext) 8.2 12.2 1.0 �2.9 �11.1 �15.1 84 0 0 1
205502 SLT1, Na+/SO42� transporter
type (p)
6.9 7.9 �6.3 �7.3 �15.0 �20.4 2341 20 0 0
205501 SLT2, Na+/SO42� transporter
type (p)
6.3 9.3 �2.5 �1.0 �9.8 �10.3 1339 17 1 3
150514 SULTR2, H+/SO42� transporter
type (p)
5.3 7.7 �4.5 �3.9 �6.4 �7.5 152 4 2 0
196910 ATS1, ATP sulfurylase 1.6 1.6 �1.2 �1.3 �3.0 �2.9 2137 723 275 305
133924 ATS2, ATP sulfurylase (chl) 2.8 3.6 0.0 0.0 �4.4 �3.6 254 36 12 37
128906 SULP1, chl. SO42�
transport system
2.4 �0.6 �3.4 147 28 14 18
116547 SULP2, chl. SO42�
transport system
1.5 �0.7 �2.2 56 20 12 12
182359 SBP1, chl. SO42�
transport system
1.5 �1.1 �2.7 79 28 12 13
194724 SABC (CysA), chl. SO42�
transport system
2.4 �0.3 �2.8 20 4 3 3
184419 APK, APS kinase (chl.) 0.4 1.3 0.5 �0.7 �1.7 �1.6 39 29 12 41
131444 APR (MET16), APS
sulforeductase (chl.)
0.5 1.4 �0.9 0.8 �2.3 �0.6 285 197 57 105
206154 SIR1, ferredoxin-sulfite
reductase (chl.)
2.0 �1.1 �2.3 124 31 26 14
205485 SIR2, ferredoxin-sulfite
reductase
2.2 �0.7 �2.2 597 126 132 80
189320 OASTL4a, O-acetylserine(thiol)-
lyase (chl.)
2.9 5.6 �0.3 �0.3 �5.0 �6.6 976 128 31 103
205985 SAT1a, serineacetyl
transferase (chl.)
5.1 4.2 �0.7 0.1 �4.3 �4.3 794 23 40 14
24268 CGS1 (METB), cystathionine
g-synthase (chl.)
–1.6 �0.6 1.4 23 71 63 49
127384 THS1, Thr synthase (chl.) �1.4 �0.7 �0.3 54 138 42 84
196483 METC, cystathionine
b-lyase (chl.)
�0.5 �0.5 1.3 24 34 57 24
154307 METE, Met synthase – �0.6 0.2 46 606 54 395
76715 METH1, Met synthase
(cobalamin)
– �0.9 �0.2 33 134 29 72
195332 METH2, Met synthase
(cobalamin)
– �0.8 1.1 30 211 65 123
182408 METM, S-adenosylmethionine
synthetase
– �0.2 �0.3 526 2288 420 1976
129593 SAH1, S-adenosylhomocysteine
hydrolase
– �0.4 �0.9 152 1298 83 952
183928 DCA1, S-adenosylmethionine
decarboxylase
– �0.3 1.5 54 184 149 146
206104 AOT2, a.a/polyamine
transporter (p)
4.1 3.6 �5.5 �2.4 �9.8 �6.3 36 2 0 0
206105 AOT4, a.a/polyamine
transporter (p)
3.9 4.0 �8.0 �8.8 �13.0 �13.1 311 21 0 0
185190 THI4a, thiazole biosynthetic
enzyme
– �0.1 �2.8 203 1859 29 1682
196899 THI4b, THI4 regulatory protein – �0.1 �2.8 188 1715 27 1557
192720 THICa, hydroxymethylpyrimidine
phosphate synthase
– �0.4 �3.3 6 95 1 74
196900 THICb, hydroxymethylpyrimidine
phosphate synthase
– �0.4 �3.4 6 92 1 72
142289 BIOB1, biotin synthase – 1.1 �0.5 2 10 1 23
97943 BIOB2, biotin synthase – �0.1 �1.6 23 86 8 77
(Continued)
2066 The Plant Cell
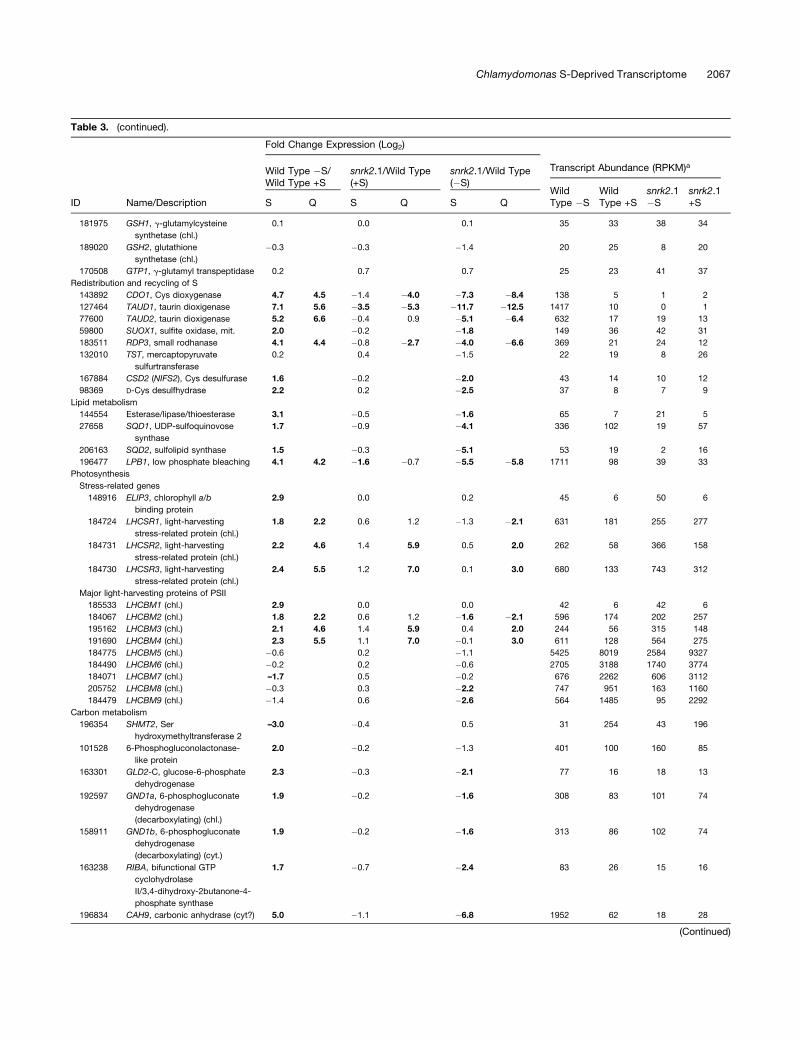
Table 3. (continued).
Fold Change Expression (Log2)
Wild Type �S/Wild Type +S
snrk2.1/Wild Type(+S)
snrk2.1/Wild Type(�S)
Transcript Abundance (RPKM)a
ID Name/Description S Q S Q S QWildType �S
WildType +S
snrk2.1�S
snrk2.1+S
181975 GSH1, g-glutamylcysteine
synthetase (chl.)
0.1 0.0 0.1 35 33 38 34
189020 GSH2, glutathione
synthetase (chl.)
�0.3 �0.3 �1.4 20 25 8 20
170508 GTP1, g-glutamyl transpeptidase 0.2 0.7 0.7 25 23 41 37
Redistribution and recycling of S
143892 CDO1, Cys dioxygenase 4.7 4.5 �1.4 �4.0 �7.3 �8.4 138 5 1 2
127464 TAUD1, taurin dioxigenase 7.1 5.6 �3.5 �5.3 �11.7 �12.5 1417 10 0 1
77600 TAUD2, taurin dioxigenase 5.2 6.6 �0.4 0.9 �5.1 �6.4 632 17 19 13
59800 SUOX1, sulfite oxidase, mit. 2.0 �0.2 �1.8 149 36 42 31
183511 RDP3, small rodhanase 4.1 4.4 �0.8 �2.7 �4.0 �6.6 369 21 24 12
132010 TST, mercaptopyruvate
sulfurtransferase
0.2 0.4 �1.5 22 19 8 26
167884 CSD2 (NIFS2), Cys desulfurase 1.6 �0.2 �2.0 43 14 10 12
98369 D-Cys desulfhydrase 2.2 0.2 �2.5 37 8 7 9
Lipid metabolism
144554 Esterase/lipase/thioesterase 3.1 �0.5 �1.6 65 7 21 5
27658 SQD1, UDP-sulfoquinovose
synthase
1.7 �0.9 �4.1 336 102 19 57
206163 SQD2, sulfolipid synthase 1.5 �0.3 �5.1 53 19 2 16
196477 LPB1, low phosphate bleaching 4.1 4.2 �1.6 �0.7 �5.5 �5.8 1711 98 39 33
Photosynthesis
Stress-related genes
148916 ELIP3, chlorophyll a/b
binding protein
2.9 0.0 0.2 45 6 50 6
184724 LHCSR1, light-harvesting
stress-related protein (chl.)
1.8 2.2 0.6 1.2 �1.3 �2.1 631 181 255 277
184731 LHCSR2, light-harvesting
stress-related protein (chl.)
2.2 4.6 1.4 5.9 0.5 2.0 262 58 366 158
184730 LHCSR3, light-harvesting
stress-related protein (chl.)
2.4 5.5 1.2 7.0 0.1 3.0 680 133 743 312
Major light-harvesting proteins of PSII
185533 LHCBM1 (chl.) 2.9 0.0 0.0 42 6 42 6
184067 LHCBM2 (chl.) 1.8 2.2 0.6 1.2 �1.6 �2.1 596 174 202 257
195162 LHCBM3 (chl.) 2.1 4.6 1.4 5.9 0.4 2.0 244 56 315 148
191690 LHCBM4 (chl.) 2.3 5.5 1.1 7.0 �0.1 3.0 611 128 564 275
184775 LHCBM5 (chl.) �0.6 0.2 �1.1 5425 8019 2584 9327
184490 LHCBM6 (chl.) �0.2 0.2 �0.6 2705 3188 1740 3774
184071 LHCBM7 (chl.) –1.7 0.5 �0.2 676 2262 606 3112
205752 LHCBM8 (chl.) �0.3 0.3 �2.2 747 951 163 1160
184479 LHCBM9 (chl.) �1.4 0.6 �2.6 564 1485 95 2292
Carbon metabolism
196354 SHMT2, Ser
hydroxymethyltransferase 2
–3.0 �0.4 0.5 31 254 43 196
101528 6-Phosphogluconolactonase-
like protein
2.0 �0.2 �1.3 401 100 160 85
163301 GLD2-C, glucose-6-phosphate
dehydrogenase
2.3 �0.3 �2.1 77 16 18 13
192597 GND1a, 6-phosphogluconate
dehydrogenase
(decarboxylating) (chl.)
1.9 �0.2 �1.6 308 83 101 74
158911 GND1b, 6-phosphogluconate
dehydrogenase
(decarboxylating) (cyt.)
1.9 �0.2 �1.6 313 86 102 74
163238 RIBA, bifunctional GTP
cyclohydrolase
II/3,4-dihydroxy-2butanone-4-
phosphate synthase
1.7 �0.7 �2.4 83 26 15 16
196834 CAH9, carbonic anhydrase (cyt?) 5.0 �1.1 �6.8 1952 62 18 28
(Continued)
Chlamydomonas S-Deprived Transcriptome 2067

These results demonstrate that2Sconditions elicit amassive rise in
LHCBM9 mRNA that is specifically controlled by previously iden-
tified S regulatory elements and that this rise is concurrent with a
loss in transcripts encoding LHCBM1-8. The possible reduction in
LHCBM1-8 polypeptide synthesis may be balanced by an increase
in LHCBM9 synthesis. These results could also explain the photo-
synthetic phenotypes of the snrk2.1 and sac1 mutants; a severe
reduction in LHCBM1-8 transcripts without the concomitant in-
crease in LHCBM9 in S-deprived snrk2.1 may compromise the
overall integrity of PSII and elicit elevated production of reactive
oxygen species (ROS), and more specifically the photoproduction
of singlet oxygen (1O2). This hypothesis is supported by the findings
that transcripts encoding proteins important for ameliorating the
consequences of 1O2 production are elevated in the S-starved
snrk2.1 mutant, but not in S-starved wild-type cells (see section:
ROS Detoxification and Cellular Redox). Elevated 1O2 levels can
cause photooxidative damage, reduce cell viability, and elicit
programmed cell death; genes encoding proteins potentially in-
volved in apoptosis are elevated in snrk2.1 but not in wild-type cells
under –S conditions (see section: Apoptosis and Autophagy). A
model depicting correlative relationships between photosynthetic
electron flow, LHCBM9, 1O2, and programmed cell death during S
deprivation in the mutant and wild-type cells is shown in Figure 9;
more work is needed to substantiate this model.
Similar to LHCBM9 mRNA, transcripts encoding four unique
LHC polypeptides (LHCSR1, LHCSR2, LHCSR3, and ELIP3) that
are not associated with light-harvesting function markedly in-
creased in cells experiencing 2S conditions. LHCSR2 and
LHCRS3 transcript levels increased to a similar extent in the
S-starvedwild type and the snrk2.1mutant, although the levels of
these transcripts during nutrient-replete growth were also some-
what higher in themutant cells. By contrast, like LHCBM9mRNA,
the increase in the LHCSR1 transcript observed in wild-type cells
under –S conditions was not observed in the snrk2.1 mutant
(Table 3). Chlamydomonas LHCSR polypeptides have no homo-
logs in vascular plants and have been associated with photo-
protection during stress conditions (Richard et al., 2000; Elrad
and Grossman, 2004; Peers et al., 2009), and, in a previous
study, the level of LHCSR2mRNAwas shown to increase in cells
deprived of S (Zhang et al., 2004).
Carbon Metabolism
Transcripts encoding key proteins of the Calvin-Benson cycle
(reductive pentose phosphate pathway), the glyoxylate cycle,
and the C4 dicarboxylic acid cycle declined in bothwild-type and
snrk2.1mutant cells experiencing S deprivation; this decline was
generally more severe in mutant than wild-type cells (see
Table 3. (continued).
Fold Change Expression (Log2)
Wild Type �S/Wild Type +S
snrk2.1/Wild Type(+S)
snrk2.1/Wild Type(�S)
Transcript Abundance (RPKM)a
ID Name/Description S Q S Q S QWildType �S
WildType +S
snrk2.1�S
snrk2.1+S
Folate metabolism
206121 MTDH/MTCH2,
methylenetetrahydrofolate
dehydrogenase/
methylenetetrahydrofolate
cyclohydrolase
�1.6 �0.2 �1.5 13 40 5 35
127560 FTHFS, 10-formyltetrahydrofolate
synthetase
–2.5 0.3 �1.8 10 59 3 71
30522 ADCL1, aminotransferase
related to
4-amino-4-deoxychorismate
lyase
�1.7 �0.2 0.2 23 73 26 65
111330 MTHFR, 5,10-
methylenetetrahydrofolate
reductase
–3.1 �0.1 0.1 11 92 12 86
182461 GGH1, g-glutamyl hydrolase 3.9 �0.6 �6.2 36 2 0 2
Extracellular/cell wall proteins
168785 HAP1, vanadium haloperoxidase 7.9 7.8 �0.2 -2.0 �8.4 �11.7 739 3 2 3
143696 HAP2, vanadium haloperoxidase 8.4 7.1 �0.1 �0.6 �11.6 �11.5 1044 3 0 3
182794 HAP3, vanadium haloperoxidase 7.1 6.5 �3.2 �1.0 �11.1 �7.2 1456 10 1 1
130684 ECP76, extracellular protein 10.7 10.3 �0.8 �0.4 �13.1 �11.8 899 1 0 0
137329 ECP88, extracellular protein 13.4 �2.3 �15.9 2295 0 0 0
119420 ECP61, extracellular protein 8.5 �0.6 �11.0 268 1 0 0
194201 ECP56, extracellular protein 8.6 �4.2 �13.0 317 1 0 0
Fold change (log2 values) in transcript levels under specified conditions as determined by RNA-seq (S) and, when available, by qRT-PCR (Q). Values
above 1.5 or below �1.5 are marked in bold type. Some genes for which expression is not affected by �S conditions are included for informative
purposes. Putative subcellular localizations are denoted in parentheses after the transcript names as cyt, cytosolic; mit, mitochondria; chl, chloroplast;
and ext, extracellular. ID, JGI protein accession number; p, putative; nd, not enough high-quality data for statistical tests.aTranscript abundance obtained from RNA-seq data is indicated as RPKMs (see Methods).
2068 The Plant Cell

Supplemental Data Set 2B online). Moreover, transcripts for
most proteins required for folate biosynthesis also declined,
while the transcript encoding g-glutamyl hydrolase (GGH1), an
enzyme involved in folate catabolism (Scott et al., 2000), in-
creased following the imposition of –S conditions (Table 3).
Various folate derivatives, including tetrahydrofolates (THFs), are
one-carbon donors and acceptors required for many cellular
processes, including the synthesis of Gly from Ser, methylation
of dUMP to form dTMP, the biosynthesis of pantothenate, purine
biosynthesis, formylation of fMet-tRNA, andMet biosynthesis. In
plants, the majority of folate (5-methyTHF) is used for the
synthesis of Met/SAM (Hanson and Roje, 2001). The decline in
transcript levels for enzymes involved in THF synthesis parallels
the decline in Met levels (Bolling and Fiehn, 2005) and in the
levels of those transcripts encoding Met/SAM cycle enzymes
(Table 3) in S-deprivedChlamydomonas. Furthermore, since THF
is required for the Ser-Gly interconversion reaction of the pho-
torespiration/glyoxylate cycle, it is likely that photorespiratory
activity declines in S-deprived cells. A reduction in photorespira-
tion is also suggested by a decrease in the level of the transcript
encoding Ser hydroxymethyltransferase (SHMT2) (Table 3), a key
enzyme of the pathway that requires a THF cofactor. Similarly, a
decline in photorespiration and folate metabolism as conse-
quence of reduced SAM levels in S-depleted Arabidopsis plants
has been proposed (Nikiforova et al., 2005b), although no em-
pirical data were presented to substantiate this conjecture.
Transcripts encoding proteins of the oxidative pentose phos-
phate (OPP) pathway increased in S-deprived Chlamydomonas
cells, which may be reflected by accumulation of OPP metab-
olites (Bolling and Fiehn, 2005). In plants, an increased flux of
metabolites through OPP is stimulated by stress conditions and
is linked to ROS detoxification (Couee et al., 2006). Alternatively,
elevated OPP activity may provide cells with an additional
capacity to generate NADPH under conditions of diminished
photosynthetic activity. The increase in transcripts encoding
OPP enzymes was less in snrk2.1 relative to wild-type cells
(Table 3). Furthermore, S deprivation elicited a rise in the level
of a transcript encoding the bifunctional GTP cyclohydrolase
II/3,4-dihydroxy-2-butanone-4-phosphate synthase (RIBA). This
enzyme uses ribulose-5-P and GTP to catalyze the first step of
riboflavin biosynthesis. Elevated RIBA levels may route excess
ribulose-5-P formed as the final product of OPP into riboflavin,
FMN, and FAD.
A number of other interesting observations have been noted
that suggest significant modifications in carbon metabolism
upon exposure of Chlamydomonas to –S conditions. S-starved
algal cells accumulate high levels of starch (Zhang and Melis,
2002), suggesting a strong redirection of fixed carbon into
storage, most likely because the cells cease dividing and have
reduced anabolic metabolism. However, there is no significant
increase in transcripts for enzymes involved in starch synthesis.
Similar results have been observed for rice (Oryza sativa) plants
(Lunde et al., 2008). We also noted that transcripts encoding
the putative carbonic anhydrases CAH7 and CAH9 (Moroney
and Ynalvez, 2007) increased in S-deprived cells; the CAH9
transcript exhibited a 31-fold increase that was SNRK2.1 de-
pendent (Table 3). A CAH gene was also found to be highly
upregulated when Arabidopsis plants were deprived of S
(Maruyama-Nakashita et al., 2003). Although intriguing, the role
of these CAHs during acclimation of organisms to –S conditions
is unexplored and not easily explained at this time.
Extracellular Proteins
Extracellular arylsulfatases (ARSs) and putative extracellular cell
wall polypeptides (ECP76 and ECP88), as well as transcripts
encoding these peptides, specifically accumulated when Chla-
mydomonaswasdeprived of S (deHostos et al., 1988; Takahashi
Figure 6. Abundances of Six Selected Transcripts under Different
Nutrient Deprivation Conditions.
RNA samples were extracted from wild-type cells for qRT-PCR analysis
at 6 h following their transfer to the different media (NR, nutrient-replete;
�S, S-depleted; �P, phosphorus-depleted; �N, nitrogen-depleted).
Levels of individual transcripts noted in (A) to (F) are given as relative
fold abundance with respect to the housekeeping control gene (CBLP)
and then multiplying relative target gene abundances by a factor of 104.
Each of the values was from at least three replicates, with the error bars
representing 1 SD. Graphics are in log scale; note the different scales for
the different analyses.
Chlamydomonas S-Deprived Transcriptome 2069

et al., 2001). In this study, we identified five new transcripts
encoding putative extracellular/cell wall proteins that increase
during S deprivation; two encode ECP-like proteins, while the
remaining three encode putative extracellular vanadium halo-
peroxidases (HAPs) (Table 3).
The two transcripts encoding novel ECP-like proteins, ECP61
and ECP56 (protein IDs 119420 and 194201, respectively; the
deduced molecular masses follow the ECP designation), rose
by up to 268- and 317-fold, respectively, in cells experiencing
2S conditions (Table 3). The increase in all ECP transcripts
was completely abolished in the snrk2.1 mutant. Like ECP88
and ECP76, these new putative proteins have features similar
to those of cell wall, Hyp-rich glycoproteins with very low
S-containing amino acid content (Table 4). While the synthesis
of the S-responsive ECPs is likely a means to economize on the
use of limited available S, it may also have significant physio-
logical consequences (e.g., rigidity of the wall and protection of
the cell body during conditions of growth limitation).
HAP1, HAP2, and HAP3 transcripts increased by up to 246-,
348-, and 145-fold, respectively, in wild-type cells experiencing
S deprivation; these increases were strictly dependent on
SNRK2.1 (Table 3). Interestingly, based on microarray data, the
HAP2 mRNA increased within 1 h of transferring cells to –S
conditions (see Supplemental Data Set 2A online), but did not
increase in response to 2P or 2N conditions (Figure 6F). HAPs,
often closely related to acid phosphatases and mostly localized
outside of the cell body, can use H2O2 to catalyze the oxidative
halogenation of organic compounds. These enzymes may also
be responsible for extracellular peroxidase activity previously
noted in Chlamydomonas (Torkelson et al., 1995). However,
HAPs generally have broad substrate specificity and in addition
to halide oxidation, may catalyze sulfoxidation, epoxidation, and
phosphodiesterase reactions (Hemrika et al., 1997; Dembitsky,
2003). Because of their broad potential reaction scope and
substrate specificity, it is difficult to assign HAPs a specific
physiological function. Putative roles for these enzymes under –S
conditions would include (1) participation in the biosynthesis/
degradation of cell wall polyphenols (Vreeland et al., 1998; Ortiz-
Bermudez et al., 2007) in reactions linked to H2O2 production
(Slesak et al., 2007); such activities may alter cell wall architec-
ture. (2) They function as an extracellular phosphatase in
S-deprived cells. Such an activity, which is both SNRK2.1 and
SAC1 dependent, has been previously observed (Moseley et al.,
2009), although its physiological significance is not known. (3)
They contribute to the conversion of sulfides to sulfoxides,
possibly the initial step in a novel mechanism for scavenging
external sulfides. Sulfides frequently present in the environ-
ment include Met, SAM, cystathionine, dimethylsulfide, and
3-methiolpropionate. The latter two compounds are intermediary
metabolites in dimethylsulfoniopropionate degradation, a po-
tentially abundant, ecologically important molecule in the envi-
ronment (Bentley and Chasteen, 2004).
Figure 7. Proposed Pathways for Redistribution and Recycling of S.
The “a” and “b” denote two possible functions for RDP3; “c” and “d” denote two possible functions for TAUD1 and TAUD2; “e” and “f” denote two
possible subcellular compartments in which SQDG degradation may occur; “g”, no gene encoding sulfinoalanine decarboxylase (CSAD) was identified
on the Chlamydomonas genome. Other details are as in Figure 5. PAPS, adenosine 39-phosphate 59-phosphosulfate; S2�, sulfide.
2070 The Plant Cell

S Sparing at the Proteome Level
As proposed previously (Mazel and Marliere, 1989; Takahashi
et al., 2001; Pereira et al., 2008), replacing high S content
proteins with others that have low S content represents an
S-sparing response that would help conserve cellular S re-
sources. In Chlamydomonas, the swapping of proteins with high
S content for ones with low S content was previously proposed
with respect to the putative cell wall polypeptides ECP76 and
ECP88 (Takahashi et al., 2001) and, as discussed above, can
now be extended to ECP61 and ECP56 (Table 4). Interestingly,
the LHCBM9 polypeptide also has a low content of S-containing
amino acids. There are three invariant S-containing amino acids
present in all mature LHCBM polypeptides except LHCBM9
(Figure 10). Hence, mature LHCBM9 has at least three fewer
S-containing amino acids than the other LHCBMs (Table 4).
Since LHCBM polypeptides are abundant cellular constituents,
substitution of S-rich LHCBM1-8 with the S-poor LHCBM9
would allow for significant S conservation. An analogous situa-
tion has been described for cyanobacterial LHC proteins (Mazel
and Marliere, 1989). Moreover, many other Chlamydomonas
transcripts that accumulated during –S conditions encode pro-
teins that contain relatively few S-containing amino acids (e.g.,
ARSs, HAPs, TAUDs, among others), and the average S amino
acid content of proteins encoded by the transcripts that accu-
mulate during S deprivation is lower (3.32%) than that of the
average Chlamydomonas proteome (4.19%) (Table 5). This de-
crease in S amino acid content is even more dramatic if the
percentages of these proteins are weighted by the abundance of
their corresponding transcripts in S-deprived cells (2.33%) (Ta-
ble 5). The SNRK2.1 kinase is critical for this S-sparing response
(Table 5). A similar S-sparing phenomenon has been described
for yeast (Fauchon et al., 2002). While these data are not
quantitative with respect to the relative amount of S-containing
amino acids used for protein biosynthesis (absolutemRNA levels
and/or identification and quantification of the proteins in the
proteome would be required), they do suggest that proteins that
accumulate under –S conditions tend to have a reduced S amino
acid content, which likely helps optimize the use of the limiting
resource.
Other Significant Processes
S deprivation also elicited an increase in transcripts encoding
several putative plasma membrane transporters and 83 RNAs
and/or proteins of unknown function (see Supplemental Data Set
2A online), along with a decrease in the levels of transcripts for
proteins associated with amino acid biosynthesis, lipid metab-
olism, some transport processes and translocons, tRNA biosyn-
thesis, chaperones, translation (especially chloroplast ribosomal
proteins), and transcription (see Supplemental Data Set 2B
online). A decrease in the levels of mRNAs encoding proteins
associated with a variety of metabolic processes may reflect an
overall slowing of metabolism as the cells stop dividing.
S Deprivation Responses Specific to the snrk2.1 Lesion
Transcripts of wild-type and snrk2.1 mutant cells that were
responsive to S deprivation were categorized based on their
transcriptome profiles (Figure 3; see Supplemental Data Set 2
online). Those genes that appear to be under SNRK2.1 control
(directly or indirectly) are in categories A1 and B1 in Figure 3 and
Supplemental Data Set 2 online. Transcripts that change in
abundance independently of SNRK2.1 are in categories A2-A3
Figure 8. Abundances of LHCBM Transcripts Based on qRT-PCR.
(A) and (B) RNA samples were extracted from the wild type (A) and the
snrk2.1 mutant (B) and analyzed for all nine of the LHCBM transcripts.
(C) Comparisons of LHCBM9 expression levels in wild-type, snrk2.1, and
sac1 cells. Levels of individual transcripts are given as relative fold
abundances with respect to the housekeeping gene (CBLP) and then
multiplying the relative target gene abundances by a factor of 10.
Graphics are in log scale. Each of the values was from at least three
replicates, with the error bars representing 1 SD. None of the values
obtained were much below 1, and those values that were below 1 are
represented as 0 on the graph.
Chlamydomonas S-Deprived Transcriptome 2071

and B2-B3. However, there is also a large set of transcripts
that changed in abundance in S-deprived snrk2.1 but not in
S-deprived wild-type cells. Included in these mutant-specific
changes, presented as categories C1 and C2, are transcripts
encoding proteins associated with oxidative stress, proteolysis,
and apoptosis. Some genes encoding proteins critical for the
biosynthesis of the S-containing cofactor CoA also increased in
S-deprived mutant relative to S-deprived wild-type cells (Table
6). All these changes potentially reflect the severe S deficiency
and the highly aberrant physiological state exhibited by the
mutant because of its inability to acclimate to S-limiting condi-
tions.
ROS Detoxification and Cellular Redox
Transcripts encoding GSH-peroxidase 5 (GPX5), GSH-transfer-
ase 1 (GSTS1), and thioredoxin h1 (TRXh1) proteins increased
in the snrk2.1 mutant relative to wild-type cells following the
Figure 9. Proposed Model for How the snrk2.1 Lesion Affects Photosynthesis and ROS Production Processes.
Wild-type (wt) and mutant cells in nutrient-replete medium (A) perform photosynthesis at optimal levels with the consequent production of superoxide
(O2�) and H2O2. Under these conditions, transcripts encoding proteins related to O2
� and H2O2 detoxification are relatively abundant, along with
transcripts encoding Calvin-Benson-Bassham cycle-related enzymes. In wild-type cells that experience S deprivation (B), photosynthetic activity
declines (most photosynthesis, chlorophyll biosynthesis, and Calvin-Benson-Bassham cycle-related transcripts decline), and the LHCBM1-8 proteins
are partially replaced by LHCBM9. The production of O2� and H2O2 may be diminished because of reduced PSII activity and electron flow to PSI.
Transcripts encoding proteins related to the detoxification of these specific ROS also decline. In the snrk2.1 mutant experiencing S deprivation (C),
LHCBM9 is not synthesized and the PSII antenna may become reduced in size. This may impair the proper assembly of PSII and its capacity for
photoprotection, triggering the production of singlet oxygen (1O2) and of genes specifically associated with 1O2 accumulation. Aberrant PSII
architecture, 1O2 accumulation, and severe S deficiency could dramatically impair PSII function in the snrk2.1 mutant, resulting in a marked decline in
electron flow to PSI. This decline in the photosynthetic activity would result in a decrease in the levels of transcripts encoding Calvin-Benson-Bassham
cycle enzymes as well as those related to O2� and H2O2 accumulation. Accumulation of 1O2 may also trigger expression of genes potentially involved in
the initiation of apoptosis (listed in Table 6). Thickness of the arrow between PSII and PSI depict a qualitative representation of the electron flow rate.
See “ROS Detoxification and Cellular Redox” section for more details.
2072 The Plant Cell

imposition of S deprivation (Table 6); these proteins are known to
mitigate the effects of ROS-elicited lipid peroxidation and DNA
damage (Goyer et al., 2002; Sarkar et al., 2005; Dayer et al., 2008)
by amelioration the toxic effects of 1O2 (Ledford et al., 2007).
Furthermore, TRXh1 and GPX5 transcript accumulation in Chla-
mydomonas is either not affected or affected to aminor extent by
elevated superoxide (O22) or H2O2 concentrations (Lemaire
et al., 1999; Sarkar et al., 2005; Ledford et al., 2007). Ledford
et al. (2007) identified 14 transcripts that changed in abun-
dance when Chlamydomonas cells experienced high 1O2 levels.
These transcripts displayed a similar change in abundance in
S-deprived snrk2.1 but not in S-deprived wild-type cells (see
Supplemental Table 1 online), suggesting that S deprivation of
the mutant elicits sustained production of 1O2. In photosynthetic
organisms, 1O2 is mainly produced as a consequence of PSII
electron flow, especially when the organisms are absorbing
excess excitation energy, and is thought to be the main cause of
photooxidative damage and cell death in plants (Apel and Hirt,
2004; Asada, 2006; Triantaphylides et al., 2008; Triantaphylides
and Havaux, 2009). As proposed in the section “Photosynthesis”
and in Figure 9, an aberrant light-harvesting architecture in
snrk2.1 during –S conditions (likely associated with a deficit in
LHCBM9) may severely impact the activity of PSII and its
capacity for photoprotection, which in turn could cause elevated1O2 production.
Interestingly, transcripts encoding proteins more specific to
combating the lethal effects of superoxides and H2O2, including
L-ascorbate peroxidases 1 and 3 (APX1 and APX3), peroxire-
doxin 1 (PRX1), mitochondrial superoxide dismutase 1 (MSD1),
and chloroplast superoxide dismutase 1 (FSD1), were slightly
reduced in wild-type cells, but their reduction was dramatic in
snrk2.1 cells deprived of S (Table 6). These data suggest that the
production of O22 and H2O2 declined during S deprivation,
especially in the snrk2.1 strain. The production of O22 and H2O2
are mostly generated as a consequence of peroxisome metab-
olism, respiration, and hyperreduction of PSI (Apel and Hirt,
2004; Asada, 2006). In wild-type cells during –S conditions,
photosynthetic electron transport is downregulated (Wykoff
et al., 1998), which would likely reduce the production of O22
and H2O2 because of reduced electron flow to PSI. In S-deprived
snrk2.1, the flow of electrons to PSI would potentially be more
severely diminished, as depicted in Figure 9.
Other proteins encoded by transcripts elevated exclusively in
the snrk2.1mutant during S deprivation include TRXh2, TRXy,Met
sulfoxide reductase 5 (MSRA5), glutaredoxin 2 (GRX2), and
nucleoredoxins 2 and 3 (NRX2 and NRX3). By contrast, S depri-
vation of the mutant cells caused a decline in the levels of PRX5,
TRXf1, and TRXf2 transcripts; the level of TRXf2 mRNA also
declined in 2S wild-type cells, although absolute levels were
significantly lower in the mutant (Table 6). Elevated MSRA5
transcripts levels may reflect protein damage by oxidative condi-
tions. GRX activity is required for protein deglutathionylation; the
role of this enzyme in glutathionylation is not understood (Rouhier
et al., 2008). Many chloroplast proteins are nonenzymatically
glutathionylated during oxidative stress (including TRXf, PRX1,
and Calvin-Benson cycle enzymes), resulting in inhibition of their
activities and/or protection from irreversible oxidation (Michelet
et al., 2005, 2008). Thus, the high levels of the GRX2may alter the
glutathionylation state of many chloroplast proteins during –S
conditions in the snrk2.1 mutant. TRXf polypeptides, located in
chloroplasts, are reductively activated by ferredoxin (Fd) and
participate in light-dependent activation/deactivation of key car-
bon metabolism enzymes, especially those of the Calvin-Benson
cycle. Decreased TRXf transcript levels during S deprivation may
reflect a decrease in photosynthetic electron flow through PSI
(Figure 9); this decrease was more pronounced in snrk2.1 relative
to the wild type (Table 6). Additionally, the redox state of TRXf is
expected to decrease, which would alter its activity and the
activities of its target proteins.
Apoptosis and Autophagy
The S-deprived snrk2.1mutant exhibited an increase in the levels
of six transcripts encoding proteins previously associated with
apoptosis, as well as a decline in a transcript encoding the
antiapoptosis protein (DAD1) (Table 6). There were also 33
transcripts for proteins related to autophagy and vesicular and
vacuolar transport (including the exocyst complex, GTPases,
R-SNARE and Q-SNARE family proteins, among others) that
increased specifically in snrk2.1 cells (and not in wild-type cells)
in response to S deprivation (see Supplemental Data Set 2C1
Table 4. S-Containing Amino Acid Content of Cell Wall and PSII
Light-Harvesting Proteins
ID Protein Length C+Ma C+M (%)b
Cell wall proteins
130684 ECP76, cell wall protein 583 1 (+1) 0.2
137329 ECP88, cell wall protein 595 0 (+4) 0.0
119420 ECP61, cell wall protein 577 1 (+1) 0.2
194201 ECP56, cell wall protein 532 1 (+1) 0.2
195768 GP2, cell wall protein 1182 48 (+1) 4.1
196402 PHC2, cell wall protein 505 36 (+2) 7.1
196403 PHC3, cell wall protein 443 25 (+1) 5.6
195824 VSP4, cell wall protein 993 43 (+2) 4.3
196399 PHC1, cell wall protein 479 36 (+2) 7.5
130359 VSP6, cell wall protein 951 46 (+1) 4.8
148333 PHC15, cell wall protein 184 10 (+3) 5.4
194264 PHC12, cell wall protein 407 28 (+3) 6.9
187643 PHC14, cell wall protein 566 42 (+1) 7.4
193780 GAS31, cell wall protein 507 37 (+1) 7.3
Peripheral PSII antennae proteins
184479 LHCBM9 254 2 (+2) 0.8
185533 LHCBM1 256 5 (+1) 2.0
184067 LHCBM2 249 5 (+2) 2.0
195162 LHCBM3 257 5 (+1) 1.9
191690 LHCBM4 254 6 (+1) 2.4
184775 LHCBM5 268 5 (+2) 1.9
184490 LHCBM6 253 5 (+2) 2.0
184071 LHCBM7 249 5 (+2) 2.0
205752 LHCBM8 254 5 (+2) 2.0
The S-containing amino acid levels of the ECP and LHCBM9 proteins
are compared with the LHCBM1-8 proteins and the 10 most abundant
putative cell wall proteins (according to RNA-seq data).aTotal number of Cys and Met residues (C+M) for the mature proteins,
with the numbers between parentheses indicating the C+M content in
the putative signal peptides.bC+M percentages are for the mature proteins.
Chlamydomonas S-Deprived Transcriptome 2073

online); plant cells experiencing apoptosis display intense au-
tophagy, with the vacuole acting like an animal autophagosome
(Williams and Dickman, 2008). Finally, numerous transcripts
encoding proteins associated with proteolysis, nuclease activity,
chromatin condensation, RNA binding, DNA binding, and lipid
degradation also increased specifically in the snrk2.1 mutant
under 2S conditions (see Supplemental Data Set 2C1 online).
The proteins encoded by all of these transcripts are potentially
involved in apoptosis/autophagy, which could explain the severe
bleaching and rapid death of snrk2.1 cells during –S conditions
(Gonzalez-Ballester et al., 2008). Apoptosis-like processes have
been previously noted for Chlamydomonas cells exposed to
UV-C irradiation (Moharikar et al., 2006, 2007) and for plants ex-
periencing photooxidative damage and elevated levels of 1O2
(Triantaphylides et al., 2008; Williams and Dickman, 2008). Thus,
these data support the hypothesis that aberrant light-harvesting
architecture, elevated 1O2 production, and a loss of cell viability
are all linked to the inability of the snrk2.1mutant to acclimate to
–S conditions (Figure 9).
Putrescine Biosynthesis
The transcript for Orn decarboxylase (ODC2) increased by up to
10-fold specifically in the snrk2.1 mutant during S deprivation
(Table 6). ODC2 catalyzes the conversion of Orn to putrescine,
the precursor of the polyamines spermine and spermidine.
Although Orn biosynthesis occurs mostly through the acetyl
cycle of Arg, the increase in ODC2 transcript levels in snrk2.1
during –S conditions was accompanied by a decrease in most
transcripts encoding enzymes involved in Arg biosynthesis; the
only exception was that of the ARG9 transcript, which encodes
an N-acetylornithine aminotransferase (NAOAT) (Table 6, Figure
11). An alternative route to Orn/polyamine synthesis involves Pro
dehydrogenase (PRD), coupled with Orn aminotransferase ac-
tivity (OAT) (Slocum, 2005) (Figure 11). In the snrk2.1 mutant,
PRD transcript levels increased under 2S conditions, although
the level of the OAT1 transcript showed little change. Interest-
ingly, several reports indicate that some NAOATs can also use
the nonacetylated compounds Orn and Glu-5-semialdehyde as
substrates (Billheimer et al., 1976; Heimberg et al., 1990;
Ledwidge and Blanchard, 1999). Therefore, it is possible, al-
though still speculative, that Chlamydomonas NAOAT (ARG9)
also works as an OAT. Additionally, the level of the transcript
encoding Glu-5-semialdehyde dehydrogenase (GSD1) in-
creased in S-starved snrk2.1 cells (Table 6, Figure 11). The
coordinated activities of PRD, GSD1, ARG9 (acting as an OAT),
and ODC2may define an alternative pathway for the synthesis of
putrescine from Pro and Glu in2S snrk2.1 cells (Figure 11). This
pathway could be predominant over the acetyl cycle of Arg under
conditions in which levels of the S-containing CoA, a cofactor
Figure 10. Alignments of the Amino Acid Sequences of Chlamydomonas LHCBM Proteins.
The LHCBM9 polypeptide has substitutions at positions in which there are conserved S-containing amino acids in the other LHCBM proteins; these are
Met157Leu, Met213Ser, and Cys101Ile; they are marked with an asterisk. The black and gray boxes indicate identical and similar amino acids,
respectively. Alignments were performed using BioEdit 7.0.5.3 software.
2074 The Plant Cell

required for the acetyl cycle of Arg, are diminished. Accumulation
of transcripts required for the biosynthesis of CoA in the snrk2.1
mutant during –S conditions (Table 6) may be indicative of a CoA
deficiency. While elevated levels of ARG9 and GSD1 gene
products could also contribute to the production of Pro, a plant
stress-related metabolite, this seems unlikely since there is
essentially no increase in the transcript encoding pyrroline-5-
carboxylate reductase (PCR1) (Table 6, Figure 11).
Putrescine and other polyamines can also be synthesized via
agmatine (Figure 11), although only one transcript of this path-
way was elevated in S-deprived snrk2.1 cells (the agmatine
iminohydrolase, AIH1), and its absolute level was much lower
than that of ODC2 (Table 6). Hence, as proposed previously
(Voigt et al., 2000), the most prominent pathway for putrescine
biosynthesis in Chlamydomonas is likely via Orn.
The above observations suggest a greater capacity for pu-
trescine synthesis in S-deprived snrk2.1 than in wild-type cells.
Accumulation of putrescine was previously observed in Arabi-
dopsis plants deprived of S (Hirai et al., 2003; Nikiforova et al.,
2005b). A SAMdeficiency was proposed to be the reason for this
accumulation since the synthesis of the putrescine-derived
polyamines spermidine and spermine requires SAM. In Chlamy-
domonas wild-type cells, transcripts encoding enzymes for
spermine and spermidine synthesis (S-adenosylmethionine de-
carboxylase, DCA1; spermidine synthase, SPD1; and spermine
synthase, SPS1) declined following S deprivation. This decline
was not observed in the snrk2.1 mutant (Table 6, Figure 11),
although spermidine and spermine biosynthesis in the S-starved
mutant cells may still be very low as these cells are likely to be
deficient for SAM.While the potential accumulation of putrescine
in S-deprived snrk2.1 mutant cells may be a consequence of
reduced SAM levels, this accumulationmay also be important for
acclimation of the organism to its extreme environment. Some
have suggested roles for polyamines in the stabilization of
membranes, scavenging of ROS, retardation of senescence,
and hypersensitive cell death (Yoda et al., 2003; Groppa and
Benavides, 2008). Polyamines have also been found to associate
with LHCB proteins, influencing nonphotochemical quenching,
photophosphorylation, and organization of PSII. Moreover, treat-
ment of plants with UV-B irradiation and high light can cause an
increase in the levels of polyamines associated with LHCB (Del
Duca et al., 1995; Della Mea et al., 2004; Ioannidis et al., 2006;
Ioannidis and Kotzabasis, 2007; Navakoudis et al., 2007; Sfichi-
Duke et al., 2008). Overall, both our work (presented here) and
the work of others suggest that oxidative stress, cell death, PSII
architecture, and putrescine accumulation may be processes
that are closely related.
Effects of the snrk2.1 Lesion on Transcript Accumulation
during Nutrient-Replete Conditions
Some transcripts exhibited aberrant levels in the snrk2.1 mutant
relative to wild-type cells even when the cells were maintained in
nutrient-replete conditions (see Supplemental Data Sets 2D and
2E online). The high number of transcripts in this group (89 in
total) suggests that regulation via SNRK2.1 is not simply an on-
off switch, but may be more similar to a rheostat that controls
cellular responses over a dynamic range of S concentrations.
Transcripts elevated in snrk2.1 relative to wild-type cells main-
tained in either +S or 2S conditions include those encoding a
pyruvate ferredoxin oxidoreductase (PFR1), a specific apoferre-
doxin (FDX5), an iron hydrogenase (HYD1), the hydrogenase
assembly factors HYDEF and HYDG, and several prolyl
4-hydroxylases (Table 6; see Supplemental Data Sets 2C1 and
2D online). The protein products of these genes have previously
been associated with cells experiencing anoxia and H2 produc-
tion (Mus et al., 2007). The link between SNRK2.1 kinase and
repression of genes regulated by anoxic conditions is intriguing
but could reflect an indirect impact of S deprivation on the
physiological state of the cells. For example, a decrease in
photosynthetic activity and an increase in HYD transcript accu-
mulation and H2 production was observed in Chlamydomonas
transformants harboring antisense constructs of the chloroplast
SO422 permease (SULP1) grown in nutrient-replete medium
(Chen et al., 2005). The authors suggested that the reduced
permease activity in the transformants limited the supply of S to
Table 5. S-Amino Acid Content of Chlamydomonas Proteins
C+M% Weighed by Transcript Abundanceb
List of Transcriptsa C+M % (nwta)b +S (Wild Type) �S (Wild Type) +S (snrk2.1) �S (snrk2.1) +P (Wild Type) �P (Wild Type)
All 4.19 4.55 4.32 4.36 4.54 4.20 4.25
�S up (wild type) 3.32 3.83 2.33 3.28 3.09 4.08 3.13
�S down (wild type) 4.05 3.93 3.89 3.79 4.24 3.64 3.49
�S up (snrk2.1) 4.18 4.25 4.02 4.28 4.28 4.45 4.28
�S down (snrk2.1) 3.98 3.66 3.68 3.57 3.64 3.64 3.62
�P up (wild type) 4.18 4.42 3.12c 4.73 4.29 4.43 4.06
�P down (wild type) 4.18 4.61 4.48 4.37 4.07 4.32 4.30
Phosphorous deprivation (�P) was used as internal control. nwta, data not weighted by transcripts abundance.aThe list of transcripts that accumulate (up) or decline (down) under the different conditions were selected as described in Figure 3. Subsequently, the
genes encoding proteins with no significant homology to a known protein (unknown genes) were filtered out because many of them represent
inaccurate v.3.1 gene models and would introduce a strong bias into the data.bS amino acid content percentages are calculated for proteins in the unprocessed state (containing putative signal peptides).cThe low values observed under this condition reflects the fact that some transcripts that increase during S deprivation also show a slight increase
during –P conditions (D. Gonzalez-Ballester and A.R. Grossman, unpublished data).
Chlamydomonas S-Deprived Transcriptome 2075

Table 6. Expression Levels of Selected Genes That Show Aberrant Behavior in the snrk2.1 Mutant
Fold Change Expression (Log2)
Wild Type �S/
Wild Type +S
snrk2.1/
Wild Type (+S)
snrk2.1/
Wild Type (�S)
Transcript Abundance (RPKM)
ID Name/Description S Q S Q S Q
Wild
Type�S
Wild
Type+S
snrk2.1
�S
snrk2.1
+S
Redox processes and singlet oxygen stress-related genes
142363 PRX1, 2-cys peroxiredoxin, thioredoxin
dependent peroxidase (chl.)
�2.2 �0.2 -3.1 177 843 20 759
157173 PRX5, peroxiredoxin type II, thioredoxin
dependent peroxidase (chl.)
�0.2 �0.6 �1.5 105 124 38 83
186597 APX1, L-ascorbate peroxidase (chl.) 0.3 �0.2 �2.4 103 85 20 74
165193 APX3, L-ascorbate peroxidase (chl.) �1.4 �0.6 �1.7 41 108 13 70
182933 FSD1, superoxide dismutase [Fe] (chl.) �0.5 0.3 �1.7 171 241 53 293
53941 MSD1, superoxide dismutase (mito.) 0.0 0.0 �1.7 381 393 120 391
158519 Singlet oxygen stress-related gene 0.8 1.3 �2.4 259 149 48 355
143122 GPXH (GPX5), glutathione peroxidase (cyt.) 0.7 �0.2 2.0 125 78 502 68
193661 GSTS1, glutathione S-transferase 0.1 �0.3 3.7 37 34 494 28
195887 TRXh1, thioredoxin (cyt.) �0.2 0.0 1.8 190 216 643 210
196117 TRXh2a, thioredoxin (cyt.) 0.3 0.8 2.7 60 49 385 86
196116 TRXh2b, thioredoxin (cyt.) 0.3 0.8 2.7 71 57 455 102
196118 TRXh2c, thioredoxin (cyt.) 0.3 0.8 2.7 75 61 483 108
134747 TRXy, thiorredoxin (chl.) �0.3 0.2 1.9 16 21 60 23
182094 NRX2, nucleoredoxin �1.7 1.5 7.2 5 15 701 42
141568 NRX3, nucleothioredoxin �0.8 2.3 6.6 2 3 150 12
195611 GRX2, glutaredoxin, CPYC type (cyt.) 0.5 �0.1 1.8 111 79 384 73
187796 MSRA5, peptide Met sulfoxide reductase 0.4 0.4 1.5 19 14 54 19
139781 TRXf1, thioredoxin f1 (chl.) 0.1 �0.1 �1.8 185 176 52 170
195886 TRXf2, thioredoxin f2 (chl.) �1.0 �0.4 �2.2 55 111 12 83
Apoptosis-related genes
141763 DAD1, antiapoptosis gene �0.6 0.4 �1.7 80 118 24 159
182542 DDI1, DNA damage-inducible v-SNARE
binding protein
�0.3 0.2 1.8 9 11 30 12
174932 LAG1, longevity assurance protein 0.0 0.5 3.7 21 20 276 29
205713 Metacaspase, type I 0.4 0.6 2.0 9 6 33 10
205701 PHD1, VIAF phosducin-like protein �0.8 0.4 4.5 20 35 437 47
190610 PDCD6/ALG-2, programmed cell
death-related gene
0.1 0.6 1.6 23 22 68 33
179155 Senescence-associated gene �0.1 0.8 4.5 13 14 281 24
Arg/Orn/polyamine biosynthesis
206062 ODC2, Orn decarboxylase 2 0.7 0.2 2.7 45 27 289 30
139007 ARG9, acetylornithine aminotransferase �0.4 �0.6 2.4 33 45 174 29
183928 DCA1, S-adenosylmethionine
decarboxylase
�1.8 �0.3 1.5 54 184 149 146
206050 SPD1, spermidine synthase �0.9 �0.5 0.7 12 24 20 17
206069 SPS1, spermine synthase �2.6 �1.0 2.0 6 34 22 17
193221 PRD, Pro dehydrogenase 0.5 1.0 2.8 14 10 100 19
192364 PCR1, pyrroline-5-carboxylate reductase �1.3 0.2 1.0 15 37 29 42
130812 GSD1, Glu-5-semialdehyde
dehydrogenase
�0.6 �0.5 2.0 42 62 164 45
195386 OAT1, Orn aminotransferase 1.6 0.9 �1.2 48 16 20 30
13028 AIH1, agmatine iminohydrolase �0.2 �1.0 3.5 3 3 28 2
Hydrogen production-related genes
156833 FDX5, Apoferredoxin �2.6 6.2 7.7 1 5 174 367
122198 PFR1, pyruvate-ferredoxin
oxidoreductase
1.8 6.7 6.5 1 0 103 33
183963 HYD1, iron hydrogenase 0.4 1.9 2.0 49 36 190 130
128256 HYDEF, iron hydrogenase
assembly protein
0.8 2.0 1.6 12 7 35 26
196226 HYDG, hydrogenase assembly factor 1.0 1.7 1.4 61 30 158 97
Carbon metabolism
115491 Acetate transporter (p) �1.7 -1.5 -1.6 699 2285 228 806
196311 ACS3, Acetyl CoA synthetase, mit �1.6 �1.4 �1.1 233 710 112 271
(Continued)
2076 The Plant Cell
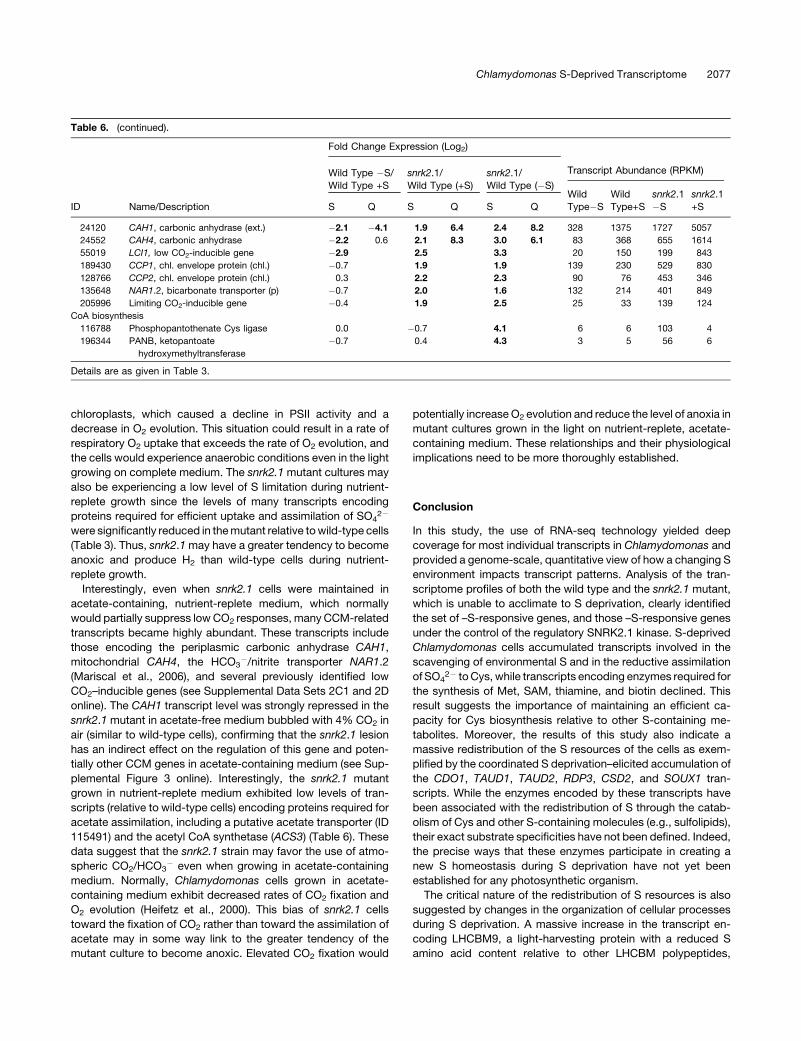
chloroplasts, which caused a decline in PSII activity and a
decrease in O2 evolution. This situation could result in a rate of
respiratory O2 uptake that exceeds the rate of O2 evolution, and
the cells would experience anaerobic conditions even in the light
growing on complete medium. The snrk2.1mutant cultures may
also be experiencing a low level of S limitation during nutrient-
replete growth since the levels of many transcripts encoding
proteins required for efficient uptake and assimilation of SO422
were significantly reduced in themutant relative towild-type cells
(Table 3). Thus, snrk2.1may have a greater tendency to become
anoxic and produce H2 than wild-type cells during nutrient-
replete growth.
Interestingly, even when snrk2.1 cells were maintained in
acetate-containing, nutrient-replete medium, which normally
would partially suppress lowCO2 responses, many CCM-related
transcripts became highly abundant. These transcripts include
those encoding the periplasmic carbonic anhydrase CAH1,
mitochondrial CAH4, the HCO32/nitrite transporter NAR1.2
(Mariscal et al., 2006), and several previously identified low
CO2–inducible genes (see Supplemental Data Sets 2C1 and 2D
online). The CAH1 transcript level was strongly repressed in the
snrk2.1 mutant in acetate-free medium bubbled with 4% CO2 in
air (similar to wild-type cells), confirming that the snrk2.1 lesion
has an indirect effect on the regulation of this gene and poten-
tially other CCM genes in acetate-containing medium (see Sup-
plemental Figure 3 online). Interestingly, the snrk2.1 mutant
grown in nutrient-replete medium exhibited low levels of tran-
scripts (relative to wild-type cells) encoding proteins required for
acetate assimilation, including a putative acetate transporter (ID
115491) and the acetyl CoA synthetase (ACS3) (Table 6). These
data suggest that the snrk2.1 strain may favor the use of atmo-
spheric CO2/HCO32 even when growing in acetate-containing
medium. Normally, Chlamydomonas cells grown in acetate-
containing medium exhibit decreased rates of CO2 fixation and
O2 evolution (Heifetz et al., 2000). This bias of snrk2.1 cells
toward the fixation of CO2 rather than toward the assimilation of
acetate may in some way link to the greater tendency of the
mutant culture to become anoxic. Elevated CO2 fixation would
potentially increaseO2 evolution and reduce the level of anoxia in
mutant cultures grown in the light on nutrient-replete, acetate-
containing medium. These relationships and their physiological
implications need to be more thoroughly established.
Conclusion
In this study, the use of RNA-seq technology yielded deep
coverage for most individual transcripts in Chlamydomonas and
provided a genome-scale, quantitative view of how a changing S
environment impacts transcript patterns. Analysis of the tran-
scriptome profiles of both the wild type and the snrk2.1 mutant,
which is unable to acclimate to S deprivation, clearly identified
the set of –S-responsive genes, and those –S-responsive genes
under the control of the regulatory SNRK2.1 kinase. S-deprived
Chlamydomonas cells accumulated transcripts involved in the
scavenging of environmental S and in the reductive assimilation
of SO422 toCys, while transcripts encoding enzymes required for
the synthesis of Met, SAM, thiamine, and biotin declined. This
result suggests the importance of maintaining an efficient ca-
pacity for Cys biosynthesis relative to other S-containing me-
tabolites. Moreover, the results of this study also indicate a
massive redistribution of the S resources of the cells as exem-
plified by the coordinated S deprivation–elicited accumulation of
the CDO1, TAUD1, TAUD2, RDP3, CSD2, and SOUX1 tran-
scripts. While the enzymes encoded by these transcripts have
been associated with the redistribution of S through the catab-
olism of Cys and other S-containing molecules (e.g., sulfolipids),
their exact substrate specificities have not been defined. Indeed,
the precise ways that these enzymes participate in creating a
new S homeostasis during S deprivation have not yet been
established for any photosynthetic organism.
The critical nature of the redistribution of S resources is also
suggested by changes in the organization of cellular processes
during S deprivation. A massive increase in the transcript en-
coding LHCBM9, a light-harvesting protein with a reduced S
amino acid content relative to other LHCBM polypeptides,
Table 6. (continued).
Fold Change Expression (Log2)
Wild Type �S/
Wild Type +S
snrk2.1/
Wild Type (+S)
snrk2.1/
Wild Type (�S)
Transcript Abundance (RPKM)
ID Name/Description S Q S Q S Q
Wild
Type�S
Wild
Type+S
snrk2.1
�S
snrk2.1
+S
24120 CAH1, carbonic anhydrase (ext.) �2.1 �4.1 1.9 6.4 2.4 8.2 328 1375 1727 5057
24552 CAH4, carbonic anhydrase �2.2 0.6 2.1 8.3 3.0 6.1 83 368 655 1614
55019 LCI1, low CO2-inducible gene �2.9 2.5 3.3 20 150 199 843
189430 CCP1, chl. envelope protein (chl.) �0.7 1.9 1.9 139 230 529 830
128766 CCP2, chl. envelope protein (chl.) 0.3 2.2 2.3 90 76 453 346
135648 NAR1.2, bicarbonate transporter (p) �0.7 2.0 1.6 132 214 401 849
205996 Limiting CO2-inducible gene �0.4 1.9 2.5 25 33 139 124
CoA biosynthesis
116788 Phosphopantothenate Cys ligase 0.0 �0.7 4.1 6 6 103 4
196344 PANB, ketopantoate
hydroxymethyltransferase
�0.7 0.4 4.3 3 5 56 6
Details are as given in Table 3.
Chlamydomonas S-Deprived Transcriptome 2077

paralleled a decline in the level of transcripts encoding all of the
other LHCBMs. This shift in antenna protein production could
lead to significant S conservation and a change in the ways in
which the alga uses light energy. Indeed, at a global level,
proteins that accumulate during –S conditions tend to have a
reduced S amino acid content; such proteins include the ECPs,
HAPs, ARSs, and TAUDs. Based on these findings, it is likely that
a recycling of S-containing amino acids and their reallocation
among proteins with low S amino acid content represents an
extreme economy of S use that can extend cell viability when S
resources become scarce.
Another important aspect of this work addresses the question
of what a cell does when it is unable to implement the –S
acclimation program, as is the case of the snrk2.1 mutant. The
inability of mutant cells to acclimate to –S conditions likely
prevents efficient use of external SO422 (free and organic), the
recycling of internal S (SQDG and Cys), and the redistribution of
the S resources among different S-containing metabolites (e.g.,
CoA and SAM); this in turn results in aberrant control of cellular
metabolism. Moreover, the absence of transcripts encoding
LHCBM9 and LHCSR1 in the snrk2.1 mutant during –S condi-
tions may alter the structure of the photosynthetic apparatus.
These metabolic and structural aberrations can result in the
accumulation of metabolites and reactive molecules (e.g., pu-
trescine and 1O2) that have extreme consequences, ultimately
leading to diminished cell viability. Indeed, when the snrk2.1
Figure 11. Potential Pathways for Polyamine Biosynthesis.
Genes encoding the proteins of the pathways are labeled with colors, indicating the fold change (log2) of their transcript levels under S deprivation
conditions relative to nutrient-replete conditions for snrk2.1 cells based on RNA-seq data (color code is given in the figure). The dashed line indicates the
alternative activities proposed for the ARG9 protein. The protein encoded by each of the genes represented in the pathway diagram is given in Table 6.
MTA, S-methyl-59-thioadenosine.
2078 The Plant Cell

mutant is starved for S, it appears to showmolecular responses,
such as the accumulation of transcripts associated with oxida-
tive damage, ROS production, and apoptosis that are typical of
organisms experiencing extreme environmental conditions.
METHODS
Strains and Culture Conditions
Chlamydomonas reinhardtii strains used for this study were D66 (wild-
type strain; nit2 cw15 mt+) (Pollock et al., 2003), ars11 (snrk2.1cw15mt+)
(Gonzalez-Ballester et al., 2008), 21gr (wild-type strain; nit5 mt2) (Harris,
1989), and sac1 (sac1mt+) (Davies et al., 1994). The ars11 strain was
designated as the snrk2.1 mutant throughout since the lesion is in the
SNRK2.1 gene. Cells were cultured under continuous light of;60 mmol
photon m22 s21 at 238C in liquid and on solid Tris-acetate-phosphate
(TAP) medium (Harris, 1989). To impose S deprivation, cells in mid-
logarithmic growth phase were washed twice with liquid TAP medium
without S (TAP-S) (Harris, 1989), and equal numbers of cells were resus-
pended in TAP or TAP-S. Cell aliquots were collected for RNA isolation just
prior to and 1, 6, and 24 h after being transferred to TAP and TAP-Smedium.
RNA Isolation, Synthesis of cDNA, and qRT-PCR
Isolation of total RNA using a phenol-chloroform procedure, cDNA
synthesis, and qRT-PCR was performed by standard methods as previ-
ously described (Schloss et al., 1984; Gonzalez-Ballester et al., 2008). Ct
values were determined for three independent technical experiments,
with at least two measurements of the same sample in each experiment.
Relative fold differences were calculated based on the DCt method
(2–(Ctsample-Ctcontrol gene)) (Livak and Schmittgen, 2001) using the CBLP
amplification product as an internal standard. Primer pairs used for qRT-
PCR analyses are in Supplemental Table 2 online. Sizes of amplification
products were 100 to 300 bp.
Microarray Analysis
Oligonucleotides (;70 nucleotides length) representing;10,000 unique
ESTs were used to print the arrays. The design and generation of the
microarrays chips used is this work was described previously (Eberhard
et al., 2006). The following RNA samples were compared in the micro-
arrays: wild type 1 h –S compared with wild type 1 h +S, wild type 6 h –S
compared with wild type 6 h +S, wild type 24 –S compared with wild type
24 h +S, wild type 0 h –S compared with snrk2.1 0 h2S, wild type 1 h –S
compared with snrk2.1 1 h2S,wild type 6 h –S comparedwith snrk2.1 6 h
2S, and wild type 24 h –S compared with snrk2.1 24 h2S. Preparation of
the fluorescent microarray probes and hybridization to the arrays was
performed as described previously (Eberhard et al., 2006; Mus et al.,
2007). Between two and four biological replicates were used for each
sample, and at least four microarray slides for each comparison (addi-
tionally, each slide has two copies of each array element). Arrays were
scanned using a GenePix 4000B scanner (Molecular Devices). Photo-
multiplier tube voltages were adjusted manually to balance Cy5 and Cy3
signals (1:1 ratio) and to avoid spot saturation. Resulting images were
imported into SpotReader (version 1.3.0.5; Niles Scientific), and spot
positions were defined and fluorescence signal intensities determined.
Spot quality signals were automatically flagged as reliable (good), non-
reliable (absent), or empty based on the following parameters: saturated
foreground, 70%; uneven color, 0.5; bright specks, 4; low foreground,
1.4; high background, 10; low background, 0.1; variable background, 5.
Additionally, spot signals that were distorted by dust, locally high back-
grounds, or printing flaws were manually flagged as nonreliable (absent).
Spot backgrounds were automatically subtracted; a radius of 2 times the
average radius for each spot (from the spot center) was defined, and the
region of the fieldwithin this radius and between the newdiameter and the
original spot diameter was considered background. Subsequent data
analyses were performed using GeneSpring 7.3.1 (Agilent Technologies).
Normalizations of spot intensities were achieved using the software
standard “per spot and per chip intensity-dependent (Lowess)” normal-
ization (http://stat-www.berkeley.edu/users/terry/zarray/Html/normspie.
html). Only spots flagged as reliable (good) were analyzed. Error models
were computed based on replicates. Signal ratios were considered only
if they passed Student’s t test for significance with a P value of #0.05.
Microarray probe sequences were mapped to the Chlamydomonas
v.3.1 genome to find their correspondence with gene models. Gapped
alignment using BLAT (Kent, 2002) was performed for a set of 9998
microarray probes, of which 6745 overlappedwith JGI v.3.1 genemodels.
At least one matching probe was found for 5948 gene models (out of
14,598). When genes have multiple matching probes, the probe with a
more significant fold changewas selected when comparing two samples.
Correspondences between microarray probes and JGI v.3.1 gene
models are included in Supplemental Data Set 1 online.
RNA-Seq Technology
Sample Preparation
Total RNA from wild-type (D66) and snrk2.1 mutant cells 6 h after being
transferred to 2S and +S medium were submitted to Illumina for se-
quencing using their proprietary Genome Analyzer. cDNA libraries were
assembled according to the manufacturer’s RNA-seq protocol, loaded,
and sequenced as 35-mers in a total of 11 lanes of the sequencer (see
Supplemental Table 3 online). Raw image files were collected by the
sequencer and analyzed using the standard Illumina pipeline.
Mapping Reads to the Genome
Processed sequence files from the Illumina pipeline output were aligned
against the v.3.1 assembly of the Chlamydomonas genome. The SOAP
alignment program (Li et al., 2008) was used tomap the short reads in two
steps (see Supplemental Methods online for details). In a first round, the
raw 35-mers sequences were aligned to the genomic sequence with a
tolerance of up to two mismatches and no indels. Approximately 77% of
the reads mapped to at least one genomic location on either of the two
strands, and of these, 89%mapped uniquely. This percentage compares
favorably with previously reported RNA-seq studies (Marioni et al., 2008;
Mortazavi et al., 2008; Nagalakshmi et al., 2008). For those sequences
that did not align to the genome, a second round alignment was
performed in which we recursively trimmed one base at a time (up to
21-mers) at either the 59 or 39 end of the reads until we found a (perfect)
match to the genome. This procedure allowed us to recover some
misalignments caused by the presence of exon-exon junctions, sequenc-
ing errors, adaptor sequences, and poly(A) tails in the sequence reads.
About 50% of the reads that were not aligned in the initial analysis were
recovered, bringing the total fraction of mappable reads to ;88% (see
Supplemental Table 3 online).
All alignments were tagged as either unique or not unique and then
combined. The most 59 position of each alignment was recorded along
with the length k of the aligned read (k-hit throughout). For differential
expression analysis, per-base unique k-hits from both strands were
pooled (as the cDNA library lacks strand specificity) and summed across
the genome to obtain gene counts.
Transcript Abundance
Relative transcript abundances were determined as follows (see Supple-
mental Methods online for notation): for each particular gene model j in
Chlamydomonas S-Deprived Transcriptome 2079
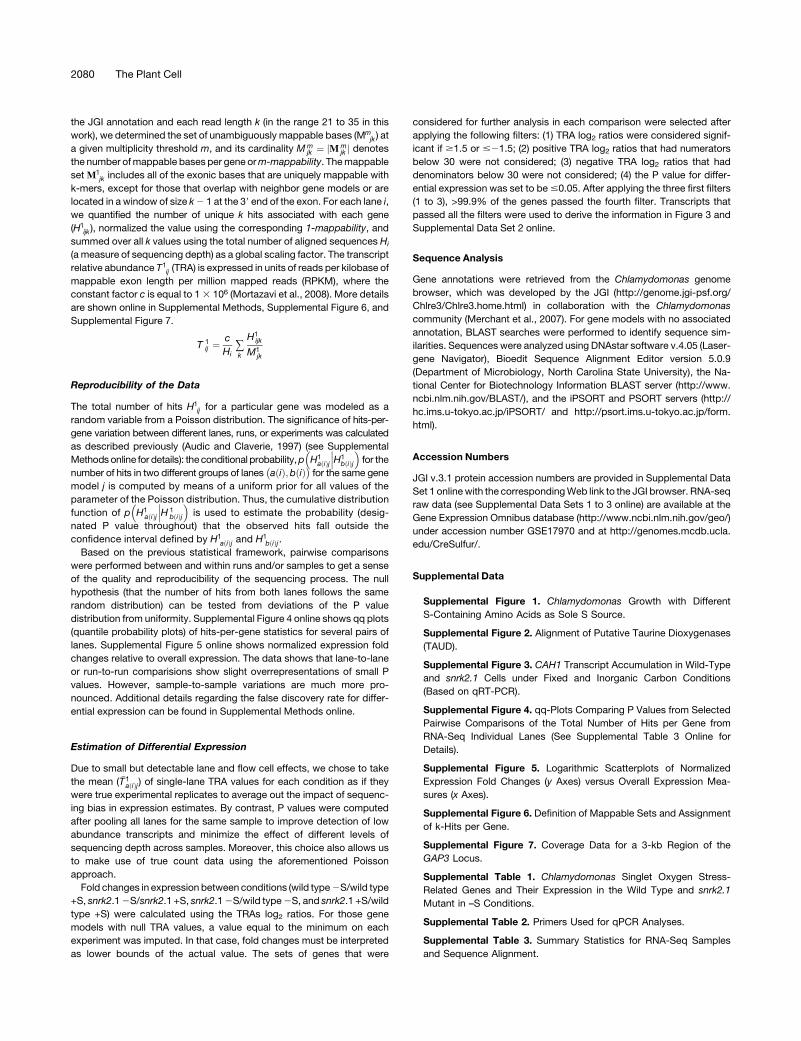
the JGI annotation and each read length k (in the range 21 to 35 in this
work), we determined the set of unambiguously mappable bases (Mmjk ) at
a given multiplicity threshold m, and its cardinality Mmjk ¼ jMm
jk j denotesthe number ofmappable bases per gene orm-mappability. Themappable
set M1jk includes all of the exonic bases that are uniquely mappable with
k-mers, except for those that overlap with neighbor gene models or are
located in a window of size k2 1 at the 39 end of the exon. For each lane i,
we quantified the number of unique k hits associated with each gene
(H1ijk ), normalized the value using the corresponding 1-mappability, and
summed over all k values using the total number of aligned sequences Hi
(a measure of sequencing depth) as a global scaling factor. The transcript
relative abundance T1ij (TRA) is expressed in units of reads per kilobase of
mappable exon length per million mapped reads (RPKM), where the
constant factor c is equal to 13 106 (Mortazavi et al., 2008). More details
are shown online in Supplemental Methods, Supplemental Figure 6, and
Supplemental Figure 7.
T 1ij ¼
c
Hi+k
H1ijk
M1jk
Reproducibility of the Data
The total number of hits H1ij for a particular gene was modeled as a
random variable from a Poisson distribution. The significance of hits-per-
gene variation between different lanes, runs, or experiments was calculated
as described previously (Audic and Claverie, 1997) (see Supplemental
Methods online for details): theconditional probability,p�H1
aðiÞj���H1
bðiÞj�for the
number of hits in two different groups of lanes�aðiÞ;bðiÞ� for the same gene
model j is computed by means of a uniform prior for all values of the
parameter of the Poisson distribution. Thus, the cumulative distribution
function of p�H1
aðiÞj���H 1
bðiÞj�is used to estimate the probability (desig-
nated P value throughout) that the observed hits fall outside the
confidence interval defined by H1aðiÞj and H1
bðiÞj.Based on the previous statistical framework, pairwise comparisons
were performed between and within runs and/or samples to get a sense
of the quality and reproducibility of the sequencing process. The null
hypothesis (that the number of hits from both lanes follows the same
random distribution) can be tested from deviations of the P value
distribution from uniformity. Supplemental Figure 4 online shows qq plots
(quantile probability plots) of hits-per-gene statistics for several pairs of
lanes. Supplemental Figure 5 online shows normalized expression fold
changes relative to overall expression. The data shows that lane-to-lane
or run-to-run comparisions show slight overrepresentations of small P
values. However, sample-to-sample variations are much more pro-
nounced. Additional details regarding the false discovery rate for differ-
ential expression can be found in Supplemental Methods online.
Estimation of Differential Expression
Due to small but detectable lane and flow cell effects, we chose to take
the mean ( �T1aðiÞj) of single-lane TRA values for each condition as if they
were true experimental replicates to average out the impact of sequenc-
ing bias in expression estimates. By contrast, P values were computed
after pooling all lanes for the same sample to improve detection of low
abundance transcripts and minimize the effect of different levels of
sequencing depth across samples. Moreover, this choice also allows us
to make use of true count data using the aforementioned Poisson
approach.
Fold changes in expression between conditions (wild type2S/wild type
+S, snrk2.12S/snrk2.1 +S, snrk2.12S/wild type2S, and snrk2.1 +S/wild
type +S) were calculated using the TRAs log2 ratios. For those gene
models with null TRA values, a value equal to the minimum on each
experiment was imputed. In that case, fold changes must be interpreted
as lower bounds of the actual value. The sets of genes that were
considered for further analysis in each comparison were selected after
applying the following filters: (1) TRA log2 ratios were considered signif-
icant if $1.5 or #21.5; (2) positive TRA log2 ratios that had numerators
below 30 were not considered; (3) negative TRA log2 ratios that had
denominators below 30 were not considered; (4) the P value for differ-
ential expression was set to be#0.05. After applying the three first filters
(1 to 3), >99.9% of the genes passed the fourth filter. Transcripts that
passed all the filters were used to derive the information in Figure 3 and
Supplemental Data Set 2 online.
Sequence Analysis
Gene annotations were retrieved from the Chlamydomonas genome
browser, which was developed by the JGI (http://genome.jgi-psf.org/
Chlre3/Chlre3.home.html) in collaboration with the Chlamydomonas
community (Merchant et al., 2007). For gene models with no associated
annotation, BLAST searches were performed to identify sequence sim-
ilarities. Sequences were analyzed using DNAstar software v.4.05 (Laser-
gene Navigator), Bioedit Sequence Alignment Editor version 5.0.9
(Department of Microbiology, North Carolina State University), the Na-
tional Center for Biotechnology Information BLAST server (http://www.
ncbi.nlm.nih.gov/BLAST/), and the iPSORT and PSORT servers (http://
hc.ims.u-tokyo.ac.jp/iPSORT/ and http://psort.ims.u-tokyo.ac.jp/form.
html).
Accession Numbers
JGI v.3.1 protein accession numbers are provided in Supplemental Data
Set 1 onlinewith the correspondingWeb link to the JGI browser. RNA-seq
raw data (see Supplemental Data Sets 1 to 3 online) are available at the
Gene Expression Omnibus database (http://www.ncbi.nlm.nih.gov/geo/)
under accession number GSE17970 and at http://genomes.mcdb.ucla.
edu/CreSulfur/.
Supplemental Data
Supplemental Figure 1. Chlamydomonas Growth with Different
S-Containing Amino Acids as Sole S Source.
Supplemental Figure 2. Alignment of Putative Taurine Dioxygenases
(TAUD).
Supplemental Figure 3. CAH1 Transcript Accumulation in Wild-Type
and snrk2.1 Cells under Fixed and Inorganic Carbon Conditions
(Based on qRT-PCR).
Supplemental Figure 4. qq-Plots Comparing P Values from Selected
Pairwise Comparisons of the Total Number of Hits per Gene from
RNA-Seq Individual Lanes (See Supplemental Table 3 Online for
Details).
Supplemental Figure 5. Logarithmic Scatterplots of Normalized
Expression Fold Changes (y Axes) versus Overall Expression Mea-
sures (x Axes).
Supplemental Figure 6. Definition of Mappable Sets and Assignment
of k-Hits per Gene.
Supplemental Figure 7. Coverage Data for a 3-kb Region of the
GAP3 Locus.
Supplemental Table 1. Chlamydomonas Singlet Oxygen Stress-
Related Genes and Their Expression in the Wild Type and snrk2.1
Mutant in –S Conditions.
Supplemental Table 2. Primers Used for qPCR Analyses.
Supplemental Table 3. Summary Statistics for RNA-Seq Samples
and Sequence Alignment.
2080 The Plant Cell

Supplemental Data Set 1. Expression Levels of All Analyzed Tran-
scripts.
Supplemental Data Set 2. Relative Levels of Transcripts Repre-
sented in Figure 3.
Supplemental Data Set 3. Expression Levels of Genes Grouped by
Putative Functions.
Supplemental Methods.
Supplemental References.
ACKNOWLEDGMENTS
We thank Jeffrey Moseley and Wirulda Pootakham for critical discus-
sions and for reading the manuscript and the Joint Genome Institute for
generating a Chlamydomonas genome sequence, which has been
invaluable for both gene identification and mutant analyses. The work
conducted by the U.S. Department of Energy Joint Genome Institute is
supported by the Office of Science of the U.S. Department of Energy
under Contract No. DE-AC02-05CH11231. We also thank Weihong Yan
for loading the data onto the genome browser. This work was supported
by National Science Foundation Grants MCB 0824469 and MCB
0235878 awarded to A.R.G., as well as funds provided by the Carnegie
Institution, by the Marie Curie MOIF-CT-2006-40208-APOSD grant (EU)
awarded to D.G.-B., and by the Spanish Foundation of Science and
Technology (FECYT) and the California Nanosystems Institute (UCLA)
grants awarded to D.C. S.S.M. and M.P. acknowledge support from the
Department of Energy (DE-FC03-02ER63421).
Received September 4, 2009; revised April 1, 2010; accepted May 18,
2010; published June 29, 2010.
REFERENCES
Apel, K., and Hirt, H. (2004). Reactive oxygen species: Metabolism,
oxidative stress, and signal transduction. Annu. Rev. Plant Biol. 55:
373–399.
Asada, K. (2006). Production and scavenging of reactive oxygen
species in chloroplasts and their functions. Plant Physiol. 141:
391–396.
Audic, S., and Claverie, J.M. (1997). The significance of digital gene
expression profiles. Genome Res. 7: 986–995.
Bentley, R., and Chasteen, T.G. (2004). Environmental VOSCs-forma-
tion and degradation of dimethyl sulfide, methanethiol and related
materials. Chemosphere 55: 291–317.
Billheimer, J.T., Cornvale, H.N., Leisinger, T., Eckhardt, T., and
Jones, E.E. (1976). Ornithine d-transaminase in Escherichia coli: Its
identity with acetylornithine d-transaminase. J. Bacteriol. 127: 1315–
1323.
Bolling, C., and Fiehn, O. (2005). Metabolite profiling of Chlamydomo-
nas reinhardtii under nutrient deprivation. Plant Physiol. 139: 1995–
2005.
Bordo, D., and Bork, P. (2002). The rhodanese/Cdc25 phosphatase
superfamily. Sequence-structure-function relations. EMBO Rep. 3:
741–746.
Chang, C.W., Moseley, J.L., Wykoff, D., and Grossman, A.R. (2005).
The LPB1 gene is important for acclimation of Chlamydomonas
reinhardtii to phosphorus and sulfur deprivation. Plant Physiol. 138:
319–329.
Chen, H.C., Newton, A.J., and Melis, A. (2005). Role of SulP, a
nuclear-encoded chloroplast sulfate permease, in sulfate transport
and H2 evolution in Chlamydomonas reinhardtii. Photosynth. Res. 84:
289–296.
Collier, J.L., and Grossman, A.R. (1992). Chlorosis induced by nutrient
deprivation in Synechococcus sp. Strain PCC 7942: Not all bleaching
is the same. J. Bacteriol. 174: 4718–4726.
Colnaghi, R., Cassinelli, G., Drummond, M., Forlani, F., and Pagani,
S. (2001). Properties of the Escherichia coli rhodanese-like protein
SseA: Contribution of the active-site residue Ser240 to sulfur donor
recognition. FEBS Lett. 500: 153–156.
Couee, I., Sulmon, C., Gouesbet, G., and El Amrani, A. (2006).
Involvement of soluble sugars in reactive oxygen species balance and
responses to oxidative stress in plants. J. Exp. Bot. 57: 449–459.
Davies, J., Yildiz, F., and Grossman, A.R. (1996). Sac1, a putative
regulator that is critical for survival of Chlamydomonas reinhardtii
during sulfur deprivation. EMBO J. 15: 2150–2159.
Davies, J.P., Yildiz, F., and Grossman, A.R. (1994). Mutants of
Chlamydomonas reinhardtii with aberrant responses to sulfur depri-
vation. Plant Cell 6: 53–63.
Davies, J.P., Yildiz, F.H., and Grossman, A.R. (1999). Sac3, an Snf1-
like serine/threonine kinase that positively and negatively regulates
the responses of Chlamydomonas to sulfur limitation. Plant Cell 11:
1179–1190.
Dayer, R., Fischer, B.B., Eggen, R.I., and Lemaire, S.D. (2008). The
peroxiredoxin and glutathione peroxidase families in Chlamydomonas
reinhardtii. Genetics 179: 41–57.
de Hostos, E.L., Schilling, J., and Grossman, A.R. (1989). Structure
and expression of the gene encoding the periplasmic arylsulfatase of
Chlamydomonas reinhardtii. Mol. Gen. Genet. 218: 229–239.
de Hostos, E.L., Togasaki, R.K., and Grossman, A.R. (1988). Purifi-
cation and biosynthesis of a derepressible periplasmic arylsulfatase
from Chlamydomonas reinhardtii. J. Cell Biol. 106: 29–37.
Del Duca, S., Beninati, S., and Serafini-Fracassini, D. (1995). Poly-
amines in chloroplasts: Identification of their glutamyl and acetyl
derivatives. Biochem. J. 305: 233–237.
Della Mea, M., Di Sandro, A., Dondini, L., Del Duca, S., Vantini, F.,
Bergamini, C., Bassi, R., and Serafini-Fracassini, D. (2004). A Zea
mays 39-kDa thylakoid transglutaminase catalyses the modification
by polyamines of light-harvesting complex II in a light-dependent way.
Planta 219: 754–764.
Dembitsky, V.M. (2003). Oxidation, epoxidation and sulfoxidation re-
actions catalyzed by haloperoxidases. Tetrahedron 59: 4701–4720.
Dominy, J.E., Jr., Simmons, C.R., Karplus, P.A., Gehring, A.M., and
Stipanuk, M.H. (2006). Identification and characterization of bacterial
cysteine dioxygenases: A new route of cysteine degradation for
eubacteria. J. Bacteriol. 188: 5561–5569.
Eberhard, S., Jain, M., Im, C.S., Pollock, S., Shrager, J., Lin, Y., Peek,
A.S., and Grossman, A.R. (2006). Generation of an oligonucleotide
array for analysis of gene expression in Chlamydomonas reinhardtii.
Curr. Genet. 49: 106–124.
Eichhorn, E., van der Ploeg, J.R., Kertesz, M.A., and Leisinger, T.
(1997). Characterization of alpha-ketoglutarate-dependent taurine
dioxygenase from Escherichia coli. J. Biol. Chem. 272: 23031–23036.
Elrad, D., and Grossman, A.R. (2004). A genome’s-eye view of the
light-harvesting polypeptides of Chlamydomonas reinhardtii. Curr.
Genet. 45: 61–75.
Fauchon, M., Lagniel, G., Aude, J.C., Lombardia, L., Soularue, P.,
Petat, C., Marguerie, G., Sentenac, A., Werner, M., and Labarre, J.
(2002). Sulfur sparing in the yeast proteome in response to sulfur
demand. Mol. Cell 9: 713–723.
Ghirardi, M.L., Posewitz, M.C., Maness, P.C., Dubini, A., Yu, J., and
Seibert, M. (2007). Hydrogenases and hydrogen photoproduction in
oxygenic photosynthetic organisms. Annu. Rev. Plant Biol. 58: 71–91.
Chlamydomonas S-Deprived Transcriptome 2081

Giovanelli, J., Mudd, S.H., and Datko, A.H. (1985). Quantitative anal-
ysis of pathways of methionine metabolism and their regulation in
Lemna. Plant Physiol. 78: 555–560.
Gonzalez-Ballester, D., and Grossman, A.R. (2009). Sulfur: From
aquisition to assimilation. In The Chlamydomonas Sourcebook, D.
Stern, E.H. Harris, and G.B. Witman, eds (Amsterdam, The Nether-
lands: Elsevier), pp. 159–188.
Gonzalez-Ballester, D., Pollock, S.V., Pootakham, W., and Grossman,
A.R. (2008). The central role of a SNRK2 kinase in sulfur deprivation
responses. Plant Physiol. 147: 216–227.
Goyer, A., Haslekas, C., Miginiac-Maslow, M., Klein, U., Le Marechal,
P., Jacquot, J.P., and Decottignies, P. (2002). Isolation and charac-
terization of a thioredoxin-dependent peroxidase from Chlamydomonas
reinhardtii. Eur. J. Biochem. 269: 272–282.
Groppa, M.D., and Benavides, M.P. (2008). Polyamines and abiotic
stress: Recent advances. Amino Acids 34: 35–45.
Hansch, R., Lang, C., Rennenberg, H., and Mendel, R.R. (2007).
Significance of plant sulfite oxidase. Plant Biol. 9: 589–595.
Hanson, A.D., and Roje, S. (2001). One-carbon metabolism in higher
plants. Annu. Rev. Plant Physiol. Plant Mol. Biol. 52: 119–137.
Harris, E.H. (1989). The Chlamydomonas Sourcebook. A Comprehen-
sive Guide to Biology and Laboratory Use. (San Diego: Academic
Press).
Heifetz, P.B., Forster, B., Osmond, C.B., Giles, L.J., and Boynton,
J.E. (2000). Effects of acetate on facultative autotrophy in Chlamy-
domonas reinhardtii assessed by photosynthetic measurements and
stable isotope analyses. Plant Physiol. 122: 1439–1445.
Heimberg, H., Boyen, A., Crabeel, M., and Glansdorff, N. (1990).
Escherichia coli and Saccharomyces cerevisiae acetylornithine ami-
notransferase: Evolutionary relationship with ornithine aminotransfer-
ase. Gene 90: 69–78.
Hemrika, W., Renirie, R., Dekker, H.L., Barnett, P., and Wever, R.
(1997). From phosphatases to vanadium peroxidases: A similar ar-
chitecture of the active site. Proc. Natl. Acad. Sci. USA 94: 2145–
2149.
Hirai, M.Y., Fujiwara, T., Awazuhara, M., Kimura, T., Noji, M., and
Saito, K. (2003). Global expression profiling of sulfur-starved Arabi-
dopsis by DNA macroarray reveals the role of O-acetyl-l-serine as a
general regulator of gene expression in response to sulfur nutrition.
Plant J. 33: 651–663.
Hogan, D.A., Auchtung, T.A., and Hausinger, R.P. (1999). Cloning and
characterization of a sulfonate/alpha-ketoglutarate dioxygenase from
Saccharomyces cerevisiae. J. Bacteriol. 181: 5876–5879.
Ioannidis, N.E., and Kotzabasis, K. (2007). Effects of polyamines on
the functionality of photosynthetic membrane in vivo and in vitro.
Biochim. Biophys. Acta 1767: 1372–1382.
Ioannidis, N.E., Sfichi, L., and Kotzabasis, K. (2006). Putrescine
stimulates chemiosmotic ATP synthesis. Biochim. Biophys. Acta
1757: 821–828.
Irihimovitch, V., and Stern, D.B. (2006). The sulfur acclimation SAC3
kinase is required for chloroplast transcriptional repression under
sulfur limitation in Chlamydomonas reinhardtii. Proc. Natl. Acad. Sci.
USA 103: 7911–7916.
Kahnert, A., Vermeij, P., Wietek, C., James, P., Leisinger, T., and
Kertesz, M.A. (2000). The ssu locus plays a key role in organosulfur
metabolism in Pseudomonas putida S-313. J. Bacteriol. 182: 2869–
2878.
Kent, W.J. (2002). BLAT - The BLAST-like alignment tool. Genome Res.
12: 656–664.
Kessler, D. (2006). Enzymatic activation of sulfur for incorporation into
biomolecules in prokaryotes. FEMS Microbiol. Rev. 30: 825–840.
Kirk, D.L., and Kirk, M.M. (1978). Carrier-mediated uptake of arginine
and urea by Chlamydomonas reinhardtii. Plant Physiol. 61: 556–560.
Kopriva, S., Mugford, S.G., Matthewman, C., and Koprivova, A.
(2009). Plant sulfate assimilation genes: Redundancy versus special-
ization. Plant Cell Rep. 28: 1769–1780.
Ledford, H.K., Chin, B.L., and Niyogi, K.K. (2007). Acclimation to
singlet oxygen stress in Chlamydomonas reinhardtii. Eukaryot. Cell 6:
919–930.
Ledwidge, R., and Blanchard, J.S. (1999). The dual biosynthetic
capability of N-acetylornithine aminotransferase in arginine and lysine
biosynthesis. Biochemistry 38: 3019–3024.
Lemaire, S., Keryer, E., Stein, M., Schepens, I., Issakidis-Bourguet,
E., Gerard-Hirne, C., Miginiac-Maslow, M., and Jacquot, J.P.
(1999). Heavy-metal regulation of thioredoxin gene expression in
Chlamydomonas reinhardtii. Plant Physiol. 120: 773–778.
Lewandowska, M., and Sirko, A. (2008). Recent advances in under-
standing plant response to sulfur-deficiency stress. Acta Biochim.
Pol. 55: 457–471.
Li, R., Li, Y., Kristiansen, K., and Wang, J. (2008). SOAP: Short
oligonucleotide alignment program. Bioinformatics 24: 713–714.
Livak, K.J., and Schmittgen, T.D. (2001). Analysis of relative gene
expression data using real-time quantitative PCR and the 2(-Delta
Delta C(T)) method. Methods 25: 402–408.
Lunde, C., Zygadlo, A., Simonsen, H.T., Nielsen, P.L., Blennow, A.,
and Haldrup, A. (2008). Sulfur starvation in rice: The effect on
photosynthesis, carbohydrate metabolism, and oxidative stress pro-
tective pathways. Physiol. Plant. 134: 508–521.
Marioni, J.C., Mason, C.E., Mane, S.M., Stephens, M., and Gilad, Y.
(2008). RNA-seq: An assessment of technical reproducibility and
comparison with gene expression arrays. Genome Res. 18: 1509–
1517.
Mariscal, V., Moulin, P., Orsel, M., Miller, A.J., Fernandez, E., and
Galvan, A. (2006). Differential regulation of the Chlamydomonas Nar1
gene family by carbon and nitrogen. Protist 157: 421–433.
Maruyama-Nakashita, A., Inoue, E., Watanabe-Takahashi, A.,
Yamaya, T., and Takahashi, H. (2003). Transcriptome profiling of
sulfur-responsive genes in Arabidopsis reveals global effects of
sulfur nutrition on multiple metabolic pathways. Plant Physiol. 132:
597–605.
Maruyama-Nakashita, A., Nakamura, Y., Tohge, T., Saito, K., and
Takahashi, H. (2006). Arabidopsis SLIM1 is a central transcriptional
regulator of plant sulfur response and metabolism. Plant Cell 18:
3235–3251.
Mazel, D., and Marliere, P. (1989). Adaptive eradication of methionine
and cysteine from cyanobacterial light-harvesting proteins. Nature
341: 245–248.
Merchant, S.S., et al. (2007). The Chlamydomonas genome reveals the
evolution of key animal and plant functions. Science 318: 245–250.
Michelet, L., Zaffagnini, M., Marchand, C., Collin, V., Decottignies,
P., Tsan, P., Lancelin, J.M., Trost, P., Miginiac-Maslow, M.,
Noctor, G., and Lemaire, S.D. (2005). Glutathionylation of chloroplast
thioredoxin f is a redox signaling mechanism in plants. Proc. Natl.
Acad. Sci. USA 102: 16478–16483.
Michelet, L., Zaffagnini, M., Vanacker, H., Le Marechal, P., Marchand,
C., Schroda, M., Lemaire, S.D., and Decottignies, P. (2008). In vivo
targets of S-thiolation in Chlamydomonas reinhardtii. J. Biol. Chem.
283: 21571–21578.
Moharikar, S., D’Souza, J., Kulkarni, A.B., and Rao, B.J. (2006). UV-C
induced apoptotic-like cell death process in the unicellular chloro-
phyte Chlamydomonas reinhardtii. J. Phycol. 42: 423–433.
Moharikar, S., D’Souza, J.S., and Rao, B.J. (2007). A homologue of
the defender against the apoptotic death gene (dad1) in UV-
exposed Chlamydomonas cells is downregulated with the onset of
programmed cell death. J. Biosci. 32: 261–270.
Moroney, J.V., and Ynalvez, R.A. (2007). Proposed carbon dioxide
2082 The Plant Cell

concentrating mechanism in Chlamydomonas reinhardtii. Eukaryot.
Cell 6: 1251–1259.
Mortazavi, A., Williams, B.A., McCue, K., Schaeffer, L., and Wold, B.
(2008). Mapping and quantifying mammalian transcriptomes by RNA-
Seq. Nat. Methods 5: 621–628.
Moseley, J., and Grossman, A.R. (2009). Phosphorus limitation from
the physiological to the genomic. In The Chlamydomonas Source-
book, E.H. Harris, D. Stern, and G.B. Witman, eds (Amsterdam:
Elsevier), pp. 189–216.
Moseley, J.L., Gonzalez-Ballester, D., Pootakham, W., Bailey, S.,
and Grossman, A.R. (2009). Genetic interactions between regulators
of Chlamydomonas phosphorus and sulfur deprivation responses.
Genetics 181: 889–905.
Mueller, E.G. (2006). Trafficking in persulfides: Delivering sulfur in
biosynthetic pathways. Nat. Chem. Biol. 2: 185–194.
Mus, F., Dubini, A., Seibert, M., Posewitz, M.C., and Grossman, A.R.
(2007). Anaerobic acclimation in Chlamydomonas reinhardtii: Anoxic
gene expression, hydrogenase induction, and metabolic pathways.
J. Biol. Chem. 282: 25475–25486.
Nagalakshmi, U., Wang, Z., Waern, K., Shou, C., Raha, D., Gerstein,
M., and Snyder, M. (2008). The transcriptional landscape of the yeast
genome defined by RNA sequencing. Science 320: 1344–1349.
Navakoudis, E., Vrentzou, K., and Kotzabasis, K. (2007). A poly-
amine- and LHCII protease activity-based mechanism regulates the
plasticity and adaptation status of the photosynthetic apparatus.
Biochim. Biophys. Acta 1767: 261–271.
Nguyen, A.V., Thomas-Hall, S.R., Malnoe, A., Timmins, M., Mussgnug,
J.H., Rupprecht, J., Kruse, O., Hankamer, B., and Schenk, P.M.
(2008). The transcriptome of photo-biological hydrogen production
induced by sulphur deprivation in the green alga Chlamydomonas
reinhardtii. Eukaryot. Cell 7: 1965–1979.
Nikiforova, V., Freitag, J., Kempa, S., Adamik, M., Hesse, H., and
Hoefgen, R. (2003). Transcriptome analysis of sulfur depletion in
Arabidopsis thaliana: Interlacing of biosynthetic pathways provides
response specificity. Plant J. 33: 633–650.
Nikiforova, V.J., Daub, C.O., Hesse, H., Willmitzer, L., and Hoefgen,
R. (2005a). Integrative gene-metabolite network with implemented
causality deciphers informational fluxes of sulphur stress response.
J. Exp. Bot. 56: 1887–1896.
Nikiforova, V.J., Kopka, J., Tolstikov, V., Fiehn, O., Hopkins, L.,
Hawkesford, M.J., Hesse, H., and Hoefgen, R. (2005b). Systems
rebalancing of metabolism in response to sulfur deprivation, as
revealed by metabolome analysis of Arabidopsis plants. Plant Physiol.
138: 304–318.
Ogasawara, Y., Lacourciere, G.M., Ishii, K., and Stadtman, T.C.
(2005). Characterization of potential selenium-binding proteins in the
selenophosphate synthetase system. Proc. Natl. Acad. Sci. USA 102:
1012–1016.
Okazaki, Y., Shimojima, M., Sawada, Y., Toyooka, K., Narisawa, T.,
Mochida, K., Tanaka, H., Matsuda, F., Hirai, A., Hirai, M.Y., Ohta,
H., and Saito, K. (2009). A chloroplastic UDP-glucose pyrophosphor-
ylase from Arabidopsis is the committed enzyme for the first step of
sulfolipid biosynthesis. Plant Cell 21: 892–909.
Ortiz-Bermudez, P., Hirth, K.C., Srebotnik, E., and Hammel, K.E.
(2007). Chlorination of lignin by ubiquitous fungi has a likely role in
global organochlorine production. Proc. Natl. Acad. Sci. USA 104:
3895–3900.
Peers, G., Truong, T.B., Ostendorf, E., Elrad, D., Grossman, A.R.,
Hippler, M., and Niyogi, K.K. (2009). An ancient light-harvesting
protein is critical for the regulation of algal photosynthesis. Science
462: 518–521.
Pereira, Y., Lagniel, G., Godat, E., Baudouin-Cornu, P., Junot, C.,
and Labarre, J. (2008). Chromate causes sulfur starvation in yeast.
Toxicol. Sci. 106: 400–412.
Perez-Alegre, M., and Franco, A.R. (1998). Resistance to L-methi-
onine-S-sulfoximine in Chlamydomonas reinhardtii is due to an
alteration in a general amino acid transport system. Planta 207:
20–26.
Pollock, S.V., Colombo, S.L., Prout, D.L., Jr., Godfrey, A.C., and
Moroney, J.V. (2003). Rubisco activase is required for optimal pho-
tosynthesis in the green alga Chlamydomonas reinhardtii in a low-CO2
atmosphere. Plant Physiol. 133: 1854–1861.
Pollock, S.V., Pootakham, W., Shibagaki, N., Moseley, J.L., and
Grossman, A.R. (2005). Insights into the acclimation of Chlamydo-
monas reinhardtii to sulfur deprivation. Photosynth. Res. 86: 475–489.
Pootakham, W., Gonzalez-Ballester, D., and Grossman, A.R. (2010).
Identification and regulation of plasma membrane sulfate transporters
in Chlamydomonas reinhardtii. Plant Physiol. http://dx.doi.org/10.1104/
pp.110.157875.
Ravina, C.G., Barroso, C., Vega, J.M., and Gotor, C. (1999). Cyste-
ine biosynthesis in Chlamydomonas reinhardtii. Molecular cloning
and regulation of O-acetylserine(thiol)lyase. Eur. J. Biochem. 264:
848–853.
Ravina, C.G., Chang, C.I., Tsakraklides, G.P., McDermott, J.P.,
Vega, J.M., Leustek, T., Gotor, C., and Davies, J.P. (2002). The
sac mutants of Chlamydomonas reinhardtii reveal transcriptional and
posttranscriptional control of cysteine biosynthesis. Plant Physiol.
130: 2076–2084.
Richard, C., Ouellet, H., and Guertin, M. (2000). Characterization of
the LI818 polypeptide from the green unicellular alga Chlamydomonas
reinhardtii. Plant Mol. Biol. 42: 303–316.
Riemenschneider, A., Wegele, R., Schmidt, A., and Papenbrock, J.
(2005). Isolation and characterization of a D-cysteine desulfhydrase
protein from Arabidopsis thaliana. FEBS J. 272: 1291–1304.
Rouhier, N., Lemaire, S.D., and Jacquot, J.P. (2008). The role of
glutathione in photosynthetic organisms: Emerging functions for
glutaredoxins and glutathionylation. Annu. Rev. Plant Biol. 59:
143–166.
Sarkar, N., Lemaire, S., Wu-Scharf, D., Issakidis-Bourguet, E., and
Cerutti, H. (2005). Functional specialization of Chlamydomonas
reinhardtii cytosolic thioredoxin h1 in the response to alkylation-
induced DNA damage. Eukaryot. Cell 4: 262–273.
Sato, N., Tsuzuki, M., Matsuda, Y., Ehara, T., Osafune, T., and
Kawaguchi, A. (1995). Isolation and characterization of mutants
affected in lipid metabolism of Chlamydomonas reinhardtii. Eur. J.
Biochem. 230: 987–993.
Schloss, J.A., Silflow, C.D., and Rosenbaum, J.L. (1984). mRNA
abundance changes during flagellar regeneration in Chlamydomonas
reinhardtii. Mol. Cell. Biol. 4: 424–434.
Scott, J., Rebeille, F., and Fletcher, J.J. (2000). Folic acid and folates:
The feasibility for nutritional enhancement in plant foods. J. Sci. Food
Agric. 80: 795–824.
Sfichi-Duke, L., Ioannidis, N.E., and Kotzabasis, K. (2008). Fast and
reversible response of thylakoid-associated polyamines during and
after UV-B stress: A comparative study of the wild type and a mutant
lacking chlorophyll b of unicellular green alga Scenedesmus obliquus.
Planta 228: 341–353.
Slesak, I., Libik, M., Karpinska, B., Karpinski, S., and Miszalski, Z.
(2007). The role of hydrogen peroxide in regulation of plant metabo-
lism and cellular signalling in response to environmental stresses.
Acta Biochim. Pol. 54: 39–50.
Slocum, R.D. (2005). Genes, enzymes and regulation of arginine bio-
synthesis in plants. Plant Physiol. Biochem. 43: 729–745.
Sugimoto, K., Sato, N., and Tsuzuki, M. (2007). Utilization of a
chloroplast membrane sulfolipid as a major internal sulfur source for
Chlamydomonas S-Deprived Transcriptome 2083

protein synthesis in the early phase of sulfur starvation in Chlamydo-
monas reinhardtii. FEBS Lett. 581: 4519–4522.
Sugimoto, K., Tsuzuki, M., and Sato, N. (2009). Regulation of synthe-
sis and degradation of a sulfolipid under sulfur-starved conditions and
its physiological significance in Chlamydomonas reinhardtii. New
Phytol. 185: 676–686.
Takahashi, H., Braby, C.E., and Grossman, A.R. (2001). Sulfur econ-
omy and cell wall biosynthesis during sulfur limitation of Chlamydo-
monas reinhardtii. Plant Physiol. 127: 665–673.
Torkelson, J.D., Lynnes, J.A., and Weger, H.G. (1995). Extracellular
peroxidase-mediated oxygen consumption in Chlamydomonas rein-
hardtii (Chlorophyta). J. Phycol. 31: 562–567.
Triantaphylides, C., and Havaux, M. (2009). Singlet oxygen in
plants: Production, detoxification and signaling. Trends Plant Sci. 14:
219–228.
Triantaphylides, C., Krischke, M., Hoeberichts, F.A., Ksas, B.,
Gresser, G., Havaux, M., Van Breusegem, F., and Mueller, M.J.
(2008). Singlet oxygen is the major reactive oxygen species involved
in photooxidative damage to plants. Plant Physiol. 148: 960–968.
Voigt, J., Deinert, B., and Bohley, P. (2000). Subcellular localization
and light-dark control of ornithine decarboxylase in the unicellular
green alga Chlamydomonas reinhardtii. Physiol. Plant. 108: 353–360.
Vreeland, V., Waite, J.H., and Epstein, L. (1998). Polyphenols and
oxidases in sbustratum adhesion by marine algae and mussels.
J. Phycol. 34: 1–8.
Wang, Z., Gerstein, M., and Snyder, M. (2009). RNA-Seq: A revolu-
tionary tool for transcriptomics. Nat. Rev. Genet. 10: 57–63.
Williams, B., and Dickman, M. (2008). Plant programmed cell death:
Can’t live with it; can’t live without it. Mol. Plant Pathol. 9: 531–544.
Wykoff, D., Davies, J., and Grossman, A. (1998). The regulation of
photosynthetic electron transport during nutrient deprivation in Chla-
mydomonas reinhardtii. Plant Physiol. 117: 129–139.
Yildiz, F., Davies, J.P., and Grossman, A.R. (1994). Characterization of
sulfate transport in Chlamydomonas reinhardtii during sulfur-limited
and sulfur-sufficient growth. Plant Physiol. 104: 981–987.
Yoda, H., Yamaguchi, Y., and Sano, H. (2003). Induction of hypersen-
sitive cell death by hydrogen peroxide produced through polyamine
degradation in tobacco plants. Plant Physiol. 132: 1973–1981.
Zhang, L., Happe, T., and Melis, A. (2002). Biochemical and morpho-
logical characterization of sulfur-deprived and H2-producing Chlamy-
domonas reinhardtii (green alga). Planta 214: 552–561.
Zhang, L., and Melis, A. (2002). Probing green algal hydrogen produc-
tion. Philos. Trans. R. Soc. Lond. B Biol. Sci. 357: 1499–1507.
Zhang, Z., Shrager, J., Jain, M., Chang, C.W., Vallon, O., and
Grossman, A.R. (2004). Insights into the survival of Chlamydomonas
reinhardtii during sulfur starvation based on microarray analysis of
gene expression. Eukaryot. Cell 3: 1331–1348.
2084 The Plant Cell

Correction
David Gonzalez-Ballester, David Casero, Shawn Cokus, Matteo Pellegrini, Sabeeha S. Merchant, and Arthur R. Grossman. (2010).
RNA-Seq Analysis of Sulfur-Deprived Chlamydomonas Cells Reveals Aspects of Acclimation Critical for Cell Survival. Plant Cell 22: 2058–
2084.
Table 3 has been corrected to read:
Table 3. Expression Levels of Selected S-Regulated Genes
Fold Change Expression (Log2)
Transcript Abundance (RPKM)aWild Type 2S/
Wild Type 1S
snrk2.1/Wild Type
(1S)
snrk2.1/ Wild Type
(2S) Wild
Type 2S
Wild
Type 1S
snrk2.1
2S
snrk2.1
1SID Name/Description S Q S Q S Q
Sulfur acquisition and assimilation
205496 ARS1, arylsulfatase (ext.) 10.5 9.5 21.2 20.5 216.1 212.0 2717 2 0 1
55757 ARS2, arylsulfatase (ext.) 8.2 12.2 1.0 22.9 211.1 215.1 84 0 0 1
205502 SLT1, Na1/ SO422 transporter
type (p)
6.9 7.9 26.3 27.3 215.0 220.4 2341 20 0 0
205501 SLT2, Na1/ SO422 transporter
type (p)
6.3 9.3 22.5 21.0 29.8 210.3 1339 17 1 3
150514 SULTR2, H1/SO422 transporter
type (p)
5.3 7.7 24.5 23.9 26.4 27.5 152 4 2 0
196910 ATS1, ATP sulfurylase 1.6 1.6 21.2 21.3 23.0 22.9 2137 723 275 305
133924 ATS2, ATP
sulfurylase (chl)
2.8 3.6 0.0 0.0 24.4 23.6 254 36 12 37
128906 SULP1, chl. SO422 transport
system
2.4 20.6 23.4 147 28 14 18
116547 SULP2, chl. SO422 transport
system
1.5 20.7 22.2 56 20 12 12
182359 SBP1, chl. SO422 transport
system
1.5 21.1 22.7 79 28 12 13
194724 SABC (CysA), chl. SO422
transport system
2.6 20.5 22.7 144 24 23 17
184419 APK, APS kinase (chl.) 0.4 1.3 0.5 20.7 21.7 21.6 39 29 12 41
131444 APR (MET16), APS
sulforeductase (chl.)
0.5 1.4 20.9 0.8 22.3 20.6 285 197 57 105
206154 SIR1, ferredoxin-sulfite
reductase (chl.)
2.0 21.1 22.3 124 31 26 14
205485 SIR2, ferredoxin-sulfite
reductase
2.2 20.7 22.2 597 126 132 80
189320 OASTL4a,
O-acetylserine(thiol)-
lyase (chl.)
2.9 5.6 20.3 20.3 25.0 26.6 976 128 31 103
205985 SAT1a, serineacetyl
transferase (chl.)
5.1 4.2 20.7 0.1 24.3 24.3 794 23 40 14
24268 CGS1 (METB), cystathionine
g-synthase (chl.)
21.6 20.6 1.4 23 71 63 49
127384 THS1, Thr synthase (chl.) 21.4 20.7 20.3 54 138 42 84
196483 METC, cystathionine
b-lyase (chl.)
20.5 20.5 1.3 24 34 57 24
154307 METE, Met synthase 23.7 20.6 0.2 46 606 54 395
76715 METH1, Met synthase
(cobalamin)
22.0 20.9 20.2 33 134 29 72
195332 METH2, Met synthase
(cobalamin)
22.8 20.8 1.1 30 211 65 123
(Continued)
www.plantcell.org/cgi/doi/10.1105/tpc.111.230460
The Plant Cell, Vol. 23: 1679–1681, April 2011, www.plantcell.org ã 2011 American Society of Plant Biologists

Table 3 (continued).
Fold Change Expression (Log2)
Transcript Abundance (RPKM)aWild Type 2S/
Wild Type 1S
snrk2.1/Wild Type
(1S)
snrk2.1/ Wild Type
(2S) Wild
Type 2S
Wild
Type 1S
snrk2.1
2S
snrk2.1
1SID Name/Description S Q S Q S Q
182408 METM, S-adenosylmethionine
synthetase
22.1 20.2 20.3 526 2288 420 1976
129593 SAH1, S-adenosylhomocysteine
hydrolase
23.1 20.4 20.9 152 1298 83 952
183928 DCA1, S-adenosylmethionine
decarboxylase
21.8 20.3 1.5 54 184 149 146
206104 AOT2, amino acid/polyamine
transporter (p)
4.1 3.6 25.5 22.4 29.8 26.3 36 2 0 0
206105 AOT4, amino acid/polyamine
transporter (p)
3.9 4.0 28.0 28.8 213.0 213.1 311 21 0 0
185190 THI4a, thiazole biosynthetic
enzyme
23.2 20.1 22.8 203 1859 29 1682
196899 THI4b, THI4 regulatory protein 23.2 20.1 22.8 188 1715 27 1557
192720 THICa, hydroxymethylpyrimidine
phosphate synthase
23.9 20.4 23.3 6 95 1 74
196900 THICb, hydroxymethylpyrimidine
phosphate synthase
23.9 20.4 23.4 6 92 1 72
142289 BIOB1, biotin synthase 22.5 1.1 20.5 2 10 1 23
97943 BIOB2, biotin synthase 21.9 20.1 21.6 23 86 8 77
181975 GSH1, g-glutamylcysteine
synthetase (chl.)
0.1 0.0 0.1 35 33 38 34
189020 GSH2, glutathione
synthetase (chl.)
20.3 20.3 21.4 20 25 8 20
170508 GTP1, g-glutamyl transpeptidase 0.2 0.7 0.7 25 23 41 37
Redistribution and recycling of S
143892 CDO1, Cys dioxygenase 4.7 4.5 21.4 24.0 27.3 28.4 138 5 1 2
127464 TAUD1, taurin dioxigenase 7.1 5.6 23.5 25.3 211.7 212.5 1417 10 0 1
77600 TAUD2, taurin dioxigenase 5.2 6.6 20.4 0.9 25.1 26.4 632 17 19 13
59800 SUOX1, sulfite oxidase, mit. 2.0 20.2 21.8 149 36 42 31
183511 RDP3, small rodhanase 4.1 4.4 20.8 22.7 24.0 26.6 369 21 24 12
132010 TST, mercaptopyruvate
sulfurtransferase
0.2 0.4 21.5 22 19 8 26
167884 CSD2 (NIFS2), Cys
desulfurase
1.6 20.2 22.0 43 14 10 12
98369 D-Cys desulfhydrase 2.2 0.2 22.5 37 8 7 9
Lipid metabolism
144554 Esterase/lipase/thioesterase 3.1 20.5 21.6 65 7 21 5
27658 SQD1, UDP-sulfoquinovose
synthase
1.7 20.9 24.1 336 102 19 57
206163 SQD2, sulfolipid synthase 1.5 20.3 25.1 53 19 2 16
196477 LPB1, low phosphate bleaching 4.1 4.2 21.6 20.7 25.5 25.8 1711 98 39 33
Photosynthesis
Stress-related genes
148916 ELIP3, chlorophyll a/b binding
protein
2.9 0.0 0.0 42 6 42 6
184724 LHCSR1, light-harvesting
stress-related protein (chl.)
1.8 2.2 0.6 1.2 21.6 22.1 596 174 202 257
184731 LHCSR2, light-harvesting
stress-related protein (chl.)
2.1 4.6 1.4 5.9 0.4 2.0 244 56 315 148
184730 LHCSR3, light-harvesting
stress-related protein (chl.)
2.3 5.5 1.1 7.0 20.1 3.0 611 128 564 275
Major light-harvesting proteins of PSII
185533 LHCBM1 (chl.) 20.6 22.9 0.2 20.3 21.1 27.2 5425 8019 2584 9327
184067 LHCBM2 (chl.) 20.2 22.9 0.2 20.3 20.6 21.9 2705 3188 1740 3774
195162 LHCBM3 (chl.) 21.7 24.5 0.5 0.1 20.2 25.5 676 2262 606 3112
(Continued)
1680 The Plant Cell

Table 3 (continued).
Fold Change Expression (Log2)
Transcript Abundance (RPKM)aWild Type 2S/
Wild Type 1S
snrk2.1/Wild Type
(1S)
snrk2.1/ Wild Type
(2S) Wild
Type 2S
Wild
Type 1S
snrk2.1
2S
snrk2.1
1SID Name/Description S Q S Q S Q
191690 LHCBM4 (chl.) 20.3 23.5 0.3 0.2 22.2 21.2 747 951 163 1160
184775 LHCBM5 (chl.) 21.4 23.4 0.6 0.4 22.6 26.8 564 1485 95 2292
184490 LHCBM6 (chl.) 21.1 22.6 0.0 0.1 0.0 21.3 1177 2448 1163 2494
184071 LHCBM7 (chl.) 20.9 24.3 0.4 0.1 22.3 25.6 3673 7052 732 9094
205752 LHCBM8 (chl.) 20.5 27.5 0.2 20.6 23.0 21.6 80 114 10 129
184479 LHCBM9 (chl.) 10.0 8.8 22.6 210.1 212.8 220.5 21455 21 3 3
Carbon metabolism
196354 SHMT2, Ser
hydroxymethyltransferase 2
23.0 20.4 0.5 31 254 43 196
101528 6-phosphogluconolactonase-
like protein
2.0 20.2 21.3 401 100 160 85
163301 GLD2-C, Glc-6-phosphate
dehydrogenase
2.3 20.3 22.1 77 16 18 13
192597 GND1a, 6-phosphogluconate
dehydrogenase
(decarboxylating) (chl.)
1.9 20.2 21.6 308 83 101 74
158911 GND1b, 6-phosphogluconate
dehydrogenase
(decarboxylating) (cyt.)
1.9 20.2 21.6 313 86 102 74
163238 RIBA, bifunctional GTP
cyclohydrolase II/3,4-
dihydroxy-2butanone-4-
phosphate synthase
1.7 20.7 22.4 83 26 15 16
196834 CAH9, carbonic anhydrase (cyt.?) 5.0 21.1 26.8 1952 62 18 28
Folate metabolism
206121 MTDH/MTCH2,
methylenetetrahydrofolate
dehydrogenase/
methylenetetrahydrofolate
cyclohydrolase
21.6 20.2 21.5 13 40 5 35
127560 FTHFS,
10-formyltetrahydrofolate
synthetase
22.5 0.3 21.8 10 59 3 71
30522 ADCL1, aminotransferase
related to 4-amino-4-
deoxychorismate lyase
21.7 20.2 0.2 23 73 26 65
111330 MTHFR,
5,10-methylenetetrahydrofolate
reductase
23.1 20.1 0.1 11 92 12 86
182461 GGH1, g-glutamyl
hydrolase
3.9 20.6 26.2 36 2 0 2
Extracellular/cell wall proteins
168785 HAP1, vanadium haloperoxidase 7.9 7.8 20.2 22.0 28.4 211.7 739 3 2 3
143696 HAP2, vanadium haloperoxidase 8.4 7.1 20.1 20.6 211.6 211.5 1044 3 0 3
182794 HAP3, vanadium haloperoxidase 7.1 6.5 23.2 21.0 211.1 27.2 1456 10 1 1
130684 ECP76, extracellular protein 10.7 10.3 20.8 20.4 213.1 211.8 899 1 0 0
137329 ECP88, extracellular protein 13.4 22.3 215.9 2295 0 0 0
119420 ECP61, extracellular protein 8.5 20.6 211.0 268 1 0 0
194201 ECP56, extracellular protein 8.6 24.2 213.0 317 1 0 0
Fold change (log2 values) in transcript levels under specified conditions as determined by RNA-seq (S) and, when available, by qRT-PCR (Q). Values above
1.5 or below 21.5 are marked in bold type. Some genes for which expression is not affected by 2S conditions are included for informative purposes.
Putative subcellular localizations are denoted in parentheses after the transcript names as: cyt., cytosolic; mit., mitochondria; chl., chloroplast; and ext.,
extracellular. ID, JGI protein accession number; p, putative.aTranscript abundance obtained from RNA-seq is indicated as RPKMs (see Methods).
Correction 1681

DOI 10.1105/tpc.109.071167; originally published online June 29, 2010; 2010;22;2058-2084Plant Cell
Arthur R. GrossmanDavid González-Ballester, David Casero, Shawn Cokus, Matteo Pellegrini, Sabeeha S. Merchant and
Critical for Cell Survival Cells Reveals Aspects of AcclimationChlamydomonasRNA-Seq Analysis of Sulfur-Deprived
This information is current as of June 6, 2019
Supplemental Data /content/suppl/2010/05/26/tpc.109.071167.DC1.html
References /content/22/6/2058.full.html#ref-list-1
This article cites 110 articles, 48 of which can be accessed free at:
Permissions https://www.copyright.com/ccc/openurl.do?sid=pd_hw1532298X&issn=1532298X&WT.mc_id=pd_hw1532298X
eTOCs http://www.plantcell.org/cgi/alerts/ctmain
Sign up for eTOCs at:
CiteTrack Alerts http://www.plantcell.org/cgi/alerts/ctmain
Sign up for CiteTrack Alerts at:
Subscription Information http://www.aspb.org/publications/subscriptions.cfm
is available at:Plant Physiology and The Plant CellSubscription Information for
Errata
/content/23/4/1679.full.pdfbe accessed at:An erratum has been published regarding this article. It is appended to this PDF and can also
ADVANCING THE SCIENCE OF PLANT BIOLOGY © American Society of Plant Biologists