RMB Morgan Stanley Off-Piste Conference - mpact.com · 5 │ Mpact Limited 2013 RMB Morgan Stanley...
25
1 │ Mpact Limited Annual Results│ 8 March 2012 RMB Morgan Stanley Off-Piste Conference 2-3 October 2013 Cape Town
Transcript of RMB Morgan Stanley Off-Piste Conference - mpact.com · 5 │ Mpact Limited 2013 RMB Morgan Stanley...

1 │ Mpact Limited Annual Results│ 8 March 2012
RMB Morgan Stanley Off-Piste Conference2-3 October 2013Cape Town

│ Presentation title │ 00 Month 201122 │ Mpact Limited 2013 RMB Morgan Stanley Off-Piste Conference
Agenda
• Introduction
• Mpact business overview
• Group financial performance review
• Strategy
• Outlook

3 │ Mpact Limited 2013 RMB Morgan Stanley Off-piste Conference
Introduction
• Listed on JSE Main Board 11 July 2011 – demerged from Mondi Limited
• Mpact is a leading Southern African producer of paper and plastic packaging
• Market capitalisation – R4,4bn at 25 September 2013

│ Presentation title │ 00 Month 201144 │ Mpact Limited 2013 RMB Morgan Stanley Off-Piste Conference
Agenda
• Introduction
• Mpact business overview
• Group financial performance review
• Strategy
• Outlook

5 │ Mpact Limited 2013 RMB Morgan Stanley Off-piste Conference
SA packaging sector overview
PAGE 5
SA packaging ex-converter sales1 2012 (Volume) SA packaging ex-converter sales1 2012 (Value)
1. Source: BMI Report (2013) 2. “Ex converter” sales refer to sales of packaging materials converted in the country by local producers (includes imports and exports)3. Private Consumption Expenditure (PCE) : Consumption spending by households, which is the largest component of total spending in the economy. Source: BMI (2013); ABSA and South
African Reserve Bank4. Source: IMF
Industry overview
Other, 4.3% Metal,
8.8%
Glass, 32.4%
Paper, 31.2%
Plastic, 23.4%
Other, 0.8%
Metal, 11.1%
Glass, 12.6%
Paper, 27.7%
Plastic, 47.7%
80
90
100
110
120
2007 2008 2009 2010 2011 2012
Corrugated Cartonboard Rigids Flexibles Metal Glass
Inde
x(2
007
= 10
0)
Total packaging volume % growth forecast in tons“Ex Converter” Sales
ValueCAGR
(’07 - ’12)
VolumeCAGR
(’07 - ’12)
Globalconsumption
CAGR(’10 - ’15)
Rigids 7.7% 2.9% 4.1%
Corrugated 5.0% 0.1%2.4%
Cartonboard 6.0% (0.7%)
Flexibles 5.0% 1.3% 3.8%
Metal 1.5% (3.4%) 1.7%
Glass 5.5% 0% 2.7%
GDP� 1.9%
PCE� 2.6%
World GDP� 2.8%
Glass
6 │ Mpact Limited 2013 RMB Morgan Stanley Off-piste Conference
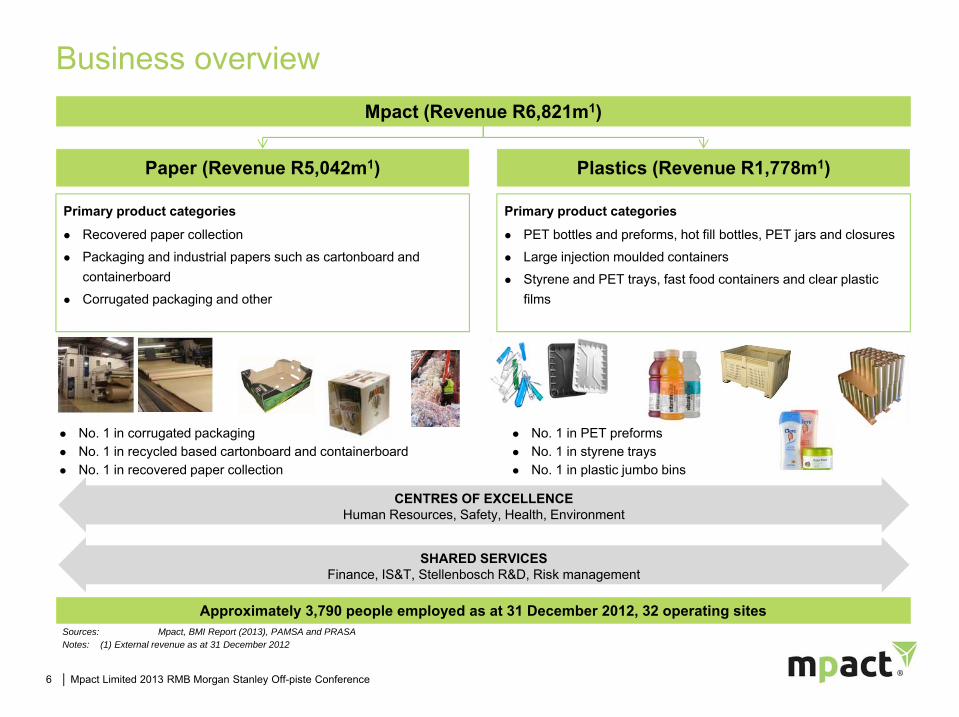
Business overview
Plastics (Revenue R1,778m1)
Mpact (Revenue R6,821m1)
Primary product categories
Recovered paper collection
Packaging and industrial papers such as cartonboard and containerboard
Corrugated packaging and other
Primary product categories
PET bottles and preforms, hot fill bottles, PET jars and closures
Large injection moulded containers
Styrene and PET trays, fast food containers and clear plastic films
Paper (Revenue R5,042m1)
No. 1 in corrugated packaging No. 1 in recycled based cartonboard and containerboard No. 1 in recovered paper collection
No. 1 in PET preforms No. 1 in styrene trays No. 1 in plastic jumbo bins
CENTRES OF EXCELLENCEHuman Resources, Safety, Health, Environment
Approximately 3,790 people employed as at 31 December 2012, 32 operating sites
SHARED SERVICESFinance, IS&T, Stellenbosch R&D, Risk management
Sources: Mpact, BMI Report (2013), PAMSA and PRASANotes: (1) External revenue as at 31 December 2012

7 │ Mpact Limited 2013 RMB Morgan Stanley Off-piste Conference
Richards Bay
Durban
Port Elizabeth
Nelspruit Maputo1
East London
Bloemfontein�
Cape Town
Piet Retief
Pretoria
Felixton
Corrugated
Recycling
Plastics
Harare
Packaging and Industrial Paper
Walvis Bay1
Windhoek1 Brits
Johannesburg
Atlantis
Operating structure which enables superior flexibility and responsiveness to customer requirements
Broad manufacturing and service footprint enabling Superior customer focus Responsiveness and flexibility in meeting
customer requirements Customised solutions
Source: MpactNotes: (1) Mpact has 2 sheet plants in Mozambique and Namibia in which it holds a controlling interest
(2) Corrugated sales office
Paarl
Springs
Midrand
Geographical footprint

8 │ Mpact Limited 2013 RMB Morgan Stanley Off-piste Conference
Paper business overview
PAGE 8
Key products : Cartonboard: Containerboard: Retail ready packaging: Regular slotted cartons: POS packaging and displays: Die-cut solutions
Key customers : Packaging converters (containerboard and cartonboard): Agricultural producers: FMCG companies: Quick service restaurants: Other consumer and industrial packaging companies
Operations : Recycling (7): Paper Manufacturing (3): Corrugated (9) + (2)1 + (1)
Employees : 2,444
Leader in recovered paper collection, production of cartonboard, containerboard and corrugated packagingSources: Mpact and financial figures extracted from audited Mpact financial informationNotes: (1) Mpact has 2 sheet plants in Mozambique and Namibia in which it holds a controlling interest
Paper
Divisions : Recycling: Paper Manufacturing: Corrugated and converting
CartonboardStandard and customised cases
Frui
t and
veg
etab
le tr
ays
Retail ready packaging
Containerboard
External Revenue (2012)
R5,042m
EBITDA (2012)
R746m
74% 76%
Other

9 │ Mpact Limited 2013 RMB Morgan Stanley Off-piste Conference
Recycling
PAGE 9Paper
Geographic footprint
Customer base
Sources of recovered paperCollected volumes (kt)
Source: Mpact Note: (1) Mondi Shanduka Newsprint
Sappi
Nampak
Kimberly Clark
Lothlorien
Gayatri
Independents
Key competitorsRichards Bay
Durban
Port Elizabeth
East London
Cape Town
JohannesburgSprings
Pretoria
Midrand
Governments and local authorities
Schools
Paper banks
Converters
Agents, dealers, waste management companies
Business and offices
Kerbside
Imports
Mobile cages and bakkies
59% Current recovery rate of recoverable paper in SA
Target rate63%
Mpact Recycling shareholding 75% Mpact Limited
25% Mondi Limited
Internal consumption, 70%
MSN1 and others, 30%457k tons
402
441448 450
457
2008 2009 2010 2011 2012
• The largest paper recycler in SA
• Recovery and recycling of paper in SA ensures local beneficiation of raw materials and creation of jobs
• Over 100,000 people involved in the recycling industry in SA
• Seven operations in major centres and 42 buy-back centres
• Over 40 entrepreneurial companies empowered to facilitate collection strategies
10 │ Mpact Limited 2013 RMB Morgan Stanley Off-piste Conference
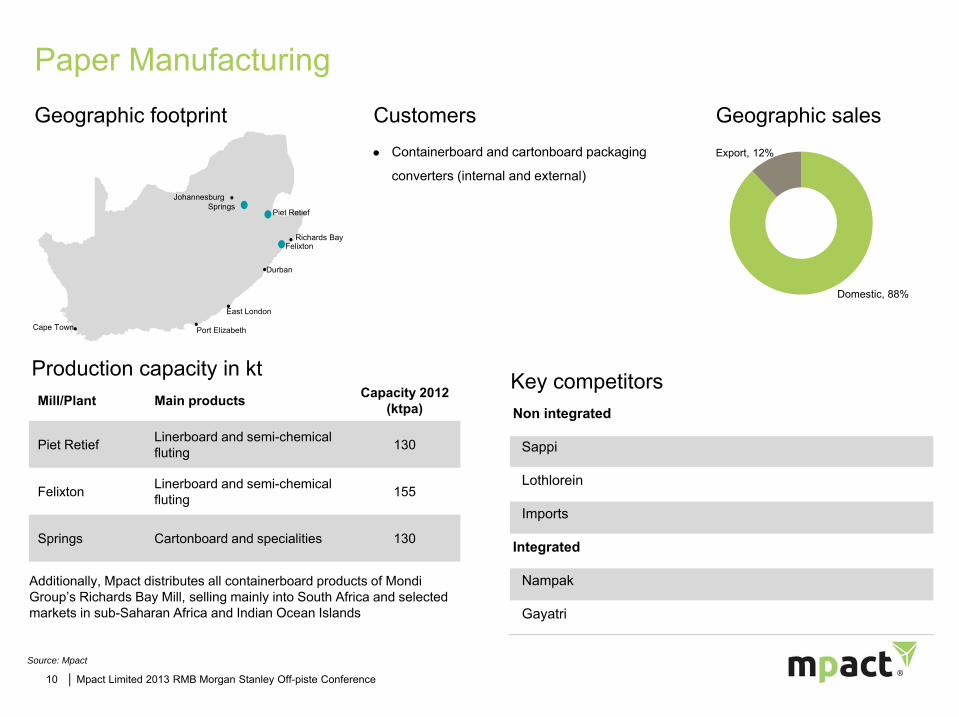
Paper Manufacturing
PAGE 10Paper
Geographic footprint Customers
Key competitors Production capacity in kt
Additionally, Mpact distributes all containerboard products of Mondi Group’s Richards Bay Mill, selling mainly into South Africa and selected markets in sub-Saharan Africa and Indian Ocean Islands
Mill/Plant Main products Capacity 2012 (ktpa)
Piet Retief Linerboard and semi-chemical fluting 130
Felixton Linerboard and semi-chemical fluting 155
Springs Cartonboard and specialities 130
Containerboard and cartonboard packaging
converters (internal and external)
Geographic sales
Non integrated
Sappi
Lothlorein
Imports
Integrated
Nampak
Gayatri
Durban
Port Elizabeth
East London
Cape Town
JohannesburgSprings
Piet Retief
Felixton
Domestic, 88%
Richards Bay
Source: Mpact
Export, 12%

11 │ Mpact Limited 2013 RMB Morgan Stanley Off-piste Conference
Durban
Port Elizabeth
Nelspruit Maputo1
East London
Bloemfontein2
Walvis Bay1
Windhoek1
Cape Town
JohannesburgSprings
Epping
Brakpan
Corrugated Packaging
PAGE 11Paper
Geographic footprint Customers
Key competitors Production in m2 (million)
Overview
Sources: Mpact and BMI Report (2013)Notes: (1) Mpact has sheet plants in Mozambique and Namibia (holding a controlling interest)
(2) Corrugated sales office in Bloemfontein(3) Management estimates
Nampak
New Era
APL
Corruseal
Houers
Three high-graphic printing
machines situated in Springs,
Pinetown and Epping offering
high-quality graphic printing on
corrugated board. These are
complimented by in-house graphic
design facilities
ISO 14,000 and ISO 9,000
environmental and quality
management systems,
respectively
Corrugated packaging products
include: Corrugated regular cases Die-cut cases Folded glued cases Trays Point of sale displays
Localised customer base
Customers include producers of agricultural,
food durable and non durable goods3:
Sheet board, 20% Agricultural,
38%
FMCG, 30%
Other, 12%
305 328367 381 369 387 391 413
2005 2006 2007 2008 2009 2010 2011 2012

12 │ Mpact Limited 2013 RMB Morgan Stanley Off-piste Conference
Plastics business overview
PAGE 12
Leader in the manufacture of PET preforms, styrene trays and plastic jumbo bins
Key products : PET preforms, bottles and jars: Plastic jumbo bins, wheelie bins, plastic crates: Plastic containers such as bottles, jars, closures, with in-mould labelling capability
: Styrene and PET trays, fast food containers and clear plastic films
Key customers : FMCG companies (carbonated soft drinks, personal care, pharmaceuticals, food producers)
: Fast food producers: Agricultural producers: Retail chains
Operations : Styrene trays and clear plastic films (3): Large injection moulds (2): PET injection (1) , FMCG plastic packaging (3) and closures (1)
Employees : 1,234
Plastic Jumbo Bins, Wheelie Bins, Plastic Crates and Pallets
Styrene and PET Trays, Fast Food Containers and Clear Plastic Film
PET Preforms, Bottles and Jars
FMCG Bottles, Jars, Closures and In-Mould Labelling
External Revenue (2012)
R1,778m
EBITDA (2012)
R226m
Plastics
Sources: Mpact and financial figures extracted from audited Mpact financial information
26% 24%

13 │ Mpact Limited 2013 RMB Morgan Stanley Off-piste Conference
Plastics segment overview
PAGE 13Plastics
Geographic footprint Customer base
Key competitors Mills/plants and main productsMill/Plant Main products
WadevillePET preforms, jars, bottles and hot fill bottles, closuresInjection moulding, blow moulding
Atlantis (Large Injection) Plastic jumbo bins, wheelie bins, plastic cratesInjection moulding
Brits Plastic jumbo bins, wheelie bins, plastic cratesInjection moulding
PinetownFMCG packaging bottles, jars, closures, in-mould labelsInjection moulding, blow moulding, IML
RobertvilleFMCG plastic bottles, jars, closuresInjection moulding, blow moulding, compression moulding
Atlantis (FMCG)FMCG plastic bottles, jars, closuresInjection moulding, blow moulding, PET bottles and printing
Versapak Paarl Styrene trays, fast food containers, PET trays and blisterpack and clear plastic films
Versapak Harare Styrene trays, fast food containers and clear plastic films
Nampak
Astrapak
Bowler Metcalf
Polyoak
MCG
CIBA
Boxmore
Beverage, 27%1
Food, 23%Distributors, 19%
Retail, 9%
Personal care, 8%
Agricultural, 7%
Home care, 6% Other, 1%
Durban
Port Elizabeth
Brits
East LondonAtlantis
Johannesburg
Paarl
Pretoria
Harare
Pinetown
Robertville Wadeville
Note: (1) A significant proportion of beverage sales is made up by an Amalgamated Beverages (ABI) contract for PET preforms
Blackheath

│ Presentation title │ 00 Month 20111414 │ Mpact Limited 2013 RMB Morgan Stanley Off-Piste Conference
Agenda
• Introduction
• Mpact business overview
• Group financial performance review
• Strategy
• Outlook
15 │ Mpact Limited 2013 RMB Morgan Stanley Off-piste Conference
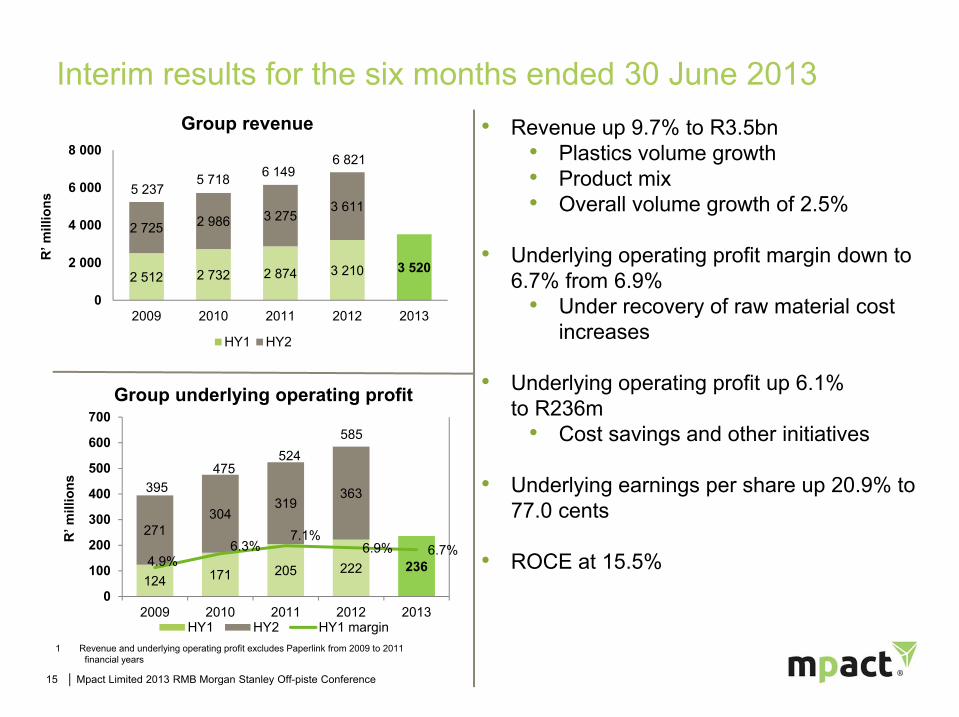
Interim results for the six months ended 30 June 2013�
2 512 2 732 2 874 3 210 3 520
2 725 2 986 3 2753 611
0
2 000
4 000
6 000
8 000
2009 2010 2011 2012 2013
R’ m
illio
ns
Group revenue
HY1 HY2
5 2375 718 6 149
6 821
124 171 205 222 236
271304
319363
4.9%6.3%
7.1%6.9% 6.7%
0
100
200
300
400
500
600
700
2009 2010 2011 2012 2013
R’ m
illio
ns
Group underlying operating profit
HY1 HY2 HY1 margin
395475
524585
• Revenue up 9.7% to R3.5bn• Plastics volume growth • Product mix• Overall volume growth of 2.5%
• Underlying operating profit margin down to 6.7% from 6.9%
• Under recovery of raw material cost increases
• Underlying operating profit up 6.1%to R236m
• Cost savings and other initiatives
• Underlying earnings per share up 20.9% to 77.0 cents
• ROCE at 15.5%
1 Revenue and underlying operating profit excludes Paperlink from 2009 to 2011 financial years

16 │ Mpact Limited 2013 RMB Morgan Stanley Off-piste Conference
Financial review
1 Underlying operating profit includes operating profit of subsidiaries before special items.
R’millions H1 2012 H1 2013 Change
Underlying operating profit1 222 236 6.1%
Net finance costs (64) (60) 6.4%
Associates and JV net earnings 2 4 81.8%
Underlying profit before tax 160 180 12.1%
Tax before special items (50) (51) (2.4%)
Total non-controlling interests (6) (3) 55.0%
Underlying earnings 104 126 20.7%
Special items (after tax and minorities) (4) - 100%
Reported profit after tax and non-controlling interests
Underlying earnings per share (cents)
100 126 25.4%
63.7 77.0 20.9%
17 │ Mpact Limited 2013 RMB Morgan Stanley Off-piste Conference
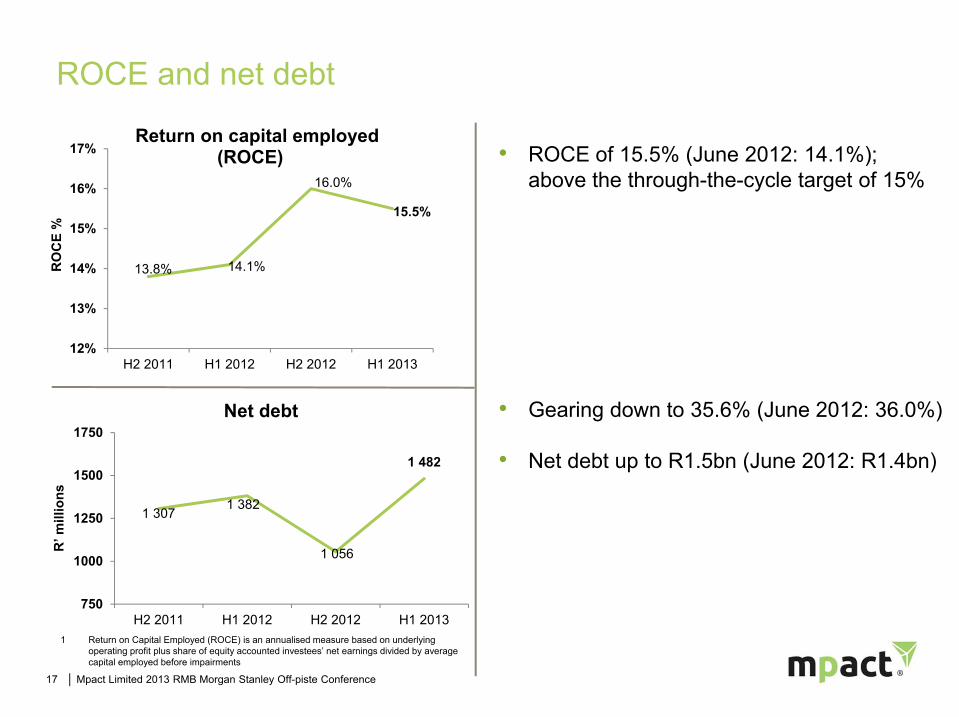
ROCE and net debt
13.8% 14.1%
16.0%
15.5%
12%
13%
14%
15%
16%
17%
H2 2011 H1 2012 H2 2012 H1 2013
RO
CE
%
Return on capital employed (ROCE)�
1 3071 382
1 056
1 482
750
1000
1250
1500
1750
H2 2011 H1 2012 H2 2012 H1 2013
R’ m
illio
ns
Net debt
• ROCE of 15.5% (June 2012: 14.1%);above the through-the-cycle target of 15%
• Gearing down to 35.6% (June 2012: 36.0%)
• Net debt up to R1.5bn (June 2012: R1.4bn)
1 Return on Capital Employed (ROCE) is an annualised measure based on underlying operating profit plus share of equity accounted investees’ net earnings divided by average capital employed before impairments

18 │ Mpact Limited 2013 RMB Morgan Stanley Off-piste Conference
Paper business
• Revenue up 6.9% to R2.6bn• Volumes up 1.3% • Price increases below inflation• Favourable product mix variance
• Underlying operating profit up 8.9% to R251m
• Stringent cost control• Offset by exchange rate driven
raw material cost increases • Integration benefits
150 192 220 231 251
265285
291331
7.8%9.1%
10.2% 9.7% 9.9%
0
100
200
300
400
500
600
2009 2010 2011 2012 2013
R’ m
illio
ns
Underlying operating profit�
HY1 HY2 HY1 margin
Paper 72%
Revenue
1 For comparative purposes, full year 2009, 2010 and 2011 underlying operating profit has been restated to reflect corporate costs of R50 million directly attributable, but previously not charged to the Paper business
4 0364 407 4 573
5 042
415477
511562
1 935 2 114 2 160 2 387 2 551
2 101 2 293 2 4132 655
0
1 000
2 000
3 000
4 000
5 000
2009 2010 2011 2012 2013
R’ m
illio
ns
External revenue
HY1 HY2
Operating profit
Paper88%

19 │ Mpact Limited 2013 RMB Morgan Stanley Off-piste Conference
Plastics business
1 For comparative purposes, full year 2009, 2010 and 2011 underlying operating profit has been restated to reflect corporate costs of R14 million directly attributable, but previously not charged to the Plastics business
• Revenue up 17.7% to R969m • Volumes up 14.1% (beverages, trays
and films, and acquisitions)• Price increases below inflation
• Underlying operating profit down 7.6% to R34m
• Under recovery of polymer prices• Improvements in FMCG and
preforms & closures
577 619 715 823 969
625 691862
955
0
500
1 000
1 500
2 000
2009 2010 2011 2012 2013
R’ m
illio
ns
Revenue
HY1 HY2
1 202 1 3101 577
1 778
20 23 2337 34
4154
77
80
3.5% 3.7% 3.2%4.5%
3.5%
0
20
40
60
80
100
120
2009 2010 2011 2012 2013
R’ m
illio
ns
Underlying operating profit�
HY1 HY2 HY1 margin
61
77
100
117
Plastics28%
RevenuePlastics12%
Operating profit

│ Presentation title │ 00 Month 20112020 │ Mpact Limited 2013 RMB Morgan Stanley Off-Piste Conference
Agenda
• Introduction
• Mpact business overview
• Group financial performance review
• Strategy
• Outlook

21 │ Mpact Limited 2013 RMB Morgan Stanley Off-piste Conference
Strategy
• Leading market positions• New business, market share, key products and geographical areas• Through strategic acquisitions and organic growth
• Customer focused operating structure• Investing to meet changing customer needs and to remain cost
competitive• Continue to develop geographic footprint
• Focus on performance• Delivering acceptable returns to our shareholders • Cost containment and improved efficiencies
│ Presentation title │ 00 Month 20112222 │ Mpact Limited 2013 RMB Morgan Stanley Off-Piste Conference
Agenda
• Introduction
• Mpact business overview
• Group financial performance review
• Strategy
• Outlook

23 │ Mpact Limited 2013 RMB Morgan Stanley Off-piste Conference
Outlook
• GDP and consumer spending growth expected to remain subdued
• Cost increases in labour, electricity and other administered services expected to be above inflation
• Trading conditions to remain highly competitive with associated margin pressures
• Weak rand should improve competitive position relative to imports, offset by related cost increases
• Focus on profitability, cash generation and ROCE
• Group is well positioned in the sectors in which it operates
24 │ Mpact Limited 2013 RMB Morgan Stanley Off-piste Conference
Thank you for your participation
For further information:
www.mpact.co.za
Bruce Strong, CEO(011) 994-5508
or
Marlize KeyterKeyter Rech Investor Solutions
(011) 447-5204
25 │ Mpact Limited 2013 RMB Morgan Stanley Off-piste Conference
DisclaimerThis document including, without limitation, those statements concerning the demand outlook, expansion projects and its capital resources and expenditure,may be considered to be forward looking statements. By their nature, forward-looking statements involve risk and uncertainty and although Mpact believes thatthe expectations reflected in such forward-looking statements are reasonable, no assurance can be given that such expectations will prove to have beencorrect. Accordingly, results could differ materially from those set out in the forward-looking statements as a result of, among other factors, changes in economicand market conditions, success of business and operating initiatives, changes in the regulatory environment and other government action and business andoperational risk management. While Mpact has taken reasonable care to ensure the accuracy of the information presented, Mpact accepts no responsibility forany consequential, indirect, special or incidental damages, whether foreseeable or unforeseeable, based on claims arising out of misrepresentation ornegligence arising in connection with a forward-looking statement. This document is not intended to contain any profit forecasts or profit estimates.