River Avon SAC - Phosphate Neutral Development · achieve phosphorus neutral development in the...
53
River Avon SAC Working Group River Avon SAC - Phosphate Neutral Development Interim Delivery Plan Wood Environment & Infrastructure Solutions UK Limited – January 2019
Transcript of River Avon SAC - Phosphate Neutral Development · achieve phosphorus neutral development in the...

River Avon SAC Working Group
River Avon SAC - Phosphate Neutral Development
Interim Delivery Plan
Wood Environment & Infrastructure Solutions UK Limited – January 2019


3 © Wood Environment & Infrastructure Solutions UK Limited
January 2019
Doc Ref. 41031rr007i3
Executive summary
Purpose of this report
This report has been produced for the purpose of describing the interim plan developed by the River Avon
SAC Working Group to achieve phosphorus neutral development over the period to 2025, and outlining in
more detail how the plan can be delivered in the period to March 2020. It includes a calculation of the
estimated additional phosphorus load that will be discharged in the catchment through increased volumes of
sewage effluent, and sets out a suite of measures that could be deployed to mitigate that load.
Spatial data for the catchment to the River Avon SAC are included that illustrate where in the catchment
measures are likely to be most effective at reducing diffuse phosphorus pollution. Recommendations are
made as to which measures should be taken forward and how the plan can be delivered on the ground. It is
shown that it is feasible to achieve the necessary reductions in diffuse phosphorus pollution to mitigate
planned growth, both with and without the implementation of Wessex Water’s Outcome Delivery Incentive.

4 © Wood Environment & Infrastructure Solutions UK Limited
January 2019
Doc Ref. 41031rr007i3
Contents
1. Introduction 6
1.1 Background 6
1.2 Structure of this report 7
2. Forecast Growth in the River Avon SAC 9
2.1 Increases in Phosphorus loads due to development 9 Residential growth 9 Non-residential growth 10 Unsewered development 10
2.2 Agricultural land taken out of production 12
2.3 What is the total phosphorus load to be mitigated? 12
2.4 Sensitivity Analysis 13
3. Options for mitigating increases in Phosphorus Loads 15
3.1 Introduction 15
3.2 Baseline agricultural pollutant losses 15 Landscape Connectivity 19 Estimation of costs 19
3.3 Description and appraisal of potential measures 20 Measures applicable on-site 21 Reducing Flows to the Foul Sewage Network through Water Efficiency Measures 21 On-site sewage treatment and disposal systems 22 Increasing the proportion of green infrastructure within new developments 24 Measures applicable in-catchment 25 On-Farm Wetland Creation and Restoration 25 In-Catchment Wetland Creation and Restoration 27 Taking Land Out of Agricultural (arable or grass) Production through Offsetting 28 Change land-use from Intensive to Less Intensive 30 River restoration measures 31 Storing and transporting excess P from dairy farms to arable farms as a means of nutrient balancing across farm type 32 Make available compost to improve soil condition 34 Regulatory controls on agricultural phosphorus 35 Measures within the remit of Water Companies 36 Diverting surface water flows and groundwater ingress away from the Foul Sewage Network 36 Addressing sewer misconnections 37 Reduce leakage from foul sewerage system 38 Reduce leakage from potable water supply 39 Increased treatment of the effluent by the water company 40
3.4 Summary of measures 41
4. Feasibility of measures 43
4.1 Introduction 43
4.2 Requirements for implementation of measures 43
4.3 Catchment and sub-catchment spatial data 44

5 © Wood Environment & Infrastructure Solutions UK Limited
January 2019
Doc Ref. 41031rr007i3
4.4 Applicability of measures 45
5. Recommendations 47
5.1 Applying measures 47
5.2 Estimating the effectiveness of agricultural measures on the ground 47
5.3 Monitoring 48
5.4 Delivery mechanisms and other catchment initiatives 48 Catchment Sensitive Farming 48 Natural England work 49 Wessex Chalk Stream and Rivers Trust 49 Landscape Enterprise Networks (LENs) 49 Offset trading 49 Developer unilateral undertakings 50 Infrastructure charge discount 50
5.5 Interim Delivery Plan 50 Achieving phosphorus neutrality – to March 2020 50 Achieving phosphorus neutrality – to 2025 51 Delivering the plan 52
5.6 Summary 53
Table 1.1 Membership of the River Avon SAC Working Group 6 Table 2.1 Projected additional phosphorus loading from sewage produced by new residential development (based on
Local Planning Authority Housing Land Supply Data, 2018). 9 Table 2.2 Projected additional phosphorus loading from non-residential development 10 Table 2.3 Projected additional phosphorus loading from unsewered residential development 11 Table 2.4 Projected additional phosphorus loading (kg P) requiring mitigation. 13 Table 2.5 Results of sensitivity calculations on predicted increases in P loads 14 Table 3.1 Farmscoper baseline P export by farm type, free draining soil, 700-900mm annual average rainfall 17 Table 3.2 Farmscoper baseline P export by farm type, impermeable soil drained for arable, 700-900mm annual
average rainfall 18 Table 3.3 Summary of estimated costs and effectiveness of measures 41 Table 4.1 Restrictions or requirements for the implementation of measures 43 Table 4.2 Figure list 44 Table A.1 Data sources 1
Figure 2.1 Estimated growth in phosphorus loads from development 11 Figure 3.1 Estimated baseline phosphorus export from generic farm types (Farmscoper 4) 19
Appendix A Maps and data sources Appendix B Data Tables

6 © Wood Environment & Infrastructure Solutions UK Limited
January 2019
Doc Ref. 41031rr007i3
1. Introduction
This report describes the interim approach to identifying and implementing measures to
achieve phosphorus neutral development in the River Avon SAC.
1.1 Background
1.1.1 The Hampshire Avon is a groundwater fed Chalk river in the south of England. It rises in the Vale of
Pewsey, Wiltshire, and flows south to the English Channel at Christchurch, Dorset, draining a total
area of about 1,700 km2. The whole river is a designated Special Area of Conservation (SAC),
supporting a variety of important ecology.
1.1.2 Elevated levels of phosphorus can have a detrimental effect on the ecology and biodiversity of
rivers, including eutrophication, and for this reason conservation objectives have been set for the
SAC which include annual average and growing season average levels of phosphate in the river.
There are two principal sources of phosphorus in rivers: effluent discharges from sewage treatment
works, and diffuse phosphorus pollution, mainly in runoff from agricultural land. Wessex Water
made significant investments in infrastructure during the period 2005-2015 in order to reduce
phosphorus loads in sewage effluent. Nonetheless, objectives for growth in the catchment will
result in new connections to sewage treatment works which, if not mitigated, will result in increased
phosphorus loadings to the river in sewage effluent.
1.1.3 In 2015 the Environment Agency, Natural England and Wiltshire Council published a nutrient
management plan (NMP) for the River Avon SAC which set out ambition targets to reduce the
phosphate loading to the river from diffuse sources, in order to support compliance with
conservation objectives, the requirements of the Habitats Directive and the Water Framework
Directive, while still allowing some increase in point source (sewage) loadings from population
growth. The NMP set out a suite of measures to reduce agricultural diffuse phosphorus pollution,
to be delivered primarily through the Catchment Sensitive Farming (CSF) initiative. A Working
Group (WG) was established to deliver the NMP, comprising members from Natural England, the
Environment Agency, Local Planning Authorities and Water Utilities. The membership of the WG is
as shown in Table 1.1.
Table 1.1 Membership of the River Avon SAC Working Group
Organisation Role
Environment Agency Regulatory body, responsible for the protection and enhancement of the natural
environment. “Competent authority” under the Habitats Regulations
Natural England Government adviser, with key role in implementation of Habitats Directive.
“Statutory Nature Conservation Body”
Wiltshire Council Local Planning Authority (LPA). “Competent authority” under the Habitats
Regulations.
New Forest District Council Local Planning Authority (LPA). “Competent authority” under the Habitats
Regulations.
New Forest National Park Authority Local Planning Authority (LPA). “Competent authority” under the Habitats
Regulations.

7 © Wood Environment & Infrastructure Solutions UK Limited
January 2019
Doc Ref. 41031rr007i3
Organisation Role
Christchurch and East Dorset Council Local Planning Authority (LPA). “Competent authority” under the Habitats
Regulations.
Wessex Water Water supply and sewerage undertaker. “Competent authority” under the Habitats
Regulations.
1.1.4 Since 2015 it has become apparent that CSF is not achieving the reductions in phosphorus loading
to the river required to meet the ambition targets. In 2018 the organisations of the WG (except East
Dorset DC) signed a Memorandum of Understanding (MoU) that set out a more stringent approach
to planning, requiring that new development in the catchment needs to be “phosphate-neutral, as
requested in a joint statement from the Environment Agency and Natural England.” The term
“phosphate-neutral” is defined in the MoU (“Principles and Definitions”, page 1), as follows:
“The additional phosphorus load generated by new development after controls at source,
reduction by treatment and/or offsetting measures leads to no net increase in the total
phosphorus load discharged to the River Avon SAC.”
1.1.5 This “interim approach” will apply to all development in the catchment to the River Avon SAC, or
that would connect to a sewage treatment works that discharges in the catchment, over the period
2018-2025. After this time, it is expected that this interim approach will be replaced by an approach
that will take account of water company planning as well as government policy and legislation.
1.1.6 As part of their PR19 business plan, Wessex Water have made a performance commitment to
support improvements to rivers (outside of their existing Water Industry National Environment
Programme (WINEP) commitments).1 This Outcome Delivery Incentive (ODI) commits to
maintaining levels of phosphate discharge to the R Avon SAC to the average level of the last five
years. This would operate over the years 2020-2025. The Business Plan has yet to be approved (due
by Dec 2019), and, although the ODI is not a regulatory requirement Wessex Water clearly
recognise the issue and intend to take action.
1.1.7 With an ODI in effect all new connections to Wessex Water sewage treatment works would be
phosphate-neutral. However, the interim approach is required as a contingency to the ODI not
being implemented in full, and also to cover new development in the period 2018-2025 that would
not connect to Wessex Water’s sewer network, and, as part of a precautionary approach, to cover
all new development prior to 2020.
1.1.8 The MoU commits signatories to working cooperatively to set out and cost appropriate phosphate
mitigation measures. The signatories have agreed to work together to develop the means for their
delivery. An Annex to the NMP has been published has assessed a range of possible measures.
This report develops these options further into an Interim Delivery Plan.
1.2 Structure of this report
1.2.1 This document sets out the interim approach agreed by the working group as follows. Section 2
sets out projections for the period to March 2025 of growth from residential and non-residential
development, including an estimate of likely unsewered development, and estimates of the
associated increase in phosphorus loads to the River Avon SAC. A sensitivity analysis is included to
illustrate the possible variations from these calculations.
1 https://www.wessexwater.co.uk/BP2020/Section%203/03.01.A%20-%20Performance%20commitment%20detail.pdf

8 © Wood Environment & Infrastructure Solutions UK Limited
January 2019
Doc Ref. 41031rr007i3
1.2.2 Section 3 describes a suite of potential measures, as set out in Annex 2 to the River Avon SAC
Nutrient Management Plan that could mitigate increases in phosphorus loads from this planned
growth. Measures could apply on-site, in the wider catchment or through water company
initiatives. Each measure is assessed in terms of challenges to implementation and wider benefits,
and a high-level estimate of the reduction in P loads that it could achieve.
1.2.3 Section 4 describes the geographical setting of the River Avon SAC, and based on this, the
applicability of various measures in different parts of the catchment.
1.2.4 Section 5 provides an Interim Delivery Plan (IDP) that shows how measures will achieve phosphate
neutral development in the lead up to the implementation of the ODI, act as a contingency to
Wessex Water measures and will achieve phosphate neutrality for new development that does not
connect to the Wessex Water network.
9 © Wood Environment & Infrastructure Solutions UK Limited
January 2019
Doc Ref. 41031rr007i3
2. Forecast Growth in the River Avon SAC
2.1 Increases in Phosphorus loads due to development
Residential growth
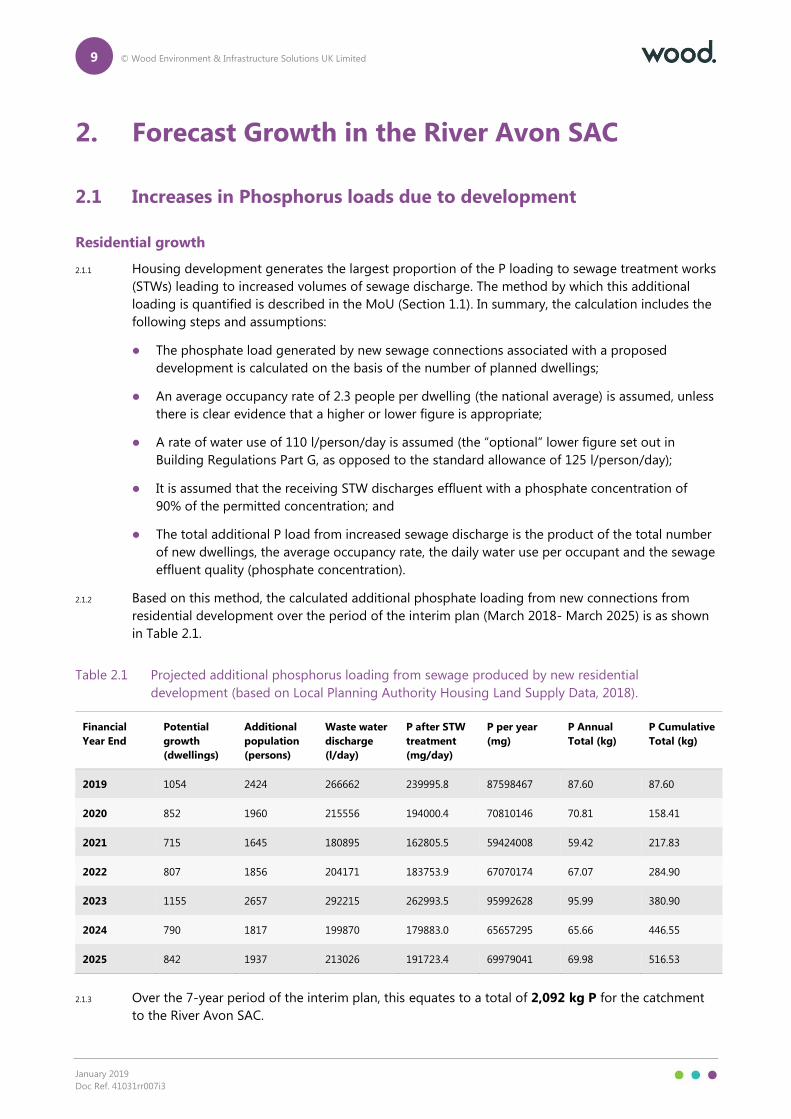
2.1.1 Housing development generates the largest proportion of the P loading to sewage treatment works
(STWs) leading to increased volumes of sewage discharge. The method by which this additional
loading is quantified is described in the MoU (Section 1.1). In summary, the calculation includes the
following steps and assumptions:
⚫ The phosphate load generated by new sewage connections associated with a proposed
development is calculated on the basis of the number of planned dwellings;
⚫ An average occupancy rate of 2.3 people per dwelling (the national average) is assumed, unless
there is clear evidence that a higher or lower figure is appropriate;
⚫ A rate of water use of 110 l/person/day is assumed (the “optional” lower figure set out in
Building Regulations Part G, as opposed to the standard allowance of 125 l/person/day);
⚫ It is assumed that the receiving STW discharges effluent with a phosphate concentration of
90% of the permitted concentration; and
⚫ The total additional P load from increased sewage discharge is the product of the total number
of new dwellings, the average occupancy rate, the daily water use per occupant and the sewage
effluent quality (phosphate concentration).
2.1.2 Based on this method, the calculated additional phosphate loading from new connections from
residential development over the period of the interim plan (March 2018- March 2025) is as shown
in Table 2.1.
Table 2.1 Projected additional phosphorus loading from sewage produced by new residential
development (based on Local Planning Authority Housing Land Supply Data, 2018).
Financial
Year End
Potential
growth
(dwellings)
Additional
population
(persons)
Waste water
discharge
(l/day)
P after STW
treatment
(mg/day)
P per year
(mg)
P Annual
Total (kg)
P Cumulative
Total (kg)
2019 1054 2424 266662 239995.8 87598467 87.60 87.60
2020 852 1960 215556 194000.4 70810146 70.81 158.41
2021 715 1645 180895 162805.5 59424008 59.42 217.83
2022 807 1856 204171 183753.9 67070174 67.07 284.90
2023 1155 2657 292215 262993.5 95992628 95.99 380.90
2024 790 1817 199870 179883.0 65657295 65.66 446.55
2025 842 1937 213026 191723.4 69979041 69.98 516.53
2.1.3 Over the 7-year period of the interim plan, this equates to a total of 2,092 kg P for the catchment
to the River Avon SAC.

10 © Wood Environment & Infrastructure Solutions UK Limited
January 2019
Doc Ref. 41031rr007i3
2.1.4 It should be noted that if Wessex Water’s ODI is adopted then all residential development after
2020 that connects to a Wessex Water sewage treatment works will be phosphate-neutral. In
practice, most if not all residential development in the period 2018-2020 will also be phosphate-
neutral, since developments granted planning permission during that period are unlikely to be
occupied before 2020.
Non-residential growth
2.1.5 Based on Wessex Water’s growth forecasts, and using the same methodology to estimate
phosphorus loads as described above for residential growth, the additional phosphorus load arising
from non-residential development has been estimated as shown in Table 2.2. It is noted that
Wessex Water estimate lower phosphorus loads from non-residential growth, using a different
method based on recent performance data from their assets. The estimates in Table 2.2 therefore
represent a worst case precautionary approach.
Table 2.2 Projected additional phosphorus loading from non-residential development
Financial Year
End
Additional
population
(persons)
Waste water
discharge
(l/day)
P after STW
treatment
(mg/day)
P per year
(mg)
P Annual Total
(kg)
P Cumulative
Total (kg)
2019 270.4 29744 26770 9770904 9.77 9.77
2020 338 37180 33462 12213630 12.21 21.98
2021 396 43560 39204 14309460 14.31 36.29
2022 454 49940 44946 16405290 16.41 52.70
2023 512 56320 50688 18501120 18.50 71.20
2024 570 62700 56430 20596950 20.60 91.80
2025 628 69080 62172 22692780 22.69 114.49
2.1.6 Over the 7-year period of the interim plan, this equates to a total of 398 kg P.
Unsewered development
2.1.7 Analysis by Wiltshire Council has previously shown that approximately 5% of recent building
completions from residential development in the Avon catchment have been within unsewered
areas. These developments are typically served by a septic tank and soakaway, which will infiltrate
to groundwater and ultimately reach rivers in baseflow.
2.1.8 The phosphorus loading from such schemes is difficult to forecast, but accounting for the fact that
the estimate is for the performance of new equipment it is estimated using similar assumptions to
those described above.
⚫ Assuming that 5% of new development is unsewered, this equates to 32 dwellings per annum,
or 224 dwellings over the interim period 2018-2025.
⚫ At an occupancy rate of 2.3 people per dwelling, this is equal to 515 residents.
⚫ Each person exports 0.44 kg P/year in sewage, generating a total P load of 227 kg P/year.
⚫ Assuming 88% attenuation (see Annex 4 of the NMP), the loading to the River Avon SAC is
calculated at 27 kg P/yr.

11 © Wood Environment & Infrastructure Solutions UK Limited
January 2019
Doc Ref. 41031rr007i3
2.1.9 A more detailed breakdown is shown in Table 2.3. The locations of septic tanks, and in particular
their proximity to watercourses and designated features such as SSSIs, can affect the degree of
subsurface attenuation of phosphorus that occurs before the effluent reaches a sensitive site. Work
commissioned by Natural England has produced risk maps for wetland sites, and it is noted that in
some high-risk areas there may be less attenuation of phosphorus than has been assumed in the
calculation presented here.
Table 2.3 Projected additional phosphorus loading from unsewered residential development
Financial Year End Total new
dwellings
Additional
population
(persons)
P export (kg/year) P after
attenuation
(kg/year)
P Cumulative
Total (kg)
2019 32 74 32.38 3.9 3.89
2020 32 74 32.38 3.9 7.77
2021 32 74 32.38 3.9 11.66
2022 32 74 32.38 3.9 15.54
2023 32 74 32.38 3.9 19.43
2024 32 74 32.38 3.9 23.32
2025 32 74 32.38 3.9 27.20
2.1.10 Over the 7-year period of the interim plan, this equates to a total of 109 kg P. These figures are
illustrated in Figure 2.1.
Figure 2.1 Estimated growth in phosphorus loads from development

12 © Wood Environment & Infrastructure Solutions UK Limited
January 2019
Doc Ref. 41031rr007i3
2.2 Agricultural land taken out of production
2.2.1 Although housing development generates additional P loading through increased sewage flows
from point sources, the cessation of intensive agriculture on greenfield sites can also reduce P
loading from diffuse sources, helping to mitigate the net effect of development, and this can
contribute to offsetting. The NMP assumes an average rate of phosphate export from the soil zone
of agricultural land of 0.4 kg P/ha/year. Further detail on modelled P export from agricultural land is
provided in Section 3.2.
2.2.2 However, phosphate can also be exported from these newly developed urban areas. Entec (2010)2
reviewed urban sources of phosphorus loss, and found that the most significant urban diffuse P
sources are mains water leakage (in areas where mains water is dosed for plumbosolvency) and
sewer leakage, which between them typically accounted for around 90% of the total loading. Both
these sources should be very low for new developments on greenfield, as lead pipes are no longer
used, and sewer integrity should be very high.
2.2.3 Work carried out by HR Wallingford for Natural England, the Environment Agency and Wessex
Water in 2018 assessed urban diffuse pollution from Nailsea, and the use of SuDS to mitigate
pollutant loads to a nearby SSSI. The report states that
2.2.4 “Any new development will increase pollution loads to the receiving waterbody unless appropriate
water quality management is designed into the system within a SuDS approach. … For the
purpose of this analysis it was assumed that SuDS treatment would be implemented effectively …
therefore pollutant washoff from the new developments was assumed as not taking place.”
2.2.5 It is therefore not unreasonable to assume that, for greenfield sites previously in agricultural
production, the increased P loading from new sewer connections will be offset by around 0.4 kg
P/ha through a reduction in diffuse agricultural losses. Development is required to provide SUDs in
accordance with technical best practice
2.2.6 The LPAs have indicated that the total area of land allocated for development in the Avon
catchment in the period to 2025 is 84 ha (NFDC) and 202 ha (Wiltshire Council): a total of 286 ha3.
Assuming that this land is all greenfield, and that it is taken out of agricultural production at a
constant rate over the period of the IDP, this equates to a land take of 41 ha per year. This is
equivalent to an offset of 16.3 kg P/year.
2.3 What is the total phosphorus load to be mitigated?
2.3.1 On the basis of the calculations detailed in Section 2.1, the total P load from new development that
could potentially need to be mitigated is the sum of the loads from residential growth (sewered
and unsewered) and non-residential growth, which equates to 2,599 kg P over the 7-year period of
the interim plan, or an average of 371 kg P/year.
2.3.2 However, once the ODI comes into operation in 2020, this would ensure that all sewered
development connecting to Wessex Water networks (residential and non-residential) is phosphate-
neutral. In this situation, mitigation would be required for all unsewered development, any
development outside of the Wessex Water sewer network and potentially any development granted
planning permission before 2020 (although as noted in Section 1, developments determined after
2018 are unlikely to be occupied before 2020). Potentially therefore, the total P load requiring
mitigation is much smaller than the projected increase due to development.
2 Cumulative Nitrogen and Phosphorus Loadings to Groundwater, Final Report, November 2010. Ref 27510rr032i3, 178pp. 3 Source: Local Planning Authorities, 2018. Includes undeveloped land with planning permission or allocated in Local
Plans.

13 © Wood Environment & Infrastructure Solutions UK Limited
January 2019
Doc Ref. 41031rr007i3
2.3.3 The total projected increase in P load from all sectors (residential, sewered and unsewered, and
non-residential) in each year, including an allowance for a reduction in P export from land taken out
of production due to development, is as shown in Table 2.4. This demonstrates that, once the ODI
comes into operation, the reduction in P export from land take for new development will more than
mitigate the growth in P loads from unsewered development, and no further mitigation will be
required.
2.3.4 For the financial year ending 2019 the total reduction in phosphorus required is 85 kg. For financial
year ending 2020 a further
Table 2.4 Projected additional phosphorus loading (kg P) requiring mitigation.
Financial
year end Sewered Unsewered Non-residential
Offset from
land take
Total - without
ODI Total - with ODI
2019 87.6 3.9 9.8 -16.3 84.9 84.9
2020 158.4 7.8 22.0 -32.7 155.5 155.5
2021 217.8 11.7 36.3 -49.0 216.8 0.0
2022 284.9 15.5 52.7 -65.4 287.8 0.0
2023 380.9 19.4 71.2 -81.7 389.8 0.0
2024 446.6 23.3 91.8 -98.0 463.6 0.0
2025 516.5 27.2 114.5 -114.4 543.8 0.0
2.4 Sensitivity Analysis
2.4.1 The estimates of increases in P load arising from new development rely on a number of
assumptions (as described in Section 2.1). In order to understand how the estimated P loads may
vary in response to changing assumptions underpinning them, the calculation of increased P loads
from residential development, which is by far the largest of the three sectors, have been repeated
with differing assumptions around water use, total housing growth and sewage effluent quality.
2.4.2 Three additional calculations were carried out:
⚫ Housing growth at a rate of 10% above the baseline projection;
⚫ Increased per capita water use of 150 l/person/day (the standard figure from Flows and Loads4,
reflecting national average consumption); and
⚫ Improved effluent quality of 0.5 mg-P/l (noting that many Wessex Water works currently treat
to a standard close to this quality).
2.4.3 The results are as shown in Table 2.5.
4 https://www.britishwater.co.uk/code-of-practise-flows-and-loads-4-on-sizing-criteria-treatm.aspx

14 © Wood Environment & Infrastructure Solutions UK Limited
January 2019
Doc Ref. 41031rr007i3
Table 2.5 Results of sensitivity calculations on predicted increases in P loads
Assumption Housing growth
(dwellings)
Water use
(l/person/day)
Effluent quality (mg-
P/l)
Predicted increase in
P load 2018-2025 (kg)
Baseline 6,215 110 0.9 2,092
Increased housing
growth 6,837 110 0.9 2,302
Increased water use 6,215 150 0.9 2,854
Improved effluent
quality 6,215 110 0.5 1,163
2.4.4 It is evident that there are considerable differences in the predicted increases in P loads using
different assumptions with a range of 1,691 kg P between the best and worst case. Since the
calculation of increase in P load is linear, being simply the product of the input variables, an
increase of X% in one of the input variables will result in an increase of X% in the predicted P loads.
2.4.5 The ODI, when approved, will result in no net increase in P loads discharged from Wessex Water
assets compared with the average load over the 5 years 2013-2017. Data from Wessex Water
indicate that many of their works currently out-perform their permits and treat to a higher effluent
quality than the baseline assumption of 0.9 mg-P/l, typically 0.5 mg-P/l to 0.7 mg-P/l. On the
advice of Natural England, a precautionary approach uses a worst-case scenario. The baseline
assumption of effluent quality of 0.9 mg-P/l is therefore conservative, by a significant margin. The
estimated increase in P load assuming an occupancy rate of 2.3, per capita water use of 150
l/person/day and effluent treatment to 0.5 mg P/l is 1,585 kg P.
2.4.6 The baseline figure for the increase in P loading from residential development (0.9 mp-P/l) is an
overestimate, therefore, even if the ODI is not adopted, particularly if Wessex Water continue to
operate their treatment works to the same quality as in recent years as this would still represent a
higher quality than 0.9 mg-P/l.

15 © Wood Environment & Infrastructure Solutions UK Limited
January 2019
Doc Ref. 41031rr007i3
3. Options for mitigating increases in
Phosphorus Loads
3.1 Introduction
3.1.1 This section sets out an appraisal of measures that could be implemented to mitigate increases in
phosphorus loads to the River Avon SAC due to development. This builds on the measures
appraisal included in Annex 2 of the River Avon NMP, and provides an indication of the
approximate costs and effectiveness of measures.
3.1.2 Estimates of costs and potential effectiveness are necessarily based on a number of assumptions,
since the actual costs and effectiveness of measures will depend on the local setting, particularly for
those measures targeting agricultural diffuse pollution. Measures are divided into those that would
be applied at the development site (on-site), those that would be applied within the wider
catchment (which are principally targeted at agricultural diffuse pollution) and those that fall within
the remit of the water company.
3.1.3 In practice, the derivation of suitable mitigation measures will need to be determined on a case-by-
case basis as individual applications come forward for consideration. This is because the
effectiveness of measures, particularly those to mitigate agricultural diffuse pollution, require
detailed information on the “baseline” for each farm on which intervention is planned, and hence
the level of reduction that can be achieved. The next section sets out estimates of baseline (i.e. pre-
mitigation) agricultural pollutant losses from a variety of generic farm types, to assist in
understanding the scale of reduction that can be achieved through measures, and which farm types
are likely to present the greatest risk of diffuse agricultural pollution. The remainder of this section
then provides further details of a range of potential measures to reduce P loads to the catchment.
3.1.4 It should be noted that all the estimates of cost and effectiveness have some uncertainty, hence
many are expressed as a range. Further work will be required during the delivery of the IDP to
refine these estimates as a part of monitoring the performance of implemented schemes and so
ensure phosphate neutrality is being achieved over the interim period.
3.2 Baseline agricultural pollutant losses
3.2.1 The reductions in phosphorus export from agricultural land that can be achieved through
implementation of measures will depend on the estimated current “baseline” losses. This section
sets out estimated present-day P losses from a variety of different farm types, prior to any
mitigation being put in place. Farms with the greatest baseline P losses offer the greatest potential
for mitigation.
3.2.2 Baseline estimates of P export from agricultural land are based on outputs from the ADAS
Farmscoper 45 model. These figures reflect estimated losses from “model” generic farm types,
which assume typical land areas and livestock numbers. In reality, farms in the River Avon
catchment will not match these assumptions precisely, and as the interim plan is delivered it will be
necessary to carry out more detailed assessments of actual nutrient losses from individual farms
based on more precise data. These figures should thus be considered as illustrative only, and are
included here as they form the basis for estimates of the reductions in P loads that could be
achieved through catchment mitigation measures. Tables 3.1 and 3.2, and Figure 3.1, show baseline
5 http://www.adas.uk/Service/farmscoper

16 © Wood Environment & Infrastructure Solutions UK Limited
January 2019
Doc Ref. 41031rr007i3
losses from each Farmscoper farm type for situations typical of the Hants Avon: 700-900 mm
annual rainfall, and for free draining soil (over the Chalk, for example) and for other soils, which are
assumed to be drained for arable use (more typical of the Tertiary deposits in the lower catchment),
respectively. It is evident that predicted P losses are significantly greater from farms with less free-
draining soils. If the assumption is made that agricultural grassland is also drained, then predicted P
losses increase further still (although it is unlikely that this would apply to much land in the Avon
catchment). This suggests that there will be greatest benefit in targeting farms on heavier soils that
are more likely to have assisted drainage in place (likely to be found more in the lower catchment,
south of Fordingbridge, and in parts of the Nadder). This will not, however, protect the upper part
of the catchment.

17 © Wood Environment & Infrastructure Solutions UK Limited
January 2019
Doc Ref. 41031rr007i3
Table 3.1 Farmscoper baseline P export by farm type, free draining soil, 700-900mm annual average rainfall
Farm type Land area (ha) Baseline P export (kg) Baseline P export (kg/ha)
Dairy 114 25.91 0.23
Lowland grazing 101 13.2 0.13
Mixed livestock 156 27.10 0.17
Outdoor pig 57 14.46 0.25
Specialist Poultry No land for livestock 0.05
Roots & combinable 180 26.35 0.15
Roots & combinable +
poultry manure
180 45.38 0.25
Mixed combinable 197 28.39 0.14
Mixed combinable + pig
manure
197 43.56 0.22
Winter combinable 159 22.33 0.14
Winter combinable + pig
manure
159 37.16 0.23
Horticulture 18 1.81 0.10
Poultry + roots and
combinable
350 79.15 0.23
Indoor pigs + mixed
combinable
197 39.07 0.20
Indoor pigs + winter
combinable
159 32.79 0.21

18 © Wood Environment & Infrastructure Solutions UK Limited
January 2019
Doc Ref. 41031rr007i3
Table 3.2 Farmscoper baseline P export by farm type, impermeable soil drained for arable, 700-900mm
annual average rainfall
Farm type Land area (ha) Baseline P export (kg) Baseline P export (kg/ha)
Dairy 114 42.07 0.37
Lowland grazing 101 21.07 0.21
Mixed livestock 156 67.20 0.43
Outdoor pig 57 128.50 2.25
Specialist Poultry No land for livestock 0.09
Roots & combinable 180 137.08 0.76
Roots & combinable +
poultry manure
180 170.30 0.95
Mixed combinable 197 141.96 0.72
Mixed combinable + pig
manure
197 174.73 0.89
Winter combinable 159 106.89 0.67
Winter combinable + pig
manure
159 136.15 0.86
Horticulture 18 9.40 0.52
Poultry + roots and
combinable
350 313.98 0.90
Indoor pigs + mixed
combinable
197 168.71 0.86
Indoor pigs + winter
combinable
159 131.31 0.83

19 © Wood Environment & Infrastructure Solutions UK Limited
January 2019
Doc Ref. 41031rr007i3
Figure 3.1 Estimated baseline phosphorus export from generic farm types (Farmscoper 4)
Landscape Connectivity
3.2.3 A further consideration in estimating baseline phosphorus losses is the connectivity between the
farm and watercourses. Fields adjacent to watercourses or on steep slopes will present a higher risk
of phosphorus export than fields that are very distant from rivers or on shallow slopes. Roads and
tracks can also provide pathways connecting fields to the river. This can be allowed for in the
Farmscoper model.
Estimation of costs
3.2.4 Sources are provided in Section 3.3 of the information used to estimate costs of implementation of
agricultural measures. In many cases, information is taken from the Defra 2012 report: An Inventory
of Mitigation Methods and Guide to their Effects on Diffuse Water Pollution, Greenhouse Gas
Emissions and Ammonia Emissions from Agriculture. User Guide6. This is referred to as “DPI User
Manual” for brevity.
3.2.5 Note that a 12% uplift has been applied to these cost estimates to allow for increases in costs from
2011 to 2018.
3.2.6 For measures which carry a one-off capital cost, an Equivalent Annualised Cost (EAC) is also
provided, based on a discount rate of 3.5% (Green Book).
6 http://randd.defra.gov.uk/Document.aspx?Document=MitigationMethods-UserGuideDecember2011FINAL.pdf

20 © Wood Environment & Infrastructure Solutions UK Limited
January 2019
Doc Ref. 41031rr007i3
3.3 Description and appraisal of potential measures
3.3.1 This section presents a variety of measures that could be employed to reduce P loads to the River
Avon SAC. For each measure, a description of the mechanism by which it would reduce P loads is
provided, followed by an estimate of the reduction in P loads that the measure could achieve,
details of the basis of the estimate and assumptions on which it is based, the timescale of operation
and a broad estimate of the cost of implementation.
3.3.2 Measures are divided into those that would be applied on-site (i.e. at the point of development),
those that would be applied in the catchment and those that fall within the remit of the water
company or sewerage undertaker.

21 © Wood Environment & Infrastructure Solutions UK Limited
January 2019
Doc Ref. 41031rr007i3
Measures applicable on-site
Reducing Flows to the Foul Sewage Network through Water Efficiency Measures
Details
3.3.3 Reducing total foul flow to STWs through implementation of water efficiency measures at new
dwellings.
Benefits
3.3.4 Improvement in sustainability as well as water quality.
Challenges
3.3.5 The effectiveness of this measures is difficult to measure and would be affected by individual
household decisions as dwellings are adapted and equipped according to different choices. Local
Planning Authority signatories to the MoU are already requiring new homes to be built to the
higher efficiency Building Regulation standards. This requirement is a condition of planning
permission for all new dwellings.
3.3.6 In addition, further improvements in water efficiency are often associated not with a reduction in
overall consumption but with measures such as rainwater harvesting and water re-use, thus while
the quantity of mains water consumed is reduced, overall flow to the sewer network does not
reduce in proportion.
Basis of estimated P reduction
3.3.7 The MoU method assumes an occupancy rate of 2.3 people per dwelling and a rate of water use of
110l/person/day, treated to 0.9 mg-P/l. A 10% reduction in water use (to 99l/person/day) would
reduce P loads by 23 mg-P/day per dwelling, or 0.008 kg-P/year.
3.3.8 Waterwise (2018)7 estimate that the cost of achieving water use of 110l/person/day is £9 per
dwelling, but that “the costs of building homes at 80 lpd would be higher, but more research is
required on the current costs and benefits of rainwater harvesting and water reuse.” For the
purposes of this report, a cost of £18 per dwelling to achieve 99l/person/day has been assumed.
3.3.9 EAC is calculated on the basis of no operational costs over a lifetime of 10 years. It is recognised
that the basis of this figure is very uncertain.
Approximate reduction in P load Timescale Cost
0.008 kg-P/year per dwelling Intermediate (post 2021) £18 per dwelling (one off cost)
EAC £2/year.
7 https://drive.google.com/file/d/1UMdkjjOZNm1QmR-a8POoL_VBIaYEC3CK/view

22 © Wood Environment & Infrastructure Solutions UK Limited
January 2019
Doc Ref. 41031rr007i3
On-site sewage treatment and disposal systems
Details
3.3.10 Large scale proposals may support on-site investment in systems that are more efficient at
managing phosphates than existing STWs.
Benefits
3.3.11 Reduction in P export to rivers, and where used in combination with constructed wetlands could
provide wider synergistic benefits for wildlife.
Challenges
3.3.12 Only likely to be viable in larger developments of >10 dwellings and levels of treatment that can be
achieved with on-site treatment vary. Likely to be most effective when combined with
appropriately designed wetlands, which will require identification of suitable sites (see later section
on wetlands). They will not be suitable for sites where groundwater levels are high, or for sites
within source protection zones.
3.3.13 Wessex Water will not adopt sewer networks which connect to private treatment works. This will
significantly increase the yearly maintenance charge and lead to complexities with ownership and
responsibilities.
3.3.14 Issues with policing potential new connections to on site private works – meaning future adjacent
developments could be forced into private treatment themselves or a lengthier offsite connection
to the public sewer network.
3.3.15 On site space will be required for the private sewage treatment works.
Basis of estimated P reduction
3.3.16 Literature review (Entec 2010) suggests that Package Treatment Plants (PTPs) can typically achieve
around 10mg P/l in final effluent, which is similar to the effluent strength from a STW with
secondary treatment (i.e. no P stripping). Concentrations in discharges from septic tanks tend to be
a little higher. Considerable attenuation would be expected if the discharge is to ground (as most
septic tanks will be), but PTPs may discharge directly to watercourses (subject to permitting). Since
this effluent quality is lower (higher P concentration) than is typically achieved by Wessex Water
STWs, use of on-site STWs is unlikely to be viable unless an additional stage of treatment to reduce
P levels in the effluent is provided.
3.3.17 On-site sewage treatment combined with suitably designed and constructed wetlands could
potentially produce final effluent of a much higher quality8. An Environment Agency permit to
discharge is likely to be required. Wildlife and Wetlands Trust (WWT) guidance indicates that more
complex systems are capable of treating and retaining nearly all influent phosphorus, achieving
final effluent quality of around 1 mg-P/l from an influent concentration of around 20 mg-P/l (i.e. a
95% reduction). Whilst this will not achieve phosphate neutrality, it could greatly reduce the
amount of mitigation required.
3.3.18 A PTP with capacity to treat waste from a population equivalent of up to 50 (approximately 22
dwellings) typically costs around £10,0009, or £500 per dwelling. There will also be ongoing
8 http://www.wwt.org.uk/uploads/documents/1429707026_WWTConstructedFarmWetlands150422.pdf 9 https://www.ukseptictanks.co.uk/sewage-treatment-plants/extra-large-treatment-plants

23 © Wood Environment & Infrastructure Solutions UK Limited
January 2019
Doc Ref. 41031rr007i3
operational costs, although these are estimated to be low. Given the difficulty of retro-fitting
improved technology to such systems, it will be important that only the highest-performing
systems (with respect to phosphorus discharge) are installed.
3.3.19 At a water usage rate of 110 l/day the PTP would discharge 5,500 l/day. At an effluent
concentration of 10 mg-P/l this equates to a P loading of about 20 kg-P/year. A 95% reduction in
this loading is 19 kg P/year, or a P reduction of about 0.9 kg-P/dwelling/year.
3.3.20 WWT estimated costs for a simple system treating the effluent from a single septic tank to be
typically £5,000 - £10,000. Costs to treat a high volume of high strength effluent could be as high
as £100,000. For illustration, a figure of £20,000 has been taken forward, or £870 per dwelling.
3.3.21 EAC is calculated on the basis of £1,370 (£500 for the PTP + £870 for the wetland) per dwelling
capital cost, plus £100/dwelling/year operational cost, over a lifetime of 20 years.
Approximate reduction in P load Timescale Cost
0.9 kg-P/dwelling/year Intermediate (post 2021) £1,370 per dwelling (one off cost)
EAC £196/dwelling/year

24 © Wood Environment & Infrastructure Solutions UK Limited
January 2019
Doc Ref. 41031rr007i3
Increasing the proportion of green infrastructure within new developments
Details
3.3.22 Where technically feasible, increase the delivery of green infrastructure (e.g. Sustainable Drainage
Systems [SuDS], swales, permeable surfaces, green rooftops) in new developments with particular
focus on attenuating phosphorus discharge.
Benefits
3.3.23 Whilst this may have a small knock-on effect on the cost of developments, it provides an option
that is readily within the gift of developers. The impact of any additional costs may nevertheless
impact upon commercial viability and this would need to be assessed on a site by site basis. Wider
benefits of more greenspace include more attractive, healthier places to live with space for people,
birds and insects, plus water retention can have a positive impact on managing flood risk. SuDS
can also reduce loads of other pollutants such as Polycyclic Aromatic Hydrocarbons (PAHs).
Challenges
3.3.24 Possible reduction in overall capacity for housing growth.
Basis of estimated P reduction
3.3.25 Would not act to reduce P loads, assuming no overall reduction in housing provision (new
dwellings) other than through reduction in urban diffuse loads (which are expected to be small for
new developments). Changes in land management on existing green infrastructure could realise
some reduction in P loads (for example, avoiding compaction of grassland; siting gateways so as to
avoid poaching in high risk areas, in order to reduce the risk of soil erosion and runoff).
3.3.26 Assuming 80% reduction in urban diffuse P export by SuDS (after CIRIA SuDS Manual, version 3),
and a baseline diffuse P loss (excluding sewer leakage and mains water leakage) of around 0.1 kg-
P/ha and 30 dwellings per hectare, the estimated reduction in P load is 0.08 kg-P/ha, or 0.003 kg-
P/dwelling.
3.3.27 Costs are estimated on the basis of Environment Agency (2015)10. Simple rainwater harvesting:
£100-£243 per dwelling; advanced rainwater harvesting: £2,000-£6,000 per dwelling; greywater
reuse: £1,900-£3,500 per dwelling. For the purposes of this report, a figure of £3,000 per dwelling
has been assumed.
3.3.28 EAC is calculated on the basis of £3,000 per dwelling capital cost, no operational cost and a lifetime
of 20 years.
Approximate reduction in P load Timescale Cost
0.003 kg P/dwelling Intermediate (post 2021) £3,000 per dwelling
EAC £211/dwelling/year
10 http://evidence.environment-
agency.gov.uk/FCERM/Libraries/FCERM_Project_Documents/SC080039_cost_SUDS.sflb.ashx

25 © Wood Environment & Infrastructure Solutions UK Limited
January 2019
Doc Ref. 41031rr007i3
Measures applicable in-catchment
On-Farm Wetland Creation and Restoration Details
3.3.29 Establishment of constructed on-farm wetlands (or silt traps) to reduce diffuse pollution from e.g.
agricultural yards and dairy cattle movements (but first having taken measures to reduce it at
source). Constructed wetlands consist of man-made systems that treat wastewater through a range
of natural processes including sedimentation and uptake of nutrients by plants.
Benefits
3.3.30 Considerable potential for multiple benefits aside from water quality improvements, such as
enhanced flood risk management, enhanced recharge, biodiversity and habitats, and community
health.
Challenges
3.3.31 Removal efficiency depends on a range of factors - hydraulic load, nutrient load, pre-existing land
use, size of wetland basin, retention time, vegetation structure, and long-term management.
Schemes would need to be carefully designed and placed to achieve maximum benefits.
3.3.32 Agreements with landowners will be necessary. Good access will be necessary to enable
maintenance and removal of captured sediment.
Basis of estimated P reduction
3.3.33 Information from Wildfowl and Wetlands Trust (WWT) guidance on on-farm wetlands11.
3.3.34 Wetland options range in size, scale, cost and effectiveness from swales (cheap and simple),
through sediment traps to constructed wetlands. The WWT guidance distinguishes between them
using a star system, with the simplest, lower cost options to treat low strength effluent being 1-star
systems and the most complex, higher cost systems capable of treating high strength effluents
being 5-star systems.
3.3.35 Typical costs range from £10-15/m2 for a 1-star swale treating a single track or field, through to £5-
100/m2 for a 5-star constructed wetland that could treat runoff from farmyards and fields to a high
quality.
3.3.36 For the most complex (and effective) types an Environment Agency permit to discharge is likely to
be required. Case studies include an in-ditch wetland with a cost of about £2,700, achieving
reductions in total phosphorus (TP) loads of 0.1-0.2 kg P/ha/year, and a constructed wetland with
P-specific crushed stone treatment that could achieve effluent quality of around 1mg-P/l at a cost
of £10-18k.
3.3.37 Baseline farm P loads from farms range from 0.1 kg/ha to over 2 kg/ha (Tables 3.1 and 3.2).
3.3.38 The case studies described in the WWT guidance suggest the effectiveness of wetlands at removing
phosphorus can be as high as 95%. Assuming 95% effectiveness, farm wetlands could reduce P
loads by 0.09 – 1.9 kg/ha. Based on the Farmscoper model farms, this equates to 1.7 – 300 kg P per
farm per year, with central estimate 69 kg-P per farm per year (average over all farm types).
However, typical effectiveness is likely to be lower than this.
11 http://www.wwt.org.uk/uploads/documents/1429707026_WWTConstructedFarmWetlands150422.pdf

26 © Wood Environment & Infrastructure Solutions UK Limited
January 2019
Doc Ref. 41031rr007i3
3.3.39 For the purposes of illustration, a constructed wetland on an arable farm on the Chalk might cost
around £10,000 and achieve a reduction in P loading from the baseline figure of 22 kg-P/year (0.14
kg P/ha) to around 50% of that, a reduction of 11 kg-P/year (although there is very large variability
between farm types and wetland systems). It is noted that there is evidence that greater reductions
than this could be achieved, and this estimate is therefore precautionary.
3.3.40 EAC is calculated on the basis of £10,000 capital cost, operational costs of £200/year over a lifetime
of 10 years. No cost is included for land purchase since it is assumed that the wetland will be
constructed on land already owned by the farm. Compensation for the loss of productive farmland
might be in the region of £640 per hectare (based on a milling wheat crop of average yield12)
although in practice much less productive land would be likely to be utilised, and compensation
would be significantly lower. No allowance has been included in the cost estimate for
compensation.
Approximate reduction in P load Timescale Cost
69 kg P per farm per year (central estimate)
with range 1.7 – 300 kg P per farm per year.
11 kg P per farm per year used for
illustration.
Medium £10,000 (one off cost), £200/year
operational cost.
EAC £1,402/farm/year
12 John Nix Farm Management Pocketbook, 46th edition, 2016.

27 © Wood Environment & Infrastructure Solutions UK Limited
January 2019
Doc Ref. 41031rr007i3
In-Catchment Wetland Creation and Restoration
Details
3.3.41 Establishment of constructed wetlands to reduce diffuse pollution, at strategic locations within the
catchment, for example alongside the river (so that some or all river flow is diverted through the
wetland), on or at the back of the floodplain of the river, or intercepting drainage ditches or smaller
tributaries that ultimately flow into the river. Constructed wetlands consist of man-made systems
that treat wastewater through a range of natural processes including sedimentation and uptake of
nutrients by plants.
Benefits
3.3.42 Considerable potential for multiple benefits aside from water quality improvements, such as
enhanced flood risk management, enhanced recharge, biodiversity and habitats, and community
health.
Challenges
3.3.43 Removal efficiency depends on a range of factors - hydraulic load, nutrient load, pre-existing land
use, size of wetland basin, retention time, vegetation structure, and long-term management.
Schemes would need to be carefully designed and placed to achieve maximum benefits.
3.3.44 Agreements with landowners will be necessary. Permits are likely to be required for any scheme
that alters flow (from the Lead Local Flood Authority) or that includes a discharge to a watercourse
(from the Environment Agency).
Basis of estimated P reduction
3.3.45 Information from Wildfowl and Wetlands Trust (WWT) guidance on on-farm wetlands13, although it
is noted that some of the case studies describe larger systems that may be more applicable in-
catchment.
3.3.46 Typical costs for larger schemes are given as £5-100/m2 for a 5-star constructed wetland that could
treat runoff to a high quality. Case studies include a large Integrated Catchment Wetland, reported
as capable of treating to very low Total Phosphorus concentrations and covering an area of about
1.3ha.
3.3.47 For the most complex (and effective) types an Environment Agency permit to discharge is likely to
be required.
3.3.48 Further work is required to identify suitable locations for larger schemes, and to understand the
levels of treatment and phosphorus removal that could be achieved. It is recommended that a
study is commissioned to further investigate the feasibility of this option. Given the likely timescale
for this to be completed, implementation of any such schemes is unlikely to occur before the latter
half of the interim delivery plan period, at the earliest.
3.3.49 At this stage no further estimate can be provided of the likely costs or effectiveness of in-
catchment wetland schemes, as they will be bespoke to each scheme.
13 http://www.wwt.org.uk/uploads/documents/1429707026_WWTConstructedFarmWetlands150422.pdf

28 © Wood Environment & Infrastructure Solutions UK Limited
January 2019
Doc Ref. 41031rr007i3
Taking Land Out of Agricultural (arable or grass) Production through Offsetting
Details
3.3.50 Includes:
⚫ Ensuring that greenfield land in new developments is taken out of production (or at least that
CSF measures or equivalent are in place to minimise P export);
⚫ Taking publicly owned land (estate) out of production;
⚫ Purchase of land by Local Authorities or charities and taking it out of production; and
⚫ Paying farmers to take their land out of production.
3.3.51 Land could be converted to parks, wetland or woodland (for example).
Benefits
3.3.52 Effective measure that could potentially realise significant reductions in P export to rivers. Wider
benefits through habitat creation and reduction in other diffuse pollutants (such as pesticides).
Challenges
3.3.53 Likely to be prohibitively expensive for Local Authorities to purchase agricultural land, or to pay
farmers to take land out of production. It would be significantly cheaper to rent land than to buy it,
although this would provide less security that the reduction in P export would be in perpetuity.
Basis of estimated P reduction
3.3.54 Reversion to woodland would provide some long-term income while reducing P loads, but on a
very long timescale (typically 75 years for a hard timber crop to mature, soft timber is up to 30
years). Reduction in P load assumed to be around 0.4 kg P/ha (as per NMP), but could be in the
range 0.1 kg P/ha to >2 kg P/ha (Farmscoper modelling results), depending on farm type and
location (soil type). Central estimate (average over all farm types) 0.5 kg P/ha. Based on the
Farmscoper model farms this equates to up to 314 kg P per farm per year, with a central estimate
of 73 kg P/farm/year.
3.3.55 Savills farmland value survey (201714) suggests land values as follows: Prime arable land £21,600 per
ha, grade 3 land £18,000 per ha and grazing land £12,000 per ha. For the purposes of this
comparison, a farm size of 100 ha has been assumed, which at £18,000/ha equates to £1,800,000
3.3.56 This cost is likely to prohibit purchase of land by Local Authorities, but this measure could be
applied to any publicly owned land that is currently put to agricultural use. Wiltshire Council own
270 ha of agricultural land, which, assuming current P export of 0.4 kg P/ha, would equate to a
reduction of 108 kg P/yr if taken out of production. In this case, the cost of implementation would
equate to the loss of rental income from the land. The Agriculture and Horticulture Development
Board (AHDB)15 indicate that the average rental price of arable land in 2018 is £356/ha, which
would equate to a rental income of £96,120/year.
14 https://www.savills.co.uk/research_articles/229130/228020-0 15 https://dairy.ahdb.org.uk/market-information/farm-expenses/land-prices/rent-prices/#.XAFM1tv7QnQ

29 © Wood Environment & Infrastructure Solutions UK Limited
January 2019
Doc Ref. 41031rr007i3
Approximate reduction in P load Timescale Cost
108 kg P/year Medium to Long £96,120/year

30 © Wood Environment & Infrastructure Solutions UK Limited
January 2019
Doc Ref. 41031rr007i3
Change land-use from Intensive to Less Intensive
Details
3.3.57 Change intensive land use to low intensity management, for example by reducing overall stocking
rates on livestock farms. Low tillage methods on arable fields to reduce sediment run-off.
Benefits
3.3.58 Effective measure that could potentially realise significant reductions in P export to rivers. Wider
benefits through potential reduction in other diffuse pollutants (such as pesticides) and carbon/
methane emissions.
Challenges
3.3.59 Degree of mitigation provided depends on the location of the site and the ‘replacement’ land use.
Relies on securing long term agreements with landowners. Securing change for the medium-long
term is key.
Basis of estimated P reduction
3.3.60 Diffuse Pollution Inventory User Manual (2011) data: Method 41, reduce overall stocking rates on
livestock farms. This suggests that P and sediment losses would be decreased by ca 30%. Applying
this to the baseline Farmscoper predictions of P export suggests an average reduction of 0.14 kg
P/ha across all farm types (range 0.04 – 0.7 kg P/ha), or 23 kg P per farm per year (range 0.5 – 94 kg
P/farm/year). The DPI User Manual notes that this measure would have a serious impact on farm
profitability (up to £33,000 per farm per year). The figure for a dairy farm is £11,000 per year. With
a 12% uplift to allow for increases in costs from 2011 to 2018 this figure rises to £12,320.
Approximate reduction in P load Timescale Cost
23 kg P/farm/year (range 0.5 – 94 kg
P/farm/year)
Short £12,320 per dairy farm per year.

31 © Wood Environment & Infrastructure Solutions UK Limited
January 2019
Doc Ref. 41031rr007i3
River restoration measures
Details
3.3.61 Measures such as removal of weirs and re-profiling of banks all help to reduce the amount of
phosphate laden silt depositing in the river, and help restore more natural river hydrodynamics,
while increased riparian vegetation will assimilate greater nutrients from the water itself. This
measure could also include the creation of in-catchment wetlands (see previous section).
Benefits
3.3.62 This has considerable wider benefits for the river ecology and could provide greater access.
Challenges
3.3.63 Difficult to quantify improvements in nutrients that can be realised. Requires engagement with
multiple stakeholders, landowners, angling groups etc. and consents from Environment
Agency/Natural England.
Basis of estimated P reduction
3.3.64 A River Restoration Plan for the Avon is already in place, which has identified and costed
restoration actions for each reach. This measure is considered to be expensive to implement and
unlikely to result in the required reductions in P loads on timescales compatible with the interim
approach. For these reasons, it is not further considered.
32 © Wood Environment & Infrastructure Solutions UK Limited
January 2019
Doc Ref. 41031rr007i3
Storing and transporting excess P from dairy farms to arable farms as a means of nutrient
balancing across farm type
Details
3.3.65 Livestock farms apply only such manure to land as is necessary to maintain nutrient levels, with the
excess being transported to arable farms nearby. The receiving farm uses a recognised fertiliser
recommendation system and other supplementary guidance to make full allowance of the nutrients
applied in organic manures and reduce manufactured fertiliser inputs accordingly, such that overall
nutrient inputs are at or below recommended rates.
Benefits
3.3.66 Wider benefits to the farming community.
Challenges
3.3.67 Ongoing costs of subsidising infrastructure for storage, transport and fuel costs. For example, the
receiving farm may need infrastructure improvements to accommodate manure heaps or slurry
stores.
3.3.68 Applicability will vary depending on scale of manure and availability of nearby arable land to
receive it (see Section 4.4). Applicability may also be limited by the Nitrate Vulnerable Zone (NVZ)
regulations, which limit the rate at which nitrogen may be applied to land, and hence the rate at
which manure may be applied. This measure may help livestock farmers meet the New Farming
Rules for Water, however.
Basis of estimated P reduction
3.3.69 The measure is evaluated on the basis that it is similar to the mitigation Method 23 Integrate
fertiliser and manure nutrient supply, described in the DPI User Manual (Defra, 2012)16 (see Section
3.2: Estimating costs of agricultural measures). This measure assumes that farmers will use manure
analysis data to quantify the nutrients in manure applications to land, and reduce mineral fertiliser
applications accordingly.
3.3.70 That measure is estimated to achieve a potential reduction in P losses of up to 10%. Based on
Farmscoper modelling this equates to an average reduction of 0.05 kg P/ha, or 7.8 kg P per farm
per year, with a range of 0.01 – 0.23 kg P/ha (0.2 – 31 kg P/farm/year). Costs of transporting
manure would be partially offset by reduction in fertiliser costs on receiving farms.
3.3.71 See also DPI User Manual Method 12: Maintain and enhance soil organic matter levels. Based on
the receiving farm paying the transport costs this is estimated to cost £800 per farm per year if
manure transported 10km, or a net saving of £6,500 per farm per year if transported 3km. The
former figure is taken forward for illustration, with a 12% uplift applied, giving a cost of £896. Note
that the levels of P reduction achieved will vary and there is increased risk of incidental P losses
from manure applications.
16 DEFRA, 2012. An Inventory of Mitigation Methods and Guide to their Effects on Diffuse Water Pollution, Greenhouse
Gas Emissions and Ammonia Emissions from Agriculture. User Guide.
http://randd.defra.gov.uk/Document.aspx?Document=MitigationMethods-UserGuideDecember2011FINAL.pdf

33 © Wood Environment & Infrastructure Solutions UK Limited
January 2019
Doc Ref. 41031rr007i3
Approximate reduction in P load Timescale Cost
7.8 kg P/farm/year (range 0.2 – 31 kg
P/farm/year)
Short to medium Up to £896 per farm per year.

34 © Wood Environment & Infrastructure Solutions UK Limited
January 2019
Doc Ref. 41031rr007i3
Make available compost to improve soil condition
Details
3.3.72 Make available compost to improve soil condition to improve soil structure, water and nutrient
holding capacity.
Benefits
3.3.73 Wider benefits to the farming community.
Challenges
3.3.74 It is not clear what level of reduction in phosphorus export can be achieved.
Basis of estimated P reduction
3.3.75 This is essentially the same as the previous measure (storing and transporting P from dairy farms),
and the costs and P reductions are estimated on the same basis.
Approximate reduction in P load Timescale Cost
7.8 kg P/farm/year (range 0.2 – 31 kg
P/farm/year)
Short to medium Up to £896 per farm per year.

35 © Wood Environment & Infrastructure Solutions UK Limited
January 2019
Doc Ref. 41031rr007i3
Regulatory controls on agricultural phosphorus
Details
3.3.76 Direct regulatory controls on agricultural phosphorus input that limits the accumulation of surplus
phosphorus in soils and prevents phosphorus losses to water from agricultural activities, for
example, regulations requiring regular soil testing and adherence to phosphorus fertiliser rates
from a recognised fertiliser recommendation system.
Benefits
3.3.77 An understanding of the scope for, prospects and possible impact of such measures would help to
inform the pursuit of other land use/management measures involving agriculture.
Challenges
3.3.78 High levels of regulatory compliance may already exist, i.e. most arable and dairy farmers will
already match fertiliser requirement to soil P status.
Basis of estimated P reduction
3.3.79 This is similar to DPI User Manual Method 32 Do not apply P fertiliser to high P index soils (except it
would be implemented through regulatory controls rather than voluntary uptake). The DPI manual
states that this measure could reduce soluble P export by up to 50% and particulate P by up to
30%, over the long term. Based on Farmscoper baseline predictions of P export, this equates to 0.05
– 1.1 kg P/ha, or 0.25 kg P/ha on average across all farm types (39 kg P/farm/year, range 1 – 157 kg
P/farm/year). Saving per farm is £100 to £500 per annum (assuming no loss of yield). There would
be an additional cost of employing an officer to carry out compliance visits, which could be funded
via Local Authorities. For the purposes of comparison, this is estimated at twice the estimated
salary of such an officer, or £50,000/year. If their remit were to include 250 farms, this would
equate to £200/farm/year. As a worst-case scenario, the potential saving to each farm is ignored
and the cost of implementation considered to be the cost of employing an officer.
Approximate reduction in P load Timescale Cost
39 kg P/farm/year (range 1 – 157 kg
P/farm/year)
Medium to long £200/farm/year.

36 © Wood Environment & Infrastructure Solutions UK Limited
January 2019
Doc Ref. 41031rr007i3
Measures within the remit of Water Companies
Diverting surface water flows and groundwater ingress away from the Foul Sewage Network
Details
3.3.80 This measure includes:
⚫ Separation of storm runoff and foul sewage in existing developments, with storm runoff being
directed to (for example) SuDS or highway drains;
⚫ Sewer lining to reduce groundwater ingress and hence foul flow to STWs.
Benefits
3.3.81 Reduction in the total flow to STWs and hence reductions in storm tank discharges and Combined
Sewer Overflow (CSO) discharges. Improvements in sewer network capacity and reduced risk of
sewer flooding.
Challenges
3.3.82 Needs a fuller understanding of land from which storm runoff currently drains to the foul sewer
network. Depends upon the levels of improvement in performance at STWs that can be achieved.
Potentially high level of disruptive work on highways.
3.3.83 Customers’ private lateral drains and connections can also be responsible for the ingress of surface
and groundwater into foul sewer networks.
Basis of estimated P reduction
3.3.84 Would act to reduce storm tank discharges and CSO flows. It is difficult to quantify the effect this
would have on P loads without knowing how frequently ST discharges occur. Based on figures for
another STW, PE 54,000, spilling 14,000m3 from storm tanks in a typical year at P concentration of
1.5 mg/l equates to a P loading discharged of 21 kg P/yr.
3.3.85 Assuming that reduced flow to the works causes a 10% reduction in storm tank discharges, this
equates a P reduction of 2kg/yr.
3.3.86 It is noted that Wessex Water will have detailed data on actual storm tank discharges.
3.3.87 Wessex Water have provided a broad indication of the cost of implementation. It is not possible to
provide a precise figure.
Approximate reduction in P load Timescale Cost
2 kg P/year (but highly uncertain) Medium Medium

37 © Wood Environment & Infrastructure Solutions UK Limited
January 2019
Doc Ref. 41031rr007i3
Addressing sewer misconnections
Details
3.3.88 Identifying and correcting instances where foul drains have been incorrectly connected to storm
drains. WWT17 suggests 0.6-2% of households have some sort of misconnection, most commonly
washing machines (35%), sinks (20%) and dishwashers (10%), but 5% involve a toilet.
Benefits
3.3.89 General improvement in water quality.
Challenges
3.3.90 Survey work would be needed to properly understand the scale of problem and reduction in P
loading that could be achieved. Difficulties in identifying mis-connections, reliance on public to
know where these occur.
3.3.91 Generally, only cost effective in larger urban conurbations (the Avon is a largely rural catchment).
Basis of estimated P reduction
3.3.92 Assuming a per capita P export of 0.44kg P/person/year (e.g. Entec, 2010) and 2.3 persons per
household, if 5% of this load is directed to storm drains instead of foul sewer (that being the
estimated proportion of mis-connections that involve a toilet) that would equate to 0.05 kg P/year.
3.3.93 P reductions will be realised in urban areas (e.g. Salisbury, Ringwood, Fordingbridge, Warminster).
Note that these will be one-off reductions, although it is likely that new misconnections will
continue to arise as existing properties are altered or extended.
3.3.94 If 1% of the sewered population of 140,000 people in the catchment are mis-connected, this would
suggest a potential P reduction of up to 70 kg P/year.
3.3.95 Wessex Water have provided a broad indication of the cost of implementation. It is not possible to
provide a precise figure.
Approximate reduction in P load Timescale Cost
Up to 70 kg P/year. Short to medium Low to medium
17 https://wwtonline.co.uk/features/the-rights-and-wrongs-of-misconnections

38 © Wood Environment & Infrastructure Solutions UK Limited
January 2019
Doc Ref. 41031rr007i3
Reduce leakage from foul sewerage system
Details
3.3.96 Reduce sewer leakage, and hence ingress of phosphorus to the catchment. Leakage of raw sewage
from the sewer network into the subsurface introduces a source of phosphorus to the environment.
Reducing leakage rates will reduce this source of phosphorus. Leakage in this context can refer to
inadequate hydraulic capacity of the network, sewage pumping station failures and rising main
bursts / sewer damage.
Benefits
3.3.97 General improvement in environmental quality.
Challenges
3.3.98 Further work would be needed to understand the scale of the problem and improvement in water
quality that could be achieved. It is likely that a high degree of attenuation of phosphorus from
sewer leakage will limit the impact of sewer leakage on river water quality.
Basis of estimated P reduction
3.3.99 Estimates of rates of leakage vary. This estimate is based on the figures quoted in Entec (2010).
Taking a value of 2% leakage and water usage of 230 l/person/day (which is high but includes other
water uses), and an effluent strength of 9 mg/l as P, yields an estimated loading of 0.015 kg
P/person/year. For the sewered population of the Hants Avon of 140,000 people, this is 2,100 kg P.
3.3.100 Significant attenuation would be expected to occur in the subsurface. 88% attenuation, as assumed
in the NMP, would result in a P loading of 252 kg P/year. (Note this is a one-off reduction rather
than an ongoing reduction).
Wessex Water have provided a broad indication of the cost of implementation. It is not possible to provide a
precise figure.
Approximate reduction in P load Timescale Cost
Up to 252 kg P Short to medium Medium

39 © Wood Environment & Infrastructure Solutions UK Limited
January 2019
Doc Ref. 41031rr007i3
Reduce leakage from potable water supply
Details
3.3.101 Reduce leakage from potable supply (where P dosing of drinking water to address lead issues in
the private pipe network represents a viable P source).
Benefits
3.3.102 Improvement in sustainability and reduction in OPEX.
Challenges
3.3.103 Uncertainty in scale of problem and improvement in water quality that could be achieved.
Basis of estimated P reduction
3.3.104 Information from Wessex Water (G. Sanders, Pers. Comm.) indicates that only Middle Camp WTW
(Salisbury) doses for plumbosolvency. The WTW releases 7.5 Ml/d of treated water, containing an
estimated 5.6 kg/d of phosphorus. With leakage estimated at 20%, this equates to a release of
410 kg-P/year.
3.3.105 Leakage reduction is targeted to be reduced from 20% to 15% by 2025, which will reduce this
release to 349 kg-P/year by 2025, or 12 kg-P/year on average.
3.3.106 There will be substantial attenuation of this load in the subsurface. Assuming an attenuation rate of
88% (as per the NMP) the resulting reduction in P load would be 1.44 kg-P/year.
Wessex Water have provided a broad indication of the cost of implementation. It is not possible to provide a
precise figure.
Approximate reduction in P load Timescale Cost
1.44 kg P/year on average. Medium Medium

40 © Wood Environment & Infrastructure Solutions UK Limited
January 2019
Doc Ref. 41031rr007i3
Increased treatment of the effluent by the water company
Details
3.3.107 Apply improved treatment technology at STWs to further improve effluent quality. This option is
effectively being taken forward by Wessex Water as their ODI. If this is adopted, it will make all new
mains-sewered development from 2020 phosphate neutral.
Benefits
3.3.108 General improvement in water quality.
Challenges
3.3.109 Would need to be implemented via the Price Review process.
Basis of estimated P reduction
3.3.110 It is difficult to estimate accurately the reduction in P loading that could be achieved through
improved treatment, since the reduction will clearly depend on the level of treatment applied.
Wessex Water’s growth forecasts indicate that the total P load from their assets in year 2017/18 was
around 11.3 tonnes (based on measured flows from each works and assuming effluent quality equal
to the average for the period 2013-2017). They further estimate that improving all works to treat to
a quality of 0.5 mg-P/l would reduce this load to 10.0 tonnes.
3.3.111 The Technically Achievable Limit (TAL) for phosphorus treatment is currently considered to be
0.25 mg-P/l. Hypothetically, therefore, if all works treated to the TAL, the total load would decrease
by a further 5.0 tonnes. This is, however, an extreme example included only to illustrate what is
theoretically achievable.
3.3.112 A reduction of 1,300 kg-P/year is a reasonable estimate of the reduction in loading that could be
achieved.
3.3.113 Wessex Water have provided a broad indication of the cost of implementation. It is not possible to
provide a precise figure.
Approximate reduction in P load Timescale Cost
Up to 1300 kg P/year (but very uncertain) Medium High

41 © Wood Environment & Infrastructure Solutions UK Limited
January 2019
Doc Ref. 41031rr007i3
3.4 Summary of measures
3.4.1 Table 3.3 presents a summary of the estimated costs and effectiveness of the measures described in
Section 3.3. Note that where costs have been taken from the DPI User Manual a 12% uplift has
been applied to account for increases from 2011 to 2018.
Table 3.3 Summary of estimated costs and effectiveness of measures
Measure Estimated effectiveness Estimated cost Cost-effectiveness (£/kg-P)
Measures applicable on-site
Reducing Flows to the Foul
Sewage Network through
Water Efficiency Measures
0.008 kg-P/year per dwelling £2/dwelling (EAC) £250/kg
On-site sewage treatment and
disposal systems (with
wetlands)
0.9 kg-P/year per dwelling £196/dwelling (EAC) £218/kg
Increasing the proportion of
green infrastructure within
new developments
0.003 kg-P/year per dwelling £211/dwelling (EAC) £70,000/kg
Measures applicable in-
catchment
Wetlands
11 kg P per farm per year
38 kg-P/year (for a PTP serving
100 people)
£1,402/farm (EAC) £127/kg
Taking Land Out of
Agricultural (arable or grass)
Production through Offsetting
108 kg P/year £96,120/year £890/kg
Change land-use from
Intensive to Less Intensive
Grass Production.
23 kg P/farm/year £12,320/farm/year £536/kg
Storing and transporting
excess P from dairy farms to
arable farms
7.8 kg P/farm/year £896/farm/year £115/kg
Make available compost to
improve soil condition
7.8 kg P/farm/year £896/farm/year £115/kg
Regulatory controls on
agricultural phosphorus
39 kg P/farm/year £200/farm/year £5/kg
Measures within the remit of
the Water Company
Diverting Surface Water Flows
and groundwater ingress away
from the Foul Sewage Network
2 kg P/year Medium
Addressing Misconnections Up to 70 kg P/year Low to Medium
Reduce leakage from foul
sewerage system
Up to 252 kg P/year Medium

42 © Wood Environment & Infrastructure Solutions UK Limited
January 2019
Doc Ref. 41031rr007i3
Measure Estimated effectiveness Estimated cost Cost-effectiveness (£/kg-P)
Reduce leakage from potable
supply
1.44 kg P/year Medium
Increased treatment of
effluent.
Up to 1300 kg P/year High

43 © Wood Environment & Infrastructure Solutions UK Limited
January 2019
Doc Ref. 41031rr007i3
4. Feasibility of measures
4.1 Introduction
4.1.1 This section discusses the feasibility of measures, both in terms of their requirements for effective
implementation, and (at a high level) the areas within the River Avon SAC in which they are most
likely to be applicable.
4.2 Requirements for implementation of measures
4.2.1 This section provides a summary of the requirements for the implementation of each of the
measures described in Section 3. This applies in particular to the catchment measures, which may
not be applicable in all parts of the River Avon SAC catchment. For example, measures which target
manure use will not apply in arable catchments where little or no manure is used.
4.2.2 A summary of the constraints on the application of each measure is provided in Table 4.1.
Table 4.1 Restrictions or requirements for the implementation of measures
Measure Applicable areas
Measures applicable on-site
Reducing Flows to the Foul Sewage Network through Water
Efficiency Measures
Any new development
On-site sewage treatment and disposal systems Any new development (but likely to be supported only for large
scale developments).
Increasing the proportion of green infrastructure within new
developments
Any new development
Measures applicable in-catchment
On-Farm Wetlands
Farms with available land for schemes. Some schemes may require
Environment Agency permits.
Also, small STWs or package treatment plants.
In-Catchment Wetlands
Likely to be most effective adjacent to the river corridor or on or
near the floodplain. Schemes that alter flow will require Lead Local
Flood Authority permits.
Taking Land Out of Agricultural (arable or grass) Production
through Offsetting
Available arable or grazed land.
Change land-use from Intensive to Less Intensive Grass
Production.
Intensive livestock farms.
Storing and transporting excess P from dairy farms to arable
farms
Livestock farms with nearby available arable land to receive
manure.
Make available compost to improve soil condition
Livestock farms with nearby available arable land to receive
manure/compost. Particularly applicable to heavier soils more
prone to runoff.

44 © Wood Environment & Infrastructure Solutions UK Limited
January 2019
Doc Ref. 41031rr007i3
Measure Applicable areas
Regulatory controls on agricultural phosphorus All farms.
Measures within the remit of the Water Company
Diverting Surface Water Flows and groundwater ingress away
from the Foul Sewage Network
All sewer catchments, particularly areas with older infrastructure.
Addressing Misconnections Mainly in urban areas including rural villages and towns.
Reduce leakage from foul sewerage system Mainly in urban areas with older infrastructure and rural villages.
Reduce leakage from potable supply Mainly in urban areas with older infrastructure.
Increased treatment of effluent. All sewer catchments.
4.3 Catchment and sub-catchment spatial data
4.3.1 Appendix A presents a series of maps and Appendix B a series of tables that illustrate where in the
Hampshire Avon catchment the various measures previously described are most likely to be
applicable. For example, the measure “Change land-use from Intensive to Less Intensive Grass
Production” is applicable to intensive grassland agriculture. Appendix A includes a map that shows,
at Water Framework Directive (WFD) waterbody level, the numbers of livestock farms in the
catchment, and where, therefore, the measure is most likely to be successfully put in place.
4.3.2 Table 4.2 provides a list of figures for reference. A list of data sources and references is also
provided at Appendix A.
Table 4.2 Figure list
Figure Content
1 WFD waterbody boundaries
2 Numbers of proposed dwellings
3 Land cover
4 Topsoil Olsen P1 (mg/kg)
5 Manure applications – beef manure and slurry
6 Manure applications – poultry manure
7 Manure applications – dairy manure and slurry
8 Manure applications – outdoor pigs
9 Manure applications – other pigs
10 Manure applications – sheep
11 Risk of soil erosion by water
12 Population density
13 Crop data

45 © Wood Environment & Infrastructure Solutions UK Limited
January 2019
Doc Ref. 41031rr007i3
Figure Content
14 Farm numbers by sub-catchment - Arable
15 Farm numbers by sub-catchment – Extensive grazing
16 Farm numbers by sub-catchment – Intensive grazing
17 Farm numbers by sub-catchment – Pigs and poultry
18 Modelled phosphorus loads to watercourses – Agricultural sources – Total phosphorus - unmitigated
19 Modelled phosphorus loads to watercourses – Agricultural sources – Dissolved phosphorus - unmitigated
20 Modelled phosphorus loads to watercourses – Agricultural sources – Total phosphorus - mitigated
21 Modelled phosphorus loads to watercourses – Agricultural sources – Dissolved phosphorus - mitigated
22 Modelled phosphorus loads to watercourses – Bank erosion – Total phosphorus
23 Modelled phosphorus loads to watercourses – Bank erosion – Dissolved phosphorus
24 Modelled phosphorus loads to watercourses – Urban diffuse – Total phosphorus
25 Modelled phosphorus loads to watercourses – Urban diffuse – Dissolved phosphorus
26 Modelled phosphorus loads to watercourses – Sewage treatment works – Total phosphorus
27 Modelled phosphorus loads to watercourses – Sewage treatment works – Dissolved phosphorus
28 Modelled phosphorus loads to watercourses – Storm tank discharges – Total phosphorus
29 Modelled phosphorus loads to watercourses – Storm tank discharges – Dissolved phosphorus
30 Modelled phosphorus loads to watercourses – Septic tanks – Total phosphorus
31 Modelled phosphorus loads to watercourses – Septic tanks – Dissolved phosphorus
32 Modelled phosphorus loads to watercourses – Combined sewer overflows – Total phosphorus
33 Modelled phosphorus loads to watercourses – Combined sewer overflows – Dissolved phosphorus
34 Modelled phosphorus loads to watercourses – Direct deposition – Total phosphorus
35 Modelled phosphorus loads to watercourses – Direct deposition – Dissolved phosphorus
36 Modelled phosphorus loads to watercourses – Waterbody total – Total phosphorus
37 Modelled phosphorus loads to watercourses – Waterbody total – Dissolved phosphorus
38 Solid geology
39 Superficial geology
1. Olsen P is a measure of the bio-available phosphorus content of topsoil.
4.4 Applicability of measures
4.4.1 From the maps and tables in Appendices A and B it is possible to make some preliminary
observations about the potential applicability of measures in sub-catchments of the Hants Avon.

46 © Wood Environment & Infrastructure Solutions UK Limited
January 2019
Doc Ref. 41031rr007i3
4.4.2 In general, to afford maximum protection to the river, it would be preferable to provide mitigation
measures close to, or upstream of, the point of discharge of the relevant sewage treatment works
to which the associated development will connect. The SAC extends along the length of the river,
so whilst implementing mitigation measures near the bottom of the catchment could, technically,
achieve phosphorus-neutrality, this would not protect the majority of the SAC.
4.4.3 The distribution of projected housing growth indicates that larger developments are likely to occur
in the Lower Nadder, west of Salisbury, and the Upper Avon downstream of the Nine Mile
confluence, north of Salisbury.
⚫ Figure 7 suggests a significant source of pig manure in the Upper Avon, which could represent
a significant source of phosphorus, offering opportunities for potential improvements in
manure management or measures to reduce diffuse pollution in runoff and soil erosion.
⚫ Figure 10 indicates a relatively high risk of soil erosion in the Bourne, and measures to mitigate
runoff and soil erosion (e.g. wetlands or silt traps) are likely to be applicable. This also applies
to some extent to the Wylye and the Ebble.
⚫ Cropping data (Figure 12) indicates areas of potato crops in the Upper Avon. Potatoes typically
receive high applications of P fertiliser, or are grown on soils that are high in P, suggesting
opportunities to reduce diffuse P loss associated with runoff and soil erosion.
⚫ Measures involving transporting manure from livestock farms to receiving arable farms are
likely to be most applicable in predominantly arable or mixed arable and livestock areas. The
largest number of arable holdings in any sub-catchment of the Avon is in the Bourne (Figure
13). There are also significant numbers of arable holdings in the Ebble, the Lower Avon and
Upper Avon (d/s Nine Mile confluence), the Middle Nadder and the Wylye (headwaters and
middle). The Bourne and Wylye also contain significant numbers of intensive livestock
enterprises (Figure 15).
⚫ Pig and poultry units present a relatively high risk of diffuse phosphorus export. There are,
however, relatively few of these, located mainly in Ditchend Brook, Dockens Water, Huckles
Brook and Linford Brook, all in the lower part of the catchment (Figure 16).

47 © Wood Environment & Infrastructure Solutions UK Limited
January 2019
Doc Ref. 41031rr007i3
5. Recommendations
5.1 Applying measures
5.1.1 It is estimated that mitigation will be required for around 85 kg P in financial year 2018/19 and
155 kg P in Financial Year 2019/2020 from new development which would otherwise reach the
River Avon SAC (Table 2.4). Of this, the majority (around 85%) is due to mains-sewered residential
development, and as noted these are likely to represent overestimates as developments granted
permissions now are unlikely to be occupied much before 2020.
5.1.2 This section presents the practical measures that could be put in place to mitigate these increases
in P loading, bearing in mind the need for short lead-in times.
5.1.3 It is evident from Table 3.3 that some of the largest reductions in P loadings can be achieved
through measures within the remit of the water company. However, whilst these measures should
remain under consideration going forward, the nature of the regulatory process precludes them on
this short timescale. At this stage, therefore, consideration is limited to catchment measures and
on-site measures.
5.1.4 On-site measures alone are not predicted to be able to achieve the levels of reductions in P loading
required to achieve phosphorus neutrality. Measures aimed at reducing P loads to foul sewers (for
example through water efficiency measures) are helpful and should be pursued, but outside of the
implementation of Wessex Water’s ODI, any new connection to their network will cause an increase
in P loads to the catchment that will need to be mitigated by some other means. On-site measures
can achieve a reduction in the level of mitigation that will be required, however.
5.1.5 Of the catchment measures, those predicted to achieve the greatest potential reductions in P
loadings are wetland sites. These are predicted to achieve significant reductions in diffuse P export
from farms (provided they are appropriately designed to capture and treat the majority of the
effluent from the farm). They can also be used to provide a form of tertiary treatment for on-site
sewage treatment plants, usually involving reed bed systems and require a good deal of
management. The predicted reductions in P loads that can be achieved by on-farm wetlands
suggest that they will play a key part in achieving P-neutrality.
5.1.6 Of the other catchment measures applicable at farm-level, land use change is predicted to be most
effective at reducing P loads. Taking land out of production is predicted to be very effective, but is
likely to be very expensive. However, as noted in Section 3.3, Wiltshire Council owns sufficient land
that, if it is all currently in agricultural production and were taken out of production, could achieve
sufficient reductions in P load to mitigate the estimated increase due to growth in 2018/2019.
5.1.7 The less extreme option of changing land use from intensive to extensive is predicted to achieve
smaller reductions in P loads, but has the advantage of being potentially applicable to a larger area
of land. Based on the estimates provided in Table 3.3, this measure would need to be implemented
on about 4 farms in 2018/2019, and 8 farms in 2019/2020 (although the number will depend on the
farm type and location; there is significant variability as shown in Tables 3.1 and 3.2).
5.2 Estimating the effectiveness of agricultural measures on the
ground
5.2.1 Section 3.2 provides estimates of baseline phosphorus losses from various “model” farm types, on
free-draining and less permeable soils. However, actual farms in the catchment are unlikely to

48 © Wood Environment & Infrastructure Solutions UK Limited
January 2019
Doc Ref. 41031rr007i3
exactly match these model farms in terms of livestock numbers, land area or nutrient management
practices. In assessing the effectiveness of measures as implemented it will be necessary to consider
the characteristics of the candidate farms, and in the case of measures such as wetlands, the
detailed design of the scheme to ensure that maximum benefits are achieved (e.g. a ditch silt trap
will have limited effectiveness if the majority of the P export from a farm is in yard runoff). This
relies on more detailed local knowledge, and it is recommended that existing schemes and
partnerships such as the Hants Avon Catchment Based Approach (CaBA) and Catchment Sensitive
Farming are engaged during delivery of the interim plan to provide that knowledge.
5.2.2 Farmscoper modelling can be tailored to individual farms to produce farm-level estimates of P loss
by sector (soil, manure etc.) and pathway (runoff, drainflow) and can help to inform detailed
designs to maximise the effectiveness of measures.
5.2.3 This report cannot therefore provide quantified estimates of the reduction in P loads that could be
achieved across the catchment through implementation of measures, since this will depend on
detailed assessment of individual farms and schemes. However high-level estimates of the
reductions which could achieve the required 155 kg-P are given in Section 5.5.
5.3 Monitoring
5.3.1 Once measures are put in place to provide mitigation, or reduce P discharges to the environment, it
will be necessary to put in place monitoring in order to ensure that the estimated reductions in P
loads are being achieved. The nature of the monitoring will vary according to the nature of the
measure being monitored, and will require further consideration at site-level.
5.3.2 For wetland sites, it is recommended that specialist advice be sought at the design stage in order to
design an appropriate monitoring plan for the site. Samples should be analysed by an accredited
laboratory. Monitoring should be carried out for at least 12 months.
5.3.3 Monitoring of on-site wastewater treatment works should comprise inline monitoring of effluent
flow and quality for larger plants. For smaller plants, monthly grab samples may be sufficient.
5.3.4 The Working Group has a continuing role to monitor the implementation of the Interim Delivery
Plan to ensure it achieves the objective that additional P load generated by new development leads
to no net increase in the total load discharged to the River Avon SAC (see section 5.5 below)
5.4 Delivery mechanisms and other catchment initiatives
Catchment Sensitive Farming
5.4.1 Implementation of on-farm mitigation measures will require the identification of suitable candidate
sites and the long-term cooperation of landowners. This will rely on good relationships between
stakeholders.
5.4.2 Catchment Sensitive Farming (CSF) officers will have those relationships, and would be well placed
to support the delivery of the interim plan. CSF is a partnership between Defra, the Environment
Agency and Natural England. It brings together farmers and other catchment stakeholders to
deliver improvements in air and water quality, through the provision of free training and advice
covering manure and nutrient management, soil condition, cross compliance and other subjects.
CSF also jointly run a number of long term catchment partnerships with local partners, and support
other short-term collaborative projects. Training and advice is delivered by a team of officers, each
with a remit to cover a particular area.

49 © Wood Environment & Infrastructure Solutions UK Limited
January 2019
Doc Ref. 41031rr007i3
5.4.3 Success of the plan will be helped by the provision of financial compensation to farmers for any
loss of income. Whilst CSF alone has not delivered the levels of P reductions required by the
Nutrient Management Plan, it should be noted that CSF is essentially a vehicle for the delivery of
advice and is voluntary with limited incentive for many of the measures actually required in
practice. To achieve greater uptake of measures would appear to require this, possibly alongside an
enhanced regulatory framework.
5.4.4 Planning authorities could support the delivery of the interim plan through, for example, the
provision of an officer (see section 5.5. below) to work with CSF staff, to oversee the delivery of the
plan through utilising existing relationships between CSF officers and farmers (see Section 5.5). A
crucial first step will be early engagement with CSF staff; they will have local knowledge of where in
the catchment measures are likely to be most effective, and which farmers are likely to be receptive
to engagement with the interim plan.
5.4.5 It is possible that provisions could be agreed to develop the CSF project in ways that help to deliver
measures in the IDP. Further discussion on funding and the scope of this work would be required
to take this option forward.
Natural England work
5.4.6 Natural England are engaged in a number of initiatives either in the Avon catchment, or potentially
of relevance to ongoing work in the catchment. Of particular note is a natural capital opportunity
mapping project (including the use of SciMap modelling, the flow pathway tool, Lidar, and outputs
from Hampshire Avon Model) that would help to improve the targeting of mitigation and to
identify a mosaic of semi-natural wetland habitats in the catchment.
Wessex Chalk Stream and Rivers Trust
5.4.7 Wessex Chalk Stream and Rivers Trust are pursuing an initiative to provide CSF-type advice in the
Nadder sub-catchment. This will not necessarily focus on agricultural mitigation, but on sediment
and nutrient enrichment, and is therefore relevant to initiatives to reduce phosphorus in the wider
Avon. The intention is to work with Farming Wildlife Action Group South West (FWAG-SW) , who
could be a delivery partner for the IDP in their own right.
Landscape Enterprise Networks (LENs)
5.4.8 The Landscape Enterprise Networks (LENs) initiative will bring businesses in the catchment
together, to identify risks and assets to their business, find areas of common ground and work
together to find solutions. LENs are currently working in the catchment with Wessex Water,
Frontier Agriculture, Qinetiq and other businesses, with an initial focus on reducing phosphorus
loads to the catchment. Natural England, the Blacksheep Consultancy and the Game and Wildlife
Conservation Trust are engaged with the initiative to facilitate a pilot scheme, working with groups
of farmers, “Cluster Farms”, to define ‘Whole Landscape Plans that can identify opportunities to
increase the environmental health of the landscape (including biodiversity, water quality and
access) but with a focus on finding solutions to reducing phosphorous.
5.4.9 The initiative has the potential to facilitate farmer-led action to invest in phosphorus reduction in
the Avon, but is at an early stage.
Offset trading
5.4.10 ‘Off-set trading’ by collaboration between Wessex Water and Local Authorities is potentially a very
effective means to deliver land use/management measures, developing the model of the Poole
Harbour nitrogen offset project.

50 © Wood Environment & Infrastructure Solutions UK Limited
January 2019
Doc Ref. 41031rr007i3
5.4.11 Wessex Water are investigating the feasibility of a phosphorus trading scheme, and will be running
a pilot scheme in 2019, followed by roll-out in the Tone, Parrett and Stour in AMP7. Options for the
remainder of the Wessex region (including the Hants Avon) are still being considered.
5.4.12 Such a scheme offers significant benefits through wider stakeholder engagement and efficiencies in
determining the most appropriate and cost-effective combinations of measures.
Developer unilateral undertakings
5.4.13 Use of s106 funding to bring forward STW improvements ahead of the AMP process could enable
treatment to a higher quality than at present. Although this measure will be largely superseded by
the ODI (if adopted), it can also act as a contingency measure should the ODI not be adopted. It
would require support from developers willing to support forward funding, and would require an
approval process outside the Price Review.
Infrastructure charge discount
5.4.14 To incentivise measures within development, the Water Company provides a 100% environmental
discount on infrastructure charge for development that is phosphate neutral at source or meets
high standards of on-site measures.
5.5 Interim Delivery Plan
Achieving phosphorus neutrality – to March 2020
5.5.1 The Interim Delivery Plan (IDP) should deliver on-site measures to reduce the phosphorus loading
to the River Avon SAC arising from housing development, and catchment measures to mitigate the
residual loading from development.
5.5.2 The analysis presented in Sections 3 and 4 demonstrate that the level of mitigation required to
achieve P-neutrality in FY2018/19 and FY2019/20 can be achieved through a combination of on-site
and catchment measures, although the interim delivery plan cannot specify exactly which measures
should be implemented and where (this will need to form the basis of further work – see ‘delivering
the plan’ below.). Annual monitoring will refine the P load reductions that need to be achieved.
Sensitivity analysis shows how forecasts may vary and has helped to estimate the likely impacts of
the likeliest factors anticipated as an influence.
5.5.3 Based on the high level figures presented here, those measures that seem the most promising and
provide mitigation for 155 kg-P/year would be :
Wetlands
5.5.4 Installing wetlands on 12 dairy farms, each achieving a reduction in P export from 26 kg-
P/farm/year, to 13 kg-P/farm/year (i.e. 50% reduction) would yield a total reduction in loading of
156 kg-P/year. There are an estimated 100 intensive grazing holdings in the Avon catchment.
Estimated cost would be £120,000 (one-off) plus ongoing maintenance costs. Amortised over 10
years, and assuming £2000/year operational costs yields an EAC of £16,400/year. As noted in
Section 3, the actual reduction in P load that wetlands can achieve could be greater than 50%, so
this represents a conservative estimate.

51 © Wood Environment & Infrastructure Solutions UK Limited
January 2019
Doc Ref. 41031rr007i3
Changing land use
5.5.5 Changing land use from intensive grazing to extensive grass production on 7 farms would yield a
reduction in catchment P load of 23 kg/farm/year, or 161 kg-P/year. Estimated cost would be
£86,240 per year.
On-site wastewater treatment
5.5.6 A combination of on-site wastewater treatment works with additional treatment by wetlands to
reduce the requirement to mitigate P loads from growth, and in-catchment measures to provide
the required level of mitigation.
5.5.7 As an illustration, on-site treatment to an effluent quality of 0.1 mg-P/l for a population of 5000
people (the estimated population growth to March 2020) would generate a need to mitigate 20 kg-
P/year. Installing farm wetlands on 2 dairy farms would achieve an estimated reduction in
catchment P load of 26 kg-P/year. The approximate cost might be 25 Package Treatment Plants
each serving 200 people at £30k each, plus 25 large wetland installations at £20k each, giving a
total capital cost of £1,250,000. This would be a one-off cost, with an Equivalent Annualised Cost
(EAC) over 20 years of £88,000/year. There would also be some ongoing maintenance costs.
Achieving phosphorus neutrality – to 2025
5.5.8 It is shown in Section 2 that reductions in diffuse P export from development on greenfield sites will
mitigate the increase in P loads from unsewered development, and no further mitigation would be
required beyond 2020.
5.5.9 This Outcome Delivery Incentive (ODI) commits Wessex Water to maintaining levels of phosphate
discharge to the R Avon SAC to the average level of the last five years. This would operate over the
years 2020-2025. If the ODI is not put fully into place, there will be a need to mitigate up to
approximately 220 kg-P/year in 2021, rising to 545 kg-P/year in 2025.
5.5.10 The most effective means of achieving these large reductions would be through reducing the
amount of mitigation required elsewhere, either through on-site treatment with tertiary treatment
to reduce the P load discharged to the environment, or through connection to a Wessex Water
STW, with improvements to treatment funded via one of the delivery mechanisms identified above
(e.g. developer unilateral undertakings).
5.5.11 By 2020 it will be necessary to review the calculated P load from new development taking into
account the actual performance of Wessex Water STWs, bearing in mind that some assets already
perform to a higher standard than the 0.9 mg-P/l assumed in the MoU methodology. Depending
on to which STW the new developments will be connected, the load requiring mitigation could be
lower than estimated here.
5.5.12 In-catchment measures with prospects for achieving mitigation of 545 kg-P/year include:
Wetlands on farms
5.5.13 Wetlands on farms in the lower catchment (on heavier soils). Using the baseline figure of 136 kg-
P/year diffuse export (winter combinable + pig manure farms) and assuming wetlands can reduce
this by 50%, yields a reduction of 68 kg-P/farm/year. Wetlands would be required on 8 farms
(based on the Farmscoper generic farms). Agricultural census data indicates that there are 17
arable holdings in the Lower Avon waterbody, and also some pig farms in the lower catchment.
Assuming capital costs of £20,000 per wetland (costs will be higher because a higher level of
treatment is required) and £2000/year maintenance costs yields an EAC over 10 years of
£21,200/year.

52 © Wood Environment & Infrastructure Solutions UK Limited
January 2019
Doc Ref. 41031rr007i3
Changing land use
5.5.14 Changing land use from intensive grazing to extensive grass production on 24 farms would yield a
reduction in catchment P load of 23 kg/farm/year, or 552 kg-P/year. Estimated cost would be
£295,680 per year. Agricultural census data identifies 100 intensive grazing holdings in the Avon,
mainly in the upper catchment (Bourne and Wylye).
Delivering the plan
5.5.15 Delivering the plan will involve the following actions to be over seen by the working group:
5.5.16 Agreement to a ‘implementation plan’ setting work objectives and task for the year ahead. This
would investigate and deliver measures identified in the IDP and involve:
⚫ Identifying and gaining access to suitable locations
⚫ Testing feasibility of measures
⚫ Detailed design and construction
⚫ Agreements for ongoing management
⚫ Specifying a monitoring programme
⚫ Co-ordination of funding and resources
⚫ Liaison and co-ordination of the IDP with other delivery mechanisms and catchment initiatives
(see above)
5.5.17 It is recommended that the working group engage an officer with responsibility for delivering the
IDP and its implementation. The tasks of the IDP Officer would be:
⚫ To engage with developers to make them aware of the requirements of the IDP;
⚫ To provide assurance that calculations of P loads that will need to be mitigate from each
development are accurate and follow the correct methodology;
⚫ To engage with catchment stakeholders such as CSF officers and LENS, in order to identify
suitable sites for agricultural mitigation measures, where there are opportunities for reductions
in diffuse pollution and willing landowners;
⚫ To work with developers to identify options for mitigation, or to reduce the degree of
mitigation required through on-site measures;
⚫ To carry out site-specific calculations of the reductions in catchment P loads that can be
achieved through measures. This will be likely to involve modelling to estimate the
effectiveness of agricultural measures (e.g. Farmscoper) and site-specific calculations of P loads
from development sites taking into account any local mitigation;
⚫ To gather specialist advice to design and implement a monitoring programme to quantify the
reductions in P loads that have been achieved by measures and ensure that developments have
achieved P-neutrality.
5.5.18 In addition, the Working Group should continue to oversee the delivery of the IDP. The Working
Group should annually review rates of housing growth in the catchment against the projections
described in this report, and ensure that any significant deviations from the projections are
accounted for by the IDP. There are a number of studies planned or underway to establish
constructed wetlands to protect sites in the south of England, and the Working Group should
review the outcomes of these projects in order to build the evidence base that wetlands can

53 © Wood Environment & Infrastructure Solutions UK Limited
January 2019
Doc Ref. 41031rr007i3
achieve the reductions in phosphorus required to achieve phosphorus-neutral growth in the River
Avon SAC. The Working Group should also continue to monitor emerging science, and review the
suites of measures implemented through the IDP to ensure that the most effective measures are
considered.
5.6 Summary
⚫ It is estimated that a P load of around 85 kg P/year will need to be mitigated in FY 2018/2019,
and a P load of 155 kg P/year mitigated in FY 2019/2020;
⚫ On-site measures, especially if they include combinations of on-site sewage treatment and
wetlands, can significantly reduce the degree of mitigation required, but not eliminate the need
for mitigation;
⚫ Catchment measures targeted at diffuse agricultural sources can provide significant reductions
in P export. There will be a great deal of variability in P export between farms, however,
depending on farm type, soil type and nutrient management practices, and further work is
required to identify suitable sites for intervention;
⚫ The largest reductions are predicted to involve land use change. Taking land out of production
is predicted to result in large reductions in phosphorus loads, but is likely to be viable only if
the land is already owned by the LPA (i.e. public estate);
⚫ Changing from intensive to extensive land use can also result in significant reductions in P
export;
⚫ Farm scale constructed wetlands offer very significant potential reductions in agricultural P
export, but the detailed design and placement of the schemes will be important to maximise
effectiveness;
⚫ Similarly, large-scale, in-catchment wetlands could potentially offer significant reductions in
phosphorus in the catchment, although further work is required to explore the feasibility of this
option, and it is recommended that a study is commissioned to that end;
⚫ The estimated costs and reductions in P loads presented here are based on many assumptions
and generic farm types, and will be refined as the IDP as further work is carried out;
⚫ It will be important to capture local knowledge of the catchment when determining suitable
schemes to mitigate P increases from housing growth and the predicted reductions in
agricultural P loads that can be achieved with combinations of measures, particularly including
constructed wetlands. The analysis presented here suggests that delivery of the interim plan to
achieve phosphorus-neutrality is technically feasible.