River and Stream Water Quality Monitoring Report, Water ... · River and Stream Water Quality...
111
River and Stream Water Quality Monitoring Report Water Year 2013 November 2014 Publication No. 14-03-047
Transcript of River and Stream Water Quality Monitoring Report, Water ... · River and Stream Water Quality...
River and Stream Water Quality Monitoring Report
Water Year 2013
November 2014
Publication No. 14-03-047
Publication and website information This report is available on the Department of Ecology’s website at https://fortress.wa.gov/ecy/publications/SummaryPages/1403047.html Ecology’s River and Stream Water Quality Monitoring website is http://www.ecy.wa.gov/programs/eap/fw_riv/rv_main.html Finalized data for this project are available at Ecology’s Environmental Information Management (EIM) website www.ecy.wa.gov/eim/index.htm. Search Study ID, AMS001. Ecology’s Activity Tracker Code for this study is 01-600. Contact information For more information contact: Publications Coordinator Environmental Assessment Program P.O. Box 47600, Olympia, WA 98504-7600 Phone: (360) 407-6764 Washington State Department of Ecology - www.ecy.wa.gov o Headquarters, Olympia (360) 407-6000 o Northwest Regional Office, Bellevue (425) 649-7000 o Southwest Regional Office, Olympia (360) 407-6300 o Central Regional Office, Yakima (509) 575-2490 o Eastern Regional Office, Spokane (509) 329-3400 Cover photo: Mike McKay sampling at Trapper Creek.
Any use of product or firm names in this publication is for descriptive purposes only and does not imply endorsement by the author or the Department of Ecology.
Accommodation Requests: To request ADA accommodation including materials in a format
for the visually impaired, call Ecology at 360-407-6764. Persons with impaired hearing may call Washington Relay Service at 711. Persons with speech disability may call TTY at 877-833-6341.
Page 1
River and Stream Water Quality Monitoring Report
Water Year 2013
by
Markus Von Prause
Freshwater Monitoring Unit Environmental Assessment Program
Washington State Department of Ecology Olympia, Washington 98504-7710
Water Resource Inventory Area (WRIA) and 8-digit Hydrologic Unit Code (HUC) numbers for the study area: This is a statewide study.

Page 2
This page is purposely left blank
Page 3
Table of Contents Page
List of Figures and Tables....................................................................................................5
Abstract ................................................................................................................................7
Acknowledgements ..............................................................................................................8
Introduction ..........................................................................................................................9 Goals and Objectives ...................................................................................................10 Monitoring in Water Year 2013 ...................................................................................11
Methods..............................................................................................................................12 Sampling Network .......................................................................................................12 Sample Collection and Analysis ..................................................................................14
Program Changes .................................................................................................15 Continuous Temperature Monitoring ..........................................................................17 Continuous Oxygen Monitoring ..................................................................................18 Metals Monitoring .......................................................................................................19 Nitrogen in Puget Sound Area Rivers ..........................................................................20 Quality Assurance ........................................................................................................22
Continuous Temperature Monitoring ..................................................................23 Continuous Multiple Parameter Monitoring .......................................................24
Results and Discussion ......................................................................................................25 Monthly Ambient Monitoring......................................................................................25 Continuous Temperature Monitoring ..........................................................................28 Continuous Multiple Parameter Monitoring ................................................................30
Temperature .........................................................................................................31 pH ........................................................................................................................31
Metals Monitoring .......................................................................................................33 Nitrogen in Puget Sound Area Rivers ..........................................................................34
Concentration Trends ..........................................................................................34 Flux and Yield .....................................................................................................37
Quality Assurance ........................................................................................................46 Errors in EIM and Web Databases ......................................................................47 Comparison to Quality Control Requirements ....................................................47 Continuous Temperature Monitoring ..................................................................51 Continuous Multiple Parameter Monitoring .......................................................51
Conclusions and Recommendations ..................................................................................57
References ..........................................................................................................................59
Appendices .........................................................................................................................63 Appendix A. Station Description and Period of Record .............................................65 Appendix B. Historical Changes in Sampling and Laboratory Procedures, as well as Large-Scale Environmental Changes Potentially Affecting Water Quality ................87 Appendix C. Water Year 2013: Sources of Raw Data ................................................94
Page 4
Appendix D. Water Year 2013: Missing Data ............................................................96 Appendix E. Nitrogen Trends in Puget Sound Rivers ................................................97 Appendix F. Glossary, Acronyms, and Abbreviations .............................................107
Page 5
List of Figures and Tables Page
Figure Figure 1. Nitrate + nitrite-nitrogen (NO2+NO3) in the Deschutes River at E Street, Water
Years 1995-2013. ................................................................................................................ 36
Figure 2. NO2+NO3 yields at long-term Puget Sound area stations. ................................................ 38
Figure 3. Difference in summer NO2+NO3 yields for two time periods, 1995-2008 and 1995-2013. .......................................................................................................................... 42
Figure 4. NO2+NO3 entering Puget Sound from the 13 largest rivers. ............................................ 44
Figure 5. Total nitrogen (TN) flux entering Puget Sound from the 13 largest rivers. ....................... 45
Tables Table 1. Ecology stream ambient monitoring stations, Water Year 2013. ........................................ 13
Table 2. Water quality parameters monitored, Water Year 2013. ..................................................... 14
Table 3. Stations monitored for continuous oxygen, in Water Year 2013. ....................................... 19
Table 4. Bi-monthly sampling stations for metals, Water Year 2013. .............................................. 19
Table 5. Long-term ambient monitoring stations in Puget Sound. .................................................... 20
Table 6. Results for un-ionized ammonia ranging from 10-15% and greater than 15% of the chronic criteria, Water Year 2013. ....................................................................................... 26
Table 7. Water quality criteria in the 2006 water quality standards associated with aquatic life uses. ............................................................................................................................... 26
Table 8. Water quality criteria in the 2006 water quality standards associated with contact recreation. ............................................................................................................................ 27
Table 9. Basin stations with flow results not available. ..................................................................... 27
Table 10. Temperature summary, Water Year 2013 (°C). ................................................................. 29
Table 11. Stations exceeding the 13 ºC supplemental temperature criterion, Water Year 2013 (Payne, 2006). .................................................................................................................... 30
Table 12. Five stations with the warmest maximum temperatures in Water Year 2013 and the maximum temperatures at those stations since Water Year 2010 (ºC). ...................... 30
Table 13. 7-DADMin oxygen and 7-DADMax temperature and pH compared to water quality criteria, Water Year 2013. ..................................................................................... 32
Table 14. Metals results exceeding 2006 water quality criteria, Water Year 2013. .......................... 33
Table 15. Statistically significant (p<0.05)trends in flow, TN, and NO2+NO3, Water Years 1995-2013. ......................................................................................................................... 35
Page 6
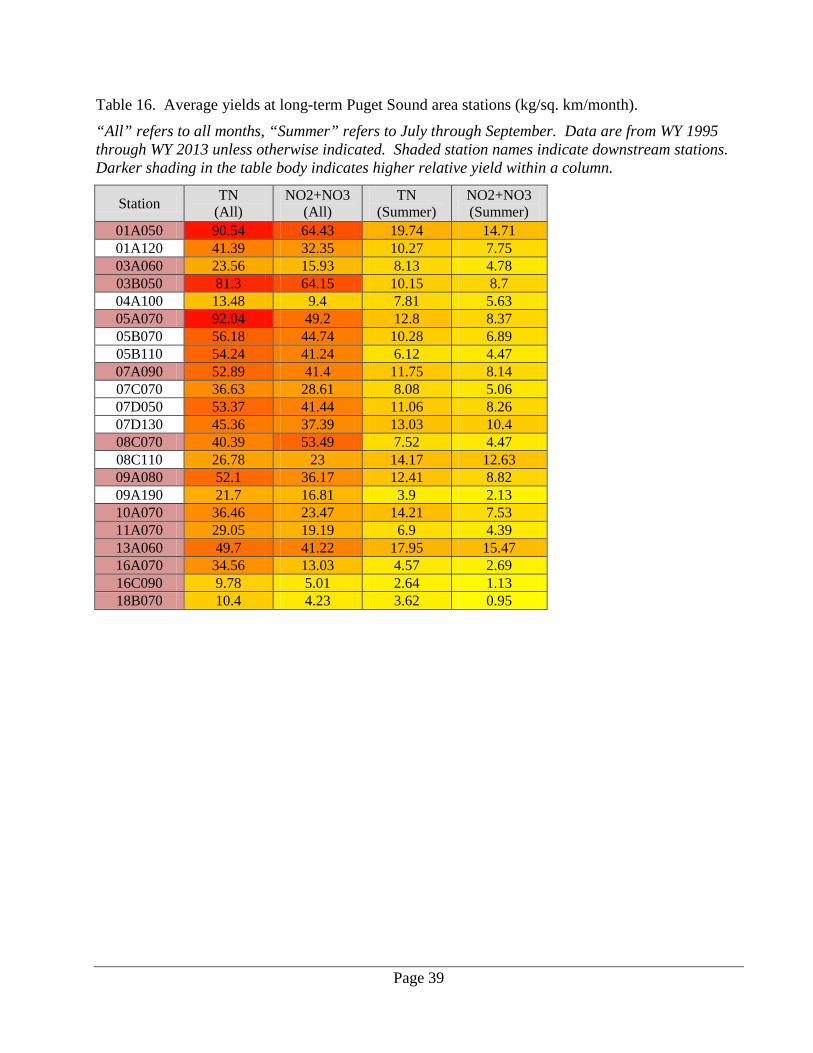
Table 16. Average yields at long-term Puget Sound area stations. ................................................... 39
Table 17. Average summer (July through September) NO2+NO3 yields and yield differences at long-term Puget Sound area stations ......................................................... 40
Table 18. Trends in TN and NO2+NO3 yields, 1995-2013. ............................................................. 41
Table 19. Flux at long-term Puget Sound stations . ........................................................................... 43
Table 20. Results qualified by Manchester Laboratory as being below the reporting limit. ............. 46
Table 21. Root mean square (RMS) of the standard deviation of sequential samples, field splits, and laboratory splits. ............................................................................................... 48
Table 22. Average relative standard deviation (RSD) of replicate samples collected, Water Year 2013. ......................................................................................................................... 49
Table 23. Results of field process blank (de-ionized water) samples. ............................................... 50
Table 24. Quality control (QC) results from continuous multiple parameter monitoring. ................ 53
Page 7
Abstract The Washington State Department of Ecology (Ecology) collected monthly water quality data at 91 stream monitoring stations during Water Year 2013 (October 1, 2012 through September 30, 2013). We also collected 30-minute interval temperature data at 25 stations, mostly from early July through September 2013, and year-round temperature data from 9 of those stations. Finally, we also maintained a continuous oxygen monitoring program at 8 sites. The principal goals of our ongoing program are to monitor trends in water quality of rivers and streams in Washington State, support a probabilistic monitoring program (Merritt, 2006), and support Clean Water Act Section 303(d) reporting. This report documents methods and data quality for Water Year 2013. This report includes:
• A continued trend analysis from Hallock (2009a) for nitrogen concentrations and yields for major river systems residing within the Puget Sound region.
• A quality control evaluation of data collection for continuous water quality information using multi-parameter (oxygen, temperature, pH, and conductivity) instruments.
A description of Ecology’s long-term monitoring program and access to historical data can be found on Ecology’s River and Stream Water Quality Monitoring website at www.ecy.wa.gov/programs/eap/fw_riv/rv_main.html
Page 8
Acknowledgements The success of the Water Year 2013 ambient monitoring program, and the quality of the data, are attributable to the following people:
• Our dedicated monitoring staff spent long hours working in all kinds of weather, traffic, and road conditions. Without this commitment, Appendix D would be much longer. Water Year 2013 samplers (and their lifetime sample counts, since we began keeping track) were: Bill Ward (3944), Casey Clishe (1103), Dan Dugger (824), Howard Christensen (544), Mike Anderson (667), Brain Gallagher (249), Urmos-Berry (89), and Markus Von Prause (83).
• Bill Ward conducted the continuous stream temperature monitoring project with regional assistance from Dan Dugger, Mike Anderson, Howard Christensen, Brian Gallagher, Tighe Stuart, Mike McKay, and Terri Hoselton.
• Brad Hopkins, Bill Ward, and Scott Collyard reviewed the draft report.
• Joan LeTourneau and Cindy Cook formatted and edited the final report. Ecology’s Manchester Environmental Laboratory staff did their usual meticulous best to provide high quality data with remarkably fast turn-around times. The folks there are a pleasure to work with, especially Nancy R., Leon, and Dean, our go-to people for process questions, sampling needs, and analytical questions, respectively.
• Nancy Rosenbower and Leon Weiks performed sample coordination services with help from Deborah Clark, Susan Carrell, Rebecca Wood, and Crystal Bowlen.
• Dean Momohara supervised the Inorganics section. Dean was always responsive to our needs and willing to re-analyze samples if there were questions.
• Kim Archer, Daniel Baker, Heidi Chuhran, Crystal, and Susan performed general chemistry analyses.
• Edlin Limmer, supported by Susan, was responsible for the microbiology.
• Karin Feddersen provided Quality Assurance.
• Meredith Jones and Rebecca, supported by Dean, worked on low-level metals analyses.
• Leon and Dean provided transport services.
• Joel Bird managed the lab and kept everything working smoothly.
Page 9
Introduction The Washington State Department of Ecology (Ecology) and its predecessor agency have operated an ambient water quality monitoring program since 1959. Between 1995 and 2010, the basic program consisted of monthly water quality monitoring for conventional parameters at 62 long-term stations and 20 basin (rotating) stations on rivers and streams throughout Washington State. Beginning with Water Year (WY) 2011, we added more long-term stations and reduced the number of basin stations. Our data are provided free to the public and are widely used by academics, consultants, local governments, schools, and others interested in the quality of Washington’s flowing waters. Within Ecology, data generated by ambient monitoring are used to:
• Determine if waters are meeting standards or are in need of cleanup (e.g., www.ecy.wa.gov/programs/wq/303d/index.html).
• Identify trends in water quality characteristics (e.g., Hallock, 2005).
• Refine and verify Total Maximum Daily Load (TMDL) models.
• Develop water quality-based permit conditions. • Conduct site-specific evaluations (e.g., Hallock, 2004).
• Determine the effectiveness of TMDL implementation plans. A generalized assessment of water quality at particular stations is provided online (www.ecy.wa.gov/programs/eap/fw_riv/rv_main.html) in the form of a water quality index (WQI; Hallock, 2002). The WQI and trends at long-term stations are reported in Washington State Water Quality Conditions in 2005 based on Data from the Freshwater Monitoring Unit (Hallock, 2005). This report describes the WY 2013 monitoring program and discusses the quality of data collected in WY 2013. More detailed analyses and interpretations of ambient monitoring data are reported elsewhere (e.g., see our reports at www.ecy.wa.gov/programs/eap/fw_riv/rv_main.html). Other Ecology programs conduct some of their own analyses. For example, Ecology’s Water Quality Program applies its own data reduction procedures prior to producing Washington State's Water Quality Assessment [303(d) & 305(b) Report], which includes the list of waters needing to be cleaned up (www.ecy.wa.gov/programs/wq/303d/index.html).

Page 10
Goals and Objectives The primary goals of the River and Stream Ambient Monitoring Program are to monitor trends in the water quality of Washington’s rivers and streams, support a companion probabilistic biological monitoring program (Merritt, 2006), and support Clean Water Act Section 303(d) reporting. Beginning with WY 2011, we modified the objectives for basin stations and added a new station type. See Hallock (2011) for a description of our previous monitoring design; a white paper discussing the redesign of our monitoring objectives is available on request.
• Long-term station objectives are unchanged. Stations are monitored every year to track water quality changes over time (trends), assess inter-annual variability, and collect current water quality information. These stations are generally located near the mouths of major rivers, below major population centers, where major streams enter the state, or upstream from most anthropogenic (human-caused) sources of water quality problems.
• Basin stations are selected to support the “Water Quality Assessment” process and Clean Water Act (303(d)) listings (http://ecy.wa.gov/programs/wq/303d/index.html). Specific objectives are to: o Confirm current Category 5 (“Polluted waters”) listings. Some listings are based on old or
suspect data. Recent data of known quality will help remove waterbodies from the Category 5 list.
o Determine a category for currently unlisted waterbodies. o Better define current Category 5 listings. o Resolve Category 2 (“Waters of concern”) listings. Should they be Category 1 (“Meets
standards”) or Category 5? o Identify "high quality" Tier III waters.
• Sentinel Stations are “long-term” sites with the following objectives: o Support Ecology’s probabilistic “watershed health” monitoring program. o Characterize reference conditions. o Provide trend data for reference conditions. o Monitor climate change.
• Special project station objectives are unchanged. These stations are typically sampled to address a particular question, and they are usually supported by funding external to the ambient monitoring program. We may not sample these stations for the entire usual suite of parameters, or we may sample extra parameters. Special project stations will not necessarily represent typical water quality conditions.
Page 11
Monitoring in Water Year 2013 In WY 2013, we monitored 66 long-term, 11 basin, and 7 sentinel stations (84 total). In addition, we monitored 7 stations associated with special projects (with external funding). All of these stations are located in Ecology’s Southwest Region. All the special project stations were associated with the Intensively Monitored Watersheds (IMW) project (see www.ecy.wa.gov/programs/eap/imw). Besides routine grab-sample monitoring, we conducted the following activities:
• Collected 30-minute interval temperature data from about July through September 2013 at 25 long-term and basin stations (9 of the stations were year-round).
• Conducted every other month (bi-monthly) metals monitoring at 9 selected stations.
• Conducted continuous monitoring for temperature, dissolved oxygen, pH, and conductivity at 8 stations, including 6 stations in support of IMW work. Results were delivered in near-real-time to the Internet by satellite telemetry at all stations.
Page 12
Methods
Sampling Network The ambient monitoring network in WY 2013 consisted of monthly water collection at all stations. Ambient stations monitored during WY 2013 are listed in Table 1. Appendix A lists current and historical monitoring locations and the years they were monitored by Ecology and its predecessor agency. A description of our long-term monitoring program, access to most historical data, and previous annual reports can be found on Ecology’s Internet website at www.ecy.wa.gov under the “Environmental Assessment” program and “River and Stream Water Quality.”
Page 13
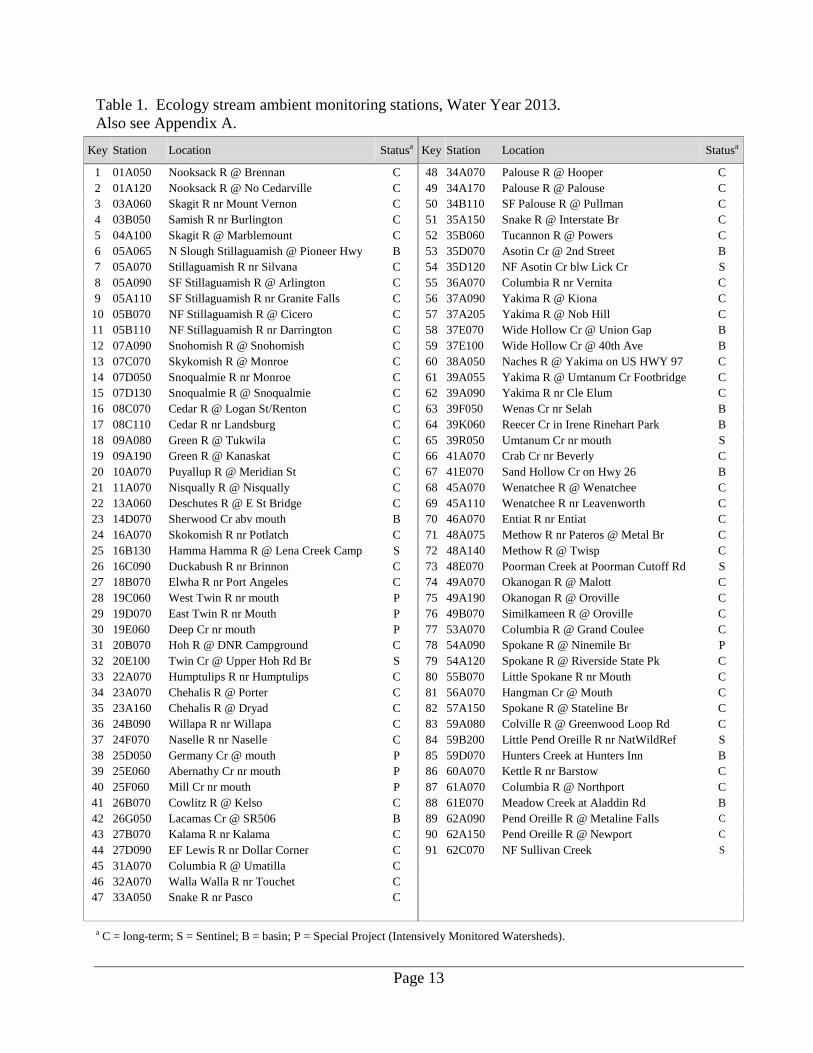
Table 1. Ecology stream ambient monitoring stations, Water Year 2013. Also see Appendix A.
Key Station Location Statusa Key Station Location Statusa
1 01A050 Nooksack R @ Brennan C 48 34A070 Palouse R @ Hooper C 2 01A120 Nooksack R @ No Cedarville C 49 34A170 Palouse R @ Palouse C 3 03A060 Skagit R nr Mount Vernon C 50 34B110 SF Palouse R @ Pullman C 4 03B050 Samish R nr Burlington C 51 35A150 Snake R @ Interstate Br C 5 04A100 Skagit R @ Marblemount C 52 35B060 Tucannon R @ Powers C 6 05A065 N Slough Stillaguamish @ Pioneer Hwy B 53 35D070 Asotin Cr @ 2nd Street B 7 05A070 Stillaguamish R nr Silvana C 54 35D120 NF Asotin Cr blw Lick Cr S 8 05A090 SF Stillaguamish R @ Arlington C 55 36A070 Columbia R nr Vernita C 9 05A110 SF Stillaguamish R nr Granite Falls C 56 37A090 Yakima R @ Kiona C
10 05B070 NF Stillaguamish R @ Cicero C 57 37A205 Yakima R @ Nob Hill C 11 05B110 NF Stillaguamish R nr Darrington C 58 37E070 Wide Hollow Cr @ Union Gap B 12 07A090 Snohomish R @ Snohomish C 59 37E100 Wide Hollow Cr @ 40th Ave B 13 07C070 Skykomish R @ Monroe C 60 38A050 Naches R @ Yakima on US HWY 97 C 14 07D050 Snoqualmie R nr Monroe C 61 39A055 Yakima R @ Umtanum Cr Footbridge C 15 07D130 Snoqualmie R @ Snoqualmie C 62 39A090 Yakima R nr Cle Elum C 16 08C070 Cedar R @ Logan St/Renton C 63 39F050 Wenas Cr nr Selah B 17 08C110 Cedar R nr Landsburg C 64 39K060 Reecer Cr in Irene Rinehart Park B 18 09A080 Green R @ Tukwila C 65 39R050 Umtanum Cr nr mouth S 19 09A190 Green R @ Kanaskat C 66 41A070 Crab Cr nr Beverly C 20 10A070 Puyallup R @ Meridian St C 67 41E070 Sand Hollow Cr on Hwy 26 B 21 11A070 Nisqually R @ Nisqually C 68 45A070 Wenatchee R @ Wenatchee C 22 13A060 Deschutes R @ E St Bridge C 69 45A110 Wenatchee R nr Leavenworth C 23 14D070 Sherwood Cr abv mouth B 70 46A070 Entiat R nr Entiat C 24 16A070 Skokomish R nr Potlatch C 71 48A075 Methow R nr Pateros @ Metal Br C 25 16B130 Hamma Hamma R @ Lena Creek Camp S 72 48A140 Methow R @ Twisp C 26 16C090 Duckabush R nr Brinnon C 73 48E070 Poorman Creek at Poorman Cutoff Rd S 27 18B070 Elwha R nr Port Angeles C 74 49A070 Okanogan R @ Malott C 28 19C060 West Twin R nr mouth P 75 49A190 Okanogan R @ Oroville C 29 19D070 East Twin R nr Mouth P 76 49B070 Similkameen R @ Oroville C 30 19E060 Deep Cr nr mouth P 77 53A070 Columbia R @ Grand Coulee C 31 20B070 Hoh R @ DNR Campground C 78 54A090 Spokane R @ Ninemile Br P 32 20E100 Twin Cr @ Upper Hoh Rd Br S 79 54A120 Spokane R @ Riverside State Pk C 33 22A070 Humptulips R nr Humptulips C 80 55B070 Little Spokane R nr Mouth C 34 23A070 Chehalis R @ Porter C 81 56A070 Hangman Cr @ Mouth C 35 23A160 Chehalis R @ Dryad C 82 57A150 Spokane R @ Stateline Br C 36 24B090 Willapa R nr Willapa C 83 59A080 Colville R @ Greenwood Loop Rd C 37 24F070 Naselle R nr Naselle C 84 59B200 Little Pend Oreille R nr NatWildRef S 38 25D050 Germany Cr @ mouth P 85 59D070 Hunters Creek at Hunters Inn B 39 25E060 Abernathy Cr nr mouth P 86 60A070 Kettle R nr Barstow C 40 25F060 Mill Cr nr mouth P 87 61A070 Columbia R @ Northport C 41 26B070 Cowlitz R @ Kelso C 88 61E070 Meadow Creek at Aladdin Rd B 42 26G050 Lacamas Cr @ SR506 B 89 62A090 Pend Oreille R @ Metaline Falls C 43 27B070 Kalama R nr Kalama C 90 62A150 Pend Oreille R @ Newport C 44 27D090 EF Lewis R nr Dollar Corner C 91 62C070 NF Sullivan Creek S 45 31A070 Columbia R @ Umatilla C 46 32A070 Walla Walla R nr Touchet C 47 33A050 Snake R nr Pasco C
a C = long-term; S = Sentinel; B = basin; P = Special Project (Intensively Monitored Watersheds).
Page 14
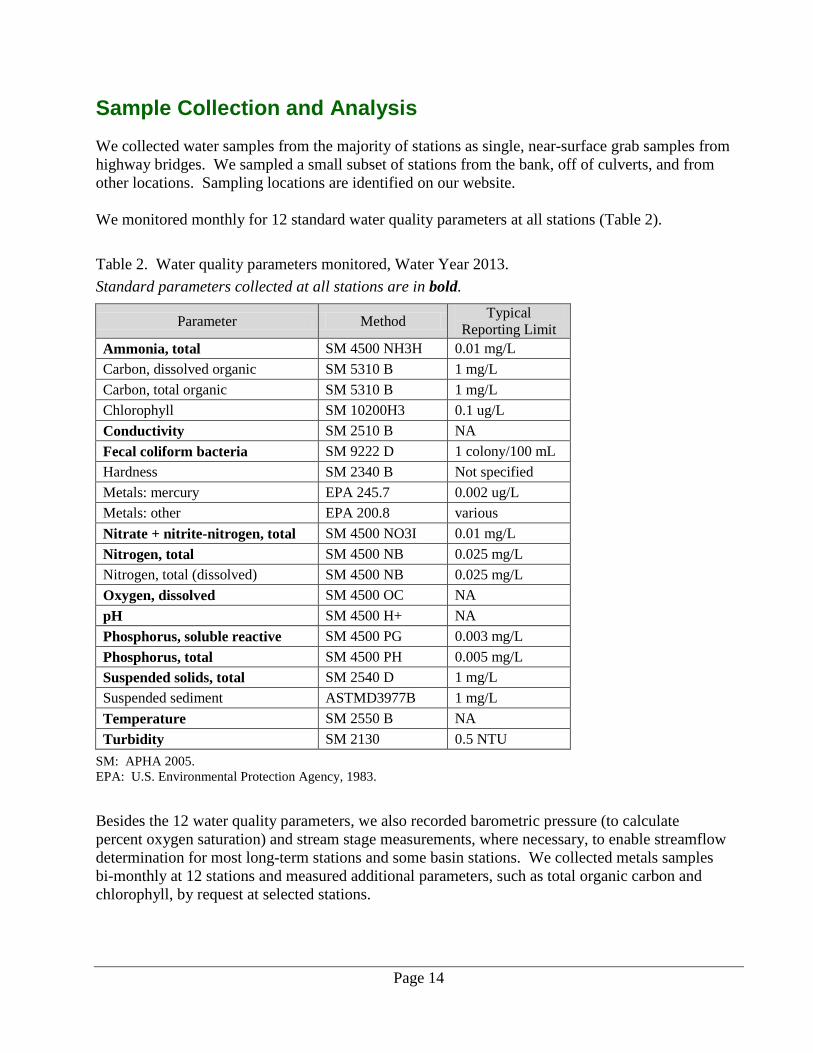
Sample Collection and Analysis We collected water samples from the majority of stations as single, near-surface grab samples from highway bridges. We sampled a small subset of stations from the bank, off of culverts, and from other locations. Sampling locations are identified on our website. We monitored monthly for 12 standard water quality parameters at all stations (Table 2).
Table 2. Water quality parameters monitored, Water Year 2013. Standard parameters collected at all stations are in bold.
Parameter Method Typical Reporting Limit
Ammonia, total SM 4500 NH3H 0.01 mg/L Carbon, dissolved organic SM 5310 B 1 mg/L Carbon, total organic SM 5310 B 1 mg/L Chlorophyll SM 10200H3 0.1 ug/L Conductivity SM 2510 B NA Fecal coliform bacteria SM 9222 D 1 colony/100 mL Hardness SM 2340 B Not specified Metals: mercury EPA 245.7 0.002 ug/L Metals: other EPA 200.8 various Nitrate + nitrite-nitrogen, total SM 4500 NO3I 0.01 mg/L Nitrogen, total SM 4500 NB 0.025 mg/L Nitrogen, total (dissolved) SM 4500 NB 0.025 mg/L Oxygen, dissolved SM 4500 OC NA pH SM 4500 H+ NA Phosphorus, soluble reactive SM 4500 PG 0.003 mg/L Phosphorus, total SM 4500 PH 0.005 mg/L Suspended solids, total SM 2540 D 1 mg/L Suspended sediment ASTMD3977B 1 mg/L Temperature SM 2550 B NA Turbidity SM 2130 0.5 NTU
SM: APHA 2005. EPA: U.S. Environmental Protection Agency, 1983.
Besides the 12 water quality parameters, we also recorded barometric pressure (to calculate percent oxygen saturation) and stream stage measurements, where necessary, to enable streamflow determination for most long-term stations and some basin stations. We collected metals samples bi-monthly at 12 stations and measured additional parameters, such as total organic carbon and chlorophyll, by request at selected stations.
Page 15
Sample collection and analytical methods are described in our standard operating procedures (SOPs; Ward, 2007; Ward, 2011), ambient monitoring quality assurance (QA) documents (Hallock and Ehinger, 2003; Hallock, 2012a; and Hopkins, 1996), and Manchester Environmental Laboratory’s Lab Users Manual (MEL, 2008). Further, to ensure sampler consistency, we use a new staff training program, do annual staff training, and conduct annual staff method audits (“ride-alongs”).
Program Changes
All long-term monitoring programs experience changes in sampling or analytical procedures that can potentially affect results. Normally, these changes are implemented to improve precision or reduce bias. Most changes will have only a minor effect on a synoptic analysis of the data, but even minor improvements in procedures should be considered when evaluating long-term trends. In WY 2013, we made no changes to collection, analytical, or quality control (QC) procedures that we believe will materially affect trends. However, we examined the following topics and made some minor modifications:
• We reviewed the overall data quality of continuous water quality data obtained during WY 2013. The objective of this review was to examine the proficiency and accuracy of QA procedures used when comparing discrete and continuous sample data for standard water quality parameters (i.e., conductivity, dissolved oxygen, pH, and temperature). Evaluation of the sources that contribute to error and bias between continuous and discrete sample results were also evaluated.
All known and suspected changes to methods and procedures during the history of the stream monitoring program, as well as large-scale environmental changes that may affect a trend analysis, are documented in Appendix B.
Continuous Multiple Parameter Monitoring Quality Assurance Review
The river and stream monitoring program has been collecting continuous water quality information since 2009. Methods and QA protocols for continuous monitoring are defined in Hallock (2009b). There are usually 35,000+ measurements obtained for each water quality parameter at one site during the course of an entire water year. Site selection for continuous monitoring at long-term and basin stations involve an annual scoping process (March-July) to evaluate the need for continuous monitoring. This is based of criteria defined in the primary goals of the River and Stream Ambient Monitoring Program objectives to support a companion probabilistic biological monitoring program (Merritt, 2006) and the Clean Water Act Section 303(d) reporting. In WY 2013, a total (n) of 707,320 water quality data points were obtained from all monitoring sites. A total of 694,718 (98%) water quality data points were obtained and reported as quantifiable measurements. However, 12,601 data points were unobtainable due to various factors (i.e., sensor failure resulting from physical variations in the stream channel). These estimates are based on initial continuous data returns via telemetry. Inaccuracies in the continuous data are reviewed annually as part of the water year QA review. All procedures associated with QC of continuous and discrete samples are described in Hallock and
Page 16
Ehinger (2003) and Hallock (2009b). If discrete samples and post-deployment calibrations indicate an offset or a linear drift, continuous data may be adjusted as necessary prior to evaluating against data quality objectives. Data adjustments are primarily based on the differences between continuous and discrete grab samples, while the relative standard deviation between continuous measurements and checks must be < 10% to pass QA criteria (Hallock, 2009b). Coefficients used for the continuous data adjustments are provided in the Multiple Parameters Monitoring section of the water year annual reports. Those who use continuous water quality information obtained from the river and stream monitoring program should be aware that there is a certain degree of error regarding data quality even after data adjustments are applied. Accurate water quality measurements can often be biased by many types of environmental factors (sedimentation/leaf letter deposition, bio-fouling), sensor calibration, or drift and field collection methods. The representativeness of the data is often determined by comparing continuous measurements. Inferring representative data accuracy derived from comparing continuous measurements and discrete samples are problematic because of:
• Small sample sizes (n) of discrete measurements are not adequate for comparisons to large sample sizes of continuous measurements for each parameter during a complete water year. One discrete sample is not a representative size to compare against 2974 continuous temperature, pH, conductivity, and dissolved oxygen measurements during a 30-day period. Furthermore, the variability dissolved oxygen measurements will vary by 1 mg/L during a 24-hour diurnal period for many of the sites surveyed.
• There are technological differences in manufacturers’ specifications between sensors used for continuous monitoring and field meters used for obtaining validation measurements.
Due to the volume of continuous water quality information obtained each year, the QC review can be time-consuming and requires specific evaluation procedures and criteria for different parameters. Furthermore, a thorough QC review requires many dedicated staff and additional resources to ensure the water quality data are accurately assessed and qualified with a certain degree of confidence before the data are made available to public entities to use for various purposes (i.e., baseline river/stream and watershed health monitoring, water quality modeling, effectiveness monitoring, and public outreach). Applying data adjustments may introduce some new bias to the overall data distribution during a deployment period. Furthermore, such a bias may also cause an un-representative estimate of water quality undergoing variations of natural processes within the stream channel (i.e., daily and seasonal diurnal variations). Based on the initial QA review during WY 2013, the following program improvements were implemented:
• Data adjustments for continuous data will no longer be applied within Ecology’s Freshwater Monitoring Unit databases containing continuous monitoring information.
Page 17
• Correction coefficients will continue to be provided as supplementary information within the monitoring section of the water year annual reports.
• Coefficients will be provided as supplementary information to “adjust” or “non adjust” continuous data based on the end users discretion.
Based on initial findings from the WY 2012 and WY 2013 annual review of continuous and discrete water quality results, the following improvements will be applied during the course of WY 2014:
• New follow-up examination of site maintenance procedures at continuous monitoring sites will be implemented. The purpose of this follow-up review is to minimize the potential for unreliable data to be embedded in the data set due to biofouling and calibration drift. This review will help address and track any reasons for data consistency issues from when the continuous datasondes (Hydrolabs) are cleaned and maintained.
• A tiered cleaning and maintenance system will be implemented. Under this new system, when Level 1 cleaning is completed, it will be the same as any other Level 1 cleaning at all continuous monitoring sites.
• Corrective action procedures will be proposed and evaluated in the field. A proposed corrective action may entail: if after the cleaning, the sonde readings fall outside a specified range, the sonde will be reported to field staff for a follow-up maintenance visit. A second more in-depth cleaning will be performed; if the sonde is reading within an acceptable range, it will be redeployed. If the sonde cannot be brought within the specified range, it will be removed and replaced with a lab calibrated sonde. This change will also include the addition of new field forms to document the process.
• New forms will be developed to track the equipment number used for each site, including calibration dates and calibration checks that have been done on the equipment. While a similar process has been in place in the past, the forms, data collection, and calibration checks will be refined to allow for easier tracking and consistency of data collected.
• The previous annual review of our continuous data records shows that dissolved oxygen measurement accuracy has been a little problematic parameter. Calibration methods and standards for the hand held-LDO electrodes will be refined during the course of WY 2014.
Continuous Temperature Monitoring This program’s goal is to collect summer, diel (24-hour) temperature data with 30-minute monitoring intervals at most long-term and current basin ambient monitoring stations, as well as at some special request stations. The data are primarily used for trend analyses and to determine the stream’s compliance with Washington State water quality standards. The scope of this program has been incrementally expanded, as resources and locations allow, with the establishment of more year-round temperature (and in some instances, seasonal oxygen) monitoring stations.
Page 18
We try to deploy the loggers that collect summer data by early July and retrieve them in late September. We also try to swap out the loggers at our year-round stations following a similar (June-September) schedule. We typically deploy two Onset StowAway TidbiT® temperature loggers at each site, one in water and one in air. All deployed loggers are shaded with a PVC pipe and installed in a location considered representative of the surrounding environment. We usually install stream temperature loggers about 6 inches off the stream bottom to minimize potential influence from groundwater inflow. Loggers are placed in a free-flowing location at a depth to avoid exposure to air resulting from low streamflows. As of WY 2012, all deployed loggers are set to standard time. Previously, we deployed loggers primarily during daylight savings time, and we used local time because it matched field sample times. However, we found that the new loggers would not follow local time; this caused year-round deployment sample time issues (local time has twice-yearly time shifts). In addition, we adjusted all our historical logger data sample times to standard time. Detailed protocols are found in Ward (2011), and QC requirements are found in Ward (2005).
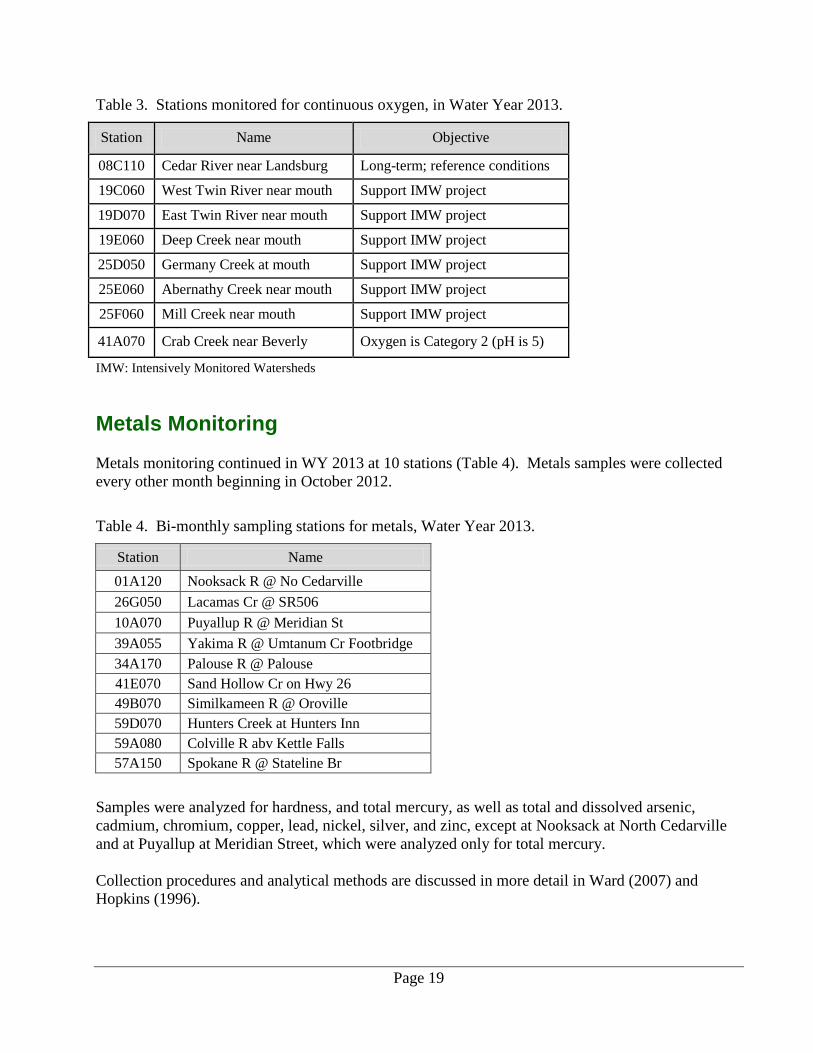
Continuous Oxygen Monitoring As with temperature, oxygen concentration changes in a sinusoidal pattern over a 24-hour period. Oxygen concentration is typically lowest in the morning and highest in the late afternoon. Usually daily lows are of the most interest because they have the most impact on aquatic life. Due to sampling logistics and laboratory sample holding time issues, our grab-sample monitoring program typically does a poor job of capturing daily low oxygen concentrations. To measure daily low oxygen concentrations, we need to collect diel oxygen data. We are primarily interested in annual lows (usually occurring in mid to late summer), but we are also interested in concentrations that coincide with the beginning and ending of salmonid spawning seasons, which vary according to location. In WY 2013, we deployed Hydrolab® Minisondes with optical oxygen sensors (LDOs) or In Situ® optical oxygen sensors (RDOs) at 8 stations, 6 in support of the IMW project and 2 to supplement grab sample monitoring (Table 3). All instruments were connected to near real-time telemetry stations. All instruments recorded temperature, oxygen, and conductivity readings every 15 minutes. One instrument also recorded pH at Cedar River near Landsburg (08C110). Our methods are described in Hallock (2009b). We hope to expand this program in the future; however, we have no dedicated funding and are dependent on available resources.
Page 19
Table 3. Stations monitored for continuous oxygen, in Water Year 2013.
IMW: Intensively Monitored Watersheds
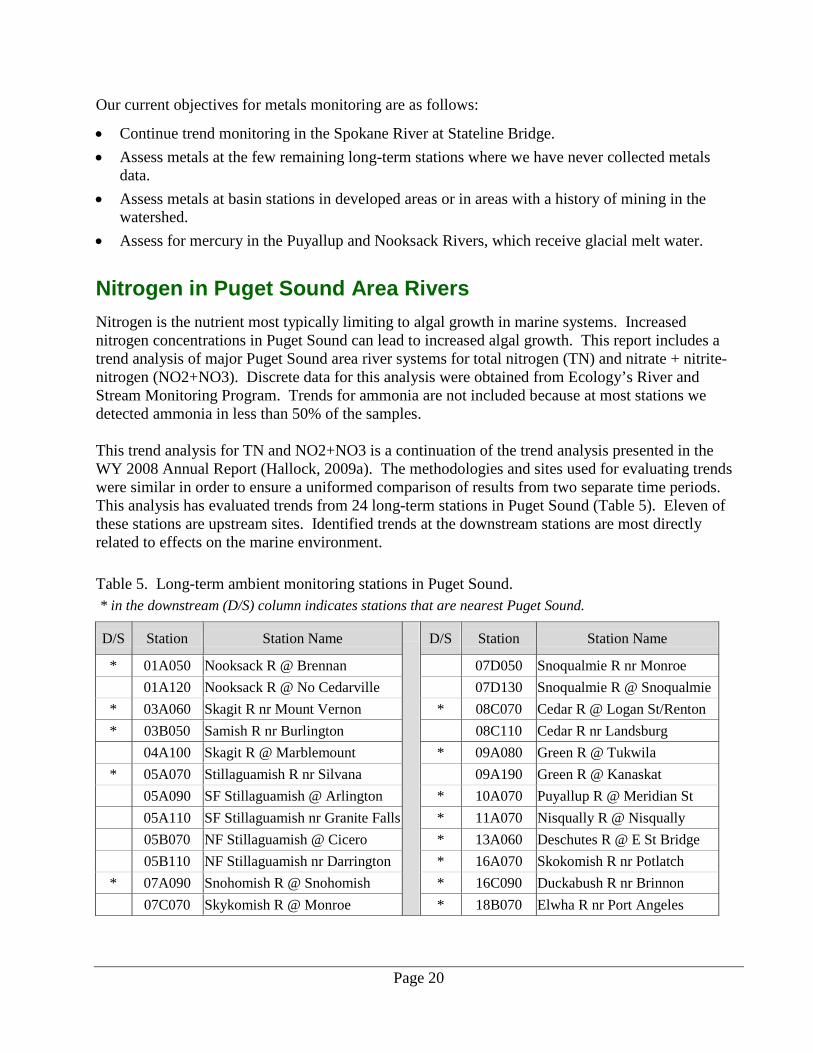
Metals Monitoring Metals monitoring continued in WY 2013 at 10 stations (Table 4). Metals samples were collected every other month beginning in October 2012.
Table 4. Bi-monthly sampling stations for metals, Water Year 2013.
Station Name 01A120 Nooksack R @ No Cedarville 26G050 Lacamas Cr @ SR506 10A070 Puyallup R @ Meridian St 39A055 Yakima R @ Umtanum Cr Footbridge 34A170 Palouse R @ Palouse 41E070 Sand Hollow Cr on Hwy 26 49B070 Similkameen R @ Oroville 59D070 Hunters Creek at Hunters Inn 59A080 Colville R abv Kettle Falls 57A150 Spokane R @ Stateline Br
Samples were analyzed for hardness, and total mercury, as well as total and dissolved arsenic, cadmium, chromium, copper, lead, nickel, silver, and zinc, except at Nooksack at North Cedarville and at Puyallup at Meridian Street, which were analyzed only for total mercury. Collection procedures and analytical methods are discussed in more detail in Ward (2007) and Hopkins (1996).
Station Name Objective
08C110 Cedar River near Landsburg Long-term; reference conditions 19C060 West Twin River near mouth Support IMW project 19D070 East Twin River near mouth Support IMW project 19E060 Deep Creek near mouth Support IMW project 25D050 Germany Creek at mouth Support IMW project 25E060 Abernathy Creek near mouth Support IMW project 25F060 Mill Creek near mouth Support IMW project
41A070 Crab Creek near Beverly Oxygen is Category 2 (pH is 5)
Page 20
Our current objectives for metals monitoring are as follows:
• Continue trend monitoring in the Spokane River at Stateline Bridge. • Assess metals at the few remaining long-term stations where we have never collected metals
data. • Assess metals at basin stations in developed areas or in areas with a history of mining in the
watershed. • Assess for mercury in the Puyallup and Nooksack Rivers, which receive glacial melt water.
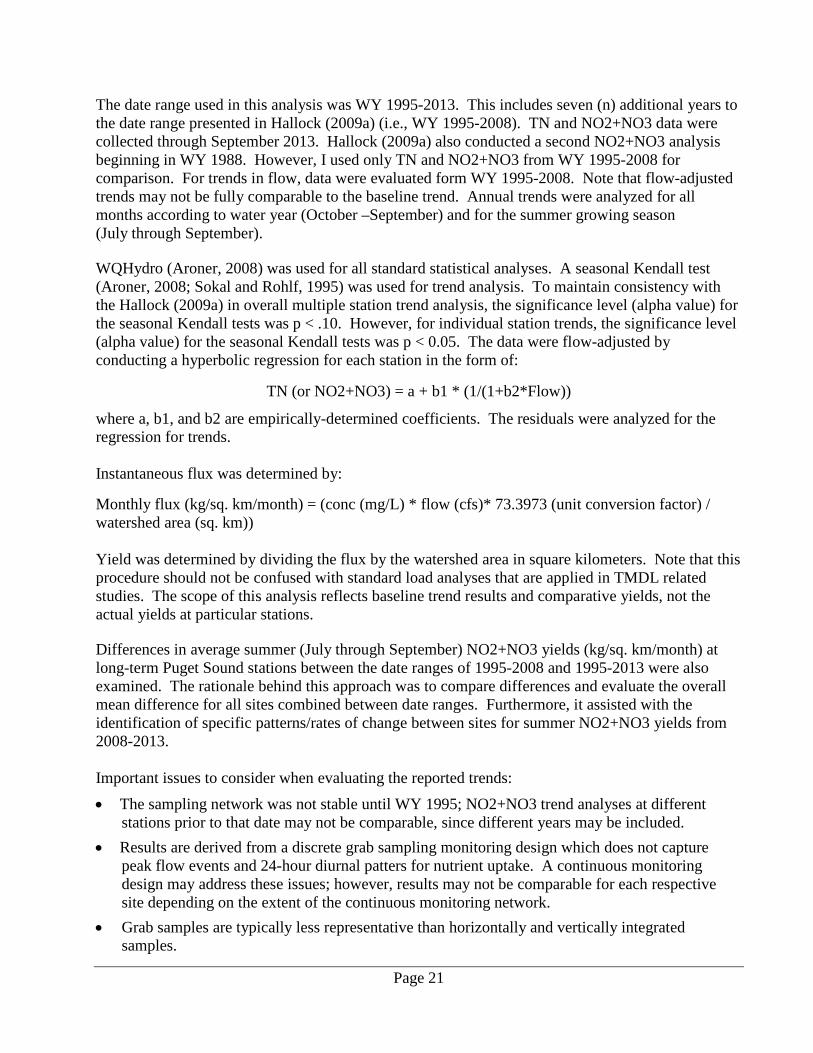
Nitrogen in Puget Sound Area Rivers Nitrogen is the nutrient most typically limiting to algal growth in marine systems. Increased nitrogen concentrations in Puget Sound can lead to increased algal growth. This report includes a trend analysis of major Puget Sound area river systems for total nitrogen (TN) and nitrate + nitrite-nitrogen (NO2+NO3). Discrete data for this analysis were obtained from Ecology’s River and Stream Monitoring Program. Trends for ammonia are not included because at most stations we detected ammonia in less than 50% of the samples. This trend analysis for TN and NO2+NO3 is a continuation of the trend analysis presented in the WY 2008 Annual Report (Hallock, 2009a). The methodologies and sites used for evaluating trends were similar in order to ensure a uniformed comparison of results from two separate time periods. This analysis has evaluated trends from 24 long-term stations in Puget Sound (Table 5). Eleven of these stations are upstream sites. Identified trends at the downstream stations are most directly related to effects on the marine environment.
Table 5. Long-term ambient monitoring stations in Puget Sound. * in the downstream (D/S) column indicates stations that are nearest Puget Sound.
D/S Station Station Name D/S Station Station Name
* 01A050 Nooksack R @ Brennan 07D050 Snoqualmie R nr Monroe
01A120 Nooksack R @ No Cedarville 07D130 Snoqualmie R @ Snoqualmie * 03A060 Skagit R nr Mount Vernon * 08C070 Cedar R @ Logan St/Renton * 03B050 Samish R nr Burlington 08C110 Cedar R nr Landsburg
04A100 Skagit R @ Marblemount * 09A080 Green R @ Tukwila * 05A070 Stillaguamish R nr Silvana 09A190 Green R @ Kanaskat
05A090 SF Stillaguamish @ Arlington * 10A070 Puyallup R @ Meridian St
05A110 SF Stillaguamish nr Granite Falls * 11A070 Nisqually R @ Nisqually
05B070 NF Stillaguamish @ Cicero * 13A060 Deschutes R @ E St Bridge
05B110 NF Stillaguamish nr Darrington * 16A070 Skokomish R nr Potlatch * 07A090 Snohomish R @ Snohomish * 16C090 Duckabush R nr Brinnon
07C070 Skykomish R @ Monroe * 18B070 Elwha R nr Port Angeles
Page 21
The date range used in this analysis was WY 1995-2013. This includes seven (n) additional years to the date range presented in Hallock (2009a) (i.e., WY 1995-2008). TN and NO2+NO3 data were collected through September 2013. Hallock (2009a) also conducted a second NO2+NO3 analysis beginning in WY 1988. However, I used only TN and NO2+NO3 from WY 1995-2008 for comparison. For trends in flow, data were evaluated form WY 1995-2008. Note that flow-adjusted trends may not be fully comparable to the baseline trend. Annual trends were analyzed for all months according to water year (October –September) and for the summer growing season (July through September). WQHydro (Aroner, 2008) was used for all standard statistical analyses. A seasonal Kendall test (Aroner, 2008; Sokal and Rohlf, 1995) was used for trend analysis. To maintain consistency with the Hallock (2009a) in overall multiple station trend analysis, the significance level (alpha value) for the seasonal Kendall tests was p < .10. However, for individual station trends, the significance level (alpha value) for the seasonal Kendall tests was p < 0.05. The data were flow-adjusted by conducting a hyperbolic regression for each station in the form of:
TN (or NO2+NO3) = a + b1 * (1/(1+b2*Flow))
where a, b1, and b2 are empirically-determined coefficients. The residuals were analyzed for the regression for trends. Instantaneous flux was determined by: Monthly flux (kg/sq. km/month) = (conc (mg/L) * flow (cfs)* 73.3973 (unit conversion factor) / watershed area (sq. km)) Yield was determined by dividing the flux by the watershed area in square kilometers. Note that this procedure should not be confused with standard load analyses that are applied in TMDL related studies. The scope of this analysis reflects baseline trend results and comparative yields, not the actual yields at particular stations. Differences in average summer (July through September) NO2+NO3 yields (kg/sq. km/month) at long-term Puget Sound stations between the date ranges of 1995-2008 and 1995-2013 were also examined. The rationale behind this approach was to compare differences and evaluate the overall mean difference for all sites combined between date ranges. Furthermore, it assisted with the identification of specific patterns/rates of change between sites for summer NO2+NO3 yields from 2008-2013. Important issues to consider when evaluating the reported trends: • The sampling network was not stable until WY 1995; NO2+NO3 trend analyses at different
stations prior to that date may not be comparable, since different years may be included. • Results are derived from a discrete grab sampling monitoring design which does not capture
peak flow events and 24-hour diurnal patters for nutrient uptake. A continuous monitoring design may address these issues; however, results may not be comparable for each respective site depending on the extent of the continuous monitoring network.
• Grab samples are typically less representative than horizontally and vertically integrated samples.
Page 22
• We do not specifically target collection of stormwater data, so nutrient concentrations related to runoff and flushing effects have a high probability of being missed.
However, the last two points are generally more problematic with sediment-associated parameters such as total phosphorus than with TN or NO2+NO3 (see Hallock, 2005b).
Quality Assurance The Freshwater Ambient Monitoring QA program can be broken out into two primary focus areas: (1) those that involve laboratory analysis of the samples and (2) those concerning the collection and processing of the water samples in the field. Ecology’s Manchester Environmental Laboratory QA program includes the use of QC charts, check standards, in-house matrix spikes, laboratory blanks, and performance evaluation samples. For a more complete discussion of laboratory QA, see Manchester Laboratory’s Quality Assurance Manual (MEL, 2012) and Lab Users Manual (MEL, 2008). The QA program for field sampling consisted of three parts: 1. Adherence to standard operating procedures for sample/data collection and periodic evaluation
of sampling personnel. 2. Consistent instrument calibration methods and schedules. 3. Collection of field QC samples during each sampling run. Our QA program is described in detail in Hallock and Ehinger (2003) and Hallock (2012). Three types of field QC samples were collected:
1. Duplicate (Sequential) Field Samples. These consisted of an additional sample collection made approximately 15-20 minutes after the initial collection at a station. These samples represent the total variability due to short-term, instream dynamics; sample collection and processing; and laboratory analysis.
2. Duplicate (Split) Field Samples. These consisted of one sample (usually the duplicate sequential sample) split into two containers that are processed as individual samples. We do this to eliminate instream and sample collection variability so we can assess the remaining variability attributable to field processing and laboratory analysis.
3. Field Blank Samples. These consisted of the submission and analysis of de-ionized water and are true field process blanks. The blank de-ionized water was poured into cleaned sample collection equipment, and the sampler simulated collecting a water sample, including lowering the sampling device to the water surface. The expected value for each analysis is the reporting limit for that analysis. Significantly higher results would indicate that sample contamination had occurred during field processing or during laboratory analysis.
We submit QC samples semi-blind to the laboratory. Samples are identified as QC samples, but sample type (duplicate, split, or blank) and station are not identified.
Page 23
In WY 2013, we processed 117 field QC samples for standard parameters: 12 field blanks, 54 field duplicates (sequential), and 51 field split samples. In addition, the laboratory conducted its own splits of some field QC samples. The central tendency of the variance of pairs of split field samples was summarized by calculating the square root of the mean of the sample-pair variances (root-mean-square; RMS). These figures provide an unbiased and higher estimate than other commonly used statistics (e.g., mean or median of the standard deviations). We use a two-tiered system to evaluate data quality of individual results based on field QC. The first tier consists of four automated checks: holding time, variability in field duplicates, reasonableness of the result, and the balance of nutrient species. Results exceeding pre-set limits are flagged. The second tier consists of a manual review of the data flagged in the first tier. Data are then coded from 1 through 9 (1 = data meet all QC requirements, 9 = data are unusable). Criteria for assigning codes are discussed in more detail in Hallock and Ehinger (2003). We do not routinely use or distribute data with quality codes greater than 4. Finally, data management includes verification at several stages:
• We verify field data entry quarterly by comparing field data forms to printouts from the database.
• At the end of the WY, we electronically compare data in Ecology’s EIM database, and in the database used for our web presentation, to the primary database.
• We visually check plots of streamflow versus stage height for anomalies. For flows determined independent of stage records, this method confirms the flow. (Most flows are derived from continuous recorders and based on date and time, not stage.) For flows based on stage, this method confirms that the flow was correctly determined from the flow curve, but the method cannot ensure that stage was correctly recorded.
Continuous Temperature Monitoring
The quality of the continuous temperature data was assessed by calibration checks using a certified reference thermometer before and after deployment. If a pre-survey calibration check indicated that a logger's accuracy was not within the required limits (0.2 °C) when compared to a certified reference thermometer, the logger was rejected and not deployed (Ward, 2005). If a logger failed a post-survey calibration check, the results may be rejected or we may adjust results if the change in bias between pre- and post-deployment calibration checks was <0.05 ºC (i.e., the pre-deployment bias was just within the required limits and the post-deployment bias was just outside the limits). All data sets are graphically reviewed to identify and delete anomalies. In addition, the river and stream monitoring database initiates automated QC checks and compares the data to the field temperature measurements taken at deployment and retrieval with a calibrated checked alcohol thermometer or thermistor. We also have the database assess the differences between the continuous results recorded by the logger and monthly results collected during grab-sample monitoring surveys. We upload all finalized results and summaries into our database, our webpage, and Ecology’s EIM database.
Page 24
Continuous Multiple Parameter Monitoring
We used Hallock (2009b) to assess the quality of data collected by multi-parameter probes. In most cases, we compared grab sample results to continuous results determined by linear interpolation between the recorded results preceding and following the grab sample time. All times were first adjusted to Pacific Standard Time. We performed the following QC checks:
• Examination of a plot of continuous data overlaid with grab sample data for signs of outliers (caused, for example, by signal noise) in the continuous data, or drift in the continuous data compared to the grab data.
• Calculation of the mean difference between continuous and grab sample results. If >2%, continuous results were adjusted for offset and drift, where such adjustment was appropriate as indicated by a plot of the data. This adjustment was made prior to conducting additional QC evaluations.
• Comparison of the average relative standard deviation (RSD) of continuous and grab sample data pairs to the precision requirements in Hallock (2009b).
• Comparison of individual differences between continuous and grab sample results to the accuracy requirements in Hallock (2009b).
Page 25
Results and Discussion The primary purpose of this report is to present the results of Ecology’s stream monitoring in WY 2013. The main body of the report describes the sampling program and interprets QC results. Appendix C describes where our monitoring data can be found. Raw data are available in computer formats on request and are posted on Ecology’s web pages (www.ecy.wa.gov/programs/eap/fw_riv/rv_main.html). Unpublished data are also available online but are considered "preliminary."
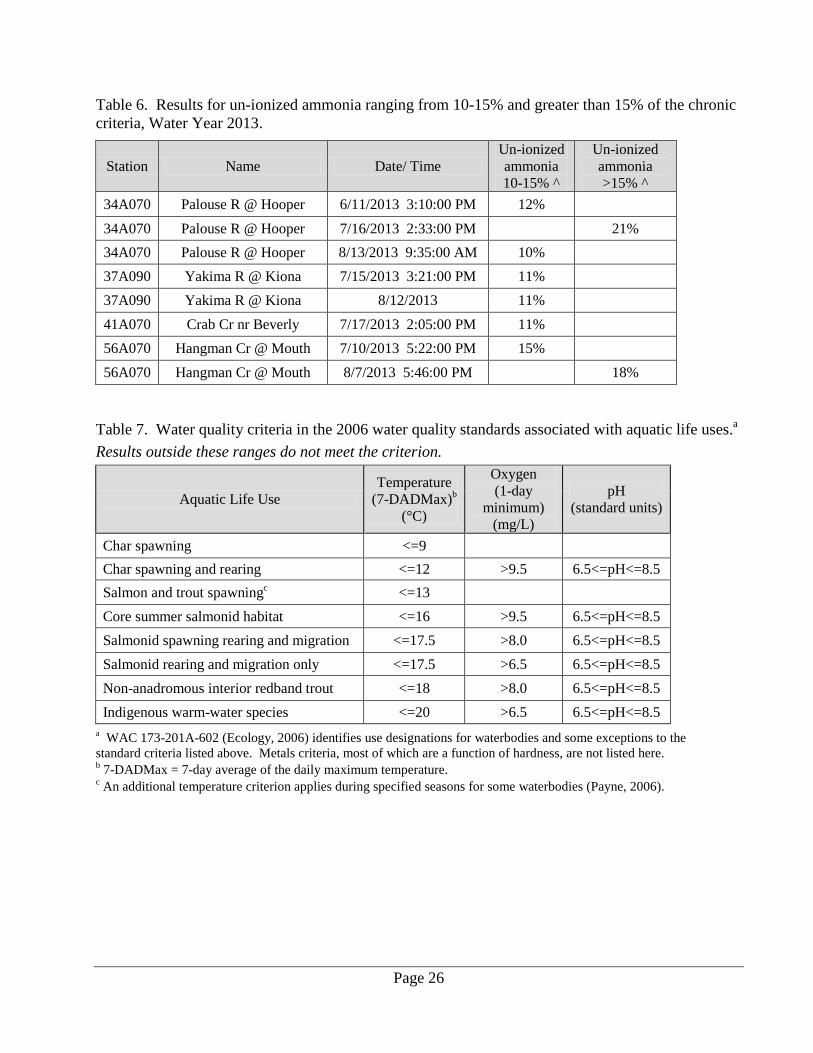
Monthly Ambient Monitoring A station-by-station data analysis is not within the scope of this report. Individual results not meeting the 2006 water quality criteria in Washington’s Water Quality Standards (WAC Chapter 173-201A), excluding un-ionized ammonia (NH3), are identified in reports on our website: www.ecy.wa.gov/apps/watersheds/riv/exceed. Un-ionized ammonia criteria are complicated to determine. Furthermore, the criteria are rarely exceeded (not met) in ambient waters. However, during the summer months some violations are likely to occur, resulting from seasonal variations in temperature and pH. In WY 2013, no samples exceeded the chronic results for the un-ionized ammonia criteria (i.e., NH3 > NH4+). Concentrations of un-ionized ammonia were greater than 15% of the chronic criterion at two stations: Palouse River @ Hooper (34A070; 21% of criterion) and Hangman Creek @ Mouth (56A070; 18% of criterion). Un-ionized ammonia results equal to or greater than 10% of the criteria are listed in Table 6. Effective December 20, 2006, Ecology adopted an aquatic life system for classifying the state’s waterbodies, dropping the AA, A, B, and C system in the 1997 standards (Ecology, 2006). Some of the numeric criteria from the new 2006 water quality standards are listed in Tables 7 and 8. The Ecology ambient monitoring program’s comparison of results to water quality criteria on our web pages is not a formal determination of water quality violations. Determining violations requires additional considerations such as human impact or multiple results not meeting a criterion, and in some cases continuous data are desired. (See www.ecy.wa.gov/programs/wq/303d//policy1-11Rev.html.) Of the nearly 13,000 possible standard water quality results in WY 2013, we missed only 115. A total of 14 missed samples were due to scheduling problems or delays that resulted in a station being dropped. Weather-related causes, such as the station being frozen or inaccessible due to snow, resulted in 26 missed samples. Other reasons for missed results included road construction or other access problems (45), and equipment failure (1). Finally, 18 results were missed due to miscellaneous reasons Appendix D gives more detailed explanations for each missed result.
Page 26
Table 6. Results for un-ionized ammonia ranging from 10-15% and greater than 15% of the chronic criteria, Water Year 2013.
Station Name Date/ Time Un-ionized ammonia 10-15% ^
Un-ionized ammonia >15% ^
34A070 Palouse R @ Hooper 6/11/2013 3:10:00 PM 12% 34A070 Palouse R @ Hooper 7/16/2013 2:33:00 PM 21% 34A070 Palouse R @ Hooper 8/13/2013 9:35:00 AM 10% 37A090 Yakima R @ Kiona 7/15/2013 3:21:00 PM 11% 37A090 Yakima R @ Kiona 8/12/2013 11% 41A070 Crab Cr nr Beverly 7/17/2013 2:05:00 PM 11% 56A070 Hangman Cr @ Mouth 7/10/2013 5:22:00 PM 15% 56A070 Hangman Cr @ Mouth 8/7/2013 5:46:00 PM 18%
Table 7. Water quality criteria in the 2006 water quality standards associated with aquatic life uses.a Results outside these ranges do not meet the criterion.
Aquatic Life Use Temperature
(7-DADMax)b
(°C)
Oxygen (1-day
minimum) (mg/L)
pH (standard units)
Char spawning <=9 Char spawning and rearing <=12 >9.5 6.5<=pH<=8.5 Salmon and trout spawningc <=13 Core summer salmonid habitat <=16 >9.5 6.5<=pH<=8.5 Salmonid spawning rearing and migration <=17.5 >8.0 6.5<=pH<=8.5 Salmonid rearing and migration only <=17.5 >6.5 6.5<=pH<=8.5 Non-anadromous interior redband trout <=18 >8.0 6.5<=pH<=8.5 Indigenous warm-water species <=20 >6.5 6.5<=pH<=8.5
a WAC 173-201A-602 (Ecology, 2006) identifies use designations for waterbodies and some exceptions to the standard criteria listed above. Metals criteria, most of which are a function of hardness, are not listed here. b 7-DADMax = 7-day average of the daily maximum temperature. c An additional temperature criterion applies during specified seasons for some waterbodies (Payne, 2006).
Page 27
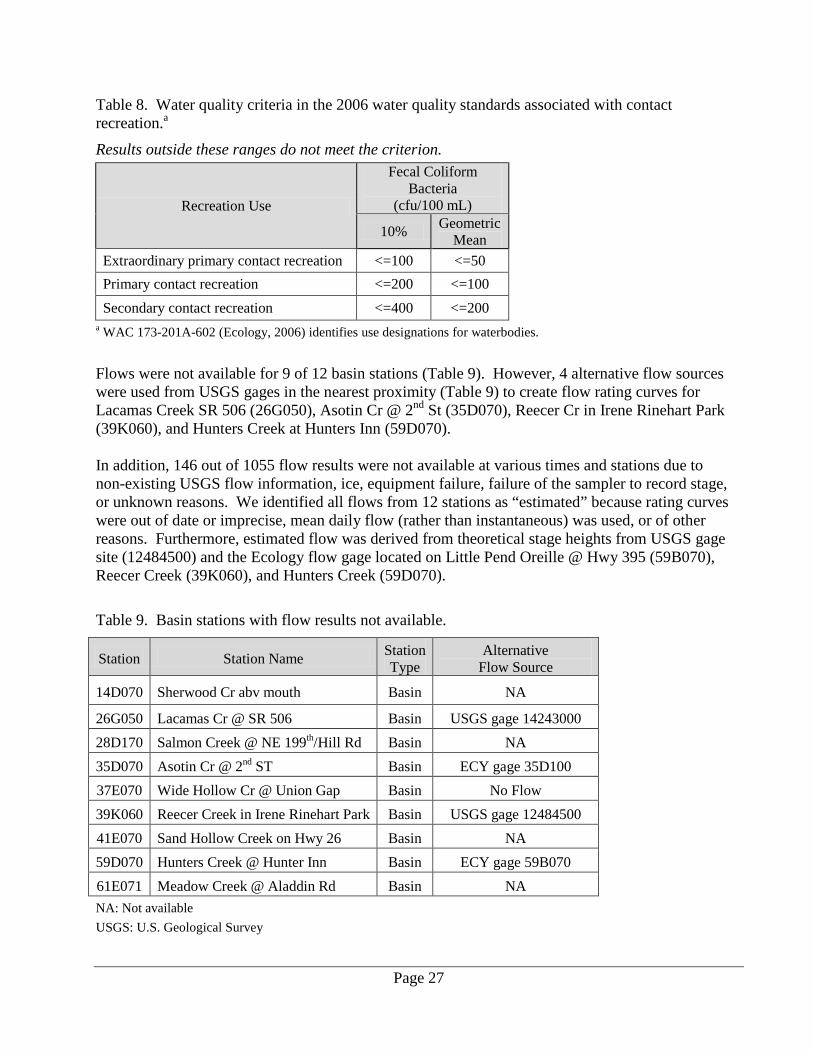
Table 8. Water quality criteria in the 2006 water quality standards associated with contact recreation.a
Results outside these ranges do not meet the criterion.
Recreation Use
Fecal Coliform Bacteria
(cfu/100 mL) 10% Geometric
Mean Extraordinary primary contact recreation <=100 <=50 Primary contact recreation <=200 <=100 Secondary contact recreation <=400 <=200
a WAC 173-201A-602 (Ecology, 2006) identifies use designations for waterbodies.
Flows were not available for 9 of 12 basin stations (Table 9). However, 4 alternative flow sources were used from USGS gages in the nearest proximity (Table 9) to create flow rating curves for Lacamas Creek SR 506 (26G050), Asotin Cr @ 2nd St (35D070), Reecer Cr in Irene Rinehart Park (39K060), and Hunters Creek at Hunters Inn (59D070). In addition, 146 out of 1055 flow results were not available at various times and stations due to non-existing USGS flow information, ice, equipment failure, failure of the sampler to record stage, or unknown reasons. We identified all flows from 12 stations as “estimated” because rating curves were out of date or imprecise, mean daily flow (rather than instantaneous) was used, or of other reasons. Furthermore, estimated flow was derived from theoretical stage heights from USGS gage site (12484500) and the Ecology flow gage located on Little Pend Oreille @ Hwy 395 (59B070), Reecer Creek (39K060), and Hunters Creek (59D070).
Table 9. Basin stations with flow results not available.
Station Station Name Station Type
Alternative Flow Source
14D070 Sherwood Cr abv mouth Basin NA
26G050 Lacamas Cr @ SR 506 Basin USGS gage 14243000 28D170 Salmon Creek @ NE 199th/Hill Rd Basin NA 35D070 Asotin Cr @ 2nd ST Basin ECY gage 35D100 37E070 Wide Hollow Cr @ Union Gap Basin No Flow 39K060 Reecer Creek in Irene Rinehart Park Basin USGS gage 12484500 41E070 Sand Hollow Creek on Hwy 26 Basin NA 59D070 Hunters Creek @ Hunter Inn Basin ECY gage 59B070 61E071 Meadow Creek @ Aladdin Rd Basin NA NA: Not available USGS: U.S. Geological Survey
Page 28
Continuous Temperature Monitoring During WY 2013, our summer monitoring goals were met at 15 western Washington and 9 eastern Washington stations (Table 10). In addition, 8 of the western Washington stations and 1 of the eastern Washington stations were year-round deployments (September 2012 to September 2013). Unfortunately we lost water loggers at 4 western Washington stations and failed to have loggers deployed at several southeastern Washington stations due to a communication error. The seven-day average of the daily maximum temperature (7-DADMax) failed to meet the basic 2006 criteria at most stations (18 of 37 stations, 48%). Nine stations did not meet supplemental temperature criteria (Table 11). More stations would probably have failed the supplemental criteria, but deployment dates at most stations rarely include the beginning or ending of the supplemental season. Seasonal maximum temperatures have remained consistent over the previous two years. In WY 2012, maximum temperatures at the warmest 5 stations ranged from 23.9 to 29.3 ºC (Table 12). In WY 2013, maximum temperatures at the warmest five stations ranged from 23.4 to 27.4 ºC (Table 12).
Page 29
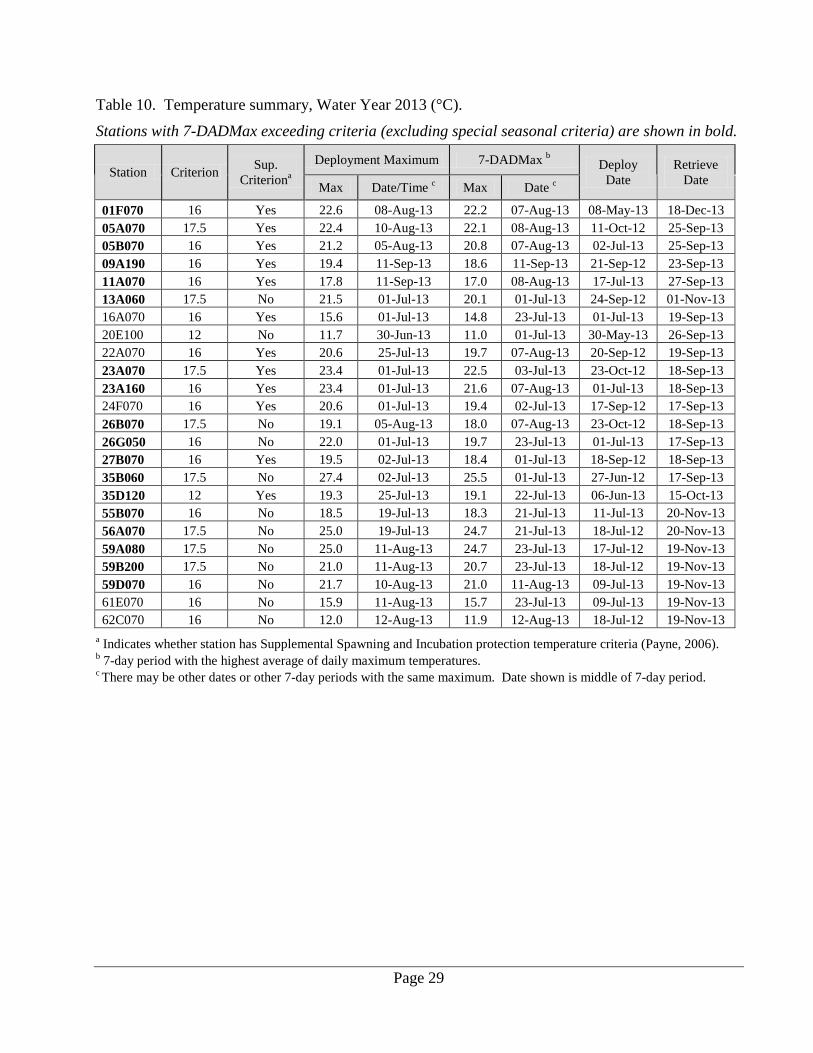
Table 10. Temperature summary, Water Year 2013 (°C).
Stations with 7-DADMax exceeding criteria (excluding special seasonal criteria) are shown in bold.
Station Criterion Sup. Criteriona
Deployment Maximum 7-DADMax b Deploy Date
Retrieve Date Max Date/Time c Max Date c
01F070 16 Yes 22.6 08-Aug-13 22.2 07-Aug-13 08-May-13 18-Dec-13 05A070 17.5 Yes 22.4 10-Aug-13 22.1 08-Aug-13 11-Oct-12 25-Sep-13 05B070 16 Yes 21.2 05-Aug-13 20.8 07-Aug-13 02-Jul-13 25-Sep-13 09A190 16 Yes 19.4 11-Sep-13 18.6 11-Sep-13 21-Sep-12 23-Sep-13 11A070 16 Yes 17.8 11-Sep-13 17.0 08-Aug-13 17-Jul-13 27-Sep-13 13A060 17.5 No 21.5 01-Jul-13 20.1 01-Jul-13 24-Sep-12 01-Nov-13 16A070 16 Yes 15.6 01-Jul-13 14.8 23-Jul-13 01-Jul-13 19-Sep-13 20E100 12 No 11.7 30-Jun-13 11.0 01-Jul-13 30-May-13 26-Sep-13 22A070 16 Yes 20.6 25-Jul-13 19.7 07-Aug-13 20-Sep-12 19-Sep-13 23A070 17.5 Yes 23.4 01-Jul-13 22.5 03-Jul-13 23-Oct-12 18-Sep-13 23A160 16 Yes 23.4 01-Jul-13 21.6 07-Aug-13 01-Jul-13 18-Sep-13 24F070 16 Yes 20.6 01-Jul-13 19.4 02-Jul-13 17-Sep-12 17-Sep-13 26B070 17.5 No 19.1 05-Aug-13 18.0 07-Aug-13 23-Oct-12 18-Sep-13 26G050 16 No 22.0 01-Jul-13 19.7 23-Jul-13 01-Jul-13 17-Sep-13 27B070 16 Yes 19.5 02-Jul-13 18.4 01-Jul-13 18-Sep-12 18-Sep-13 35B060 17.5 No 27.4 02-Jul-13 25.5 01-Jul-13 27-Jun-12 17-Sep-13 35D120 12 Yes 19.3 25-Jul-13 19.1 22-Jul-13 06-Jun-13 15-Oct-13 55B070 16 No 18.5 19-Jul-13 18.3 21-Jul-13 11-Jul-13 20-Nov-13 56A070 17.5 No 25.0 19-Jul-13 24.7 21-Jul-13 18-Jul-12 20-Nov-13 59A080 17.5 No 25.0 11-Aug-13 24.7 23-Jul-13 17-Jul-12 19-Nov-13 59B200 17.5 No 21.0 11-Aug-13 20.7 23-Jul-13 18-Jul-12 19-Nov-13 59D070 16 No 21.7 10-Aug-13 21.0 11-Aug-13 09-Jul-13 19-Nov-13 61E070 16 No 15.9 11-Aug-13 15.7 23-Jul-13 09-Jul-13 19-Nov-13 62C070 16 No 12.0 12-Aug-13 11.9 12-Aug-13 18-Jul-12 19-Nov-13
a Indicates whether station has Supplemental Spawning and Incubation protection temperature criteria (Payne, 2006). b 7-day period with the highest average of daily maximum temperatures. c There may be other dates or other 7-day periods with the same maximum. Date shown is middle of 7-day period.
Page 30
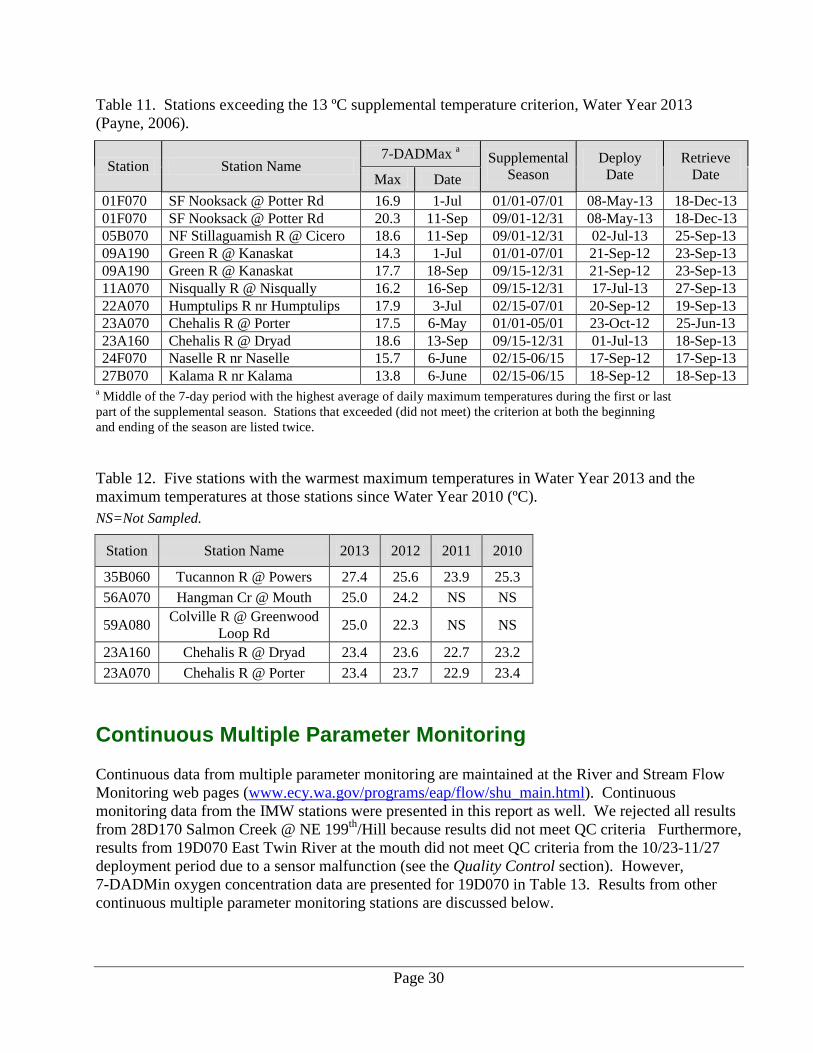
Table 11. Stations exceeding the 13 ºC supplemental temperature criterion, Water Year 2013 (Payne, 2006).
Station Station Name 7-DADMax a Supplemental
Season Deploy
Date Retrieve
Date Max Date 01F070 SF Nooksack @ Potter Rd 16.9 1-Jul 01/01-07/01 08-May-13 18-Dec-13 01F070 SF Nooksack @ Potter Rd 20.3 11-Sep 09/01-12/31 08-May-13 18-Dec-13 05B070 NF Stillaguamish R @ Cicero 18.6 11-Sep 09/01-12/31 02-Jul-13 25-Sep-13 09A190 Green R @ Kanaskat 14.3 1-Jul 01/01-07/01 21-Sep-12 23-Sep-13 09A190 Green R @ Kanaskat 17.7 18-Sep 09/15-12/31 21-Sep-12 23-Sep-13 11A070 Nisqually R @ Nisqually 16.2 16-Sep 09/15-12/31 17-Jul-13 27-Sep-13 22A070 Humptulips R nr Humptulips 17.9 3-Jul 02/15-07/01 20-Sep-12 19-Sep-13 23A070 Chehalis R @ Porter 17.5 6-May 01/01-05/01 23-Oct-12 25-Jun-13 23A160 Chehalis R @ Dryad 18.6 13-Sep 09/15-12/31 01-Jul-13 18-Sep-13 24F070 Naselle R nr Naselle 15.7 6-June 02/15-06/15 17-Sep-12 17-Sep-13 27B070 Kalama R nr Kalama 13.8 6-June 02/15-06/15 18-Sep-12 18-Sep-13
a Middle of the 7-day period with the highest average of daily maximum temperatures during the first or last part of the supplemental season. Stations that exceeded (did not meet) the criterion at both the beginning and ending of the season are listed twice.
Table 12. Five stations with the warmest maximum temperatures in Water Year 2013 and the maximum temperatures at those stations since Water Year 2010 (ºC). NS=Not Sampled.
Station Station Name 2013 2012 2011 2010 35B060 Tucannon R @ Powers 27.4 25.6 23.9 25.3 56A070 Hangman Cr @ Mouth 25.0 24.2 NS NS
59A080 Colville R @ Greenwood Loop Rd 25.0 22.3 NS NS
23A160 Chehalis R @ Dryad 23.4 23.6 22.7 23.2 23A070 Chehalis R @ Porter 23.4 23.7 22.9 23.4
Continuous Multiple Parameter Monitoring Continuous data from multiple parameter monitoring are maintained at the River and Stream Flow Monitoring web pages (www.ecy.wa.gov/programs/eap/flow/shu_main.html). Continuous monitoring data from the IMW stations were presented in this report as well. We rejected all results from 28D170 Salmon Creek @ NE 199th/Hill because results did not meet QC criteria Furthermore, results from 19D070 East Twin River at the mouth did not meet QC criteria from the 10/23-11/27 deployment period due to a sensor malfunction (see the Quality Control section). However, 7-DADMin oxygen concentration data are presented for 19D070 in Table 13. Results from other continuous multiple parameter monitoring stations are discussed below.
Page 31
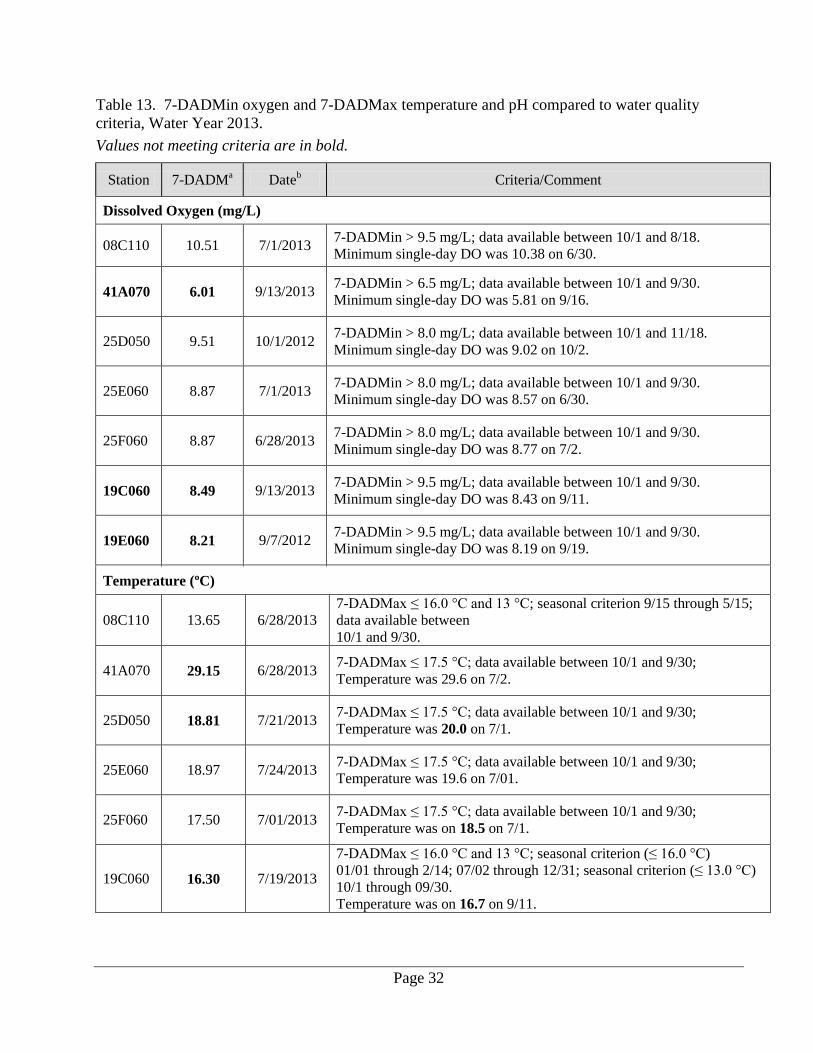
Dissolved Oxygen Four stations (08C110-Cedar R nr Landsburg, 25D050-Germany Cr @ mouth, 25E060-Abernathy Cr nr mouth, and 25F060-Mill Cr nr mouth) met criteria for 7-day averages of daily minimums (7-DADMin) for dissolved oxygen concentrations. Four stations (41A070-Crab Creek near Beverly, 19C060-West Twin River near mouth, 19D070-East Twin River near mouth, and 19E060-Deep Creek near mouth) did not meet criteria for 7-day averages of daily minimums (7-DADMin) of dissolved oxygen concentrations during the critical period (July-September), when the highest annual temperatures and lowest annual oxygen concentrations are expected (Table 13). Station 41A070-Crab Creek near Beverly had the lowest daily minimum dissolved oxygen concentration, 6.01 mg/L. As reported in 2012, the criterion (7-DADMin >6.5 mg/L) for station 41A070 is considerably low when compared to other stream segments within the Lower Crab Creek watershed. Currently, Lower Crab Creek is under a Category 2 listing for dissolved oxygen.
Temperature
7-DADMax for temperature was warmer than the basic criteria at 41A070-Crab Cr nr Beverly, 25D050-Germany Cr @ mouth, and 19C060-West Twin River at the mouth. Station 41A070-Crab Cr nr Beverly exceeded the 7-DADMax temperature criteria by 12.1 °C (Table 13). Five stations (08C110-Cedar R nr Landsburg, 25E060-Abernathy Cr nr mouth, 25F060-Mill Cr nr mouth, 19D070-East Twin R nr Mouth, 19E060-Deep Cr nr mouth) met seasonal criteria of daily maximums (7-DADMax) for temperature. One or more reaches of Germany Creek, Abernathy Creek, Mill Creek, and Crab Creek are already listed as Category 5 for temperature in the 2012 Water Quality Assessment.
pH
Station 08C110-Cedar River at Landsburg was the only station monitored for pH in WY 2013 (Table 13). This station met pH criteria (6.5 ≤ pH ≤ 8.5) from October 1 to August 18. The Individual daily maximum was 8.06 on April 2, 2013.
Page 32
Table 13. 7-DADMin oxygen and 7-DADMax temperature and pH compared to water quality criteria, Water Year 2013. Values not meeting criteria are in bold.
Station 7-DADMa Dateb Criteria/Comment
Dissolved Oxygen (mg/L)
08C110 10.51 7/1/2013 7-DADMin > 9.5 mg/L; data available between 10/1 and 8/18. Minimum single-day DO was 10.38 on 6/30.
41A070 6.01 9/13/2013 7-DADMin > 6.5 mg/L; data available between 10/1 and 9/30. Minimum single-day DO was 5.81 on 9/16.
25D050 9.51 10/1/2012 7-DADMin > 8.0 mg/L; data available between 10/1 and 11/18. Minimum single-day DO was 9.02 on 10/2.
25E060 8.87 7/1/2013 7-DADMin > 8.0 mg/L; data available between 10/1 and 9/30. Minimum single-day DO was 8.57 on 6/30.
25F060 8.87 6/28/2013 7-DADMin > 8.0 mg/L; data available between 10/1 and 9/30. Minimum single-day DO was 8.77 on 7/2.
19C060 8.49 9/13/2013 7-DADMin > 9.5 mg/L; data available between 10/1 and 9/30. Minimum single-day DO was 8.43 on 9/11.
19E060 8.21 9/7/2012 7-DADMin > 9.5 mg/L; data available between 10/1 and 9/30. Minimum single-day DO was 8.19 on 9/19.
Temperature (ºC)
08C110 13.65 6/28/2013 7-DADMax ≤ 16.0 °C and 13 °C; seasonal criterion 9/15 through 5/15; data available between 10/1 and 9/30.
41A070 29.15 6/28/2013 7-DADMax ≤ 17.5 °C; data available between 10/1 and 9/30; Temperature was 29.6 on 7/2.
25D050 18.81 7/21/2013 7-DADMax ≤ 17.5 °C; data available between 10/1 and 9/30; Temperature was 20.0 on 7/1.
25E060 18.97 7/24/2013 7-DADMax ≤ 17.5 °C; data available between 10/1 and 9/30; Temperature was 19.6 on 7/01.
25F060 17.50 7/01/2013 7-DADMax ≤ 17.5 °C; data available between 10/1 and 9/30; Temperature was on 18.5 on 7/1.
19C060 16.30 7/19/2013 7-DADMax ≤ 16.0 °C and 13 °C; seasonal criterion (≤ 16.0 °C) 01/01 through 2/14; 07/02 through 12/31; seasonal criterion (≤ 13.0 °C) 10/1 through 09/30. Temperature was on 16.7 on 9/11.
Page 33
Station 7-DADMa Dateb Criteria/Comment
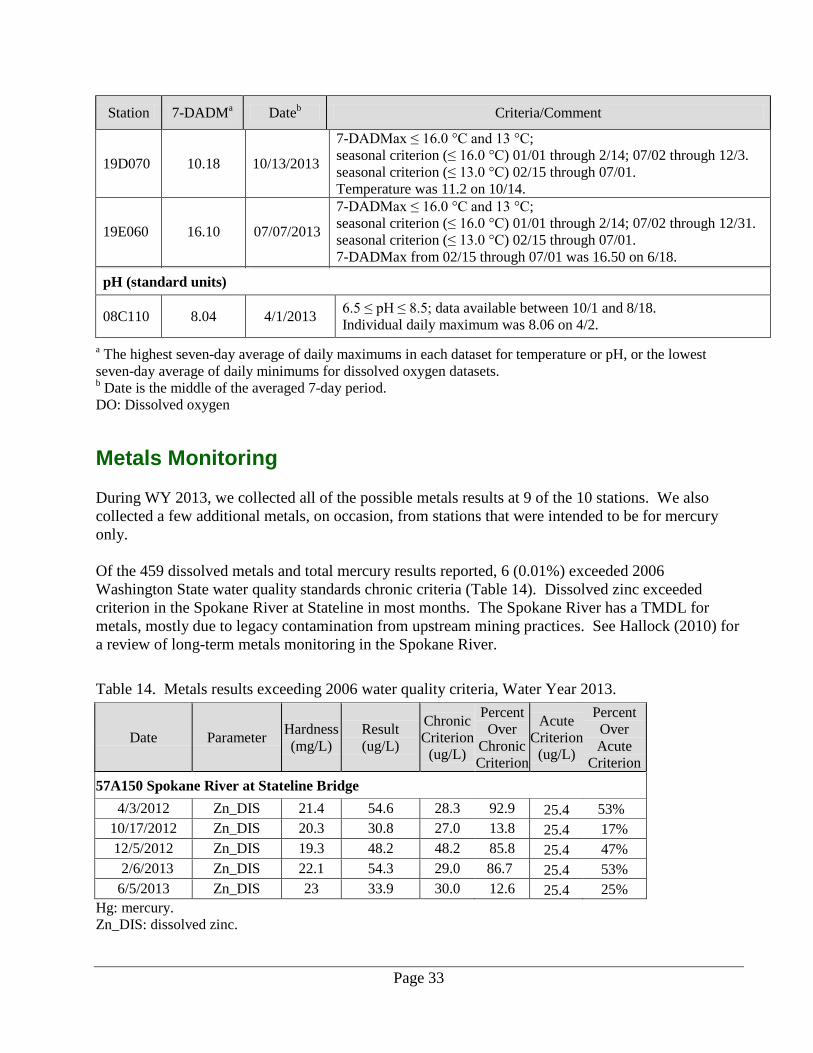
19D070 10.18 10/13/2013 7-DADMax ≤ 16.0 °C and 13 °C; seasonal criterion (≤ 16.0 °C) 01/01 through 2/14; 07/02 through 12/3. seasonal criterion (≤ 13.0 °C) 02/15 through 07/01. Temperature was 11.2 on 10/14.
19E060 16.10 07/07/2013 7-DADMax ≤ 16.0 °C and 13 °C; seasonal criterion (≤ 16.0 °C) 01/01 through 2/14; 07/02 through 12/31. seasonal criterion (≤ 13.0 °C) 02/15 through 07/01. 7-DADMax from 02/15 through 07/01 was 16.50 on 6/18.
pH (standard units)
08C110 8.04 4/1/2013 6.5 ≤ pH ≤ 8.5; data available between 10/1 and 8/18. Individual daily maximum was 8.06 on 4/2.
a The highest seven-day average of daily maximums in each dataset for temperature or pH, or the lowest seven-day average of daily minimums for dissolved oxygen datasets. b Date is the middle of the averaged 7-day period. DO: Dissolved oxygen
Metals Monitoring During WY 2013, we collected all of the possible metals results at 9 of the 10 stations. We also collected a few additional metals, on occasion, from stations that were intended to be for mercury only. Of the 459 dissolved metals and total mercury results reported, 6 (0.01%) exceeded 2006 Washington State water quality standards chronic criteria (Table 14). Dissolved zinc exceeded criterion in the Spokane River at Stateline in most months. The Spokane River has a TMDL for metals, mostly due to legacy contamination from upstream mining practices. See Hallock (2010) for a review of long-term metals monitoring in the Spokane River.
Table 14. Metals results exceeding 2006 water quality criteria, Water Year 2013.
Date Parameter Hardness (mg/L)
Result (ug/L)
Chronic Criterion
(ug/L)
Percent Over
Chronic Criterion
Acute Criterion
(ug/L)
Percent Over Acute
Criterion 57A150 Spokane River at Stateline Bridge
4/3/2012 Zn_DIS 21.4 54.6 28.3 92.9 25.4 53% 10/17/2012 Zn_DIS 20.3 30.8 27.0 13.8 25.4 17% 12/5/2012 Zn_DIS 19.3 48.2 48.2 85.8 25.4 47%
2/6/2013 Zn_DIS 22.1 54.3 29.0 86.7 25.4 53% 6/5/2013 Zn_DIS 23 33.9 30.0 12.6 25.4 25%
Hg: mercury. Zn_DIS: dissolved zinc.
Page 34
Nitrogen in Puget Sound Area Rivers
Concentration Trends
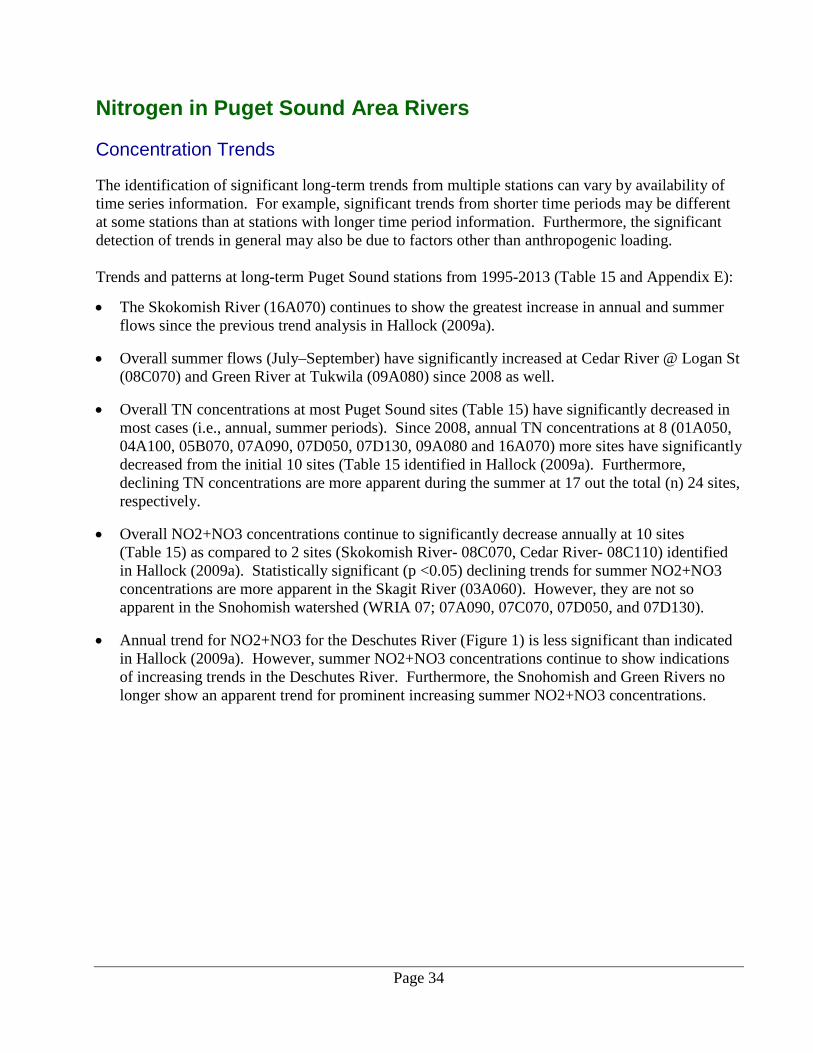
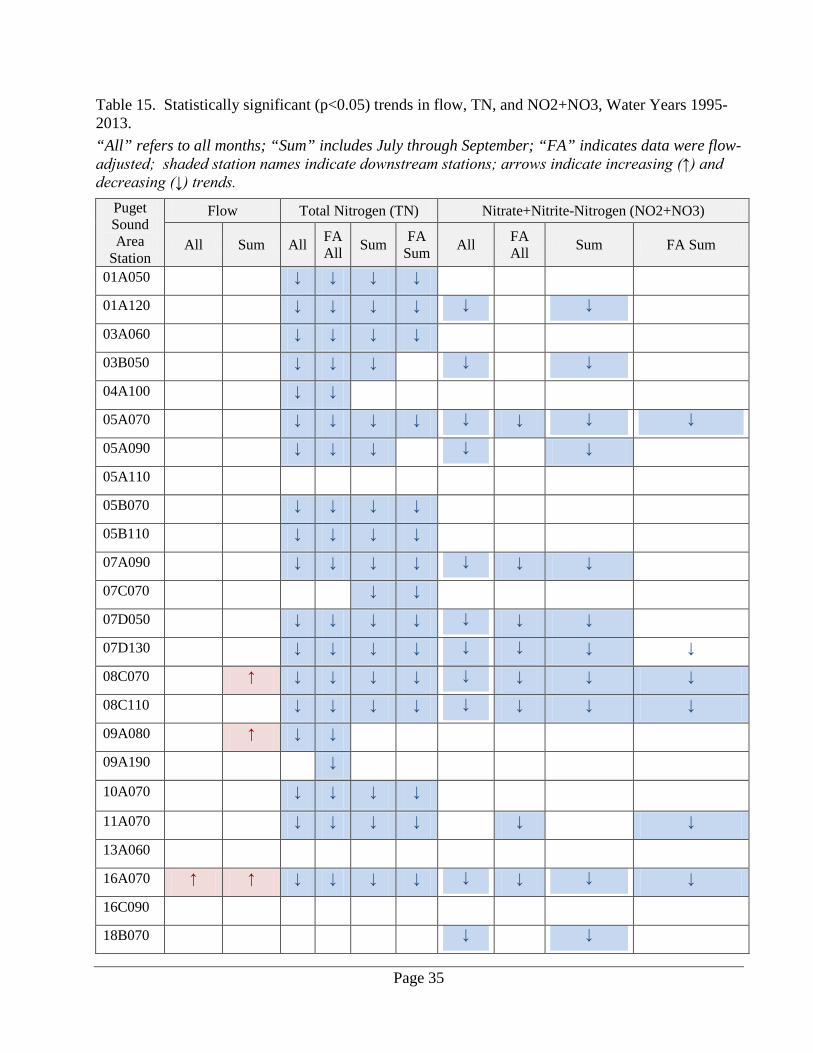
The identification of significant long-term trends from multiple stations can vary by availability of time series information. For example, significant trends from shorter time periods may be different at some stations than at stations with longer time period information. Furthermore, the significant detection of trends in general may also be due to factors other than anthropogenic loading. Trends and patterns at long-term Puget Sound stations from 1995-2013 (Table 15 and Appendix E):
• The Skokomish River (16A070) continues to show the greatest increase in annual and summer flows since the previous trend analysis in Hallock (2009a).
• Overall summer flows (July–September) have significantly increased at Cedar River @ Logan St (08C070) and Green River at Tukwila (09A080) since 2008 as well.
• Overall TN concentrations at most Puget Sound sites (Table 15) have significantly decreased in most cases (i.e., annual, summer periods). Since 2008, annual TN concentrations at 8 (01A050, 04A100, 05B070, 07A090, 07D050, 07D130, 09A080 and 16A070) more sites have significantly decreased from the initial 10 sites (Table 15 identified in Hallock (2009a). Furthermore, declining TN concentrations are more apparent during the summer at 17 out the total (n) 24 sites, respectively.
• Overall NO2+NO3 concentrations continue to significantly decrease annually at 10 sites (Table 15) as compared to 2 sites (Skokomish River- 08C070, Cedar River- 08C110) identified in Hallock (2009a). Statistically significant (p <0.05) declining trends for summer NO2+NO3 concentrations are more apparent in the Skagit River (03A060). However, they are not so apparent in the Snohomish watershed (WRIA 07; 07A090, 07C070, 07D050, and 07D130).
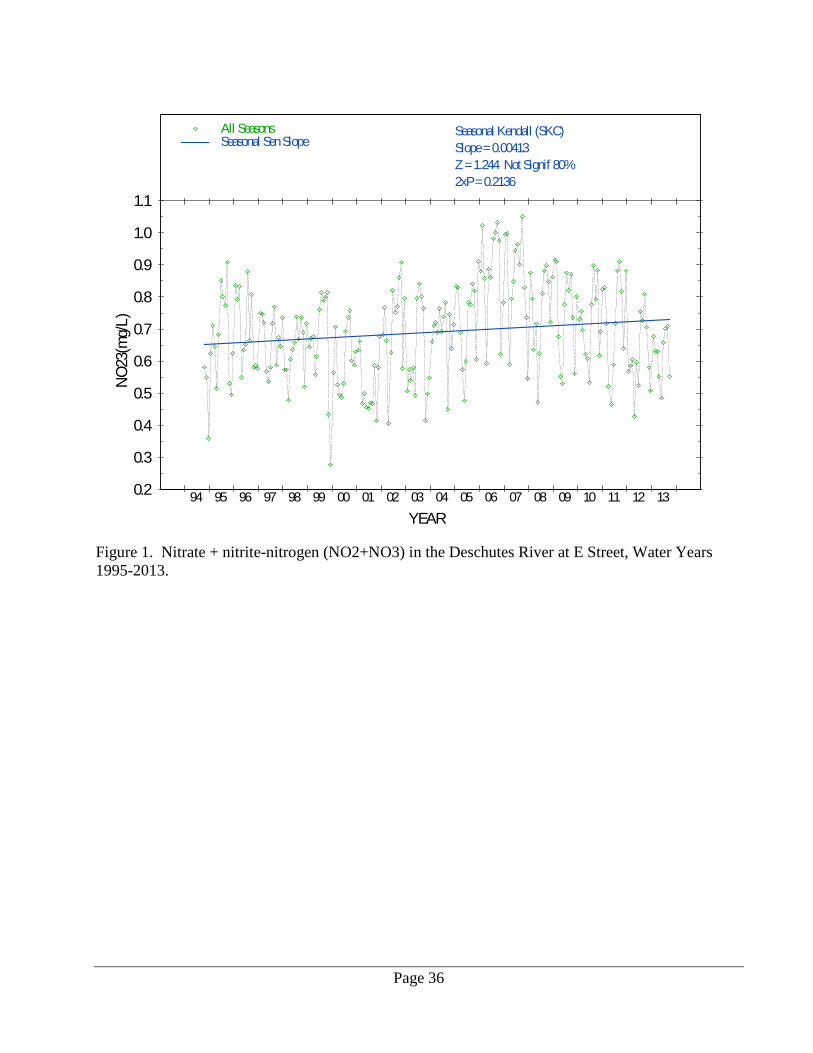
• Annual trend for NO2+NO3 for the Deschutes River (Figure 1) is less significant than indicated in Hallock (2009a). However, summer NO2+NO3 concentrations continue to show indications of increasing trends in the Deschutes River. Furthermore, the Snohomish and Green Rivers no longer show an apparent trend for prominent increasing summer NO2+NO3 concentrations.
Page 35
Table 15. Statistically significant (p<0.05) trends in flow, TN, and NO2+NO3, Water Years 1995-2013. “All” refers to all months; “Sum” includes July through September; “FA” indicates data were flow-adjusted; shaded station names indicate downstream stations; arrows indicate increasing (↑) and decreasing (↓) trends.
Puget Sound Area
Station
Flow Total Nitrogen (TN) Nitrate+Nitrite-Nitrogen (NO2+NO3)
All Sum All FA All Sum FA
Sum All FA All Sum FA Sum
01A050
↓ ↓ ↓ ↓
01A120
↓ ↓ ↓ ↓ ↓
↓
03A060
↓ ↓ ↓ ↓
03B050
↓ ↓ ↓
↓
↓
04A100
↓ ↓
05A070
↓ ↓ ↓ ↓ ↓
↓ ↓
↓
05A090
↓ ↓ ↓
↓
↓
05A110
05B070
↓ ↓ ↓ ↓
05B110
↓ ↓ ↓ ↓
07A090
↓ ↓ ↓ ↓ ↓
↓ ↓
07C070
↓ ↓
07D050
↓ ↓ ↓ ↓ ↓
↓ ↓
07D130
↓ ↓ ↓ ↓ ↓
↓
↓ ↓
08C070
↑ ↓ ↓ ↓ ↓ ↓
↓ ↓ ↓
08C110
↓ ↓ ↓ ↓ ↓
↓ ↓ ↓
09A080
↑ ↓ ↓
09A190
↓
10A070
↓ ↓ ↓ ↓
11A070
↓ ↓ ↓ ↓ ↓
↓
13A060
16A070 ↑ ↑ ↓ ↓ ↓ ↓ ↓
↓ ↓
↓
16C090
18B070
↓
↓
Page 36
Figure 1. Nitrate + nitrite-nitrogen (NO2+NO3) in the Deschutes River at E Street, Water Years 1995-2013.
NO23
(mg/
L)
YEAR
0.2
0.3
0.4
0.5
0.6
0.7
0.8
0.9
1.0
1.1
All Seasons Seasonal Sen Slope
94 95 96 97 98 99 00 01 02 03 04 05 06 07 08 09 10 11 12 13
Seasonal Kendall (SKC)Slope = 0.00413 Z = 1.244 Not Signif 80% 2xP = 0.2136
Page 37
Flux and Yield
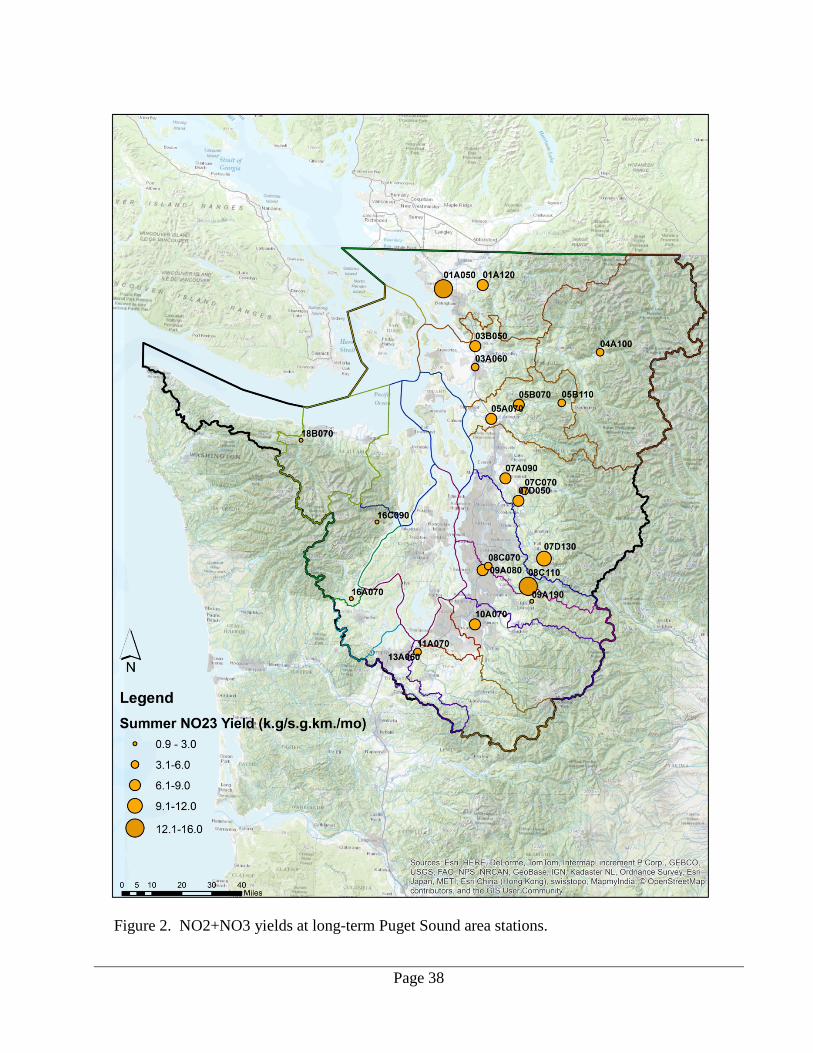
Flux and yield patterns are particularly important in evaluating watershed processes for nitrogen. Flux is the amount of a constituent passing through a spatial location (site) at a specific period in time, and yield is flux normalized for a watershed area. Large watersheds (i.e., x sq. km) that have more confounding effects driven by runoff will have more overall flux. Yields may indicate higher natural sources in the watershed or greater anthropogenic effects resulting from land-use activities and human impacts. Annual TN and NO2+NO3 yields from major Puget Sound river systems during 1995-2013 continue to be fairly uniform since 1995 (Figure 2). The top 4 ranked Puget Sound river systems with the greatest yields for NO2+NO3 are Nooksack River (01A050), Samish River (03B050), Cedar River (08070), and Stillaguamish River near Silvana (05A070). The greatest yields for TN are Stillaguamish River near Silvana (05A070), Nooksack River (01A050), and Samish River (03B050) (Table 16). Summer TN and NO2+NO3 yields are the greatest in Nooksack River (01A050), Deschutes River (13A060), and Cedar River (08C110) (Figure 2). Generally, the Stillaguamish and Nooksack River systems are the largest contributors of annual nitrogen per unit of watershed area in the Puget Sound Region. Significant yield trends were generally downward and very similar to the yield trends evaluated in Hallock (2009a). Significant annual declining trends identified in both evaluations are Nooksack River @ North Cedarville (01A120), Samish River near Burlington (03B050), Stillaguamish River near Silvana (05A070), and Nisqually River @ Nisqually (11A070) for TN. However, no downward trends were indicated at Snohomish R @ Snohomish (07D130), Cedar River @ Logan St (08C070), and Nisqually River @ Nisqually (11A070) as in Hallock (2009a). Furthermore, there was a noticeable increasing trend at Elwha River near Port Angeles (18B070) after the Elwha Dam removal in 2012. Significant declining summer yields are prevalent at the same sites with significant annual yields. Since 2008, the mean difference in summer NO2+NO3 yields for all Puget Sound sites combined has increased slightly by 0.18 kg/sq. km/month with a relative percent difference of 1.93%. However, this is relativity small considering inter-annual variability between time periods. Annual NO2+NO3 yield decreasing trends are only significant at one site, SF Stillaguamish @ Arlington (05A090), as compared to 5 sites (03A060, 03B050, 05A070, 05B110, 07D050) identified in Hallock (2009a). Annual positive trends for NO2+NO3 yield continue to be prevalent at Puyallup R @ Meridian St (10A070). An additional NO2+NO3 yield positive trend was identified at Elwha R nr Port Angeles (18B070). Summer NO2+NO3 yield decreasing trends are only significant at SF Stillaguamish @ Arlington (05A090), while increasing trends were found at Green R @ Tukwila (09A080).
Page 38
Figure 2. NO2+NO3 yields at long-term Puget Sound area stations.
Page 39
Table 16. Average yields at long-term Puget Sound area stations (kg/sq. km/month).
“All” refers to all months, “Summer” refers to July through September. Data are from WY 1995 through WY 2013 unless otherwise indicated. Shaded station names indicate downstream stations. Darker shading in the table body indicates higher relative yield within a column.
Station TN (All)
NO2+NO3 (All)
TN (Summer)
NO2+NO3 (Summer)
01A050 90.54 64.43 19.74 14.71 01A120 41.39 32.35 10.27 7.75 03A060 23.56 15.93 8.13 4.78 03B050 81.3 64.15 10.15 8.7 04A100 13.48 9.4 7.81 5.63 05A070 92.04 49.2 12.8 8.37 05B070 56.18 44.74 10.28 6.89 05B110 54.24 41.24 6.12 4.47 07A090 52.89 41.4 11.75 8.14 07C070 36.63 28.61 8.08 5.06 07D050 53.37 41.44 11.06 8.26 07D130 45.36 37.39 13.03 10.4 08C070 40.39 53.49 7.52 4.47 08C110 26.78 23 14.17 12.63 09A080 52.1 36.17 12.41 8.82 09A190 21.7 16.81 3.9 2.13 10A070 36.46 23.47 14.21 7.53 11A070 29.05 19.19 6.9 4.39 13A060 49.7 41.22 17.95 15.47 16A070 34.56 13.03 4.57 2.69 16C090 9.78 5.01 2.64 1.13 18B070 10.4 4.23 3.62 0.95
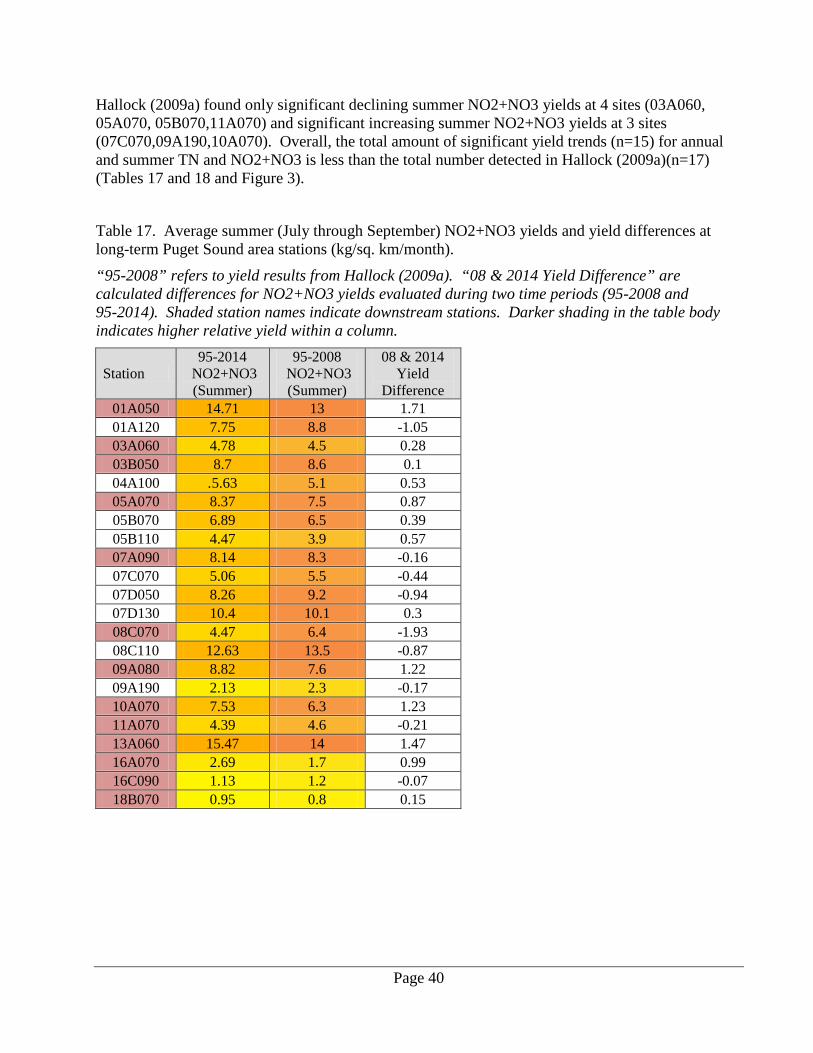
Page 40
Hallock (2009a) found only significant declining summer NO2+NO3 yields at 4 sites (03A060, 05A070, 05B070,11A070) and significant increasing summer NO2+NO3 yields at 3 sites (07C070,09A190,10A070). Overall, the total amount of significant yield trends (n=15) for annual and summer TN and NO2+NO3 is less than the total number detected in Hallock (2009a)(n=17) (Tables 17 and 18 and Figure 3).
Table 17. Average summer (July through September) NO2+NO3 yields and yield differences at long-term Puget Sound area stations (kg/sq. km/month).
“95-2008” refers to yield results from Hallock (2009a). “08 & 2014 Yield Difference” are calculated differences for NO2+NO3 yields evaluated during two time periods (95-2008 and 95-2014). Shaded station names indicate downstream stations. Darker shading in the table body indicates higher relative yield within a column.
Station 95-2014
NO2+NO3 (Summer)
95-2008 NO2+NO3 (Summer)
08 & 2014 Yield
Difference 01A050 14.71 13 1.71 01A120 7.75 8.8 -1.05 03A060 4.78 4.5 0.28 03B050 8.7 8.6 0.1 04A100 .5.63 5.1 0.53 05A070 8.37 7.5 0.87 05B070 6.89 6.5 0.39 05B110 4.47 3.9 0.57 07A090 8.14 8.3 -0.16 07C070 5.06 5.5 -0.44 07D050 8.26 9.2 -0.94 07D130 10.4 10.1 0.3 08C070 4.47 6.4 -1.93 08C110 12.63 13.5 -0.87 09A080 8.82 7.6 1.22 09A190 2.13 2.3 -0.17 10A070 7.53 6.3 1.23 11A070 4.39 4.6 -0.21 13A060 15.47 14 1.47 16A070 2.69 1.7 0.99 16C090 1.13 1.2 -0.07 18B070 0.95 0.8 0.15
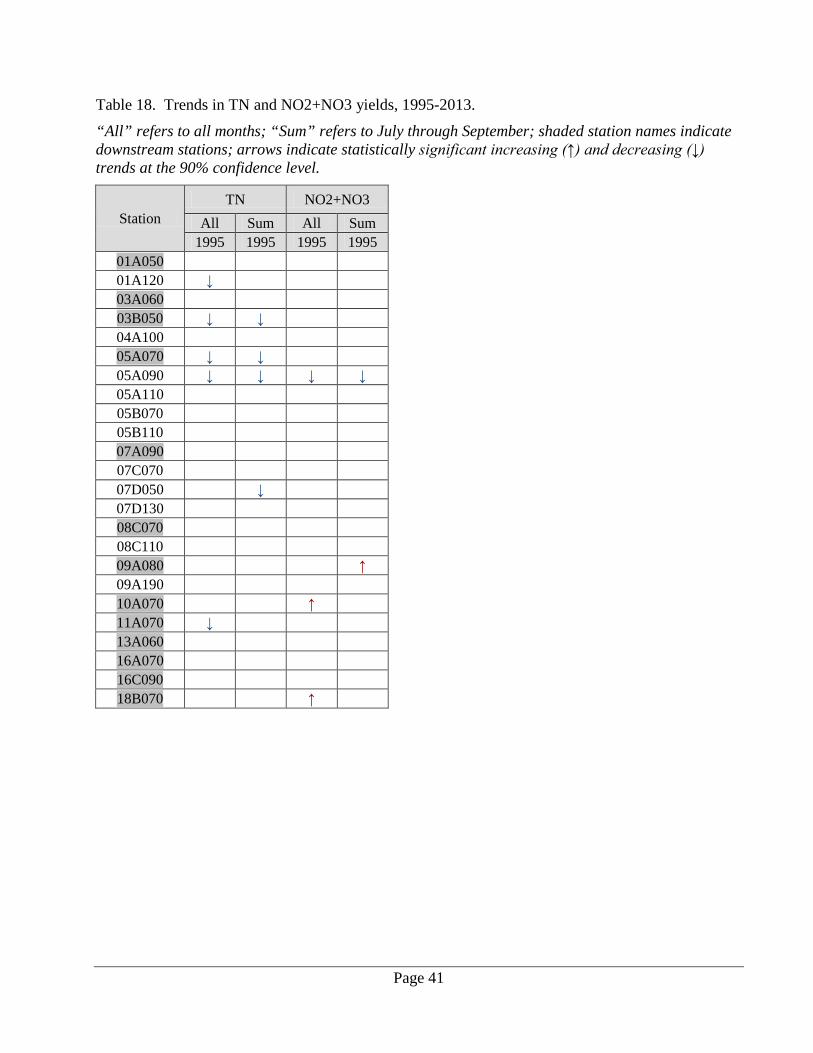
Page 41
Table 18. Trends in TN and NO2+NO3 yields, 1995-2013.
“All” refers to all months; “Sum” refers to July through September; shaded station names indicate downstream stations; arrows indicate statistically significant increasing (↑) and decreasing (↓) trends at the 90% confidence level.
Station TN NO2+NO3
All Sum All Sum 1995 1995 1995 1995
01A050 01A120 ↓ 03A060 03B050 ↓ ↓ 04A100 05A070 ↓ ↓ 05A090 ↓ ↓ ↓ ↓ 05A110 05B070 05B110 07A090 07C070 07D050 ↓ 07D130 08C070 08C110 09A080 ↑ 09A190 10A070 ↑ 11A070 ↓ 13A060 16A070 16C090 18B070 ↑
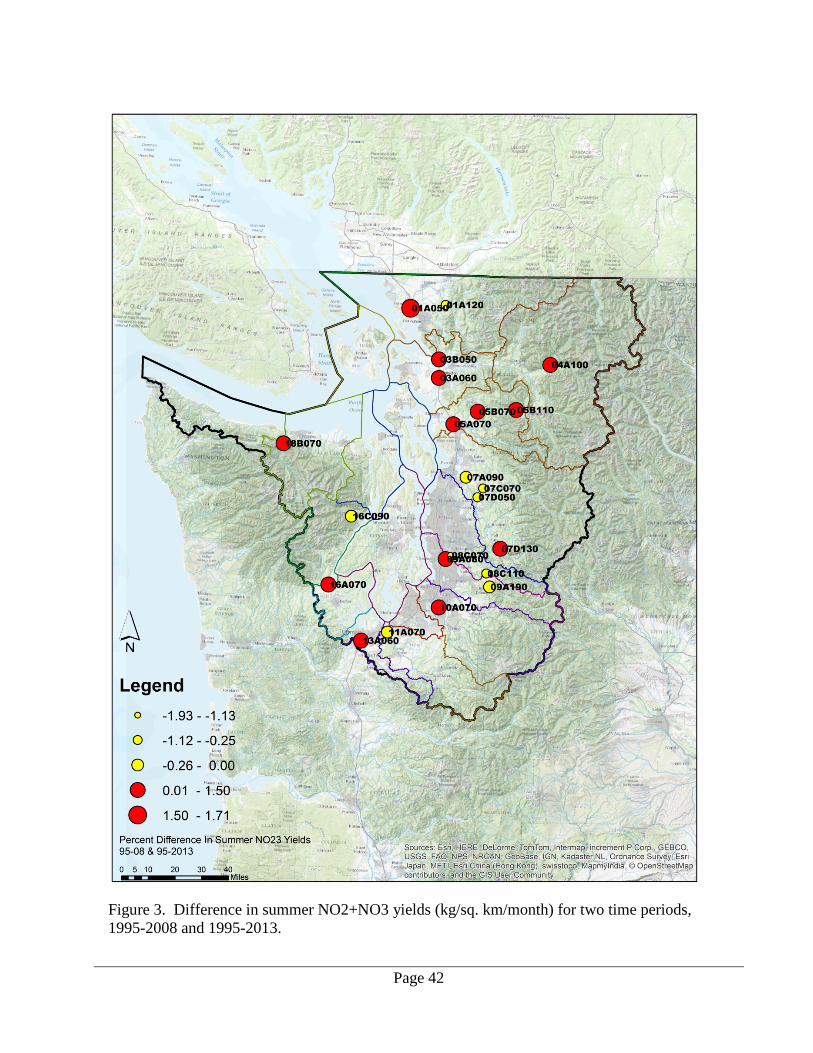
Page 42
Figure 3. Difference in summer NO2+NO3 yields (kg/sq. km/month) for two time periods, 1995-2008 and 1995-2013.
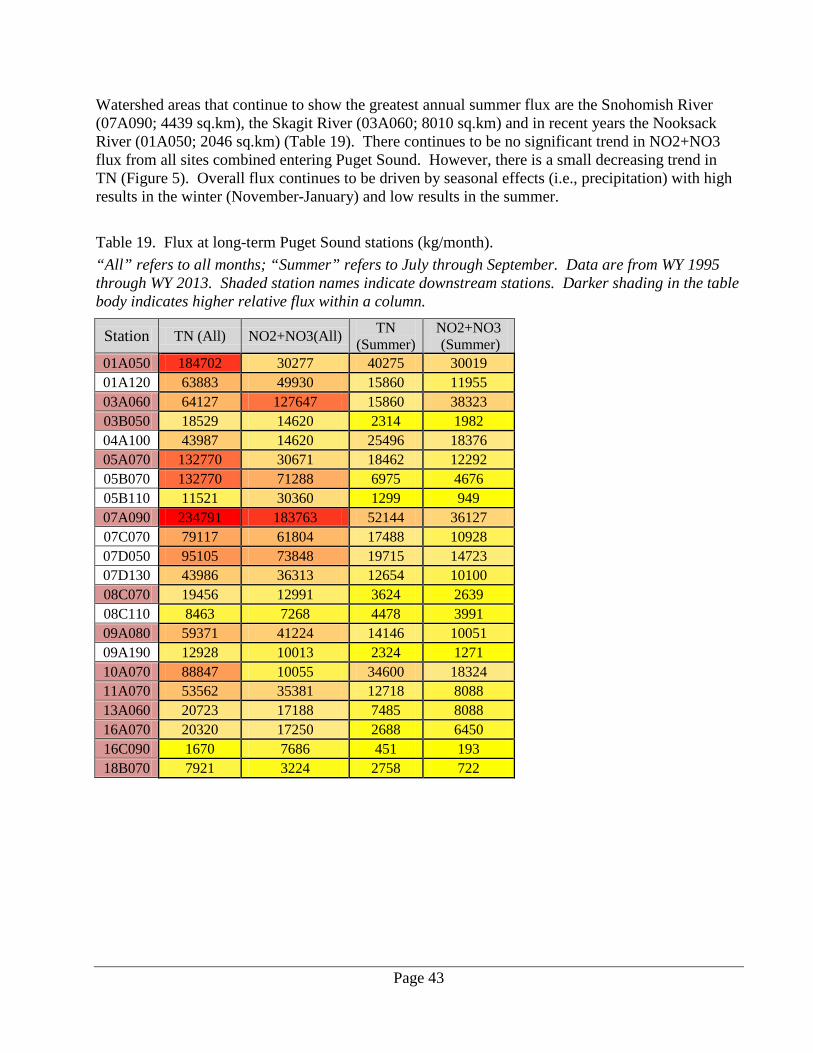
Page 43
Watershed areas that continue to show the greatest annual summer flux are the Snohomish River (07A090; 4439 sq.km), the Skagit River (03A060; 8010 sq.km) and in recent years the Nooksack River (01A050; 2046 sq.km) (Table 19). There continues to be no significant trend in NO2+NO3 flux from all sites combined entering Puget Sound. However, there is a small decreasing trend in TN (Figure 5). Overall flux continues to be driven by seasonal effects (i.e., precipitation) with high results in the winter (November-January) and low results in the summer. Table 19. Flux at long-term Puget Sound stations (kg/month). “All” refers to all months; “Summer” refers to July through September. Data are from WY 1995 through WY 2013. Shaded station names indicate downstream stations. Darker shading in the table body indicates higher relative flux within a column.
Station TN (All) NO2+NO3(All) TN (Summer)
NO2+NO3 (Summer)
01A050 184702 30277 40275 30019 01A120 63883 49930 15860 11955 03A060 64127 127647 15860 38323 03B050 18529 14620 2314 1982 04A100 43987 14620 25496 18376 05A070 132770 30671 18462 12292 05B070 132770 71288 6975 4676 05B110 11521 30360 1299 949 07A090 234791 183763 52144 36127 07C070 79117 61804 17488 10928 07D050 95105 73848 19715 14723 07D130 43986 36313 12654 10100 08C070 19456 12991 3624 2639 08C110 8463 7268 4478 3991 09A080 59371 41224 14146 10051 09A190 12928 10013 2324 1271 10A070 88847 10055 34600 18324 11A070 53562 35381 12718 8088 13A060 20723 17188 7485 8088 16A070 20320 17250 2688 6450 16C090 1670 7686 451 193 18B070 7921 3224 2758 722
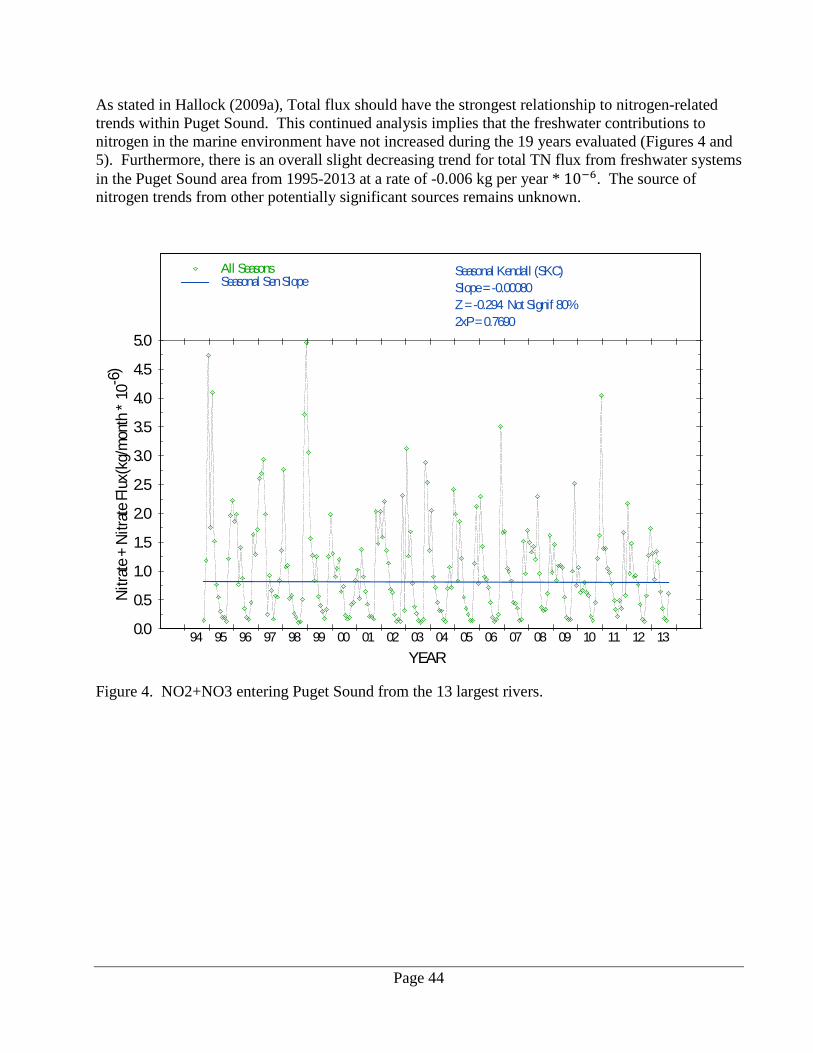
Page 44
As stated in Hallock (2009a), Total flux should have the strongest relationship to nitrogen-related trends within Puget Sound. This continued analysis implies that the freshwater contributions to nitrogen in the marine environment have not increased during the 19 years evaluated (Figures 4 and 5). Furthermore, there is an overall slight decreasing trend for total TN flux from freshwater systems in the Puget Sound area from 1995-2013 at a rate of -0.006 kg per year * 10−6. The source of nitrogen trends from other potentially significant sources remains unknown.
Figure 4. NO2+NO3 entering Puget Sound from the 13 largest rivers.
N i t r a
t e +
N i t r
a t e F
l u x (
k g / m
o n t h
* 1
0 - 6 )
YEAR
0.0
0.5
1.0
1.5
2.0
2.5
3.0
3.5
4.0
4.5
5.0
All Seasons Seasonal Sen Slope
94 95 96 97 98 99 00 01 02 03 04 05 06 07 08 09 10 11 12 13
Seasonal Kendall (SKC)Slope = -0.00080Z = -0.294 Not Signif 80%2xP = 0.7690
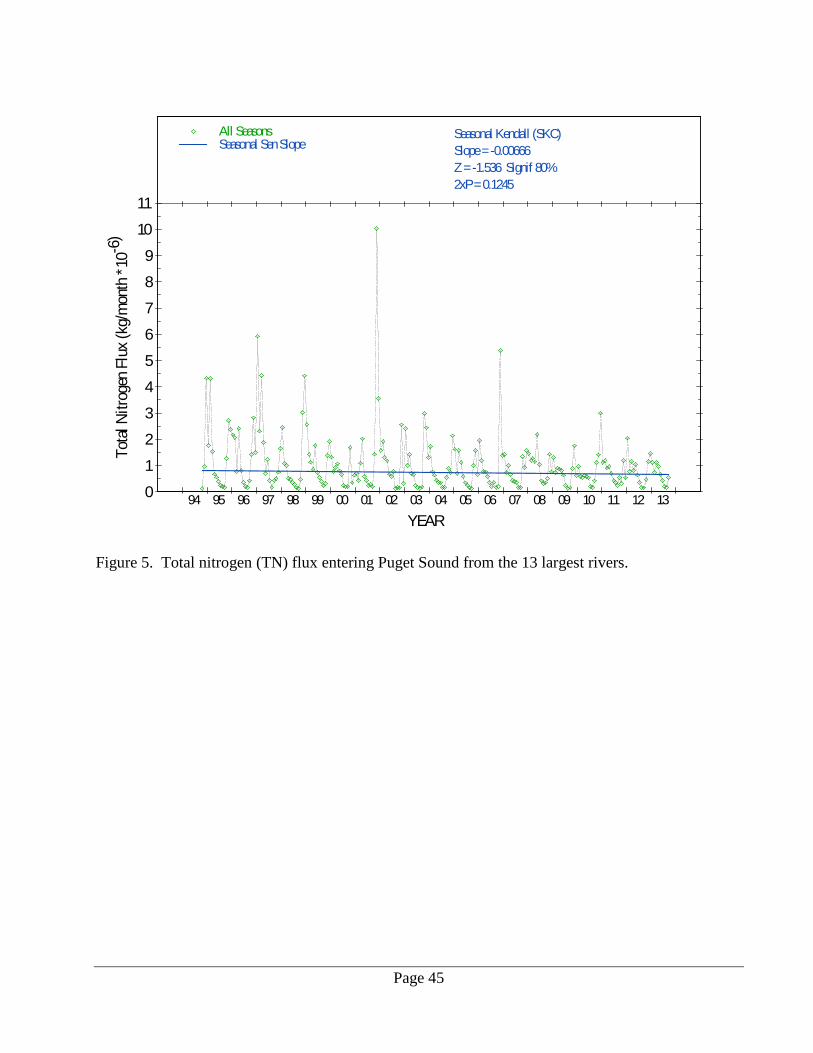
Page 45
Figure 5. Total nitrogen (TN) flux entering Puget Sound from the 13 largest rivers.
T o t a
l N i t r
o g e n
F l u
x ( k
g / m
o n t h
* 1 0
- 6 )
YEAR
0
1
2
3
4
5
6
7
8
9
10
11
All Seasons Seasonal Sen Slope
94 95 96 97 98 99 00 01 02 03 04 05 06 07 08 09 10 11 12 13
Seasonal Kendall (SKC)Slope = -0.00666Z = -1.536 Signif 80%2xP = 0.1245
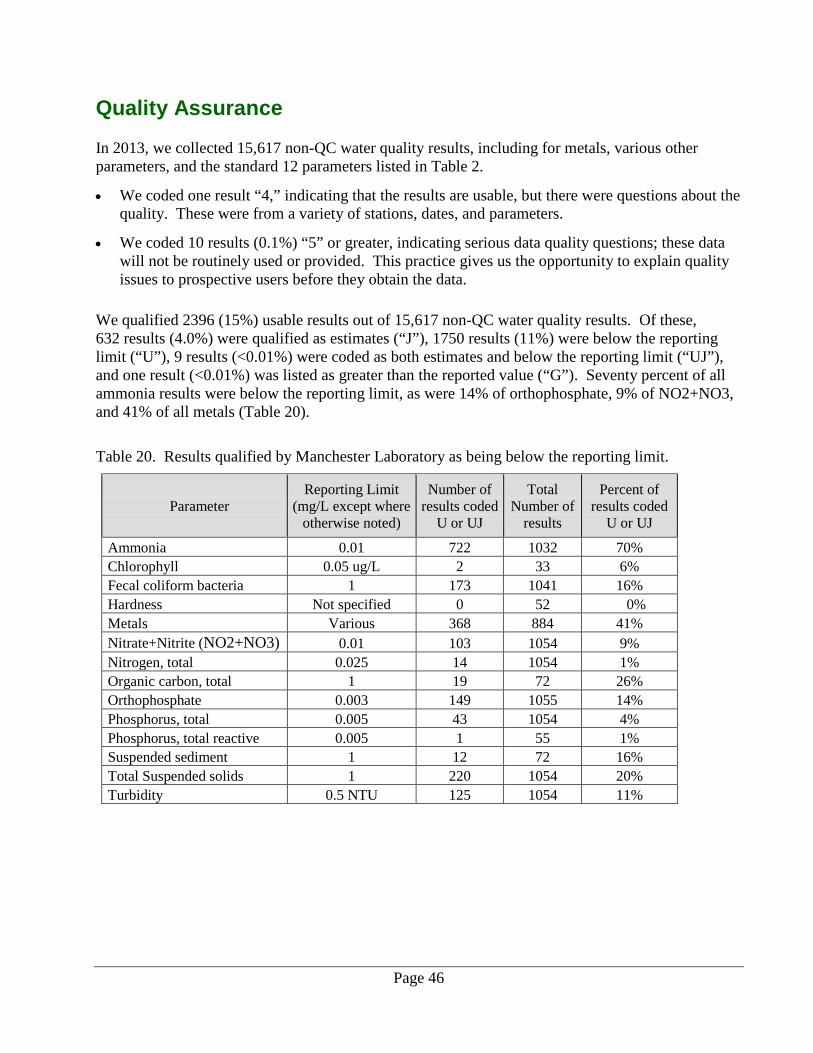
Page 46
Quality Assurance In 2013, we collected 15,617 non-QC water quality results, including for metals, various other parameters, and the standard 12 parameters listed in Table 2.
• We coded one result “4,” indicating that the results are usable, but there were questions about the quality. These were from a variety of stations, dates, and parameters.
• We coded 10 results (0.1%) “5” or greater, indicating serious data quality questions; these data will not be routinely used or provided. This practice gives us the opportunity to explain quality issues to prospective users before they obtain the data.
We qualified 2396 (15%) usable results out of 15,617 non-QC water quality results. Of these, 632 results (4.0%) were qualified as estimates (“J”), 1750 results (11%) were below the reporting limit (“U”), 9 results (<0.01%) were coded as both estimates and below the reporting limit (“UJ”), and one result (<0.01%) was listed as greater than the reported value (“G”). Seventy percent of all ammonia results were below the reporting limit, as were 14% of orthophosphate, 9% of NO2+NO3, and 41% of all metals (Table 20).
Table 20. Results qualified by Manchester Laboratory as being below the reporting limit.
Parameter Reporting Limit
(mg/L except where otherwise noted)
Number of results coded
U or UJ
Total Number of
results
Percent of results coded
U or UJ Ammonia 0.01 722 1032 70% Chlorophyll 0.05 ug/L 2 33 6% Fecal coliform bacteria 1 173 1041 16% Hardness Not specified 0 52 0% Metals Various 368 884 41% Nitrate+Nitrite (NO2+NO3) 0.01 103 1054 9% Nitrogen, total 0.025 14 1054 1% Organic carbon, total 1 19 72 26% Orthophosphate 0.003 149 1055 14% Phosphorus, total 0.005 43 1054 4% Phosphorus, total reactive 0.005 1 55 1% Suspended sediment 1 12 72 16% Total Suspended solids 1 220 1054 20% Turbidity 0.5 NTU 125 1054 11%
Page 47
Errors in EIM and Web Databases
The automated data verification process identified 121 instances where results in Ecology’s EIM database (“transitional” project AMS001-2) were different than results in our primary database. However, 17 pH results and 1 water temperature result were actually in EIM and not detected in the validation procedure. This was due to EIM table structure changes from EIM database modifications in WY 2013. Fifty-six metal results also were not detected in the validation procedure because laboratory sample IDs were mismatched with station run information in our primary database. Furthermore, 54 total reactive phosphorus (TRP) results were mismatched in the validation procedure and were listed in EIM as total ortho-phosphate instead.
Comparison to Quality Control Requirements
Decision Quality Objectives
Decision quality objectives (DQOs) are based on root-mean-squared (RMS) values broken out by concentration range (Tables 21 and 22). In practice, estimates of variability are strongly influenced by extreme values, especially when the sample size (n) is small. Also, the variability estimate is skewed downward for the lowest concentration ranges because data below the reporting limit are censored and, therefore, sample pairs below this limit have a variance of zero. In general, variability of repeated measures followed the expected pattern: field sequential samples > field split samples > lab split samples. However, in some cases, field split or lab split samples had greater variability than field QC samples. Why this should be for field splits is not clear. Lab splits are often based on different samples than field QC samples. In either case, often a single split pair with poor precision was responsible. Three field split parameters and five concentration ranges failed our Quality Assurance Monitoring Plan (QAMP) DQO (Hallock and Ehinger, 2003), which specifies that DQOs be evaluated against field splits, where possible. The mid-range and upper range for TN, the upper ranges for NO2+NO3 and the upper range for total phosphorus samples exceeded their DQOs. In the case of TN, 2 split pairs were particularly poor (0.116/0.184 ug/L and 0.078/0.053 ug/L) which drove the RMS to 32.06%. There was one particularly poor phosphorus sample pair (0.0332/0.0054 mg/L). Several field sequential parameter categories failed to meet DQO criteria specifically for TN and NO2+NO3, but instream variability is included in these sample pairs so their variability is not a true measure of sampling plus analytical error. As in years past, the variability in sequential samples for total suspended solids (TSS) concentrations tended to be particularly high. This underscores the inherent variability in measurements of stream sediment.
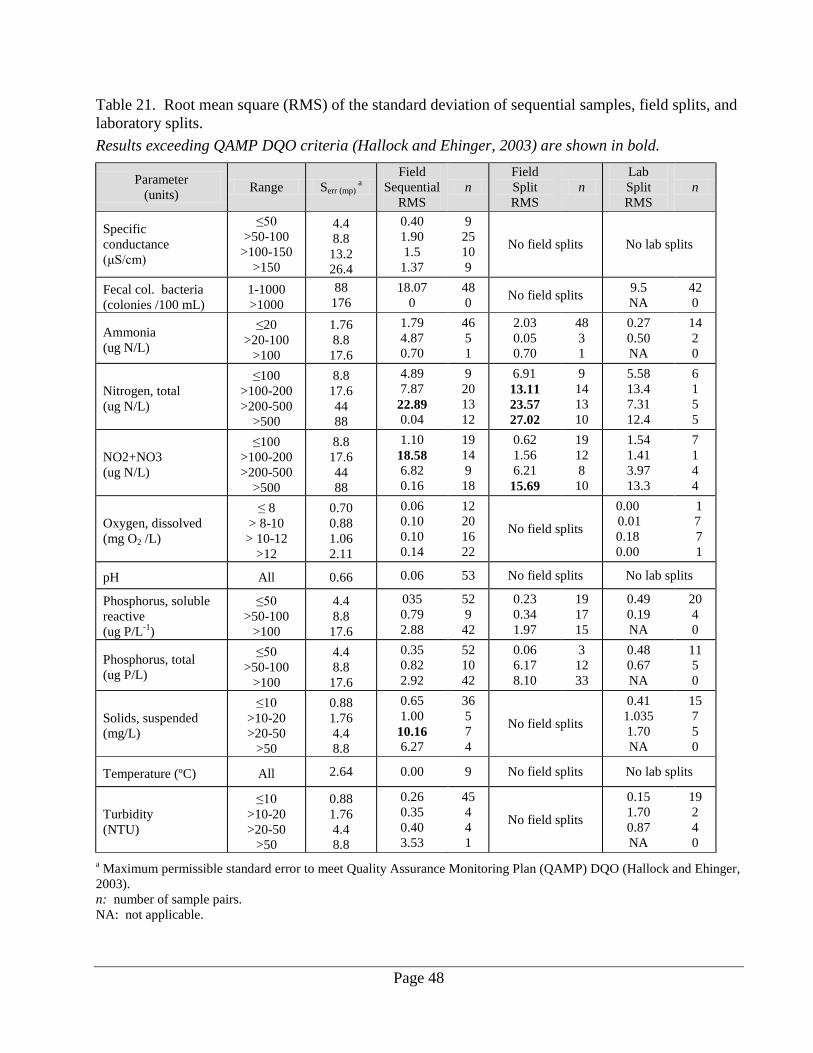
Page 48
Table 21. Root mean square (RMS) of the standard deviation of sequential samples, field splits, and laboratory splits. Results exceeding QAMP DQO criteria (Hallock and Ehinger, 2003) are shown in bold.
Parameter (units) Range Serr (mp)
a Field
Sequential RMS
n Field Split RMS
n Lab Split RMS
n
Specific conductance (μS/cm)
≤50 >50-100
>100-150 >150
4.4 8.8
13.2 26.4
0.40 1.90 1.5
1.37
9 25 10 9
No field splits No lab splits
Fecal col. bacteria (colonies /100 mL)
1-1000 >1000
88 176
18.07 0
48 0 No field splits 9.5
NA 42 0
Ammonia (ug N/L)
≤20 >20-100
>100
1.76 8.8
17.6
1.79 4.87 0.70
46 5 1
2.03 0.05 0.70
48 3 1
0.27 0.50 NA
14 2 0
Nitrogen, total (ug N/L)
≤100 >100-200 >200-500
>500
8.8 17.6 44 88
4.89 7.87
22.89 0.04
9 20 13 12
6.91 13.11 23.57 27.02
9 14 13 10
5.58 13.4 7.31 12.4
6 1 5 5
NO2+NO3 (ug N/L)
≤100 >100-200 >200-500
>500
8.8 17.6 44 88
1.10 18.58 6.82 0.16
19 14 9 18
0.62 1.56 6.21
15.69
19 12 8 10
1.54 1.41 3.97 13.3
7 1 4 4
Oxygen, dissolved (mg O2 /L)
≤ 8 > 8-10 > 10-12
>12
0.70 0.88 1.06 2.11
0.06 0.10 0.10 0.14
12 20 16 22
No field splits
0.00 1 0.01 7 0.18 7 0.00 1
pH All 0.66 0.06 53 No field splits No lab splits
Phosphorus, soluble reactive (ug P/L-1)
≤50 >50-100
>100
4.4 8.8
17.6
035 0.79 2.88
52 9 42
0.23 0.34 1.97
19 17 15
0.49 0.19 NA
20 4 0
Phosphorus, total (ug P/L)
≤50 >50-100
>100
4.4 8.8
17.6
0.35 0.82 2.92
52 10 42
0.06 6.17 8.10
3 12 33
0.48 0.67 NA
11 5 0
Solids, suspended (mg/L)
≤10 >10-20 >20-50
>50
0.88 1.76 4.4 8.8
0.65 1.00
10.16 6.27
36 5 7 4
No field splits
0.41 1.035 1.70 NA
15 7 5 0
Temperature (ºC) All 2.64 0.00 9 No field splits No lab splits
Turbidity (NTU)
≤10 >10-20 >20-50
>50
0.88 1.76 4.4 8.8
0.26 0.35 0.40 3.53
45 4 4 1
No field splits
0.15 1.70 0.87 NA
19 2 4 0
a Maximum permissible standard error to meet Quality Assurance Monitoring Plan (QAMP) DQO (Hallock and Ehinger, 2003). n: number of sample pairs. NA: not applicable.
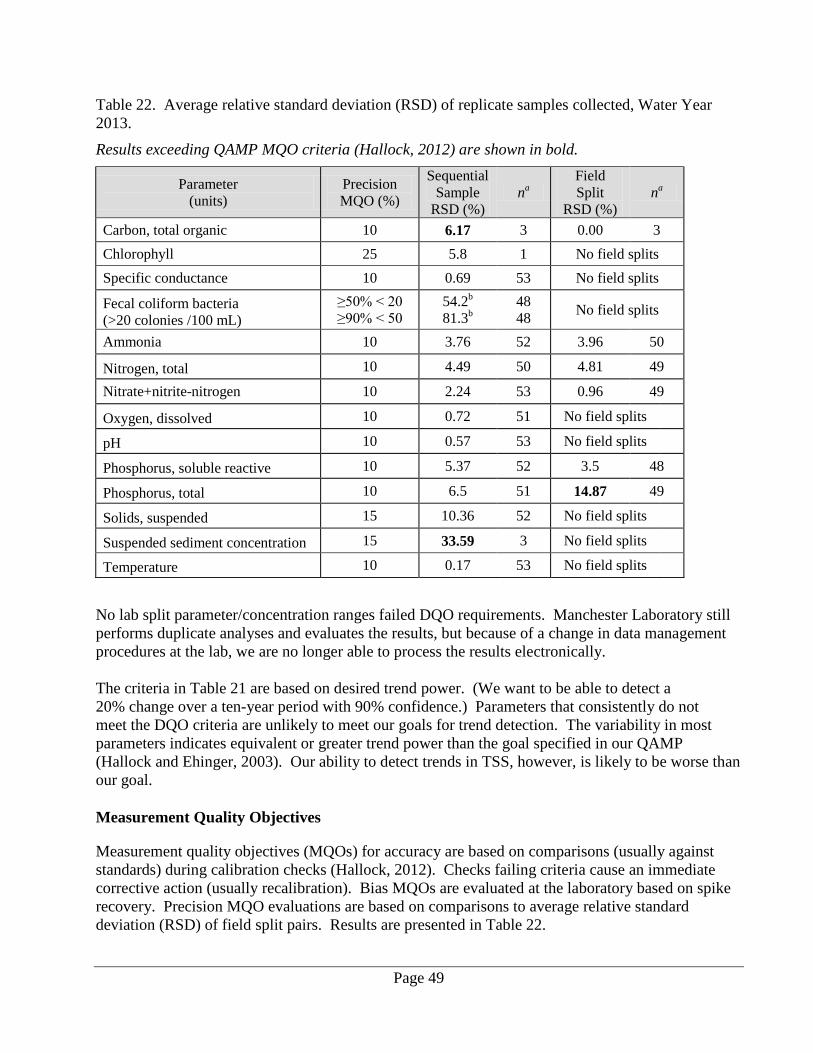
Page 49
Table 22. Average relative standard deviation (RSD) of replicate samples collected, Water Year 2013.
Results exceeding QAMP MQO criteria (Hallock, 2012) are shown in bold.
Parameter (units)
Precision MQO (%)
Sequential Sample
RSD (%) na
Field Split
RSD (%) na
Carbon, total organic 10 6.17 3 0.00 3 Chlorophyll 25 5.8 1 No field splits Specific conductance 10 0.69 53 No field splits Fecal coliform bacteria (>20 colonies /100 mL)
≥50% < 20 ≥90% < 50
54.2b 81.3b
48 48 No field splits
Ammonia 10 3.76 52 3.96 50
Nitrogen, total 10 4.49 50 4.81 49 Nitrate+nitrite-nitrogen 10 2.24 53 0.96 49
Oxygen, dissolved 10 0.72 51 No field splits
pH 10 0.57 53 No field splits
Phosphorus, soluble reactive 10 5.37 52 3.5 48
Phosphorus, total 10 6.5 51 14.87 49
Solids, suspended 15 10.36 52 No field splits
Suspended sediment concentration 15 33.59 3 No field splits Temperature 10 0.17 53 No field splits
No lab split parameter/concentration ranges failed DQO requirements. Manchester Laboratory still performs duplicate analyses and evaluates the results, but because of a change in data management procedures at the lab, we are no longer able to process the results electronically. The criteria in Table 21 are based on desired trend power. (We want to be able to detect a 20% change over a ten-year period with 90% confidence.) Parameters that consistently do not meet the DQO criteria are unlikely to meet our goals for trend detection. The variability in most parameters indicates equivalent or greater trend power than the goal specified in our QAMP (Hallock and Ehinger, 2003). Our ability to detect trends in TSS, however, is likely to be worse than our goal.
Measurement Quality Objectives
Measurement quality objectives (MQOs) for accuracy are based on comparisons (usually against standards) during calibration checks (Hallock, 2012). Checks failing criteria cause an immediate corrective action (usually recalibration). Bias MQOs are evaluated at the laboratory based on spike recovery. Precision MQO evaluations are based on comparisons to average relative standard deviation (RSD) of field split pairs. Results are presented in Table 22.
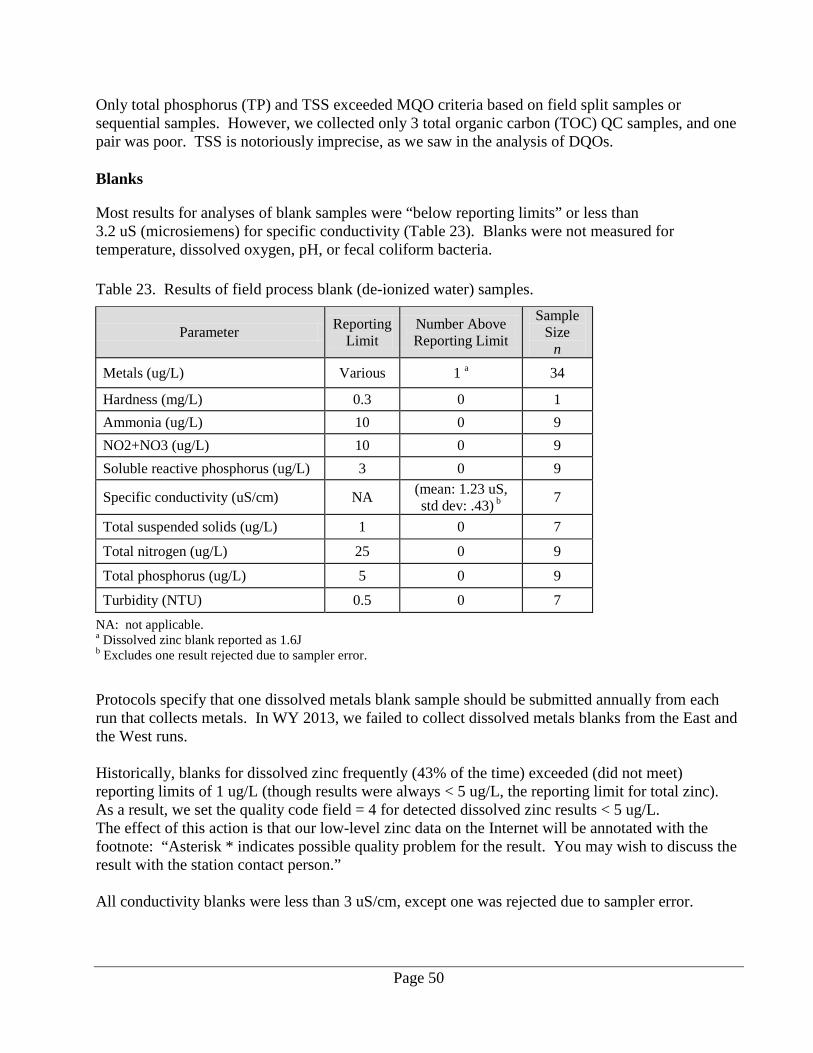
Page 50
Only total phosphorus (TP) and TSS exceeded MQO criteria based on field split samples or sequential samples. However, we collected only 3 total organic carbon (TOC) QC samples, and one pair was poor. TSS is notoriously imprecise, as we saw in the analysis of DQOs.
Blanks
Most results for analyses of blank samples were “below reporting limits” or less than 3.2 uS (microsiemens) for specific conductivity (Table 23). Blanks were not measured for temperature, dissolved oxygen, pH, or fecal coliform bacteria. Table 23. Results of field process blank (de-ionized water) samples.
Parameter Reporting Limit
Number Above Reporting Limit
Sample Size
n Metals (ug/L) Various 1 a 34
Hardness (mg/L) 0.3 0 1 Ammonia (ug/L) 10 0 9 NO2+NO3 (ug/L) 10 0 9 Soluble reactive phosphorus (ug/L) 3 0 9
Specific conductivity (uS/cm) NA (mean: 1.23 uS, std dev: .43) b 7
Total suspended solids (ug/L) 1 0 7 Total nitrogen (ug/L) 25 0 9 Total phosphorus (ug/L) 5 0 9 Turbidity (NTU) 0.5 0 7
NA: not applicable. a Dissolved zinc blank reported as 1.6J b Excludes one result rejected due to sampler error.
Protocols specify that one dissolved metals blank sample should be submitted annually from each run that collects metals. In WY 2013, we failed to collect dissolved metals blanks from the East and the West runs. Historically, blanks for dissolved zinc frequently (43% of the time) exceeded (did not meet) reporting limits of 1 ug/L (though results were always < 5 ug/L, the reporting limit for total zinc). As a result, we set the quality code field = 4 for detected dissolved zinc results < 5 ug/L. The effect of this action is that our low-level zinc data on the Internet will be annotated with the footnote: “Asterisk * indicates possible quality problem for the result. You may wish to discuss the result with the station contact person.” All conductivity blanks were less than 3 uS/cm, except one was rejected due to sampler error.
Page 51
Laboratory staff assessed the remaining elements of the laboratory QA program through a manual review of laboratory QC results, including check standards, in-house matrix spikes, and laboratory blanks. Results were within acceptable ranges as defined by Manchester Laboratory’s Quality Assurance Manual (MEL, 2012) or were either re-run or coded as determined by laboratory staff (e.g., as an estimate, “J”).
Continuous Temperature Monitoring
The pre- and post-deployment calibration checks (using a certified reference thermometer) met or exceeded (were better than) the criteria for the instruments (Ward, 2005). Most of the summer temperature loggers were deployed by July 24.
Continuous Multiple Parameter Monitoring
Some deployments extended beyond the water year reviewed in this annual report; however, for continuous multiple parameter monitoring, we reviewed all data from each location. The Deployment at 28D170 Salmon Creek @ NE 199th/Hill Rd failed QC requirements for all parameters due to excess sedimentation and sensor malfunction. We rejected all data from this deployment. Due to budget constraints, station 28D170 was permanently removed in November 2012. Several stations that had only single QA grab samples obtained during the deployment periods were coded “estimates”. Continuous monitoring data from the IMW stations were processed in time to be included in this QC review, which is performed after visually reviewing data and removing anomalous data points.
Dissolved Oxygen
Besides 28D170 Salmon Creek @ NE 199th/Hill, Hydrolab®, dissolved oxygen sensors failed QC requirements (Table 24) at 41A070 Crab Creek near Beverly for a 3-month deployment period (7/17-9/18). Constant adjustments (offset) information is provided to account for probable calibration errors. Slight positive offsets are suggested for 25E060, 25F060, 19D070, 19C060, 19E060, and 25D050. Station 08C110 required a positive offset during the 11/26- 1/14 deployment and negative offsets for the reminding 2 deployment periods. Generally, most LDO sensors were extremely stable, with little or no drift over the course of the deployment. However, the sensors on 41A070 Crab Creek near Beverly had a greater average percent difference between continuous data and grab sample after applying offsets. During WY 2013, there was a lack of resources available for onsite servicing of the LDO sensors for 41A070 during the 3/13-9/18 deployment period. On the whole, the RSD between the optical dissolved oxygen sensor results and Winkler results is 0.7% greater than the RSD between sequentially collected Winkler grab samples (Table 24).
Page 52
In general long-term continuous monitoring for dissolved oxygen will require additional telemetry resources, regular maintenance of the dissolved oxygen sensors, maintenance of battery voltage, and regular check samples.
Temperature
The temperature signal from almost all sensors was both stable and clean. However, small constant positive and negative adjustments are suggested at various deployment periods for all stations. One sensor failed the QC requirements at 25D050 due to a sensor malfunction. In 73% of deployments, precision was satisfactory compared to the allowed ±0.4 ºC difference between grab sample temperatures and recorded temperatures. However, 27% of grab samples did not meet the allowed ±0.4 ºC difference prior to applying offset corrections. This may be caused by slightly different locations for grab samples and sensor deployments. We coded some continuous deployments as “estimates” because there was only one valid check sample obtained between deployment periods.
Conductivity
Some conductivity deployments exhibited apparent drift at 19C060 West Twin River near the mouth. We rejected part of the dataset from 19C060 because the check sample conductivity results from the 11/27-01/29 deployment period did not meet QC requirements to determine an offset with confidence. To bring continuous data in line with check sample results, offset adjustments coefficients are provided at various deployment periods (Table 24). Likewise, check sample conductivity did not meet QC requirements at Station 19D070 for the deployment period ending in 11/27. Conductivity data were rejected for the 10/23-11/27 deployment because continuous and check samples were inconstant. No conductivity data were obtained after 11/27 due to a sensor malfunction. As previously observed in WY 2011 and 2012, the conductivity sensors during WY 2013 deployments exhibited more apparent “noise” than oxygen or temperature sensors. Noise was usually expressed as a single, unusually high value, though sometimes the value would be unusually low.
pH
In WY 2013, pH information was obtained only at 08C110 Cedar River near Landsburg for the determination of long-term reference conditions. QC results for pH at 08C110 are presented in Table 24. Generally, pH has not been a critical parameter for continuous monitoring at the long-term and IMW stations. However, in the past, pH information has been reported because most of the instruments included pH sensors.
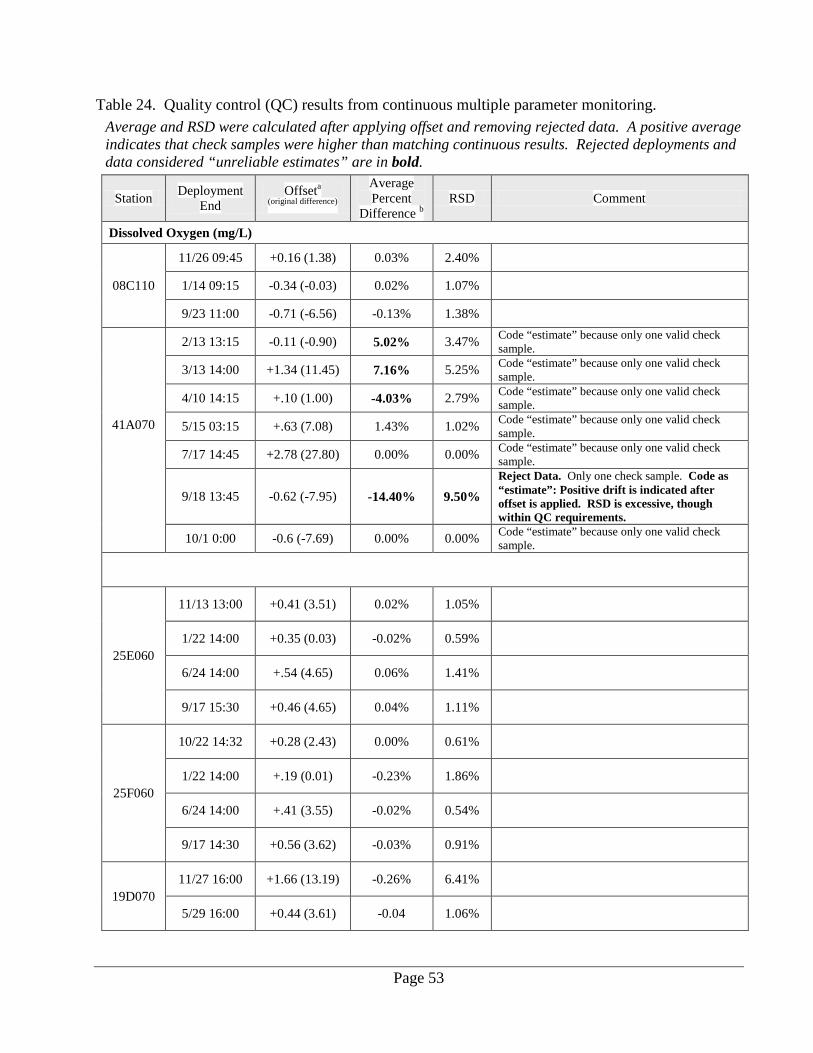
Page 53
Table 24. Quality control (QC) results from continuous multiple parameter monitoring. Average and RSD were calculated after applying offset and removing rejected data. A positive average indicates that check samples were higher than matching continuous results. Rejected deployments and data considered “unreliable estimates” are in bold.
Station Deployment End
Offseta
(original difference)
Average Percent
Difference b RSD Comment
Dissolved Oxygen (mg/L)
08C110
11/26 09:45 +0.16 (1.38) 0.03% 2.40%
1/14 09:15 -0.34 (-0.03) 0.02% 1.07%
9/23 11:00 -0.71 (-6.56) -0.13% 1.38%
41A070
2/13 13:15 -0.11 (-0.90) 5.02% 3.47% Code “estimate” because only one valid check sample.
3/13 14:00 +1.34 (11.45) 7.16% 5.25% Code “estimate” because only one valid check sample.
4/10 14:15 +.10 (1.00) -4.03% 2.79% Code “estimate” because only one valid check sample.
5/15 03:15 +.63 (7.08) 1.43% 1.02% Code “estimate” because only one valid check sample.
7/17 14:45 +2.78 (27.80) 0.00% 0.00% Code “estimate” because only one valid check sample.
9/18 13:45 -0.62 (-7.95) -14.40% 9.50% Reject Data. Only one check sample. Code as “estimate”: Positive drift is indicated after offset is applied. RSD is excessive, though within QC requirements.
10/1 0:00 -0.6 (-7.69) 0.00% 0.00% Code “estimate” because only one valid check sample.
25E060
11/13 13:00 +0.41 (3.51) 0.02% 1.05%
1/22 14:00 +0.35 (0.03) -0.02% 0.59%
6/24 14:00 +.54 (4.65) 0.06% 1.41%
9/17 15:30 +0.46 (4.65) 0.04% 1.11%
25F060
10/22 14:32 +0.28 (2.43) 0.00% 0.61%
1/22 14:00 +.19 (0.01) -0.23% 1.86%
6/24 14:00 +.41 (3.55) -0.02% 0.54%
9/17 14:30 +0.56 (3.62) -0.03% 0.91%
19D070 11/27 16:00 +1.66 (13.19) -0.26% 6.41%
5/29 16:00 +0.44 (3.61) -0.04 1.06%
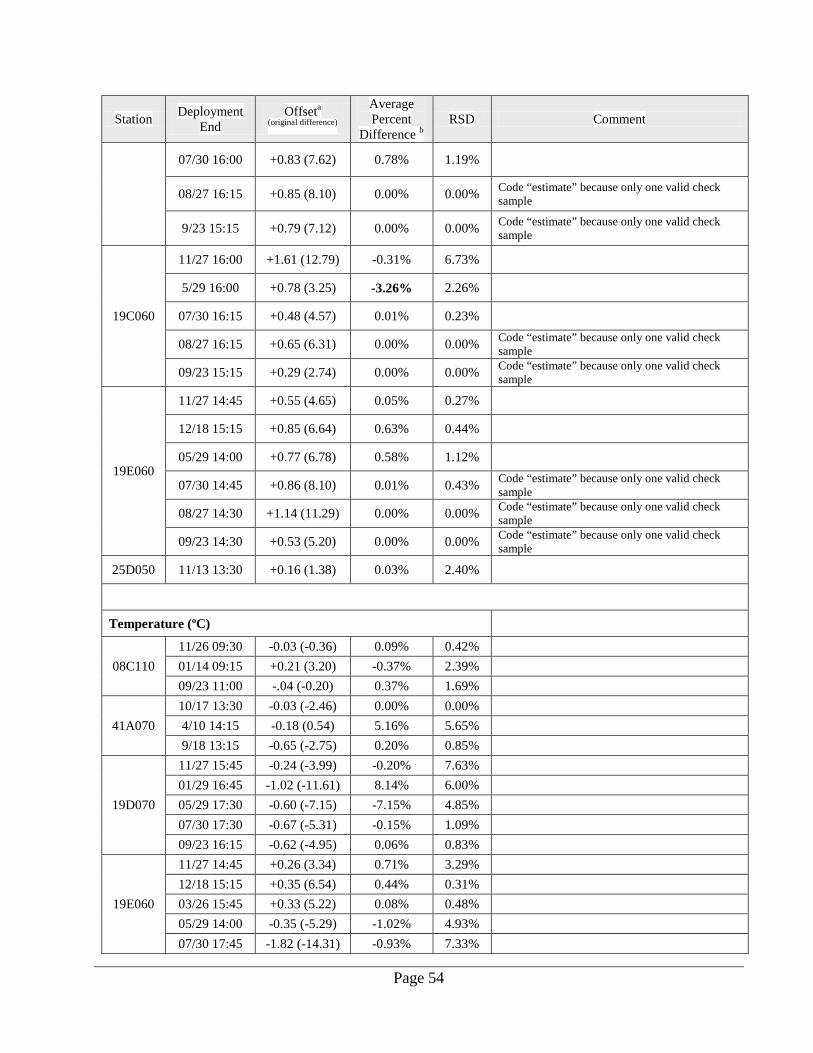
Page 54
Station Deployment End
Offseta
(original difference)
Average Percent
Difference b RSD Comment
07/30 16:00 +0.83 (7.62) 0.78% 1.19%
08/27 16:15 +0.85 (8.10) 0.00% 0.00% Code “estimate” because only one valid check sample
9/23 15:15 +0.79 (7.12) 0.00% 0.00% Code “estimate” because only one valid check sample
19C060
11/27 16:00 +1.61 (12.79) -0.31% 6.73%
5/29 16:00 +0.78 (3.25) -3.26% 2.26%
07/30 16:15 +0.48 (4.57) 0.01% 0.23%
08/27 16:15 +0.65 (6.31) 0.00% 0.00% Code “estimate” because only one valid check sample
09/23 15:15 +0.29 (2.74) 0.00% 0.00% Code “estimate” because only one valid check sample
19E060
11/27 14:45 +0.55 (4.65) 0.05% 0.27%
12/18 15:15 +0.85 (6.64) 0.63% 0.44%
05/29 14:00 +0.77 (6.78) 0.58% 1.12%
07/30 14:45 +0.86 (8.10) 0.01% 0.43% Code “estimate” because only one valid check sample
08/27 14:30 +1.14 (11.29) 0.00% 0.00% Code “estimate” because only one valid check sample
09/23 14:30 +0.53 (5.20) 0.00% 0.00% Code “estimate” because only one valid check sample
25D050 11/13 13:30 +0.16 (1.38) 0.03% 2.40%
Temperature (ºC)
08C110 11/26 09:30 -0.03 (-0.36) 0.09% 0.42%
01/14 09:15 +0.21 (3.20) -0.37% 2.39%
09/23 11:00 -.04 (-0.20) 0.37% 1.69%
41A070 10/17 13:30 -0.03 (-2.46) 0.00% 0.00% 4/10 14:15 -0.18 (0.54) 5.16% 5.65% 9/18 13:15 -0.65 (-2.75) 0.20% 0.85%
19D070
11/27 15:45 -0.24 (-3.99) -0.20% 7.63% 01/29 16:45 -1.02 (-11.61) 8.14% 6.00% 05/29 17:30 -0.60 (-7.15) -7.15% 4.85% 07/30 17:30 -0.67 (-5.31) -0.15% 1.09% 09/23 16:15 -0.62 (-4.95) 0.06% 0.83%
19E060
11/27 14:45 +0.26 (3.34) 0.71% 3.29% 12/18 15:15 +0.35 (6.54) 0.44% 0.31% 03/26 15:45 +0.33 (5.22) 0.08% 0.48% 05/29 14:00 -0.35 (-5.29) -1.02% 4.93% 07/30 17:45 -1.82 (-14.31) -0.93% 7.33%
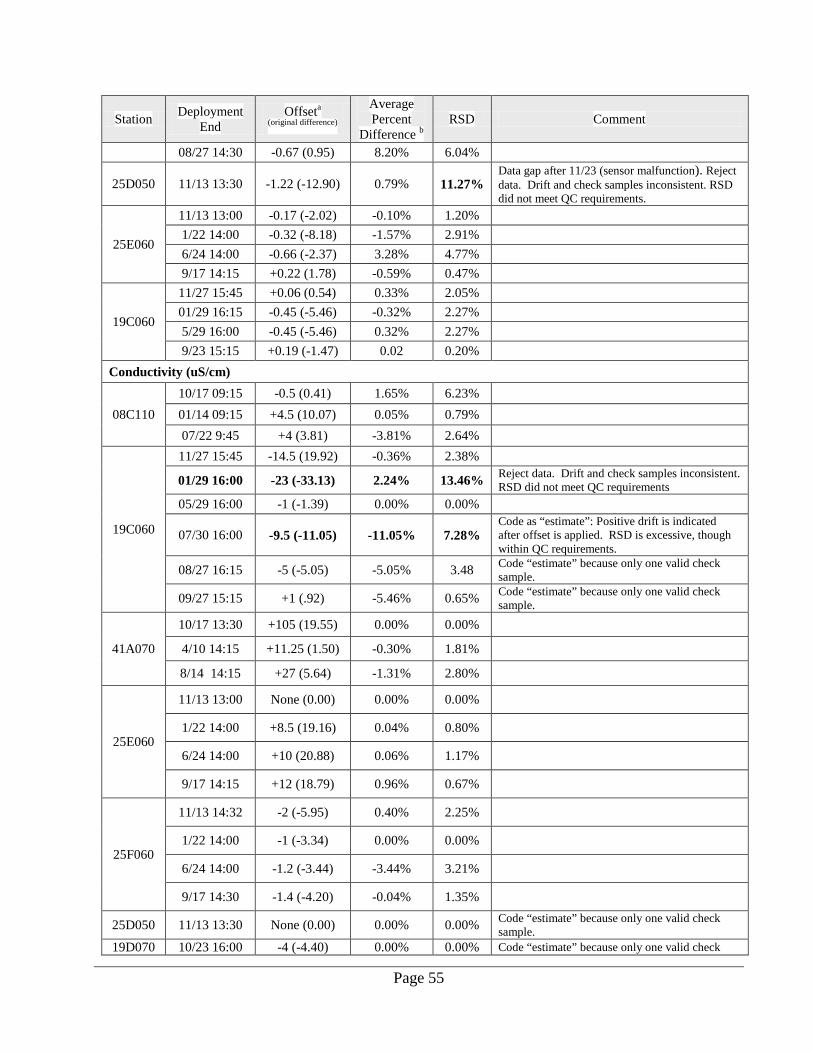
Page 55
Station Deployment End
Offseta
(original difference)
Average Percent
Difference b RSD Comment
08/27 14:30 -0.67 (0.95) 8.20% 6.04%
25D050 11/13 13:30 -1.22 (-12.90) 0.79% 11.27% Data gap after 11/23 (sensor malfunction). Reject data. Drift and check samples inconsistent. RSD did not meet QC requirements.
25E060
11/13 13:00 -0.17 (-2.02) -0.10% 1.20% 1/22 14:00 -0.32 (-8.18) -1.57% 2.91% 6/24 14:00 -0.66 (-2.37) 3.28% 4.77% 9/17 14:15 +0.22 (1.78) -0.59% 0.47%
19C060
11/27 15:45 +0.06 (0.54) 0.33% 2.05% 01/29 16:15 -0.45 (-5.46) -0.32% 2.27% 5/29 16:00 -0.45 (-5.46) 0.32% 2.27% 9/23 15:15 +0.19 (-1.47) 0.02 0.20%
Conductivity (uS/cm)
08C110 10/17 09:15 -0.5 (0.41) 1.65% 6.23% 01/14 09:15 +4.5 (10.07) 0.05% 0.79% 07/22 9:45 +4 (3.81) -3.81% 2.64%
19C060
11/27 15:45 -14.5 (19.92) -0.36% 2.38%
01/29 16:00 -23 (-33.13) 2.24% 13.46% Reject data. Drift and check samples inconsistent. RSD did not meet QC requirements
05/29 16:00 -1 (-1.39) 0.00% 0.00%
07/30 16:00 -9.5 (-11.05) -11.05% 7.28% Code as “estimate”: Positive drift is indicated after offset is applied. RSD is excessive, though within QC requirements.
08/27 16:15 -5 (-5.05) -5.05% 3.48 Code “estimate” because only one valid check sample.
09/27 15:15 +1 (.92) -5.46% 0.65% Code “estimate” because only one valid check sample.
41A070
10/17 13:30 +105 (19.55) 0.00% 0.00%
4/10 14:15 +11.25 (1.50) -0.30% 1.81%
8/14 14:15 +27 (5.64) -1.31% 2.80%
25E060
11/13 13:00 None (0.00) 0.00% 0.00%
1/22 14:00 +8.5 (19.16) 0.04% 0.80%
6/24 14:00 +10 (20.88) 0.06% 1.17%
9/17 14:15 +12 (18.79) 0.96% 0.67%
25F060
11/13 14:32 -2 (-5.95) 0.40% 2.25%
1/22 14:00 -1 (-3.34) 0.00% 0.00%
6/24 14:00 -1.2 (-3.44) -3.44% 3.21%
9/17 14:30 -1.4 (-4.20) -0.04% 1.35%
25D050 11/13 13:30 None (0.00) 0.00% 0.00% Code “estimate” because only one valid check sample.
19D070 10/23 16:00 -4 (-4.40) 0.00% 0.00% Code “estimate” because only one valid check
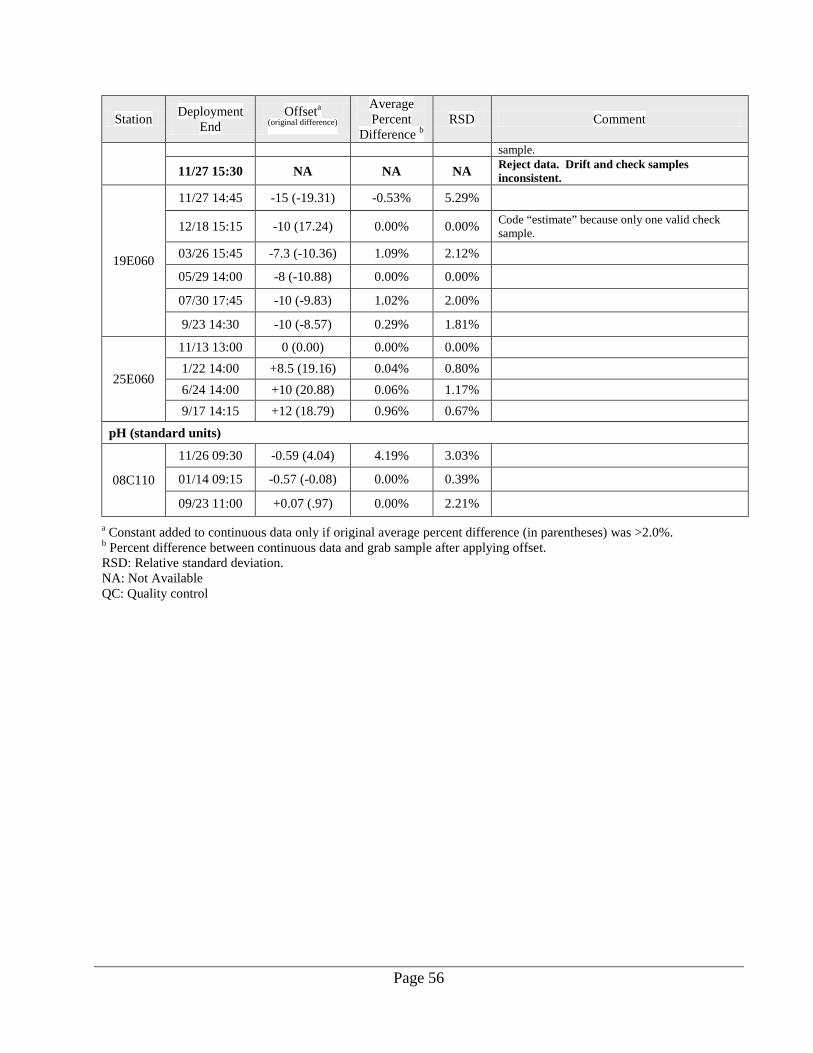
Page 56
Station Deployment End
Offseta
(original difference)
Average Percent
Difference b RSD Comment
sample.
11/27 15:30 NA NA NA Reject data. Drift and check samples inconsistent.
19E060
11/27 14:45 -15 (-19.31) -0.53% 5.29%
12/18 15:15 -10 (17.24) 0.00% 0.00% Code “estimate” because only one valid check sample.
03/26 15:45 -7.3 (-10.36) 1.09% 2.12%
05/29 14:00 -8 (-10.88) 0.00% 0.00%
07/30 17:45 -10 (-9.83) 1.02% 2.00%
9/23 14:30 -10 (-8.57) 0.29% 1.81%
25E060
11/13 13:00 0 (0.00) 0.00% 0.00%
1/22 14:00 +8.5 (19.16) 0.04% 0.80%
6/24 14:00 +10 (20.88) 0.06% 1.17%
9/17 14:15 +12 (18.79) 0.96% 0.67%
pH (standard units)
08C110
11/26 09:30 -0.59 (4.04) 4.19% 3.03% 01/14 09:15 -0.57 (-0.08) 0.00% 0.39% 09/23 11:00 +0.07 (.97) 0.00% 2.21%
a Constant added to continuous data only if original average percent difference (in parentheses) was >2.0%. b Percent difference between continuous data and grab sample after applying offset. RSD: Relative standard deviation. NA: Not Available QC: Quality control
Page 57
Conclusions and Recommendations Following are conclusions and recommendations that result from this Water Year (WY) 2013 study by Ecology's River and Stream Monitoring Program. Conclusions • Most quality control (QC) results were within the limits specified in our Quality Assurance
Management Plan and were consistent with findings in previous years.
• Except where noted otherwise, data collected in WY 2013 can be used without qualification.
• Our analysis indicated that freshwater contributions to nitrogen in the marine environment have not increased since 1995. Furthermore, there is an overall slight decreasing trend for total nitrogen (TN) flux from freshwater systems in the Puget Sound area from WY 1995-2013.
• Annual nitrogen yields in the Puget Sound area continue to be the highest in the Samish, Nooksack, and Stillaguamish watersheds. Summer nitrogen yields were highest in the Nooksack and Deschutes watersheds.
• Among the major rivers, the Snohomish and Nooksack represent the largest sources of freshwater nitrogen contribution to Puget Sound.
• Most all long-term TN and most nitrate + nitrite-nitrogen (NO2+NO3) trends, where significant, were down (decreasing concentrations).
• Since 2008, the mean difference in summer NO2+NO3 yields for all Puget Sound sites combined has increased slightly by 0.18 kg/sq. km/month, with a relative percent difference of 1.93%.
Recommendations • Quality assurance issues identified from the continuous multiple parameter monitoring should be
addressed during monitoring in WY 2014.
• Calibration methods and standards for the hand held LDO electrodes should be refined during monitoring in WY 2014.

Page 58
This page is purposely left blank
Page 59
References APHA, 2005. Standard Methods for the Examination of Water and Wastewater, 21st Edition. Joint publication of the American Public Health Association, American Water Works Association, and Water Environment Federation.
Aroner, E., 2008. WQHydro, Water Quality/Hydrology Graphics/Analysis System. PO Box 82468, Portland, OR, 97282.
Ecology, 2006. Water Quality Standards for Surface Waters of the State of Washington Chapter 173-201A WAC. Washington State Department of Ecology, Olympia WA. 113 p. Publication No. 06-10-091. https://fortress.wa.gov/ecy/publications/summarypages/0610091.html
Ecology, 2013. Water Quality Improvement Projects (TMDLS): WRIA 41: Lower Crab. http://www.ecy.wa.gov/programs/wq/tmdl/TMDLsbyWria/tmdl-wria41.html Accessed August 20, 2013.
Hallock, D., 2002. A Water Quality Index for Ecology's Stream Monitoring Program. Washington State Department of Ecology, Olympia, WA. 17 pp. + appendices. Publication No. 02-03-052. https://fortress.wa.gov/ecy/publications/summarypages/0203052.html
Hallock, D., 2004. Assessment of Changes in Water Quality in the Spokane River Between Riverside State Park and the Washington-Idaho Border. Washington State Department of Ecology, Olympia, WA. 54 pp. Publication No. 04-03-007. https://fortress.wa.gov/ecy/publications/summarypages/0403007.html
Hallock, D., 2005. Washington State Water Quality Conditions in 2005 based on Data from the Freshwater Monitoring Unit. Washington State Department of Ecology, Olympia, WA. Publication No. 05-03-036, with Technical Appendix bound separately. https://fortress.wa.gov/ecy/publications/summarypages/0603030.html
Hallock, D., 2009a. River and Stream Water Quality Monitoring Report, Water Year 2008. Washington State Department of Ecology, Olympia, WA. 72 pp. + appendices. Publication No. 09-03-041. https://fortress.wa.gov/ecy/publications/summarypages/0903041.html.
Hallock, D., 2009b. Quality Assurance Monitoring Plan: Continuous Monitoring for Oxygen, Temperature, pH, and Conductivity in Statewide Rivers and Streams. Washington State Department of Ecology, Olympia, WA. 24 pp. Publication No. 09-03-122. https://fortress.wa.gov/ecy/publications/summarypages/0903122.html.
Hallock, D., 2010. River and Stream Water Quality Monitoring Report, Water Year 2009. Washington State Department of Ecology, Olympia, WA. 50 pp. + appendices. Publication No. 10-03-046. https://fortress.wa.gov/ecy/publications/summarypages/1003046.html
Hallock, D., 2011. River and Stream Water Quality Monitoring Report, Water Year 2010. Washington State Department of Ecology, Olympia, WA. 40 pp. + appendices. Publication No. 11-03-037. https://fortress.wa.gov/ecy/publications/summarypages/1103037.html.
Page 60
Hallock, D., 2012a. Addendum to Quality Assurance Monitoring Plan: Stream Ambient Water Quality Monitoring: Correction of Objectives, Responsibilities, and Addition of Analytes. Washington State Department of Ecology, Olympia, WA. 11 pp. Publication No. 03-03-200-Addendum2. https://fortress.wa.gov/ecy/publications/summarypages/0303200Addendum2.html
Hallock, D., 2012b, River and Stream Water Quality Monitoring Report, Water Year 2012. Washington State Department of Ecology, Olympia, WA. 45 pp. + appendices. Publication No. 13-03-042. https://fortress.wa.gov/ecy/publications/SummaryPages/1303042.html
Hallock, D. and W. Ehinger, 2003. Quality Assurance Monitoring Plan: Stream Ambient Water Quality Monitoring. Washington State Department of Ecology, Olympia, WA. 27 pp. Publication No. 03-03-200. https://fortress.wa.gov/ecy/publications/summarypages/0303200.html
Hopkins, B., 1996. Ambient Metals Project Proposal - Final Quality Assurance Project Plan. Washington State Department of Ecology, Environmental Investigations and Laboratory Services Program, Olympia, WA. 19 pp. + appendices. March 1996.
MEL, 2008. Manchester Environmental Laboratory Lab Users Manual, Ninth Edition. Manchester Environmental Laboratory, Washington State Department of Ecology, Manchester, WA.
MEL, 2012. Manchester Environmental Laboratory Quality Assurance Manual. Manchester Environmental Laboratory, Washington State Department of Ecology, Manchester, WA.
Merritt, G., 2006. Status and Trends Monitoring for Watershed Health and Salmon Recovery: Quality Assurance Monitoring Plan. Washington State Department of Ecology, Olympia, WA. 54 pp. Publication No. 06-03-203. https://fortress.wa.gov/ecy/publications/summarypages/0603203.html.
Payne, S., 2006. Waters Requiring Supplemental Spawning and Incubation Protection for Salmonid Species. Washington State Department of Ecology, Olympia, WA. 49 pp. Publication No. 06-10-038. https://fortress.wa.gov/ecy/publications/summarypages/0610038.html.
Sokal, R.R. and F.J. Rohlf, 1995. Biometry: the principles and practice of statistics in biological research. 3rd edition. W. H. Freeman and Co.: New York. 887 pp. ISBN: 0-7167-2411-1.
U.S. Environmental Protection Agency, 1983. Methods for Chemical Analysis of Water and Wastes, EPA-600/ 4-79-020. U.S. Environmental Protection Agency, Cincinnati, Ohio.
Ward, W., 2005. Quality Assurance Project Plan: Continuous Stream Temperature Monitoring by the Freshwater Monitoring Unit. Washington State Department of Ecology, Olympia, WA. 18 pp. Publication No. 05-03-202. https://fortress.wa.gov/ecy/publications/summarypages/0503202.html.
Ward, W., 2007. Standard Operating Procedures for the Collection, Processing, and Analysis of Stream Samples, Version 1.0. Washington State Department of Ecology, Olympia, WA. SOP Number EAP034. http://www.ecy.wa.gov/programs/eap/quality.html.

Page 61
Ward, W., 2011. Standard Operating Procedures for Continuous Temperature Monitoring of Fresh Water Rivers and Streams. Version 1.0. Washington State Department of Ecology, Olympia, WA. SOP Number EAP080. http://www.ecy.wa.gov/programs/eap/quality.html.

Page 62
This page is purposely left blank

Page 63
Appendices

Page 64
This page is purposely left blank
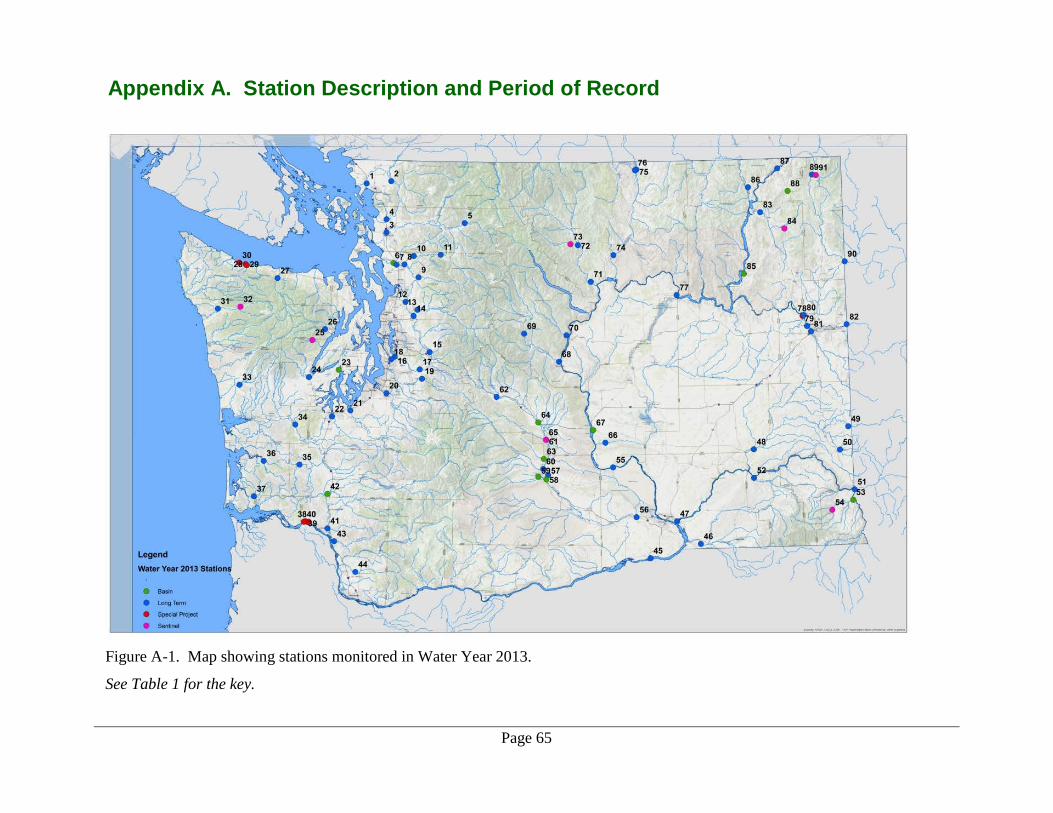
Page 65
Appendix A. Station Description and Period of Record
Figure A-1. Map showing stations monitored in Water Year 2013.
See Table 1 for the key.
Page 66
The following 19-page table provides: Monitoring History for Environmental Assessment Program Ambient Monitoring Stations
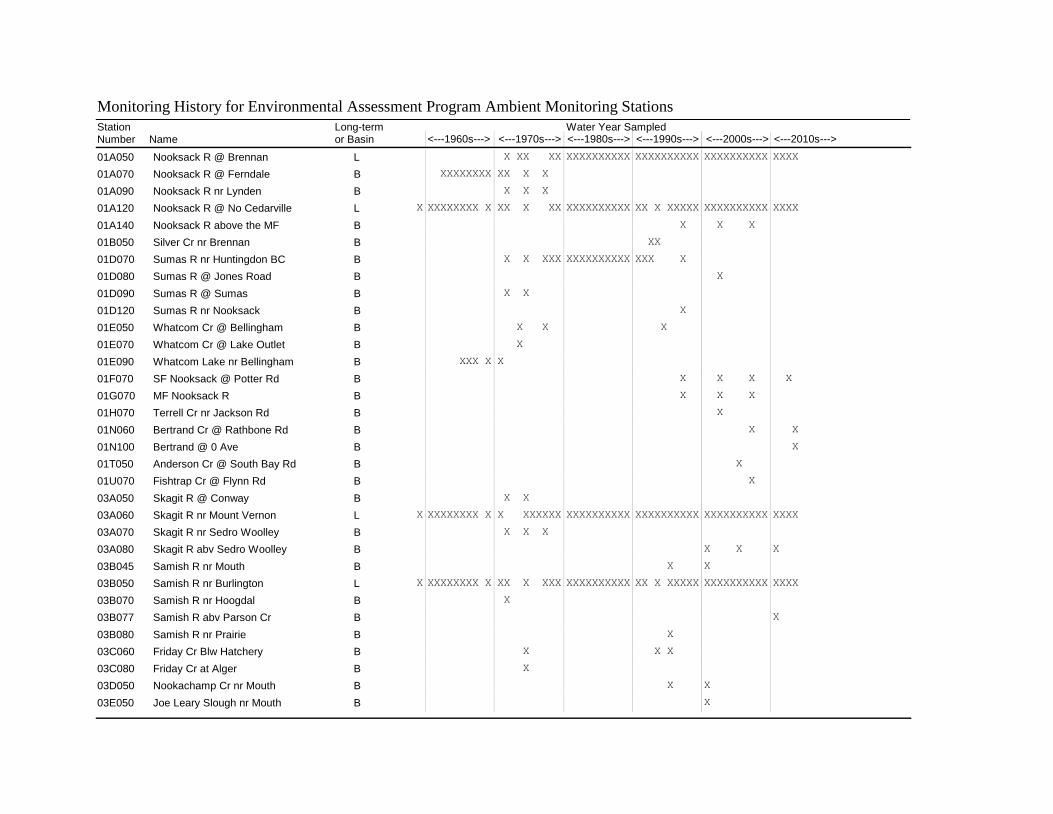
Monitoring History for Environmental Assessment Program Ambient Monitoring Stations
<---1980s---> <---1990s--->StationNumber Name <---1960s--->
Water Year Sampled<---1970s---> <---2000s--->
Long-termor Basin <---2010s--->
01A050 Nooksack R @ Brennan X XX XX XXXXXXXXXX XXXXXXXXXX XXXXXXXXXXL XXXX
01A070 Nooksack R @ Ferndale XXXXXXXX XX X X B
01A090 Nooksack R nr Lynden X X X B
X01A120 Nooksack R @ No Cedarville XXXXXXXX X XX X XX XXXXXXXXXX XX X XXXXX XXXXXXXXXXL XXXX
01A140 Nooksack R above the MF X X X B
01B050 Silver Cr nr Brennan XX B
01D070 Sumas R nr Huntingdon BC X X XXX XXXXXXXXXX XXX X B
01D080 Sumas R @ Jones Road X B
01D090 Sumas R @ Sumas X X B
01D120 Sumas R nr Nooksack X B
01E050 Whatcom Cr @ Bellingham X X X B
01E070 Whatcom Cr @ Lake Outlet X B
01E090 Whatcom Lake nr Bellingham XXX X X B
01F070 SF Nooksack @ Potter Rd X X X B X
01G070 MF Nooksack R X X X B
01H070 Terrell Cr nr Jackson Rd X B
01N060 Bertrand Cr @ Rathbone Rd X B X
01N100 Bertrand @ 0 Ave B X
01T050 Anderson Cr @ South Bay Rd X B
01U070 Fishtrap Cr @ Flynn Rd X B
03A050 Skagit R @ Conway X X B
X03A060 Skagit R nr Mount Vernon XXXXXXXX X X XXXXXX XXXXXXXXXX XXXXXXXXXX XXXXXXXXXXL XXXX
03A070 Skagit R nr Sedro Woolley X X X B
03A080 Skagit R abv Sedro Woolley X X B X
03B045 Samish R nr Mouth X X B
X03B050 Samish R nr Burlington XXXXXXXX X XX X XXX XXXXXXXXXX XX X XXXXX XXXXXXXXXXL XXXX
03B070 Samish R nr Hoogdal X B
03B077 Samish R abv Parson Cr B X
03B080 Samish R nr Prairie X B
03C060 Friday Cr Blw Hatchery X X X B
03C080 Friday Cr at Alger X B
03D050 Nookachamp Cr nr Mouth X X B
03E050 Joe Leary Slough nr Mouth X B
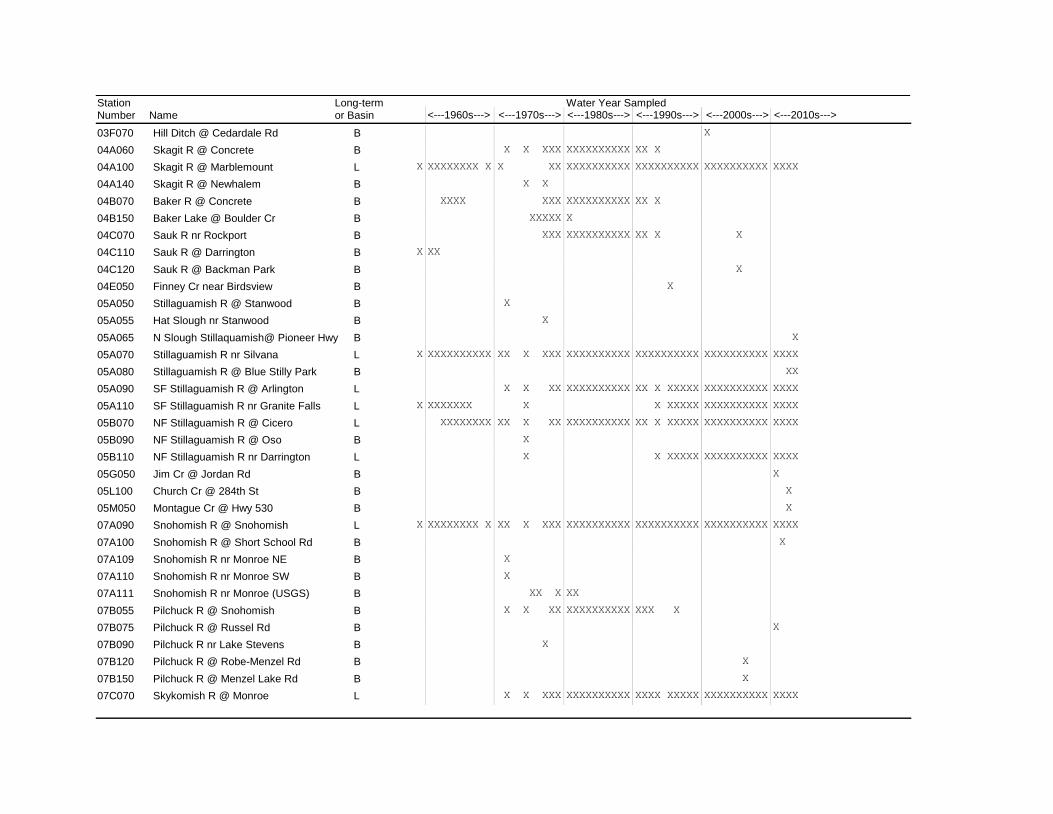
<---1980s---> <---1990s--->StationNumber Name <---1960s--->
Water Year Sampled<---1970s---> <---2000s--->
Long-termor Basin <---2010s--->
03F070 Hill Ditch @ Cedardale Rd X B
04A060 Skagit R @ Concrete X X XXX XXXXXXXXXX XX X B
X04A100 Skagit R @ Marblemount XXXXXXXX X X XX XXXXXXXXXX XXXXXXXXXX XXXXXXXXXXL XXXX
04A140 Skagit R @ Newhalem X X B
04B070 Baker R @ Concrete XXXX XXX XXXXXXXXXX XX X B
04B150 Baker Lake @ Boulder Cr XXXXX X B
04C070 Sauk R nr Rockport XXX XXXXXXXXXX XX X X B
X04C110 Sauk R @ Darrington XX B
04C120 Sauk R @ Backman Park X B
04E050 Finney Cr near Birdsview X B
05A050 Stillaguamish R @ Stanwood X B
05A055 Hat Slough nr Stanwood X B
05A065 N Slough Stillaquamish@ Pioneer Hwy B X
X05A070 Stillaguamish R nr Silvana XXXXXXXXXX XX X XXX XXXXXXXXXX XXXXXXXXXX XXXXXXXXXXL XXXX
05A080 Stillaguamish R @ Blue Stilly Park B XX
05A090 SF Stillaguamish R @ Arlington X X XX XXXXXXXXXX XX X XXXXX XXXXXXXXXXL XXXX
X05A110 SF Stillaguamish R nr Granite Falls XXXXXXX X X XXXXX XXXXXXXXXXL XXXX
05B070 NF Stillaguamish R @ Cicero XXXXXXXX XX X XX XXXXXXXXXX XX X XXXXX XXXXXXXXXXL XXXX
05B090 NF Stillaguamish R @ Oso X B
05B110 NF Stillaguamish R nr Darrington X X XXXXX XXXXXXXXXXL XXXX
05G050 Jim Cr @ Jordan Rd B X
05L100 Church Cr @ 284th St B X
05M050 Montague Cr @ Hwy 530 B X
X07A090 Snohomish R @ Snohomish XXXXXXXX X XX X XXX XXXXXXXXXX XXXXXXXXXX XXXXXXXXXXL XXXX
07A100 Snohomish R @ Short School Rd B X
07A109 Snohomish R nr Monroe NE X B
07A110 Snohomish R nr Monroe SW X B
07A111 Snohomish R nr Monroe (USGS) XX X XX B
07B055 Pilchuck R @ Snohomish X X XX XXXXXXXXXX XXX X B
07B075 Pilchuck R @ Russel Rd B X
07B090 Pilchuck R nr Lake Stevens X B
07B120 Pilchuck R @ Robe-Menzel Rd X B
07B150 Pilchuck R @ Menzel Lake Rd X B
07C070 Skykomish R @ Monroe X X XXX XXXXXXXXXX XXXX XXXXX XXXXXXXXXXL XXXX
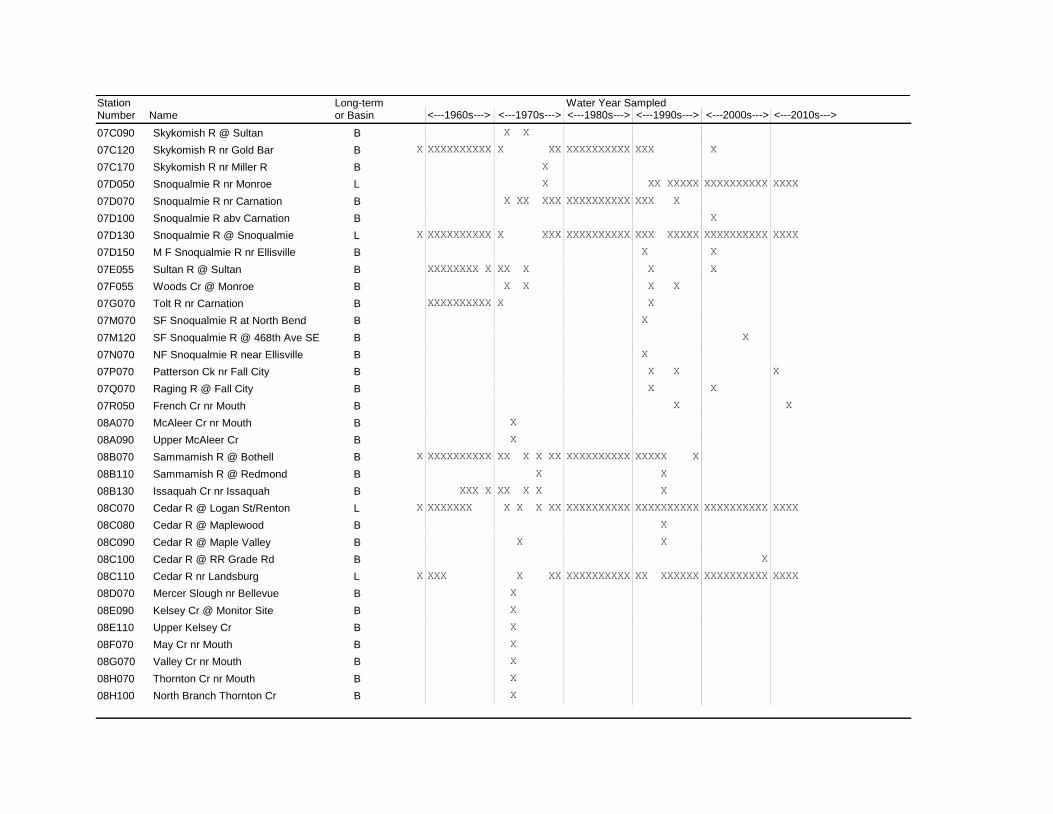
<---1980s---> <---1990s--->StationNumber Name <---1960s--->
Water Year Sampled<---1970s---> <---2000s--->
Long-termor Basin <---2010s--->
07C090 Skykomish R @ Sultan X X B
X07C120 Skykomish R nr Gold Bar XXXXXXXXXX X XX XXXXXXXXXX XXX X B
07C170 Skykomish R nr Miller R X B
07D050 Snoqualmie R nr Monroe X XX XXXXX XXXXXXXXXXL XXXX
07D070 Snoqualmie R nr Carnation X XX XXX XXXXXXXXXX XXX X B
07D100 Snoqualmie R abv Carnation X B
X07D130 Snoqualmie R @ Snoqualmie XXXXXXXXXX X XXX XXXXXXXXXX XXX XXXXX XXXXXXXXXXL XXXX
07D150 M F Snoqualmie R nr Ellisville X X B
07E055 Sultan R @ Sultan XXXXXXXX X XX X X X B
07F055 Woods Cr @ Monroe X X X X B
07G070 Tolt R nr Carnation XXXXXXXXXX X X B
07M070 SF Snoqualmie R at North Bend X B
07M120 SF Snoqualmie R @ 468th Ave SE X B
07N070 NF Snoqualmie R near Ellisville X B
07P070 Patterson Ck nr Fall City X X B X
07Q070 Raging R @ Fall City X X B
07R050 French Cr nr Mouth X B X
08A070 McAleer Cr nr Mouth X B
08A090 Upper McAleer Cr X B
X08B070 Sammamish R @ Bothell XXXXXXXXXX XX X X XX XXXXXXXXXX XXXXX X B
08B110 Sammamish R @ Redmond X X B
08B130 Issaquah Cr nr Issaquah XXX X XX X X X B
X08C070 Cedar R @ Logan St/Renton XXXXXXX X X X XX XXXXXXXXXX XXXXXXXXXX XXXXXXXXXXL XXXX
08C080 Cedar R @ Maplewood X B
08C090 Cedar R @ Maple Valley X X B
08C100 Cedar R @ RR Grade Rd XB
X08C110 Cedar R nr Landsburg XXX X XX XXXXXXXXXX XX XXXXXX XXXXXXXXXXL XXXX
08D070 Mercer Slough nr Bellevue X B
08E090 Kelsey Cr @ Monitor Site X B
08E110 Upper Kelsey Cr X B
08F070 May Cr nr Mouth X B
08G070 Valley Cr nr Mouth X B
08H070 Thornton Cr nr Mouth X B
08H100 North Branch Thornton Cr X B
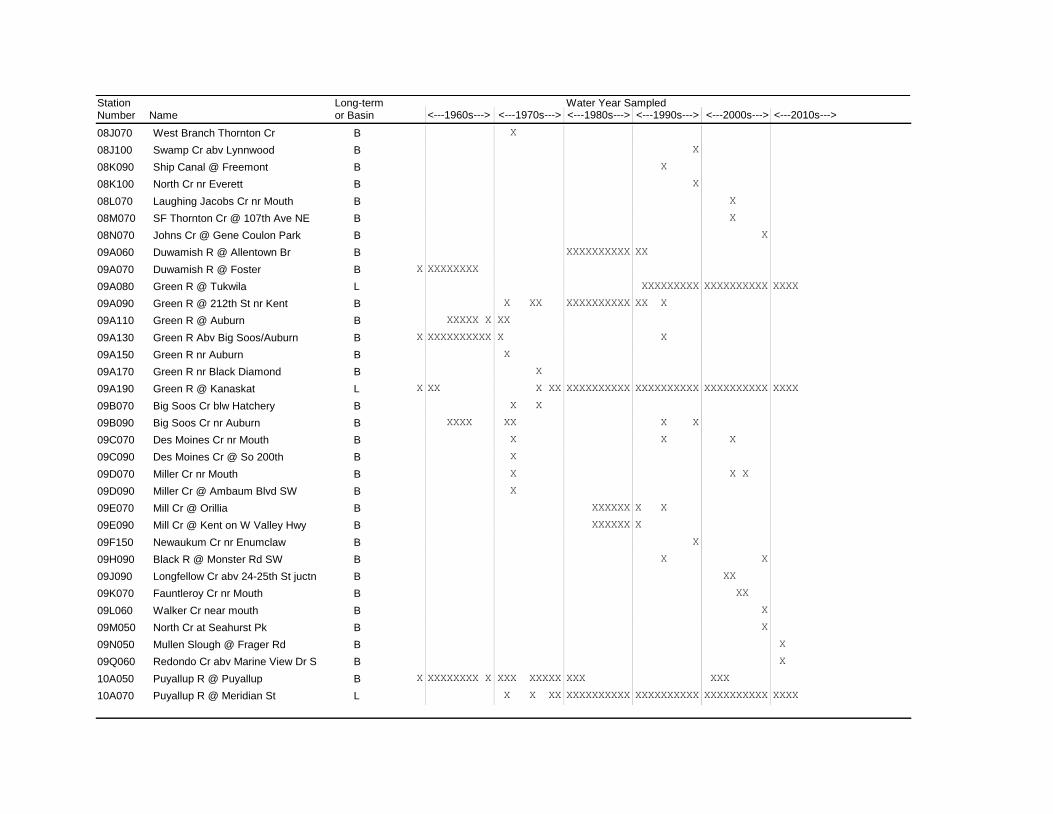
<---1980s---> <---1990s--->StationNumber Name <---1960s--->
Water Year Sampled<---1970s---> <---2000s--->
Long-termor Basin <---2010s--->
08J070 West Branch Thornton Cr X B
08J100 Swamp Cr abv Lynnwood X B
08K090 Ship Canal @ Freemont X B
08K100 North Cr nr Everett X B
08L070 Laughing Jacobs Cr nr Mouth X B
08M070 SF Thornton Cr @ 107th Ave NE X B
08N070 Johns Cr @ Gene Coulon Park XB
09A060 Duwamish R @ Allentown Br XXXXXXXXXX XX B
X09A070 Duwamish R @ Foster XXXXXXXX B
09A080 Green R @ Tukwila XXXXXXXXX XXXXXXXXXXL XXXX
09A090 Green R @ 212th St nr Kent X XX XXXXXXXXXX XX X B
09A110 Green R @ Auburn XXXXX X XX B
X09A130 Green R Abv Big Soos/Auburn XXXXXXXXXX X X B
09A150 Green R nr Auburn X B
09A170 Green R nr Black Diamond X B
X09A190 Green R @ Kanaskat XX X XX XXXXXXXXXX XXXXXXXXXX XXXXXXXXXXL XXXX
09B070 Big Soos Cr blw Hatchery X X B
09B090 Big Soos Cr nr Auburn XXXX XX X X B
09C070 Des Moines Cr nr Mouth X X X B
09C090 Des Moines Cr @ So 200th X B
09D070 Miller Cr nr Mouth X X X B
09D090 Miller Cr @ Ambaum Blvd SW X B
09E070 Mill Cr @ Orillia XXXXXX X X B
09E090 Mill Cr @ Kent on W Valley Hwy XXXXXX X B
09F150 Newaukum Cr nr Enumclaw X B
09H090 Black R @ Monster Rd SW X XB
09J090 Longfellow Cr abv 24-25th St juctn XX B
09K070 Fauntleroy Cr nr Mouth XX B
09L060 Walker Cr near mouth XB
09M050 North Cr at Seahurst Pk XB
09N050 Mullen Slough @ Frager Rd B X
09Q060 Redondo Cr abv Marine View Dr S B X
X10A050 Puyallup R @ Puyallup XXXXXXXX X XXX XXXXX XXX XXX B
10A070 Puyallup R @ Meridian St X X XX XXXXXXXXXX XXXXXXXXXX XXXXXXXXXXL XXXX
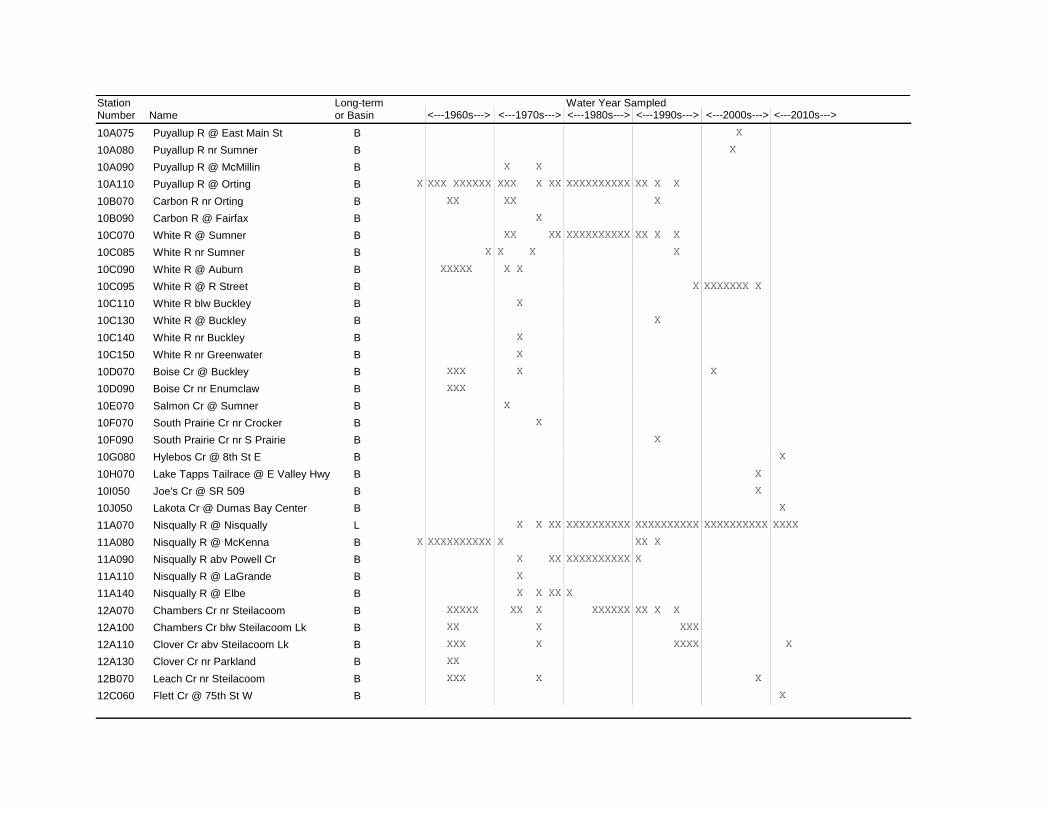
<---1980s---> <---1990s--->StationNumber Name <---1960s--->
Water Year Sampled<---1970s---> <---2000s--->
Long-termor Basin <---2010s--->
10A075 Puyallup R @ East Main St X B
10A080 Puyallup R nr Sumner X B
10A090 Puyallup R @ McMillin X X B
X10A110 Puyallup R @ Orting XXX XXXXXX XXX X XX XXXXXXXXXX XX X X B
10B070 Carbon R nr Orting XX XX X B
10B090 Carbon R @ Fairfax X B
10C070 White R @ Sumner XX XX XXXXXXXXXX XX X X B
10C085 White R nr Sumner X X X X B
10C090 White R @ Auburn XXXXX X X B
10C095 White R @ R Street X XXXXXXX X B
10C110 White R blw Buckley X B
10C130 White R @ Buckley X B
10C140 White R nr Buckley X B
10C150 White R nr Greenwater X B
10D070 Boise Cr @ Buckley XXX X X B
10D090 Boise Cr nr Enumclaw XXX B
10E070 Salmon Cr @ Sumner X B
10F070 South Prairie Cr nr Crocker X B
10F090 South Prairie Cr nr S Prairie X B
10G080 Hylebos Cr @ 8th St E B X
10H070 Lake Tapps Tailrace @ E Valley Hwy X B
10I050 Joe's Cr @ SR 509 X B
10J050 Lakota Cr @ Dumas Bay Center B X
11A070 Nisqually R @ Nisqually X X XX XXXXXXXXXX XXXXXXXXXX XXXXXXXXXXL XXXX
X11A080 Nisqually R @ McKenna XXXXXXXXXX X XX X B
11A090 Nisqually R abv Powell Cr X XX XXXXXXXXXX X B
11A110 Nisqually R @ LaGrande X B
11A140 Nisqually R @ Elbe X X XX X B
12A070 Chambers Cr nr Steilacoom XXXXX XX X XXXXXX XX X X B
12A100 Chambers Cr blw Steilacoom Lk XX X XXX B
12A110 Clover Cr abv Steilacoom Lk XXX X XXXX B X
12A130 Clover Cr nr Parkland XX B
12B070 Leach Cr nr Steilacoom XXX X X B
12C060 Flett Cr @ 75th St W B X
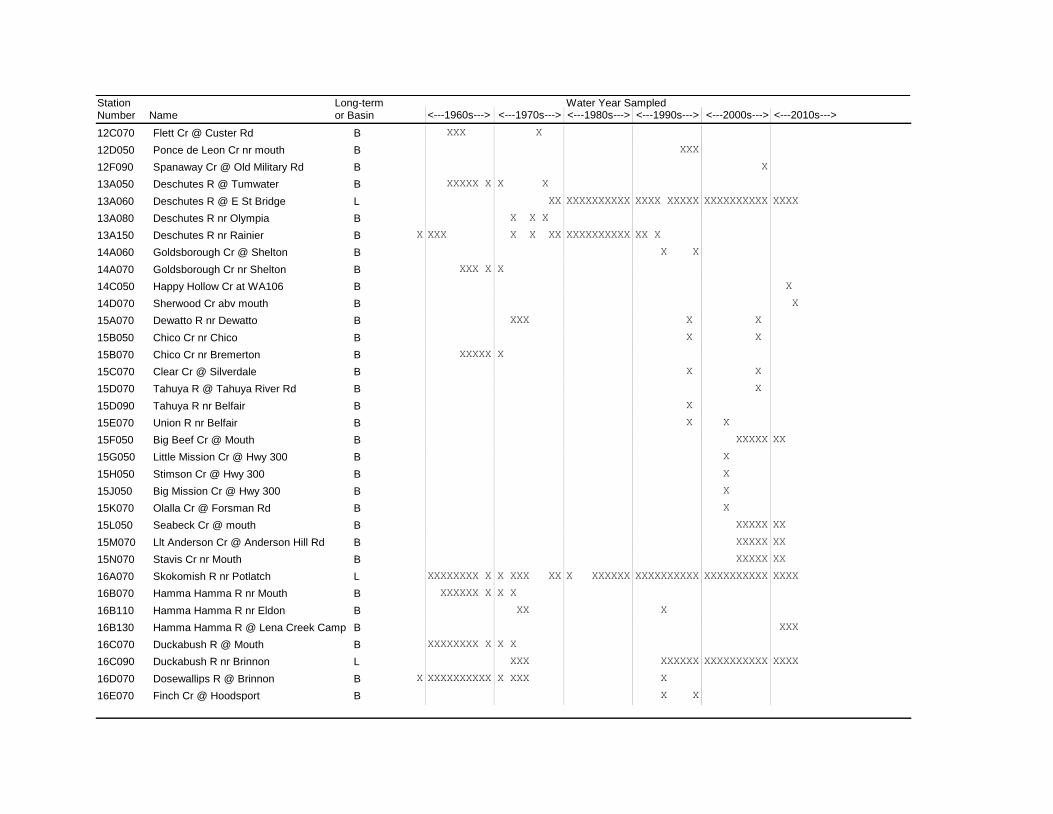
<---1980s---> <---1990s--->StationNumber Name <---1960s--->
Water Year Sampled<---1970s---> <---2000s--->
Long-termor Basin <---2010s--->
12C070 Flett Cr @ Custer Rd XXX X B
12D050 Ponce de Leon Cr nr mouth XXX B
12F090 Spanaway Cr @ Old Military Rd XB
13A050 Deschutes R @ Tumwater XXXXX X X X B
13A060 Deschutes R @ E St Bridge XX XXXXXXXXXX XXXX XXXXX XXXXXXXXXXL XXXX
13A080 Deschutes R nr Olympia X X X B
X13A150 Deschutes R nr Rainier XXX X X XX XXXXXXXXXX XX X B
14A060 Goldsborough Cr @ Shelton X X B
14A070 Goldsborough Cr nr Shelton XXX X X B
14C050 Happy Hollow Cr at WA106 B X
14D070 Sherwood Cr abv mouth B X
15A070 Dewatto R nr Dewatto XXX X X B
15B050 Chico Cr nr Chico X X B
15B070 Chico Cr nr Bremerton XXXXX X B
15C070 Clear Cr @ Silverdale X X B
15D070 Tahuya R @ Tahuya River Rd X B
15D090 Tahuya R nr Belfair X B
15E070 Union R nr Belfair X X B
15F050 Big Beef Cr @ Mouth XXXXXB XX
15G050 Little Mission Cr @ Hwy 300 X B
15H050 Stimson Cr @ Hwy 300 X B
15J050 Big Mission Cr @ Hwy 300 X B
15K070 Olalla Cr @ Forsman Rd X B
15L050 Seabeck Cr @ mouth XXXXXB XX
15M070 Llt Anderson Cr @ Anderson Hill Rd XXXXXB XX
15N070 Stavis Cr nr Mouth XXXXXB XX
16A070 Skokomish R nr Potlatch XXXXXXXX X X XXX XX X XXXXXX XXXXXXXXXX XXXXXXXXXXL XXXX
16B070 Hamma Hamma R nr Mouth XXXXXX X X X B
16B110 Hamma Hamma R nr Eldon XX X B
16B130 Hamma Hamma R @ Lena Creek Camp B XXX
16C070 Duckabush R @ Mouth XXXXXXXX X X X B
16C090 Duckabush R nr Brinnon XXX XXXXXX XXXXXXXXXXL XXXX
X16D070 Dosewallips R @ Brinnon XXXXXXXXXX X XXX X B
16E070 Finch Cr @ Hoodsport X X B
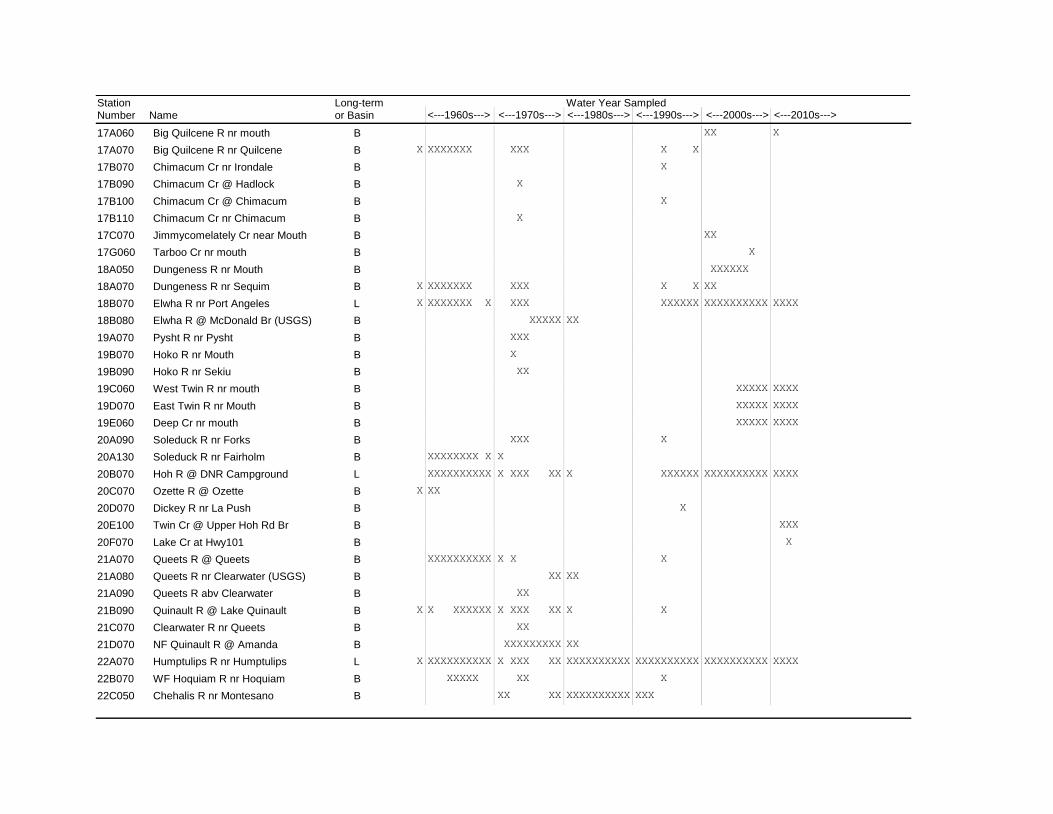
<---1980s---> <---1990s--->StationNumber Name <---1960s--->
Water Year Sampled<---1970s---> <---2000s--->
Long-termor Basin <---2010s--->
17A060 Big Quilcene R nr mouth XX B X
X17A070 Big Quilcene R nr Quilcene XXXXXXX XXX X X B
17B070 Chimacum Cr nr Irondale X B
17B090 Chimacum Cr @ Hadlock X B
17B100 Chimacum Cr @ Chimacum X B
17B110 Chimacum Cr nr Chimacum X B
17C070 Jimmycomelately Cr near Mouth XX B
17G060 Tarboo Cr nr mouth X B
18A050 Dungeness R nr Mouth XXXXXX B
X18A070 Dungeness R nr Sequim XXXXXXX XXX X X XX B
X18B070 Elwha R nr Port Angeles XXXXXXX X XXX XXXXXX XXXXXXXXXXL XXXX
18B080 Elwha R @ McDonald Br (USGS) XXXXX XX B
19A070 Pysht R nr Pysht XXX B
19B070 Hoko R nr Mouth X B
19B090 Hoko R nr Sekiu XX B
19C060 West Twin R nr mouth XXXXXB XXXX
19D070 East Twin R nr Mouth XXXXXB XXXX
19E060 Deep Cr nr mouth XXXXXB XXXX
20A090 Soleduck R nr Forks XXX X B
20A130 Soleduck R nr Fairholm XXXXXXXX X X B
20B070 Hoh R @ DNR Campground XXXXXXXXXX X XXX XX X XXXXXX XXXXXXXXXXL XXXX
X20C070 Ozette R @ Ozette XX B
20D070 Dickey R nr La Push X B
20E100 Twin Cr @ Upper Hoh Rd Br B XXX
20F070 Lake Cr at Hwy101 B X
21A070 Queets R @ Queets XXXXXXXXXX X X X B
21A080 Queets R nr Clearwater (USGS) XX XX B
21A090 Queets R abv Clearwater XX B
X21B090 Quinault R @ Lake Quinault X XXXXXX X XXX XX X X B
21C070 Clearwater R nr Queets XX B
21D070 NF Quinault R @ Amanda XXXXXXXXX XX B
X22A070 Humptulips R nr Humptulips XXXXXXXXXX X XXX XX XXXXXXXXXX XXXXXXXXXX XXXXXXXXXXL XXXX
22B070 WF Hoquiam R nr Hoquiam XXXXX XX X B
22C050 Chehalis R nr Montesano XX XX XXXXXXXXXX XXX B
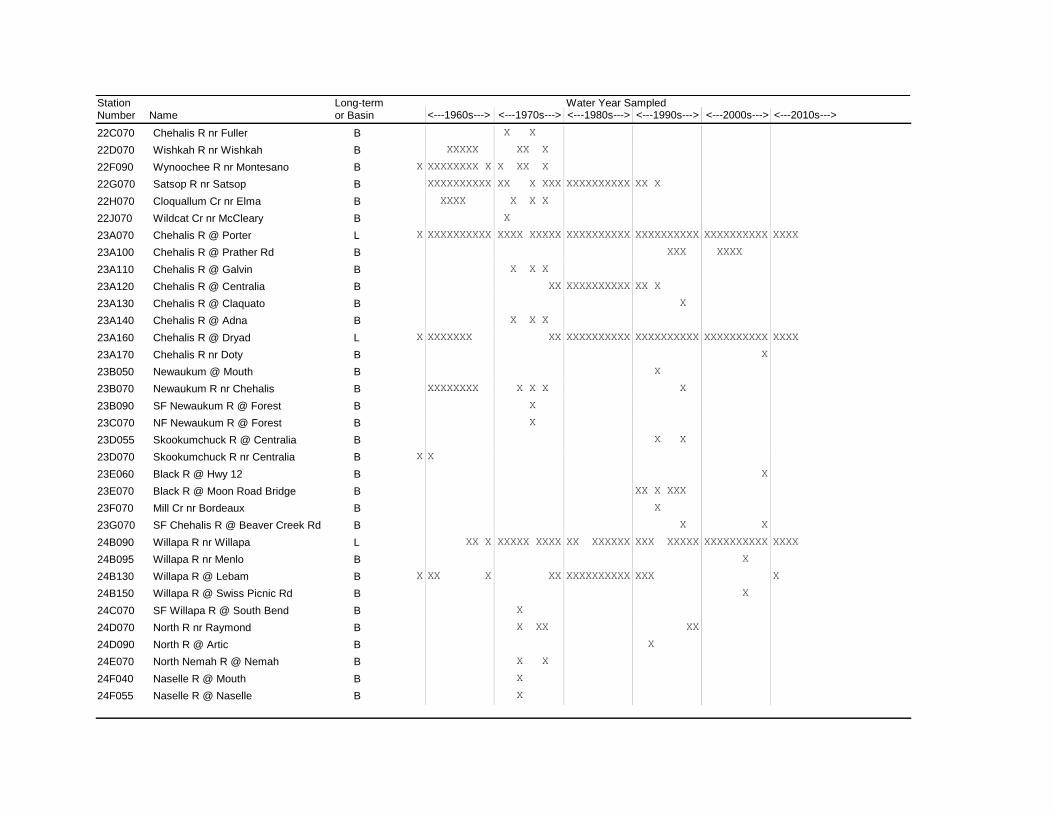
<---1980s---> <---1990s--->StationNumber Name <---1960s--->
Water Year Sampled<---1970s---> <---2000s--->
Long-termor Basin <---2010s--->
22C070 Chehalis R nr Fuller X X B
22D070 Wishkah R nr Wishkah XXXXX XX X B
X22F090 Wynoochee R nr Montesano XXXXXXXX X X XX X B
22G070 Satsop R nr Satsop XXXXXXXXXX XX X XXX XXXXXXXXXX XX X B
22H070 Cloquallum Cr nr Elma XXXX X X X B
22J070 Wildcat Cr nr McCleary X B
X23A070 Chehalis R @ Porter XXXXXXXXXX XXXX XXXXX XXXXXXXXXX XXXXXXXXXX XXXXXXXXXXL XXXX
23A100 Chehalis R @ Prather Rd XXX XXXX B
23A110 Chehalis R @ Galvin X X X B
23A120 Chehalis R @ Centralia XX XXXXXXXXXX XX X B
23A130 Chehalis R @ Claquato X B
23A140 Chehalis R @ Adna X X X B
X23A160 Chehalis R @ Dryad XXXXXXX XX XXXXXXXXXX XXXXXXXXXX XXXXXXXXXXL XXXX
23A170 Chehalis R nr Doty XB
23B050 Newaukum @ Mouth X B
23B070 Newaukum R nr Chehalis XXXXXXXX X X X X B
23B090 SF Newaukum R @ Forest X B
23C070 NF Newaukum R @ Forest X B
23D055 Skookumchuck R @ Centralia X X B
X23D070 Skookumchuck R nr Centralia X B
23E060 Black R @ Hwy 12 XB
23E070 Black R @ Moon Road Bridge XX X XXX B
23F070 Mill Cr nr Bordeaux X B
23G070 SF Chehalis R @ Beaver Creek Rd X XB
24B090 Willapa R nr Willapa XX X XXXXX XXXX XX XXXXXX XXX XXXXX XXXXXXXXXXL XXXX
24B095 Willapa R nr Menlo X B
X24B130 Willapa R @ Lebam XX X XX XXXXXXXXXX XXX B X
24B150 Willapa R @ Swiss Picnic Rd X B
24C070 SF Willapa R @ South Bend X B
24D070 North R nr Raymond X XX XX B
24D090 North R @ Artic X B
24E070 North Nemah R @ Nemah X X B
24F040 Naselle R @ Mouth X B
24F055 Naselle R @ Naselle X B
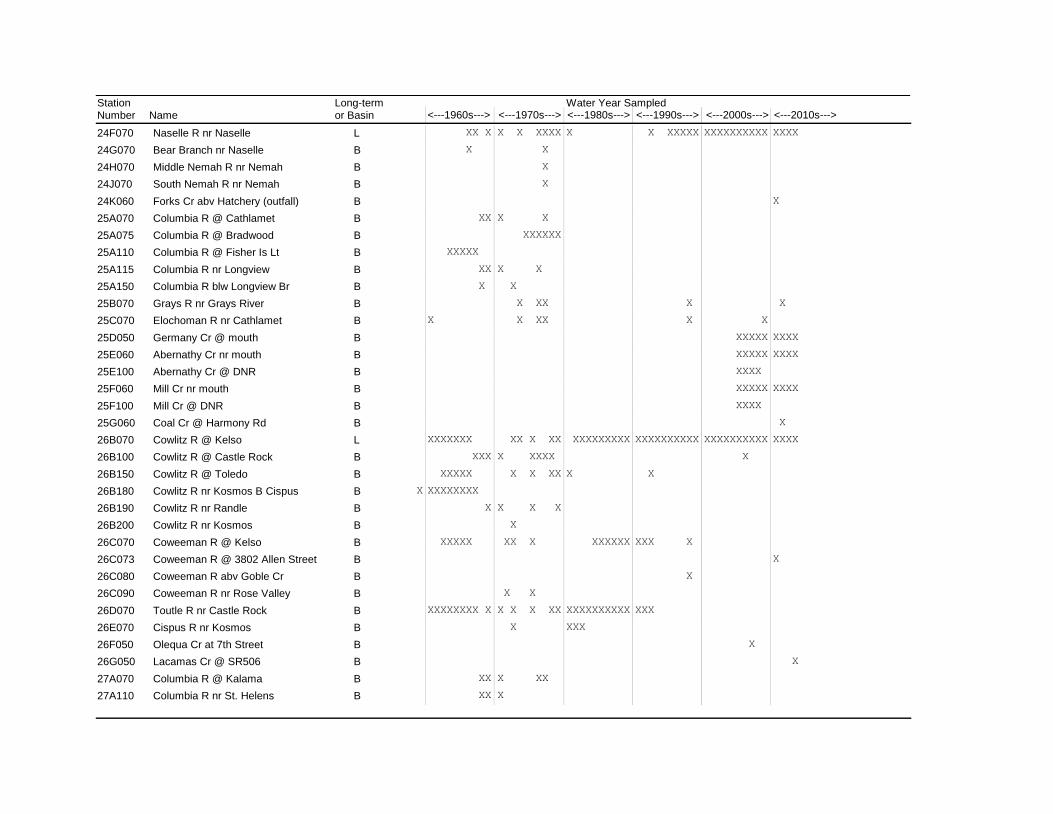
<---1980s---> <---1990s--->StationNumber Name <---1960s--->
Water Year Sampled<---1970s---> <---2000s--->
Long-termor Basin <---2010s--->
24F070 Naselle R nr Naselle XX X X X XXXX X X XXXXX XXXXXXXXXXL XXXX
24G070 Bear Branch nr Naselle X X B
24H070 Middle Nemah R nr Nemah X B
24J070 South Nemah R nr Nemah X B
24K060 Forks Cr abv Hatchery (outfall) B X
25A070 Columbia R @ Cathlamet XX X X B
25A075 Columbia R @ Bradwood XXXXXX B
25A110 Columbia R @ Fisher Is Lt XXXXX B
25A115 Columbia R nr Longview XX X X B
25A150 Columbia R blw Longview Br X X B
25B070 Grays R nr Grays River X XX X B X
25C070 Elochoman R nr Cathlamet X X XX X XB
25D050 Germany Cr @ mouth XXXXXB XXXX
25E060 Abernathy Cr nr mouth XXXXXB XXXX
25E100 Abernathy Cr @ DNR XXXX B
25F060 Mill Cr nr mouth XXXXXB XXXX
25F100 Mill Cr @ DNR XXXX B
25G060 Coal Cr @ Harmony Rd B X
26B070 Cowlitz R @ Kelso XXXXXXX XX X XX XXXXXXXXX XXXXXXXXXX XXXXXXXXXXL XXXX
26B100 Cowlitz R @ Castle Rock XXX X XXXX X B
26B150 Cowlitz R @ Toledo XXXXX X X XX X X B
X26B180 Cowlitz R nr Kosmos B Cispus XXXXXXXX B
26B190 Cowlitz R nr Randle X X X X B
26B200 Cowlitz R nr Kosmos X B
26C070 Coweeman R @ Kelso XXXXX XX X XXXXXX XXX X B
26C073 Coweeman R @ 3802 Allen Street B X
26C080 Coweeman R abv Goble Cr X B
26C090 Coweeman R nr Rose Valley X X B
26D070 Toutle R nr Castle Rock XXXXXXXX X X X X XX XXXXXXXXXX XXX B
26E070 Cispus R nr Kosmos X XXX B
26F050 Olequa Cr at 7th Street X B
26G050 Lacamas Cr @ SR506 B X
27A070 Columbia R @ Kalama XX X XX B
27A110 Columbia R nr St. Helens XX X B
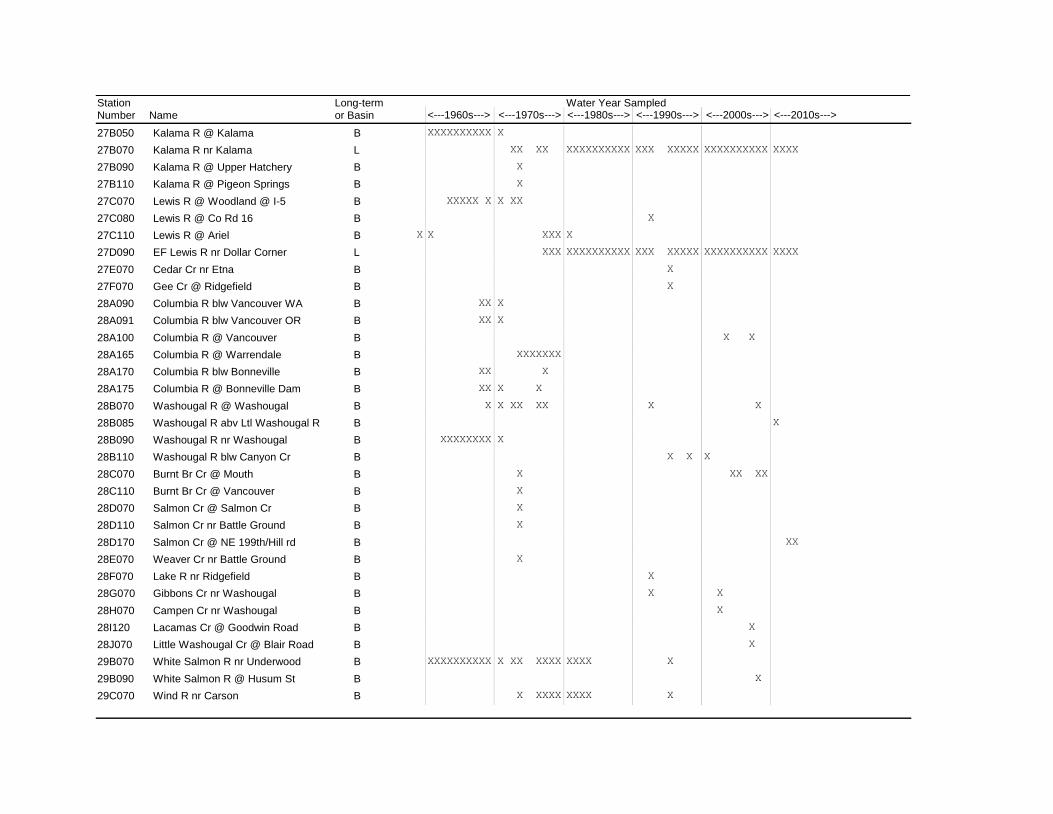
<---1980s---> <---1990s--->StationNumber Name <---1960s--->
Water Year Sampled<---1970s---> <---2000s--->
Long-termor Basin <---2010s--->
27B050 Kalama R @ Kalama XXXXXXXXXX X B
27B070 Kalama R nr Kalama XX XX XXXXXXXXXX XXX XXXXX XXXXXXXXXXL XXXX
27B090 Kalama R @ Upper Hatchery X B
27B110 Kalama R @ Pigeon Springs X B
27C070 Lewis R @ Woodland @ I-5 XXXXX X X XX B
27C080 Lewis R @ Co Rd 16 X B
X27C110 Lewis R @ Ariel X XXX X B
27D090 EF Lewis R nr Dollar Corner XXX XXXXXXXXXX XXX XXXXX XXXXXXXXXXL XXXX
27E070 Cedar Cr nr Etna X B
27F070 Gee Cr @ Ridgefield X B
28A090 Columbia R blw Vancouver WA XX X B
28A091 Columbia R blw Vancouver OR XX X B
28A100 Columbia R @ Vancouver X X B
28A165 Columbia R @ Warrendale XXXXXXX B
28A170 Columbia R blw Bonneville XX X B
28A175 Columbia R @ Bonneville Dam XX X X B
28B070 Washougal R @ Washougal X X XX XX X X B
28B085 Washougal R abv Ltl Washougal R B X
28B090 Washougal R nr Washougal XXXXXXXX X B
28B110 Washougal R blw Canyon Cr X X X B
28C070 Burnt Br Cr @ Mouth X XX XXB
28C110 Burnt Br Cr @ Vancouver X B
28D070 Salmon Cr @ Salmon Cr X B
28D110 Salmon Cr nr Battle Ground X B
28D170 Salmon Cr @ NE 199th/Hill rd B XX
28E070 Weaver Cr nr Battle Ground X B
28F070 Lake R nr Ridgefield X B
28G070 Gibbons Cr nr Washougal X X B
28H070 Campen Cr nr Washougal X B
28I120 Lacamas Cr @ Goodwin Road X B
28J070 Little Washougal Cr @ Blair Road X B
29B070 White Salmon R nr Underwood XXXXXXXXXX X XX XXXX XXXX X B
29B090 White Salmon R @ Husum St X B
29C070 Wind R nr Carson X XXXX XXXX X B
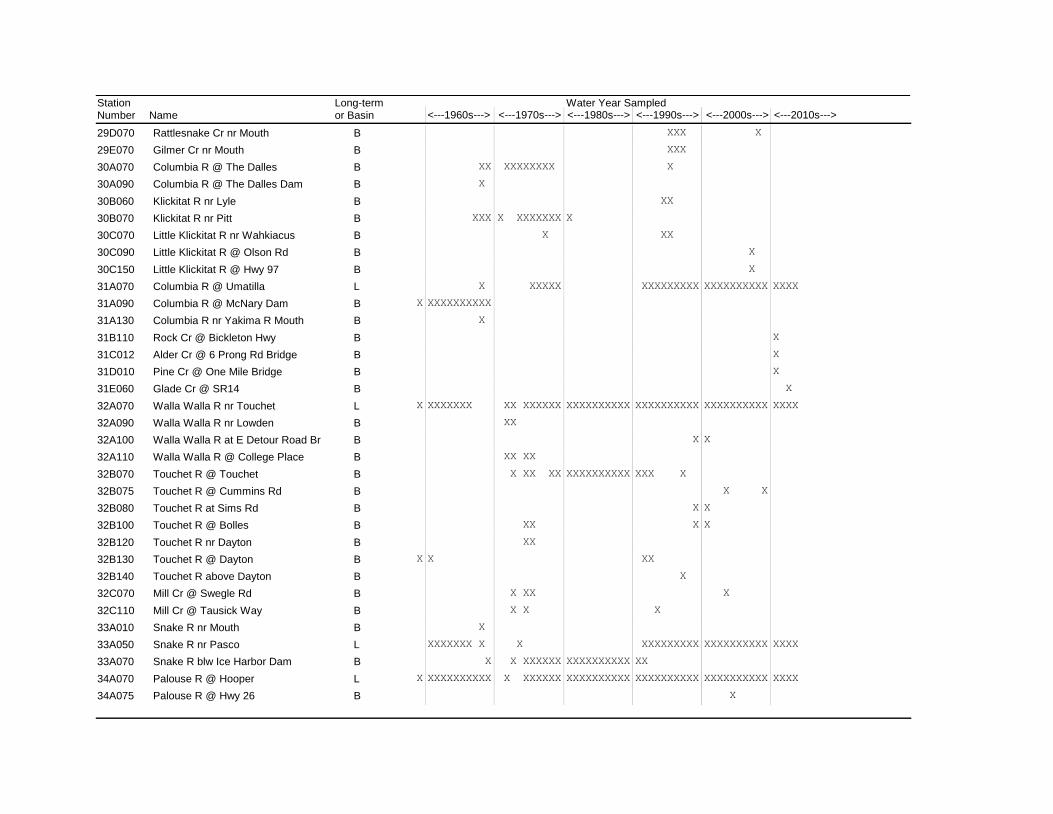
<---1980s---> <---1990s--->StationNumber Name <---1960s--->
Water Year Sampled<---1970s---> <---2000s--->
Long-termor Basin <---2010s--->
29D070 Rattlesnake Cr nr Mouth XXX X B
29E070 Gilmer Cr nr Mouth XXX B
30A070 Columbia R @ The Dalles XX XXXXXXXX X B
30A090 Columbia R @ The Dalles Dam X B
30B060 Klickitat R nr Lyle XX B
30B070 Klickitat R nr Pitt XXX X XXXXXXX X B
30C070 Little Klickitat R nr Wahkiacus X XX B
30C090 Little Klickitat R @ Olson Rd X B
30C150 Little Klickitat R @ Hwy 97 X B
31A070 Columbia R @ Umatilla X XXXXX XXXXXXXXX XXXXXXXXXXL XXXX
X31A090 Columbia R @ McNary Dam XXXXXXXXXX B
31A130 Columbia R nr Yakima R Mouth X B
31B110 Rock Cr @ Bickleton Hwy B X
31C012 Alder Cr @ 6 Prong Rd Bridge B X
31D010 Pine Cr @ One Mile Bridge B X
31E060 Glade Cr @ SR14 B X
X32A070 Walla Walla R nr Touchet XXXXXXX XX XXXXXX XXXXXXXXXX XXXXXXXXXX XXXXXXXXXXL XXXX
32A090 Walla Walla R nr Lowden XX B
32A100 Walla Walla R at E Detour Road Br X X B
32A110 Walla Walla R @ College Place XX XX B
32B070 Touchet R @ Touchet X XX XX XXXXXXXXXX XXX X B
32B075 Touchet R @ Cummins Rd X XB
32B080 Touchet R at Sims Rd X X B
32B100 Touchet R @ Bolles XX X X B
32B120 Touchet R nr Dayton XX B
X32B130 Touchet R @ Dayton X XX B
32B140 Touchet R above Dayton X B
32C070 Mill Cr @ Swegle Rd X XX X B
32C110 Mill Cr @ Tausick Way X X X B
33A010 Snake R nr Mouth X B
33A050 Snake R nr Pasco XXXXXXX X X XXXXXXXXX XXXXXXXXXXL XXXX
33A070 Snake R blw Ice Harbor Dam X X XXXXXX XXXXXXXXXX XX B
X34A070 Palouse R @ Hooper XXXXXXXXXX X XXXXXX XXXXXXXXXX XXXXXXXXXX XXXXXXXXXXL XXXX
34A075 Palouse R @ Hwy 26 X B
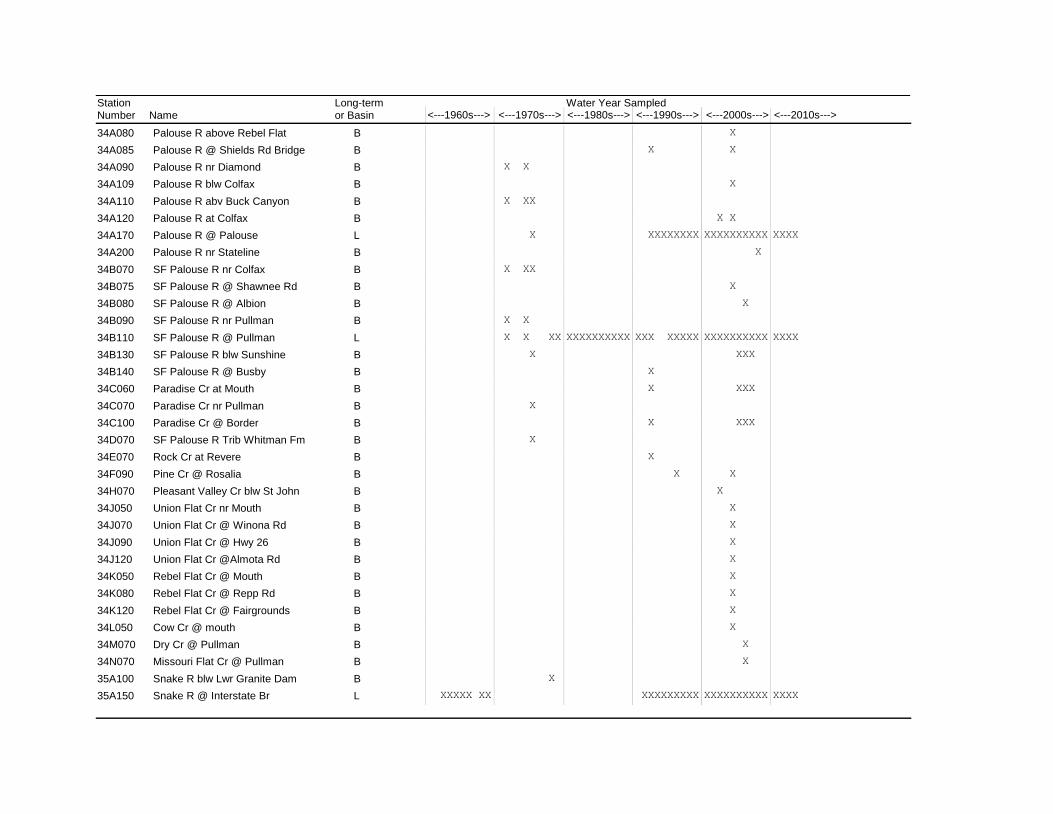
<---1980s---> <---1990s--->StationNumber Name <---1960s--->
Water Year Sampled<---1970s---> <---2000s--->
Long-termor Basin <---2010s--->
34A080 Palouse R above Rebel Flat X B
34A085 Palouse R @ Shields Rd Bridge X X B
34A090 Palouse R nr Diamond X X B
34A109 Palouse R blw Colfax X B
34A110 Palouse R abv Buck Canyon X XX B
34A120 Palouse R at Colfax X X B
34A170 Palouse R @ Palouse X XXXXXXXX XXXXXXXXXXL XXXX
34A200 Palouse R nr Stateline X B
34B070 SF Palouse R nr Colfax X XX B
34B075 SF Palouse R @ Shawnee Rd X B
34B080 SF Palouse R @ Albion X B
34B090 SF Palouse R nr Pullman X X B
34B110 SF Palouse R @ Pullman X X XX XXXXXXXXXX XXX XXXXX XXXXXXXXXXL XXXX
34B130 SF Palouse R blw Sunshine X XXX B
34B140 SF Palouse R @ Busby X B
34C060 Paradise Cr at Mouth X XXX B
34C070 Paradise Cr nr Pullman X B
34C100 Paradise Cr @ Border X XXX B
34D070 SF Palouse R Trib Whitman Fm X B
34E070 Rock Cr at Revere X B
34F090 Pine Cr @ Rosalia X X B
34H070 Pleasant Valley Cr blw St John X B
34J050 Union Flat Cr nr Mouth X B
34J070 Union Flat Cr @ Winona Rd X B
34J090 Union Flat Cr @ Hwy 26 X B
34J120 Union Flat Cr @Almota Rd X B
34K050 Rebel Flat Cr @ Mouth X B
34K080 Rebel Flat Cr @ Repp Rd X B
34K120 Rebel Flat Cr @ Fairgrounds X B
34L050 Cow Cr @ mouth X B
34M070 Dry Cr @ Pullman X B
34N070 Missouri Flat Cr @ Pullman X B
35A100 Snake R blw Lwr Granite Dam X B
35A150 Snake R @ Interstate Br XXXXX XX XXXXXXXXX XXXXXXXXXXL XXXX
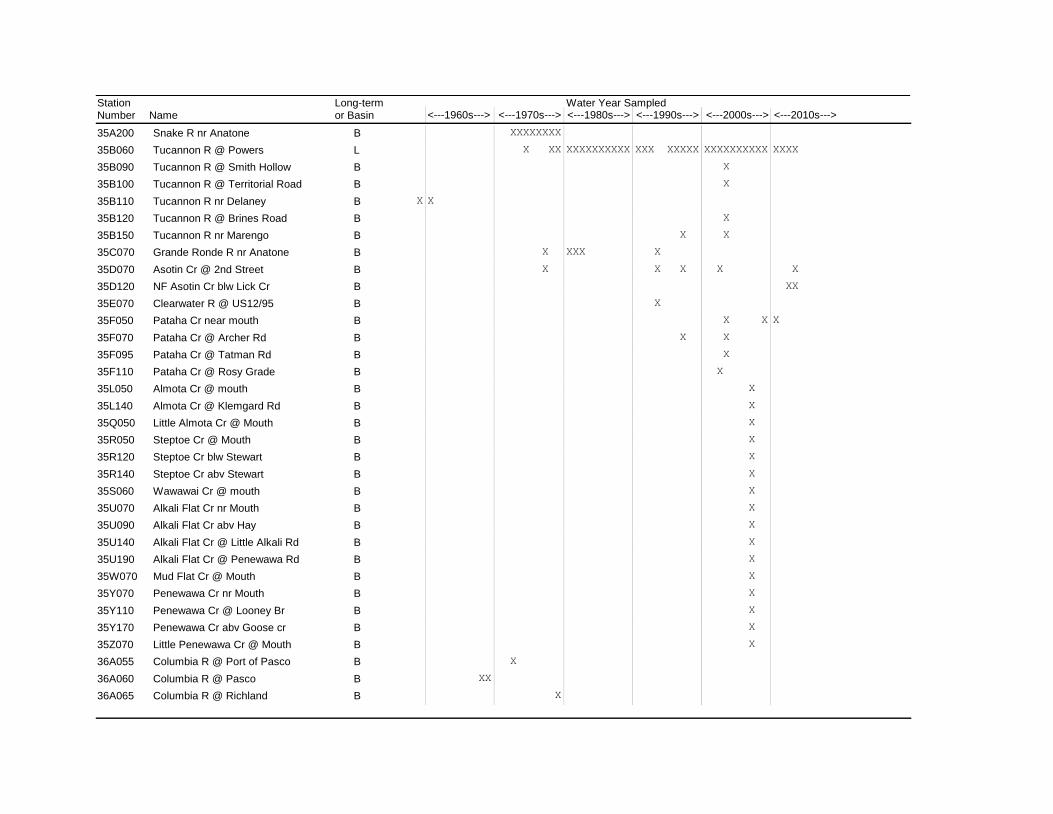
<---1980s---> <---1990s--->StationNumber Name <---1960s--->
Water Year Sampled<---1970s---> <---2000s--->
Long-termor Basin <---2010s--->
35A200 Snake R nr Anatone XXXXXXXX B
35B060 Tucannon R @ Powers X XX XXXXXXXXXX XXX XXXXX XXXXXXXXXXL XXXX
35B090 Tucannon R @ Smith Hollow X B
35B100 Tucannon R @ Territorial Road X B
X35B110 Tucannon R nr Delaney X B
35B120 Tucannon R @ Brines Road X B
35B150 Tucannon R nr Marengo X X B
35C070 Grande Ronde R nr Anatone X XXX X B
35D070 Asotin Cr @ 2nd Street X X X X B X
35D120 NF Asotin Cr blw Lick Cr B XX
35E070 Clearwater R @ US12/95 X B
35F050 Pataha Cr near mouth X XB X
35F070 Pataha Cr @ Archer Rd X X B
35F095 Pataha Cr @ Tatman Rd X B
35F110 Pataha Cr @ Rosy Grade X B
35L050 Almota Cr @ mouth X B
35L140 Almota Cr @ Klemgard Rd X B
35Q050 Little Almota Cr @ Mouth X B
35R050 Steptoe Cr @ Mouth X B
35R120 Steptoe Cr blw Stewart X B
35R140 Steptoe Cr abv Stewart X B
35S060 Wawawai Cr @ mouth X B
35U070 Alkali Flat Cr nr Mouth X B
35U090 Alkali Flat Cr abv Hay X B
35U140 Alkali Flat Cr @ Little Alkali Rd X B
35U190 Alkali Flat Cr @ Penewawa Rd X B
35W070 Mud Flat Cr @ Mouth X B
35Y070 Penewawa Cr nr Mouth X B
35Y110 Penewawa Cr @ Looney Br X B
35Y170 Penewawa Cr abv Goose cr X B
35Z070 Little Penewawa Cr @ Mouth X B
36A055 Columbia R @ Port of Pasco X B
36A060 Columbia R @ Pasco XX B
36A065 Columbia R @ Richland X B
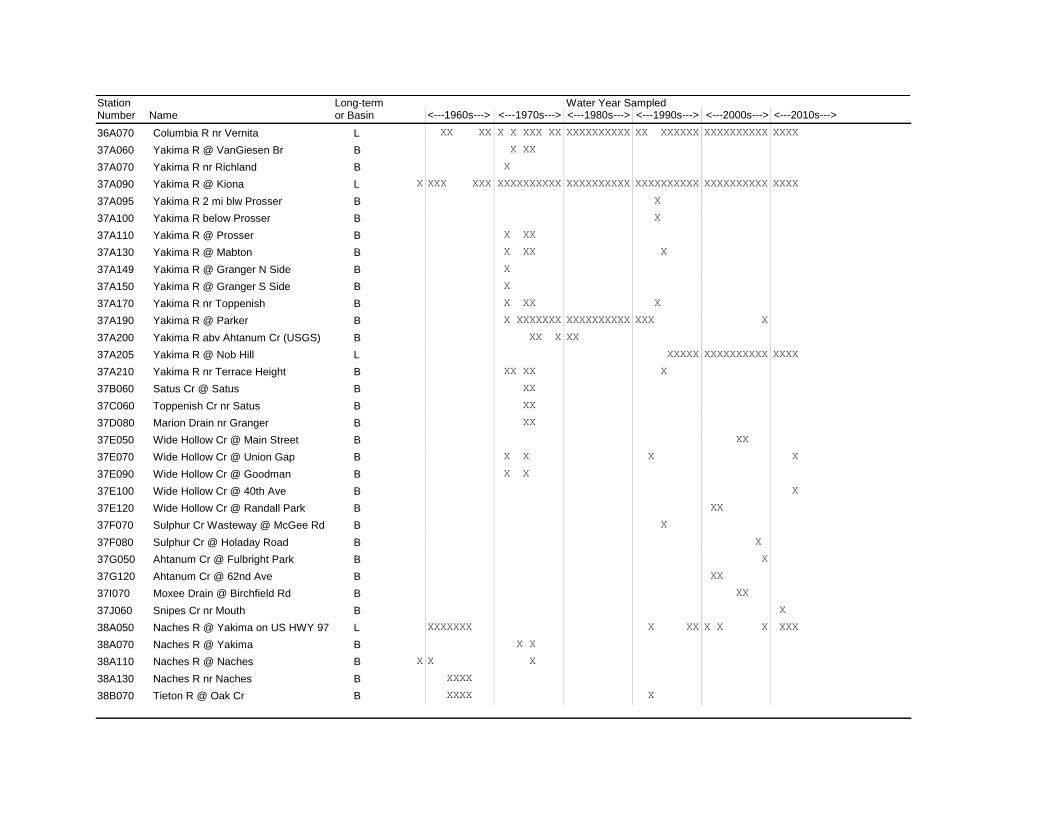
<---1980s---> <---1990s--->StationNumber Name <---1960s--->
Water Year Sampled<---1970s---> <---2000s--->
Long-termor Basin <---2010s--->
36A070 Columbia R nr Vernita XX XX X X XXX XX XXXXXXXXXX XX XXXXXX XXXXXXXXXXL XXXX
37A060 Yakima R @ VanGiesen Br X XX B
37A070 Yakima R nr Richland X B
X37A090 Yakima R @ Kiona XXX XXX XXXXXXXXXX XXXXXXXXXX XXXXXXXXXX XXXXXXXXXXL XXXX
37A095 Yakima R 2 mi blw Prosser X B
37A100 Yakima R below Prosser X B
37A110 Yakima R @ Prosser X XX B
37A130 Yakima R @ Mabton X XX X B
37A149 Yakima R @ Granger N Side X B
37A150 Yakima R @ Granger S Side X B
37A170 Yakima R nr Toppenish X XX X B
37A190 Yakima R @ Parker X XXXXXXX XXXXXXXXXX XXX XB
37A200 Yakima R abv Ahtanum Cr (USGS) XX X XX B
37A205 Yakima R @ Nob Hill XXXXX XXXXXXXXXXL XXXX
37A210 Yakima R nr Terrace Height XX XX X B
37B060 Satus Cr @ Satus XX B
37C060 Toppenish Cr nr Satus XX B
37D080 Marion Drain nr Granger XX B
37E050 Wide Hollow Cr @ Main Street XX B
37E070 Wide Hollow Cr @ Union Gap X X X B X
37E090 Wide Hollow Cr @ Goodman X X B
37E100 Wide Hollow Cr @ 40th Ave B X
37E120 Wide Hollow Cr @ Randall Park XX B
37F070 Sulphur Cr Wasteway @ McGee Rd X B
37F080 Sulphur Cr @ Holaday Road X B
37G050 Ahtanum Cr @ Fulbright Park XB
37G120 Ahtanum Cr @ 62nd Ave XX B
37I070 Moxee Drain @ Birchfield Rd XX B
37J060 Snipes Cr nr Mouth B X
38A050 Naches R @ Yakima on US HWY 97 XXXXXXX X XX X X XL XXX
38A070 Naches R @ Yakima X X B
X38A110 Naches R @ Naches X X B
38A130 Naches R nr Naches XXXX B
38B070 Tieton R @ Oak Cr XXXX X B
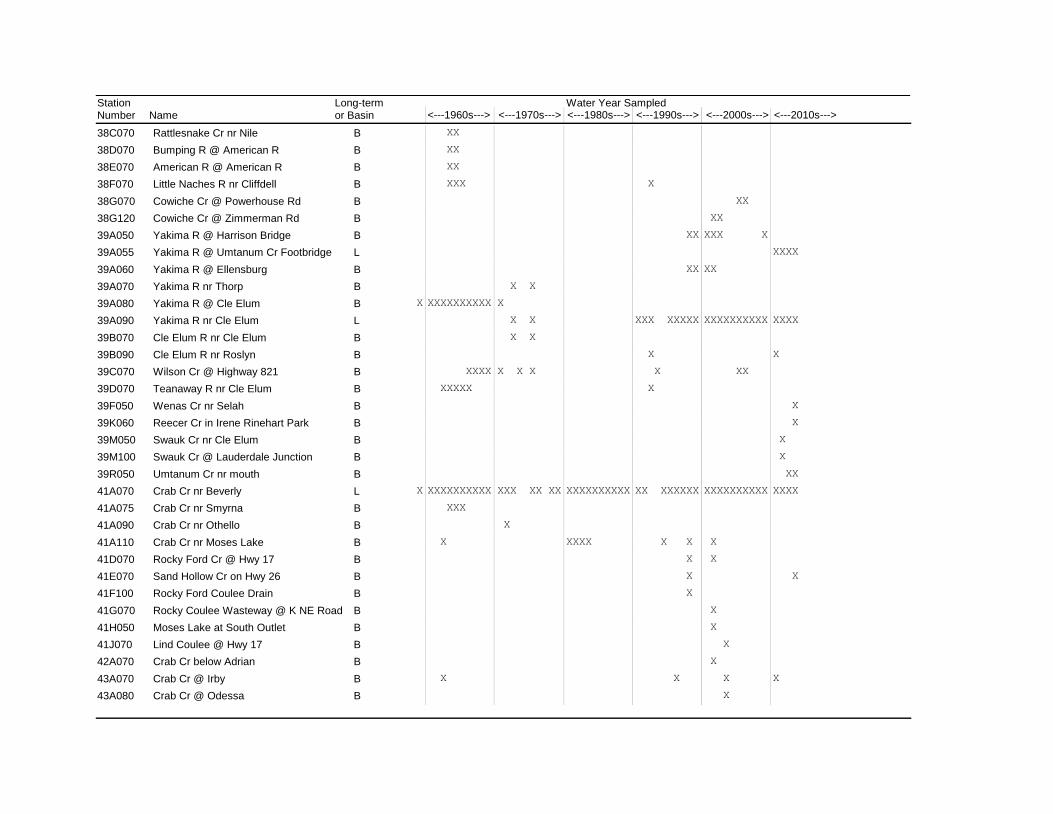
<---1980s---> <---1990s--->StationNumber Name <---1960s--->
Water Year Sampled<---1970s---> <---2000s--->
Long-termor Basin <---2010s--->
38C070 Rattlesnake Cr nr Nile XX B
38D070 Bumping R @ American R XX B
38E070 American R @ American R XX B
38F070 Little Naches R nr Cliffdell XXX X B
38G070 Cowiche Cr @ Powerhouse Rd XX B
38G120 Cowiche Cr @ Zimmerman Rd XX B
39A050 Yakima R @ Harrison Bridge XX XXX XB
39A055 Yakima R @ Umtanum Cr Footbridge L XXXX
39A060 Yakima R @ Ellensburg XX XX B
39A070 Yakima R nr Thorp X X B
X39A080 Yakima R @ Cle Elum XXXXXXXXXX X B
39A090 Yakima R nr Cle Elum X X XXX XXXXX XXXXXXXXXXL XXXX
39B070 Cle Elum R nr Cle Elum X X B
39B090 Cle Elum R nr Roslyn X B X
39C070 Wilson Cr @ Highway 821 XXXX X X X X XX B
39D070 Teanaway R nr Cle Elum XXXXX X B
39F050 Wenas Cr nr Selah B X
39K060 Reecer Cr in Irene Rinehart Park B X
39M050 Swauk Cr nr Cle Elum B X
39M100 Swauk Cr @ Lauderdale Junction B X
39R050 Umtanum Cr nr mouth B XX
X41A070 Crab Cr nr Beverly XXXXXXXXXX XXX XX XX XXXXXXXXXX XX XXXXXX XXXXXXXXXXL XXXX
41A075 Crab Cr nr Smyrna XXX B
41A090 Crab Cr nr Othello X B
41A110 Crab Cr nr Moses Lake X XXXX X X X B
41D070 Rocky Ford Cr @ Hwy 17 X X B
41E070 Sand Hollow Cr on Hwy 26 X B X
41F100 Rocky Ford Coulee Drain X B
41G070 Rocky Coulee Wasteway @ K NE Road X B
41H050 Moses Lake at South Outlet X B
41J070 Lind Coulee @ Hwy 17 X B
42A070 Crab Cr below Adrian X B
43A070 Crab Cr @ Irby X X X B X
43A080 Crab Cr @ Odessa X B
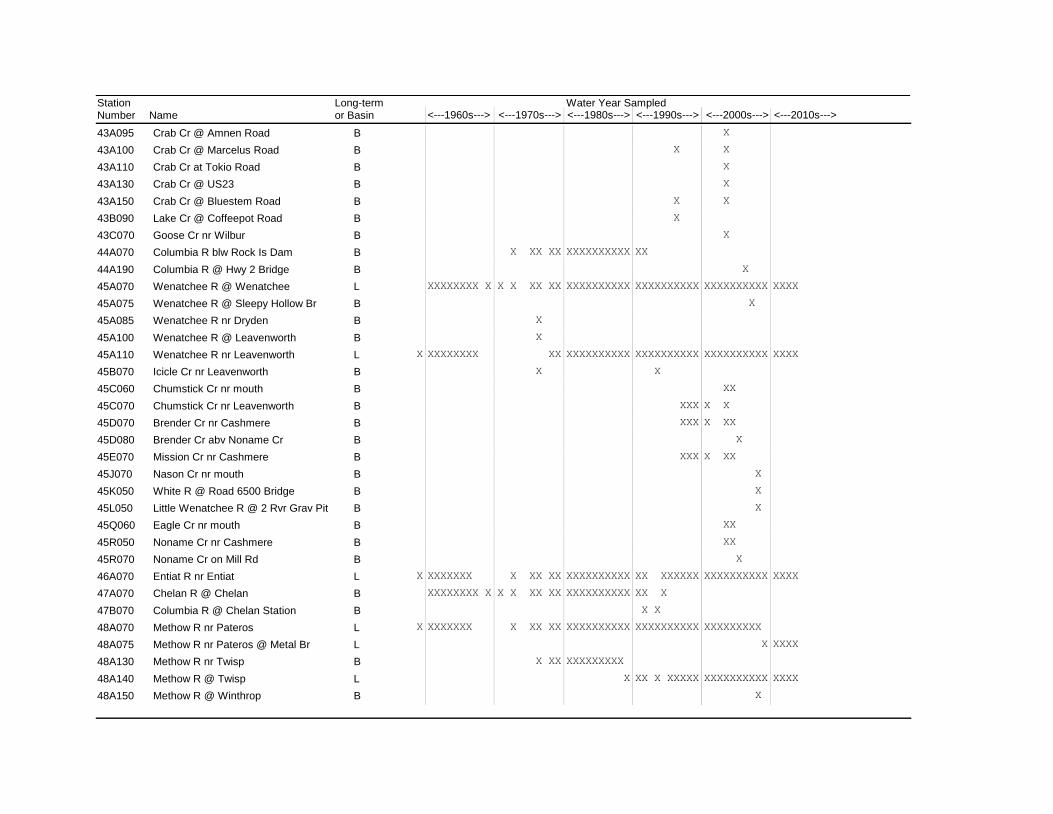
<---1980s---> <---1990s--->StationNumber Name <---1960s--->
Water Year Sampled<---1970s---> <---2000s--->
Long-termor Basin <---2010s--->
43A095 Crab Cr @ Amnen Road X B
43A100 Crab Cr @ Marcelus Road X X B
43A110 Crab Cr at Tokio Road X B
43A130 Crab Cr @ US23 X B
43A150 Crab Cr @ Bluestem Road X X B
43B090 Lake Cr @ Coffeepot Road X B
43C070 Goose Cr nr Wilbur X B
44A070 Columbia R blw Rock Is Dam X XX XX XXXXXXXXXX XX B
44A190 Columbia R @ Hwy 2 Bridge X B
45A070 Wenatchee R @ Wenatchee XXXXXXXX X X X XX XX XXXXXXXXXX XXXXXXXXXX XXXXXXXXXXL XXXX
45A075 Wenatchee R @ Sleepy Hollow Br X B
45A085 Wenatchee R nr Dryden X B
45A100 Wenatchee R @ Leavenworth X B
X45A110 Wenatchee R nr Leavenworth XXXXXXXX XX XXXXXXXXXX XXXXXXXXXX XXXXXXXXXXL XXXX
45B070 Icicle Cr nr Leavenworth X X B
45C060 Chumstick Cr nr mouth XX B
45C070 Chumstick Cr nr Leavenworth XXX X X B
45D070 Brender Cr nr Cashmere XXX X XX B
45D080 Brender Cr abv Noname Cr X B
45E070 Mission Cr nr Cashmere XXX X XX B
45J070 Nason Cr nr mouth X B
45K050 White R @ Road 6500 Bridge X B
45L050 Little Wenatchee R @ 2 Rvr Grav Pit X B
45Q060 Eagle Cr nr mouth XX B
45R050 Noname Cr nr Cashmere XX B
45R070 Noname Cr on Mill Rd X B
X46A070 Entiat R nr Entiat XXXXXXX X XX XX XXXXXXXXXX XX XXXXXX XXXXXXXXXXL XXXX
47A070 Chelan R @ Chelan XXXXXXXX X X X XX XX XXXXXXXXXX XX X B
47B070 Columbia R @ Chelan Station X X B
X48A070 Methow R nr Pateros XXXXXXX X XX XX XXXXXXXXXX XXXXXXXXXX XXXXXXXXX L
48A075 Methow R nr Pateros @ Metal Br XL XXXX
48A130 Methow R nr Twisp X XX XXXXXXXXX B
48A140 Methow R @ Twisp X XX X XXXXX XXXXXXXXXXL XXXX
48A150 Methow R @ Winthrop X B
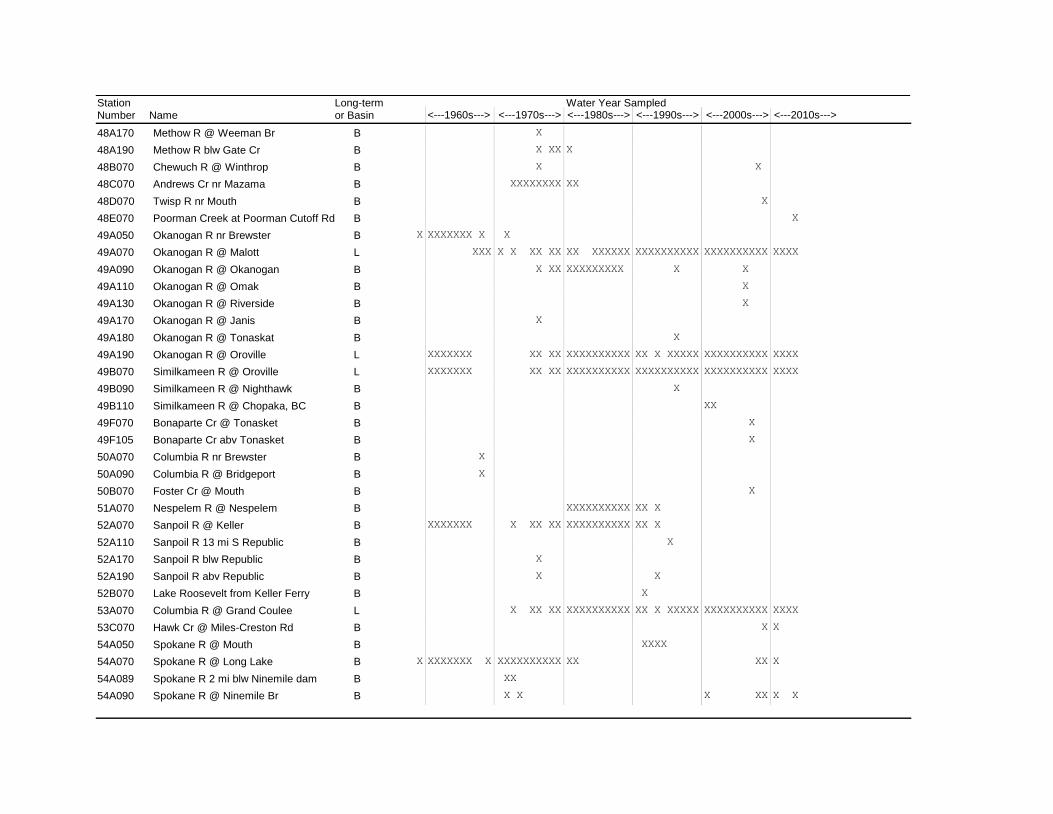
<---1980s---> <---1990s--->StationNumber Name <---1960s--->
Water Year Sampled<---1970s---> <---2000s--->
Long-termor Basin <---2010s--->
48A170 Methow R @ Weeman Br X B
48A190 Methow R blw Gate Cr X XX X B
48B070 Chewuch R @ Winthrop X X B
48C070 Andrews Cr nr Mazama XXXXXXXX XX B
48D070 Twisp R nr Mouth XB
48E070 Poorman Creek at Poorman Cutoff Rd B X
X49A050 Okanogan R nr Brewster XXXXXXX X X B
49A070 Okanogan R @ Malott XXX X X XX XX XX XXXXXX XXXXXXXXXX XXXXXXXXXXL XXXX
49A090 Okanogan R @ Okanogan X XX XXXXXXXXX X X B
49A110 Okanogan R @ Omak X B
49A130 Okanogan R @ Riverside X B
49A170 Okanogan R @ Janis X B
49A180 Okanogan R @ Tonaskat X B
49A190 Okanogan R @ Oroville XXXXXXX XX XX XXXXXXXXXX XX X XXXXX XXXXXXXXXXL XXXX
49B070 Similkameen R @ Oroville XXXXXXX XX XX XXXXXXXXXX XXXXXXXXXX XXXXXXXXXXL XXXX
49B090 Similkameen R @ Nighthawk X B
49B110 Similkameen R @ Chopaka, BC XX B
49F070 Bonaparte Cr @ Tonasket X B
49F105 Bonaparte Cr abv Tonasket X B
50A070 Columbia R nr Brewster X B
50A090 Columbia R @ Bridgeport X B
50B070 Foster Cr @ Mouth X B
51A070 Nespelem R @ Nespelem XXXXXXXXXX XX X B
52A070 Sanpoil R @ Keller XXXXXXX X XX XX XXXXXXXXXX XX X B
52A110 Sanpoil R 13 mi S Republic X B
52A170 Sanpoil R blw Republic X B
52A190 Sanpoil R abv Republic X X B
52B070 Lake Roosevelt from Keller Ferry X B
53A070 Columbia R @ Grand Coulee X XX XX XXXXXXXXXX XX X XXXXX XXXXXXXXXXL XXXX
53C070 Hawk Cr @ Miles-Creston Rd XB X
54A050 Spokane R @ Mouth XXXX B
X54A070 Spokane R @ Long Lake XXXXXXX X XXXXXXXXXX XX XXB X
54A089 Spokane R 2 mi blw Ninemile dam XX B
54A090 Spokane R @ Ninemile Br X X X XXB X X
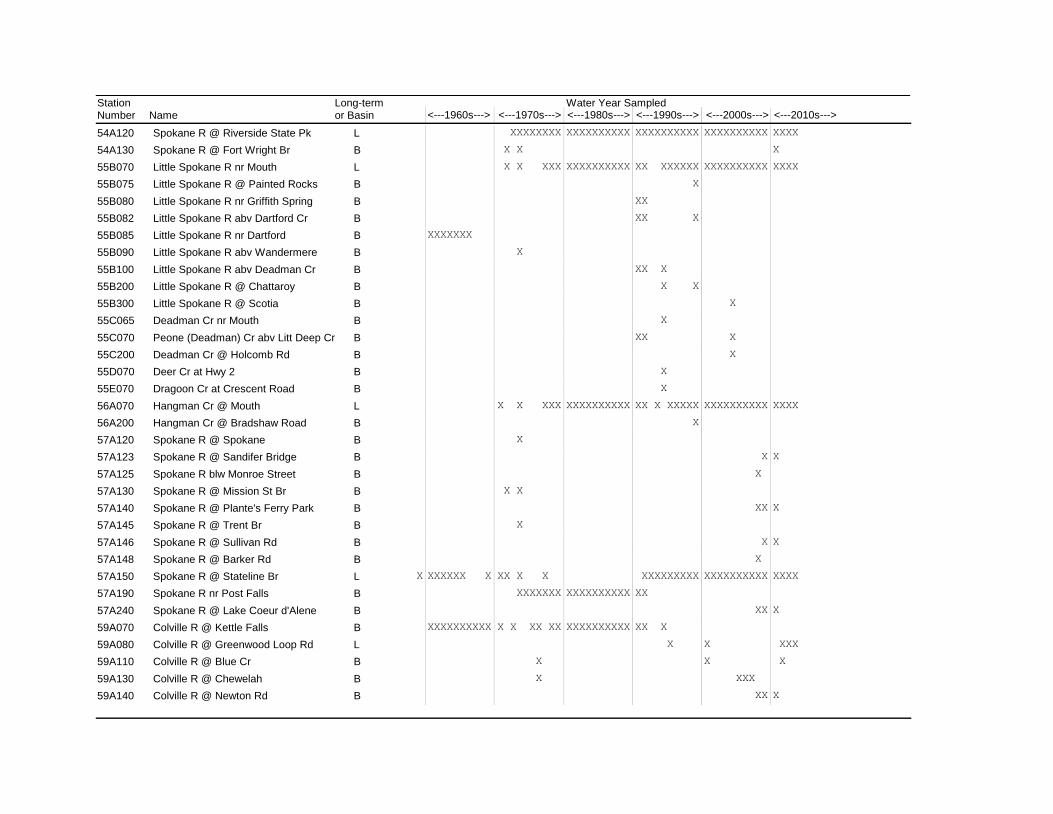
<---1980s---> <---1990s--->StationNumber Name <---1960s--->
Water Year Sampled<---1970s---> <---2000s--->
Long-termor Basin <---2010s--->
54A120 Spokane R @ Riverside State Pk XXXXXXXX XXXXXXXXXX XXXXXXXXXX XXXXXXXXXXL XXXX
54A130 Spokane R @ Fort Wright Br X X B X
55B070 Little Spokane R nr Mouth X X XXX XXXXXXXXXX XX XXXXXX XXXXXXXXXXL XXXX
55B075 Little Spokane R @ Painted Rocks X B
55B080 Little Spokane R nr Griffith Spring XX B
55B082 Little Spokane R abv Dartford Cr XX X B
55B085 Little Spokane R nr Dartford XXXXXXX B
55B090 Little Spokane R abv Wandermere X B
55B100 Little Spokane R abv Deadman Cr XX X B
55B200 Little Spokane R @ Chattaroy X X B
55B300 Little Spokane R @ Scotia X B
55C065 Deadman Cr nr Mouth X B
55C070 Peone (Deadman) Cr abv Litt Deep Cr XX X B
55C200 Deadman Cr @ Holcomb Rd X B
55D070 Deer Cr at Hwy 2 X B
55E070 Dragoon Cr at Crescent Road X B
56A070 Hangman Cr @ Mouth X X XXX XXXXXXXXXX XX X XXXXX XXXXXXXXXXL XXXX
56A200 Hangman Cr @ Bradshaw Road X B
57A120 Spokane R @ Spokane X B
57A123 Spokane R @ Sandifer Bridge XB X
57A125 Spokane R blw Monroe Street X B
57A130 Spokane R @ Mission St Br X X B
57A140 Spokane R @ Plante's Ferry Park XXB X
57A145 Spokane R @ Trent Br X B
57A146 Spokane R @ Sullivan Rd XB X
57A148 Spokane R @ Barker Rd X B
X57A150 Spokane R @ Stateline Br XXXXXX X XX X X XXXXXXXXX XXXXXXXXXXL XXXX
57A190 Spokane R nr Post Falls XXXXXXX XXXXXXXXXX XX B
57A240 Spokane R @ Lake Coeur d'Alene XXB X
59A070 Colville R @ Kettle Falls XXXXXXXXXX X X XX XX XXXXXXXXXX XX X B
59A080 Colville R @ Greenwood Loop Rd X X L XXX
59A110 Colville R @ Blue Cr X X B X
59A130 Colville R @ Chewelah X XXX B
59A140 Colville R @ Newton Rd XXB X
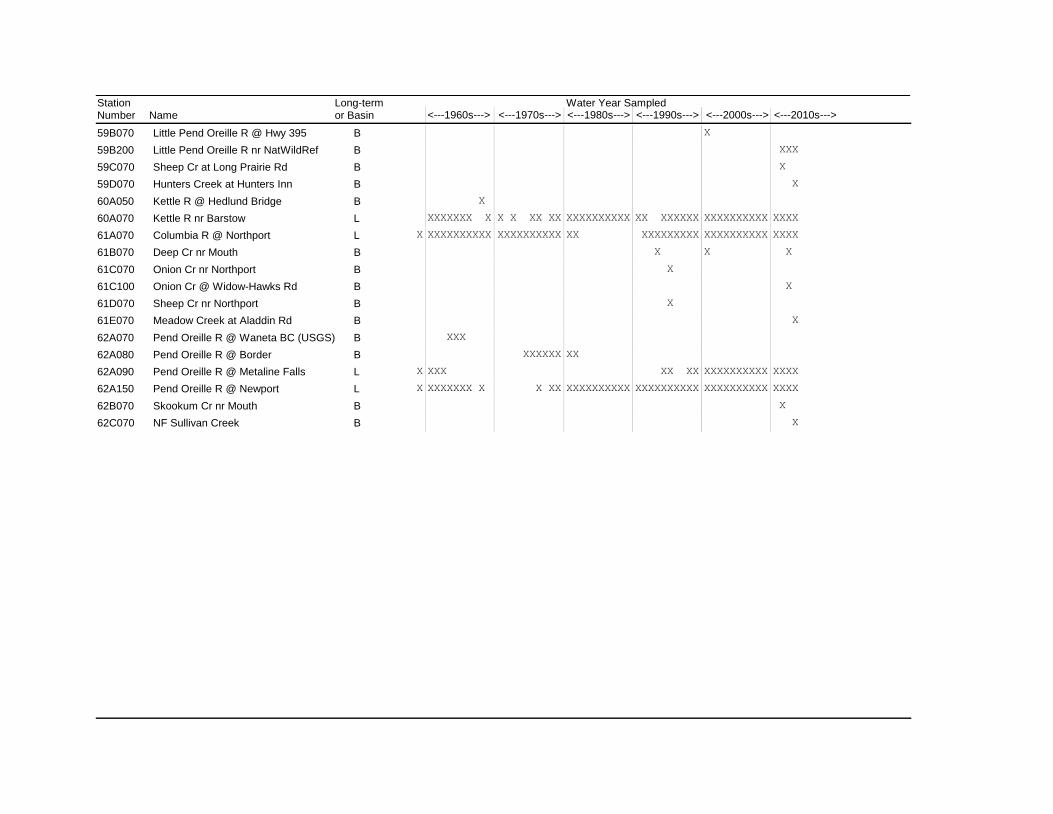
<---1980s---> <---1990s--->StationNumber Name <---1960s--->
Water Year Sampled<---1970s---> <---2000s--->
Long-termor Basin <---2010s--->
59B070 Little Pend Oreille R @ Hwy 395 X B
59B200 Little Pend Oreille R nr NatWildRef B XXX
59C070 Sheep Cr at Long Prairie Rd B X
59D070 Hunters Creek at Hunters Inn B X
60A050 Kettle R @ Hedlund Bridge X B
60A070 Kettle R nr Barstow XXXXXXX X X X XX XX XXXXXXXXXX XX XXXXXX XXXXXXXXXXL XXXX
X61A070 Columbia R @ Northport XXXXXXXXXX XXXXXXXXXX XX XXXXXXXXX XXXXXXXXXXL XXXX
61B070 Deep Cr nr Mouth X X B X
61C070 Onion Cr nr Northport X B
61C100 Onion Cr @ Widow-Hawks Rd B X
61D070 Sheep Cr nr Northport X B
61E070 Meadow Creek at Aladdin Rd B X
62A070 Pend Oreille R @ Waneta BC (USGS) XXX B
62A080 Pend Oreille R @ Border XXXXXX XX B
X62A090 Pend Oreille R @ Metaline Falls XXX XX XX XXXXXXXXXXL XXXX
X62A150 Pend Oreille R @ Newport XXXXXXX X X XX XXXXXXXXXX XXXXXXXXXX XXXXXXXXXXL XXXX
62B070 Skookum Cr nr Mouth B X
62C070 NF Sullivan Creek B X

Page 86
This page is purposely left blank
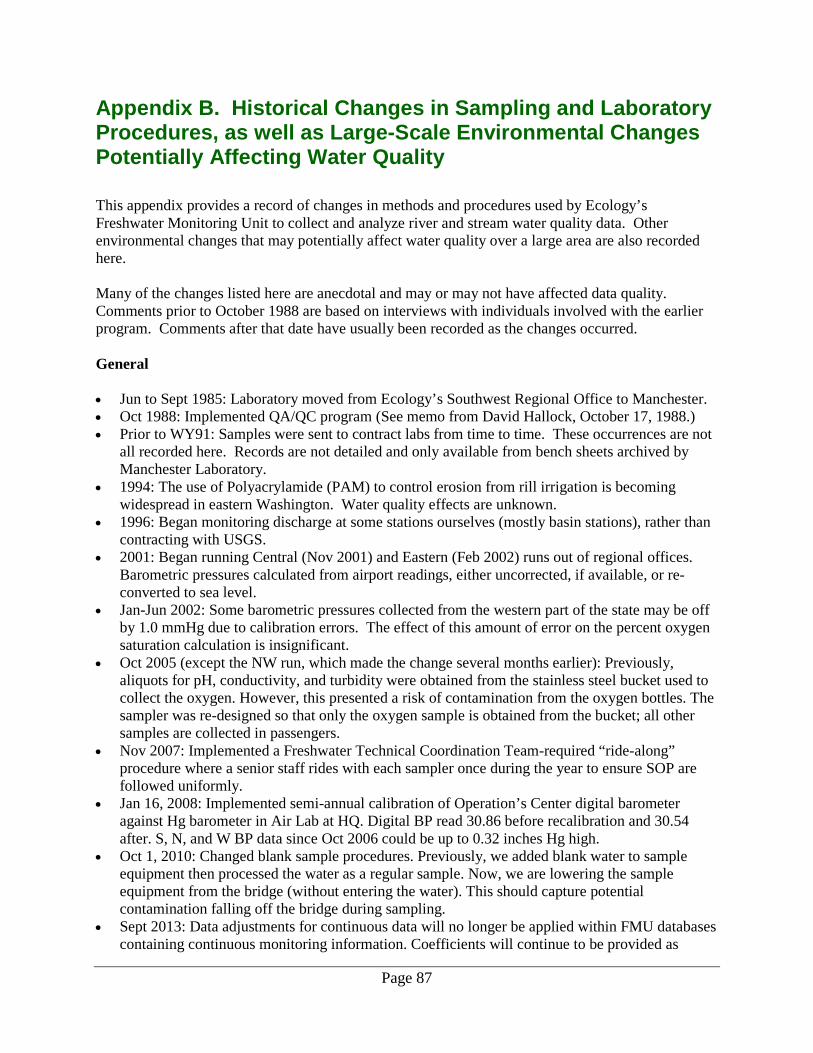
Page 87
Appendix B. Historical Changes in Sampling and Laboratory Procedures, as well as Large-Scale Environmental Changes Potentially Affecting Water Quality This appendix provides a record of changes in methods and procedures used by Ecology’s Freshwater Monitoring Unit to collect and analyze river and stream water quality data. Other environmental changes that may potentially affect water quality over a large area are also recorded here. Many of the changes listed here are anecdotal and may or may not have affected data quality. Comments prior to October 1988 are based on interviews with individuals involved with the earlier program. Comments after that date have usually been recorded as the changes occurred. General • Jun to Sept 1985: Laboratory moved from Ecology’s Southwest Regional Office to Manchester. • Oct 1988: Implemented QA/QC program (See memo from David Hallock, October 17, 1988.) • Prior to WY91: Samples were sent to contract labs from time to time. These occurrences are not
all recorded here. Records are not detailed and only available from bench sheets archived by Manchester Laboratory.
• 1994: The use of Polyacrylamide (PAM) to control erosion from rill irrigation is becoming widespread in eastern Washington. Water quality effects are unknown.
• 1996: Began monitoring discharge at some stations ourselves (mostly basin stations), rather than contracting with USGS.
• 2001: Began running Central (Nov 2001) and Eastern (Feb 2002) runs out of regional offices. Barometric pressures calculated from airport readings, either uncorrected, if available, or re-converted to sea level.
• Jan-Jun 2002: Some barometric pressures collected from the western part of the state may be off by 1.0 mmHg due to calibration errors. The effect of this amount of error on the percent oxygen saturation calculation is insignificant.
• Oct 2005 (except the NW run, which made the change several months earlier): Previously, aliquots for pH, conductivity, and turbidity were obtained from the stainless steel bucket used to collect the oxygen. However, this presented a risk of contamination from the oxygen bottles. The sampler was re-designed so that only the oxygen sample is obtained from the bucket; all other samples are collected in passengers.
• Nov 2007: Implemented a Freshwater Technical Coordination Team-required “ride-along” procedure where a senior staff rides with each sampler once during the year to ensure SOP are followed uniformly.
• Jan 16, 2008: Implemented semi-annual calibration of Operation’s Center digital barometer against Hg barometer in Air Lab at HQ. Digital BP read 30.86 before recalibration and 30.54 after. S, N, and W BP data since Oct 2006 could be up to 0.32 inches Hg high.
• Oct 1, 2010: Changed blank sample procedures. Previously, we added blank water to sample equipment then processed the water as a regular sample. Now, we are lowering the sample equipment from the bridge (without entering the water). This should capture potential contamination falling off the bridge during sampling.
• Sept 2013: Data adjustments for continuous data will no longer be applied within FMU databases containing continuous monitoring information. Coefficients will continue to be provided as
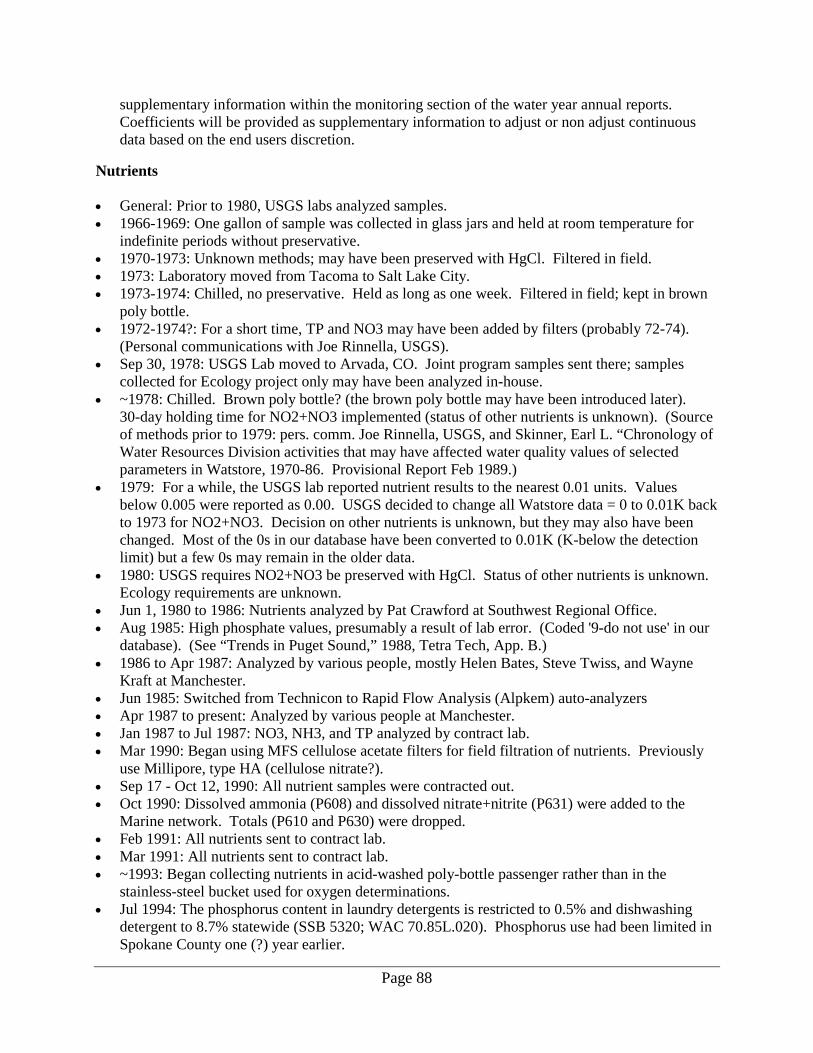
Page 88
supplementary information within the monitoring section of the water year annual reports. Coefficients will be provided as supplementary information to adjust or non adjust continuous data based on the end users discretion.
Nutrients • General: Prior to 1980, USGS labs analyzed samples. • 1966-1969: One gallon of sample was collected in glass jars and held at room temperature for
indefinite periods without preservative. • 1970-1973: Unknown methods; may have been preserved with HgCl. Filtered in field. • 1973: Laboratory moved from Tacoma to Salt Lake City. • 1973-1974: Chilled, no preservative. Held as long as one week. Filtered in field; kept in brown
poly bottle. • 1972-1974?: For a short time, TP and NO3 may have been added by filters (probably 72-74).
(Personal communications with Joe Rinnella, USGS). • Sep 30, 1978: USGS Lab moved to Arvada, CO. Joint program samples sent there; samples
collected for Ecology project only may have been analyzed in-house. • ~1978: Chilled. Brown poly bottle? (the brown poly bottle may have been introduced later).
30-day holding time for NO2+NO3 implemented (status of other nutrients is unknown). (Source of methods prior to 1979: pers. comm. Joe Rinnella, USGS, and Skinner, Earl L. “Chronology of Water Resources Division activities that may have affected water quality values of selected parameters in Watstore, 1970-86. Provisional Report Feb 1989.)
• 1979: For a while, the USGS lab reported nutrient results to the nearest 0.01 units. Values below 0.005 were reported as 0.00. USGS decided to change all Watstore data = 0 to 0.01K back to 1973 for NO2+NO3. Decision on other nutrients is unknown, but they may also have been changed. Most of the 0s in our database have been converted to 0.01K (K-below the detection limit) but a few 0s may remain in the older data.
• 1980: USGS requires NO2+NO3 be preserved with HgCl. Status of other nutrients is unknown. Ecology requirements are unknown.
• Jun 1, 1980 to 1986: Nutrients analyzed by Pat Crawford at Southwest Regional Office. • Aug 1985: High phosphate values, presumably a result of lab error. (Coded '9-do not use' in our
database). (See “Trends in Puget Sound,” 1988, Tetra Tech, App. B.) • 1986 to Apr 1987: Analyzed by various people, mostly Helen Bates, Steve Twiss, and Wayne
Kraft at Manchester. • Jun 1985: Switched from Technicon to Rapid Flow Analysis (Alpkem) auto-analyzers • Apr 1987 to present: Analyzed by various people at Manchester. • Jan 1987 to Jul 1987: NO3, NH3, and TP analyzed by contract lab. • Mar 1990: Began using MFS cellulose acetate filters for field filtration of nutrients. Previously
use Millipore, type HA (cellulose nitrate?). • Sep 17 - Oct 12, 1990: All nutrient samples were contracted out. • Oct 1990: Dissolved ammonia (P608) and dissolved nitrate+nitrite (P631) were added to the
Marine network. Totals (P610 and P630) were dropped. • Feb 1991: All nutrients sent to contract lab. • Mar 1991: All nutrients sent to contract lab. • ~1993: Began collecting nutrients in acid-washed poly-bottle passenger rather than in the
stainless-steel bucket used for oxygen determinations. • Jul 1994: The phosphorus content in laundry detergents is restricted to 0.5% and dishwashing
detergent to 8.7% statewide (SSB 5320; WAC 70.85L.020). Phosphorus use had been limited in Spokane County one (?) year earlier.
Page 89
• Feb 1999: Manchester Laboratory switched from manual to inline digestion for total phosphorus. In early 2003, during the course of evaluating a different method for phosphorus analysis, Manchester Laboratory discovered that the in-line method contained a high bias (4 to 20 ppb). Trend analyses of total phosphorus data should be interpreted carefully if results collected between Feb 1999 and Sept 2003 are included. (See email from Dean Momohara to David Hallock, 31 March 2003.) Total phosphorus data analyzed using this method have been coded "4" indicating a potential quality problem, and given a different name ("TP_PInline" rather than the usual "TP_P").
• Sep 2000: Nitrate+nitrite method nomenclature changed from EPA 353.2 to SM 4500NO3I because the latter method is more specific. The instrument used was changed at around this time from a “Flow analyzer” to a “Flow Injection” instrument and procedures may have changed slightly.
• Before Jul 2001: Ammonia method nomenclature changed from EPA 350.1 to SM 4500NH3H because the latter method is more specific. The instrument used was changed at around this time from a “Flow analyzer” to a “Flow Injection” instrument and procedures may have changed slightly.
• Before Aug 2001: Ortho-phosphorus method nomenclature changed from EPA 365.3M to SM 4500PG because the latter method is more specific. The instrument used was changed at around this time from a “Flow analyzer” to a “Flow Injection” instrument and procedures may have changed slightly.
• Before May 2000: Total nitrogen method nomenclature changed from VALDERRAMA to SM 4500NB because the latter method is more specific. The instrument used was changed at around this time from a “Flow analyzer” to a “Flow Injection” instrument and procedures may have changed slightly.
• Oct 2000: TP method changed from EPA 365.1 to SM4500PI. The former method specifies a manual digestion, while the latter correctly refers to the in-line digestion used by Manchester Laboratory’s Lachat instrument.
• Oct 2000 to Feb 2001: A low bias may apply to TN data. Except for December data, Manchester Laboratory deemed the bias to be small enough that the data did not need to be qualified. December TN results were coded as estimates (See email from M. Lee to David Hallock, March 8, 2001.)
• Oct 2003: TP method changed from SM4500PI to EPA 200.8M, an ICP/MS method with low detection limits and without the bias associated with in-line digestion. Samples are collected in a 60mL container with HCl preservative instead of the earlier 125mL container with H2SO4 preservative.
• Oct 1, 2007 we changed total phosphorus analytical methods from EPA200.8M (ICP-MS) to SM4500PH (colorimetric with manual digestion). We made this change because we discovered that at turbidities greater than 4 NTUs, the ICP method is biased low compared to the colorimetric method. (See email from Dave Hallock to Bob Cusimano, October 25, 2007.)
• Jan 15, 2008: OP method changed from SM4500PG to SM4500PF and TOC method changed from EPA415.1 to SM5310B. Neither procedure actually changed.
• Jul 2008: The phosphorus content in dishwasher detergents is restricted in certain counties Spokane County depending on population as of this date (RCW 70.95L.020). (A new law signed in March 2008, eliminated Clark County from the July 1 deadline and weakened regulations that will start in Whatcom County. Phosphorus in laundry detergents has been restricted since 1994.)
• Jul 2010: The phosphorus content in dishwasher detergents will be restricted statewide as of this date (RCW 70.95L.020).
Page 90
• Mar 2013 (after ERM analysis): TP method changed from SM4500PF to SM4500PH. In practices, pH is the same as PF but the instrument changed from Lachat 7500 to Lachat 8000. SM4500PF specifies ‘Automated Ascorbic Acid Reduction Method’ while SM4500PH specifies ‘Manual Digestion and Flow Injection Analysis for Total Phosphorus’.
• Sept 2013: Changed peristaltic pump/filter stand from one using 142 mm diameter filters to one using 102 mm diameter filters. This apparatus filters samples for the laboratory analysis of orthophosphorus. For more information about this change, see the WY 2012 Annual Report.
Suspended Solids • General: Filters were usually used, but sometimes Gooch crucibles were used. • Feb 1978: Began collecting as passenger to oxygen sampler (was previously collected as aliquot
of oxygen sampler). (See memo from Bill Yake, 30 Jan 1978 and Ambient Monitoring Procedure-1978(?) notebook.)
• Mid-1985: Amount filtered changed from 250 (?) to 500 ml. • Sep 17 - Oct 12, 1990: Suspended sediment samples were contracted out. • Apr 1991: Began collecting 1000 ml of sample. • Jul 2002: A number of suspended solids results entered into our database as ‘0’ were deleted.
We do not know if these results were below reporting limits or “missing data”; 138 results collected between 1972 and 1981 were affected.
• Mar 2003: TSS method reference changed from EPA160.2 to SM 2540D. Methods did not change; the latter reference more accurately reflects analytical procedures. See email from Feddersen, Karin, March 24, 2003.
Conductivity • Feb 1978: Began calibrating twice monthly using 40, 70, 140, and 200 umho/cm standards.
(See memo from Bill Yake, 30 Jan 1978 and Ambient Monitoring Procedure-1978(?) Notebook) • Oct 1991: All meters were re-calibrated Oct 11, 1991. One conductivity meter was not calibrated
above 500 umhos/cm (and could not be calibrated). This meter had last been calibrated about 1 year earlier. Most meters read higher than the 100 umhos/cm standard.
• Oct 1994: Switched from Beckman model Type RB-5 (which could not be field calibrated) to Orion Model 126 meter, calibrated daily.
• 1998: Orion meter calibration began drifting during the day. Sometimes meter could only be calibrated to within 4 umhos/cm of the standard. At first, some samplers would correct the data, others would not. Now, these data are uncorrected and coded “J” (estimate).
• Oct 1, 2011: Dropped Orion model 126 meter and started using Hach model HQ40d combination meter for both pH and conductivity.
• Spring 2006: Changed from 500 mL to 100 mL “one-shot” standard, both from VWR. • Summer 2009: Changed from 100 mL VWR snap-top standard to a 100 mL screw top by Ricca. • Winter 2011: Changed from 100 mL screw top to 20 mL single use packets, both by Ricca. • Sept 2013: Changed from single use packets to 500 mL bottle stock, with 100 mL aliquots used
for calibration in the field. Also began measuring MEL-provided standard as a daily check standard. See the WY 2012 Annual Report for more discussion of conductivity standards.
Fecal Coliform Bacteria • Early 1980s: field personnel may have analyzed some samples.
Page 91
• Oct 7, 1975 to Nov 1981: fecal data from eastern Washington may be questionable during this period.
• 1980 to Mar 1988: No changes; analyzed by Nancy Jensen and others at Manchester. However, there is an apparent drop in monthly geometric means in late 1985. The may be coincident with moving the lab to Manchester (see memo from Dave Hallock to Dick Cunningham, June 18, 1991).
• Mar 1988: Switched to new filter with slightly better recovery. • Nov 2000: Holding time was changed from 30 hours to 24 hours (Standard Methods changed to
24 hours with the 17th edition, 1989). As a result, more data have been coded “J” since then due to exceeding holding times.
• Sep 2003: FC method reference changed from SM 16-909C to SM 9222D. Methods did not change; the latter reference more accurately reflects analytical procedures. See email from Feddersen, Karin, September 15, 2003.
• ~Aug 2009: Pasco airport began x-raying water samples. Other airports may follow suit eventually. Exposure is < 1 millirad while doses used to kill bacteria on food are >30,000 rads. An unnamed contact at Washington’s Department of Health stated that the dose is not a concern. We considered testing for an effect, but the number of samples required to detect a small effect is prohibitively large given the natural variance in bacteria data.
Turbidity • 1970s: EPA specified a 2100A turbidimeter. Formerly, turbidity units were FTU (?) • Jan 1976: Turbidity units changed from Jackson Turbidity Units (JTU) to Nephelometric
Turbidity Units (NTU). (Source: review of historical reports.) These are roughly equivalent when greater than 25 JTU/NTU, otherwise not.
• Sep 1993: Lab began using a new turbidimeter, Hach model "Ratio X/R." • Jan 2003: In our database, the units for turbidity results collected prior to January were changed
from NTU back to JTU. Though roughly equivalent at JTUs > 25, these are not equivalent for lower measurements; the original units should have been retained.
Field pH • Oct 7, 1975 to Nov 1981: pH data from eastern Washington are questionable during this period. • Feb 1978: Began calibrating meter twice monthly. Previous procedures unknown. (See memo
from Bill Yake, 30 Jan 1978 and Ambient Monitoring Procedure-1978(?) notebook) • 1986: Changed to Beckman digital pH meter with gel probe. • Dec 1991: Changed to Orion model 250A meter with "spare water" liquid probe (uses 1M KCl,
rather than 4M). Calibrate daily and check calibration three times during the sampling day. • Oct 1, 2011: Dropped Orion model 250A meter and started using Hach model HQ40d
combination meter for both pH and conductivity. See the WY 2011 Annual Report for results of a method comparison study.
Temperature • Feb 1978: Switched from thermometer in bucket to thermistor in river. (See memo from
Bill Yake, 30 Jan 1978 and Ambient Monitoring Procedure-1978(?) notebook.)
Page 92
• Feb 1985: Checked thermistor calibration daily (internal calibration check based on red-lining needle, not a check against a NIST thermometer) (Memorandum from John Bernhardt, Feb 7, 1985).
• Spring 1994: Switched to YSI 300 meter (precision +/- 0.4C) • Jan 1, 2001: Began calibrating thermistors prior to each run rather than annually. Some
thermistors were found to be as much as 1-2 °C low. • About May 2006: Began evaluating thermistor calibration at several temperatures and calculating
correction coefficients based on a linear regression correction. Corrections are applied upon data entry by the database rather than by the sampler.
Oxygen • Oct 1, 1977: Began measuring barometric pressure to calculate percent saturation. Previous
saturation calculations were presumably based on elevation. • Mar 1989: Began applying correction factor to results of Winkler analyses based on titration with
sodium biiodate to correct sodium thiosulfate normality to 0.025. Previously, thiosulfate was standardized upon preparation, but not during use.
Barometric Pressure • Feb 1985: Began calibrating barometer before each run based on National Weather Service report
from Olympia airport (Memorandum from John Bernhardt, Feb 7, 1985). • 1995: Began calibrating barometer prior to each run using an on-site mercury barometer rather
than pressure as reported by the Olympia airport. • 2003: Began calibrating barometer prior to each run using an on-site digital barometer rather than
the mercury barometer. Calibrating digital barometer to mercury barometer annually. • Jan 2008: Began calibrating on-site digital barometer twice yearly against a mercury barometer. • ~April 2011: Evaluated historical data against elevation-based BP and adjusted quality codes for
some data points. Implemented BP QC check which compares BP during data entry to expected BP based on elevation.
Chlorophyll • Mar 15, 1990: Switched to fluorometric method (from spectrophotometric). New method has
lower detection limit (0.02 ug/L) but less precision. (See memo from Despina Strong, April 12, 1990.)
Hardness • Jul 1, 1991: Began using 125 ml bottle with HNO3 as preservative. (Previously, aliquot from
unpreserved general chemistry bottle was used.) Metals • May 1994: Implemented low-level dissolved metals monitoring at selected stations. Metals
results prior to this date are questionable unless well above detection limits and have been quality-coded “9” in our database so that they will not routinely be retrieved. Quality problems
Page 93
include inconsistent blank correction and indications of simultaneous peaks and troughs in data series from unrelated stations for results above reporting limits.
• Apr 2010: A review of historical blank data showed that dissolved zinc exceed reporting limits of 1 ug/L 43% of the time (though never greater than 5 ug/L). As a result, we have decided to set the quality code field = 4 for reported dissolved zinc results < 5 ug/L, which indicates a potential data quality issue.
Flow • Oct 1, 2009: Began recording uncorrected stage, correction, and error estimate. • Feb 2011: Processing of flow for ambient stations shifted from Howard Christensen to Jason
Myers. Prior to this time, flows below some dams (e.g., Grand Coulee) were miss-calculated. (These flows have been corrected.)
• Oct 2011: Decided to remove flows from the web (and replace with a link to our source, typically USGS, USCOE, or in-house) and code flows in EIM “Instantaneous flow based on provisional data obtained from various sources. Not confirmed.” We also developed procedures to automate retrieval of flow data and to document and manage metadata used for determining flow (e.g., time of travel correction).
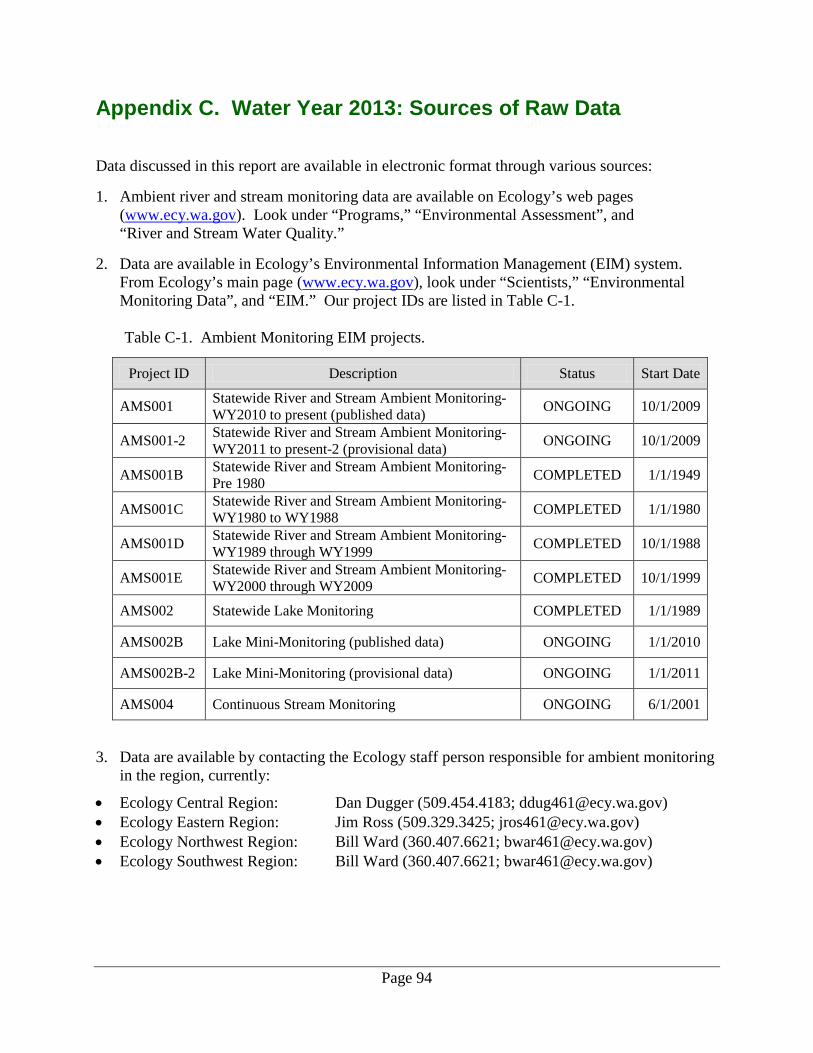
Page 94
Appendix C. Water Year 2013: Sources of Raw Data Data discussed in this report are available in electronic format through various sources: 1. Ambient river and stream monitoring data are available on Ecology’s web pages
(www.ecy.wa.gov). Look under “Programs,” “Environmental Assessment”, and “River and Stream Water Quality.”
2. Data are available in Ecology’s Environmental Information Management (EIM) system.
From Ecology’s main page (www.ecy.wa.gov), look under “Scientists,” “Environmental Monitoring Data”, and “EIM.” Our project IDs are listed in Table C-1. Table C-1. Ambient Monitoring EIM projects.
Project ID Description Status Start Date
AMS001 Statewide River and Stream Ambient Monitoring-WY2010 to present (published data) ONGOING 10/1/2009
AMS001-2 Statewide River and Stream Ambient Monitoring-WY2011 to present-2 (provisional data) ONGOING 10/1/2009
AMS001B Statewide River and Stream Ambient Monitoring- Pre 1980 COMPLETED 1/1/1949
AMS001C Statewide River and Stream Ambient Monitoring- WY1980 to WY1988 COMPLETED 1/1/1980
AMS001D Statewide River and Stream Ambient Monitoring-WY1989 through WY1999 COMPLETED 10/1/1988
AMS001E Statewide River and Stream Ambient Monitoring-WY2000 through WY2009 COMPLETED 10/1/1999
AMS002 Statewide Lake Monitoring COMPLETED 1/1/1989
AMS002B Lake Mini-Monitoring (published data) ONGOING 1/1/2010
AMS002B-2 Lake Mini-Monitoring (provisional data) ONGOING 1/1/2011
AMS004 Continuous Stream Monitoring ONGOING 6/1/2001
3. Data are available by contacting the Ecology staff person responsible for ambient monitoring
in the region, currently:
• Ecology Central Region: Dan Dugger (509.454.4183; [email protected]) • Ecology Eastern Region: Jim Ross (509.329.3425; [email protected]) • Ecology Northwest Region: Bill Ward (360.407.6621; [email protected]) • Ecology Southwest Region: Bill Ward (360.407.6621; [email protected])
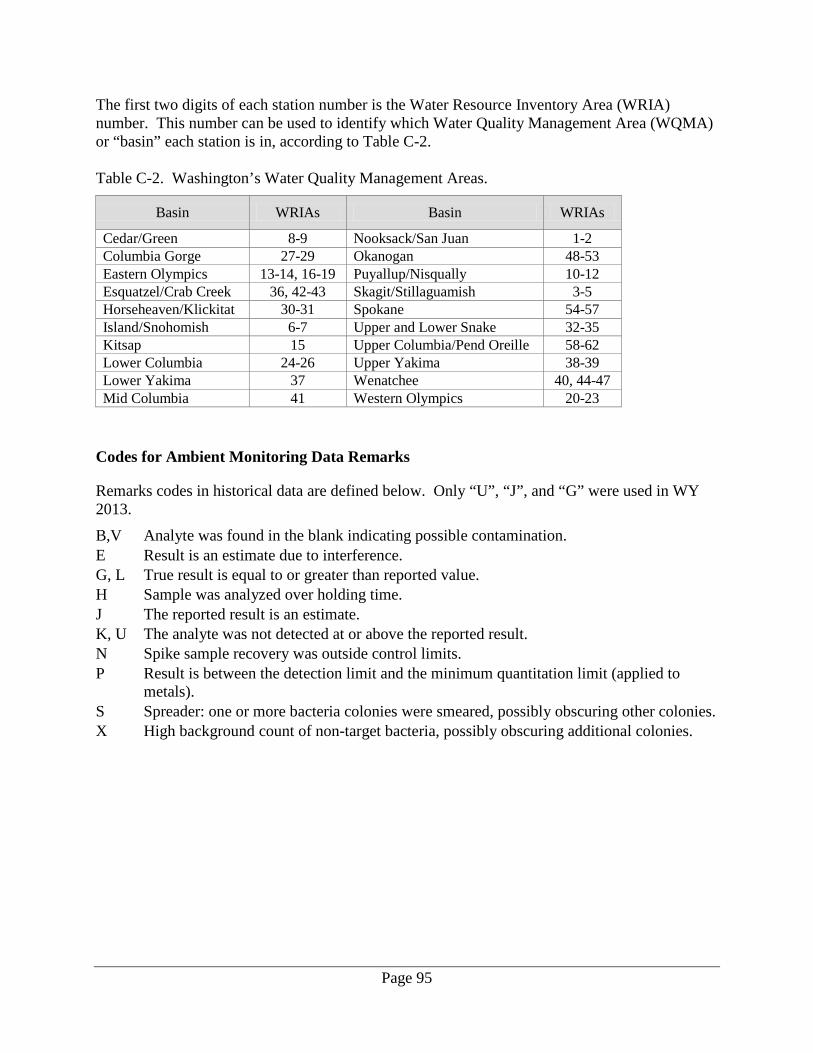
Page 95
The first two digits of each station number is the Water Resource Inventory Area (WRIA) number. This number can be used to identify which Water Quality Management Area (WQMA) or “basin” each station is in, according to Table C-2. Table C-2. Washington’s Water Quality Management Areas.
Basin WRIAs Basin WRIAs Cedar/Green 8-9 Nooksack/San Juan 1-2 Columbia Gorge 27-29 Okanogan 48-53 Eastern Olympics 13-14, 16-19 Puyallup/Nisqually 10-12 Esquatzel/Crab Creek 36, 42-43 Skagit/Stillaguamish 3-5 Horseheaven/Klickitat 30-31 Spokane 54-57 Island/Snohomish 6-7 Upper and Lower Snake 32-35 Kitsap 15 Upper Columbia/Pend Oreille 58-62 Lower Columbia 24-26 Upper Yakima 38-39 Lower Yakima 37 Wenatchee 40, 44-47 Mid Columbia 41 Western Olympics 20-23
Codes for Ambient Monitoring Data Remarks
Remarks codes in historical data are defined below. Only “U”, “J”, and “G” were used in WY 2013.
B,V Analyte was found in the blank indicating possible contamination. E Result is an estimate due to interference. G, L True result is equal to or greater than reported value. H Sample was analyzed over holding time. J The reported result is an estimate. K, U The analyte was not detected at or above the reported result. N Spike sample recovery was outside control limits. P Result is between the detection limit and the minimum quantitation limit (applied to
metals). S Spreader: one or more bacteria colonies were smeared, possibly obscuring other colonies. X High background count of non-target bacteria, possibly obscuring additional colonies.
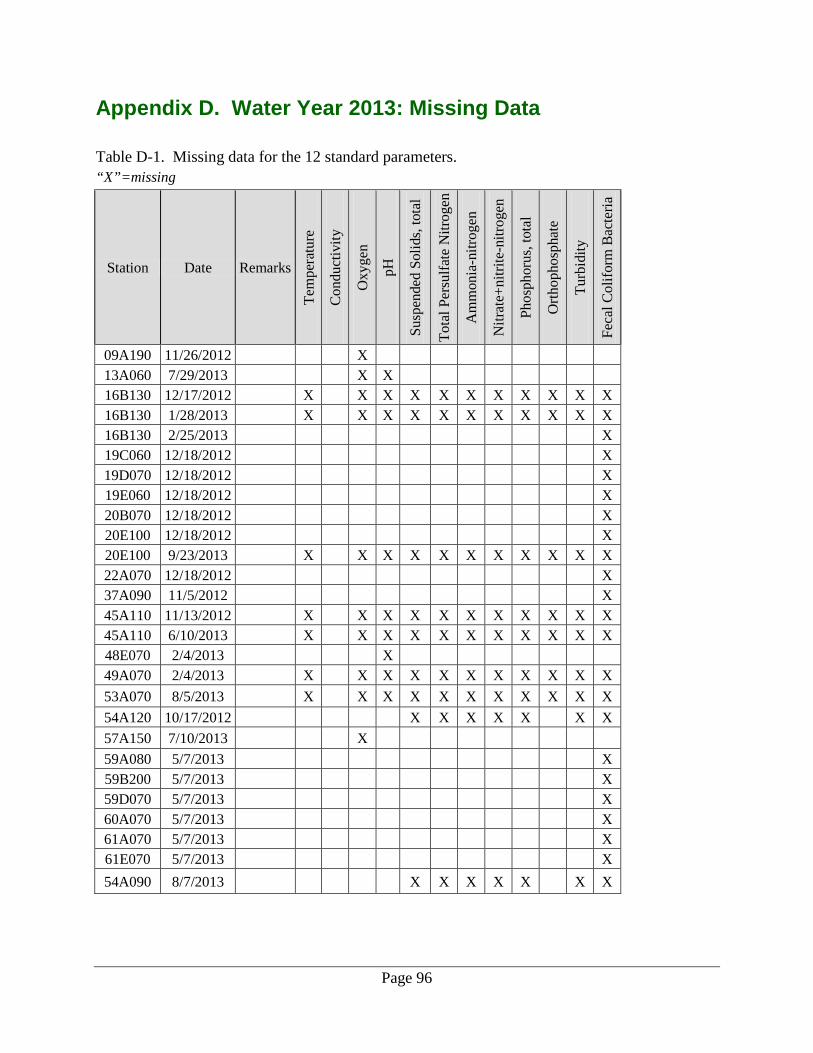
Page 96
Appendix D. Water Year 2013: Missing Data
Table D-1. Missing data for the 12 standard parameters. “X”=missing
Station Date Remarks
Tem
pera
ture
Con
duct
ivity
Oxy
gen
pH
Susp
ende
d So
lids,
tota
l
Tota
l Per
sulfa
te N
itrog
en
Am
mon
ia-n
itrog
en
Nitr
ate+
nitri
te-n
itrog
en
Phos
phor
us, t
otal
Orth
opho
spha
te
Turb
idity
Feca
l Col
iform
Bac
teria
09A190 11/26/2012 X 13A060 7/29/2013 X X 16B130 12/17/2012 X X X X X X X X X X X 16B130 1/28/2013 X X X X X X X X X X X 16B130 2/25/2013 X 19C060 12/18/2012 X 19D070 12/18/2012 X 19E060 12/18/2012 X 20B070 12/18/2012 X 20E100 12/18/2012 X 20E100 9/23/2013 X X X X X X X X X X X 22A070 12/18/2012 X 37A090 11/5/2012 X 45A110 11/13/2012 X X X X X X X X X X X 45A110 6/10/2013 X X X X X X X X X X X 48E070 2/4/2013 X 49A070 2/4/2013 X X X X X X X X X X X 53A070 8/5/2013 X X X X X X X X X X X 54A120 10/17/2012 X X X X X X X 57A150 7/10/2013 X 59A080 5/7/2013 X 59B200 5/7/2013 X 59D070 5/7/2013 X 60A070 5/7/2013 X 61A070 5/7/2013 X 61E070 5/7/2013 X 54A090 8/7/2013 X X X X X X X
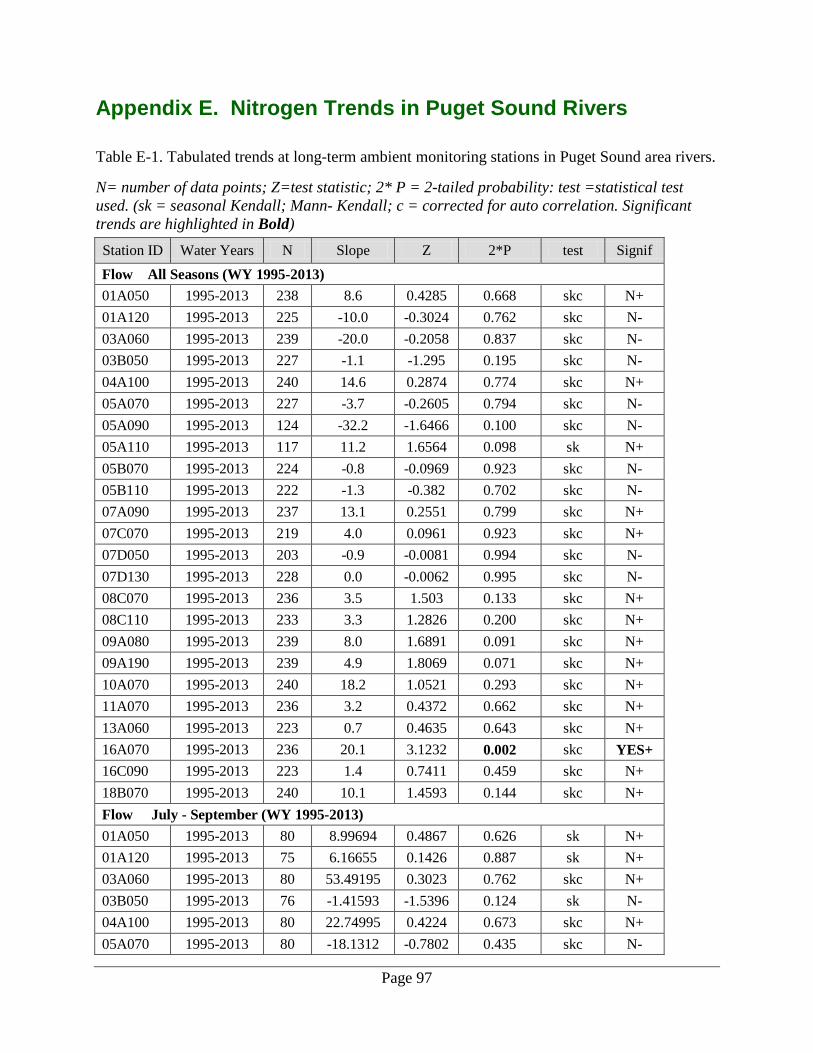
Page 97
Appendix E. Nitrogen Trends in Puget Sound Rivers Table E-1. Tabulated trends at long-term ambient monitoring stations in Puget Sound area rivers. N= number of data points; Z=test statistic; 2* P = 2-tailed probability: test =statistical test used. (sk = seasonal Kendall; Mann- Kendall; c = corrected for auto correlation. Significant trends are highlighted in Bold) Station ID Water Years N Slope Z 2*P test Signif Flow All Seasons (WY 1995-2013) 01A050 1995-2013 238 8.6 0.4285 0.668 skc N+ 01A120 1995-2013 225 -10.0 -0.3024 0.762 skc N- 03A060 1995-2013 239 -20.0 -0.2058 0.837 skc N- 03B050 1995-2013 227 -1.1 -1.295 0.195 skc N- 04A100 1995-2013 240 14.6 0.2874 0.774 skc N+ 05A070 1995-2013 227 -3.7 -0.2605 0.794 skc N- 05A090 1995-2013 124 -32.2 -1.6466 0.100 skc N- 05A110 1995-2013 117 11.2 1.6564 0.098 sk N+ 05B070 1995-2013 224 -0.8 -0.0969 0.923 skc N- 05B110 1995-2013 222 -1.3 -0.382 0.702 skc N- 07A090 1995-2013 237 13.1 0.2551 0.799 skc N+ 07C070 1995-2013 219 4.0 0.0961 0.923 skc N+ 07D050 1995-2013 203 -0.9 -0.0081 0.994 skc N- 07D130 1995-2013 228 0.0 -0.0062 0.995 skc N- 08C070 1995-2013 236 3.5 1.503 0.133 skc N+ 08C110 1995-2013 233 3.3 1.2826 0.200 skc N+ 09A080 1995-2013 239 8.0 1.6891 0.091 skc N+ 09A190 1995-2013 239 4.9 1.8069 0.071 skc N+ 10A070 1995-2013 240 18.2 1.0521 0.293 skc N+ 11A070 1995-2013 236 3.2 0.4372 0.662 skc N+ 13A060 1995-2013 223 0.7 0.4635 0.643 skc N+ 16A070 1995-2013 236 20.1 3.1232 0.002 skc YES+ 16C090 1995-2013 223 1.4 0.7411 0.459 skc N+ 18B070 1995-2013 240 10.1 1.4593 0.144 skc N+ Flow July - September (WY 1995-2013) 01A050 1995-2013 80 8.99694 0.4867 0.626 sk N+ 01A120 1995-2013 75 6.16655 0.1426 0.887 sk N+ 03A060 1995-2013 80 53.49195 0.3023 0.762 skc N+ 03B050 1995-2013 76 -1.41593 -1.5396 0.124 sk N- 04A100 1995-2013 80 22.74995 0.4224 0.673 skc N+ 05A070 1995-2013 80 -18.1312 -0.7802 0.435 skc N-
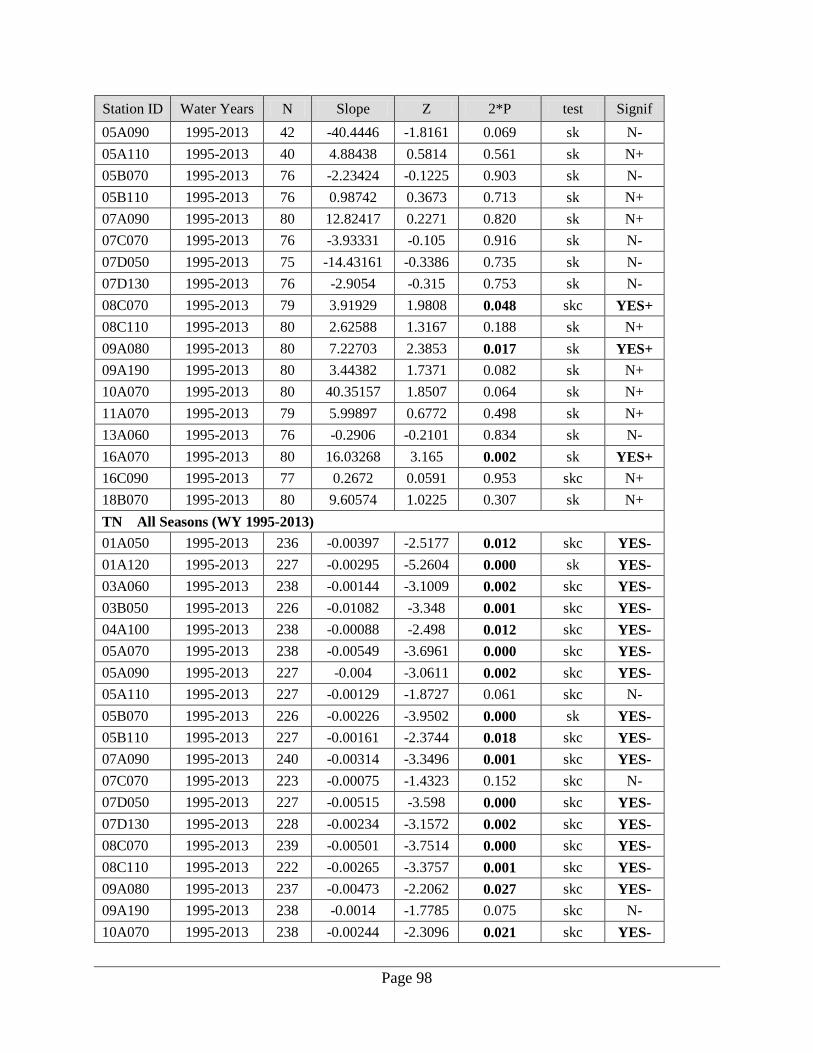
Page 98
Station ID Water Years N Slope Z 2*P test Signif 05A090 1995-2013 42 -40.4446 -1.8161 0.069 sk N- 05A110 1995-2013 40 4.88438 0.5814 0.561 sk N+ 05B070 1995-2013 76 -2.23424 -0.1225 0.903 sk N- 05B110 1995-2013 76 0.98742 0.3673 0.713 sk N+ 07A090 1995-2013 80 12.82417 0.2271 0.820 sk N+ 07C070 1995-2013 76 -3.93331 -0.105 0.916 sk N- 07D050 1995-2013 75 -14.43161 -0.3386 0.735 sk N- 07D130 1995-2013 76 -2.9054 -0.315 0.753 sk N- 08C070 1995-2013 79 3.91929 1.9808 0.048 skc YES+ 08C110 1995-2013 80 2.62588 1.3167 0.188 sk N+ 09A080 1995-2013 80 7.22703 2.3853 0.017 sk YES+ 09A190 1995-2013 80 3.44382 1.7371 0.082 sk N+ 10A070 1995-2013 80 40.35157 1.8507 0.064 sk N+ 11A070 1995-2013 79 5.99897 0.6772 0.498 sk N+ 13A060 1995-2013 76 -0.2906 -0.2101 0.834 sk N- 16A070 1995-2013 80 16.03268 3.165 0.002 sk YES+ 16C090 1995-2013 77 0.2672 0.0591 0.953 skc N+ 18B070 1995-2013 80 9.60574 1.0225 0.307 sk N+ TN All Seasons (WY 1995-2013) 01A050 1995-2013 236 -0.00397 -2.5177 0.012 skc YES- 01A120 1995-2013 227 -0.00295 -5.2604 0.000 sk YES- 03A060 1995-2013 238 -0.00144 -3.1009 0.002 skc YES- 03B050 1995-2013 226 -0.01082 -3.348 0.001 skc YES- 04A100 1995-2013 238 -0.00088 -2.498 0.012 skc YES- 05A070 1995-2013 238 -0.00549 -3.6961 0.000 skc YES- 05A090 1995-2013 227 -0.004 -3.0611 0.002 skc YES- 05A110 1995-2013 227 -0.00129 -1.8727 0.061 skc N- 05B070 1995-2013 226 -0.00226 -3.9502 0.000 sk YES- 05B110 1995-2013 227 -0.00161 -2.3744 0.018 skc YES- 07A090 1995-2013 240 -0.00314 -3.3496 0.001 skc YES- 07C070 1995-2013 223 -0.00075 -1.4323 0.152 skc N- 07D050 1995-2013 227 -0.00515 -3.598 0.000 skc YES- 07D130 1995-2013 228 -0.00234 -3.1572 0.002 skc YES- 08C070 1995-2013 239 -0.00501 -3.7514 0.000 skc YES- 08C110 1995-2013 222 -0.00265 -3.3757 0.001 skc YES- 09A080 1995-2013 237 -0.00473 -2.2062 0.027 skc YES- 09A190 1995-2013 238 -0.0014 -1.7785 0.075 skc N- 10A070 1995-2013 238 -0.00244 -2.3096 0.021 skc YES-
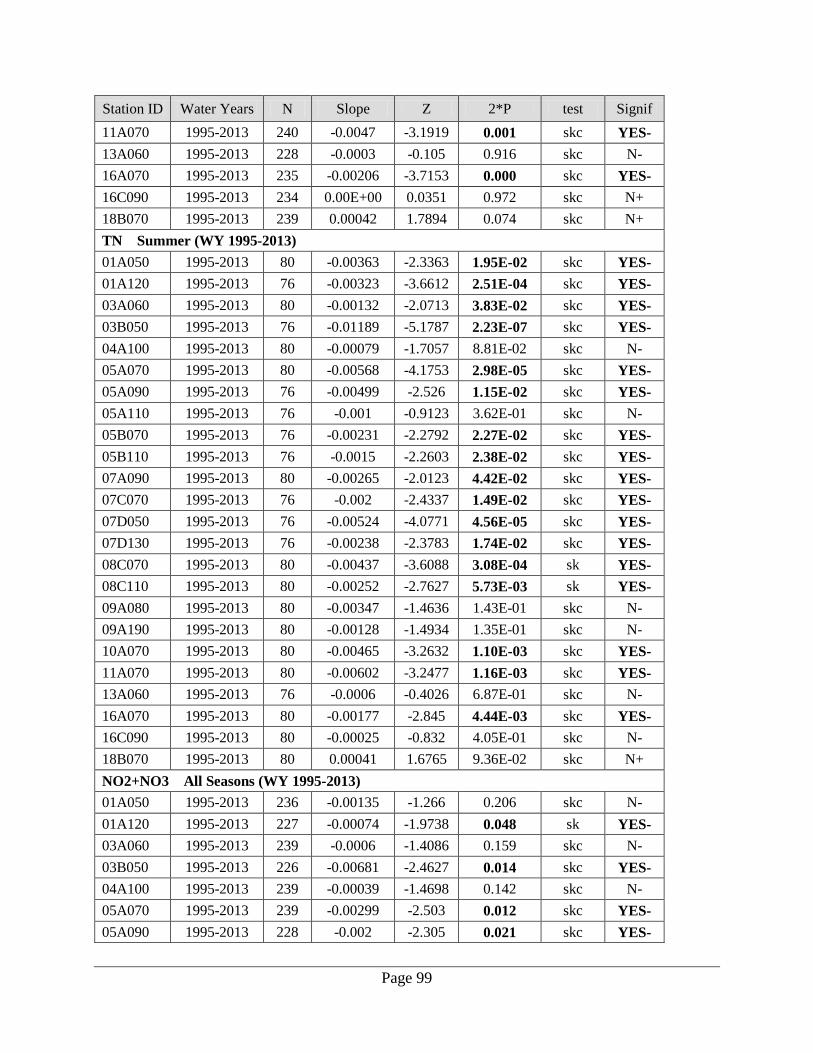
Page 99
Station ID Water Years N Slope Z 2*P test Signif 11A070 1995-2013 240 -0.0047 -3.1919 0.001 skc YES- 13A060 1995-2013 228 -0.0003 -0.105 0.916 skc N- 16A070 1995-2013 235 -0.00206 -3.7153 0.000 skc YES- 16C090 1995-2013 234 0.00E+00 0.0351 0.972 skc N+ 18B070 1995-2013 239 0.00042 1.7894 0.074 skc N+ TN Summer (WY 1995-2013) 01A050 1995-2013 80 -0.00363 -2.3363 1.95E-02 skc YES- 01A120 1995-2013 76 -0.00323 -3.6612 2.51E-04 skc YES- 03A060 1995-2013 80 -0.00132 -2.0713 3.83E-02 skc YES- 03B050 1995-2013 76 -0.01189 -5.1787 2.23E-07 skc YES- 04A100 1995-2013 80 -0.00079 -1.7057 8.81E-02 skc N- 05A070 1995-2013 80 -0.00568 -4.1753 2.98E-05 skc YES- 05A090 1995-2013 76 -0.00499 -2.526 1.15E-02 skc YES- 05A110 1995-2013 76 -0.001 -0.9123 3.62E-01 skc N- 05B070 1995-2013 76 -0.00231 -2.2792 2.27E-02 skc YES- 05B110 1995-2013 76 -0.0015 -2.2603 2.38E-02 skc YES- 07A090 1995-2013 80 -0.00265 -2.0123 4.42E-02 skc YES- 07C070 1995-2013 76 -0.002 -2.4337 1.49E-02 skc YES- 07D050 1995-2013 76 -0.00524 -4.0771 4.56E-05 skc YES- 07D130 1995-2013 76 -0.00238 -2.3783 1.74E-02 skc YES- 08C070 1995-2013 80 -0.00437 -3.6088 3.08E-04 sk YES- 08C110 1995-2013 80 -0.00252 -2.7627 5.73E-03 sk YES- 09A080 1995-2013 80 -0.00347 -1.4636 1.43E-01 skc N- 09A190 1995-2013 80 -0.00128 -1.4934 1.35E-01 skc N- 10A070 1995-2013 80 -0.00465 -3.2632 1.10E-03 skc YES- 11A070 1995-2013 80 -0.00602 -3.2477 1.16E-03 skc YES- 13A060 1995-2013 76 -0.0006 -0.4026 6.87E-01 skc N- 16A070 1995-2013 80 -0.00177 -2.845 4.44E-03 skc YES- 16C090 1995-2013 80 -0.00025 -0.832 4.05E-01 skc N- 18B070 1995-2013 80 0.00041 1.6765 9.36E-02 skc N+ NO2+NO3 All Seasons (WY 1995-2013) 01A050 1995-2013 236 -0.00135 -1.266 0.206 skc N- 01A120 1995-2013 227 -0.00074 -1.9738 0.048 sk YES- 03A060 1995-2013 239 -0.0006 -1.4086 0.159 skc N- 03B050 1995-2013 226 -0.00681 -2.4627 0.014 skc YES- 04A100 1995-2013 239 -0.00039 -1.4698 0.142 skc N- 05A070 1995-2013 239 -0.00299 -2.503 0.012 skc YES- 05A090 1995-2013 228 -0.002 -2.305 0.021 skc YES-
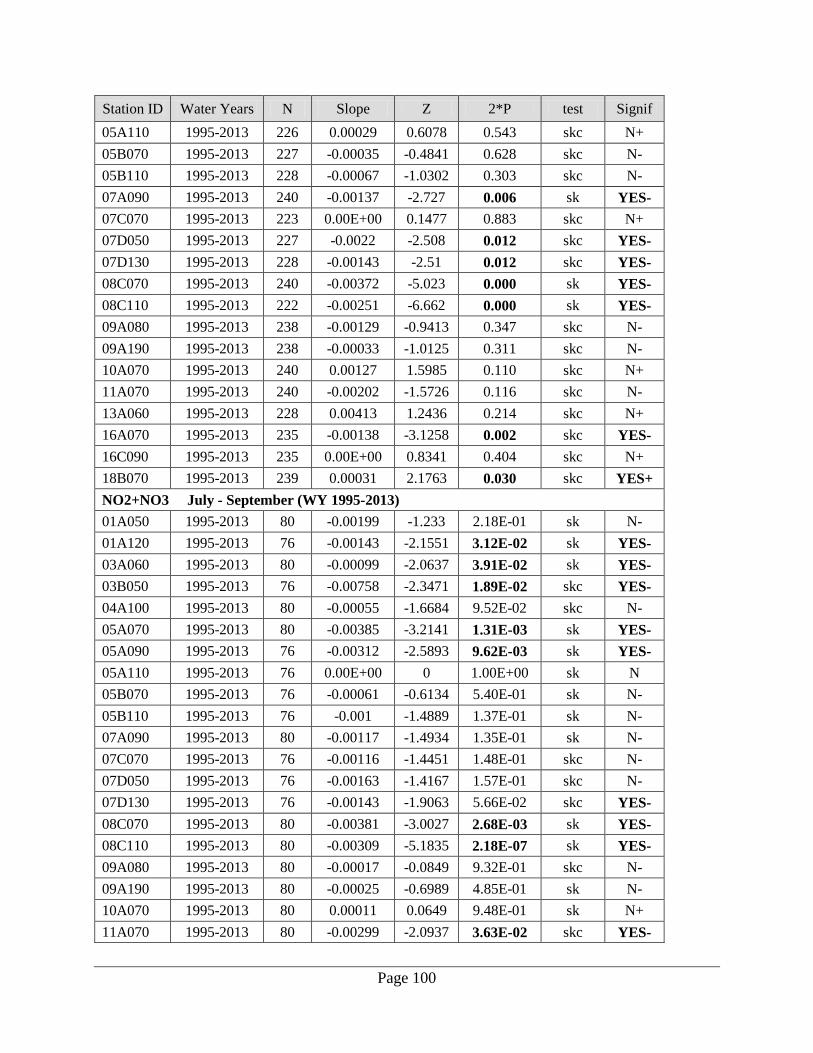
Page 100
Station ID Water Years N Slope Z 2*P test Signif 05A110 1995-2013 226 0.00029 0.6078 0.543 skc N+ 05B070 1995-2013 227 -0.00035 -0.4841 0.628 skc N- 05B110 1995-2013 228 -0.00067 -1.0302 0.303 skc N- 07A090 1995-2013 240 -0.00137 -2.727 0.006 sk YES- 07C070 1995-2013 223 0.00E+00 0.1477 0.883 skc N+ 07D050 1995-2013 227 -0.0022 -2.508 0.012 skc YES- 07D130 1995-2013 228 -0.00143 -2.51 0.012 skc YES- 08C070 1995-2013 240 -0.00372 -5.023 0.000 sk YES- 08C110 1995-2013 222 -0.00251 -6.662 0.000 sk YES- 09A080 1995-2013 238 -0.00129 -0.9413 0.347 skc N- 09A190 1995-2013 238 -0.00033 -1.0125 0.311 skc N- 10A070 1995-2013 240 0.00127 1.5985 0.110 skc N+ 11A070 1995-2013 240 -0.00202 -1.5726 0.116 skc N- 13A060 1995-2013 228 0.00413 1.2436 0.214 skc N+ 16A070 1995-2013 235 -0.00138 -3.1258 0.002 skc YES- 16C090 1995-2013 235 0.00E+00 0.8341 0.404 skc N+ 18B070 1995-2013 239 0.00031 2.1763 0.030 skc YES+ NO2+NO3 July - September (WY 1995-2013) 01A050 1995-2013 80 -0.00199 -1.233 2.18E-01 sk N- 01A120 1995-2013 76 -0.00143 -2.1551 3.12E-02 sk YES- 03A060 1995-2013 80 -0.00099 -2.0637 3.91E-02 sk YES- 03B050 1995-2013 76 -0.00758 -2.3471 1.89E-02 skc YES- 04A100 1995-2013 80 -0.00055 -1.6684 9.52E-02 skc N- 05A070 1995-2013 80 -0.00385 -3.2141 1.31E-03 sk YES- 05A090 1995-2013 76 -0.00312 -2.5893 9.62E-03 sk YES- 05A110 1995-2013 76 0.00E+00 0 1.00E+00 sk N 05B070 1995-2013 76 -0.00061 -0.6134 5.40E-01 sk N- 05B110 1995-2013 76 -0.001 -1.4889 1.37E-01 sk N- 07A090 1995-2013 80 -0.00117 -1.4934 1.35E-01 sk N- 07C070 1995-2013 76 -0.00116 -1.4451 1.48E-01 skc N- 07D050 1995-2013 76 -0.00163 -1.4167 1.57E-01 skc N- 07D130 1995-2013 76 -0.00143 -1.9063 5.66E-02 skc YES- 08C070 1995-2013 80 -0.00381 -3.0027 2.68E-03 sk YES- 08C110 1995-2013 80 -0.00309 -5.1835 2.18E-07 sk YES- 09A080 1995-2013 80 -0.00017 -0.0849 9.32E-01 skc N- 09A190 1995-2013 80 -0.00025 -0.6989 4.85E-01 sk N- 10A070 1995-2013 80 0.00011 0.0649 9.48E-01 sk N+ 11A070 1995-2013 80 -0.00299 -2.0937 3.63E-02 skc YES-
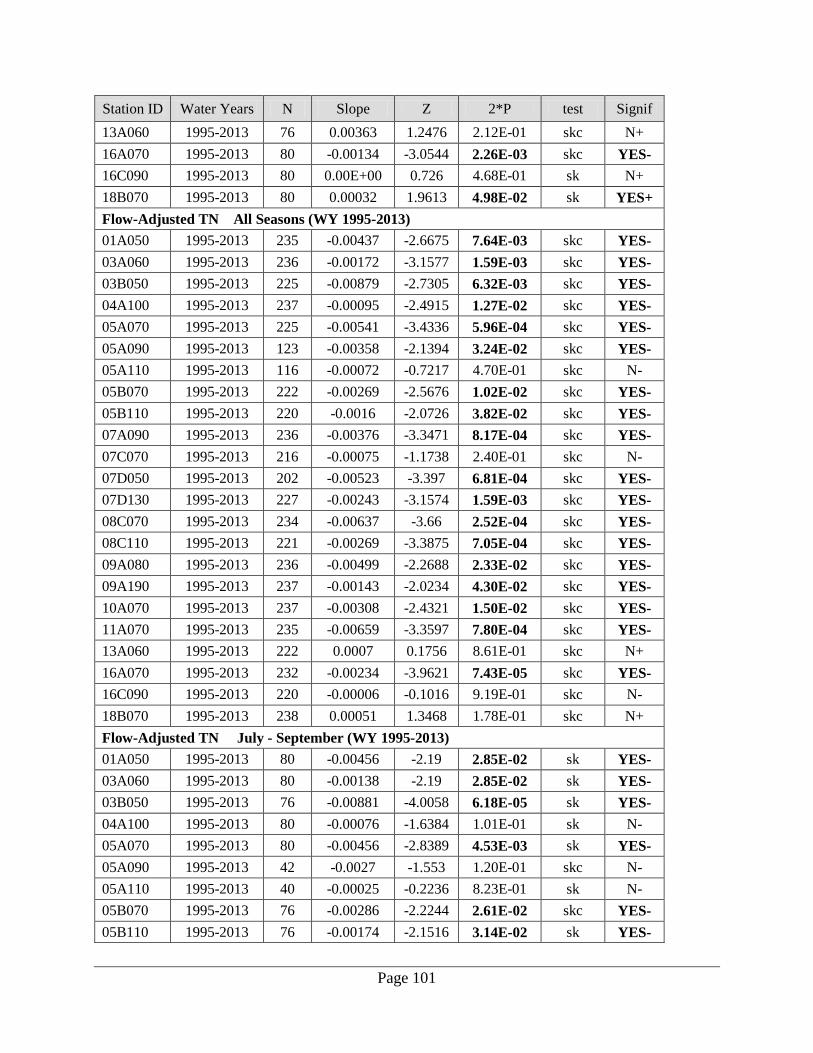
Page 101
Station ID Water Years N Slope Z 2*P test Signif 13A060 1995-2013 76 0.00363 1.2476 2.12E-01 skc N+ 16A070 1995-2013 80 -0.00134 -3.0544 2.26E-03 skc YES- 16C090 1995-2013 80 0.00E+00 0.726 4.68E-01 sk N+ 18B070 1995-2013 80 0.00032 1.9613 4.98E-02 sk YES+ Flow-Adjusted TN All Seasons (WY 1995-2013) 01A050 1995-2013 235 -0.00437 -2.6675 7.64E-03 skc YES- 03A060 1995-2013 236 -0.00172 -3.1577 1.59E-03 skc YES- 03B050 1995-2013 225 -0.00879 -2.7305 6.32E-03 skc YES- 04A100 1995-2013 237 -0.00095 -2.4915 1.27E-02 skc YES- 05A070 1995-2013 225 -0.00541 -3.4336 5.96E-04 skc YES- 05A090 1995-2013 123 -0.00358 -2.1394 3.24E-02 skc YES- 05A110 1995-2013 116 -0.00072 -0.7217 4.70E-01 skc N- 05B070 1995-2013 222 -0.00269 -2.5676 1.02E-02 skc YES- 05B110 1995-2013 220 -0.0016 -2.0726 3.82E-02 skc YES- 07A090 1995-2013 236 -0.00376 -3.3471 8.17E-04 skc YES- 07C070 1995-2013 216 -0.00075 -1.1738 2.40E-01 skc N- 07D050 1995-2013 202 -0.00523 -3.397 6.81E-04 skc YES- 07D130 1995-2013 227 -0.00243 -3.1574 1.59E-03 skc YES- 08C070 1995-2013 234 -0.00637 -3.66 2.52E-04 skc YES- 08C110 1995-2013 221 -0.00269 -3.3875 7.05E-04 skc YES- 09A080 1995-2013 236 -0.00499 -2.2688 2.33E-02 skc YES- 09A190 1995-2013 237 -0.00143 -2.0234 4.30E-02 skc YES- 10A070 1995-2013 237 -0.00308 -2.4321 1.50E-02 skc YES- 11A070 1995-2013 235 -0.00659 -3.3597 7.80E-04 skc YES- 13A060 1995-2013 222 0.0007 0.1756 8.61E-01 skc N+ 16A070 1995-2013 232 -0.00234 -3.9621 7.43E-05 skc YES- 16C090 1995-2013 220 -0.00006 -0.1016 9.19E-01 skc N- 18B070 1995-2013 238 0.00051 1.3468 1.78E-01 skc N+ Flow-Adjusted TN July - September (WY 1995-2013) 01A050 1995-2013 80 -0.00456 -2.19 2.85E-02 sk YES- 03A060 1995-2013 80 -0.00138 -2.19 2.85E-02 sk YES- 03B050 1995-2013 76 -0.00881 -4.0058 6.18E-05 sk YES- 04A100 1995-2013 80 -0.00076 -1.6384 1.01E-01 sk N- 05A070 1995-2013 80 -0.00456 -2.8389 4.53E-03 sk YES- 05A090 1995-2013 42 -0.0027 -1.553 1.20E-01 skc N- 05A110 1995-2013 40 -0.00025 -0.2236 8.23E-01 sk N- 05B070 1995-2013 76 -0.00286 -2.2244 2.61E-02 skc YES- 05B110 1995-2013 76 -0.00174 -2.1516 3.14E-02 sk YES-
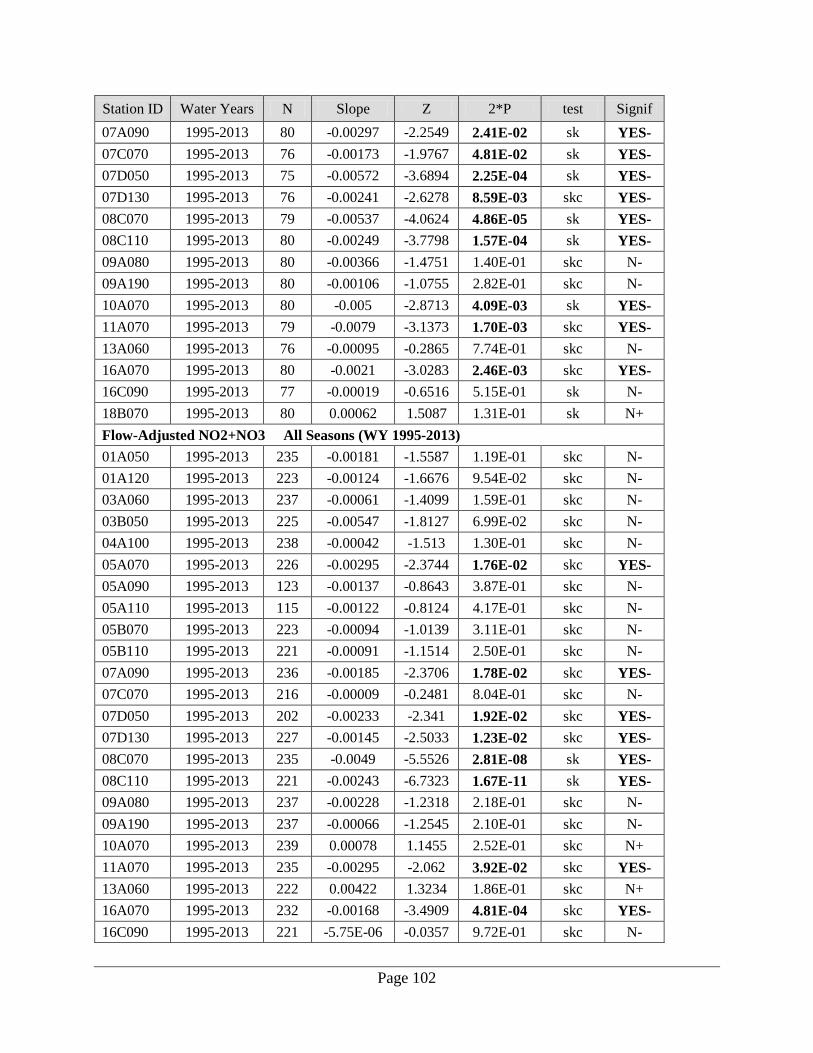
Page 102
Station ID Water Years N Slope Z 2*P test Signif 07A090 1995-2013 80 -0.00297 -2.2549 2.41E-02 sk YES- 07C070 1995-2013 76 -0.00173 -1.9767 4.81E-02 sk YES- 07D050 1995-2013 75 -0.00572 -3.6894 2.25E-04 sk YES- 07D130 1995-2013 76 -0.00241 -2.6278 8.59E-03 skc YES- 08C070 1995-2013 79 -0.00537 -4.0624 4.86E-05 sk YES- 08C110 1995-2013 80 -0.00249 -3.7798 1.57E-04 sk YES- 09A080 1995-2013 80 -0.00366 -1.4751 1.40E-01 skc N- 09A190 1995-2013 80 -0.00106 -1.0755 2.82E-01 skc N- 10A070 1995-2013 80 -0.005 -2.8713 4.09E-03 sk YES- 11A070 1995-2013 79 -0.0079 -3.1373 1.70E-03 skc YES- 13A060 1995-2013 76 -0.00095 -0.2865 7.74E-01 skc N- 16A070 1995-2013 80 -0.0021 -3.0283 2.46E-03 skc YES- 16C090 1995-2013 77 -0.00019 -0.6516 5.15E-01 sk N- 18B070 1995-2013 80 0.00062 1.5087 1.31E-01 sk N+ Flow-Adjusted NO2+NO3 All Seasons (WY 1995-2013) 01A050 1995-2013 235 -0.00181 -1.5587 1.19E-01 skc N- 01A120 1995-2013 223 -0.00124 -1.6676 9.54E-02 skc N- 03A060 1995-2013 237 -0.00061 -1.4099 1.59E-01 skc N- 03B050 1995-2013 225 -0.00547 -1.8127 6.99E-02 skc N- 04A100 1995-2013 238 -0.00042 -1.513 1.30E-01 skc N- 05A070 1995-2013 226 -0.00295 -2.3744 1.76E-02 skc YES- 05A090 1995-2013 123 -0.00137 -0.8643 3.87E-01 skc N- 05A110 1995-2013 115 -0.00122 -0.8124 4.17E-01 skc N- 05B070 1995-2013 223 -0.00094 -1.0139 3.11E-01 skc N- 05B110 1995-2013 221 -0.00091 -1.1514 2.50E-01 skc N- 07A090 1995-2013 236 -0.00185 -2.3706 1.78E-02 skc YES- 07C070 1995-2013 216 -0.00009 -0.2481 8.04E-01 skc N- 07D050 1995-2013 202 -0.00233 -2.341 1.92E-02 skc YES- 07D130 1995-2013 227 -0.00145 -2.5033 1.23E-02 skc YES- 08C070 1995-2013 235 -0.0049 -5.5526 2.81E-08 sk YES- 08C110 1995-2013 221 -0.00243 -6.7323 1.67E-11 sk YES- 09A080 1995-2013 237 -0.00228 -1.2318 2.18E-01 skc N- 09A190 1995-2013 237 -0.00066 -1.2545 2.10E-01 skc N- 10A070 1995-2013 239 0.00078 1.1455 2.52E-01 skc N+ 11A070 1995-2013 235 -0.00295 -2.062 3.92E-02 skc YES- 13A060 1995-2013 222 0.00422 1.3234 1.86E-01 skc N+ 16A070 1995-2013 232 -0.00168 -3.4909 4.81E-04 skc YES- 16C090 1995-2013 221 -5.75E-06 -0.0357 9.72E-01 skc N-
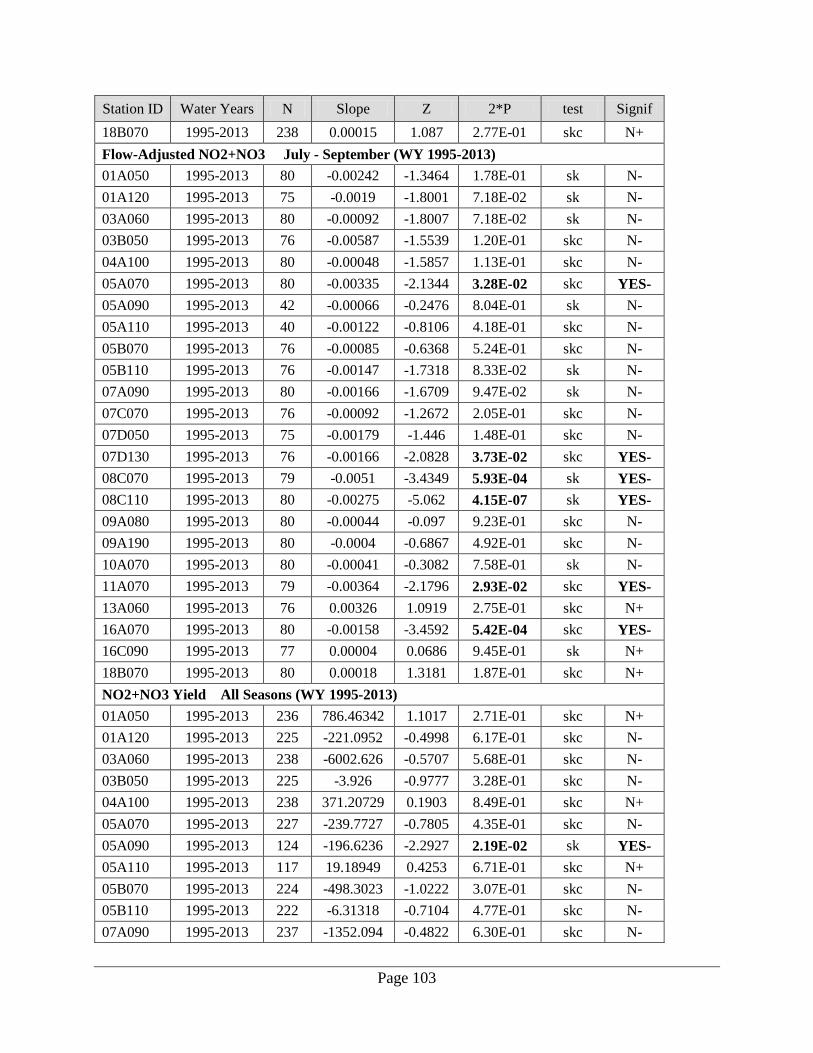
Page 103
Station ID Water Years N Slope Z 2*P test Signif 18B070 1995-2013 238 0.00015 1.087 2.77E-01 skc N+ Flow-Adjusted NO2+NO3 July - September (WY 1995-2013) 01A050 1995-2013 80 -0.00242 -1.3464 1.78E-01 sk N- 01A120 1995-2013 75 -0.0019 -1.8001 7.18E-02 sk N- 03A060 1995-2013 80 -0.00092 -1.8007 7.18E-02 sk N- 03B050 1995-2013 76 -0.00587 -1.5539 1.20E-01 skc N- 04A100 1995-2013 80 -0.00048 -1.5857 1.13E-01 skc N- 05A070 1995-2013 80 -0.00335 -2.1344 3.28E-02 skc YES- 05A090 1995-2013 42 -0.00066 -0.2476 8.04E-01 sk N- 05A110 1995-2013 40 -0.00122 -0.8106 4.18E-01 skc N- 05B070 1995-2013 76 -0.00085 -0.6368 5.24E-01 skc N- 05B110 1995-2013 76 -0.00147 -1.7318 8.33E-02 sk N- 07A090 1995-2013 80 -0.00166 -1.6709 9.47E-02 sk N- 07C070 1995-2013 76 -0.00092 -1.2672 2.05E-01 skc N- 07D050 1995-2013 75 -0.00179 -1.446 1.48E-01 skc N- 07D130 1995-2013 76 -0.00166 -2.0828 3.73E-02 skc YES- 08C070 1995-2013 79 -0.0051 -3.4349 5.93E-04 sk YES- 08C110 1995-2013 80 -0.00275 -5.062 4.15E-07 sk YES- 09A080 1995-2013 80 -0.00044 -0.097 9.23E-01 skc N- 09A190 1995-2013 80 -0.0004 -0.6867 4.92E-01 skc N- 10A070 1995-2013 80 -0.00041 -0.3082 7.58E-01 sk N- 11A070 1995-2013 79 -0.00364 -2.1796 2.93E-02 skc YES- 13A060 1995-2013 76 0.00326 1.0919 2.75E-01 skc N+ 16A070 1995-2013 80 -0.00158 -3.4592 5.42E-04 skc YES- 16C090 1995-2013 77 0.00004 0.0686 9.45E-01 sk N+ 18B070 1995-2013 80 0.00018 1.3181 1.87E-01 skc N+ NO2+NO3 Yield All Seasons (WY 1995-2013) 01A050 1995-2013 236 786.46342 1.1017 2.71E-01 skc N+ 01A120 1995-2013 225 -221.0952 -0.4998 6.17E-01 skc N- 03A060 1995-2013 238 -6002.626 -0.5707 5.68E-01 skc N- 03B050 1995-2013 225 -3.926 -0.9777 3.28E-01 skc N- 04A100 1995-2013 238 371.20729 0.1903 8.49E-01 skc N+ 05A070 1995-2013 227 -239.7727 -0.7805 4.35E-01 skc N- 05A090 1995-2013 124 -196.6236 -2.2927 2.19E-02 sk YES- 05A110 1995-2013 117 19.18949 0.4253 6.71E-01 skc N+ 05B070 1995-2013 224 -498.3023 -1.0222 3.07E-01 skc N- 05B110 1995-2013 222 -6.31318 -0.7104 4.77E-01 skc N- 07A090 1995-2013 237 -1352.094 -0.4822 6.30E-01 skc N-
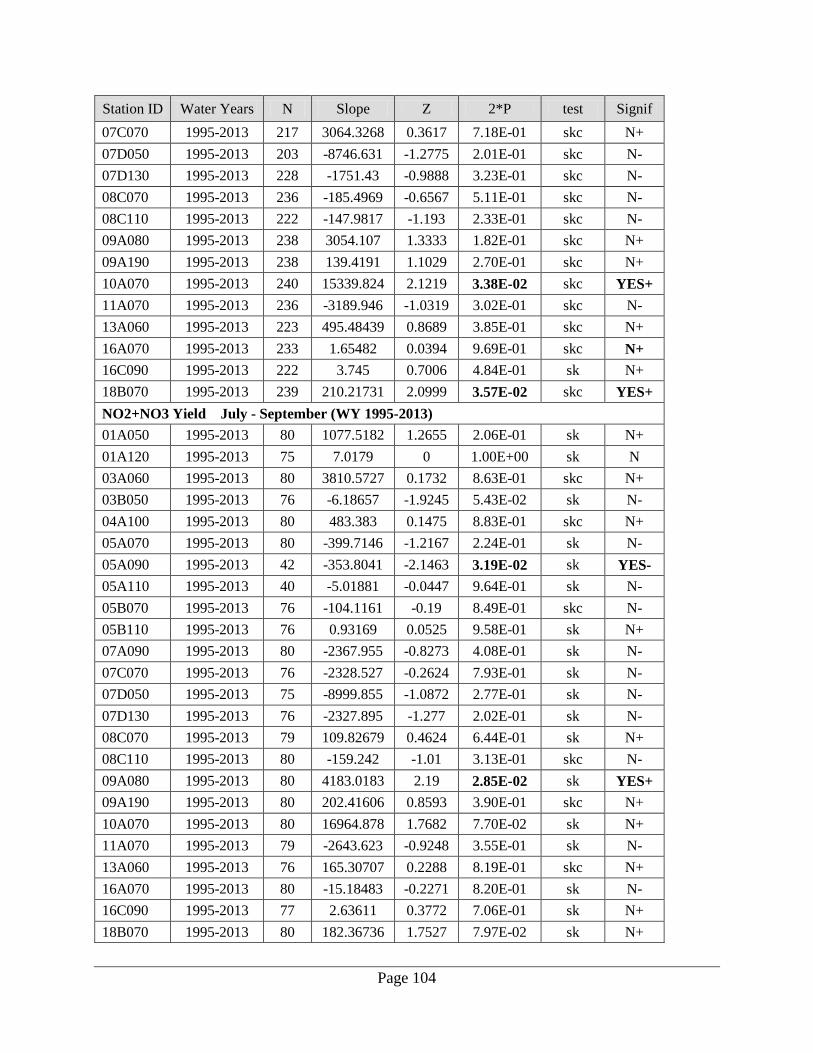
Page 104
Station ID Water Years N Slope Z 2*P test Signif 07C070 1995-2013 217 3064.3268 0.3617 7.18E-01 skc N+ 07D050 1995-2013 203 -8746.631 -1.2775 2.01E-01 skc N- 07D130 1995-2013 228 -1751.43 -0.9888 3.23E-01 skc N- 08C070 1995-2013 236 -185.4969 -0.6567 5.11E-01 skc N- 08C110 1995-2013 222 -147.9817 -1.193 2.33E-01 skc N- 09A080 1995-2013 238 3054.107 1.3333 1.82E-01 skc N+ 09A190 1995-2013 238 139.4191 1.1029 2.70E-01 skc N+ 10A070 1995-2013 240 15339.824 2.1219 3.38E-02 skc YES+ 11A070 1995-2013 236 -3189.946 -1.0319 3.02E-01 skc N- 13A060 1995-2013 223 495.48439 0.8689 3.85E-01 skc N+ 16A070 1995-2013 233 1.65482 0.0394 9.69E-01 skc N+ 16C090 1995-2013 222 3.745 0.7006 4.84E-01 sk N+ 18B070 1995-2013 239 210.21731 2.0999 3.57E-02 skc YES+ NO2+NO3 Yield July - September (WY 1995-2013) 01A050 1995-2013 80 1077.5182 1.2655 2.06E-01 sk N+ 01A120 1995-2013 75 7.0179 0 1.00E+00 sk N 03A060 1995-2013 80 3810.5727 0.1732 8.63E-01 skc N+ 03B050 1995-2013 76 -6.18657 -1.9245 5.43E-02 sk N- 04A100 1995-2013 80 483.383 0.1475 8.83E-01 skc N+ 05A070 1995-2013 80 -399.7146 -1.2167 2.24E-01 sk N- 05A090 1995-2013 42 -353.8041 -2.1463 3.19E-02 sk YES- 05A110 1995-2013 40 -5.01881 -0.0447 9.64E-01 sk N- 05B070 1995-2013 76 -104.1161 -0.19 8.49E-01 skc N- 05B110 1995-2013 76 0.93169 0.0525 9.58E-01 sk N+ 07A090 1995-2013 80 -2367.955 -0.8273 4.08E-01 sk N- 07C070 1995-2013 76 -2328.527 -0.2624 7.93E-01 sk N- 07D050 1995-2013 75 -8999.855 -1.0872 2.77E-01 sk N- 07D130 1995-2013 76 -2327.895 -1.277 2.02E-01 sk N- 08C070 1995-2013 79 109.82679 0.4624 6.44E-01 sk N+ 08C110 1995-2013 80 -159.242 -1.01 3.13E-01 skc N- 09A080 1995-2013 80 4183.0183 2.19 2.85E-02 sk YES+ 09A190 1995-2013 80 202.41606 0.8593 3.90E-01 skc N+ 10A070 1995-2013 80 16964.878 1.7682 7.70E-02 sk N+ 11A070 1995-2013 79 -2643.623 -0.9248 3.55E-01 sk N- 13A060 1995-2013 76 165.30707 0.2288 8.19E-01 skc N+ 16A070 1995-2013 80 -15.18483 -0.2271 8.20E-01 sk N- 16C090 1995-2013 77 2.63611 0.3772 7.06E-01 sk N+ 18B070 1995-2013 80 182.36736 1.7527 7.97E-02 sk N+
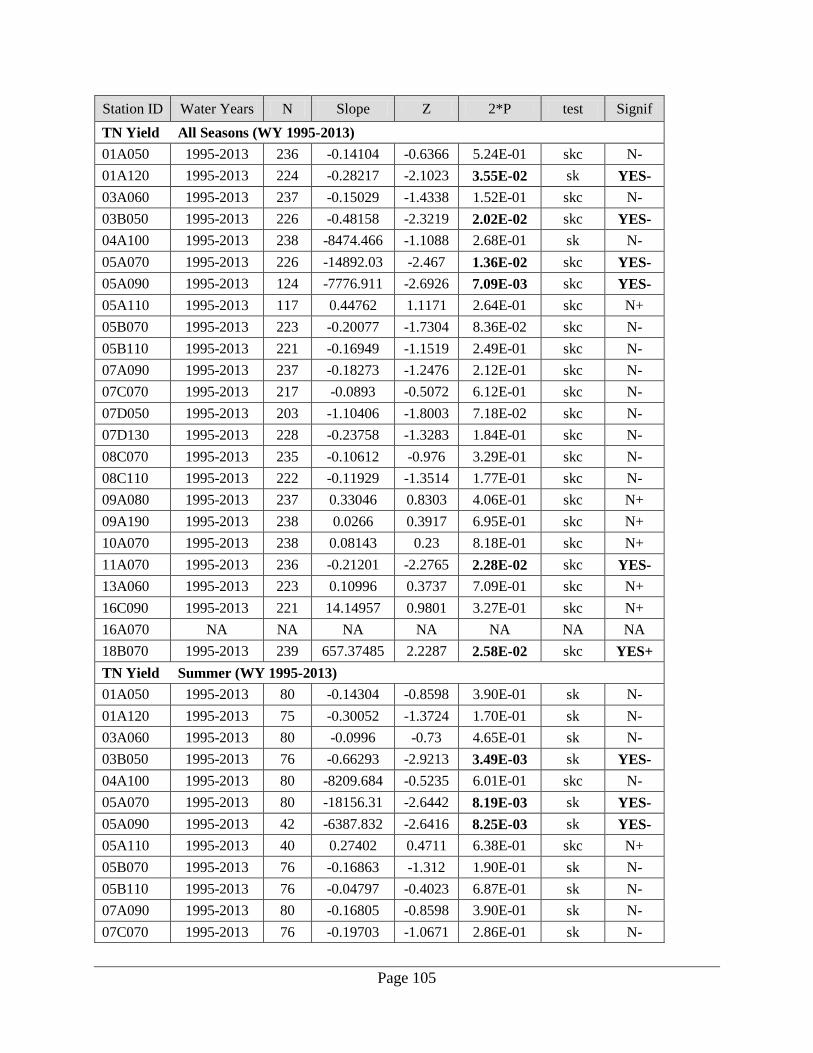
Page 105
Station ID Water Years N Slope Z 2*P test Signif TN Yield All Seasons (WY 1995-2013) 01A050 1995-2013 236 -0.14104 -0.6366 5.24E-01 skc N- 01A120 1995-2013 224 -0.28217 -2.1023 3.55E-02 sk YES- 03A060 1995-2013 237 -0.15029 -1.4338 1.52E-01 skc N- 03B050 1995-2013 226 -0.48158 -2.3219 2.02E-02 skc YES- 04A100 1995-2013 238 -8474.466 -1.1088 2.68E-01 sk N- 05A070 1995-2013 226 -14892.03 -2.467 1.36E-02 skc YES- 05A090 1995-2013 124 -7776.911 -2.6926 7.09E-03 skc YES- 05A110 1995-2013 117 0.44762 1.1171 2.64E-01 skc N+ 05B070 1995-2013 223 -0.20077 -1.7304 8.36E-02 skc N- 05B110 1995-2013 221 -0.16949 -1.1519 2.49E-01 skc N- 07A090 1995-2013 237 -0.18273 -1.2476 2.12E-01 skc N- 07C070 1995-2013 217 -0.0893 -0.5072 6.12E-01 skc N- 07D050 1995-2013 203 -1.10406 -1.8003 7.18E-02 skc N- 07D130 1995-2013 228 -0.23758 -1.3283 1.84E-01 skc N- 08C070 1995-2013 235 -0.10612 -0.976 3.29E-01 skc N- 08C110 1995-2013 222 -0.11929 -1.3514 1.77E-01 skc N- 09A080 1995-2013 237 0.33046 0.8303 4.06E-01 skc N+ 09A190 1995-2013 238 0.0266 0.3917 6.95E-01 skc N+ 10A070 1995-2013 238 0.08143 0.23 8.18E-01 skc N+ 11A070 1995-2013 236 -0.21201 -2.2765 2.28E-02 skc YES- 13A060 1995-2013 223 0.10996 0.3737 7.09E-01 skc N+ 16C090 1995-2013 221 14.14957 0.9801 3.27E-01 skc N+ 16A070 NA NA NA NA NA NA NA 18B070 1995-2013 239 657.37485 2.2287 2.58E-02 skc YES+ TN Yield Summer (WY 1995-2013) 01A050 1995-2013 80 -0.14304 -0.8598 3.90E-01 sk N- 01A120 1995-2013 75 -0.30052 -1.3724 1.70E-01 sk N- 03A060 1995-2013 80 -0.0996 -0.73 4.65E-01 sk N- 03B050 1995-2013 76 -0.66293 -2.9213 3.49E-03 sk YES- 04A100 1995-2013 80 -8209.684 -0.5235 6.01E-01 skc N- 05A070 1995-2013 80 -18156.31 -2.6442 8.19E-03 sk YES- 05A090 1995-2013 42 -6387.832 -2.6416 8.25E-03 sk YES- 05A110 1995-2013 40 0.27402 0.4711 6.38E-01 skc N+ 05B070 1995-2013 76 -0.16863 -1.312 1.90E-01 sk N- 05B110 1995-2013 76 -0.04797 -0.4023 6.87E-01 sk N- 07A090 1995-2013 80 -0.16805 -0.8598 3.90E-01 sk N- 07C070 1995-2013 76 -0.19703 -1.0671 2.86E-01 sk N-
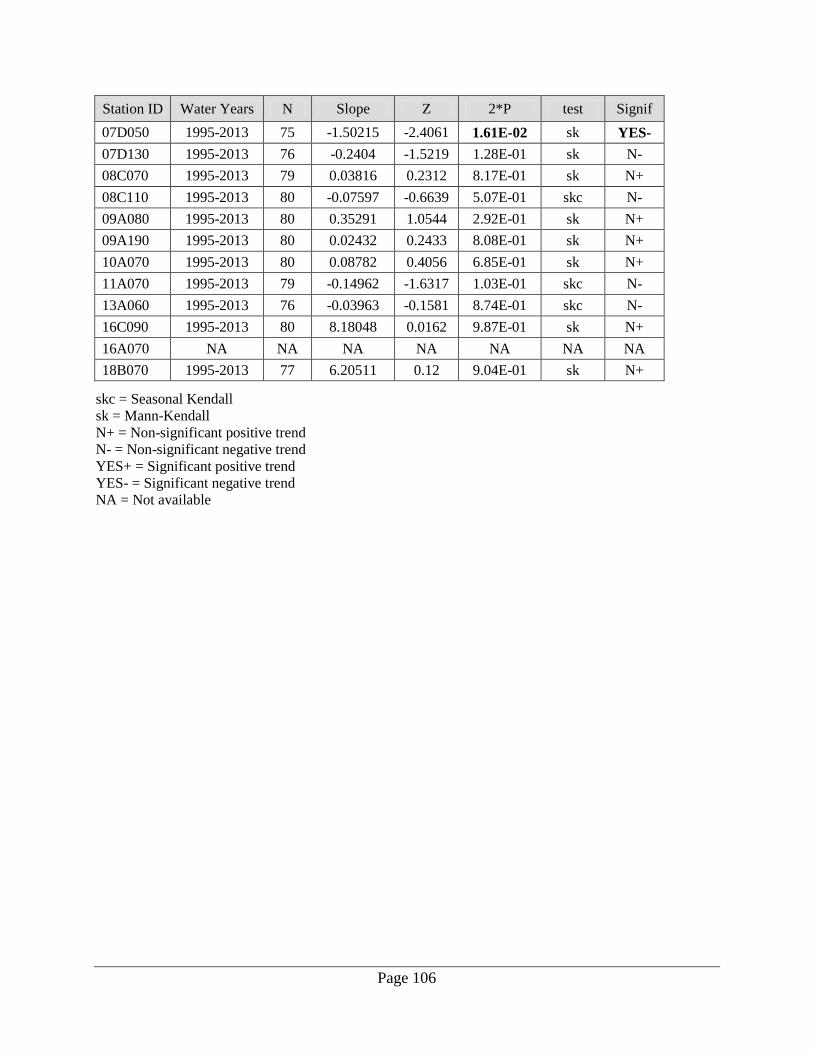
Page 106
Station ID Water Years N Slope Z 2*P test Signif 07D050 1995-2013 75 -1.50215 -2.4061 1.61E-02 sk YES- 07D130 1995-2013 76 -0.2404 -1.5219 1.28E-01 sk N- 08C070 1995-2013 79 0.03816 0.2312 8.17E-01 sk N+ 08C110 1995-2013 80 -0.07597 -0.6639 5.07E-01 skc N- 09A080 1995-2013 80 0.35291 1.0544 2.92E-01 sk N+ 09A190 1995-2013 80 0.02432 0.2433 8.08E-01 sk N+ 10A070 1995-2013 80 0.08782 0.4056 6.85E-01 sk N+ 11A070 1995-2013 79 -0.14962 -1.6317 1.03E-01 skc N- 13A060 1995-2013 76 -0.03963 -0.1581 8.74E-01 skc N- 16C090 1995-2013 80 8.18048 0.0162 9.87E-01 sk N+ 16A070 NA NA NA NA NA NA NA 18B070 1995-2013 77 6.20511 0.12 9.04E-01 sk N+
skc = Seasonal Kendall sk = Mann-Kendall N+ = Non-significant positive trend N- = Non-significant negative trend YES+ = Significant positive trend YES- = Significant negative trend NA = Not available
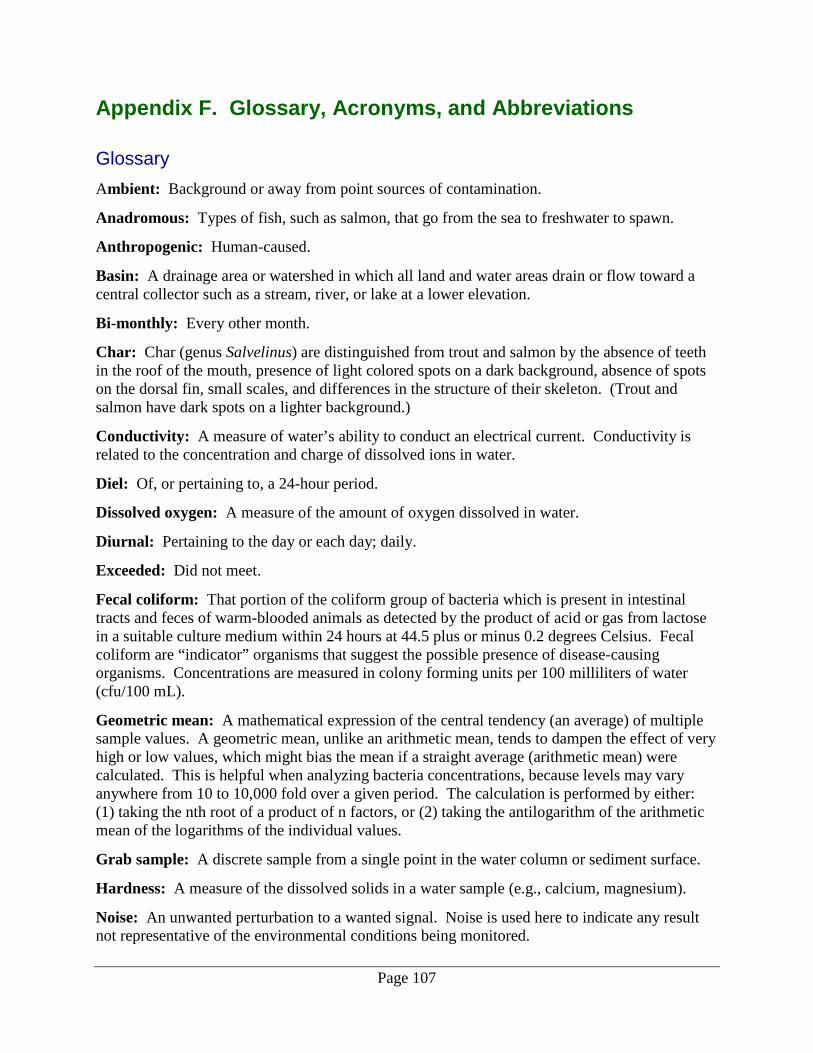
Page 107
Appendix F. Glossary, Acronyms, and Abbreviations Glossary Ambient: Background or away from point sources of contamination.
Anadromous: Types of fish, such as salmon, that go from the sea to freshwater to spawn.
Anthropogenic: Human-caused.
Basin: A drainage area or watershed in which all land and water areas drain or flow toward a central collector such as a stream, river, or lake at a lower elevation.
Bi-monthly: Every other month.
Char: Char (genus Salvelinus) are distinguished from trout and salmon by the absence of teeth in the roof of the mouth, presence of light colored spots on a dark background, absence of spots on the dorsal fin, small scales, and differences in the structure of their skeleton. (Trout and salmon have dark spots on a lighter background.)
Conductivity: A measure of water’s ability to conduct an electrical current. Conductivity is related to the concentration and charge of dissolved ions in water.
Diel: Of, or pertaining to, a 24-hour period.
Dissolved oxygen: A measure of the amount of oxygen dissolved in water.
Diurnal: Pertaining to the day or each day; daily.
Exceeded: Did not meet.
Fecal coliform: That portion of the coliform group of bacteria which is present in intestinal tracts and feces of warm-blooded animals as detected by the product of acid or gas from lactose in a suitable culture medium within 24 hours at 44.5 plus or minus 0.2 degrees Celsius. Fecal coliform are “indicator” organisms that suggest the possible presence of disease-causing organisms. Concentrations are measured in colony forming units per 100 milliliters of water (cfu/100 mL).
Geometric mean: A mathematical expression of the central tendency (an average) of multiple sample values. A geometric mean, unlike an arithmetic mean, tends to dampen the effect of very high or low values, which might bias the mean if a straight average (arithmetic mean) were calculated. This is helpful when analyzing bacteria concentrations, because levels may vary anywhere from 10 to 10,000 fold over a given period. The calculation is performed by either: (1) taking the nth root of a product of n factors, or (2) taking the antilogarithm of the arithmetic mean of the logarithms of the individual values.
Grab sample: A discrete sample from a single point in the water column or sediment surface.
Hardness: A measure of the dissolved solids in a water sample (e.g., calcium, magnesium).
Noise: An unwanted perturbation to a wanted signal. Noise is used here to indicate any result not representative of the environmental conditions being monitored.
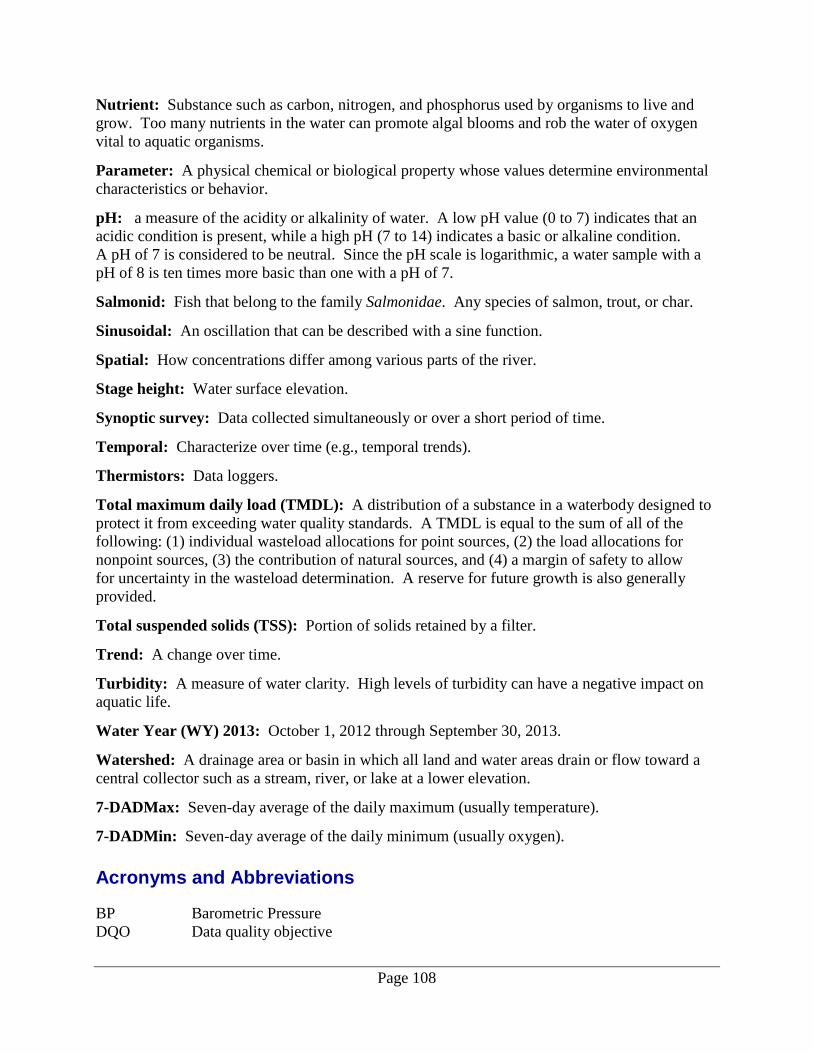
Page 108
Nutrient: Substance such as carbon, nitrogen, and phosphorus used by organisms to live and grow. Too many nutrients in the water can promote algal blooms and rob the water of oxygen vital to aquatic organisms.
Parameter: A physical chemical or biological property whose values determine environmental characteristics or behavior.
pH: a measure of the acidity or alkalinity of water. A low pH value (0 to 7) indicates that an acidic condition is present, while a high pH (7 to 14) indicates a basic or alkaline condition. A pH of 7 is considered to be neutral. Since the pH scale is logarithmic, a water sample with a pH of 8 is ten times more basic than one with a pH of 7.
Salmonid: Fish that belong to the family Salmonidae. Any species of salmon, trout, or char.
Sinusoidal: An oscillation that can be described with a sine function.
Spatial: How concentrations differ among various parts of the river.
Stage height: Water surface elevation.
Synoptic survey: Data collected simultaneously or over a short period of time.
Temporal: Characterize over time (e.g., temporal trends).
Thermistors: Data loggers.
Total maximum daily load (TMDL): A distribution of a substance in a waterbody designed to protect it from exceeding water quality standards. A TMDL is equal to the sum of all of the following: (1) individual wasteload allocations for point sources, (2) the load allocations for nonpoint sources, (3) the contribution of natural sources, and (4) a margin of safety to allow for uncertainty in the wasteload determination. A reserve for future growth is also generally provided.
Total suspended solids (TSS): Portion of solids retained by a filter.
Trend: A change over time.
Turbidity: A measure of water clarity. High levels of turbidity can have a negative impact on aquatic life.
Water Year (WY) 2013: October 1, 2012 through September 30, 2013.
Watershed: A drainage area or basin in which all land and water areas drain or flow toward a central collector such as a stream, river, or lake at a lower elevation.
7-DADMax: Seven-day average of the daily maximum (usually temperature).
7-DADMin: Seven-day average of the daily minimum (usually oxygen).
Acronyms and Abbreviations
BP Barometric Pressure DQO Data quality objective
Page 109
DNR Washington State Department of Natural Resources Ecology Washington State Department of Ecology EF East Fork EIM Environmental Information Management database IMW Intensively Monitored Watersheds EPA U.S. Environmental Protection Agency LDO Luminescent Dissolved Oxygen MEL Manchester Environmental Laboratory MQO Measurement quality objective n number NF North Fork NO2+NO3 Nitrate + nitrite-nitrogen QA Quality assurance QAMP Quality Assurance Management Plan QC Quality control RMS Root mean squared RSD Relative standard deviation SF South Fork SM Standard method Std dev Standard deviation TMDL (See Glossary above) TN Total nitrogen TP Total phosphorus TSS Total suspended solids USGS U.S. Geological Survey WAC Washington Administrative Code WQI Water Quality Index WRIA Water Resource Inventory Area WY Water year Units of Measurement
°C degrees centigrade cfs cubic feet per second cm centimeter kg kilogram mg/L milligrams per liter (parts per million) mL milliliter NTU nephelometric turbidity unit sq. km square kilometer s.u. standard unit ug/L micrograms per liter (parts per billion) uS microsiemens per centimeter, a unit of conductivity