
RISMA Network Metadata 20140311 Real‐time In‐situ Soil Monitoring for Agriculture (RISMA)...
44
AGRICULTURE AND AGRI‐FOOD CANADA’ S REAL‐ TIME I N‐SITU SOIL MONITORING FOR AGRICULTURE (RISMA) NETWORK METADATA December, 2014 Science and Technology Branch Agriculture and Agri‐Food Canada Anna Pacheco 1 , Jessika L’Heureux 1 , Heather McNairn 2 , Jarrett Powers 3 , Allan Howard 1 , Xiaoyuan Geng 2 , Patrick Rollin 4 , Kurt Gottfried 3 , Jacqueline Freeman 5 , Rotimi Ojo 8 , Catherine Champagne 4 , Evan Rodgers 3 , Craig Smith 7 , John Fitzmaurice 5 , Amine Merzouki 2 , Tom Hansen 5 , Branden Wyryha 3 , Mike Chubey 5 , Erle Einarsson 5 , Ben Bondaruk 2 , Dell Bayne 9 , Robert Tillie 1 , Aston Chipanshi 1 , Mike Hammer 6 , Ian Douhaniuk 6 , and Kirk Brossart 6 . Agriculture and Agri‐Food Canada, Science and Technology Branch 1 NAIS, AgroClimate, ACGEO (Regina & Calgary) 2 Eastern Cereal and Oilseed Research Centre (Ottawa) 3 MB Knowledge and Technology Transfer (Winnipeg) 4 Earth Observation, ACGEO (Ottawa) 5 MB Research and Development (Winnipeg) 6 Geotechnical Unit (Regina) 7 Environment Canada 8 University of Manitoba 9 University of Saskatchewan
-
Upload
truongkiet -
Category
Documents
-
view
216 -
download
0
Transcript of RISMA Network Metadata 20140311 Real‐time In‐situ Soil Monitoring for Agriculture (RISMA)...

AGRICULTURE AND AGRI‐FOOD CANADA’S
REAL‐TIME IN‐SITU SOIL MONITORING FOR AGRICULTURE (RISMA) NETWORK METADATA
December, 2014
Science and Technology Branch
Agriculture and Agri‐Food Canada
Anna Pacheco1, Jessika L’Heureux1, Heather McNairn2, Jarrett Powers3, Allan Howard1, Xiaoyuan Geng2, Patrick Rollin4, Kurt Gottfried3, Jacqueline Freeman5, Rotimi Ojo8, Catherine Champagne4, Evan Rodgers3, Craig Smith7, John Fitzmaurice5, Amine Merzouki2, Tom Hansen5, Branden Wyryha3, Mike Chubey5, Erle Einarsson5, Ben Bondaruk2, Dell Bayne9, Robert Tillie1, Aston Chipanshi1, Mike Hammer6, Ian Douhaniuk6, and Kirk Brossart6.
Agriculture and Agri‐Food Canada, Science and Technology Branch
1 NAIS, AgroClimate, ACGEO (Regina & Calgary) 2 Eastern Cereal and Oilseed Research Centre (Ottawa) 3 MB Knowledge and Technology Transfer (Winnipeg) 4 Earth Observation, ACGEO (Ottawa) 5 MB Research and Development (Winnipeg) 6 Geotechnical Unit (Regina) 7 Environment Canada
8 University of Manitoba 9 University of Saskatchewan

Manitoba Real‐time In‐situ Soil Monitoring for Agriculture (RISMA) Network Metadata
Overview: The monitoring stations in the Manitoba network were established in two phases. Nine stations were installed near the towns of Carman and Elm Creek, located southwest of the city of Winnipeg in 2011. Three other stations were installed in the Sturgeon Creek watershed in 2013, located immediately northwest of Winnipeg (Table 1.1 and Figures 1.1 and 1.2). The stations in Carman‐Elm Creek are situated in the La Salle and Boyne River watersheds which are part of the larger Red River basin. The area is characterized by a distinct soil texture divide between heavy clays and clay loams to the east, and lighter sandy and sandy loam soils to the west. Topography is generally flat; influenced by lacustrine deposition. Two stations in the Sturgeon Creek watershed are located near the town of Warren while the third station is located immediately outside Winnipeg near the town of Rosser. The Sturgeon Creek watershed is part of the larger Assiniboine River basin. Topography is mainly flat, consisting of imperfect to poorly drained lacustrine clay and clay loam textured soils. Glacial till loamy soils occur in the more northern area of the watershed where ridges and swales are the more common landform. These areas are part of Canada’s Prairie/Boreal Plain Ecozone and were chosen to capture the diverse soil moisture conditions in the Manitoba portion of the Red River and lower Assiniboine River basins. The stations are located at the edge of annually cropped agricultural fields with the soil moisture sensors installed within the field, about 6‐30m away from the edge. Annual crops that are typically grown in this area include cereals, canola, corn, soybeans and edible beans. The Manitoba stations record precipitation with a tipping bucket rain gauge as well as real dielectric permittivity, soil moisture and soil temperature using hydra probe sensors at surface (0‐5cm), 5cm, 20cm, 50cm and 100cm depths. Three hydra probe sensors, or replicas, are installed at each depth. This replication provides a measurement of spatial variability in soil moisture, and redundancy in the event of sensor malfunction. To complement the existing soils data, the stations in the Manitoba network are also equipped with meteorological sensors such as air temperature, relative humidity, wind speed and wind direction.

Station Location:
Table 1.1. Manitoba RISMA Station Locations. Note that Easting and Northing are provided in UTM Z14 WGS84.
Manitoba
RISMA STATION ID Legal Land Description* Easting Northing Latitude Longitude
MB1 SW 13‐07‐05 W1 570924 5490434 49.56234 ‐98.01924 MB2 SW 22‐06‐04 W1 577265 5482737 49.49250 ‐97.93374 MB3 SW 33‐06‐04 W1 575556 5485725 49.51951 ‐97.95649 MB4 SE 07‐08‐04 W1 573041 5498688 49.63609 ‐97.98813 MB5 SW 04‐08‐04 W1 575222 5497102 49.62145 ‐97.95781 MB6 NW 21‐08‐04 W1 575084 5503458 49.67877 ‐97.95957 MB7 SE 24‐08‐05 W1 571640 5501962 49.66552 ‐98.00762 MB8 NW 17‐09‐04 W1 573335 5511606 49.75253 ‐97.98237 MB9 NW 25‐08‐05 W1 570393 5505108 49.69462 ‐98.02397
MB10 NE 35‐11‐01 E1 618431 5537198 49.97536 ‐97.34829 MB11 SW 20‐13‐01 W1 602004 5551981 50.11131 ‐97.57337 MB12 NE 13‐14‐2 W1 600078 5560695 50.18998 ‐97.59801
* SEC‐TWP‐RGE

Figure 1.1. Map of the Manitoba RISMA stations in the Carman area. Note that Easting and Northing are provided in UTM Z14 WGS84.

Figure 1.2. Map of the Manitoba RISMA stations in the Sturgeon Creek Watershed. Note that Easting and Northing are provided in UTM Z14 WGS84.

Instrumentation:
• 2011‐2013: Data transmitted using ADCON Radio transmitter Units (RTU) on Rogers cellular (GSM/GPRS) network to a central gateway.
• Data logger: Campbell Sci CR1000‐XT installed April‐June 2013. • Power source: 50W solar panels and two 100 AmpH batteries. • Modem: Raven X on Rogers 3G or LTE Network (HSPA). • Soil moisture sensor: Steven’s hydra probe II (SDI‐12). Installed with three replicas at each depth: 0‐5cm
(vertical), 5cm (horizontal), 20cm (horizontal), 50cm (horizontal) and 100 cm (horizontal). • Rain gauge: Tipping bucket rain gauge (CS700) installed at 2.5m to avoid interference from crop. • Wind speed/ direction: RM Young installed in 2013 at 3m. • Air temperature and Relative humidity: Campbell Sci HC2‐S3 or HC‐S3 installed in 2013 inside a 10 plate
RM Young radiation shield at 1.5m on the north side of shelter where possible. Installation Procedure:
The Carman‐Elm Creek stations were installed in the fall of 2011 and the Sturgeon Creek Stations were installed in the fall of 2013. Detailed descriptions of the Carman‐Elm Creek installation procedure, site selection process and the soil profiles are provided by Walker (2012). Information for the Sturgeon Creek stations is provided by Eilers (2013). The meteorological sensors, data logger, solar panel and battery were installed at the edge of the field. The soil moisture sensors were installed in a soil pit, located in the field, approximately 6‐30m away from the station depending on the farming practices of the landowner (see Figure 1.3 and 1.4). A trench between the soil pit and the station was also dug so that the cables connecting the soil moisture sensors to the data logger could be buried and protected. Care was taken to leave an “undisturbed” pit wall where the sensors were installed. The soil that was removed from the pit was placed on a tarp so that it could be used to backfill the pit with minimal mixing of the soil layers. The sensor locations were selected and flagged. Three sensors, or replicas, were installed at each depth: 0‐5cm (vertical), 5cm (horizontal), 20cm (horizontal), 50cm (horizontal) and 100 cm (horizontal). The three replicas were installed to form three columns of sensors according to Figure 1.5. Within the columns, the sensors are located somewhat offset from each other to avoid disturbing the flow to the sensors below.
To install the soil moisture sensors, a soil coring device (1.5 inch diameter x 6 inch long) was first used to extract an undisturbed soil sample from the pit wall at each flagged sensor location. These soil cores were used to do site specific lab calibration (dry down of undisturbed sample) and a soil texture analysis for each sensor location. The sensors were then inserted into the back wall of the cavity that was left after extracting the soil core (see Figure 1.6). After installing the sensors, the soil core cavity was backfilled with soil and a mix of soil and bentonite to prevent preferential flow towards the sensor. Once all the sensors were installed, the soil pit and the trench were carefully backfilled.
Agriculture and Agri‐Food Canada carefully seeds and cuts the crop surrounding the sensors to avoid damage to the soil moisture equipment and to better emulate field conditions. Due to poor performance of the sensors at site MB5, a complete re‐installation of the sensors was completed on October 15, 2014 by AAFC employees and has been thoroughly documented (Powers, 2014).

Figure 1.3. Schematic illustration of the Manitoba RISMA station layout (cross‐section view, note: not to scale)
Figure 1.4. a) Manitoba Station #5 (MB5) illustrating the air temperature / RH sensor, the tipping bucket rain gauge, the wind sensor and the solar panel. The data logger and the batteries are housed inside the small shelter. b) Manitoba Station #4 (MB4) illustrating the location of the hydra probe sensors in the field relative to the station at the edge of the field. Note that this station has one of the longest distances between the sensors and the station (approximately 30 m).

Stevens Hydra Probes Surface - vertical Depth - horizontal
5 cm
20 cm
50 cm
100 cm
Column #1 Column #2 Column #3
Figure 1.5. A Schematic illustration on how the Steven’s hydra probe sensors are installed in the wall of the soil pit at the Manitoba RISMA stations. The three replicas at each depth are spaced approximately 20‐30cm apart.
Figure 1.6. Photos illustrating the installation of the hydra probe sensors into the pit wall. A soil corer (1.5 inches diameter and 6 inches long, 3.81cm diameter and 15.24cm long) was hammered in horizontally to extract a soil sample (left photo), the back wall of the cavity (left after removing the soil core sample) was scraped clean and smooth (centre photo), and the soil moisture sensor was inserted horizontally into the back wall of the cavity with the use of a PVC tube for leverage (right photo). The soil core cavity was backfilled with soil and a mix of soil and bentonite to prevent preferential flow towards the sensor within the cavity. The undisturbed soil sample was used to conduct sensor calibrations and to determine soil characteristics at each sensor location.

Soil Texture: Table 1.2. Soil textures for Manitoba RISMA Stations based on the soil core extracted during installation.
SITE DEPTH (m) DENSITY (g/cm3) SAND (%) SILT (%) CLAY (%) CLASSIFICATION
MB1 0.05 1.2
78.8 10.1 11.1 Sandy Loam MB1 0.20 1.5
80.2 8.3 11.5 Sandy Loam
MB1 0.50 1.5
81.5 8.2 10.3 Loamy Sand MB1 1.00 1.5
81.0 6.8 12.2 Sandy Loam
MB2 0.05 1.3
44.9 20.8 34.3 Clay Loam MB2 0.20 1.6
62.6 12.9 24.5 Sandy Clay Loam
MB2 0.50 1.6
65.8 13.2 21.0 Sandy Clay Loam MB2 0.95 1.5
75.3 15.0 9.7 Sandy Loam
MB3 0.05 1.4
47.1 21.1 31.8 Sandy Clay Loam MB3 0.20 1.5
45.8 21.3 32.9 Sandy Clay Loam
MB3 0.50 1.4
31.3 23.7 45.0 Clay MB3 1.00 1.4
69.9 17.7 12.4 Sandy Loam
MB4 0.05 1.3
90.4 0.2 9.4 Sand MB4 0.20 1.5
88.7 1.6 9.7 Loamy Sand
MB4 0.50 1.6
88.7 1.6 9.7 Loamy Sand MB4 1.00 1.5
85.6 5.0 9.4 Loamy Sand
MB5 0.05 1.4
41.4 18.1 40.5 Clay MB5 0.20 1.4
22.7 19.5 57.8 Clay
MB5 0.50 1.3
4.3 27.2 68.5 Heavy Clay MB5 1.00 1.3
3.0 27.7 69.3 Heavy Clay
MB6 0.05 1.2
3.7 24.6 71.7 Heavy Clay MB6 0.20 1.3
3.8 21.3 74.9 Heavy Clay
MB6 0.50 1.3
2.0 25.9 72.1 Heavy Clay MB6 1.00 1.3
0.5 27.3 72.2 Heavy Clay
MB7 0.05 1.4
78.3 9.2 12.5 Sandy Loam MB7 0.20 1.5
82.3 5.8 11.9 Loamy Sand
MB7 0.50 1.5
78.1 8.6 13.3 Sandy Loam MB7 1.00 1.5
80.3 8.0 11.7 Sandy Loam
MB8 0.05 1.2
3.6 33.2 63.2 Heavy Clay MB8 0.20 1.3
3.5 22.6 73.9 Heavy Clay
MB8 0.50 1.3
3.9 23.3 72.8 Heavy Clay MB8 1.00 1.5
1.5 27.6 70.9 Heavy Clay
MB9 0.05 1.5
81.3 6.0 12.7 Sandy Loam MB9 0.20 1.6
85.5 3.2 11.3 Loamy Sand
MB9 0.50 1.5
83.4 5.1 11.5 Loamy Sand MB9 1.00 1.5
87.5 6.7 5.8 Loamy Sand
MB10 0.05 1.0
4.55 24.0 71.6 Heavy Clay MB10 0.20 1.2
2.4 13.5 84.1 Heavy Clay
MB10 0.50 1.2
6.7 22.9 70.4 Heavy Clay MB10 1.00 1.3
13.6 44.6 41.8 Silty Clay

SITE DEPTH (m) DENSITY (g/cm3) SAND (%) SILT (%) CLAY (%) CLASSIFICATION
MB11 0.05 1.3 23.8 39.5 36.8 Clay Loam MB11 0.20 1.5
25.4 38.8 35.8 Clay Loam
MB11 0.50 1.6
24.0 46.6 29.3 Clay Loam MB11 1.00 1.7
64.9 29.4 5.8 Sandy Loam
MB12 0.05 1.3
42.1 41.7 16.2 Loam MB12 0.20 1.5
36.5 38.7 24.8 Loam
MB12 0.50 1.6
27.9 45.0 27.1 Loam MB12 1.00 1.5
24.9 46.2 28.9 Clay Loam
Soil Moisture Calibration Equations: The soil moisture calibration equations are based on a regional in‐situ calibration developed by Ojo (2014). The regional calibration equations were applied to the regionally consistent sandy and loam soils, while the site specific lab equations were applied to the more variable clay soils.
Table 1.3. The soil moisture calibration equations for the Manitoba RISMA stations used for version 1 and 2 of data. The soil moisture calibration equations output soil moisture as m3/m3 and are based on regional field calibration developed by Ojo (2014). RDC is the non‐temperature corrected Read Dielectric Permittivity.
Station Depth (m) Equation (x=√RDC) Station Depth (m) Equation (x=√RDC)
MB1 0‐0.05 0.1059x – 0.1582 MB7 0‐0.05 0.0978x – 0.12 MB1 0.05 0.1059x – 0.1582 MB7 0.05 0.0978x – 0.12 MB1 0.2 0.1059x – 0.1582 MB7 0.2 0.0978x – 0.12 MB1 0.5 0.1059x – 0.1582 MB7 0.5 0.0978x – 0.12 MB1 1 0.1059x – 0.1582 MB7 1 0.0978x – 0.12
MB2 0‐0.05 0.0748x – 0.0299 MB8 0‐0.05 0.0592x + 0.0635 MB2 0.05 0.0748x – 0.0299 MB8 0.05 0.0592x + 0.0635 MB2 0.2 0.0748x – 0.0299 MB8 0.2 0.059x + 0.067 MB2 0.5 0.084x – 0.0773 MB8 0.5 0.059x + 0.067 MB2 1 0.07642x – 0.05692 MB8 1 0.059x + 0.067
MB3 0‐0.05 0.0786x – 0.0766 MB9 0‐0.05 0.0869x – 0.1159 MB3 0.05 0.0786x – 0.0766 MB9 0.05 0.0869x – 0.1159 MB3 0.2 0.0753x – 0.0551 MB9 0.2 0.1034x – 0.1603 MB3 0.5 0.0776x – 0.066 MB9 0.5 0.1087x – 0.1548 MB3 1 0.07642x – 0.05692 MB9 1 0.1087x – 0.1548
MB4 0‐0.05 0.1169x – 0.1831 MB10 0‐0.05 0.0672x + 0.0807 MB4 0.05 0.1169x – 0.1831 MB10 0.05 0.0672x + 0.0807 MB4 0.2 0.1169x – 0.1831 MB10 0.2 0.0662x + 0.0865 MB4 0.5 0.1169x – 0.1831 MB10 0.5 0.0662x + 0.0865 MB4 1 0.1169x – 0.1831 MB10 1 0.0662x + 0.0865

Station Depth (m) Equation (x=√RDC) Station Depth (m) Equation (x=√RDC)
MB5 0‐0.05 0.0759x – 0.0649 MB11 0‐0.05 0.059x + 0.0866 MB5 0.05 0.0759x – 0.0649 MB11 0.05 0.059x + 0.0866 MB5 0.2 0.0672x – 0.0294 MB11 0.2 0.059x + 0.0866 MB5 0.5 0.0672x – 0.0294 MB11 0.5 0.059x + 0.0866 MB5 1 0.0672x – 0.0294 MB11 1 0.1084x – 0.1633
MB6 0‐0.05 0.0804x – 0.0605 MB12 0‐0.05 0.0653x + 0.0521 MB6 0.05 0.0804x – 0.0605 MB12 0.05 0.0653x + 0.0521 MB6 0.2 0.0734x – 0.0111 MB12 0.2 0.0577x + 0.0968 MB6 0.5 0.0734x – 0.0111 MB12 0.5 0.0584x + 0.0864 MB6 1 0.0734x – 0.0111 MB12 1 0.0616x + 0.0730
Data: Data is logged every 15 minutes and the data is updated on the AAFC internal server, SOS cloud server and the web portal once per hour.
Data format changed in 2013 with the installation of the additional sensors and the new data loggers. Data recorded prior to 2013 can be requested directly from Agriculture and Agri‐Food Canada. Data recorded after June 2013 is provided at the following data portal: http://aafc.fieldvision.ca/. Current conditions, 15‐minute data series and daily data summaries can be visualized and downloaded through the portal.
The headers for the soil moisture sensors are constructed according to:
Depth of measurement in cm, replica or column number, parameter
• #1 sensors were installed in column #1 • #2 sensors were installed in column #2, which is the middle column (always located between column 1
and 3) • #3 sensors were installed in column #3
15-Minute Data: The following are examples of 15‐minute data headers for station MB1.
• Reading Time (CST): Date and time reported in local time (CST), 24‐hour clock. • Ambient Air RHAvg (%): Average relative humidity in the past 15 minutes measured at 1.5m height, in % • Ambient Air Temp (°C): Average air temperature in the past 15 minutes measured at 1.5m height, in °C • Precipitation Precip (mm): Total amount of rain in the past 15 minutes measured at 2.5m height, in mm • Wind WindDir: Average wind direction in the past 15 minutes measured at 3m height, in cardinal direction • Wind WindSpeed (km/h): Average wind speed in the past 15 minutes measured at 3m height, in km/h • Wind WindSpeedMax (km/h): Maximum wind speed in the past 15 minutes measured at 2m height, m/s • Wind WindSpeedMin (km/h): Minimum wind speed in the past 15 minutes measured at 2m height, m/s • 0 to 5 cm Depth Sensor 1 Temp (°C): Soil temperature (hydra probe parameter F) measured at 0‐5 cm
(vertical surface sensor) in column #1 in the past 15 minutes, in °C

• 0 to 5 cm Depth Sensor 1 WFV (%): Calibrated soil moisture as calculated based on the recorded RDC at 0‐5cm (vertical surface sensor) in column #1 in the past 15 minutes, in m3/m3
The data from the remaining Stevens hydra probe sensors follow the exact pattern as the example provided above. The soil moisture measured by a 20cm sensor in column #3, would have the following header: 20 cm Depth Sensor 3 WFV (%).
Note, the station ID in the header may be provided as MB_1 or MB1 depending on where the data is downloaded. The data from the remaining Stevens hydra probe sensors follow the exact pattern as the 0to5cm_1 example provided above. The soil moisture measured by a horizontal 5cm sensor in column #2, would have the following header: MB_1_Hydra_5cm_WFV_2. The data files for all stations are structured exactly the same and the headers are the same with the exception of Station ID.
Daily Data: The daily data values provided at the data portal (http://aafc.fieldvision.ca/) are calculated from midnight Local Standard Time (CST for MB stations).
The following is an example of the daily data headers for MB stations:
• Reading Time (CST): Date • Ambient Air RHAvg (%): Average daily relative humidity measured at 1.5m height, in % • Ambient Air Temp (°C): Average daily air temperature measured at 1.5m height (calculated based on the
15 min data, ie not based on min and max air temperature), in °C • Ambient Air TempMax (°C): Minimum daily air temperature measured at 1.5m height, in °C • Ambient Air TempMin (°C): Maximum daily air temperature measured at 1.5m height, in °C • Precipitation Precip (mm): Total daily rain amount measured at 1.5m height, in mm • Wind WindDir: Average daily wind direction measured at 3m height, in cardinal direction • Wind WindSpeed (km/h): Average daily wind speed measured at 2m height, in km/h • Wind WindSpeedMax (km/h): Maximum daily wind speed measured at 2m height, in km/h • Wind WindSpeedMin (km/h): Minimum daily wind speed measured at 2m height, in km/h • 0 to 5 cm Depth Average Temp (°C): Average daily soil temperature (hydra probe parameter F) at 0‐5 cm
(vertical surface sensor) in column #1, in °C • 0 to 5 cm Depth Average WFV (%): Average daily calibrated soil moisture at 0‐5cm (vertical surface sensor)
in column #1, in %
The data from the remaining Stevens hydra probe sensors follow the exact pattern as the example provided above. The daily average soil moisture measured at 20‐cm depth would have the following header: 20 cm Depth Average Temp (°C).

Data Flags:
The hydra probe data has gone through a basic, automated quality control (QC) procedure where data not meeting the quality standards has either been removed or flagged.
Missing data and data removed by QC process is reported as “NoData” in the data columns and as NA in the flag columns.
The data flags have been modified over time and are considered cumulative after V2.20140214.
V1.20130617: Applied June 27, 2013.
These data flags apply to data downloaded between June 17, 2013, and the application of the next data version.
Original QC Flags “Flag1,Flag2,Flag3,Flag4,Flag5 ” The flags will be OK, NA or an error message. Here are the possible outputs for each Flag: Flag 1 Output: “OK” / “Out of WFV range” / “NA” Flag 2 Output: “OK” / “Frozen soil” / “NA” Flag 3 Output: “OK” / “Out of average range” / “NA” Flag 4 Output: “OK” / “Readings below zero” / “NA” Flag 5 Output: “OK” / “DLT > 2” / “NA”
Flag 1 “Out of WFV range”: activated if Soil Moisture (m3/m3) is less than 0 or greater than 0.60
Flag 2 “Frozen soil”: activated if the soil temperature is below zero degrees Celsius and indicates that the soil moisture readings should not be used.
Flag 3 “Out of WFV average range”: activated if Soil Moisture value (m3/m3) is more than 10% different from the average, ie if there are sudden changes in soil moisture (these could be due to rain events or data noise; the flag is there to assist in interpretation along with rain gauge data).
Flag 4 “Readings below zero”: activated if Real Dielectric Permittivity (RDC) or Temperature Corrected Soil Conductivity (CON) is negative.
Flag 5 “DLT > 2”: activated if the Dielectric Loss Tangent (DLT = Imaginary Dielectric Permittivity / Real Dielectric Permittivity) is greater than 2.

V2.20140214: Applied February 14, 2014. Updates: The automated QC protocol has been adjusted and the soil moisture flags have been modified.
These updates apply to all RISMA data (June 2013 to current) downloaded between November 28, 2014, and the application date of the next data version.
Meteorological data: The known bad data between June 2013 and November 2013 has been removed. Also new to this version is that the precipitation data will be removed and reported as “NoData” when the air temperature is below freezing point.
Soil Moisture QC Flags: “Flag1,Flag2,Flag3,Flag4,Flag5,Flag6” The flags will be OK, NA or an error message. Here are the possible outputs for each Flag: Flag 1 Output: “OK” / “Out of WFV range” / “NA” Flag 2 Output: “OK” / “Out of WFV average range” / “NA” Flag 3 Output: “OK” / “Frozen soil” / warning: “STC averaged using depth 1 & 2” / “NA” Flag 4 Output: “OK” / “Out of RDC range” / “NA” Flag 5 Output: “OK” / “DLT >= 1.5” / “NA” Flag 6 Output: “OK” / “CON >= 0.2” / “NA”
Flag 1 “Out of WFV range”: activated if the Soil Moisture (m3/m3) is less than 0.02 or greater than 0.60
Flag 2 “Out of WFV average range”: activated if Soil Moisture value (m3/m3) is more than 10% different from the average, ie if there are sudden changes in soil moisture (these could be due to rain events or data noise; the flag is there to assist in interpretation along with rain gauge data).
Flag 3 “Frozen soil”: activated if the soil temperature is below zero degrees Celsius and indicates that the soil moisture readings should not be used.
Flag 3 “STC averaged using depth 1 & 2”: activated when hydra probe sensor #3 does not measure soil temperature. The average soil temperature from sensor #1 and 2 is used instead. Occurs at some ON stations.
Flag 4 “Out of RDC range”: activated when Real Dielectric Permittivity (RDC) is less than 2.4.
Flag 5 “DLT >= 1.5”: activated when the Dielectric Loss Tangent (DLT = Imaginary Dielectric Permittivity / Real Dielectric Permittivity) is equal to or larger than 1.5.
Flag 6 “CON >= 0.2”: activated when temperature corrected soil conductivity (CON) is equal to or larger than 0.2 S/m.
The hydra probe data is removed if real dielectric permittivity (RDC), conductivity (Con) or dielectric loss tangent is negative as it indicates a malfunctioning sensor.

V3.20141128: Applied November 28, 2014. Updates: New calibration equations have been implemented and the Sturgeon Creek stations (MB10, 11 and 12) have been added to the QC automated protocol. The soil moisture flags have not been modified from V2.20140214.
These updates apply to all RISMA data (June 2013 to current) downloaded between November 28, 2014, and the application date of the next data version.
New calibration equations have been implemented on the data and all Manitoba RISMA data have been re‐processed using these equations. The new equations were derived from a site‐specific calibration methodology developed by Ojo (2014). The data flags have not been modified since the last version and are applied on the data as per previous versions.
Meteorological data: Please note that precipitation data will be removed and reported as “NoData” when the air temperature is below freezing point. Non‐responsive hydra probe sensors: hydra probe sensors that have been non‐responsive at 20‐cm depths and below will not be replaced with new sensors and thus are now being reported as “NoSensor”. The following sensors are deemed non‐responsive: MB1‐50cm‐S1; MB1‐100cm‐S3; MB2‐20cm‐S2; MB2‐50cm‐S2; MB2‐100cm‐S2; MB3‐20cm‐S1; MB4‐20cm‐S1; MB4‐50cm‐S3; MB4‐100cm‐S1; MB6‐100cm‐S3; MB7‐100cm‐S2; MB9‐100cm‐S1.

References: Eilers, R.G. (2013). Sturgeon Creek Soil Moisture Monitoring Stations (SMMS) Soil and Lanscape Classification. Agriculture and Agri‐Food Canada, Science and Technology Branch. Winnipeg, MB. 30pp.
Ojo, R. (2012). Multi‐depth Hydra Probe Calibration. SMAPVEX12: SMAP Validation Experiment 2012. University of Manitoba, 7pp. Ojo, R., L’Heureux, J., Bullock, P. R., Powers, J., McNairn, H. and A. Pacheco (2014). Calibration and Evaluation of an FDR Sensor for the Real‐time In Situ Monitoring for Agriculture Network in Manitoba (Submitted).
Powers, J. (2014). Re‐Installation of Hydra‐Probes at RISMA Station MB 5, Agriculture and Agri‐Food Canada, Winnipeg, MB, 6pp.
Walker, B.D. (2012). Agri‐Environmental Monitoring – Manitoba: Methodology and landscape descriptions. Agriculture and Agri‐Food Canada, Agri‐Environmental Services Branch. Winnipeg, MB and Ottawa, ON. 29 pp.

Saskatchewan Real‐time In‐situ Soil Monitoring for Agriculture (RISMA) Network Metadata
Overview: The Saskatchewan monitoring stations were established west of Kenaston, or about 100 km south of Saskatoon, which is part of Canada’s Prairie/Boreal Plain Ecozone (Table 2.1 and Figure 2.1). The network of stations was installed in 2011 by AAFC to supplement an existing network established by Environment Canada (EC) and the University of Guelph (see Figure 2.1). The EC‐Guelph network supports a variety of hydrological, land surface modelling and satellite data validation research. The AAFC sites were installed on four pasture sites to supplement the existing sites that are installed primarily on annual cropland. Cereals, canola and peas are typically grown in this area. The Saskatchewan stations record precipitation, air temperature, wind direction and wind speed at 1.4‐2m height as well as the real dielectric permittivity, soil moisture and soil temperature using hydra probe sensors at surface (0‐5cm), 5cm, 20cm, 50cm, 100cm and 150 cm depths. Three hydra probe sensors, or replicas, record data at all depths except for 100cm and 150cm where only two sensors were installed.
Station Location:
Table 2.1. Saskatchewan RISMA Station Locations. Note that Easting and Northing are provided in UTM Z13 WGS84.
Saskatchewan
RISMA STATION ID Legal Land Description* Easting Northing Latitude Longitude
SK1 SW 30‐27‐04 W3 390984 5688224 51.33484 ‐106.56494 SK2 SW 30‐27‐04 W3 391057 5688245 51.335042 ‐106.563899 SK3 NW 11‐28‐04 W3 397761 5693570 51.384154 ‐106.469228 SK4 NW 07‐28‐03 W3 401471 5693217 51.381637 ‐106.415833
* SEC‐TWP‐RGE

Figure 2.1. Map of Saskatchewan RISMA stations.
Instrumentation:
• 2011‐2013: Data logged using Campbell Sci CR800 data logger. • Data logger: Campbell Sci CR1000 installed in 2013. • Power source: 40W solar panels and 100 AmpH batteries. • Modem: Bluetree 6800 modems on Bell 3G or LTE Network (HSPA). • Soil moisture sensor: Steven’s hydra probe II (SDI‐12). Installed with three replicas at each depth:
0‐5cm (vertical), 5cm (horizontal), 20cm (horizontal) and 50cm (horizontal). Two replicas were installed at 100 cm (horizontal) and 150cm (horizontal).
• Rain gauge: Tipping bucket rain gauge (CS700) installed in 2011‐13 at 1.5m. • Wind speed/ direction: RM Young installed in 2012‐13 at 2m. • Air temperature and Relative humidity: Campbell Sci HC2‐S3 or HC‐S3 installed in 2012‐13
inside a 10 plate RM Young radiation shield at 1.5m on the north side of fence post where possible.

Installation Procedure:
The stations were installed in the summer of 2011 and detailed descriptions of the Installation procedure and the soil profiles are provided by L’Heureux (2011). The four Saskatchewan RISMA stations were installed in pastures, which means that the stations could be installed anywhere on the field without risk of being hit by agricultural machinery as long as they are fenced to prevent cattle from interfering with the sensors. An overview of the station layout is shown in Figure 2.2. The soil moisture sensors were installed in a soil pit that was excavated with a back hoe. Care was taken to leave an “undisturbed” pit wall where the sensors were installed. The soil that was removed from the pit was placed on a tarp so that it could be used to backfill the pit with minimal mixing of the soil layers. The sensor locations were selected and flagged. Three sensors, or replicas, were installed at each depth: 0‐5cm (vertical), 5cm (horizontal), 20cm (horizontal), 50cm (horizontal) and 100 cm (horizontal). The three replicas were installed to form three columns of sensors according to Figure 2.3. Within the columns, the sensors are located somewhat offset from each other to avoid disturbing the flow to the sensors below.
To install the soil moisture sensors, a soil coring device (2 inch diameter x 3 inch long) was first used to extract an undisturbed soil sample from the pit wall at each flagged sensor location. These soil cores were used to do site specific lab calibration (dry down of undisturbed sample) and a soil texture analysis for each sensor location. The sensors were then inserted into the back wall of the cavity that was left after extracting the soil core (see Figure 2.4). After installing the sensors, the soil core cavity was backfilled with soil and a mix of soil and bentonite to prevent preferential flow towards the sensor. Once all the sensors were installed, the soil pit and the trench were carefully backfilled.
A photograph of the final Saskatchewan RISMA station set‐up is shown in Figure2. 5.
Figure 2.2. An illustration of the Saskatchewan RISMA station layout as seen from above.

Figure 2.3. A Schematic illustration on how the Steven’s hydra probe sensors are installed at the Saskatchewan RISMA stations. The three replicas at each depth are spaced approximately 1 m apart.
Figure 2.4. Photos illustrating the installation of the hydra probe sensors into the pit wall. A soil corer (2 inches diameter and 3 inches long, 5.08cm diameter and 7.62cm long) was hammered horizontally into the pit wall to extract an undisturbed soil sample (left photo), the back wall of the cavity (left after removing the soil core sample) was scraped clean and smooth (centre photo), and the soil moisture sensor was inserted horizontally into the back wall of the cavity with the use of a PVC tube for leverage (right photo). The cavity was backfilled with soil and a mix of soil and bentonite to prevent preferential flow towards the sensor. The undisturbed soil sample was used to conduct sensor calibrations and to determine soil characteristics at each sensor location.

Figure 2.5. Saskatchewan RISMA Station #3 (SK3) illustrating the air temperature / RH sensor, wind sensor, tipping bucket rain gauge, the solar panel and the enclosure containing the data logger. Two of the three vertical surface soil moisture sensors can also be seen in the background. The fence is to prevent cattle from entering the site. (Photo is taken looking southwest).

Soil Texture: Table 2.2. Soil textures for Saskatchewan RISMA Stations based on the soil core extracted during installation. Note that depth 0‐0.05m indicates the vertically installed surface sensors.
SITE DEPTH (m) DENSITY (g/cm3) SAND (%) SILT (%) CLAY (%) CLASSIFICATION
SK1 0‐0.05 1.01 14.5 56.3 29.2 Silty Clay Loam SK1 0.05 1.07 14.8 56.3 28.9 Silty Clay Loam SK1 0.20 1.52 23 49.9 27.1 Loam SK1 0.50 1.59 11.7 53.2 35.1 Silty Clay Loam SK1 1.00 1.81 38.8 31.5 29.7 Clay Loam SK1 1.50 1.81 24 47.3 28.7 Clay Loam SK2 0‐0.05 1.10 20.2 55.4 24.4 Silt Loam SK2 0.05 1.34 24.3 49.6 26.1 Loam SK2 0.20 1.58 21.5 48.6 29.9 Clay Loam SK2 0.50 1.69 52.5 26.8 20.7 Sandy Clay Loam SK2 1.00 1.87 35.1 25.8 39.1 Clay Loam SK2 1.50 1.88 36.2 31 32.8 Clay Loam SK3 0‐0.05 1.31 35.6 36.8 27.6 Loam SK3 0.05 1.61 45.1 30.7 24.2 Loam SK3 0.20 1.63 49.5 26.1 24.4 Sandy Clay Loam SK3 0.50 1.73 41.4 25.2 33.4 Clay Loam SK3 1.00 1.86 40.9 31.9 27.2 Loam SK3 1.50 2.00 37.1 29.4 33.5 Clay Loam SK4 0‐0.05 1.25 24.3 44.9 30.8 Clay Loam SK4 0.05 1.57 29.1 37.6 33.3 Clay Loam SK4 0.20 1.52 26.5 40.7 32.8 Clay Loam SK4 0.50 1.59 28.7 38 33.3 Clay Loam SK4 1.00 1.57 30.4 36.6 33 Clay Loam SK4 1.50 1.62 33.5 34.6 31.9 Clay Loam

Soil Moisture Calibration Equations: The soil moisture calibration equations are based on a lab calibration on site specific soil cores.
Table 2.3. The soil moisture calibration equations for the Saskatchewan RISMA stations. The soil moisture calibration equations output soil moisture as m3/m3. RDC is the non‐temperature corrected Read Dielectric Permittivity.
Station Depth (m) Equation (x=RDC)
SK1 0‐0.05 (0.00663x2 + 1.14948x + 3.525889) / 100
SK1 0.05 (0.000127x2 + 1.43425x + 1.334277) / 100
SK1 0.20 (0.02280x2 + 0.57818x + 2.92099) / 100
SK1 0.50 (0.02021x2 + 0.26598x + 4.32800) / 100
SK1 1.00 (0.02168x2 + 0.62133x + 0.35983) / 100
SK1 1.50 (0.00873x2 + 0.94502x ‐ 1.65041) / 100
SK2 0‐0.05 (0.0107x2 + 0.9161x + 4.062) / 100
SK2 0.05 (0.0152x2 + 0.8583x + 2.4355) / 100
SK2 0.20 (0.0228x2 + 0.479x + 3.3194) / 100
SK2 0.50 (0.0439x2 + 0.2804x + 2.0212) / 100
SK2 1.00 (0.0466x2 ‐ 0.4425x + 8.6272) / 100
SK2 1.50 (‐0.0038x2 + 1.3114x ‐ 3.618) / 100
SK3 0‐0.05 (0.01666x2 + 0.73262x + 2.38252) / 100
SK3 0.05 (0.01089x2 + 1.05061x ‐ 0.70396) / 100
SK3 0.20 (0.01827x2 + 0.72865x + 0.76218) / 100
SK3 0.50 (‐0.00794x2 + 1.053396x ‐ 2.48302) / 100
SK3 1.00 (‐0.00267x2 + 0.54936x + 2.19025) / 100
SK3 1.50 (‐0.00602x2 + 1.06546x ‐ 4.60197) / 100
SK4 0‐0.05 (0.0217x2 + 0.4287x + 4.4967) / 100
SK4 0.05 (0.0263x2 + 0.1246x + 4.8707) / 100
SK4 0.20 (0.0258x2 + 0.1622x + 4.0373) / 100
SK4 0.50 (0.0171x2 + 0.6727x + 0.2673) / 100
SK4 1.00 (0.0016x2 + 0.556x + 1.5024) / 100
SK4 1.50 (‐0.0056x2 + 1.0049x ‐ 2.0664) / 100

Data: Data is logged every 15 minutes and the data is updated on the AAFC internal server, SOS cloud server and the web portal once per hour.
Data format changed in 2013 with the installation of the additional sensors and the new data loggers. Data recorded prior to 2013 can be requested directly from Agriculture and Agri‐Food Canada. Data recorded after June 2013 is provided at the following data portal: http://aafc.fieldvision.ca/. Current conditions, 15‐minute data series and daily data summaries can be visualized and downloaded through the portal.
The headers for the soil moisture sensors are constructed according to:
Depth of measurement in cm, replica or column number, parameter
• #1 sensors were installed in column #1 • #2 sensors were installed in column #2, which is the middle column (always located between column 1 and
3) • #3 sensors were installed in column #3
15-Minute Data: The following are examples of 15‐minute data headers for station MB1.
• Reading Time (CST): Date and time reported in local time (CST), 24‐hour clock. • Ambient Air RHAvg (%): Average relative humidity in the past 15 minutes measured at 1.5m height, in % • Ambient Air Temp (°C): Average air temperature in the past 15 minutes measured at 1.5m height, in °C • Precipitation Precip (mm): Total amount of rain in the past 15 minutes measured at 2.5m height, in mm • Wind WindDir: Average wind direction in the past 15 minutes measured at 3m height, in cardinal direction • Wind WindSpeed (km/h): Average wind speed in the past 15 minutes measured at 3m height, in km/h • Wind WindSpeedMax (km/h): Maximum wind speed in the past 15 minutes measured at 2m height, m/s • Wind WindSpeedMin (km/h): Minimum wind speed in the past 15 minutes measured at 2m height, m/s • 0 to 5 cm Depth Sensor 1 Temp (°C): Soil temperature (hydra probe parameter F) measured at 0‐5 cm
(vertical surface sensor) in column #1 in the past 15 minutes, in °C • 0 to 5 cm Depth Sensor 1 WFV (%): Calibrated soil moisture as calculated based on the recorded RDC at 0‐
5cm (vertical surface sensor) in column #1 in the past 15 minutes, in m3/m3
The data from the remaining Stevens hydra probe sensors follow the exact pattern as the example provided above. The soil moisture measured by a 20cm sensor in column #3, would have the following header: 20 cm Depth Sensor 3 WFV (%).
Note, the station ID in the header may be provided as MB_1 or MB1 depending on where the data is downloaded. The data from the remaining Stevens hydra probe sensors follow the exact pattern as the 0to5cm_1 example provided above. The soil moisture measured by a horizontal 5cm sensor in column #2, would have the following header: MB_1_Hydra_5cm_WFV_2. The data files for all stations are structured exactly the same and the headers are the same with the exception of Station ID.
Daily Data: The daily data values provided at the data portal (http://aafc.fieldvision.ca/) are calculated from midnight Local Standard Time (CST for MB stations).

The following is an example of the daily data headers for MB stations:
• Reading Time (CST): Date • Ambient Air RHAvg (%): Average daily relative humidity measured at 1.5m height, in % • Ambient Air Temp (°C): Average daily air temperature measured at 1.5m height (calculated based on the
15 min data, ie not based on min and max air temperature), in °C • Ambient Air TempMax (°C): Minimum daily air temperature measured at 1.5m height, in °C • Ambient Air TempMin (°C): Maximum daily air temperature measured at 1.5m height, in °C • Precipitation Precip (mm): Total daily rain amount measured at 1.5m height, in mm • Wind WindDir: Average daily wind direction measured at 3m height, in cardinal direction • Wind WindSpeed (km/h): Average daily wind speed measured at 2m height, in km/h • Wind WindSpeedMax (km/h): Maximum daily wind speed measured at 2m height, in km/h • Wind WindSpeedMin (km/h): Minimum daily wind speed measured at 2m height, in km/h • 0 to 5 cm Depth Average Temp (°C): Average daily soil temperature (hydra probe parameter F) at 0‐5 cm
(vertical surface sensor) in column #1, in °C • 0 to 5 cm Depth Average WFV (%): Average daily calibrated soil moisture at 0‐5cm (vertical surface sensor)
in column #1, in %
The data from the remaining Steven’s hydra probe sensors follow the exact pattern as the example provided above. The daily average soil moisture measured at 20‐cm depth would have the following header: 20 cm Depth Average Temp (°C).

Data Flags:
The hydra probe data has gone through a basic, automated QC procedure where data not meeting quality standards has either been removed or flagged.
Missing data and data removed by QC process is reported as “NoData” in the data columns and as NA in the flag columns.
The data flags have been modified over time and are considered cumulative after V2.20140214.
V1.20130617: Applied June 27, 2013.
These data flags apply to data downloaded between June 17, 2013, and the application of the next data version.
Original QC Flags “Flag1,Flag2,Flag3,Flag4,Flag5 ” The flags will be OK, NA or an error message. Here are the possible outputs for each Flag: Flag 1 Output: “OK” / “Out of WFV range” / “NA” Flag 2 Output: “OK” / “Frozen soil” / “NA” Flag 3 Output: “OK” / “Out of average range” / “NA” Flag 4 Output: “OK” / “Readings below zero” / “NA” Flag 5 Output: “OK” / “DLT > 2” / “NA”
Flag 1 “Out of WFV range”: activated if Soil Moisture (m3/m3) is less than 0 or greater than 0.60
Flag 2 “Frozen soil”: activated if the soil temperature is below zero degrees Celsius and indicates that the soil moisture readings should not be used.
Flag 3 “Out of WFV average range”: activated if Soil Moisture value (m3/m3) is more than 10% different from the average, ie if there are sudden changes in soil moisture (these could be due to rain events or data noise; the flag is there to assist in interpretation along with rain gauge data).
Flag 4 “Readings below zero”: activated if Real Dielectric Permittivity (RDC) or Temperature Corrected Soil Conductivity (CON) is negative.
Flag 5 “DLT > 2”: activated if the Dielectric Loss Tangent (DLT = Imaginary Dielectric Permittivity / Real Dielectric Permittivity) is greater than

V2.20140214: Applied February 14, 2014. Updates: The automated QC protocol has been adjusted and the soil moisture flags have been modified. These updates apply to all RISMA data (June 2013 to current) downloaded between February 14, 2014, and the application date of the next data version.
Meteorological data: The known bad data between June 2013 and November 2013 has been removed. Also new to this version is that the precipitation data will be removed and reported as “NoData” when the air temperature is below freezing point.
Soil Moisture QC Flags: “Flag1,Flag2,Flag3,Flag4,Flag5,Flag6” The flags will be OK, NA or an error message. Here are the possible outputs for each Flag: Flag 1 Output: “OK” / “Out of WFV range” / “NA” Flag 2 Output: “OK” / “Out of WFV average range” / “NA” Flag 3 Output: “OK” / “Frozen soil” / warning: “STC averaged using depth 1 & 2” / “NA” Flag 4 Output: “OK” / “Out of RDC range” / “NA” Flag 5 Output: “OK” / “DLT >= 1.5” / “NA” Flag 6 Output: “OK” / “CON >= 0.2” / “NA”
Flag 1 “Out of WFV range”: activated if the Soil Moisture (m3/m3) is less than 0.02 or greater than 0.60
Flag 2 “Out of WFV average range”: activated if Soil Moisture value (m3/m3) is more than 10% different from the average, ie if there are sudden changes in soil moisture (these could be due to rain events or data noise; the flag is there to assist in interpretation along with rain gauge data).
Flag 3 “Frozen soil”: activated if the soil temperature is below zero degrees Celsius and indicates that the soil moisture readings should not be used.
Flag 3 “STC averaged using depth 1 & 2”: activated when hydra probe sensor #3 does not measure soil temperature. The average soil temperature from sensor #1 and 2 is used instead. Occurs at some ON stations.
Flag 4 “Out of RDC range”: activated when Real Dielectric Permittivity (RDC) is less than 2.4.
Flag 5 “DLT >= 1.5”: activated when the Dielectric Loss Tangent (DLT = Imaginary Dielectric Permittivity / Real Dielectric Permittivity) is equal to or larger than 1.5.
Flag 6 “CON >= 0.2”: activated when temperature corrected soil conductivity (CON) is equal to or larger than 0.2 S/m.
The hydra probe data is removed if real dielectric permittivity (RDC), conductivity (Con) or dielectric loss tangent is negative as it indicates a malfunctioning sensor.

V3.20141128: Applied November 28, 2014. Updates: The soil moisture flags have not been modified from V2.20140214.
These updates apply to all RISMA data (June 2013 to current) downloaded between November 28, 2014, and the application date of the next data version.

References: L’Heureux, J. (2011). 2011 Installation Report for AAFC‐SAGES Soil Moisture Stations in Kenaston, SK. Agriculture and Agri‐Food Canada, Regina, SK.

Ontario Real‐time In‐situ Soil Monitoring for Agriculture (RISMA) Network Metadata
Overview: The Ontario monitoring network was established in 2010 and 2011 by AAFC at a site of ongoing research in the development and validation of soil moisture retrieval models from active microwave satellites. The network is situated near Casselman, about 50 km east of Ottawa (see Table 3.1 and Figure 3.1), in Canada’s Mixed Wood Plain Ecozone. One additional station is located on Agriculture and Agri‐Food Canada’s Central Experimental Farm (CEF) in Ottawa. The location of each station was selected based on soil texture variability across this site, as well as variability at the field level. The Ontario stations are located at the edge of agricultural fields with annual crops. Annual crops that are generally grown in the area include corn and soybeans. The deeper (50 cm and 100cm) soil moisture sensors are located in the field, about 5‐10 m away from the edge, while the shallow sensors are located in the grass at the edge of the field to avoid interference with farming operations. The Ontario stations record precipitation data using a tipping bucket rain gauge as well as real dielectric permittivity, soil moisture and soil temperature using hydra probes at surface (0‐5 cm), 5 cm, 20 cm and 50 cm. These stations have a high water table and the 100 cm sensors could only be installed at one station (ON5). Three hydra probe sensors, or replicas, are installed at each depth. This replication provides a measurement of spatial variability in soil moisture, and redundancy in the event of sensor malfunction.
Station Location:
Table 3.1. Ontario RISMA Station Locations. Note that Easting and Northing are provided in UTM Z18 WGS84.
Ontario RISMA STATION ID
Legal Land Description Easting Northing Latitude Longitude
ON1 CON 20 PT LOT 12 505020 5020462 45.33765 ‐74.93593 ON2 CON 15 S PT LOT 9 504077 5027566 45.40160 ‐74.94790 ON3 CON 17E PT LOT 18 500228 5023235 45.36263 ‐74.99708 ON4 CON 8 PT GORE LOT CON 9 498489 5017836 45.31403 ‐75.01928 ON5 CON 16 E PT LOT 18 499754 5024816 45.37686 ‐75.00314 CEF 443652 5026024 45.38546 ‐75.71978

Figure 3.1. Map of Ontario RISMA stations.

Instrumentation:
• Data Transmission: Adcon A755 GSM/GPRS Radio Telemetry Unit (RTU), powered by Adcon 9VDC 460mA battery and 4.3 W solar panel.
• Station power source: 40W solar panels and 17 AmpH batteries. • Soil moisture sensor: Steven’s hydra probe II (SDI‐12). Installed with three replicas at each depth: 0‐5cm
(vertical), 5cm (horizontal), 20cm (horizontal) and 50cm (horizontal). Three replicas were also installed at 100cm (horizontal) at station ON5.
• Rain gauge: Tipping bucket rain gauge (Adcon RG1 2mm) installed at a height of 2.5‐3.0m. Installation Procedure:
The stations were installed in the summer of 2010 and 2011. The Ontario RISMA stations were designed to avoid interference from agricultural machinery while remaining low maintenance. The deep sensors (50cm and 100cm) were buried in the field given that they would not interfere with farming operations while the shallow sensors were installed at the edge of the field next to the station containing data logger, rain gauge, solar panel and battery (see Figure 3.2 and 3.3). The deeper sensors were installed in a soil pit in the cultivated field, approximately 5‐10m away from the edge where the rest of the station was located. Due to a high water table, the 100cm sensors could only be installed in one of the Ontario stations (ON5). The 5cm and 20cm sensors were installed in a small soil pit in the grassed area at the edge of the field next to the station and the vertical sensors were installed between the shallow soil pit and the station. The soil moisture sensor cables were buried in a trench running between the soil pits and the station. The pits and the trenches were excavated manually and the soil that was removed was placed on a tarp so that it could be used to backfill the pit with minimal mixing of the soil layers. As the soil pit was excavated, a small soil core was taken at each depth for the purpose of soil texture analysis and a large soil core was collected for lab calibration of the soil moisture sensors (see Figure 3.4). Care was taken to leave an “undisturbed” pit wall where the sensors were installed. The sensor locations were selected and flagged. Three sensors, or replicas, were installed at each depth: 0‐5cm (vertical), 5cm (horizontal), 20cm (horizontal), 50cm (horizontal) and in one case at 100cm (horizontal). The layout of the sensor replicas is provided in Figure 3.2. Due to the limited number of variables that can be recorded using the Adcon RTU system implemented at ON5, there are only two replicates of soil temperature at each depth to accommodate the additional space needed to record measurements from the 100cm sensors.
To install the soil moisture sensors, a soil coring device (2 inch diameter x 6 inch long) was first used to extract an undisturbed soil sample from the pit wall at each flagged sensor location. These soil cores were used to determine soil characteristics at each sensor location. The sensors were then inserted into the back wall of the cavity that was left after extracting the soil core (see Figure 3.5). After installing the sensors, the soil core cavity was backfilled with soil and a mix of soil and bentonite to prevent preferential flow towards the sensor. Once all the sensors were installed, the soil pit and the trench were carefully backfilled.
A photograph of the Ontario RISMA station set‐up is shown in Figure 3.6.

Figure 3.2. Schematic illustrations of the Ontario RISMA stations as seen from above.

Figure 3.3. Cross section view of the Ontario RISMA station set‐up.
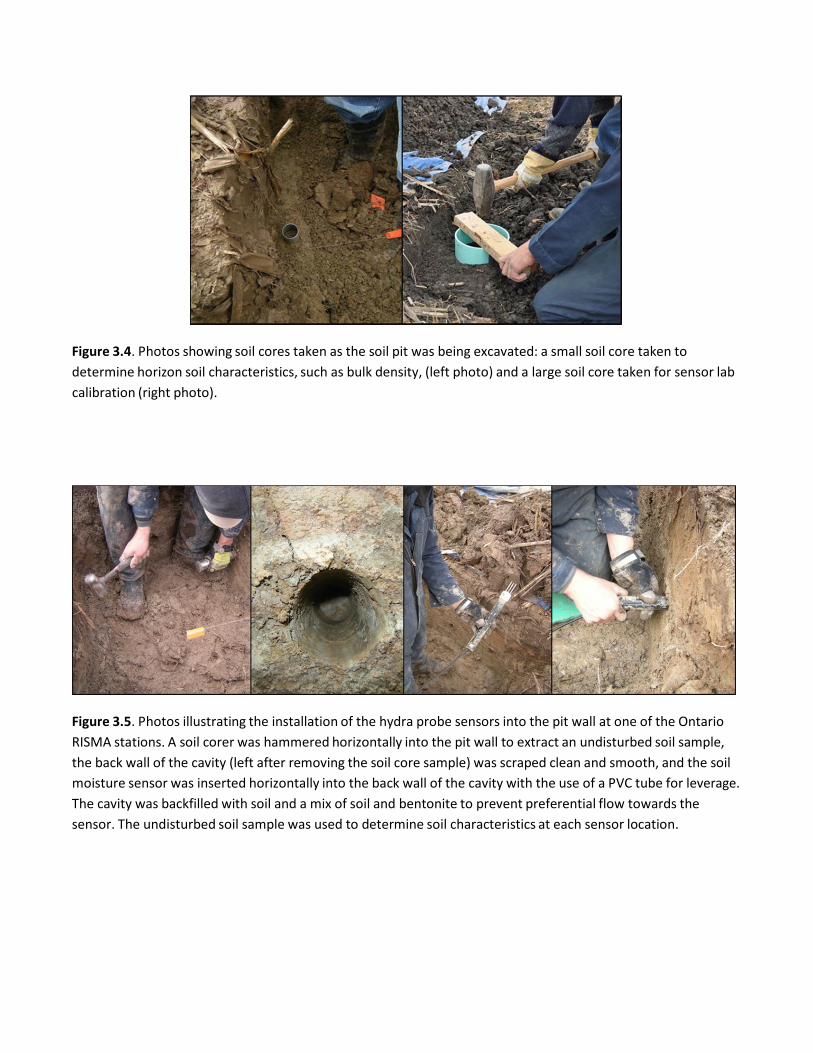
Figure 3.4. Photos showing soil cores taken as the soil pit was being excavated: a small soil core taken to determine horizon soil characteristics, such as bulk density, (left photo) and a large soil core taken for sensor lab calibration (right photo).
Figure 3.5. Photos illustrating the installation of the hydra probe sensors into the pit wall at one of the Ontario RISMA stations. A soil corer was hammered horizontally into the pit wall to extract an undisturbed soil sample, the back wall of the cavity (left after removing the soil core sample) was scraped clean and smooth, and the soil moisture sensor was inserted horizontally into the back wall of the cavity with the use of a PVC tube for leverage. The cavity was backfilled with soil and a mix of soil and bentonite to prevent preferential flow towards the sensor. The undisturbed soil sample was used to determine soil characteristics at each sensor location.

Figure 3.6. Ontario RISMA Station #4 (ON4) illustrating the tipping bucket rain gauge, the RTU solar panel and antenna, the solar panel and the enclosure containing the data logger. Note that only ON5 has 100cm sensors due to high water table at the other stations.

Soil Texture: Table 3.2. Soil textures for Ontario RISMA Stations based on the soil core extracted during installation. Note that depth 0‐0.05m indicates the vertically installed surface sensors.
SITE DEPTH (m) DENSITY (g/cm3) SAND (%) SILT (%) CLAY (%) CLASSIFICATION
ON1 0‐0.05 1.44 8.3 38.6 53.1 Clay ON1 0.05 1.44 8.3 38.6 53.1 Clay ON1 0.20 1.38 8.6 39.2 52.2 Clay ON1 0.50 1.22 28.4 29.9 41.7 Clay ON2 0‐0.05 1.32 34.7 45.4 19.9 Loam ON2 0.05 1.32 34.7 45.4 19.9 Loam ON2 0.20 1.5 36.5 45.9 17.6 Loam ON2 0.50 1.6 68.2 25.7 6.1 Sandy Loam ON3 0‐0.05 1.36 23.8 32.4 43.8 Clay ON3 0.05 1.36 23.8 32.4 43.8 Clay ON3 0.20 1.42 24.4 29.5 46.1 Clay ON3 0.50 1.29 2.4 45.4 52.2 Silty Clay ON4 0‐0.05 1.36 28.1 43.1 28.8 Clay Loam ON4 0.05 1.36 28.1 43.1 28.8 Clay Loam ON4 0.20 1.42 10.6 32.8 56.6 Clay ON4 0.50 1.29 2.4 53.3 44.3 Silty Clay ON5 0‐0.05 1.36 51.6 41.9 6.5 Sandy Loam ON5 0.05 1.36 51.6 41.9 6.5 Sandy Loam ON5 0.20 1.42 47.9 45.6 6.5 Sandy Loam ON5 0.50 1.29 71.2 23.8 5 Sandy Loam ON5 1.00 1.29 39.7 32.3 28 Clay Loam

Soil Moisture Calibration Equations: The soil moisture calibration equations are based on Seyfried (2005) and Bellingham (2007) and verified by field testing and lab calibration. Cores from the site were selected and site specific functions were developed, but the texture based equations from Seyfried (2005) and Bellingham (2007) were found to provide reduced error when compared to field collected gravimetric samples (Canisius, 2011).
Table 3.3. The soil moisture calibration equations for the Ontario RISMA stations. The soil moisture calibration equations output soil moisture as m3/m3. RDCTempCorr is the temperature corrected Real Dielectric Permittivity, RDC is the non‐temperature corrected Real Dielectric Permittivity and STC is soil temperature in degrees Celsius.
Station Depth (m) Equation (x = RDCTempCorr = RDC x 1.011 / (1.045 – 0.00225 x STC))
ON1 0‐0.05 (‐20.93 + (6.553x) + (‐0.2464x2) + (0.0032414x3)) / 100
ON1 0.05 (‐20.93 + (6.553x) + (‐0.2464x2) + (0.0032414x3)) / 100
ON1 0.20 (‐20.93 + (6.553x) + (‐0.2464x2) + (0.0032414x3)) / 100
ON1 0.50 (‐20.93 + (6.553x) + (‐0.2464x2) + (0.0032414x3)) / 100
ON2 0‐0.05 0.109 * sqrt(x) ‐ 0.179
ON2 0.05 0.109 * sqrt(x) ‐ 0.179
ON2 0.20 0.109 * sqrt(x) ‐ 0.179
ON2 0.50 0.109 * sqrt(x) ‐ 0.179
ON3 0‐0.05 (‐20.93 + (6.553x) + (‐0.2464x2) + (0.0032414x3)) / 100
ON3 0.05 (‐20.93 + (6.553x) + (‐0.2464x2) + (0.0032414x3)) / 100
ON3 0.20 (‐20.93 + (6.553x) + (‐0.2464x2) + (0.0032414x3)) / 100
ON3 0.50 0.1088 * sqrt(x) ‐ 0.1738
ON4 0‐0.05 0.1033 * sqrt(x) ‐ 0.1768
ON4 0.05 0.1033 * sqrt(x) ‐ 0.1768
ON4 0.20 (‐20.93 + (6.553x) + (‐0.2464x2) + (0.0032414x3)) / 100
ON4 0.50 0.1088 * sqrt(x) ‐ 0.1738
ON5 0‐0.05 0.1105 * sqrt(x) ‐ 0.1725
ON5 0.05 0.1105 * sqrt(x) ‐ 0.1725
ON5 0.20 0.109 * sqrt(x) ‐ 0.179
ON5 0.50 0.109 * sqrt(x) ‐ 0.179
ON5 1.00 0.1033 * sqrt(x) ‐ 0.1768

Data: Data is logged every 15 minutes and the data is updated on the AAFC internal server, SOS cloud server and the web portal once per hour.
Data format changed in 2013 with the installation of the additional sensors and the new data loggers. Data recorded prior to 2013 can be requested directly from Agriculture and Agri‐Food Canada. Data recorded after June 2013 is provided at the following data portal: http://aafc.fieldvision.ca/. Current conditions, 15‐minute data series and daily data summaries can be visualized and downloaded through the portal.
The headers for the soil moisture sensors are constructed according to:
Depth of measurement in cm, replica or column number, parameter
• #1 sensors were installed in column #1 • #2 sensors were installed in column #2, which is the middle column (always located between column 1
and 3) • #3 sensors were installed in column #3
15-Minute Data: The following are examples of 15‐minute data headers for station MB1.
• Reading Time (CST): Date and time reported in local time (CST), 24‐hour clock. • Ambient Air RHAvg (%): Average relative humidity in the past 15 minutes measured at 1.5m height, in % • Ambient Air Temp (°C): Average air temperature in the past 15 minutes measured at 1.5m height, in °C • Precipitation Precip (mm): Total amount of rain in the past 15 minutes measured at 2.5m height, in mm • Wind WindDir: Average wind direction in the past 15 minutes measured at 3m height, in cardinal direction • Wind WindSpeed (km/h): Average wind speed in the past 15 minutes measured at 3m height, in km/h • Wind WindSpeedMax (km/h): Maximum wind speed in the past 15 minutes measured at 2m height, m/s • Wind WindSpeedMin (km/h): Minimum wind speed in the past 15 minutes measured at 2m height, m/s • 0 to 5 cm Depth Sensor 1 Temp (°C): Soil temperature (hydra probe parameter F) measured at 0‐5 cm
(vertical surface sensor) in column #1 in the past 15 minutes, in °C • 0 to 5 cm Depth Sensor 1 WFV (%): Calibrated soil moisture as calculated based on the recorded RDC at
0‐5cm (vertical surface sensor) in column #1 in the past 15 minutes, in m3/m3
The data from the remaining Stevens hydra probe sensors follow the exact pattern as the example provided above. The soil moisture measured by a 20cm sensor in column #3, would have the following header: 20 cm Depth Sensor 3 WFV (%).
Note, the station ID in the header may be provided as MB_1 or MB1 depending on where the data is downloaded. The data from the remaining Stevens hydra probe sensors follow the exact pattern as the 0to5cm_1 example provided above. The soil moisture measured by a horizontal 5cm sensor in column #2, would have the following header: MB_1_Hydra_5cm_WFV_2. The data files for all stations are structured exactly the same and the headers are the same with the exception of Station ID.

Daily Data: The daily data values provided at the data portal (http://aafc.fieldvision.ca/) are calculated from midnight Local Standard Time (CST for MB stations).
The following is an example of the daily data headers for MB stations:
• Reading Time (CST): Date • Ambient Air RHAvg (%): Average daily relative humidity measured at 1.5m height, in % • Ambient Air Temp (°C): Average daily air temperature measured at 1.5m height (calculated based on the
15 min data, ie not based on min and max air temperature), in °C • Ambient Air TempMax (°C): Minimum daily air temperature measured at 1.5m height, in °C • Ambient Air TempMin (°C): Maximum daily air temperature measured at 1.5m height, in °C • Precipitation Precip (mm): Total daily rain amount measured at 1.5m height, in mm • Wind WindDir: Average daily wind direction measured at 3m height, in cardinal direction • Wind WindSpeed (km/h): Average daily wind speed measured at 2m height, in km/h • Wind WindSpeedMax (km/h): Maximum daily wind speed measured at 2m height, in km/h • Wind WindSpeedMin (km/h): Minimum daily wind speed measured at 2m height, in km/h • 0 to 5 cm Depth Average Temp (°C): Average daily soil temperature (hydra probe parameter F) at 0‐5 cm
(vertical surface sensor) in column #1, in °C • 0 to 5 cm Depth Average WFV (%): Average daily calibrated soil moisture at 0‐5cm (vertical surface
sensor) in column #1, in %
The data from the remaining Stevens hydra probe sensors follow the exact pattern as the example provided above. The daily average soil moisture measured at 20‐cm depth would have the following header: 20 cm Depth Average Temp (°C).

Data Flags:
The hydra probe data has gone through a basic, automated QC procedure where data not meeting quality standards has either been removed or flagged.
Missing data and data removed by QC process is reported as “NoData” in the data columns and as NA in the flag columns.
The data flags have been modified over time.
V1.20130617: Applied June 27, 2013.
These data flags apply to data downloaded between June 17, 2013, and the application of the next data version.
Original QC Flags “Flag1,Flag2,Flag3,Flag4,Flag5 ” The flags will be OK, NA or an error message. Here are the possible outputs for each Flag: Flag 1 Output: “OK” / “Out of WFV range” / “NA” Flag 2 Output: “OK” / “Frozen soil” / “NA” Flag 3 Output: “OK” / “Out of average range” / “NA” Flag 4 Output: “OK” / “Readings below zero” / “NA” Flag 5 Output: “OK” / “DLT > 2” / “NA”
Flag 1 “Out of WFV range”: activated if Soil Moisture (m3/m3) is less than 0 or greater than 0.60
Flag 2 “Frozen soil”: activated if the soil temperature is below zero degrees Celsius and indicates that the soil moisture readings should not be used.
Flag 3 “Out of WFV average range”: activated if Soil Moisture value (m3/m3) is more than 10% different from the average, ie if there are sudden changes in soil moisture (these could be due to rain events or data noise; the flag is there to assist in interpretation along with rain gauge data).
Flag 4 “Readings below zero”: activated if Real Dielectric Permittivity (RDC) is negative.
Flag 5 “DLT > 2”: activated if the Dielectric Loss Tangent (DLT = Imaginary Dielectric Permittivity / Real Dielectric Permittivity) is greater than 2. Note that since Imaginary Dielectric Permittivity is not recorded at Ontario stations, this flag is not relevant.

V2.20140214: Applied February 14, 2014. Updates: The automated QC protocol has been adjusted and the soil moisture flags modified.
These updates apply to all RISMA data (June 2013 to current) downloaded between February 14, 2014, and the application date of the next data version.
Meteorological data: The known bad data between June 2013 and November 2013 has been removed.
Soil Moisture QC Flags: “Flag1,Flag2,Flag3,Flag4,Flag5,Flag6” The flags will be OK, NA or an error message. Here are the possible outputs for each Flag: Flag 1 Output: “OK” / “Out of WFV range” / “NA” Flag 2 Output: “OK” / “Out of WFV average range” / “NA” Flag 3 Output: “OK” / “Frozen soil” / warning: “STC averaged using depth 1 & 2” / “NA” Flag 4 Output: “OK” / “Out of RDC range” / “NA” Flag 5 Output: “OK” / “DLT >= 1.5” / “NA” Flag 6 Output: “OK” / “CON >= 0.2” / “NA”
Flag 1 “Out of WFV range”: activated if the Soil Moisture (m3/m3) is less than 0.02 or greater than 0.60
Flag 2 “Out of WFV average range”: activated if Soil Moisture value (m3/m3) is more than 10% different from the average, ie if there are sudden changes in soil moisture (these could be due to rain events or data noise; the flag is there to assist in interpretation along with rain gauge data).
Flag 3 “Frozen soil”: activated if the soil temperature is below zero degrees Celsius and indicates that the soil moisture readings should not be used.
Flag 3 “STC averaged using depth 1 & 2”: activated when hydra probe sensor #3 does not measure soil temperature. The average soil temperature from sensor #1 and 2 is used instead. Occurs at some ON stations.
Flag 4 “Out of RDC range”: activated when Real Dielectric Permittivity (RDC) is less than 2.4.
Flag 5 “DLT >= 1.5”: activated when the Dielectric Loss Tangent (DLT = Imaginary Dielectric Permittivity / Real Dielectric Permittivity) is equal to or larger than 1.5. Note that since Imaginary Dielectric Permittivity is not recorded at Ontario stations, this flag is not relevant.
Flag 6 “CON >= 0.2”: activated when temperature corrected soil conductivity (CON) is equal to or larger than 0.2 S/m. Note that since conductivity is not recorded at Ontario stations, this flag is not relevant.
The hydra probe data is removed if real dielectric permittivity (RDC) is negative as it indicates a malfunctioning sensor.

V3.20141128: Applied November 28, 2014. The soil moisture flags have not been modified from V2.20140214.
These updates apply to all RISMA data (June 2013 to current) downloaded between November 28, 2014, and the application date of the next data version.

References:
Bellingham, K. (2007). The Stevens Hydra Probe Inorganic Soil Calibrations, Stevens Water Monitoring Systems, Portland, Oregon.
Canisius, F. (2011). Calibration of Casselman, Ontario Soil Moisture Monitoring Network, Agriculture and Agri‐ Food Canada, Ottawa, ON, 37pp.
Seyfried, MS, LE Grant, E Du and K Humes. (2005). Dielectric Loss and Calibration of the Hydra Probe Soil Water Sensor. Vadose Zone Journal 4: 1070‐1079.


![Image Labeling on a Network: Using Social-Network Metadata ...jure/pubs/image-eccv12.pdf · in the form of exif and GPS data [11,12,13,14]. Such metadata can be used to determine](https://static.fdocuments.in/doc/165x107/5f840493952a4e239a5b21ea/image-labeling-on-a-network-using-social-network-metadata-jurepubsimage-eccv12pdf.jpg)


