Risks of Stagnation in the Euro Area - International … of Stagnation in the Euro Area Prepared by...
25
WP/16/9 Risks of Stagnation in the Euro Area by Huidan Lin
Transcript of Risks of Stagnation in the Euro Area - International … of Stagnation in the Euro Area Prepared by...

WP/16/9
Risks of Stagnation in the Euro Area
by Huidan Lin

© 2016 International Monetary Fund WP/16/9
IMF Working Paper
European Department
Risks of Stagnation in the Euro Area
Prepared by Huidan Lin1
Authorized for distribution by Kenneth Kang
January 2016
Abstract
This paper discusses the risks of stagnation over the medium term in the euro area. It
examines the consequences of longer-term growth trends that predate the crisis and the
progress made in addressing the crisis legacies of high unemployment and debt. The paper
illustrates in a downside scenario, how low potential growth and crisis legacies leave the
euro area vulnerable to a negative shock that tips the economy into a prolonged
slowdown.
JEL Classification Numbers: O47, O52, C53
Keywords: Potential growth, Productivity, Deleveraging, Euro area, Downside scenario
Author’s E-Mail Address: [email protected]
1 I would like to thank Kenneth Kang and Mahmood Pradhan for guidance and suggestions. I also thank
Benjamin Hunt and Susanna Mursula for assistance in model simulations, Shekhar Aiyar, James John, seminar
participants at the European Commission, colleagues from European Central Bank, and others for helpful
comments and suggestions, and Jesse Siminitz for excellent research assistance. An earlier version of this paper
was issued as a Selected Issues paper and served as background material for the Executive Board Meeting on
the 2015 Article IV Consultation for the Euro Area.
IMF Working Papers describe research in progress by the author(s) and are published to
elicit comments and to encourage debate. The views expressed in IMF Working Papers are
those of the author(s) and do not necessarily represent the views of the IMF, its Executive Board,
or IMF management.

3
Contents Page
I. Motivation ________________________________________________________________4
II. Output per Capita: Diagnosis and Prospects _____________________________________7
A. Labor ________________________________________________________________7
B. Capital _______________________________________________________________9
C. Total factor productivity__________________________________________________10
III. Crisis Legacies: Progress and Prospects ________________________________________12
A. High Unemployment ____________________________________________________13
B. High Debt _____________________________________________________________14
IV. An Illustrative Downside Scenario ____________________________________________16
V. Concluding Remarks _______________________________________________________22
References __________________________________________________________________24
Figures
1. Actual and Pre-crisis Trend Output ___________________________________________5
2. Actual and Potential Output _________________________________________________6
3. Contribution to Growth in Hours Worked per Capita _____________________________8
4. Simulation Results: Investment Shock _________________________________________19
5. Simulation Results: Investment and Risk Premium Shock__________________________21
Table
Results from an Illustrative Downside Scenario _____________________________________22

4
I. MOTIVATION
Since the global financial crisis, growth in output per capita in the euro area has stalled and
the gap with the United States has widened.2 For the major advanced economies, per capita
growth rates have fallen well below their pre-crisis levels, but the decline has been
particularly severe for the euro area where output per capita in 2014 remained at the same
level as in the mid-2000s (Figure 1). In PPP terms, nominal GDP per capita in the euro area
is now nearly $15,000 below that in the United States, the highest gap since the start of EMU
(text charts).
Sources: World Economic Outlook; and IMF staff calculations.
Recent IMF research (IMF, 2015a) points out that potential growth slowed in the advanced
economies well before the global financial crisis, due mainly to declining total factor
productivity (TFP) growth. Studies also
suggest that potential growth is likely to
increase only slightly and remain below
pre-crisis levels in the medium term, due to
population aging and slow progress in
addressing crisis legacies. Indeed, potential
output estimates for the major advanced
economies have been revised down
dramatically since the onset of the crisis
(Figure 2, text chart).
Low potential growth has raised concerns
over the risks of stagnation. This is
particularly relevant given the high levels of unemployment and public and private
indebtedness, as well as limited policy space in many euro area countries. A prolonged
2 In this paper, euro area excludes Lithuania, unless stated otherwise.
90
100
110
120
130
140
150
1991 1995 1999 2003 2007 2011
Real Output per Capita
(1991=100)
United States
Japan
Euro area
20
25
30
35
40
45
50
55
60
1991 1995 1999 2003 2007 2011
Nominal Output per Capita
(PPP dollar, thousands)
United States
Euro area
Japan
-1.0
-0.5
0.0
0.5
1.0
1.5
2.0
2.5
3.0
1991-2000 2001-2007 2008-2014
Real Output per Capita
(year-on-year percent change)
Euro area
United States
Japan
0.0
0.5
1.0
1.5
2.0
2.5
1999
2000
2001
2002
2003
2004
2005
2006
2007
2008
2009
2010
2011
2012
2013
2014
2015
2016
2017
2018
2019
2020
Euro Area: Potential GDP Growth
(percent change)
2001-07 average
Sources: World Economic Outlook; and IMF staff estimates.
5
Figure 1. Actual and Pre-crisis Trend Output1
(1991=100)
Sources: WEO; and IMF staff calculations.
1/ Pre-crisis trend is the trend growth over 1991-2007. Excluding the two years (2006 and 2007) before the recession
does not change the trend.
90
110
130
150
170
190
210
1991 1994 1997 2000 2003 2006 2009 2012
Actual GDP Pre-Crisis trend
Euro Area
90
110
130
150
170
190
210
1991 1994 1997 2000 2003 2006 2009 2012
United States
90
110
130
150
170
190
210
1991 1994 1997 2000 2003 2006 2009 2012
Japan

6
Figure 2. Actual and Potential Output
(2007=100)
Sources: WEO; and IMF staff calculations.
90
95
100
105
110
115
120
125
130
2007 2009 2011 2013 2015 2017 2019
Euro Area
2008
2010
2012
2015
Actual output 2008
20102012
2015
Actual
90
95
100
105
110
115
120
125
130
2007 2009 2011 2013 2015 2017 2019
United States
2008 2010 2012
2015
Actual
90
95
100
105
110
115
120
125
130
2007 2009 2011 2013 2015 2017 2019
Japan
2008
2010 2012 2015
Actual
7
period of low growth and inflation could exacerbate these weaknesses, leaving the euro area
vulnerable to shocks. This paper examines the risks of stagnation for the euro area.
Specifically, it asks the following questions: (i) what have been the main drivers of the
slowdown in output per capita (Section II) (ii) how much progress has been made in
addressing the crisis legacies of high unemployment and debt (Section III) and (iii) how
vulnerable is the euro area to a prolonged slowdown given the subdued prospect for medium-
term growth and unaddressed crisis legacies (Section IV).
II. OUTPUT PER CAPITA: DIAGNOSIS AND PROSPECTS
On the supply side, output per capita can be decomposed into: (i) labor input per capita; (ii)
capital per capita; and (iii) total factor productivity.3 While the growth rates of supply-side
factors of differ significantly, this section abstracts from within-euro area differences and
compares the euro area aggregates against those of Japan and the United States.
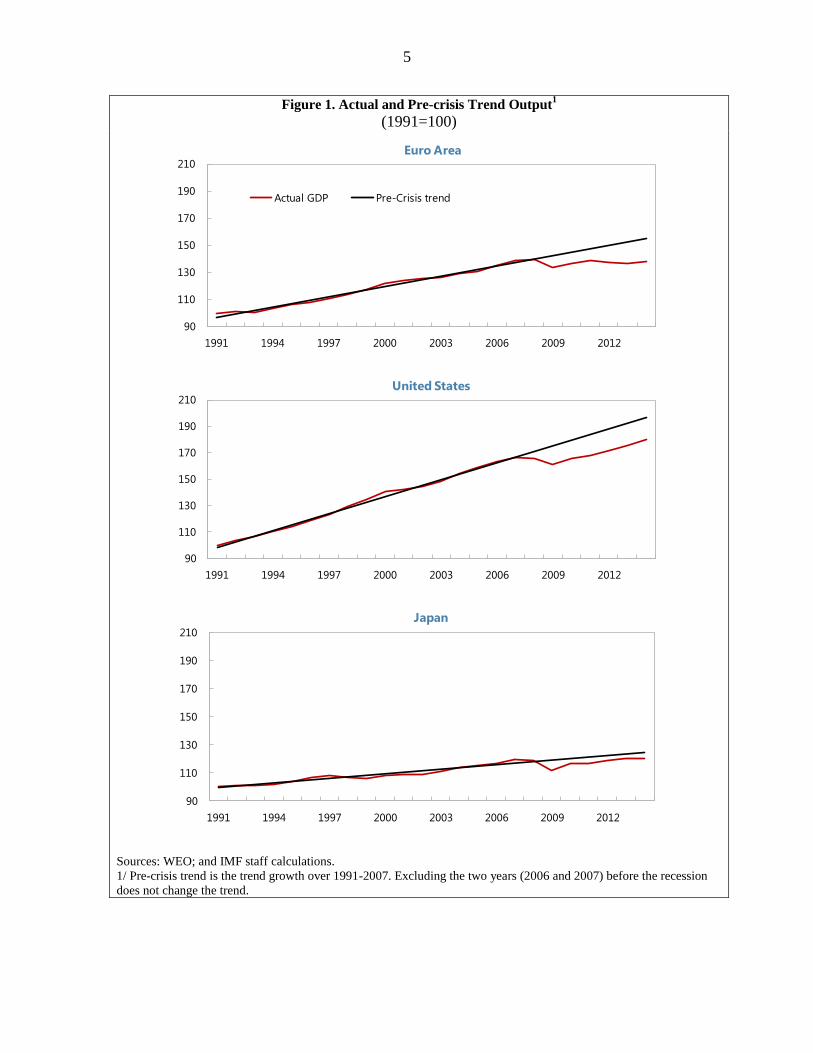
A. Labor
Before the crisis, the euro area benefited from increasing labor force participation and
declining unemployment, which more than offset the shrinking working-age population
(aged 15-64 years, as a share of total population) (text charts). During the crisis, the
contribution of labor to per-capita growth in the euro area turned negative. Labor force
participation continued to rise but at a slower pace, while the working-age population grew
more slowly than total population. All of these factors, combined with higher unemployment,
led to a decline in total labor inputs for the euro area (Figure 3). Similarly, in the United
States and Japan labor inputs also fell during the crisis, but for different reasons. In the
United States, the decline in labor force participation, the shrinking working-age population,
and rising unemployment contributed equally to the fall in labor inputs, while in Japan labor
inputs declined due mainly to the shrinking working-age population (as a share of total
population).4
3 A decomposition along a Cobb-Douglas specification of the output per capita would be
, where Y, N, A, K, L, α are output, population, TFP, capital stock, labor input (in
hours), and capital share, respectively.
4 For comparison purpose, the labor statistics of the United States and Japan are also from European
Commission annual macroeconomic database (AMECO), if available. There are some differences between
AMECO and the labor statistics bureaus of the United States and Japan. For instance, Japanese labor force
participation increased from 82.7 percent in 2007 to 86 percent in 2017 according to AMECO, while it
increased from 78.2 percent to 80.2 percent according to Statistics Bureau, Ministry of Internal Affairs and
Communications.

8
Figure 3. Contribution to Growth in Hours Worked per Capita
(annualized average, percentage point)
Sources: European Commission AMECO; and IMF staff calculations.
-2.0
-1.5
-1.0
-0.5
0.0
0.5
1.0
1.5
2.0
2002-07 2008-14
Euro Area
Hour per employee
Employment/labor force
Working age pop/total
Labor participation
Hour per capita
-2.0
-1.5
-1.0
-0.5
0.0
0.5
1.0
2002-07 2008-14
United States
-2.0
-1.5
-1.0
-0.5
0.0
0.5
1.0
1.5
2.0
2002-07 2008-14
Japan

9
Population aging is expected to hold employment growth below pre-crisis levels, by lowering
the growth of the working-age population and trend labor force participation rates. Working-
age population growth is projected to decline significantly in advanced economies (text
chart). Aging is also expected to reduce trend labor participation rates (the ratio of trend labor
force to working-age population), offsetting the positive effect of continued population
increase on overall labor supply (IMF,
2015a). For advanced economies, the net
effect is little expansion in the labor force
over the medium term, compared to annual
growth of about 0.2 percent during crisis
and 0.7 percent during 2002–07; for the
euro area, the labor force is expected to
expand by 0.3 percent annually over the
medium term, about one-third of the level
during 2002-07 (WEO, April 2014).
Raising employment growth above the pre-
crisis levels can then be achieved only
through a significant reduction in structural unemployment (see Section C).
B. Capital
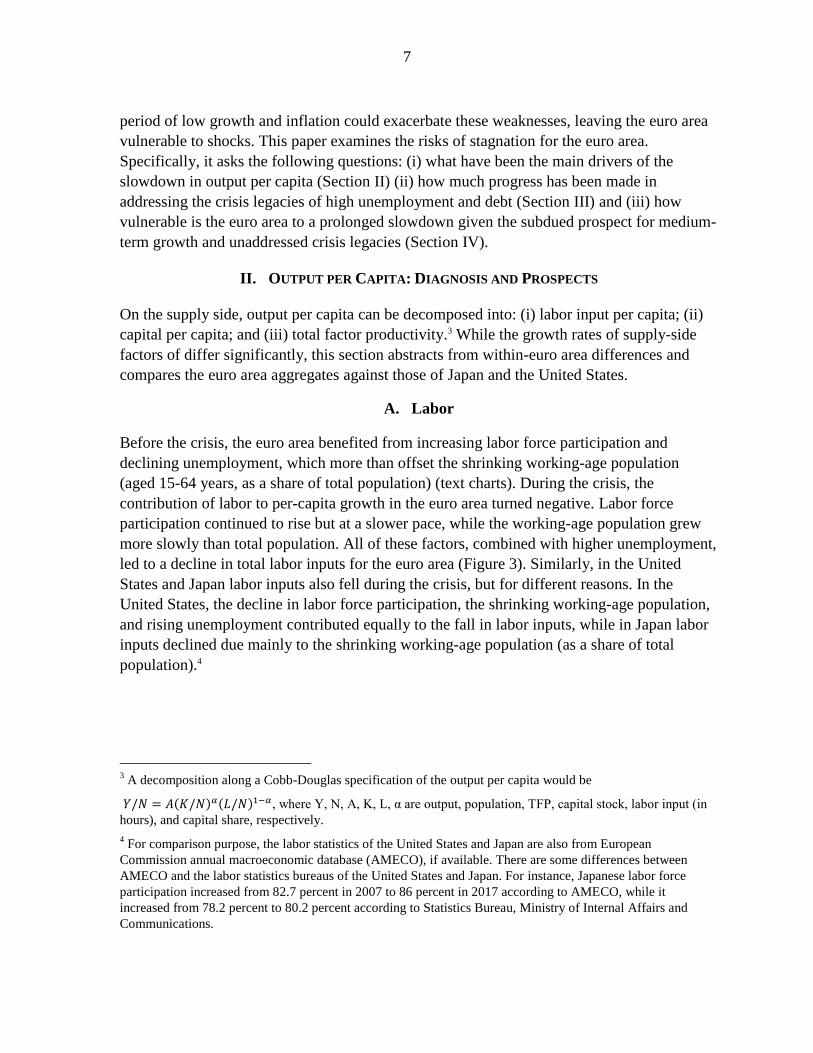
The slowdown in capital accumulation accelerated during the crisis. While the United States
saw a larger decline in capital accumulation during the global financial crisis, investment and
hence capital accumulation has since picked up strongly. In the euro area, investment has
expanded only moderately since the second half of 2014. As a result, the capital is growing
more slowly than the population, with the decline in capital accumulation particularly sharp
in countries such as Greece and Italy (text charts).
60
62
64
66
68
70
1995 1998 2001 2004 2007 2010 2013
Working Age Population
(percent of total population)
Japan
Euro area
United States
60
65
70
75
80
85
90
1995 1998 2001 2004 2007 2010 2013
Labor Force Participation
(percent of working age population)
Sources: AMECO; and IMF staff calculations.
Japan
United States
Euro area
60
80
100
120
140
160
180
200
220
1950 1960 1970 1980 1990 2000 2010 2020 2030 2040 2050
Euro area
United States
Japan
Projection
Working Age Population (1950=100)
Sources: United Nations; and IMF staff estimates.
10
-5
-4.5
-4
-3.5
-3
-2.5
-2
-1.5
-1
-0.5
0
-1 0 1 2 3 4 5 6 7 8 9 10
Investment-to-Capital Ratio
(percentage points; years on x-axis)
Euro area
Advanced economies
All previous crises
All previous crises (90% confidence band)
Sources: IMF (2015a) based on Laeven and Valencia (2014);
euro area data from AMECO; and IMF staff calculations.
Capital accumulation is likely to remain below
pre-crisis levels over the medium term. The
ratio of investment-to-capital (I/K) has fallen
significantly since the onset of the crisis,
reflecting the weak economic recovery (text
chart). This decline is broadly in line with
experience from past financial crises, which
suggests the I/K ratio and hence capital stock
growth will remain below pre-crisis levels for
some time (IMF, 2015a). Country
circumstances vary, but even for the United
States where capital per capita growth has
recovered partially, a complete recovery is
likely to take a decade or more (Hall, 2014).
C. Total Factor Productivity
Labor productivity in the euro area (measured as output per hour worked) had grown steadily
faster than in the United States until the mid-1990s, which helped narrow the productivity
gap. Since the mid-1990s, however, productivity growth has diverged between these two
blocks as euro area productivity growth fell consistently below that of the United States until
the onset of the crisis. As a result, the labor productivity gap between the euro area and the
United States widened again in the early 2000s (text charts).
Empirical studies suggest that the widening gap between the euro area and the United States
reflects mainly slower TFP growth (see, e.g., van Ark and others, 2008). Indeed, within the
euro area, TFP growth has slowed in most economies, and has been negative for Italy since
the early 2000s and for Greece and a few other countries during the crisis (text charts).
Sources: AMECO; WEO; and IMF staff calculations.
Sources: Eurostat; and IMF staff calculations.
-2.0
-1.5
-1.0
-0.5
0.0
0.5
1.0
1.5
2.0
2.5
3.0
3.5
1996 1998 2000 2002 2004 2006 2008 2010 2012 2014
Capital per Capita
(year-on-year percent change)
Euro area United States
Italy Greece
40
50
60
70
80
90
100
110
120
40
50
60
70
80
90
100
110
120
GRC ITA PRT JPN ESP EA19 DEU FRA GBR US
Private Non-Residential Investment Recovery
to Date: 2015Q1 (2007 quarterly average=100)

11
Sources: The Conference Board Total Economy Database, January 2014; and IMF staff calculations. 1 Excludes Estonia, Latvia, Lithuania, Slovak Republic, and Slovenia.
Sources: European Commission AMECO. Note: Total factor productivity is estimated where the labor input is measured as hours worked.
The productivity slowdown in services explains most of the decline in TFP growth of the
overall economy. Lower productivity growth in services, especially due to slower adoption
and diffusion of information and communications technology (ICT), is found to be an
important factor in explaining the slowdown in TFP growth in Europe since the mid-1990s
(van Ark and others, 2008; Dabla-Norris and others, 2015). Reversing the productivity
slowdown in service sectors is therefore essential to raising TFP growth. However, unlike the
United States where service sector productivity has picked up and surpassed its pre-crisis
peak, it is growing only very gradually in the euro area and remains well below its pre-crisis
peak in countries such as Germany and Italy (text chart).
0.0
0.5
1.0
1.5
2.0
2.5
3.0
3.5
4.0
4.5
1981-85 1986-90 1991-95 1996-00 2001-05 2006-10 2011-13
Output per hour worked
(average annual growth rate, percent)
Euro area 1/
US
Japan
25
30
35
40
45
50
55
60
65
70
1990 1993 1996 1999 2002 2005 2008 2011
Output per hour worked
(in ppp dollar)
Euro area 1/
US
Japan
-1.5
-1.0
-0.5
0.0
0.5
1.0
1.5
1996-2000 2001-2007 2008-2014
Total Factor Productivity
(average of annual growth, percent)
Germany France
Italy Spain
-3.0
-2.0
-1.0
0.0
1.0
2.0
3.0
4.0
5.0
1996-2000 2001-2007 2008-2014
Total Factor Productivity
(average of annual growth, percent)
Netherlands Portugal
Greece Ireland

12
Looking forward, overall productivity
growth in the euro area is likely to remain
weak.5 First, TFP growth in the United
States is likely to slow as growth in ICT-
producing sectors already started to
decline prior to the crisis (Fernald, 2014),
leading some to conclude that the
productivity frontier is likely to expand
less quickly (Gordon, 2012).6 This
slowdown in the expansion of the
productivity frontier in the United States,
if it happens, is also likely to spill over to
the rest of the world (IMF, 2015a).
Second, although convergence is still
possible, adopting and promoting
innovations requires flexibility and
adaptability, and the slow progress in
addressing structural gaps in the euro area
may delay the diffusion of technology.
To sum, potential growth in the euro area
is expected to be subdued in the baseline, rising only slightly from 0.7 percent during
2008-14 to about 1.1 percent during 2015–20, significantly lower than the 1999–2007
average of 1.9 percent (WEO, April 2015). In addition to low potential growth, the slow
progress in addressing crisis legacies is also likely to weigh on aggregate demand.7
III. CRISIS LEGACIES: PROGRESS AND PROSPECTS
This section looks into the demand-side factors behind the subdued prospect for medium-
term growth—unaddressed legacies from the global financial crisis and in particular the
sovereign debt crisis in several euro area countries. Therefore, this section zooms into
individual countries and highlights the variation within the euro area. While crisis legacies
are cyclical, if left unaddressed, they would become structural: high unemployment would
5 See IMF (2015a) for policy recommendations on increasing potential output.
6 However, J. Mokyr argues that technology progresses tend to contribute little to measured output even if their
impact on consumer welfare is very large. (http://www.wsj.com/articles/joel-mokyr-what-todays-economic-
gloomsayers-are-missing-1407536487). See also Brynjolfsson and McAfee (2014).
7 European Commission (McMorrow and Roeger, 2014) also expects that EU growth rates are likely to be
substantially weaker over 2014-2023 at an annual average rate of about 1.5%, a full percentage point lower than
in the decade leading up to the crisis (1998-2007). Low future growth rates will essentially reflect the influence
of weak pre-crisis trends, most notably for TFP, as well as the economic realities of aging populations and the
fallout from the financial crisis.
90
92
94
96
98
100
102
104
106
108
Mar-05 Mar-07 Mar-09 Mar-11 Mar-13
Service Sector Productivity
(2008 = 100)
Euro area
United States
Italy
Germany
Sources: Eurostat; national statistics offices; Bureau of Labor
Statistics; and IMF staff calculations.
Note: Measured as per person employed. Euro area service
sector covers travel, trade, accommodation & food,
information & communication, finance and insurance, real
estate, professional, science & technology; and for the
United States trade, transportation & warehousing,
information, finance, insurance, real estate, rental and
leasing.
13
hamper human capital accumulation through the hysteresis effect and low investment would
delay capital accumulation.
A. High Unemployment
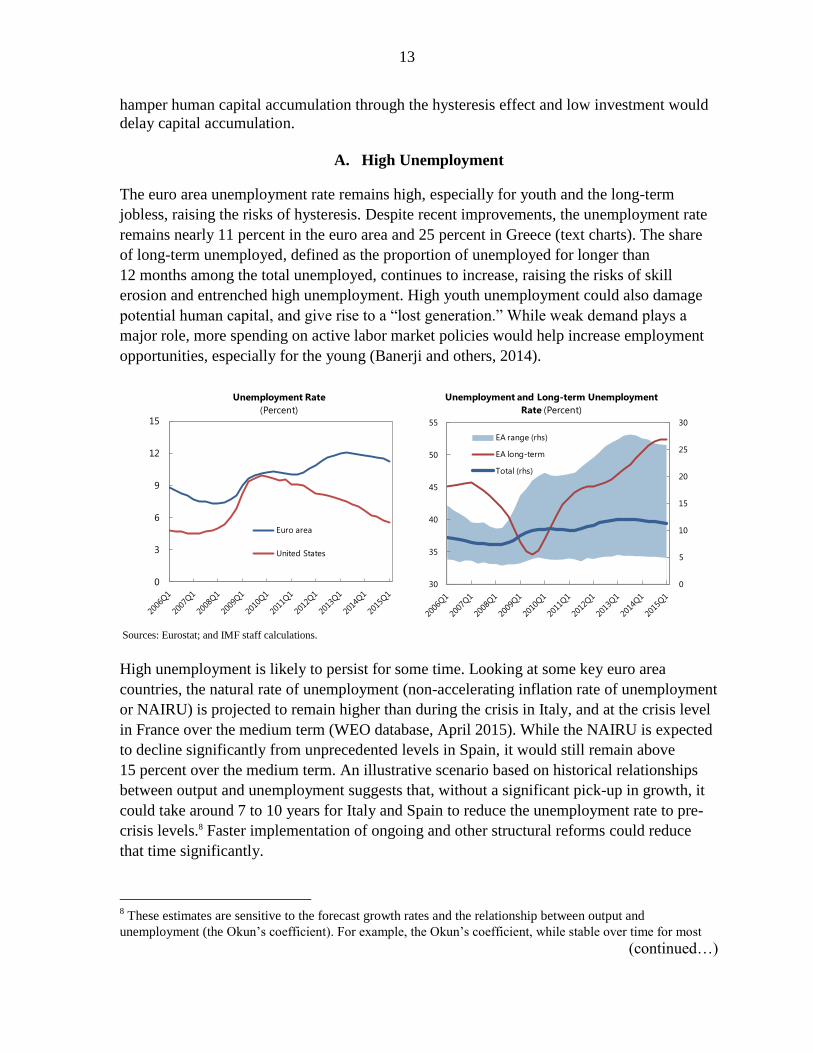
The euro area unemployment rate remains high, especially for youth and the long-term
jobless, raising the risks of hysteresis. Despite recent improvements, the unemployment rate
remains nearly 11 percent in the euro area and 25 percent in Greece (text charts). The share
of long-term unemployed, defined as the proportion of unemployed for longer than
12 months among the total unemployed, continues to increase, raising the risks of skill
erosion and entrenched high unemployment. High youth unemployment could also damage
potential human capital, and give rise to a “lost generation.” While weak demand plays a
major role, more spending on active labor market policies would help increase employment
opportunities, especially for the young (Banerji and others, 2014).
High unemployment is likely to persist for some time. Looking at some key euro area
countries, the natural rate of unemployment (non-accelerating inflation rate of unemployment
or NAIRU) is projected to remain higher than during the crisis in Italy, and at the crisis level
in France over the medium term (WEO database, April 2015). While the NAIRU is expected
to decline significantly from unprecedented levels in Spain, it would still remain above
15 percent over the medium term. An illustrative scenario based on historical relationships
between output and unemployment suggests that, without a significant pick-up in growth, it
could take around 7 to 10 years for Italy and Spain to reduce the unemployment rate to pre-
crisis levels.8 Faster implementation of ongoing and other structural reforms could reduce
that time significantly.
8 These estimates are sensitive to the forecast growth rates and the relationship between output and
unemployment (the Okun’s coefficient). For example, the Okun’s coefficient, while stable over time for most
(continued…)
Sources: Eurostat; and IMF staff calculations.
0
3
6
9
12
15
Euro area
United States
Unemployment Rate
(Percent)
0
5
10
15
20
25
30
30
35
40
45
50
55
EA range (rhs)
EA long-term
Total (rhs)
Unemployment and Long-term Unemployment
Rate (Percent)
14
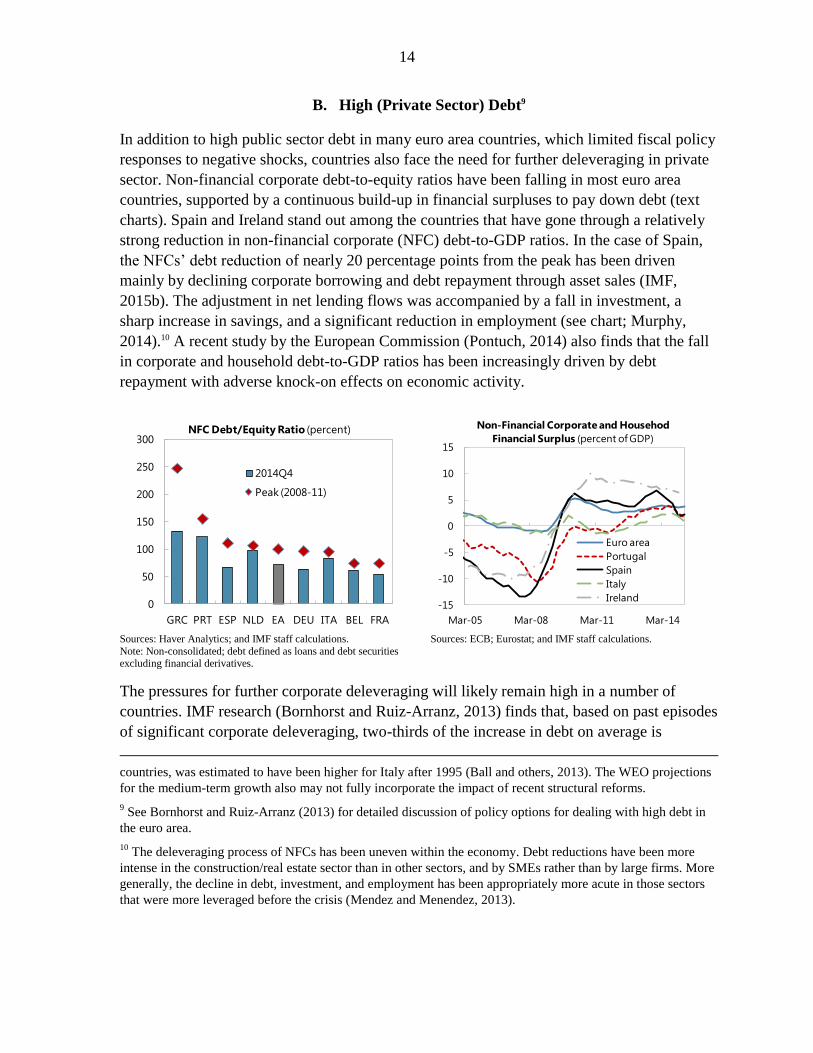
B. High (Private Sector) Debt9
In addition to high public sector debt in many euro area countries, which limited fiscal policy
responses to negative shocks, countries also face the need for further deleveraging in private
sector. Non-financial corporate debt-to-equity ratios have been falling in most euro area
countries, supported by a continuous build-up in financial surpluses to pay down debt (text
charts). Spain and Ireland stand out among the countries that have gone through a relatively
strong reduction in non-financial corporate (NFC) debt-to-GDP ratios. In the case of Spain,
the NFCs’ debt reduction of nearly 20 percentage points from the peak has been driven
mainly by declining corporate borrowing and debt repayment through asset sales (IMF,
2015b). The adjustment in net lending flows was accompanied by a fall in investment, a
sharp increase in savings, and a significant reduction in employment (see chart; Murphy,
2014).10 A recent study by the European Commission (Pontuch, 2014) also finds that the fall
in corporate and household debt-to-GDP ratios has been increasingly driven by debt
repayment with adverse knock-on effects on economic activity.
The pressures for further corporate deleveraging will likely remain high in a number of
countries. IMF research (Bornhorst and Ruiz-Arranz, 2013) finds that, based on past episodes
of significant corporate deleveraging, two-thirds of the increase in debt on average is
countries, was estimated to have been higher for Italy after 1995 (Ball and others, 2013). The WEO projections
for the medium-term growth also may not fully incorporate the impact of recent structural reforms.
9 See Bornhorst and Ruiz-Arranz (2013) for detailed discussion of policy options for dealing with high debt in
the euro area.
10 The deleveraging process of NFCs has been uneven within the economy. Debt reductions have been more
intense in the construction/real estate sector than in other sectors, and by SMEs rather than by large firms. More
generally, the decline in debt, investment, and employment has been appropriately more acute in those sectors
that were more leveraged before the crisis (Mendez and Menendez, 2013).
Sources: Haver Analytics; and IMF staff calculations.
Note: Non-consolidated; debt defined as loans and debt securities excluding financial derivatives.
Sources: ECB; Eurostat; and IMF staff calculations.
0
50
100
150
200
250
300
GRC PRT ESP NLD EA DEU ITA BEL FRA
NFC Debt/Equity Ratio (percent)
2014Q4
Peak (2008-11)
-15
-10
-5
0
5
10
15
Mar-05 Mar-08 Mar-11 Mar-14
Non-Financial Corporate and Househod
Financial Surplus (percent of GDP)
Euro area
Portugal
Spain
Italy
Ireland

15
subsequently reduced. If deleveraging in the euro area follows a similar path, it would imply
still sizable deleveraging needs for firms in a number of countries, and a significant
headwind for an investment recovery (text chart).11 Barkbu and others (2015) find that in
addition to weak demand, expectations of low future growth and continued deleveraging also
reduced investment decline during the crisis. Looking forward, in countries where the
recovery has been stronger (such as Spain), faster growth is expected to facilitate
deleveraging more by increasing nominal output, and thereby reduce the burden on spending.
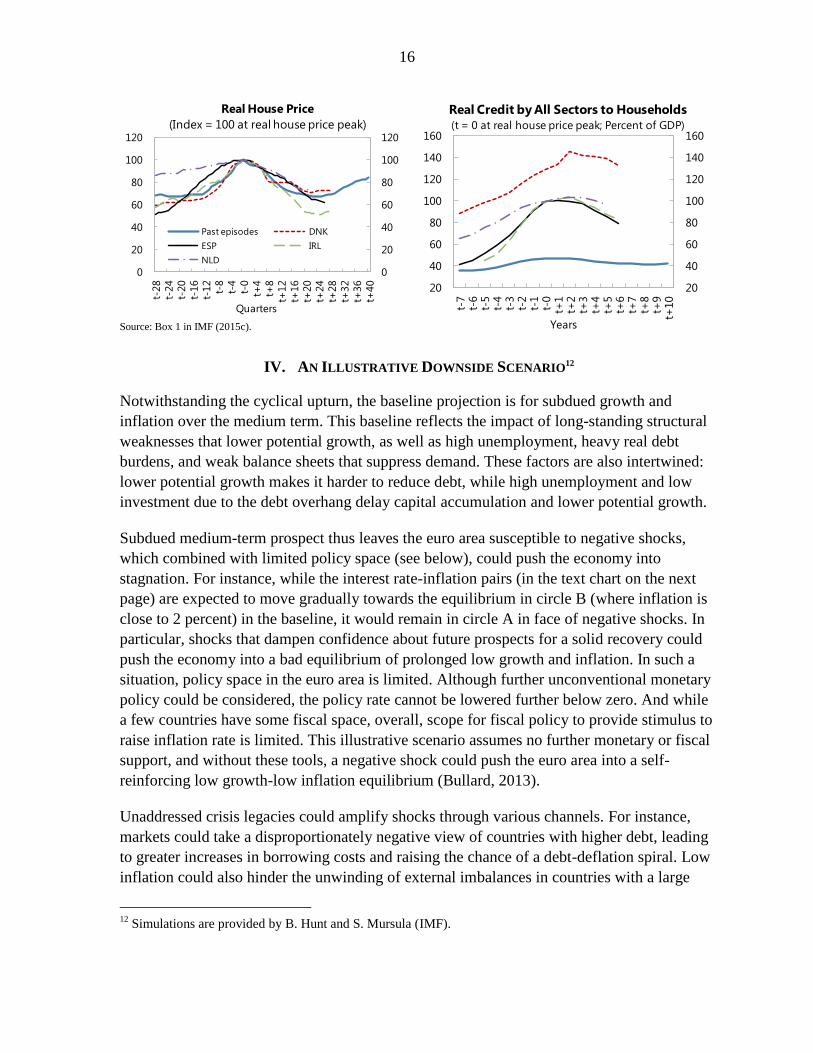
Households in some countries also suffer from high debt, following a large housing boom-
bust cycle. After five to seven years of adjustment, housing prices seem to be nearing a
trough, similar to past episodes of house price declines (IMF, 2015c). However, domestic
demand has been much weaker than in the past. This is due possibly to higher household debt
both at the peak and a large increase in debt during the boom (IMF, 2015b). Although
household debt-to-GDP ratios have come down by 10-20 percentage points in high debt
countries, they remain significantly above their pre-boom levels, raising the risks that the
debt overhang will continue to weign on spending for some time (text charts).
11
For instance, if the accumulated debt were to be fall by two-thirds, it would imply a further reduction of
nine percentage points of GDP for the euro area as a whole.
Sources: Haver Analytics; and IMF staff calculations.
Note: Non-consolidated; debt defined as loans and debt securities excluding financial derivatives.
Sources: updated from Bornhorst and Ruiz-Arranz (2013). 1 Non-consolidated; ESA2010 for euro area countries. 2 Historic episodes: JP 89-97, UK 90-96, AU 88-96, FI 93-96, NO
00-05, SE 01-04.
50
54
58
62
66
70
74
20
25
30
35
40
45
50
Mar-07 Mar-09 Mar-11 Mar-13 Mar-15
Spain: Gross Operating Surplus of NFCs
(percent of GVA)
Gross operating surplus
Gross fixed capital formation
Compensation of employees (rhs)
0
50
100
150
200
250
GR IT PT FR ES BE IE EA AU UK FI NO SE JP
Increase through peak
Starting point 2000 (or earliest)
Starting point 2/
Post-crisis trough
Latest (Q4 2014)
Non-Financial Corporate Deleveraging Episodes
(Corporate debt1/, percent of GDP)
16
Source: Box 1 in IMF (2015c).
IV. AN ILLUSTRATIVE DOWNSIDE SCENARIO12
Notwithstanding the cyclical upturn, the baseline projection is for subdued growth and
inflation over the medium term. This baseline reflects the impact of long-standing structural
weaknesses that lower potential growth, as well as high unemployment, heavy real debt
burdens, and weak balance sheets that suppress demand. These factors are also intertwined:
lower potential growth makes it harder to reduce debt, while high unemployment and low
investment due to the debt overhang delay capital accumulation and lower potential growth.
Subdued medium-term prospect thus leaves the euro area susceptible to negative shocks,
which combined with limited policy space (see below), could push the economy into
stagnation. For instance, while the interest rate-inflation pairs (in the text chart on the next
page) are expected to move gradually towards the equilibrium in circle B (where inflation is
close to 2 percent) in the baseline, it would remain in circle A in face of negative shocks. In
particular, shocks that dampen confidence about future prospects for a solid recovery could
push the economy into a bad equilibrium of prolonged low growth and inflation. In such a
situation, policy space in the euro area is limited. Although further unconventional monetary
policy could be considered, the policy rate cannot be lowered further below zero. And while
a few countries have some fiscal space, overall, scope for fiscal policy to provide stimulus to
raise inflation rate is limited. This illustrative scenario assumes no further monetary or fiscal
support, and without these tools, a negative shock could push the euro area into a self-
reinforcing low growth-low inflation equilibrium (Bullard, 2013).
Unaddressed crisis legacies could amplify shocks through various channels. For instance,
markets could take a disproportionately negative view of countries with higher debt, leading
to greater increases in borrowing costs and raising the chance of a debt-deflation spiral. Low
inflation could also hinder the unwinding of external imbalances in countries with a large
12
Simulations are provided by B. Hunt and S. Mursula (IMF).
0
20
40
60
80
100
120
0
20
40
60
80
100
120
t-28
t-24
t-20
t-16
t-12
t-8
t-4
t-0
t+4
t+8
t+12
t+16
t+20
t+24
t+28
t+32
t+36
t+40
Past episodes DNK
ESP IRL
NLD
Real House Price
(Index = 100 at real house price peak)
Quarters
20
40
60
80
100
120
140
160
20
40
60
80
100
120
140
160
t-7
t-6
t-5
t-4
t-3
t-2
t-1
t-0
t+1
t+2
t+3
t+4
t+5
t+6
t+7
t+8
t+9
t+10
Real Credit by All Sectors to Households
(t = 0 at real house price peak; Percent of GDP)
Years

17
output gap by making it harder for real prices and wages to fall or by forcing countries to
adjust through painful cuts in nominal wages, prices and/or employment.
To highlight some of these channels, two illustrative simulations are considered: (1) private
investment shock; (2) private investment shock plus risk premium shock. In these scenarios,
unconventional monetary policy is assumed to have reached its limit, that is, no more
unconventional monetary action than is incorporated in the baseline. Instead, the policy
responses rely only on conventional monetary policy and fiscal policy. However, due to the
zero lower bound and limited fiscal space, monetary policy cannot be eased further in
response to shocks and fiscal policy cannot provide stimulus beyond the operation of
automatic stabilizers in the short run (and stabilizing debt-to-GDP ratio in the long run).13
The simulations were conducted using the Flexible System of Global Models (FSGM) in
coordination with the IMF’s Research Department.14 Simulation outcomes are measured
against the April 2015 WEO baseline. In this baseline, growth is projected to rise from
13
If fiscal stance were allowed to respond beyond the role of automatic stabilizers in countries with low debt
levels, the growth impact on these countries and the euro area aggregate would be smaller than presented in the
text.
14 FSGM comprises three core models (G20MOD, EUROMOD, and EMERGMOD), each of which captures
the global economy. FSGM is semi-structural with a single good, but private consumption and investment are
structural (micro-founded); trade, labor supply and inflation are reduced form representations; supply is
determined by an aggregate Cobb-Douglas production function; and monetary and fiscal policies are
endogenously set with simple rules (Andrle and others, 2015).
Sources: Bloomberg; and Haver Analytics. Note: Nominal interest rates are overnight EONIA for the euro area; the overnight call rate for Japan; federal funds rate for the
United States; and SONIA for the United Kingdom.
-1
0
1
2
3
4
5
6
7
-2 -1 0 1 2 3 4 5
No
min
al i
nte
rest
rate
(p
erc
en
t)
Core CPI inflation rate (percent)
United States
United Kingdom
Euro area
Japan
Inflation and Interest Rates (2002-2014)
Non-linear Taylor Rule
i = F(x)
Fisher Relation
i = r + x
where r = 0.5%
A
B

18
1.5 percent this year to 1.6 percent next year, and stay at this level throughout the medium
term. Given the still large output gap (-2.3 percent of potential GDP), inflation is expected to
remain low, close to zero this year, before rising to one percent next year and to 1.7 percent
over the medium term. The output gap is expected to close around 2020.
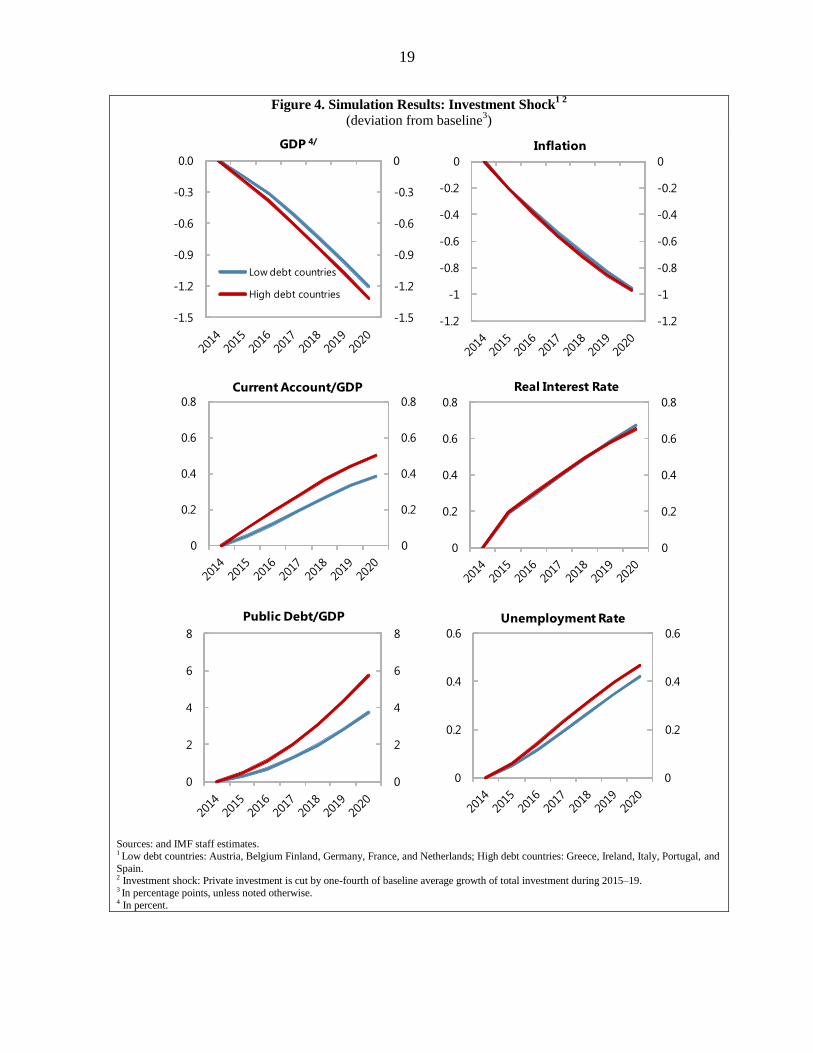
Model simulations first consider a shock to
real private sector investment. Such a shock
could be triggered by a sudden drop in
investor confidence (for instance, due to the
intensification of geopolitical tensions, or
lower expected future output) that reduces
equity prices and private investment
demand so that the euro area countries’
investment growth is cut by one-fourth
relative to baseline projections (text
chart)—equivalent to a half-percentage-
point reduction per year or three percent
cumulatively over the medium term (about
half of the decline in euro area business
investment during 2007–14.)
The investment shock would lower output by around 1¼ percent below the baseline by 2020
(Figure 4)15. The declines in output are broadly similar across all euro area countries, except
for Greece and Ireland where the drop in investment growth is significantly greater compared
to the baseline. The impulse from lower investment growth to aggregate demand comes from
the traditional knock-on effect to households via labor income and wealth effects. In
response, inflation expectations and inflation fall, and financial conditions tighten, with real
corporate interest rates higher by 65 basis points in 2020. In addition, weaker domestic
demand depresses imports, while higher real interest rates lower competitiveness. On
balance, the current account improves by 0.4 percentage points of GDP by 2020. The output
gap would widen by nearly one percentage point, as potential growth is reduced only slightly
due to slower investment growth and capital stock accumulation.
The public debt-to-GDP ratio would rise (by 4½ percentage points) reflecting larger overall
deficits and lower nominal output (text chart). The increase varies across countries, with
highly indebted countries seeing larger increases: Greece (+12 percentage points), Italy
(+5½), Portugal (+5¾) and Spain (+5¼). The more the public debt ratio increases, the greater
are market concerns about debt sustainability. The model thus adds a second shock at the
same time as the private investment shock— an increase of 100 basis points in sovereign
15
The impact on real output per capita growth is the same because the simulations assume the same population
growth as in the baseline.
0.5
0.7
0.9
1.1
1.3
1.5
1.7
1.9
2.1
2.3
2.5
2014 2015 2016 2017 2018 2019 2020
Euro Area Investment Growth
(percent change)
WEO
Scenario
Sources: WEO; and IMF staff estimates.
19
Figure 4. Simulation Results: Investment Shock1 2
(deviation from baseline3)
Sources: and IMF staff estimates. 1 Low debt countries: Austria, Belgium Finland, Germany, France, and Netherlands; High debt countries: Greece, Ireland, Italy, Portugal, and
Spain. 2 Investment shock: Private investment is cut by one-fourth of baseline average growth of total investment during 2015–19. 3 In percentage points, unless noted otherwise. 4 In percent.
-1.5
-1.2
-0.9
-0.6
-0.3
0
-1.5
-1.2
-0.9
-0.6
-0.3
0.0
GDP 4/
Low debt countries
High debt countries
-1.2
-1
-0.8
-0.6
-0.4
-0.2
0
-1.2
-1
-0.8
-0.6
-0.4
-0.2
0
Inflation
0
0.2
0.4
0.6
0.8
0
0.2
0.4
0.6
0.8
Current Account/GDP
0
0.2
0.4
0.6
0.8
0
0.2
0.4
0.6
0.8
Real Interest Rate
0
2
4
6
8
0
2
4
6
8
Public Debt/GDP
0
0.2
0.4
0.6
0
0.2
0.4
0.6
Unemployment Rate

20
and corporate risk premia to capture the
impact of high levels of debt in Greece,
Italy, Ireland, Portugal, and Spain. As a
benchmark, this magnitude is similar to the
increase in Spanish 10-year sovereign bond
yields during late June-July of 2012.
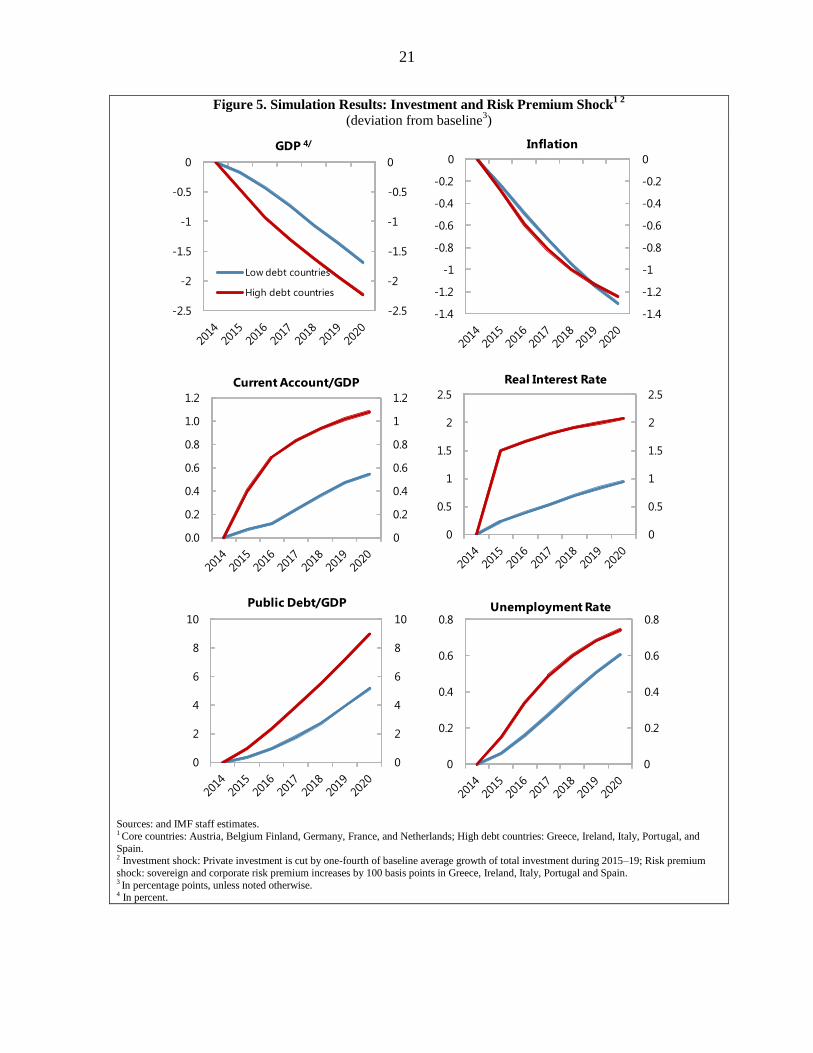
With an additional risk premium shock, the
output loss would increase to nearly two
percent by 2020, compared to the baseline
(Figure 5, Table 1, text chart). The output
gap would widen by around 1¼ percentage
points by 2020 and take an additional three
to four years to close, compared to the
baseline. With no policy response, negative
shocks would push the euro area back into recession. Other results include:
Financial fragmentation. While the risk premium in highly indebted countries is
raised by 100 basis points by design
with this shock, the real corporate
interest rate would increase by 200
basis points in these countries,
reflecting mainly lower inflation.
Unemployment. The unemployment
rate would be higher by 0.6–1.2
percentage points. This is likely a
lower-bound estimate as the model
does not fully incorporate nominal
wage rigidities. Nominal wage inflation
is expected to decline by around
1.5 percentage points for the euro area with some cross-country variations. If nominal
wage rigidities are fully present, employment would have to adjust more in countries
with modest baseline wage growth.
Public debt dynamics. The public debt-to-GDP ratio would also rise more in these
countries (Greece: +17 percentage points; Italy and Portugal: +9; Spain: +8), due to
larger declines in the fiscal balance and nominal GDP, compared to an average
increase of 5¼ percentage points in the core countries.
Both scenarios highlight the potential for moderate shocks to push the euro area into a bad
low growth-inflation equilibrium. In addition to lower output, inflation would also fall close
0
1
2
3
4
5
6
7
0
1
2
3
4
5
6
7
2014 2015 2016 2017 2018 2019 2020
Simulation Results: Public Debt/GDP
(deviation from April 2015 WEO,
percentage points )
Low debt countries 1/
High debt countries 1/
Source: IMF staff estimates.
1/ see definition in Figure 4 footnote 1.
-4.0 -3.0 -2.0 -1.0 0.0
Germany
France
Italy
Spain
Portugal
Greece
Ireland
Euro area
Simulation Results: Impact on GDP
(by 2020, deviation from baseline, percent)
Source: IMF staff estimates.
21
Figure 5. Simulation Results: Investment and Risk Premium Shock1 2
(deviation from baseline3)
Sources: and IMF staff estimates. 1 Core countries: Austria, Belgium Finland, Germany, France, and Netherlands; High debt countries: Greece, Ireland, Italy, Portugal, and
Spain. 2 Investment shock: Private investment is cut by one-fourth of baseline average growth of total investment during 2015–19; Risk premium
shock: sovereign and corporate risk premium increases by 100 basis points in Greece, Ireland, Italy, Portugal and Spain. 3 In percentage points, unless noted otherwise. 4 In percent.
-2.5
-2
-1.5
-1
-0.5
0
-2.5
-2
-1.5
-1
-0.5
0
GDP 4/
Low debt countries
High debt countries
-1.4
-1.2
-1
-0.8
-0.6
-0.4
-0.2
0
-1.4
-1.2
-1
-0.8
-0.6
-0.4
-0.2
0
Inflation
0
0.2
0.4
0.6
0.8
1
1.2
0.0
0.2
0.4
0.6
0.8
1.0
1.2
Current Account/GDP
0
0.5
1
1.5
2
2.5
0
0.5
1
1.5
2
2.5
Real Interest Rate
0
2
4
6
8
10
0
2
4
6
8
10
Public Debt/GDP
0
0.2
0.4
0.6
0.8
0
0.2
0.4
0.6
0.8Unemployment Rate
22
to zero through the medium term, as a result of the wider output gap. Low inflation could
lead to unfavorable debt-deflation dynamics. While not fully captured by the scenarios in this
paper, debt-deflation-like dynamics could occur in countries with high public or private debt
levels. This would further depress demand because low inflation or deflation redistributes
wealth from debtors to creditors, pushing down the economy-wide propensity to consume. It
would also delay the much-needed recovery in business investment and capital stock
accumulation. This in turn lowers potential growth, and would generate a feedback loop that
lowers expected future growth (see, e.g., Barkbu and others, 2015; Kalemli-Ozcan and
others, 2015).
Low inflation would also reverse rebalancing within the euro area. Model results suggest that
current account balances would improve in response to these shocks, but the improvement
would reflect mainly import compression. Moreover, low inflation for the euro area as a
whole would require deflation for the countries that need to achieve relative price adjustment
and redress their loss of competiveness against the surplus countries. Combined with
downward nominal wage rigidities, this would imply more labor shedding, adding to an
already severe high unemployment problem. Downward nominal wage rigidities and the
feedback loop of low inflation are not directly built in the scenarios, suggesting the impact on
output would likely be worse.
V. CONCLUDING REMARKS
The weak medium-term prospect and limited policy space leave the euro area vulnerable to
shocks that could lead to a prolonged period of low growth and inflation. Model simulations
suggest that a modest shock to investor confidence could push up risk premia and real
interest rates, as policy space is constrained at the zero lower bound and fiscal policy space to
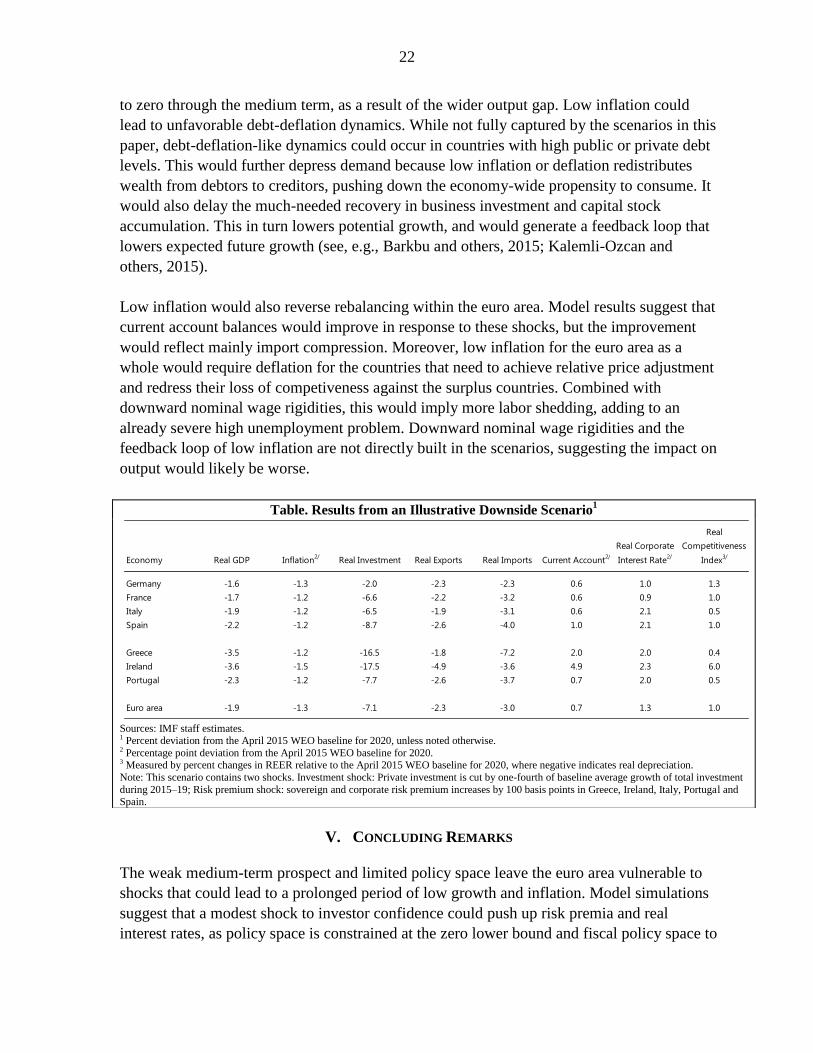
Table. Results from an Illustrative Downside Scenario1
Sources: IMF staff estimates. 1 Percent deviation from the April 2015 WEO baseline for 2020, unless noted otherwise. 2 Percentage point deviation from the April 2015 WEO baseline for 2020. 3 Measured by percent changes in REER relative to the April 2015 WEO baseline for 2020, where negative indicates real depreciation.
Note: This scenario contains two shocks. Investment shock: Private investment is cut by one-fourth of baseline average growth of total investment
during 2015–19; Risk premium shock: sovereign and corporate risk premium increases by 100 basis points in Greece, Ireland, Italy, Portugal and Spain.
Economy Real GDP Inflation2/
Real Investment Real Exports Real Imports Current Account2/
Real Corporate
Interest Rate2/
Real
Competitiveness
Index3/
Germany -1.6 -1.3 -2.0 -2.3 -2.3 0.6 1.0 1.3
France -1.7 -1.2 -6.6 -2.2 -3.2 0.6 0.9 1.0
Italy -1.9 -1.2 -6.5 -1.9 -3.1 0.6 2.1 0.5
Spain -2.2 -1.2 -8.7 -2.6 -4.0 1.0 2.1 1.0
Greece -3.5 -1.2 -16.5 -1.8 -7.2 2.0 2.0 0.4
Ireland -3.6 -1.5 -17.5 -4.9 -3.6 4.9 2.3 6.0
Portugal -2.3 -1.2 -7.7 -2.6 -3.7 0.7 2.0 0.5
Euro area -1.9 -1.3 -7.1 -2.3 -3.0 0.7 1.3 1.0

23
provide stimulus is limited. Moreover, the lingering crisis legacies of high debt and
unemployment could amplify the original shocks, creating a bad feedback loop and keeping
the economy stuck in an equilibrium of stagnation.
Insuring against the risks of stagnation would require addressing both longer-term structural
issues and crisis legacies.16 This suggests continued monetary accommodation to lift demand
and inflation expectations, while strengthening bank and corporate balance sheets to enhance
the effectiveness of monetary transmission, and making use of available fiscal space. To
permanently raise productivity, reforms should aim to address structural gaps in labor,
product, and capital markets. To mitigate the impact of aging, policies should look to raise
labor participation.
16
See 2015 Article IV Euro Area Policies for detailed policy recommendations (IMF Country Report No.
15/204). https://www.imf.org/external/pubs/ft/scr/2015/cr15204.pdf.

24
References
Andrle, M., Blagrave, P. Espaillat, P., Honjo, K., Hunt, B., Kortelainen, M., Lalonde, R.,
Laxton, D., Mavroeidi, E., Muir, D., Mursula, S. and S. Snudden. 2015. “The Flexible
System of Global Models – FSGM”, IMF Working Paper No. 15/64 (Washington,
D.C.: International Monetary Fund).
Ball, L., D. Leigh, and P. Loungani. 2013. “Okun’s Law: Fit at Fifty?” NBER Working
Paper 18668. Cambridge, Massachusetts: National Bureau of Economic Research.
Banerji, A., S. Saksonovs, H. Lin, R. Blavy. 2014. “Youth Unemployment in Advanced
Economies in Europe: Searching for Solutions.” IMF Staff Discussion Notes No.
14/11.
Barkbu, B., P. Berkmen, P. Lukyantsau, S. Saksonovs, H. Schoelermann. 2015. “Investment
in the Euro Area: Why Has It Been Weak?” IMF Working Paper No. 15/32.
Bornhorst, F. and M. Ruiz-Arranz. 2013. “Indebtedness and Deleveraging in the Euro Area.”
Euro Area Policies, 2013 Article IV Consultation Selected Issues, IMF Country
Report 13/232.
Brynjolfsson, E. and A. McAfee, 2014. “Tshe Second Machine Age: Work, Progress, and
Prosperity in a Time of Brilliant Technologies.” 1st
Edition, W.W. Norton and
Company, Ltd.
Dabla-Norris, E., S. Guo, V. Haksar, M. Kim, K. Kochhar, K. Wiseman, and A. Zdzienicka.
2015. “The New Normal: A Sector-Level Perspective on Growth and Productivity
Trends in Advanced Economies.” IMF Staff Discussion Note 15/03 (Washington:
International Monetary Fund).
Pontuch, P. 2014. “Private Sector Deleveraging: Where Do We Stand?” European
Commission Quarterly Report On the Euro Area Volume 13 No 3.
Fernald, J. 2014. "Productivity and Potential Output before, During, and after the Great
Recession." NBER Macroeconomics Annual 2014, Vol. 29. (Chicago: University of
Chicago Press).
Gordon, R. J. 2012. “Is US Economic Growth Over? Faltering Innovation Confronts the Six
Headwinds.” NBER Working Paper 18315, National Bureau of Economic Research,
Cambridge, Massachusetts.
Hall, R. E. 2014. “Quantifying the Lasting Harm to the U.S. Economy from the Financial
Crisis.” NBER Working Paper 19895, National Bureau of Economic Research,
Cambridge, Massachusetts.

25
International Monetary Fund. 2015a. “Where Are We Headed? Perspectives on Potential
Output.” World Economic Outlook, Chapter 3, April 2015.
______________. 2015b. “Enhancing Policy Traction and Reducing Risks” Global Financial
Stability Report, Chapter 1, April 2015.
______________. 2015c. “Housing Recoveries: Cluster Report on Denmark, Ireland,
Kingdom of the Netherlands—the Netherlands, and Spain.” IMF Country Report No.
15/1.
Kalemli-Ozcan, S., L. Laeven and D. Moreno. 2015. “Debt Overhang on Europe: Evidence
from Firm-Bank-Sovereign Linkages,” unpublished manuscript.
Laeven, L., and F. Valencia, 2014, “Systemic Banking Crises.” In Financial Crises: Causes,
Consequences, and Policy Responses, edited by Stijn Claessens, M. Ayhan Kose, Luc
Laeven, and Fabián Valencia (Washington: International Monetary Fund).
McMorrow, K. and W. Roeger. 2014. “The EU’s Growth Prospects in a Globalized
Economy.” ECFIN Economic Brief, Issue 35, June 2014.
Mendez, M. and A. Menendez, 2013. “La Evolucion del Endeudamiento de las Empresas No
Financieras desde el Inicio de la Crisis,” Bank of Spain, Economic Bulletin, January
(Madrid: Bank of Spain).
Mokyr, J., 2014. “What Today's Economic Gloomsayers Are Missing”, Wall Street Journal,
August 8, 2014. http://www.wsj.com/articles/joel-mokyr-what-todays-economic-
gloomsayers-are-missing-1407536487.
Murphy, P. 2014. “Tackling the Corporate Debt Overhang in Spain.” 2014 Article IV
Consultation Selected Issues, IMF Country Report No. 14/93.
van Ark, B., M. O’Mahony, and M.P. Timmer. 2008. “The Productivity Gap between Europe
and the United States: Trends and Causes.” Journal of Economic Perspectives,
Volume 22, Number 1, Pages 25–44.