Risk, VulneRability & Resilience in the limpopo … Climate Change, water and biodiversity – a...
77
CLIMATE CHANGE, WATER AND BIODIVERSITY – A SYNTHESIS RISK, VULNERABILITY & RESILIENCE IN THE LIMPOPO RIVER BASIN
Transcript of Risk, VulneRability & Resilience in the limpopo … Climate Change, water and biodiversity – a...

Climate Change, water and biodiversity – a synthesis
Risk, VulneRability & Resilience in the
limpopo RiVeR basin

Resilience in the limpopo RiveR Basin (Resilim) pRogRam
strengthening the overall resiliency of the limpopo River Basin ecosystems, and the people dependent upon them, is necessary for sustainable development in the region. there is a need to bolster participatory processes built on sound science that effectively incorporates ecological, social and economic aspects of water resource management in the face of climatic change. in addition, there is a need to enhance individual and institutional capacities in order to anticipate and respond to changes in ways that ensure equitable and lasting development.
the Resilience in the limpopo River Basin (Resilim) program provides the United states agency for international Development (UsaiD) the opportunity to collaborate with the riparian countries of the basin to improve management of the basin’s water resources—surface and ground—to meet the economic, biodiversity, and social needs of each country, and, in parallel, support the achievement of the development goals of the limpopo Watercourse commission (limcom) and southern african Development community (saDc). Resilim’s goal is to improve transboundary management of the limpopo River Basin, resulting in enhanced resilience of people and ecosystems. given its current status of a ‘closed’ basin, meaning it has no more resource to allocate, the strategic objective is to open water flows in the basin.
compiled for UsaiD southern africa Resilience in the limpopo River Basin (Resilim) program by oneWorld sustainable investments (pty) ltd
aBoUt oneWoRlD sUstainaBle investments
oneWorld is an african-based sustainable development partner organization focused on adaptive management within the context of a changing climate and increasing resource constraints. With a focus on the science-policy-development interface, the organization has developed skill and experience in translating the overwhelming evidence base of climate change and impact into realistic policy and institutional arrangements. oneWorld constantly seeks ways of achieving in-country and inter-regional objectives whilst accelerating the pace of change.
oneWorld offers applied research, strategic and technical advisory services and accessible publications in support of partners and clients in the climate resilience, climate finance, global governance and in green growth development.
Climate Change, water and biodiversity – a synthesis
Risk, VulneRability & Resilience in the
limpopo RiVeR basin

2015
Climate Change, water and biodiversity – a synthesis
Risk, VulneRability & Resilience in the
limpopo RiVeR basin

aBoUt the aUthoRs
Belynda Petrie, ceo of oneWorld, is an expert and leading figure in regional and international climate change adaptation and mitigation, energy, socioeconomic development and human security. Belynda has pioneered a systematic analysis approach, drawing on economic, social and ecological learnings in the search for solid sustainability solutions to complex transboundary issues. ms. petrie sees stakeholder engagement as a pillar of all attempts to find durable and resilient solutions to the complex challenges facing southern african leaders.
Arthur Chapman is oneWorld’s senior researcher on water; he has managed projects on climate change and regional water resources, climate risk and vulnerability, disaster risk and response, and the impacts of climate change on human health.
Amelia Midgley is a natural resource economist at oneWorld, with a current focus on public and private interactions in the management of biodiversity and ecosystem services. amelia has worked as technical advisor, researcher and analyst on a variety of projects which include resource valuations, climate change finance readiness and risk and vulnerability mapping.
Ruth Parker is currently a technical advisor/researcher at oneWorld. she holds a keen interest in biodiversity and the conservation of Renosterveld – an endangered vegetation type in the cape Floristic Region.
RecommenDeD citation
petrie, B., chapman, a., midgley, a. and parker, R. (2014) Risk, vulnerability and Resilience in the limpopo River Basin system: climate change, water and biodiversity – a synthesis. For the UsaiD southern africa “Resilience in the limpopo River Basin” (Resilim) program. oneWorld sustainable investments, cape town, south africa.
acknoWleDgements
oneWorld would like to thank Resilim chief scientist, Dr. nkobi mpho moleele and Resilim chief of party, mr kule chitepo, for their invaluable review and comments, and the rest of the Resilim management team for their input throughout the work oneWorld did in the limpopo River Basin. this work has been presented to, and discussed with, important Resilim partners. oneWorld wishes to thank limcom (sergio sitoe, and the technical advisors representing the basin countries of Zimbabwe, south africa, mozambique and Botswana at a meeting in Johannesburg in october 2013); the global Water partnership southern africa (Ruth Beukman); and representatives from the UsaiD southern africa office, as the development partner on this program, for their unfailing interaction and insights on the work that has underpinned this synthesis report.
oneWorld would also like to thank habitatinFo (Rob Davies and tim Wroblewski) for their valuable technical assistance with geographic information systems (gis) mapping in the limpopo River Basin.
For their valuable inputs, comments and review, amy sullivan, todd smith and pippa tsilik are thanked.
there are oneWorld team members, not acknowledged as authors to this report, are thanked for their excellent research and analysis, editing, proof reading, brainstorming and logistical support: stephanie midgley, Fiona Wakelin, Dania petrik, sven kreher, andy mason, Webster Whande, simon croxton, monica schlottau and veronica Doyile.
Climate Change, water and biodiversity – a synthesis
Risk, VulneRability & Resilience in the limpopo RiVeR basin
authors: B. Petrie • A. Chapman • A. Midgley • R. Parker
DisclaimeR
the development of this material has been funded by UsaiD southern africa. however, the views expressed do not necessarily reflect the official policies or views of UsaiD southern africa. While reasonable efforts have been made to ensure that the contents of this publication are factually correct, UsaiD southern africa does not take responsibility for the accuracy or completeness of its contents and shall not be liable for loss or damage that may be occasioned directly or indirectly through the use of, or reliance on, the contents of this publication.

Contents pReFace . . . . . . . . . . . . . . . . . . . . . . . . . . . . . . . . . . . . . . . . . . . . . . . . . . . . vi execUtive sUmmaRy. . . . . . . . . . . . . . . . . . . . . . . . . . . . . . . . . . . . . . . viii key messages . . . . . . . . . . . . . . . . . . . . . . . . . . . . . . . . . . . . . . . . . . xii
1 Introduction . . . . . . . . . . . . . . . . . . . . . . . . . . . . . . . . . . . . . . . . . 1 1.1 a systems appRoach – an integRation oF thRee themes. . . . . . . . . . . . . . . . . 1 1.1.1 a systems approach . . . . . . . . . . . . . . . . . . . . . . . . . . . . . . . 1 1.1.2 Why water, biodiversity and climate change in particular? . . . . . . . . . . . . 2 1.1.3 the political economy . . . . . . . . . . . . . . . . . . . . . . . . . . . . . . 2 1.2 the thRee themes: climate change, BioDiveRsity anD WateR . . . . . . . . . . . . . . . 4 1.2.1 climate change . . . . . . . . . . . . . . . . . . . . . . . . . . . . . . . . . . 4 1.2.1.1 climate projections diverge – ccam and echam/cmip . . . . . . . . 4 1.2.2 Biodiversity . . . . . . . . . . . . . . . . . . . . . . . . . . . . . . . . . . . . 4 1.2.2.1 implications of biodiversity hotspots and centers of high endemism
for water resources . . . . . . . . . . . . . . . . . . . . . . . . . . . . 6 1.2.3 Water and water scarcity . . . . . . . . . . . . . . . . . . . . . . . . . . . . . 7 1.2.3.1 groundwater. . . . . . . . . . . . . . . . . . . . . . . . . . . . . . . . 8 1.3 main actoRs, Dynamics anD aReas oF conFlict . . . . . . . . . . . . . . . . . . . . . 9 1.3.1 Why is growth in mining and energy development a potential problem? . . . . 10 1.4 pUtting systems thinking into pRactice in the limpopo RiveR Basin . . . . . . . . . 10 1.4.1 methodology . . . . . . . . . . . . . . . . . . . . . . . . . . . . . . . . . . . 11
2 Vulnerability Mapping and what it tells us . . . . . . . . . . . . . . . . . . . . . . . . . . . 13 2.1 appRoach . . . . . . . . . . . . . . . . . . . . . . . . . . . . . . . . . . . . . . . 13 2.1.1 1st-to-4th order impact Framework . . . . . . . . . . . . . . . . . . . . . . 14 2.2 Resilience action aReas pRoviDe nUance . . . . . . . . . . . . . . . . . . . . . . . 15 2.2.1 Upper limpopo (Botswana and south africa). . . . . . . . . . . . . . . . . . 16 2.2.2 pretoria north – moretele (south africa) . . . . . . . . . . . . . . . . . . . . 17 2.2.3 shashe-limpopo River confluence (Botswana, Zimbabwe and south africa) . . 19 2.2.4 Upper Umzingwane (Zimbabwe) . . . . . . . . . . . . . . . . . . . . . . . . 20 2.2.5 soutpansberg (south africa) . . . . . . . . . . . . . . . . . . . . . . . . . . 22 2.2.6 pafuri triangle (south africa, Zimbabwe and mozambique) . . . . . . . . . . . 24 2.2.7 middle olifants – Former homeland area of lebowa (south africa) . . . . . . 26 2.2.8 lower limpopo (mozambique) . . . . . . . . . . . . . . . . . . . . . . . . . 28
3 Governance in the Limpopo River Basin – a systems approach . . . . . . . . . . . . . . 31 3.1 WateR . . . . . . . . . . . . . . . . . . . . . . . . . . . . . . . . . . . . . . . . 31 3.1.1 the evolution of regimes . . . . . . . . . . . . . . . . . . . . . . . . . . . . 31 3.1.2 a basin-wide regime . . . . . . . . . . . . . . . . . . . . . . . . . . . . . . 31 3.1.3 the regional regime . . . . . . . . . . . . . . . . . . . . . . . . . . . . . . 32 3.1.4 towards decentralized national water structures . . . . . . . . . . . . . . . . 32 3.1.5 stakeholder participation and data sharing in the limpopo River Basin . . . . 33 3.1.5.1 the downstream vulnerability of mozambique . . . . . . . . . . . . . . 34 3.1.5.2 information and communication systems in the limpopo River Basin . 34 3.1.5.3 Regional and Basin-level collaboration . . . . . . . . . . . . . . . . . . 34 3.2 Biodiversity . . . . . . . . . . . . . . . . . . . . . . . . . . . . . . . . . . . . . . 35 3.3 climate change . . . . . . . . . . . . . . . . . . . . . . . . . . . . . . . . . . . . 36
iv
CO
NT
EN
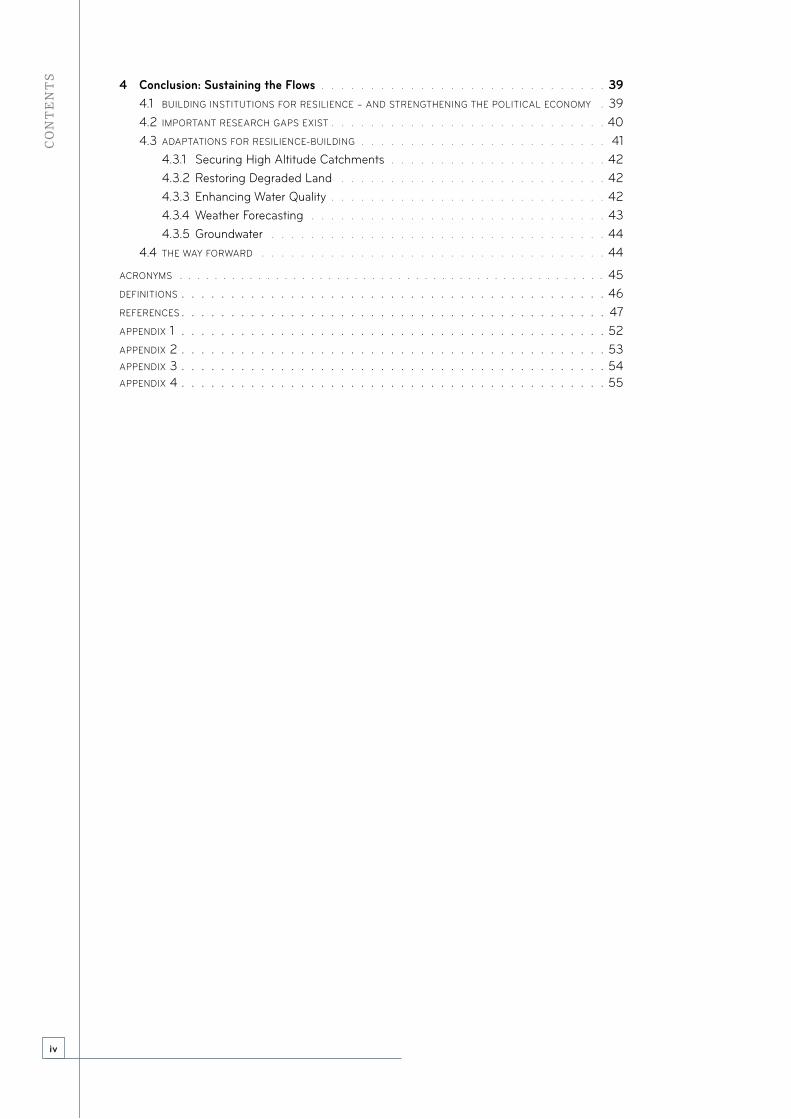
TS 4 Conclusion: Sustaining the Flows . . . . . . . . . . . . . . . . . . . . . . . . . . . . . 39
4.1 BUilDing institUtions FoR Resilience – anD stRengthening the political economy . 39 4.2 impoRtant ReseaRch gaps exist . . . . . . . . . . . . . . . . . . . . . . . . . . . . 40 4.3 aDaptations FoR Resilience-BUilDing . . . . . . . . . . . . . . . . . . . . . . . . . 41 4.3.1 securing high altitude catchments . . . . . . . . . . . . . . . . . . . . . . 42 4.3.2 Restoring Degraded land . . . . . . . . . . . . . . . . . . . . . . . . . . . 42 4.3.3 enhancing Water Quality . . . . . . . . . . . . . . . . . . . . . . . . . . . . 42 4.3.4 Weather Forecasting . . . . . . . . . . . . . . . . . . . . . . . . . . . . . . 43 4.3.5 groundwater . . . . . . . . . . . . . . . . . . . . . . . . . . . . . . . . . . 44 4.4 the Way FoRWaRD . . . . . . . . . . . . . . . . . . . . . . . . . . . . . . . . . . . 44
acRonyms . . . . . . . . . . . . . . . . . . . . . . . . . . . . . . . . . . . . . . . . . . . . . . . . . 45 DeFinitions . . . . . . . . . . . . . . . . . . . . . . . . . . . . . . . . . . . . . . . . . . . 46 ReFeRences . . . . . . . . . . . . . . . . . . . . . . . . . . . . . . . . . . . . . . . . . . . 47 appenDix 1 . . . . . . . . . . . . . . . . . . . . . . . . . . . . . . . . . . . . . . . . . . . 52 appenDix 2 . . . . . . . . . . . . . . . . . . . . . . . . . . . . . . . . . . . . . . . . . . . 53 appenDix 3 . . . . . . . . . . . . . . . . . . . . . . . . . . . . . . . . . . . . . . . . . . . 54 appenDix 4 . . . . . . . . . . . . . . . . . . . . . . . . . . . . . . . . . . . . . . . . . . . 55

v
liS
T O
f f
igu
rE
S/b
Ox
ES
/Ta
bl
ESlist of figures
Figure 1.1 the systemic dimensions of biodiversity, water and climate change represented in the limpopo River Basin, and the external drivers of change . . . . . . . . . . . . . . . 2
Figure 1.2 groundwater levels respond dramatically after heavy rainfalls, indicating that most groundwater recharge takes place after these heavy rainfalls. this example is for the borehole B7mica in the limpopo River Basin, modified after verster (2011) . . . . . . . . . . . . . . . . . . . . . . . . . . . . . . . . . . . . . . . . 8
Figure 1.3 a comparison of various reports into how much water is in the limpopo River Basin, after abstractions, comparing Basson et al., (1997) and görgens and Boroto (1999) with aurecon (2013) . . . . . . . . . . . . . . . . . . . . . . . . . . . . . . . . . . 9
Figure 2.1 the components of vulnerability, after ipcc (2007) . . . . . . . . . . . . . . . . . . . . . . . . . . . . 13Figure 2.2 eight highly vulnerable areas identified as resilience action areas across the limpopo River Basin . . . . 14Figure 2.3 1st-to-4th order of impacts . . . . . . . . . . . . . . . . . . . . . . . . . . . . . . . . . . . . . . . . . 14Figure 2.4 Upper limpopo – 1st-to-4th order impact assessment . . . . . . . . . . . . . . . . . . . . . . . . . . 16Figure 2.5 increasing temperatures are driven by an increasing number of extreme hot days . . . . . . . . . . . . 17Figure 2.6 pretoria north – 1st-to-4th order impact assessment . . . . . . . . . . . . . . . . . . . . . . . . . . . 18Figure 2.7 shashe-limpopo River confluence – 1st-to-4th order impact assessment . . . . . . . . . . . . . . . . 19Figure 2.8 Upper Umzingwane – 1st-to-4th order impact assessment . . . . . . . . . . . . . . . . . . . . . . . . 21Figure 2.9 soutpansberg – 1st-to-4th order impact assessment . . . . . . . . . . . . . . . . . . . . . . . . . . 23Figure 2.10 pafuri triangle – 1st-to-4th order impact assessment . . . . . . . . . . . . . . . . . . . . . . . . . . 24Figure 2.11 middle olifants – Former homeland area of lebowa 1st-to-4th order impact assessment . . . . . . . 26Figure 2.12 lower limpopo – 1st-to-4th order impact assessment . . . . . . . . . . . . . . . . . . . . . . . . . 28Figure 4.1 high-biodiversity, high-runoff catchment areas (green) juxtaposed
against lowland degraded land (red) in the limpopo River Basin . . . . . . . . . . . . . . . . . . . . 43
list of boxesBox 1.1 conservation in the limpopo River Basin. . . . . . . . . . . . . . . . . . . . . . . . . . . . . . . . . . 6Box 1.2 oneWorld Reports for Resilim thus far . . . . . . . . . . . . . . . . . . . . . . . . . . . . . . . . . . 11Box 2.1 temperatures are driven by extremes . . . . . . . . . . . . . . . . . . . . . . . . . . . . . . . . . . . . 17Box 2.2 Building adaptive capacity through tFcas . . . . . . . . . . . . . . . . . . . . . . . . . . . . . . . . 20Box 2.3 challenges faced in the Umzingwane catchment area . . . . . . . . . . . . . . . . . . . . . . . . . . 22Box 4.1 the role of social programs in securing biodiversity . . . . . . . . . . . . . . . . . . . . . . . . . . . 40Box 4.2 adaptations in mozambique . . . . . . . . . . . . . . . . . . . . . . . . . . . . . . . . . . . . . . . 44
list of Tablestable 2.1 climate change, case studies and lessons for the basin as a whole . . . . . . . . . . . . . . . . . . . . 15table a 4.1 exposure indicators used under the categories exposure (present),
sensitivity and adaptive capacity. . . . . . . . . . . . . . . . . . . . . . . . . . . . . . . . . . . . . . 55table a 4.2 sensitivity indicators used under the categories exposure (present),
sensitivity and adaptive capacity . . . . . . . . . . . . . . . . . . . . . . . . . . . . . . . . . . . . . 56table a 4.3 adaptive capacity indicators used under the categories exposure (present),
sensitivity and adaptive capacity . . . . . . . . . . . . . . . . . . . . . . . . . . . . . . . . . . . . . 58

vi
pr
Ef
aC
E
preface
the limpopo River Basin is transboundary, spanning the four southern african countries of Botswana, south africa, Zimbabwe and mozambique. While much of it is arid, with a highly variable climate that is prone to extreme weather, it is also known for its wide diversity of landscapes, biodiversity, wildlife, natural resources and people. the basin contains enormous mineral wealth and agricultural richness, and plays an important role in the economy of the region. however, large parts of the basin are degraded, with densely populated areas reliant on relatively unproductive agriculture. many communities within the basin are impoverished and face limited access to basic services, such as sanitation and education, as a consequence of a legacy of political inequality. Water is scarce in large parts of the basin and polluted in others. these challenges threaten the ecological heritage within the basin, and the sustainability of the livelihoods dependent on it. population growth and development are likely to intensify these problems, and are further exacerbated by climate change.
in recognition of these challenges, the UsaiD southern africa-funded Resilience in the limpopo River Basin (Resilim) program, which commenced operation in June 2012, has the overriding objective to improve the resilience of ecosystems and livelihoods within the basin. the Resilim strategy integrates water management, biodiversity conservation, and adaptations to climate change, with a view to building resilience for the long-term sustainability of the basin. improving the basin’s resilience requires evidence and action – both of which are supported by the Resilim program. this report synthesizes the evidence that has been developed in order to inform investments in, and actions for, building resilience in the limpopo River Basin.
integrated systems analysis underpins Resilim’s approach to developing evidence for action, encapsulated
in this synthesis Report. Understanding the political and livelihood economy of the basin – where the balance of power and decision-making lies – is as critical as deep insights into the nature of the climate risks for the basin’s people, biodiversity and water. a systems view, in which the causal links across different components are examined, looks at how the same approach can deliver multiple benefits simultaneously. this analysis has made use of the research tools of spatially-integrated information, modeling and scenario development, participatory analysis, interviews, field research, and validation processes. the analytical outputs facilitate the identification of investments needed in adaptation and resilience building, as outlined in the final chapter – sustaining the Flows – in this water scarce, transboundary river system.
target audiences include those concerned with transboundary and local governance, those who make decisions on natural resource management, and those who invest in resilience. Readers will learn about the status quo of the basin, as well as the current and future climate risks for water, biodiversity and people. the report goes on to provide some pointers to how higher levels of resilience could be achieved in ways which protect the basin’s natural resource heritage and livelihoods.
this is not only a product of the report authors, Resilim management and UsaiD. it is the culmination of inputs from the various and comprehensive aspects of the Resilim program, from numerous stakeholders in the basin, and particularly from those concerned with protecting the basin’s valuable resources. the authors of this document would like to sincerely acknowledge the way in which such interactions have informed and added to the story told here, and hope that the lessons learned can be applied in ways that benefit all in the basin.

vii
pr
Ef
aC
E
Maputo Pretoria
Gaborone
Bulawayo Zimbabwe
Botswana
Mozambique
South Africa Swaziland
Political boundaries of the Limpopo River Basin

viii
Ex
EC
uT
ivE
Su
mm
ar
y
A snapshot of the Limpopo River Basin highlights existing water scarcity
the limpopo River Basin is a complex transboundary system that supports 18 million people across the riparian states of Botswana, mozambique, south africa and Zimbabwe. it is an important agricultural area, has extraordinary mineral resources and is exceptionally rich from a biodiversity point of view. it also contains portions of south africa’s most important urban and industrial centers. economic growth is accelerating in some basin countries, largely underpinned by developments in the extractive sector, while population growth and urbanization characterize each of the basin countries. this is all supported by an essential and increasingly valuable resource – water. as an increasingly scarce commodity in the basin, water poses the biggest threat to the livelihoods, economies and ecosystems of the river basin system.
particularly visible in the limpopo River Basin are the tight cause-and-effect linkages between climate, biodiversity and water. the basin is mostly semi-arid, with a highly variable climate, and is periodically exposed to severe droughts and floods. it has widely divergent land-use patterns, ecosystems and social, economic and governance systems. its water resources are already over-subscribed; rainfed agriculture relies heavily on the basin for food production and livelihoods are largely based on climate-sensitive natural resources. home to mostly rural communities, poverty is prevalent in the basin, with relatively undiversified economies in some parts, and insufficient public and private resources being directed to the area. as a result, the basin is highly vulnerable to shocks such as resource shortages and climate-related risks.
Resilience is critical in securing a sustainable future for the Limpopo River Basin
the basin has approached water resource closure (meaning there is no more water left to allocate), and thus choices need to be made about the future management of the limpopo River Basin system. Decisions need to be taken on actions that will promote resilience, or strengthen the basin’s ability to recover quickly from disturbances and shocks. the limpopo River provides a shared resource between four countries. given existing scarcity - likely to be exacerbated by climate change – this necessitates careful resource allocation and management. Resilience is increasingly needed at a transboundary level, rather than country by country.
intensive water-related developments, such as irrigated agriculture and mining, have dominated economic
Executive Summary
development in the basin. there is now little water left to allocate to new activities, while demand for resources continues to grow. Water resources are also stressed by other biophysical sub-systems and how these interact. in the basin, these sub-systems are primarily water, biodiversity and climate. a change in one sub-system has significant impacts on the other sub-systems, and often vice versa. the human interface adds further complexity to the system, while the strength of the underpinning governance systems can be a determining factor of the critical thresholds, or tipping points, from which there is no return.
through these drivers of change in the basin, insight into the particular vulnerability of the limpopo River Basin – and why a focus on building resilience is so critical – is gained. this study attempts to understand the ability of the basin – as an integrated, interactive system – to absorb climate and development shocks and adapt to these. this is what will enable the building of resilience in the basin, noting that a highly vulnerable system is one that is highly sensitive to modest changes in climate, and one for which the ability to adapt is severely constrained (ipcc 2000a).
the limpopo River Basin system comprises complex biophysical and human sub-systems, all of which interact to present a composite picture of current levels of resilience. put another way, the state of these interactions demonstrates the basin system’s ability (or inability) to absorb shocks, an important measure of its overall resilience. the objective of this report and its underpinning studies, therefore, is to inform resilience building priorities that can be scaled through the system for maximum basin-wide benefit. the focus is on how the pace of change needs to be accelerated in key aspects of the political economy in the system in order to enable the limpopo River Basin to better absorb shocks, increase overall resilience and avoid tipping points.
Navigating system complexity is facilitated by integrated analysis
a ‘systems’ approach is taken in analyzing the complexities in, and particular vulnerabilities of, the limpopo River Basin system. combined with an analysis of climate risks in the biophysical system, an examination of the political and local economy, as well as the institutional arrangements surrounding the basin system, this approach facilitates an assessment of whether the human system and governance mechanisms in the basin are enablers of, or barriers to, resilience. accelerating the requisite pace of change is more readily achievable when the key drivers of development are

ix
Ex
EC
uT
ivE
Su
mm
ar
y
understood, how decisions are made, where the balance of power lies, and to what extent regional cooperation exists.
geographical information systems (gis) were used to map vulnerability, as this methodology captures the spatial variability of different biophysical, biological (including extreme weather events such as floods and droughts), and socio-economic indicators into models of risk and vulnerability. this analysis revealed an initial set of ten highly-vulnerable areas. eight of these, three of which are transboundary in nature, were selected and validated by limpopo River Basin experts as the pilot study group. each highly-vulnerable area was analyzed in greater detail, primarily with a view to establishing solutions and priorities for action. these detailed analyses of how climate changes cascade through a system, resulting in biophysical and socio-economic impacts, identified the most important drivers of vulnerability in the limpopo River Basin system.
the combined study methodology components provide an integrated platform for understanding the basin’s current and future levels of adaptive capacity and ability to build resilience. importantly, they highlight where resilience building activities are needed most and why, assuming that the objective is to secure the entire basin system.
this synthesis report gathers the evidence, analyzes the data and presents the results, including graphically, which will inform a stakeholder-led process for identifying the adaptation strategies which, if implemented, will build resilience in the limpopo River Basin system.
A glimpse into the future is predicated on current and anticipated vulnerability
By 2025, rapid growth in urban populations and mining and energy projects is anticipated to place enormous pressure on the basin’s water resources. growth in irrigation is expected to remain relatively modest (ashton, et al., 2008). ashton et al. (2008) forecast an increase in water demands in the limpopo River Basin of 46% by 2025, with urban demands rising the fastest. south africa contains 45% of the catchment area, but uses 60% of the total water usage (lBptc, 2010). the current distribution of water usage will grow increasingly more difficult to sustain as Botswana, Zimbabwe, and mozambique experience rapid urban growth and increase large-scale national development projects. there is already little water left to allocate to new activities, but demand continues to grow.
governance and institutional arrangements in this climate sensitive transboundary system are another critical driver of vulnerability. the current situation highlights low adaptive
capacity across the system, heightening the need for building resilience. since the limpopo River Basin is located in the southern african region, it falls under the southern african Development community’s (saDc’s) regional-cooperation-for-development mandate. the recently launched limpopo Watercourse commission (limcom) is the basin’s embryonic river basin organization (RBo) that evolved out of the saDc structures and mandate. Regional cooperation in saDc is founded on post-conflict reconstruction, development and peace-building priorities. at the same time, many countries in the region are enjoying unprecedented levels of post-colonial economic growth and thus, in reality, regional cooperation is characterized by the protection of vested national interests. however, although the basin’s resources are shared by four substantial economic powers, a shared vision for managing the basin has not been established and water benefits are not understood. treaties and agreements do not define water allocations and the current transboundary governance arrangements are not strong enough to promote the extent of resilience building needed in the basin, now or in the future. there is, however, dialogue on the concept of managing the basin’s resources more effectively through shared benefits, but this is unlikely to happen in the absence of a shared vision and appropriate institutional arrangements for coordinating this process.
the institutions needed to reduce vulnerability and enhance and protect the resource base vary considerably across sectors and countries in the basin. policies, while in existence, are poorly harmonized and implemented. poor implementation of policies increases vulnerability and impacts the basin as a whole. Regional policy dialogue is largely facilitated by saDc and the common market for eastern and southern africa (comesa), but interdependent sectors frequently don’t talk to each other.
analysis indicates that no single regional or national institution is grappling simultaneously with the three key threats facing the limpopo River Basin; water scarcity, declining ecosystems services, and climate change and variability. the water sector is significantly more mature; hence water-related institutional arrangements are far more robust.
climate interactions with the other important sub-systems are based primarily on robust, but nonetheless projected, climate changes. how these will scale through the biophysical and human system that is the limpopo River Basin remains to be seen. What is certain is that small changes in climate, for example temperature, can bring a sub-system to a critical threshold, increasing the vulnerability of the system as a whole.

x
Ex
EC
uT
ivE
Su
mm
ar
y
the eight highly-vulnerable areas requiring resilience action highlighted by the mapping process do not just refer to the specific locations identified, but also a much broader area of similarly affected areas – making these highly-vulnerable areas relevant case study areas that are representative of broader, or similar issues in the basin. Water scarcity is a dominant theme across these highly-vulnerable areas, often exacerbated by high human population density, land degradation, pollution, and climate-induced floods and droughts. on the other hand, a biodiversity assessment indicates that zones of high biodiversity (such as the high altitude, highly-vulnerable soutpansberg resilience action area), while vulnerable, hold the key to improving the resilience of ecosystems and people within the limpopo River Basin. in terms of securing water, and therefore the basin, protecting the high altitude catchments is a major priority because of their potential to act as water towers for the basin. in addition to the soutpansberg, these are the Wolkberg, sekhukune mountainland, Drakensberg, strydpoort, and Waterberg in south africa, the tswapong hills in Botswana, and matopos hills in Zimbabwe.
There are key emerging messages for the custodians of the Limpopo River Basin
today, flows in the basin are at risk, and a critical threshold for livelihoods, economies and biodiversity is fast approaching. protecting significant biodiversity has important effects on water quality, and, when done in high altitude catchment areas, efforts have the potential of opening and sustaining flows in the basin. in areas where water is plentiful, biodiversity thrives. Where biodiversity is intact, water tends to be of high quality.
system resilience and adaptive capacity need to be addressed in equal measure. in addition to conservation and restoration efforts, improving adaptive capacity should be a central strategy – conserving the high altitude catchment areas entails better legal protection, prevention of habitat loss, prevention of soil loss and prevention of invasion by alien vegetation. noting that economic development is a primary driver of decision-making in the basin, job creation through biodiversity conservation is the solution most likely to ensure the protection of these zones.
low adaptive capacity is another common characteristic of each resilience action area, primarily because of inadequate planning, infrastructure and weak institutions. at a livelihood economy level, influences such as low agricultural productivity and poor infrastructure heighten the vulnerability of livelihoods and are likely to result in increased
poverty. at a national, political economy level, water pollution is going unchecked, further exacerbating water scarcity. the transboundary political economy is also not coordinated by strong governance and a shared vision for managing the basin’s resources and the discussion on trade-offs is not taking place – partly because it is difficult to have this conversation in the absence of critical analysis.
Securing the Limpopo River Basin requires human and biophysical system investments and action
the way forward is to develop the key adaptive approaches for each of the resilience action areas identified in the vulnerability analysis and representative of related needs in other parts of the basin, using cost-benefit analysis to help identify the most appropriate response measures. a basin-wide investment strategy should emphasize the importance of water producing areas, which are the sustainers of resilience since they generate up to 100 times more runoff per unit area than lower-lying rainfall areas (middleton and Bailey, 2008). maintaining stream flows into lower parts of the catchment, particularly in the dry seasons, defines their importance to the water resources of the basin. this is a strategy that is supported by existing policy and strategy (south africa), and is likely to have support from Botswana and Zimbabwe if increased levels of protection can be afforded to the tswapong hills and the matopos hills respectively.
improving the health of the basin’s biodiversity has the payoff of conserving ecosystem services (water production in the dry season), thereby increasing downstream resilience. importantly, this approach also has transboundary ramifications and benefits, in that conserving areas in one country may lead to increased water flows benefiting countries downstream, while at the same time relieving pressure on upstream demands. the high altitude catchments also house some of the basin’s most important biodiversity, exponentially increasing the social, ecological and financial returns of investing in resilience in these catchments.
in terms of extreme weather, priorities lie in further research and enhanced early warning systems and disaster preparedness. seasonal droughts, already a feature of basin vulnerability, are expected to lengthen and become more intense. (there is a gap in related basin research in that it would be useful to understand how atmospheric circulatory changes and pacific and indian ocean dynamics can be used to derive improved short to medium term projections of the likelihood of drought.) Floods will be unavoidable

xi
Ex
EC
uT
ivE
Su
mm
ar
y
and, since it is likely that people will continue to farm the floodplains, the most effective response will be to target how and where settlements are located, how early warnings are distributed, and what appropriate responses are in the face of an oncoming flood. Flood mitigation can also take the form of restored upstream catchments through land and vegetation repair. such action is pre-emptive and long-term, but aims to reduce the magnitude and occurrence of floods.
strengthened basin-wide governance and institutional arrangements are critical to the future of the limpopo River Basin and to achieving the above recommendations. a shared vision for the basin needs to be facilitated and informed by socio-economic analysis of the benefits of water for all riparians, but primarily for the basin as a whole.
strengthened institutional and regulatory frameworks are needed for increasing the basin’s adaptive capacity, thus improving resilience. the political and livelihood economies will need to be brought closer together in basin decisions, facilitated by a community voice in revised policies and harmonized policies across basin countries.
investing in community-based resilience and biophysical resilience building is a more attractive proposition than investing in institutions and governance. the former is generally less risky and easier to manage, creating the illusion of greater returns. however, securing basin flows for the future requires adaptive institutions, bold governance and protected biophysical systems. at the heart of this study is the finding that water defines the politics, but the political process has not produced more water.

xii
kE
y m
ES
Sa
gE
S
Water scarcity poses the greatest threat to livelihoods, economies and ecosystems of the Limpopo River Basin strong existing demands for surface and groundwater by agriculture, mining and urban use means that there is little surplus water for further development. the river basin is highly sensitive to water shortages.
Water demand is currently so high that the system has become ‘closed,’ meaning that there is little water left to allocate to additional uses or to growing demandthis places existing flows in the basin at risk, threatening livelihoods, economies and biodiversity. the only way to avoid this tipping point is to protect critical biodiversity and what it represents, thereby opening and sustaining flows in the basin.
Sufficient access to water is the most important driver of livelihood vulnerability in the Limpopo River Basin systemWater scarcity is a common factor in all of the representative resilience action areas. an analysis of how climate impacts cascade through a system, from biophysical to socio-economic impacts, further identifies high human population density, land degradation, and climate-exacerbated floods and droughts as the key drivers of vulnerability.
Areas of high vulnerability in the Limpopo River Basin are likely to remain highly vulnerable unless adaptive capacity can be substantially improved the risk and vulnerability mapping has highlighted numerous problem areas in the basin. eight of these – three of which are transboundary in nature – have been selected as being representative of climate vulnerability beyond their geographic locations in the basin. a common characteristic of each is low adaptive capacity, primarily because of inadequate planning and infrastructure, weak institutions and dense populations.
There is a strong relationship between water quantity, quality and biodiversity in areas where water is plentiful, biodiversity thrives. Where biodiversity is intact, water tends to be of high quality. climate changes, which can include reduced rainfall, are likely to negatively affect these relationships through diminished soil water storage and runoff quality.
The areas which have the highest biodiversity and levels of endemism are also those high-altitude areas with the highest rainfall and water runoff per unit areathe first order of business in securing water-production and maintaining hydrological functioning in the basin is to conserve these zones of high biodiversity, as a means of securing the important ecosystem service of sustainable water production. conservation includes better legal protection, prevention of habitat loss, prevention of soil loss and prevention of invasion by alien vegetation.
Biodiversity is more likely to be protected if it is perceived as a way to create jobs and provide incomein developing countries, where public budgets are stretched between social prerogatives perceived to be more-pressing, biodiversity conservation will only occur if it can provide jobs and social development. public works programs are a powerful tool in this regard.
All water users and all key economic sectors will be affected strongly by climate change in the futureclimate change projections of rainfall for the basin are divergent in their outlooks. ensembles of global circulation models (gcms) project strong future warming everywhere, and either moderate wetting or a strong drying. the implications of the projections are that climate change will not help the water scarcity problem in the basin and all water users will be affected. severe flooding will still be a feature of the basin, especially in the lower limpopo region. the ‘low regrets’ adaptation response should be built around the strong drying future scenario.
key messages

xiii
kE
y m
ES
Sa
gE
S
Today, usage of water for irrigation is dominant in the Limpopo River Basin. However, by 2025, this pattern will change significantly – with climate change making water scarcer and scarcer expected growth in irrigation is expected to remain relatively modest, while rapid growth in urban populations, mining and energy projects is anticipated to place enormous pressure on basin water resources. Water demand is expected to increase by 46% by 2025. climate change will further stress the system as drying is projected across the basin.
Climate-smart development and restoration of degraded environments is a long-term but necessary solution in the Limpopo River Basin systemvulnerability mapping indicates that those areas which are degraded, water scarce and densely populated are most at risk from adverse climatic events. low agricultural productivity and poor infrastructure heightens the vulnerability of livelihoods and the likelihood of increasing poverty.
Groundwater provides hope for increasing water supply in the Limpopo River Basin but the sustainability of the resource is limited by under-resourced management and enforcement agencieseffective use of available groundwater is a good short-term solution in the basin, but good stakeholder engagement and enforced legislation is urgently needed to protect the sustainability of this resource. legislation for managing groundwater exists, but is generally not well enforced in the basin. additionally, aquifer characteristics and particularly transboundary aquifers, are not well understood, nor is the recharge rate, which is essential for sustainable management.
Opening up water flows in the basin is critical but counterproductive in the absence of cleaning up or preventing pollutants. Due to the status quo of the basin, freeing up water flows adds more water into an already polluted system. Untreated sewage will only contaminate ‘new’ water in the basin.
High levels of pollution in the tributaries of the Limpopo are threatening communities throughout the basin, as far downstream as Mozambiqueacid mine drainage from defunct coal mines on the mpumalanga highveld, effluent from industrial processes, overloaded waste-water treatment plants which release raw sewerage in the north West, limpopo and gauteng region, as well as agricultural runoff, have created a highly toxic mix of organic and inorganic pollution.
No single regional or national institution is grappling simultaneously with the key threats facing the Limpopo River BasinWater scarcity, declining ecosystem services, and climate change and variability form an interactive system in the basin, requiring coherent, cross-sectoral institutional arrangements and research. the water sector is significantly more mature; hence, the related institutional arrangements are far more robust.
Balancing community needs with a politically coordinated approach to water scarcity is neededvulnerability in communities and ecosystems demands on-the-ground efforts to build resilience. however, this must be balanced with an overarching political approach that encourages transboundary management of the basin’s resources.
A common vision for sharing the benefits of effective transboundary water management is key to overcoming the challenge of accelerated water scarcityRegional cooperation in saDc is predicated by post-conflict reconstruction, development and peace-building priorities. at the same time, many countries in the region are enjoying unprecedented levels of post-colonial economic growth, and the protection of national vested interests takes precedence over regional priorities. Robust institutions to promote regional cooperation will be needed in the basin to minimize risk and vulnerability, and ensure water security.


1
as the limpopo River Basin approaches water resources closure (there is little water left to allocate to different uses), choices need to be made about the future management of the basin and decisions need to be taken on actions that will promote resilience. the basin has been the focus of intensive water-related developments, such as irrigated agriculture and mining expansion. Water crowding has reached severe levels, as has water pollution, indicating water stress. signs suggest that this situation will continue to develop through, for example, a growing population and diversions to mining activities. transformation and use of the land surface will continue. extreme weather events have an especially detrimental effect on rural, often impoverished, inhabitants, and this is likely to be exacerbated by possible future climatic impacts. all of these, and other pressures, point to declining resilience of livelihoods in the basin. the question is how this may be ameliorated. complicating matters is that adaptation activities must be managed within the context of a transboundary river basin, such that the stakeholder countries of Botswana, south africa, Zimbabwe and mozambique all have equitable involvement in management decisions.
this report takes an integrated view of the resources in the basin, as well as some of the key drivers of change. Water, climate change and biodiversity are the focus and the basis for assessing how these elements interact to change the nature of ecosystem provisioning. the inter-relatedness of water resources, biodiversity and climate change, as it affects livelihoods (related to land-use), governance and population growth, is examined as an inter-linked system. a systems approach is thus adopted. the nature and spatial distribution of livelihood vulnerability is documented, with the objective of finding system-wide adaptations that ease the growing constraints of too little water in the basin.
studies such as the aurecon monograph (2013) capture detailed data on the basin’s resource base, especially that of water, whereas the work done in this study seeks to integrate information on the basin in a multidisciplinary way – providing an interpretive analysis of how this diverse range of sectors and stakeholders interact and influence water flows. the approach used encompasses a wide range of primary and secondary research, expert consultations, peer review and interaction with stakeholders from across the basin.
the following chapters describe climate change projections, alongside the nature of some components of biodiversity and water resource activities indicative of change within the basin. this is followed by a description of vulnerability mapping and its outcomes, while the chapter on institutional arrangements examines the milieu in which water resources and biodiversity is managed.
in the conclusion, the arguments focus on how water resources
and biodiversity can combine to create a sustainable solution. other conclusions are drawn, relating to adaptations that include improved management of the environment and aspects of the political arrangements of decision-making within the basin.
1.1 A systems approach – an integration of three themes
1.1.1 A systems approachthe trajectory of the limpopo River Basin over time conveys a picture of increasing difficulty in obtaining sufficient water to satisfy the industrial, agricultural, mining, energy and household needs of all the riparian countries, exacerbated by increasing environmental degradation and climate change concerns. in addition, millions of people are trying to escape poverty, and socio-economic development remains a prerogative in the region.
it is not surprising that the need to protect national interests, and the resources these depend on, is so fierce. growth and development in the region is predicated by increased mining, commercial agriculture and energy development activities. along with livelihoods and a growing population (for example, south africa’s population is expected to grow to 66.4m by 2030 (iss)1), these activities all compete for the same resource.
For all intents and purposes, the basin is currently ‘closed’ and the water budget, particularly pertaining to the south african portion, is in deficit (turton and ashton, 2008; ashton and turton, 2008). While governments of the basin have good intentions with regards to sharing water equitably (as is reflected in their legislation), national plans and actions indicate otherwise, focusing rather on vested national interests through strong development initiatives – pushing the basin into further water crisis.
‘systems thinking’ is used to examine the inter-relationships between the different drivers and sub-systems operating in the basin. Using this approach, alternative pathways are proposed for increasing sustainability and resilience, focusing on the inter-relatedness of water resources, biodiversity and climate change (all critical sub-systems of the basin system), and how these are managed for building overall resilience. Furthermore, systems thinking recognizes that resilience is both critical to, and dependent on, livelihoods and populations (related to land-use), whilst governance (including institutional arrangements) is either a key resilience enabler or barrier.
1 The current South African Government forecast in the National Development Plan is 58,5m by 2030
introduction
1

2
1. i
NT
rO
du
CT
iON 1.1.2 Why water, biodiversity and climate change
in particular? the extent to which livelihoods and economic development depend on functioning ecosystem services (water and healthy biodiversity) and on the effectiveness of the limpopo River Basin system is becoming clearer. so too is the fact that weak governance structures are a significant barrier to building resilience – or even just maintaining functional ecosystems and related services (primarily water). that there is already no more water left to allocate brings the other major pressures or drivers – such as climate change and variability, growing populations and accelerated economic growth – into sharp focus, as these have the potential to shift the limpopo River Basin system (or parts of it) closer to critical thresholds from which there is no return.
the tight linkages between water and biodiversity are evident. climate variability interactions are also clear; recent experiences of severe flooding in parts of the basin have highlighted the knock-on effects for human health, water availability and sanitation, and have eroded biodiversity habitats. linkages with climatic changes are still being explored and are largely based on uncertain projections. chapter 2, ‘vulnerability mapping and what it tells us’, shows how outcomes of certain changes in climate scaling through a system or sub-system can be extrapolated in a robust manner, producing feasible scenarios for use in a risk-based and proactive management approach in the basin.
a oneWorld systems-based study of the limpopo River Basin (2013) shows that biodiversity needs to be protected and enhanced in its own right, as healthy biodiversity in turn promotes and ensures functional ecosystems that yield essential services for development and livelihoods. For example, aquatic biodiversity is more effective at removing nutrient pollutants from water than are ecosystems with low diversity (cardinale, 2011). Further, an intact riparian zone is required as part of this ecosystem service for maintaining
water quality. given that aquatic biodiversity impacts occur throughout the basin, including through the abstraction of water, these are critical considerations for determining rates of abstraction – essentially a transboundary issue.
the particular vulnerability of the limpopo River Basin is that it is mostly semi-arid, with a highly variable climate, and is periodically exposed to severe droughts and floods. it has widely divergent land-use patterns, ecosystems, social, economic and governance systems. its water resources are already over-subscribed; it is over-reliant on rainfed agriculture for food production, livelihoods are largely based on climate sensitive natural resources, it has large poor rural populations and relatively undiversified economies in some parts, and insufficient public and private resources to deal with poverty and shocks. as a result, the basin is highly vulnerable to shocks such as resource shortages and climate-related risks.
1.1.3 The political economyWater defines the politics, but the political process has not produced more water.home to more than 18 million people2, the limpopo River Basin sits astride the shared borders of Botswana, south africa, Zimbabwe and mozambique (aurecon, 2013). it is an important agricultural area, has extraordinary mineral resource reserves and is exceptionally rich from a biodiversity point of view. it contains portions of south africa’s most important major urban and industrial centers – which includes the conurbations within the gauteng province.
Understanding the political economy of the limpopo River Basin requires insight into the human systems (political and local economies) in which the inter-linked biophysical drivers for resilience operate across the four riparian countries. this includes the key elements of decision making, examining who holds what power, how this power is exercized and the implications for resilience. given that the study of climate change is a relatively recent science and that the importance of biodiversity has historically been undervalued, the political economy analysis tends to be dominated by political and livelihood decision making as it relates to water, a much more mature sector and therefore a driver that decision makers understand better.
the heterogeneity of the limpopo River Basin environment, activities and populations translates into a variety of demands on the river basin, both between riparian states and within state borders. Water usage is currently dominated by irrigation – agriculture accounts for the half of total water usage, urban for 30%, and the remaining demand is divided evenly across the rural, mining, and power sectors (lBptc, 2010). however, by 2025, expected growth in irrigation is expected to remain relatively modest, while rapid growth in urban populations and mining and energy projects is anticipated to place enormous pressure on basin water resources (ashton et al., 2008).
at present, south africa contains 45% of the catchment area, but is responsible for 60% of the total water usage (lBptc, 2010). the current distribution of water usage will
3 Note that population figures for the Limpopo River Basin vary in the literature, from between 15 to 20 million people
POPU
LATI
ON
GOVERNANCE
LIVELIHOODS
Water
Biodiversity Climate change
Figure 1.1: The systemic dimensions of biodiversity, water and climate change represented in the Limpopo River basin, and the external drivers of change1
2 Options for Adaptations at Scale in the Limpopo River Basin: A conceptual assessment (OneWorld 2013)

3
1. i
NT
rO
du
CT
iON
grow increasingly harder to sustain as Botswana, Zimbabwe, and mozambique experience rapid urban growth and increase large-scale national development projects.
concerns over water security have escalated into geopolitical conflicts surrounding water allocation in several international river basins (e.g. the mekong, the indus, and the nile). the riparian states of the limpopo River Basin system, however, have yet to experience serious conflict, and have maintained a general environment of cooperation. the absence of hostility gives regional institutions like the southern african Development community (saDc) Water Division (saDc/WD) and the limpopo Watercourse commission (limcom) an opportunity to build a foundation for equitable and responsible transboundary water management before tensions rise. as both institutions continue to build their capacity, the challenge for saDc/WD and limcom will be navigating the political, social and economic aspirations of multiple stakeholders within the region. significantly, the basin is located in the southern african region and falls under saDc’s regional cooperation for development mandate.
Regional cooperation in saDc today is underpinned by post-conflict reconstruction, development and a peace-building focus. it is noteworthy that south africa, an apartheid era protagonist of cross border conflict, has since been playing a key role in post-conflict peace efforts in the region. the country promotes regional cooperation, but its bordering countries (there are five, three of which are in the limpopo River Basin) have not bought into this (lucey and o’Riordan, 2014). in reality, regional cooperation is characterized by the protection of vested national interests and many countries in the region are enjoying unprecedented levels of post-colonial economic growth.
however, conflicts have been few in the past two decades and in the main are resolved through bilateral interventions. in any event, there are no dispute resolution mechanisms or capacities in saDc or the basin. limcom was nested in the saDc framework by referring to the saDc tribunal as a recourse mechanism. however, the tribunal was suspended in 2010, thus removing this recourse mechanism for external mediation3. Furthermore, limcom is an embryonic institution, with no mechanisms or capacity for dispute resolution in place (morck-Jensen and petrie, 2013). But there are other indicators of vested interests prevailing over regional cooperation, evident in resource sector endeavours in the region. the saDc Water Dialogue, maun (2011), with the theme ‘Climate Change as an incentive for regional cooperation’ yielded weak policy outcomes - willingness to share data being a major obstacle. Furthermore, it is evident that the region is good at reaching political level agreements, but these then fall short in implementation (lucey and o’Riordan, 2014). that these agreements often cannot be technically or operationally implemented may well be a capacity issue. however, the mandates often cannot cascade
4 The Tribunal was abolished due to several verdicts against Zimbabwe. The 2012 SADC Summit resolved that a new Tribunal should be negotiated and that its mandate should be confined to interpretation of the four Protocols relating to disputes between Member States (see http://www.sadc.int/about-sadc/sadcinstitu-tions/Tribun). Namibia is the only Zambezi riparian that has not ratified the SADC Water Protocol. At the time of going to press, the Tribunal is in the process of being reinstated.
down as the agreements are ultimately perceived to threaten national interests.
the institutions needed to reduce vulnerability, and enhance and protect the resource base, vary considerably in strength across sectors and countries in the limpopo River Basin. policies often exist but are poorly implemented, increasing vulnerability not only in those locations but impacting on the basin as a whole. there is regional policy dialogue, largely facilitated by saDc and the common market for eastern and southern africa (comesa), but inter-dependent sectors frequently don’t talk to each other (see limpopo River Basin systems matrix, oneWorld); demonstrating that the inter-linked drivers in the region and the basin are under-acknowledged in regional and national policy.
the limpopo River Basin organization (RBo), limcom, comprising four saDc member states – Botswana, south africa, Zimbabwe and mozambique - is embryonic, with the initial ratification of the limcom agreement having been signed in 2003 but operationalization only taking place in 2011. limcom was officially launched in July 2014 and the agreement for mozambique to act as it host country was signed during this launch. accordingly, limcom’s mandate is evolving and the institution is still defining its terms of reference within the dictates of the treaty, as well as within the mandate of its principal, saDc Water. What an RBo should and shouldn’t be can be gleaned from international RBos that have been in place for decades, such as the mekong River commission in asia (morck-Jensen and petrie, 2013), with particular lessons for mandates, roles and responsibilities (conflict management, knowledge platforms and facilitators of data sharing). Developing regions and shared river basins around the world struggle with balancing cross border cooperation and the need to protect vested national interests.
limcom also has to balance its role with that of the myriad catchment and water management agencies that exist across the four limpopo River Basin riparian states. as these riparians have undergone water sector reforms, so these agencies have proliferated, many with little capacity to deliver as countries struggle to transition from highly centralized water sector models to more decentralized approaches.
the management of biodiversity and ecosystems, although highly dependent on water and vice versa, do not fall under the water sector mandate in any of the aforementioned institutional arrangements. nationally, the function typically falls under the mandates of environmental ministries, few of which are directly linked to water ministries, but most of which are also responsible for climate change. at the saDc level, biodiversity and climate change fall under Food and natural Resources (FanR), a secretariat that currently plays a minor role in the regional and continental fight against climate change. Regionally, the international Union for the conservation of nature (iUcn) plays a significant role and is widely recognized, but it does not hold a political mandate.
most regional RBos include climate change as a strategic pillar but few have the capacity to allow for its prioritization in delivery. national environmental ministries hold the climate change mandates. although the climate variability institute (originally Drought monitoring center, now part of the climate services center) was recently moved into the same

4
saDc secretariat as climate change (FanR), this is not the case in the rest of the basin. River Basin organizations and water ministries are expected to co-manage and plan for the eventuality of disasters (particularly since these are largely water-related), but other units, such as ingc4 in mozambique, are designated as being responsible for disaster risk reduction and management. at best, meteorological departments (sometimes housed within environmental ministries) provide early warning systems and seasonal forecasts.
1.2 The three themes: climate change, biodiversity and water
1.2.1 Climate changea comparative analysis of several different climate models (see oneWorld, 2013) and the published results of two global circulation models (gcm) ensemble projections, namely ccam and echam/cmip5, as assessed by midgley et al., (2013) are summarized in the next section. all findings indicate a future warming of the region. this accords with observations by the long-term adaptations scenarios Research programme (ltas), published by the Department of environmental affairs (Dea) ) in south africa. summaries in that document, which represent the latest consolidated overview of observed and projected changes for southern africa (Dea, 2013), indicate that mean annual temperatures have increased at twice the rate reported by the Fourth assessment Report (aR4) of the inter-governmental panel on climate change (ipcc), and warming is expected to continue (Boko et al., 2007). there have been significant increases in the frequency of hot extremes in the basin, decreases in the number of cold extremes, and shifts in rainfall seasonality. overall, there has been an increase in rainfall intensity, as well as in the duration of dry spells, but in particular a reduction of rainfall in march, april and may (mam – the autumn months) – in line with the general projections of trenberth et al., (2003). however, the different gcm ensembles of climate projections for the limpopo River Basin region present different views of how rainfall might evolve. this may be problematic in terms of how decisions on adaptations evolve. the ensembles and projections are discussed in more detail below.
1.2.1.1 Climate projections diverge – CCAM and ECHAM/CMIP
the (dynamically downscaled) cubic-conformal atmospheric model (ccam) regional model ensembles project a significant drying over most the limpopo River Basin, along with the northward displacement of cyclones and tropical low pressures convection systems (malherbe et al., 2013). By 2080–2100, average temperature increases of 3-6°c, relative to the baseline period, are expected for much of the basin under the a2 (Rcp8.5) emission scenario, with interior regions warming more than coastal regions. these are very substantial temperature increases for the region and could be expected to have significant consequences for water resources, agriculture and biodiversity. the echam/
5 Instituto Nacional de Gestão de Calamidades (INGC) – the Government Institute for Disaster Management and Preparedness in Mozambique
cmip ensemble projections, on the other hand, project warming but little change in rainfall, with some slight wetting during march-april-may (mam) and september-october-november (son) quartiles (Davis, 2011).
one ensemble of gcms predicts that much of the basin will become drier; there will be fewer tropical cyclones and risks of flooding, and more frequent droughts (malherbe et al., 2012). the other ensemble considers a general slight wetting of the basin; however, summer drying is consistent in both sets. this dichotomy of views requires that decisions must be taken that are valid for whatever climate future evolves. all climate trajectories project significant warming across the basin (noting the uncertainties relating to the projections), with consequences for water resources management, agricultural water demand and allocations to ecological function.
When the spatially-explicit national and regional level climate projections are consolidated to identify key messages specifically for the limpopo River Basin area, it appears that the basin is likely to become drier, particularly in winter and spring (although, as noted previously, there is uncertainty around the seasonal patterns and magnitude of this trend), and a high likelihood of becoming warmer, especially in spring and more so toward the interior parts of the basin. some models project possible wetting in the upper (western) basin and the lower (eastern) basin, with indications of more frequent extremely wet summers. the start and end of the rainy season will shift, thereby affecting the duration of the rainy season, but the patterns will differ across the basin (malherbe et al., 2012). Rainfall events are expected to become heavier, with increased risks of local and regional flooding. Dry spells and droughts are expected to increase in frequency and severity. the projections for changes in the frequency of tropical cyclones along the mozambique coast remain uncertain, but cyclones could become more intense.
given the dichotomy of views of how rainfall may evolve over the basin, what should be done? the low regrets option suggests that the region should prepare for a significantly warmer and drier future, while bearing in mind that the frequency of intense rainfalls will increase. in later sections on vulnerability mapping in this document, the climate assessment focuses attention on those areas where drought and other climate-related sensitivities are the greatest.
1.2.2 Biodiversity “The primary tactic in conservation must be to locate the world’s hotspots and protect the entire environment they contain.” Wilson, 1992. the limpopo River Basin is exceptionally rich in biodiversity and, as such, has a wide variety of genes, species and ecosystems. the region contains a number of globally important centers of endemism (see, for example, van Wyk and smith, 2001), which are discussed further below. this heritage is threatened through resource degradation caused primarily by human activity. it is well known that climate change will impact on biodiversity and, with this, the ability of biodiversity and ecosystems to provide ecosystem services that support human society. With these impacts in mind, it is important to understand the current state of biodiversity throughout the basin, with a particular focus on areas with
1. i
NT
rO
du
CT
iON

5
high levels of endemism and diversity under threat from humans and development. While it may not be feasible to protect all biodiversity within the basin, focusing attention on biodiversity-rich areas provides a mean of both effective and efficient conservation. such areas often overlap with important water catchment areas, also threatened by degradation, and thus the key to maintaining these ecosystem services is the protection of these biodiversity-rich areas.
Biodiversity patterns have been relatively poorly studied in the limpopo River Basin (Reyers et al., 2002). the region is mostly covered by a savanna biome, which is a tree-grass interaction controlled in part by the seasonal climate in which a long dry season and a shorter wet season affects vegetation-fire dynamics. land degradation in the basin is strongly associated with high population densities and bare ground, primarily defined by communal farming areas. such zones are closely associated with the lebowa and venda areas. indeed, approximately 58% of the limpopo province of south africa was mapped by gibson (2006) as being degraded. the primary land use, particularly of the savanna and grassland vegetation types, is extensive grazing of domestic animals – but of this, 13% is used for commercial and dryland agriculture. it is the grazing areas that are mostly degraded. in the north-western parts of the limpopo River Basin, which includes those parts of south africa and Botswana, continuous grazing has led to bush encroachment. this is a process in which over-stocking and heavy grazing reduces the frequency of grass fires and allows saplings to grow above the flame zone (Bond et al., 2003). trees, shrubs and thicket species invade and thicken open grassland areas, considered a form of degradation, causing a biome shift and a reduction of grazing potential. the savanna biome is heavily utilized by humans, resulting in heightened vulnerability to the effects of climate change on biodiversity. the key biodiversity aspects are, however, the upland catchment areas, which also correlate to centers of endemism and high biodiversity, and are of significant conservation importance. For example, the soutpansberg- Blouberg complex, including nearby Wolkberg, is a center of plant endemism and is extremely diverse (van Wyk and smith, 2001; mostert et al., 2008). Between 2,500 and 3,000 vascular plant taxa comprising 1,066 genera and 240 families occur on the mountains – 68% of all plant families of the entire flora of the southern african region (hahn, 2003). the soutpansberg is also known for the high avian diversity and the location of important breeding colonies of the cape vulture (Gyps coprotheres)), a species under threat at a global level.
Further south, the sekhukhune center of endemism is less well-known, but also important (van Wyk and van Wyk, 1997; siebert et al., 2001, victor et al, 2005). more than 2,200 vascular plants have been reported from the natural vegetation of the region (siebert et al., 2002), with 58 endemic and 70 near-endemic plant taxa. the ultramafic rocks of the Bushveld igneous complex (Bic) are a geological system incredibly rich in minerals, including chromite, and 90% of the world’s known platinum group metals. the soils that derive from these ultramafics usually have low calcium-magnesium ratios and also lack phosphorus, potassium and nitrogen; these chemical characteristics have a crucial
bearing on the diversity of plants found there (siebert et al., 2001). mining has, to date, destroyed about 15% of this vegetation type in the sekhukhune mountain land (siebert et al., 2001). While this region is particularly vulnerable to transformation by mining because of its Bic geology, other areas, such as the soutpansberg-Blouberg, Drakensberg, Waterberg sandstone massif and tswapong hills, are not because they are sandstone-based and mineral poor. the grasslands in Wolkberg and Drakensberg, on the other hand, are vulnerable to grazing pressure.
the Waterberg, strydpoortberg, the lebombo mountains in the kruger national park (along the border with mozambique), and the tswapong hills in the Botswana portion of the basin, bounding on the matobo hills (matopos) in Zimbabwe, are all areas of significant biodiversity.
the matopos hills in Zimbabwe, south of the city of Bulawayo, was designated as a Unesco World heritage site in 2003 as an area of conservation significance, although not necessarily with high botanic diversity. the matopos hills World heritage landscape comprises three types of land ownership, namely state-protected areas (matopos national parks), privately owned land with tenure and communal lands, and state land without individual tenure in the matopos and Umzingwane Districts (Unesco, 2013). each land category is administered by the acts of parliament: Rural District council act (29:13), parks and Wildlife act (20:14), and natural Resources Board act (20:13) respectively. the management of cultural properties falls under the national museums and monuments of Zimbabwe act (25:11), regardless of the land tenure status, while the Department of national parks and Wild life management is responsible for natural resources. While Unesco status provides this area with some form of protection against acts of hostility, reprisal and war, these land-use and ownership structures have varying implications on the ways in which resources are protected, with communal or state land facing the most significant challenges to biodiversity preservation (Unesco, 2013).
in Botswana, tswapong hills is part of the palapye ecological outlier of the soutpansberg (mostert et al., 2008), although geologically it is a remnant of the Waterberg massif system in south africa. Rising 300–400m above the surrounding plain, it receives more rainfall and is relatively water rich, forming the locally important lotsane River and moremi gorge. the flat hill tops absorb rainfall, which then emerges as springs along the base of the feature – giving rise to permanent water streams. the cape vulture breeds at three sites in the hills complex (tyler and Bishop, 1998). the hill feature and related biodiversity is not formally protected; however, the feature and surrounding cultural heritage has been described in an application for listing as a Unesco World heritage site (pending since 2010). again, World heritage site listing offers little support for conservation, in terms of stricter legislation on its use, except in the form of increased awareness of the area’s importance (Unesco, 2013).
the limpopo River Basin is home to exceptional biodiversity in some places, but also shows clear evidence of already degraded land coverage and over-utilized natural resources. With the added pressures of population growth, the strong drive for development throughout the region, and climate change predictions, it is likely that – without future interventions
1. i
NT
rO
du
CT
iON

6
– much more of this biodiversity will be lost or at risk. large losses of biome-optimal bio-climates are projected to occur in the savanna biome areas (oneWorld, 2013), which is noted as a key conservation concern by the south african national Biodiversity institute (sanBi) (sanBi, 2010). climate change will affect both flora and fauna – analyses of animal species range shifts showed that the majority of species will contract their range (some up to 98%). this is especially the case for red-data vulnerable species that are highly susceptible to range change, and therefore highly sensitive to climate change.
1.2.2.1 Implications of biodiversity hotspots and centers of high endemism for water resources
mist-belt forests (afromontane forests), such as those found in the soutpansberg, the Wolkberg (cloud mountain), and along the northern Drakensberg in the south african portion of the limpopo River Basin, are important hydrological modifiers. the Wolkberg mist-belt forests (which include patches of grassland) are about 65,000 hectares in area. the mist-belt appellation refers to the frequent incident of orographic mist, which, condensing on the vegetation at high altitude, can increase total precipitation dramatically. For example, entabeni Forest, a commercial plantation in the soutpansberg, receives about 1,800 mm.yr-1 rainfall. Fog interception boosts total precipitation to about 3,230 mm.yr-1, adding another 1,400 mm for the year (olivier and Rautenbach, 2002; mostert et al., 2008). it is worth remembering that mean annual rainfall at lower altitudes in the basin, such as musina, is around 300 mm. Fog interception by the vegetation alone can add nearly
five times the precipitation to the land surface. mean annual rainfall for the whole limpopo River Basin is around 530 mm and these high altitude catchments have a large impact on the general rainfall statistics.
Bruijnzeel (2004) describes how tropical forests moderate streamflow; firstly, by maintaining a high infiltration rate because of the thick vegetation cover, and a relatively high water storage, released later during the dry season. Baseflow is thus maintained. this ecosystem service of modifying hydrological behavior by the tropical forests is highly valued all over the tropics and sub-tropics (Bruijnzeel, 2004). the mean annual runoff per unit area from the upland catchments is up to 100 times that of the low-lying areas of the limpopo River Basin because firstly, the high rainfall is supplemented by a high fog catch, and secondly the forests maintain a significant baseflow during the dry season. as such, the mist-belt forests and upland grasslands of the basin are of exceptional value to the hydrological resilience of the limpopo River Basin.
ensuring a vegetated land surface reduces the risk of desertification and can result in cooler temperatures, mitigating climate change effects. Desertification results in local climate changes; the potential coupling of the land surface with local climate conditions has negative effects such as declining rainfall, or more intense rainfalls with a longer duration of dry periods. Reducing erosion and sediment transfer through improved land-use management and ecosystem conservation has further benefits for the sustainability of dams and other reservoir storage systems.
governance and property rights, and the manner in which they are implemented, have well-documented effects on natural resource management, with common property experiencing heightened vulnerability to over-exploitation (ostrom, 1990). this can be observed across the basin, with areas under different authorities experiencing varying levels of land degradation and ecosystem functioning. even within protected areas, resource use differs due to different legislation and enforcement. the lekgalameetse provincial park, in the foothills of the Drakensberg mountain Range, for example, allows communal use of land and is prone to overgrazing (visser et al., 2005), while national parks, such as the kruger national park, have stricter land-use regulations and thus lower anthropogenic use. enforcement is, and will remain, a critical aspect of conservation success in the basin where capacity is low and conservation funds are limited. private interests, conservation bodies, such as peace parks and iUcn, and tourism can enable financial support and increase the levels of protection (DFa, 2003).
Driving a coordinated approach to regional conservation are transfrontier parks and transfrontier conservation areas (tFcas). the greater mapungubwe transfrontier conservation area (situated at the confluence of the limpopo-shashe Rivers) and the great limpopo transfrontier park are two such conservation
areas in the basin. tFcas are protected areas that span the boundaries of more than one country, allowing freer passage and migration of animals and humans within the area. these require formal agreements and contracts between countries, as well as coordinated efforts in management, and are expensive to establish. tFcas face the additional management complexities of varying capacities of the countries which share their borders, as well as in the management of stressors such as cross-border poaching and spread of disease (see Box 2.1 on the One Health Approach).
in terms of national efforts, the four countries of the limpopo River Basin have multiple forms of conservation, both formal and informal. contained within the suite of formal conservation initiatives are national parks, provincial parks, nature reserves and marine protected areas. informal protection includes private game reserves and stewardship programs, amongst others.
Unesco World heritage sites (Whs) form an additional layer in conservation efforts across the basin. these are designated areas of exceptional value to humanity. While World heritage site status does not prejudice property rights provided by the national legislation of a country, the title helps raise awareness of the importance of the site, often with positive conservation ramifications (Unesco, 2013).
Box 1.1: Conservation in the Limpopo River Basin
1. i
NT
rO
du
CT
iON

7
conservation of ecosystem functioning and biodiversity has the added payoff of conserving ecosystem services (water production in the dry season), thereby increasing the resilience of downstream settlements, which in turn impacts positively on economic activities in dry periods. the protected areas act (Dea, 2009) lists additional reasons why such conservation is important, including the promotion of rural livelihoods and supporting socio-economic development. the report lists the Blouberg-langian focus area #5 (soutpansberg) and the northeast escarpment focus area #29, which includes the lekgalameetse and Wolkberg reserves. alongside the Waterberg region, these are also areas of concern in this report. protection of all of these areas is an attainable goal; the northeast escarpment and mountain uplands are already owned mostly by the state. increasing protection through improved governance is achievable. much of the Waterberg is already under a level of protection through commercial game farms which protect and manage their operations, and by the Waterberg nature conservancy – a voluntary group of private land owners and interested parties. the Waterberg Biosphere Reserve, as a section 21 non-profit organization formed to promote Unesco’s man and Biosphere program, is an additional governance mechanism which includes provincial and municipal government stakeholders, private individuals and ngos.
all of the areas rich in biodiversity mentioned above are situated along escarpments and mountain ridges which, as major geographical features, also constitute the important high runoff-generating areas. these areas are characterized by higher rainfalls, steep terrains and high rainfall-runoff coefficients – giving rise to high runoff yields. While their value for water generation has been intrinsically recognized through human settlement, the very same activity and exploitation is also causing degradation. a national protected areas expansion strategy seeks to protect these areas of high endemism (Dea, 2010). although it is not the richness of the biodiversity per se that creates the important effect of ecosystem provisioning and regulation that is necessary for preserving water flows in the basin, it provides a powerful spatial indicator of these important services.
1.2.3 Water and water scarcity Water demand exceeded availability in 2000 (ashton et al., 2008), meaning that the basin reached ‘closure’ as there was no more water left to allocate (turton and ashton, 2008). shortfalls are being met by the importation of water via inter-basin transfers and balancing the deficits from the ecosystem allocations. as of 2000, the limpopo had a Water crowding index (Wci) of 4,219, well beyond that of 2,000 which is seen by Falkenmark (1989) as being a marker of water stress and a barrier to further human development. Despite the building of new dams, the limpopo Wci will reach about 4,974 by 2025, further exacerbating the situation (ashton et al., 2008). societies are forced to adapt as they reach the water barrier (Falkenmark, 1989). ashton et al. (2008) forecasts an increase in water demand in the basin of 46% by 2025, with urban demands rising the fastest.
poor water quality in the basin is one of a number of causes of the reduced availability of water for people and aquatic ecosystems (Joint limpopo River Basin study, 2010). effluents from industrial and urban uses in the olifants’ headwaters
around gauteng, and decant of acid mine drainage from defunct coal mines on the mpumalanga highveld result in severe contamination of waters further downstream (mccarthy, 2011). Return flows and runoff from agricultural areas contribute pesticides, herbicides and nutrients to the waters. the parlous state of wastewater treatment plants in the region is causing the large-scale influx of highly nutrient-enriched waters into tributaries of the limpopo River (principally runoff from gauteng province into the crocodile River). this water is heavily contaminated by bacteria and blue-green algae, causing significant losses to farming communities and loss of important product markets. this contamination contributes to excessive loading of sulphates, ammonia, chlorides, ph extremes and unacceptable trophic conditions (related to nutrient loading), making the river waters of main tributaries (such as the crocodile and, in particular, the olifants River) toxic to the healthy functioning of aquatic ecosystems. aquatic biodiversity is particularly sensitive to changes in water quality which, coupled with the temperature and water availability effects of climate change, leave aquatic biodiversity increasingly vulnerable.
in general, impacts on aquatic biodiversity occur throughout the basin through water abstraction, flow, bed and channel modifications, inundation of riparian zones through barrier construction, the existence and invasion of exotic aquatic fauna and macrophytes, addition of pollutants, bank erosion and the removal of indigenous riparian buffer vegetation. Farm dams, particularly in south africa, decrease water flows during the dry season and reduce the integrity of riparian vegetation along ephemeral rivers (o’connor, 2001). Riparian vegetation is a crucial element of ecological functioning and provides irreplaceable ecosystem services - regulating water temperature, reducing turbidity, maintaining biodiversity, nutrient recycling and bank stability. along the river courses throughout the basin, especially in south africa and Botswana, sand mining from river water courses for construction purposes is degrading local environments. this is leading to riparian degradation, including wetland destruction, lowering of water tables, bank erosion, loss of riparian function and increases in water turbidity (kori and mathada, 2013). to date, law enforcement against illegal activities has been weak, while inadequate water management systems compound the issue. especially damaging to general water quality is the poor standard of wastewater treatment plants.
the critical issue to consider from a management point of view is that ambient metal concentrations rise when water levels are low (towards the end of winter and as a result of droughts), and spike during floods when there is increased exposure of suspended sediments to metals adsorption. adverse effects have been experienced 300 kilometers away from the pollutant source, with the consequence that people and ecosystems are exposed to, and challenged by, poor quality water over very large distances. in general, the abstraction of water for irrigation, industrial and urban use compromises water quality in the system by reducing flows and increasing the ambient concentrations of harmful substances. the addition of extra water through the inter-basin transfers at the headwaters of the crocodile and olifants rivers works to benefit the system, because without these inflows, the quality of waters in the rivers could be much worse.
1. i
NT
rO
du
CT
iON
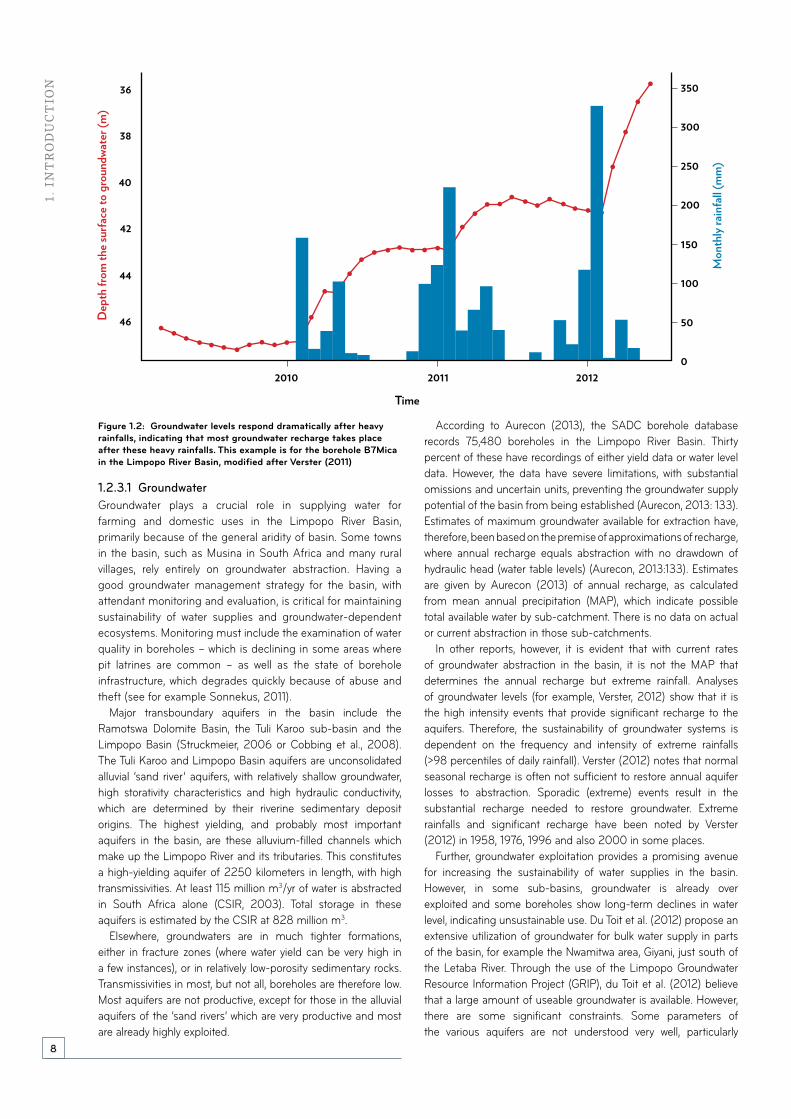
8
1.2.3.1 Groundwatergroundwater plays a crucial role in supplying water for farming and domestic uses in the limpopo River Basin, primarily because of the general aridity of basin. some towns in the basin, such as musina in south africa and many rural villages, rely entirely on groundwater abstraction. having a good groundwater management strategy for the basin, with attendant monitoring and evaluation, is critical for maintaining sustainability of water supplies and groundwater-dependent ecosystems. monitoring must include the examination of water quality in boreholes – which is declining in some areas where pit latrines are common – as well as the state of borehole infrastructure, which degrades quickly because of abuse and theft (see for example sonnekus, 2011).
major transboundary aquifers in the basin include the Ramotswa Dolomite Basin, the tuli karoo sub-basin and the limpopo Basin (struckmeier, 2006 or cobbing et al., 2008). the tuli karoo and limpopo Basin aquifers are unconsolidated alluvial ‘sand river’ aquifers, with relatively shallow groundwater, high storativity characteristics and high hydraulic conductivity, which are determined by their riverine sedimentary deposit origins. the highest yielding, and probably most important aquifers in the basin, are these alluvium-filled channels which make up the limpopo River and its tributaries. this constitutes a high-yielding aquifer of 2250 kilometers in length, with high transmissivities. at least 115 million m3/yr of water is abstracted in south africa alone (csiR, 2003). total storage in these aquifers is estimated by the csiR at 828 million m3.
elsewhere, groundwaters are in much tighter formations, either in fracture zones (where water yield can be very high in a few instances), or in relatively low-porosity sedimentary rocks. transmissivities in most, but not all, boreholes are therefore low. most aquifers are not productive, except for those in the alluvial aquifers of the ‘sand rivers’ which are very productive and most are already highly exploited.
according to aurecon (2013), the saDc borehole database records 75,480 boreholes in the limpopo River Basin. thirty percent of these have recordings of either yield data or water level data. however, the data have severe limitations, with substantial omissions and uncertain units, preventing the groundwater supply potential of the basin from being established (aurecon, 2013: 133). estimates of maximum groundwater available for extraction have, therefore, been based on the premise of approximations of recharge, where annual recharge equals abstraction with no drawdown of hydraulic head (water table levels) (aurecon, 2013:133). estimates are given by aurecon (2013) of annual recharge, as calculated from mean annual precipitation (map), which indicate possible total available water by sub-catchment. there is no data on actual or current abstraction in those sub-catchments.
in other reports, however, it is evident that with current rates of groundwater abstraction in the basin, it is not the map that determines the annual recharge but extreme rainfall. analyses of groundwater levels (for example, verster, 2012) show that it is the high intensity events that provide significant recharge to the aquifers. therefore, the sustainability of groundwater systems is dependent on the frequency and intensity of extreme rainfalls (>98 percentiles of daily rainfall). verster (2012) notes that normal seasonal recharge is often not sufficient to restore annual aquifer losses to abstraction. sporadic (extreme) events result in the substantial recharge needed to restore groundwater. extreme rainfalls and significant recharge have been noted by verster (2012) in 1958, 1976, 1996 and also 2000 in some places.
Further, groundwater exploitation provides a promising avenue for increasing the sustainability of water supplies in the basin. however, in some sub-basins, groundwater is already over exploited and some boreholes show long-term declines in water level, indicating unsustainable use. Du toit et al. (2012) propose an extensive utilization of groundwater for bulk water supply in parts of the basin, for example the nwamitwa area, giyani, just south of the letaba River. through the use of the limpopo groundwater Resource information project (gRip), du toit et al. (2012) believe that a large amount of useable groundwater is available. however, there are some significant constraints. some parameters of the various aquifers are not understood very well, particularly
Figure 1.2: Groundwater levels respond dramatically after heavy rainfalls, indicating that most groundwater recharge takes place after these heavy rainfalls. This example is for the borehole B7Mica in the Limpopo River Basin, modified after Verster (2011)
1. i
NT
rO
du
CT
iON 350
300
250
200
150
100
50
0
36
38
40
42
44
46Dep
th fr
om th
e sur
face
to g
roun
dwat
er (m
)
Mon
thly
rain
fall (
mm
)
2010 2011 2012
Time

9
transboundary aquifers. Botha (2009) illustrates this, highlighting that storativity differences could result in very large differences of water available for abstraction. how much is not known. in the mzingwane River sub-catchment, there is heavy groundwater abstraction in the headwaters of the catchment. elsewhere, most of the abstraction is from shallow alluvial aquifers (<15m deep). in the Botswana sub-catchments, groundwater plays a very important role in maintaining livelihoods, but there is deep concern over the sustainability of these aquifers and recharge rate given the low rainfall there. in mozambique, in the lower limpopo Basin region, there are mixed results regarding the groundwater resources. near the limpopo River, shallow aquifers are influenced by the river and are valuable sources of water. Further away from main channel, in more remote areas of the gaza province, boreholes tend to be deep (down to +90m) and groundwater is often saline, a result of the marine origin of the sedimentary rocks. this makes further exploitation of this water untenable.
climate change will likely have a large impact on groundwater in the basin if it affects the rate of recharge. this will happen primarily if climate change affects the frequency and intensity of severe weather - in other words, whether storms can generate sufficient surface flow to produce adequate pulses of percolating water which penetrates beyond the root zones of most plants; contributing to rising water levels. it has already been observed that groundwater levels respond strongly to severe storms. While these generate large floods, they also contribute the critical component of recharge required for sustainable groundwater resources. minor storms appear to have little impact.
1.3 Main actors, dynamics and areas of conflict
south african water resources saw particularly rapid development in the 1960s and 1970s. this was especially due to the series of large dams constructed in the basin for the purpose of irrigated agriculture, and urban and industrial uses
in the economic heartland of the country (now gauteng), with its gold mines and associated industry. Despite the current situation of scarcity and deficits, the central water authority in south africa has a substantial development plan for the south african portion of the basin (DWa, 2013 – Final strategic plan). there is ongoing activity in planning and building water resources infrastructure and bulk distribution in order to meet the growth in demand.
given the intensifying competition for water within the basin, it is useful to explore the nature of developments and how these give rise to competition for the resource – and potential for conflict. the mining and energy sectors currently require relatively small amounts of water resources from the basin, accounting for 10% of total water usage (lBptc, 2010). however, the expected growth of water demand in these sectors is significant: by 2025 mining is anticipated to grow by 30% and power generation by 26% (ashton et al., 2008). Botswana’s rapidly growing urban and industrial sectors are, at present, placing the greatest demand on total water demanded in the basin (lBptc, 2010).
mega-infrastructure projects in south africa (spending > R300 million/yr) includes the completion of the De hoop dam on the steelpoort River and the construction of bulk raw water distribution infrastructure, with the expectation of delivering water to more than three million people in the greater sekhukhune, Waterberg and capricorn District municipalities (lebowa – middle olifants) (DWa, 2013). the first phase of the crocodile River (West) water augmentation project is also underway to supply the new medupi power station in the Waterberg coal fields, as well as the lephalale local municipality and industry (DWa, 2013). the groot letaba water resource development project, the matoks regional bulk scheme, magalies Water (a water servicers entity), and the Waterberg regional bulk scheme (including increased exploitation of groundwater) are all mentioned in the most recent Department of Water affairs (DWa) strategy documents
Annual flow (million m3/yr)
Ephemeral and episodic flowPerennial flow
Inter-basin transfer288
Marico50 40
Notwane 24 62
Bonwapitse 15 81
Matlabas21 46
Mahalapswe 13 13
Mokolo117 165
Lotsane62 22
Lephalala99 67
Motloutse111 86
Mogalakwena79 127
Shashe462 369
Sand38 40
Mzingwane350 260
Nzhelele89 70
Bubi53 187
Luvuvhu492 456
Mwenezi256 332
Letaba574 379
Changane315 543
Steelpoort400 285
Xai Xai 4,055 4,072
Olifants1,233 559
Crocodile205 399
120
Figure 1.3: A comparison of various reports into how much water is in the Limpopo River basin, after abstractions, comparing Basson et al., (1997) and Görgens and Boroto (1999) (black) with Aurecon (2013) (red). These values consider surface water only.
1. i
NT
rO
du
CT
iON

10
(DWa, 2013). of concern is the change in the assessed quantity of water by various modeling studies (see Basson et al. 1997, görgens and Boroto, 1999, and aurecon, 2013), implying that there is actually more surface water available for exploitation in some places than before. the difference in some tributaries is substantial – questions need to be asked about the large discrepancy (see Figure 1.2). this figure reflects only available surface water because the total quantity of groundwater abstraction is not known. the total quantity of groundwater abstraction is not known, as stated earlier.
currently, at less than 2% of total demand, mozambique’s water requirements for mining and industry from the limpopo River Basin are negligible (lBptc, 2010). however, recent discoveries of large deposits of coal and natural gas in the lower limpopo catchment will alter mozambique’s development trajectory significantly and impact future water requirements. Furthermore, water resource development plans are set to increase the demand for water in the near future and place additional stress on the sub-catchment area. these include development plans for the massingir dam, which forms the southern border of the parque nacional do limpopo, of hydropower build of 27mW (Reuters, 2012). in addition, the massingir agro-industrial project (mai), a sugar plantation and mill covering 37,000 ha – scheduled to begin production in 2016 – will place a heavy demand on the dam’s resources (allafrica, 2012). mai is to be established in the same area once demarcated for procana, the now-cancelled biofuels project, which was plagued by issues related to both the displacement of communities and political issues surrounding the high water requirements of the project.
1.3.1 Why is growth in mining and energy development a potential problem?
each of the four member countries within the limpopo River Basin have ambitious national development plans that rely heavily on the exploitation of mineral resources as a means to provide energy security, job creation, and economic growth. each member state’s water allocation system reserves a set amount of water usage for environmental flows and household users, and requires large-scale commercial users in areas of agriculture, mining, energy, or industry to apply for a water usage permit from the national Department of Water affairs. this provides a binding legal agreement to limit commercial water usage and ensures enough resource is left for domestic use. in reality, these systems are flawed: in 2010, the south african parliament uncovered that 125 mines in south africa were operating without a water license (morgan, 2011). currently there are a total of 1,717 mines which are operating and registered (DmR, 2014). in Botswana, increased mining production (for example, coal at morupule) already places a high demand on water resources, while some mines (for example, lerala diamond mine) operate without a licence to abstract water from the limpopo River (DWa & mmeWR, 2013). mining and energy development is complicated further by the growing role of foreign investors in the basin, particularly in extractive sectors, with their own national and commercial interests in mind. the resulting power dynamic places considerable weight behind economic growth objectives and individual profit seeking, causing mineral and energy development objectives to take precedence over
environmental and water management concerns. economic growth objectives, in particular, tend to outweigh the need for sustainable resource management as governments facilitate or fast-track mineral and energy developments in spite of environmental considerations (ashton et al., 2008). long-term and cross-sectoral planning is not evident for either mining or energy, or for sustainable natural resource management.
1.4 Putting systems thinking into practice in the Limpopo River Basin
the sub-systems of water, ecosystems and climate are tightly linked and inter-related in the basin; a change in one has significant impacts on the others; and often vice versa. there are few or no buffers in this system of linkages in this region, with the result that small changes in an input pathway usually leads to clearly observable impacts on output pathways or products (see the 1st-to-4th order climate impacts analyses outlined in chapter 2).
changes in one sub-system (illustrated in Figure 1.1) affect the behaviour of another. typically in the basin, demand from a sub-system exceeds supply, placing the interlinked system in deficit. alternatively, constraints exist in a dimension or sub-system by the limits exerted by one or more of the others. this risk and vulnerability assessment interrogates the interactions between climate change and ecosystems, between water and ecosystems, and between water and climate change. it also evaluates the influence of the external drivers (of this conceptual system) on the inter-relationships of the system – governance, economic development and livelihood needs, and population dynamics and growth (including economic effects).
an obvious, general trend across the system is the decline in per capita quantity of water available to meet the needs of society. climatic impacts projected for the basin are likely to exacerbate this trend; it is evident that the governance mechanisms and livelihood responses currently operating there are not equipped to enhance system recovery from severe disturbances, for example extreme weather.
moreover, the issues and agendas of political and livelihood economies often don’t coincide and the local economy typically has little voice in the political economy. this is a governance issue of particular significance in the context of a changing climate that affects both economies – and is possibly a reason that the internationally highly acclaimed integrated Water Resource management (iWRm) approach has not gained the traction and delivered the benefits it could have (morck-Jensen and petrie 2013). this will be further investigated in the next phase of analysis of the resilience action areas.
the limpopo River Basin system is complex, necessitating a more in-depth analysis of the political economy, and the resilience building responses that are appropriate to the context and which meet the needs of the region.
a first glance indicates that no single regional or national institution is grappling with the three key threats facing the basin: water scarcity, declining ecosystems services, and climate change and variability. it is also evident that there is little connectivity between the institutions responsible for the key system drivers. a system view, or an examination of
1. i
NT
rO
du
CT
iON

11
the linkages between different actors within the system and the inter-relationships operating in the basin, demonstrates how changes in one part of the system affect those elsewhere. previous studies have generally presented compartmentalized views on aspects of the basin; one of the major shortcomings of this silo approach is that consequences and system-wide side effects have not been addressed. the value of the Resilim program is that it is designed to alter this status quo by addressing the inter-relationships of water, biodiversity and climate change. the systems approach adopted under the Resilim program is built on a number of underpinning studies (see Box 1.1). all of these come together in the balance of this report.
1.4.1 Methodologythe Resilim program has taken a rigorous approach to building an evidence base for change through primary and secondary research. this has been complemented by stakeholder consultation and participatory analysis across the basin. a comprehensive literature review provided insight into the status quo of the basin – its water users, development prospects, as well as risks and vulnerabilities. Risk and vulnerability mapping, using geographical information systems (gis), formed a spatial picture of climate risk and vulnerability across the basin. the expert review of these findings provided critical, in-depth insights into highly vulnerable areas in the basin. through the combined process of risk and vulnerability mapping and expert consultation, eight resilience action areas emerged as areas of heightened vulnerability. these areas were used as a means of understanding more localized vulnerabilities across the basin, as well as ways in which basin-wide resilience could be built through replication and scale.
governance and institutional arrangements are central to understanding how the system functions, what its levels of adaptive capacity are, and how decisions are made within the basin. the political economy analysis, augmented by institutional mapping across the three themes of water, biodiversity and climate, has improved insights into basin risk and vulnerability. even more importantly, this analysis provides a basis for determining critical courses of action and how these may best be implemented. these analyses provided the analytical basis for the first published report: ‘Risk, vulnerability & Resilience in the limpopo River Basin: climate change, Water and Biodiversity – a synthesis’ (petrie et al, 2014). .
validation and re-infoming analytical findings is an ongoing, crucial part of the process. a closer look at the findings of the political economy and institutional mapping highlights how extensive the network of stakeholders (public, private sector and civil society) – integral to decision making in the limpopo River Basin system – is. the oneWorld research team met with communities in different case study areas in the basin, and the Resilim management team regularly interacts with basin stakeholders. additionally, three regional workshops focused on decisions needed for improved water management, strengthened climate policy and entrenched conservation practices in the basin. these workshops were held in maun, Botswana (april 2014), hwange, Zimbabwe
(may 2014), and maputo, mozambique (July 2014). a review of the most current data, now including the recently published limpopo monograph study, updated the research behind this revised synthesis report and informed future strategy. peer reviews have been conducted at all stages of this work.
Box 1.2: OneWorld Reports for RESILIM thus far
1. Synthesis Report on Spatial Climate Risk & Vulnerability Assessments conducted in the Limpopo River Basin (comparative analysis – 30 June 2013): this report presents the results of a desk review of existing spatial climate risk and vulnerability assessments, which are relevant to the limpopo River Basin. the purpose was to consolidate the sources of data and knowledge, analyze each approach (at conceptual, methodological and technical levels), and draw out the various purposes, methodologies, strengths and weaknesses.
2. The Limpopo River Basin System: Climate Impacts and the Political Economy (technical report – 02 september 2013): this report produces the research and analysis of the biophysical, economic and socio-political system which characterizes each identified vulnerable area and gives rise to its identified vulnerability. it further analyzes the political economy governing the basin as a system, providing a political economy context to the identified hotspots and potentially contributing to the status of each as a ‘tipping point’, or sub-system that has crossed or is likely to cross a critical threshold.
3. What does Climate Change mean in the Limpopo Basin? (technical report – 15 november 2013): this consolidated report of the eight identified vulnerable areas forms part of the evidence base for the participatory process - embedded in the systems view of the basin system, including socio-political and bio-physical attributes and dynamics. the outcome of this analysis should help the Resilim program assist limcom in developing effective responses within the basin by the various responsible entities, which would be aimed at preventing shifts of hotspots to ‘tipping-point’ status.
4. Options for Adaptations at Scale in the Limpopo River Basin: A conceptual assessment (think piece – 15 november 2013): in this conceptual assessment a systems approach was used to examine the different drivers operating in the limpopo River Basin system and propose alternative pathways to increasing sustainability. the context, however, is that resolving the drivers of vulnerability requires interventions that are system-wide and not necessarily at the places where they converge, which are locations of increased vulnerability.
1. i
NT
rO
du
CT
iON

wa
TE
r r
ES
Ou
rC
ES
12
wa
TE
r r
ES
Ou
rC
ES
12

13
2
mapping the limpopo River Basin by vulnerability indicators shows that, in broad terms, the most important driver of vulnerability is sufficient access to water. Different states of vulnerability are explained by land degradation, population density and high reliance on rainfed agriculture, all of which vary strongly across the basin.
the scientific basis for policy development and decision-making at national, regional and local levels addressing livelihood vulnerability in southern africa has generally been poor (midgley et al., 2012). one reason is that there is little understanding of how vulnerability differs across a region and what key drivers cause that spatial variation. increasing the resilience of a system that includes people requires an understanding of their exposure to externally imposed stresses and shocks. stresses tend to be chronic, while shocks may be relatively short lived (such as floods or droughts). the measures need to be represented in ways that convey understanding and illustrate the concept that interventions require a focus on the most affected areas. locating the different ranges of vulnerability must therefore also take into account the widely divergent climates, land-uses and natural resources, as well as the local social and economic systems of an area – in this case, the area spanning the limpopo River Basin.
2.1 Approach
vulnerability mapping is a spatial modeling process which combines variables of exposure and sensitivity to give a picture of climate-related impacts (Figure 2.1). the process of vulnerability mapping makes use of a range of indicators, including biophysical, biological and socio-economic factors, and combines them with different weightings into one index. the indicators vary spatially, which means that the final vulnerability index can be displayed as a map. combined with a model of adaptive capacity, the maps provide insights into which adaptive responses are likely to have the highest impacts on livelihoods and the environment.
the capacity of the system (human and natural) to adapt to changing environmental conditions is referred to here as adaptive capacity and is differentiated from coping. coping is about the ability of a system to draw on existing resources (such as knowledge) in responding to stresses, thus maintaining the status quo.
the combined layers of exposure (includes variables such as exposure to cyclones and risk of floods), sensitivity (includes variables such as crowding on agricultural land and water stress), and adaptive capacity (includes variables such
as governance and economic wealth) present a composite picture of risk and vulnerability for the region. areas that have lower adaptive capacity and higher vulnerability emerged as representative areas useful in exploring localized challenges and potential adaptation responses in the basin that are scalable and/or replicable.
VuLNEraBiLiTyExposure
Sensitivity
adaptive capacity
Potential impact
Figure 2.1: The components of vulnerability, after IPCC (2007).
these highly vulnerable areas were reviewed by basin experts using the key themes underpinning Resilim; this resulted in the selection of the following eight resilience action areas (see Figure 2.2): 1. Upper limpopo – a transboundary groundwater-
dependent ecosystem 2. pretoria north – moretele – an unserviced peri-urban
human settlement3. shashe – limpopo river confluence – a transboundary
management priority4. Upper Umzingwane – a highly populated area reliant
on subsistence agriculture5. soutpansberg – a mountainous water source area and
hotspot of biodiversity and endemism6. pafuri triangle – a transboundary zone of diverse
ecosystems and subsistence agriculture7. middle oilfants (Former homeland area of lebowa) – a
highly populated area reliant on subsistence agriculture8. lower limpopo – chokwe – a floodplain with an
intensive agricultural system.
the processes leading to this outcome are fully-described in midgley et al. (2013). the final outcomes are composites of up to 52 indicator layers represented as gis maps (see appendix 4).
vulnerability mapping and what it tells us

14
Figure 2.2: Eight highly vulnerable areas identified as resilience action areas across the Limpopo River Basin: 1) Upper Limpopo, 2) Pretoria North – Moretele, 3) Shashe – Limpopo river confluence, 4) Upper Umzingwane, 5) Soutpansberg, 6) Pafuri Triangle, 7) Middle Olifants and 8) Lower Limpopo – Chokwe
2.1.1 1st-to-4th Order Impact Frameworka method is required to examine the flow-through from climate effects to ecosystem and livelihood impacts. the 1st-to-4th order impact framework is used to do this.
this method of evaluation makes explicit the linkages between basic climate parameters (1st order), the resulting physical and chemical processes in the physical and biotic environment (2nd order), the resulting ecosystem services and production potential (3rd order), and finally the resultant social and economic conditions (4th order). Feedbacks exist between the orders. the 1st-to-4th order impact levels are defined as shown in Figure 2.3.
4
3
5
87
1 2
6
3rd order impacts: Ecosystem services, agricultural productivity, crop and livestock health 3rd
order
4th order impacts: Human health, livelihoods, poverty, coping strategies, conflict, most vulnerable people, interaction with other drivers of change, macro economy
4th
order
2nd order impacts: Physical and chemical processes in physical and biotic environment including soil and water resources
2nd
order
1st order impacts: Basic climatic parameters eg. temperature, rainfall 1st
order
CurrENT
Figure 2.3: 1st-to-4th order cascade of impacts
2.
vu
lN
Er
ab
iliT
y m
ap
piN
g a
Nd
wh
aT
iT
TE
ll
S u
S
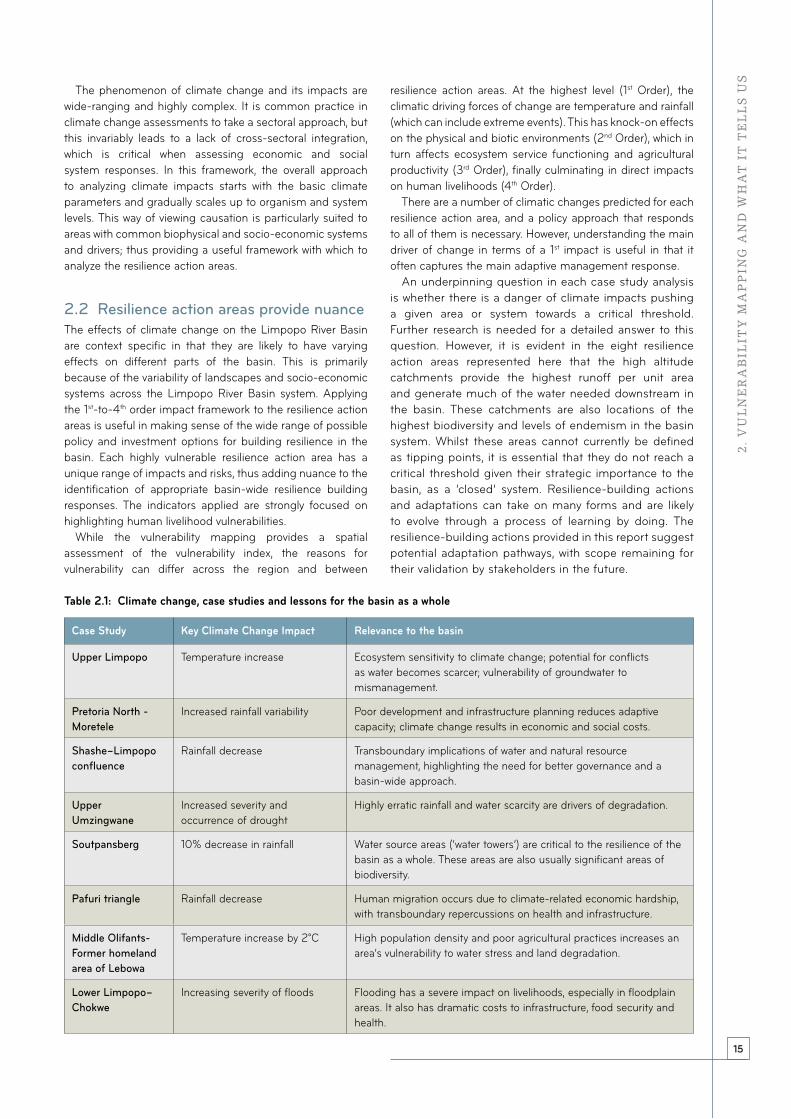
15
the phenomenon of climate change and its impacts are wide-ranging and highly complex. it is common practice in climate change assessments to take a sectoral approach, but this invariably leads to a lack of cross-sectoral integration, which is critical when assessing economic and social system responses. in this framework, the overall approach to analyzing climate impacts starts with the basic climate parameters and gradually scales up to organism and system levels. this way of viewing causation is particularly suited to areas with common biophysical and socio-economic systems and drivers; thus providing a useful framework with which to analyze the resilience action areas.
2.2 Resilience action areas provide nuancethe effects of climate change on the limpopo River Basin are context specific in that they are likely to have varying effects on different parts of the basin. this is primarily because of the variability of landscapes and socio-economic systems across the limpopo River Basin system. applying the 1st-to-4th order impact framework to the resilience action areas is useful in making sense of the wide range of possible policy and investment options for building resilience in the basin. each highly vulnerable resilience action area has a unique range of impacts and risks, thus adding nuance to the identification of appropriate basin-wide resilience building responses. the indicators applied are strongly focused on highlighting human livelihood vulnerabilities.
While the vulnerability mapping provides a spatial assessment of the vulnerability index, the reasons for vulnerability can differ across the region and between
resilience action areas. at the highest level (1st order), the climatic driving forces of change are temperature and rainfall (which can include extreme events). this has knock-on effects on the physical and biotic environments (2nd order), which in turn affects ecosystem service functioning and agricultural productivity (3rd order), finally culminating in direct impacts on human livelihoods (4th order).
there are a number of climatic changes predicted for each resilience action area, and a policy approach that responds to all of them is necessary. however, understanding the main driver of change in terms of a 1st impact is useful in that it often captures the main adaptive management response.
an underpinning question in each case study analysis is whether there is a danger of climate impacts pushing a given area or system towards a critical threshold. Further research is needed for a detailed answer to this question. however, it is evident in the eight resilience action areas represented here that the high altitude catchments provide the highest runoff per unit area and generate much of the water needed downstream in the basin. these catchments are also locations of the highest biodiversity and levels of endemism in the basin system. Whilst these areas cannot currently be defined as tipping points, it is essential that they do not reach a critical threshold given their strategic importance to the basin, as a ‘closed’ system. Resilience-building actions and adaptations can take on many forms and are likely to evolve through a process of learning by doing. the resilience-building actions provided in this report suggest potential adaptation pathways, with scope remaining for their validation by stakeholders in the future.
Table 2.1: Climate change, case studies and lessons for the basin as a whole
Case Study Key Climate Change Impact Relevance to the basin
Upper Limpopo temperature increase ecosystem sensitivity to climate change; potential for conflicts as water becomes scarcer; vulnerability of groundwater to mismanagement.
Pretoria North - Moretele
increased rainfall variability poor development and infrastructure planning reduces adaptive capacity; climate change results in economic and social costs.
Shashe–Limpopo confluence
Rainfall decrease transboundary implications of water and natural resource management, highlighting the need for better governance and a basin-wide approach.
Upper Umzingwane
increased severity and occurrence of drought
highly erratic rainfall and water scarcity are drivers of degradation.
Soutpansberg 10% decrease in rainfall Water source areas (‘water towers’) are critical to the resilience of the basin as a whole. these areas are also usually significant areas of biodiversity.
Pafuri triangle Rainfall decrease human migration occurs due to climate-related economic hardship, with transboundary repercussions on health and infrastructure.
Middle Olifants- Former homeland area of Lebowa
temperature increase by 2°c high population density and poor agricultural practices increases an area’s vulnerability to water stress and land degradation.
Lower Limpopo–Chokwe
increasing severity of floods Flooding has a severe impact on livelihoods, especially in floodplain areas. it also has dramatic costs to infrastructure, food security and health.
2.
vu
lN
Er
ab
iliT
y m
ap
piN
g a
Nd
wh
aT
iT
TE
ll
S u
S

16
2.2.1 Upper Limpopo (Botswana and South Africa)
this is a highly sensitive ecosystem that straddles Botswana and south africa at the source of the limpopo River. Dolomitic aquifers, associated springs, and wetland systems fed by groundwater from the upper catchment of the groot marico River are of great conservation significance and highly sensitive to groundwater abstraction. Biodiversity in the area relies on the free-flowing nature of the groot marico River – its geographical isolation has led to high levels of speciation and adaptation to local environmental conditions. away from the river the area is semi-arid, with low rainfall – droughts occur at regular intervals. heat stress and frost can have significant localized impacts. high population densities in nearby towns further threaten to increase the already high water abstraction rates.
FUTURE POSSIBLE IMPACTS:
Slightly increased annual rainfall or no change observed; increase in length of rainy season; more thunderstorms; warming by 2.5°C, highest temperatures in spring; and moderate increase in heat extremes with additional heat stress to living organisms; warmer nights and fewer frosts; risk of droughts.
What does this mean for the basin?temperature increases will have a significant impact on the resilience action area – capturing the need for better
management of the land and soil, and an understanding of the ecosystem services derived from the area. a temperature change will have impacts on crop and livestock productivity, incomes and livelihoods, affecting the poorest members of the community with greater severity. as in many other areas across the limpopo River Basin, livelihood opportunities are very limited and a large proportion of the inhabitants (36%) are unemployed, with youth unemployment even higher at 45% (local government handbook municipal Fact sheet, 2011). With education levels low, this resilience action area indicates the need for better training and education of communities living in sensitive natural environments and an understanding of sustainable development. these are important needs for a large part of the basin. many areas will experience warmer climate in areas with low adaptive capacity if left unmanaged – the result of which is often an overexploitation of the natural environment.
What can be done to build resilience?
Biodiversity• legislate and/or provide other means for high level
conservation protection for the Upper groot marico catchment and ecosystem
• institute a moratorium on any new impoundments or mining activities along the currently free-flowing parts of the marico River
• monitor changes in habitat and species populations and ranges, including invasives, and take appropriate action when warning signs emerge
There is a decrease in the productivity of ecosystems as temperatures change habitats. Temperature also decreases water availability, further placing the ecosystem under threat. There is severe threat to the ecosystem of the upper catchment due to lower flows, a drying of wetlands and less water storage capacity in the soil.
3rd
order
reduced agricultural productivity is observed as soils become drier. Small-scale mining is scaled up to account for lost income, reducing the quality of water. Heat stress to organisms decrease the tourism potential of the area, as do water shortages. Potential localized conflict between water users.
4th
order
Soil moisture declines and there is increased evapo-transpiration. Dams on both sides of the rivers have reduced water levels. Groundwater is relied on more heavily, which threatens the springs and may lead to water quality concerns.
2nd
order
TEMPEraTurE: increase by 2.5°C, increase in heat extremesraiNfaLL: Slight increase or no change, increased thunderstorm intensity
1st
order
Figure 2.4: Upper Limpopo – 1st-to-4th Order Impact Assessment
2.
vu
lN
Er
ab
iliT
y m
ap
piN
g a
Nd
wh
aT
iT
TE
ll
S u
S

17
Water• monitor climate trends, groundwater and surface water
seasonal supply and demand (abstraction) in both sub-basins (especially around the dolomitic springs – or ‘eyes’) and take mitigating action when demand exceeds supply
• adopt careful, flexible and adaptive water allocation policies, linked tightly to development planning, with no compromises on the ecological reserve
• adopt best practice waste and sewerage management
to ensure no accidental spills into water bodies• maintain bilateral discussions and implement
binding agreements on flexible and adaptive use and management of shared water resources
Climate Resilient Development• plan for alternative economic growth avenues and food
systems• establish a basin-wide shared platform for joint
discussions of national and regional level threats
Box 2.1: Temperatures are driven by extremes
2.2.2 Pretoria North – Moretele (South Africa)this is a region of villages that have grown and joined to make large sprawling settlements, without visible supporting infrastructure such as tar roads, sanitation, lighting and schools. Decades of high-density stocking has led to high levels of land degradation. Frequent fires destroy grazing land and even homes, and fire-fighting services are hampered by lack of resourcing and infrastructure. the probability of an economic development that will take the inhabitants out of poverty is not high, as there are few reasons to locate significant economic development in this area. additionally, the potential for further agricultural development is very limited. the water flowing through this resilience action area is highly polluted through urban and industrial effluent (originating in tshwane) and is often not
safe for consumption. Downstream intensive agriculture in the crocodile sub-basin is placed at risk. the area consists of low-lying land and wetlands, and is characterized by variable rainfall, intense summer thunderstorms, periodic flooding and droughts.
FUTURE POSSIBLE IMPACTS:
10% increase in annual rainfall (mainly in summer); small increase in rain days; earlier beginning and later end to rainy season; small increase in number of convective rainfalls; warming by 2.5°C, highest in spring; increases in heat extremes; warmer nights and fewer frosts; risks of droughts remains high.
w2
. v
ul
NE
ra
bil
iTy
ma
pp
iNg
aN
d w
ha
T i
T T
El
lS
uS
With global warming, temperature changes are not experienced through changes in average temperature, which could be dominated by the diurnal range, but by the frequency and intensity of the extreme temperatures. the number of very hot days and nights will increase,
affecting the health of humans, animals and crop yield. this effect is already happening in the region and is especially prevalent during drought (kruger at al., 2014). the relationship is presented in Figure 2.5:
Figure 2.5: Increasing temperatures are driven by an increasing number of extreme hot days (Source: Huber, D and Gulledge, J., 2011)
increase in mean Temperature and variance
average HotCold
Less change for cold weather
Much more hot weather
Old climateNew climate

18
What does this mean for the basin?the people of moretele experience hardship as a result of historically weak investment in infrastructure and basic services. lack of town and spatial planning, and poor building standards combine with a drainage system of numerous rivers and wetlands to create high risks of flooding after heavy rains. high levels of unemployment, competition for meager informal trade opportunities, poverty and a weakened social fabric render many inhabitants very vulnerable to shocks.
this resilience action area represents the wider vulnerability of unplanned human settlements to climate variability – with droughts and floods a significant economic and social burden on the local economy. this area does not contain high levels of biodiversity, but requires priority in future adaptive capacity work done in the basin. the uncertain future of employment in this area, driven by the mining industry, underscores the urgent need to implement adaptive and resilient development solutions which account for the need for diversified livelihoods.
What can be done to build resilience?Water• monitor climate trends, groundwater and surface water
seasonal supply and demand (abstraction) in the
resilience action area and upstream catchment, and take mitigating action when demand exceeds supply. this is likely to imply that adjustments in the transfers from the vaal system and regulation of groundwater abstraction must be made.
• monitor the state of the local wetlands, gain a better understanding of wetland dynamics and use this understanding to plan settlements within a flood risk management strategy
• implement an affordable but effective waste and sewerage management strategy to reduce water pollution
• improve the disaster risk reduction and management practices and resourcing for better responses to flooding and fires
Climate Resilient Development• take measures to restore the degraded communal
grazing lands, and instill best practice livestock herd management and grazing systems to sustainably raise production levels
• conduct improved spatial planning and develop climate resilient infrastructure, services and building codes
• explore and plan for alternative economic growth avenues and livelihood options, by linking the area to the economically vibrant Johannesburg-tshwane metropolitan area and surrounding growth nodes
Poorly planned urban settlements are vulnerable to flooding, resulting in high economic and social costs to the area. an increased reliance on social-grants is expected as agricultural and livestock productivity declines. Disaster risk management is required, with costs to the economy. Pollution affects human health as well as ecosystem resilience.
4th
order
Heavy rainfall combined with general aridification increases erosion and land degradation. Grazing potential is significantly reduced. Livestock is at risk of pests and disease when area is water logged.
3rd
order
Low-lying land becomes water-logged in heavy rain events, with poor drainage. This compacts the clay soils and leads to cracking under periods of drought. Wetlands dry out more rapidly in summer.
2nd
order
TEMPEraTurE: increase by 2.5°C, increase in heat extremesraiNfaLL: 10% increase in annual rainfall, greater intensity thunderstorms, drought risk high
1st
order
Figure 2.6: Pretoria North - 1st-to-4th Order Impact Assessment
2.
vu
lN
Er
ab
iliT
y m
ap
piN
g a
Nd
wh
aT
iT
TE
ll
S u
S

19
2.2.3 Shashe-Limpopo River Confluence (Botswana, Zimbabwe and South Africa)
this transboundary resilience action area covers Botswana, Zimbabwe and south africa. it is an arid zone, containing beautiful landscapes, abundant game and wildlife, and a rich cultural history with much potential for tourism; however, the area is currently categorized as having a dry, arid climate, with very low rainfall and intense summer heat. the potential for further development of ecotourism (game farms and reserves and related tourism) and cultural/historical tourism (mapungubwe and other sites) is large, although an increasing economic reliance on mining and agriculture threatens such possibilities. mining consists of opencast coal extraction (started 8 kilometers east of the mapungubwe heritage site) and diamonds (venetia diamond pipe 26 kilometers south of the border between south africa and Zimbabwe). irrigated agriculture is located on both banks of the limpopo and extensive (low density) livestock grazing is practiced in all three countries. this resilience action area incorporates much of the proposed area of the greater mapungubwe transfrontier conservation area (tFca).
FUTURE POSSIBLE IMPACTS:
10% decrease in rainfall (mainly summer); reduction in mean number of rainy days; later start and earlier end to rainy season; warming by 2°C (highest in spring); increases in heat extremes; additional heat stress to living organisms; risk of droughts and floods.
What does this mean for the basin?
the resilience action area’s economy depends heavily on water resources – including the shared alluvial aquifer used for crop irrigation – and mining resources. Declining rainfall will see a decrease in agricultural productivity and the need for alternative livelihoods. this might take the form of increased mining activities, with significant impacts on downstream water quality. increased utilization of resources for economic development, including further mining and irrigated agriculture, needs to be sensitive to the ecological fragility of the area and scarce water resources, and possible implications of climate change. the transfrontier conservation area (tFca) is the dominant focus of governance, but is in conflict with the pressures for mining activities. the unrestricted movement of animals across the borders can create unwanted disease pathways, bringing the practice into conflict with national economic entities relying on the export of disease-free meat to foreign markets. tFcas provide a range of valuable opportunities to the region; however, they currently face a multitude of challenges. While detailed research on tFcas is not within the scope of this synthesis report, Box 2.1 discusses some of the key challenges facing tFcas, along with possible solutions.
this resilience action area captures the need for a better understanding of livelihoods in a region of important conservation value, as well as ways in which local communities can be supported by a conservation area. if alternative livelihoods are not addressed, challenges such as increased poaching may increase. conservation of the natural and cultural heritage of the area will have benefits to people living in the area, but will require good communication and collaborative governance across the three countries to succeed.
Figure 2.7: Shashe-Limpopo River Confluence – 1st-to-4th Order Impact Assessment
Cross-border conflict between humans and animals occurs due to migration out of the area. Livestock and human disease increases. The TfCa area is at risk of a decrease in tourism, as wild animals suffer from water shortages. There is a loss of income to the area and human wellbeing suffers.
4th
order
Vegetation cover decreases and biodiversity is at increasing risk (especially birds and aquatic species). Small-scale farming is put at risk and unsustainable groundwater harvesting is observed. Despite the decline in carrying capacity, livestock numbers increase and disease is observed.
3rd
order
Ephemeral streams and rivers flow less often, reducing the flow in the main stem of the Limpopo. Soil loses moisture, water levels in dams decrease and groundwater is relied on more heavily. Groundwater levels become more variable and alluvial aquifer recharge is less frequent.
2nd
order
TEMPEraTurE: increase by 2°C, increase in heat extremesraiNfaLL: 10% decrease in annual rainfall, drought risk increases
1st
order
2.
vu
lN
Er
ab
iliT
y m
ap
piN
g a
Nd
wh
aT
iT
TE
ll
S u
S

20
Box 2.2: Building adaptive capacity through TFCAs
transfrontier conservation areas (tFcas), conservation areas (cas) and other types of cross-border natural resource management efforts are increasing, aiming to integrate ecosystem conservation and socio-economic development. they face the challenge of supporting communities within these areas, along with those on the conservation area’s perimeter. Without diversified livelihoods for these communities and limited opportunities provided by the regulation of the areas, it is likely (and understandable) that they will revert to wildlife crime (Booth, 2013). projects that offer diversification of livelihoods are, for example, the Wildlife in livelihood Development (WilD) program, an eU-funded initiative that is aimed at improving socio-economic and ecological resilience of land-use activities and livelihoods in Zimbabwe and commodity-Based trade.
the transmission of animal diseases through tFcas is also a significant barrier to realizing climate-adaptive responses that combine conservation and socio-economic development. transboundary animal diseases such as foot-and-mouth and bovine tuberculosis are inimical to the advantages that tFcas bring to biodiversity and ecosystem maintenance, particularly where rural livestock production interfaces with wildlife conservation (saDc, 2008). concepts such as “one health” and the use of commodity-Based trade (cBt), whereby animal products that are disease-free can be traded out of the area into disease-free zones (thomson et al., 2004), are possible adaptations to these animal diseases and allow the continued operation of tFcas juxtaposed with rural livestock production. in the one health approach, animal and human health are brought under one program of surveillance, epidemiological research and modeling, along with control and containment strategies across institutional boundaries and national borders – an operation that has proven to be very challenging for a variety of reasons (see lee and Brumme, 2012).
What can be done to build resilience?
Biodiversity• continue negotiations and planning between the three
countries to achieve the full extent of the greater mapungubwe transfrontier conservation area, with conservation-sensitive land use and economic planning on the periphery
• Develop the potential for further climate- and ecologically-sensitive nature-based and cultural tourism, with the necessary supporting infrastructure
• identify and act on effective ways to reduce wildlife-human conflict
• monitor, prevent, and respond effectively to wildlife-livestock-transmissible diseases
Water• maintain trilateral discussions and implement
binding agreements on flexible and adaptive use and management of shared water resources, including the alluvial aquifer
• exercise keen oversight of current and planned future water use for mining and large-scale irrigation activities around the shashe and limpopo Rivers, and interrogate changes in viability and sustainability
• take a basin-wide systems view when planning intra-basin water transfers from one sub-basin to another e.g. the north-south Water carrier between Francistown and gaborone in Botswana
Climate Resilient Development• manage conflicts between mining companies and other
land and water users, and avoid detrimental conversion of landscapes which could reduce the future socio-economic potential of climate-adapted resource use
• enhance current knowledge of shifts in disease prevalence and patterns as a result of climate change
2.2.4 Upper Umzingwane (Zimbabwe)the Umzingwane tributary has its source just south of Bulawayo in Zimbabwe. it is an ephemeral river, influenced by periodic and highly variable inter-seasonal rainfall and a long and hot dry season. the upper catchment of this tributary generally has thin soils and the intense utilization of catchment resources results in high levels of erosion and sediment transport in the river and its tributaries. Flood plains near the river are especially used for agricultural purposes, including the shallow alluvial aquifers found there, because of their proximity to the water resource. artisanal gold mining and gold panning results in pollution and substantial sediment disturbance and release into the river and its tributaries. Water resource infrastructure (i.e. small dams) have been poorly maintained and are in disrepair.
FUTURE POSSIBLE IMPACTS:
Slightly increased annual rainfall or no change observed; increase in length of rainy season; more thunderstorms; warming by 2.5°C, highest in spring; moderate increase in heat extremes with additional heat stress to living organisms; warmer nights and fewer frosts; risk of droughts.
What does this mean for the area?
the increasing severity and occurrence of droughts in this already semi-arid environment will be a key driver of stress in the future. threats to biodiversity arise from the destruction of vegetation, soil erosion, land degradation and siltation, and unsustainable depletion of water resources. artisanal mining of gold adds further pressure in this regard and contributes to the deterioration of water quality. livelihoods are already largely centered on climate-sensitive natural resources, with
2.
vu
lN
Er
ab
iliT
y m
ap
piN
g a
Nd
wh
aT
iT
TE
ll
S u
S

21
rain-fed agricultural livelihoods being highly vulnerable to rainfall changes. Droughts decrease the productivity for the area, leading to food insecurity and nutrition concerns for the area. migration out of the area and across country borders (much of which is illegal) is a notable concern.
this resilience action area captures the need to build resilience across water scarce regions throughout the basin – with the common themes of declining agricultural productivity in the face of already poor communities. Without adaptation to drought across the basin, areas will become uninhabitable. this in turn will have impacts on migration patterns and local conflict over scarce resources such as water.
What can be done to build resilience?
Biodiversity• manage and reduce the threats to biodiversity, such as
siltation and water pollution
Water• Develop adaptation approaches premised on soil water
conservation; this will utilize the water storage capacity of the soils in the catchment
• monitor climate trends, groundwater and surface water seasonal supply and demand (abstraction), and water quality in the Umzingwane River and its tributaries – take mitigating action where necessary
• exercise keen oversight of current and planned future water use for mining and irrigation activities
• establish strong governance of the critical water resource and its associated infrastructure, taking into account the climate change projections for this sub-basin
• tap into the potential for greater sustainable use of groundwater for humans, livestock and crops, within the context of climate change
Climate Resilient Development• continue the implementation of proven best soil and
water management practices, such as conservation agriculture
• implement measures to control erosion and siltation caused by mining and poor land management
• Rehabilitate the existing small dams and irrigation schemes and put in place management and finances for continued maintenance
• identify and develop diversified livelihood options offering better security and a more resilient future, for example the development of game ranching in communal areas
• involve all stakeholders in planning and decision-making• establish a basin-wide shared platform for joint
discussions of national and regional level threats which could flow from threats to the important Umzingwane River sub-basin
Livelihood options become more limited and crop productivity declines. Subsistence farming is challenged and nutrition suffers. food security becomes a critical concern. increasing reliance on mining on the river results in erosion and land mismanagement. Droughts threaten development and increases reliance on social systems. There is migration from the area with cross-border impacts.
4th
order
Vegetation cover decreases, land becomes unproductive without irrigation in times of drought. increased land degradation is associated with a greater reliance on livestock. risk of over abstraction from aquifer to meet human and animal demand. animal diseases increase.
3rd
order
Ephemeral streams and rivers flow less often. Dam levels and alluvial aquifer recharge is more variable and generally decreasing. risks to water quality increase (siltation and acid mine drainage) as flows decrease. increased risk of wildfires.
2nd
order
TEMPEraTurE: increase by 2.5°C, increase in heat extremes, heat stressraiNfaLL: Little change in annual rainfall, drought risk increases
1st
order
Figure 2.8: Upper Umzingwane – 1st-to-4th Order Impact Assessment
2.
vu
lN
Er
ab
iliT
y m
ap
piN
g a
Nd
wh
aT
iT
TE
ll
S u
S

22
Box 2.3: Challenges faced in the Umzingwane catchment area
Umzingwane district is a water catchment area for several surrounding areas (including Bulawayo city), with five dams supplying the area – Umzingwane, Upper ncema, lower ncema, inyankuni and Umtshabezi. these dams lie along three primary rivers (Umzingwane, insiza and mtshabezi) and host a concentration of (both legal and illegal) alluvial gold panning activities (Fao, 2004). With this activity, however, comes the risk of huge amounts of silt being released into the river system – and alongside soil erosion, worsens the risk of flooding and drying up of the water reserves (phiri, 2011). indeed, inyankuni and Upper ncema were decommissioned in late 2013 due to how dry they were (moyo, 2014), unable to function or supply the district with water. in addition to the main climatic driver in the area being droughts, sparked by erratic rainfall and high temperatures, such activity has severe implications for water resource management.
the area is also hampered by governance issues, due to a variety of actors involved in management of the catchment area. the Umzingwane catchment council, mostly comprised of powerful farmers represented through the Rural District councils
(RDcs), manages the catchment area (love, et al., 2005). however, the catchment area is extensive, falling under different districts and provinces, and thus requires greater coordination and consideration of various interests and activities. to date, other stakeholder groups, particularly those of the ‘lower tiers’ (e.g. communal or resettlement farmers) have had minimal participation in sub-catchment management, and are not effectively represented, lacking capacity and water monitoring skills (mcc, 2010).
governance by different institutions overlaps, is confused, or has insufficient capability for rectifying negative trends. the identification and development of diversified livelihood options offering the inhabitants better security and a more resilient future is urgently required, however, these opportunities are few, if any. it is likely to be more feasible to implement sustainable land use practices, including sustainable artisanal mining. planning and decision-making needs to involve all local stakeholders and national planners/regulators and produce a strong monitoring system, which includes water quality and erosion control.
What does this mean for the basin?tracing the effects of just one climatic shock, such as a decrease in rainfall, sees drastic changes occurring throughout the ecosystem and impacting livelihoods in the area. of critical concern in this resilience action area is the importance of maintaining the integrity of its ability to act as a water source for downstream users. the area provides three fundamental ecosystem services to the basin – the provision of water, the regulation of its flow, and quality improvements for downstream users. Without adequate management of the river banks and the vegetative cover and soil, these ecosystem services will be compromised. this resilience action area captures the need for effective management of all such water source areas, highlighting the fact that these areas are also usually high priority biodiversity areas and centers of endemism. compounding climate variability is the fact that a reduction in rainfall results in a proportionally higher reduction in runoff (huang et al., 2014). stronger governance of land use is required, with enforced protection of natural areas. some areas are more strongly protected than others, and institutional and legislative frameworks for conservation are generally fragmented (paterson, 2009). additionally, the management of anthropocentric activities such as poor infrastructure (e.g. dirt roads), overgrazing and trampling, vegetation cutting, washing, excessive fishing and sand mining will have significant costs to communities if left unmanaged.
2.2.5 Soutpansberg (South Africa)this region, central to the vhembe Biosphere and known for its exceptional biodiversity and high species endemism, is a conservation priority. the mountains of the soutpansberg are an important ‘water tower’ in this otherwise semi-arid environment, meaning that the area’s runoff is proportionally higher than its surrounds and supports a cloud forest at higher altitudes. however, the area is not formally protected. the area is also known for its important cool, high-lying wetlands. Factors such as unsustainable farming methods, vegetation clearing and pollution are impacting the area’s ability to act as a water source for the basin. a healthy catchment will protect biodiversity, building both the resilience of the area itself, and that of the basin as a whole. the area already experiences highly temporal and spatial variability in rainfall and land degradation despite its importance as a biodiversity centre.
FUTURE POSSIBLE IMPACTS:
10% decrease in rainfall (mainly summer); reduction in mean number of rainy days; later beginning and earlier end to rainy season; lifting of the cloud base, resulting in loss of mist interception in the cloud forest; warming by 2°C (highest in spring); increases in heat extremes; additional heat stress to living organisms; risk of droughts and floods.
2.
vu
lN
Er
ab
iliT
y m
ap
piN
g a
Nd
wh
aT
iT
TE
ll
S u
S

23
What can be done to build resilience?
Biodiversity• legislate or provide other means for high level
conservation protection for the biodiverse soutpansberg (vhembe Biosphere)
• Remove alien vegetation and invasive species
Water• maintain the ecosystems (particularly the higher
catchments and cloud forests) in order to maintain river flows off the slopes
• Remove invasive woody species that utilize a substantial proportion of potential runoff
• monitor climate trends, groundwater and surface water seasonal supply and demand (abstraction) in the levuvhu and nzhelele Rivers and their tributaries and
take mitigating action when demand exceeds supply; tap into the remaining potential for sustainable use of groundwater in the levuvhu sub-basin for humans, livestock and crops
• Develop adaptation approaches premised on soil water conservation; this will utilize the water storage capacity of the soils in the catchment
• exercise keen oversight of current and planned future water use for mining and irrigation development, and for ecosystems and eco-tourism. systematically interrogate trade-offs between different opportunities and their long-term economic and ecological sustainability
• establish strong governance of the water resource and its associated infrastructure, taking into account the climate change projections for this sub-basin
Figure 2.9: Soutpansberg – 1st-to-4th Order Impact Assessment
reduced runoff becomes a driver of stress in the area, with negative impacts downstream. Siltation decreases productivity of infrastructure. agricultural livelihoods, in addition to those reliant on environmental services (such as subsistence fishermen) become difficult, with increasing poverty and food security experienced.
4th
order
Biodiversity suffers as water supply decreases. alien vegetation may increase, reducing water flows further. Ecosystem services (regulation and quality) decrease. Wetlands dry out. agricultural productivity decreases and reliance on livestock increases. Water quality deteriorates and there are siltation concerns due to erosion.
3rd
order
Semi-arid areas transition to arid areas, putting pressure on indigenous vegetation. a decrease in rainfall results in a proportionally higher decrease in runoff, affecting the river flow downstream. Soil moisture decreases, erosion is observed and land further degrades.
2nd
order
TEMPEraTurE: increase by 2°C, increase in heat extremesraiNfaLL: 10% decrease in annual rainfall, drought and heat stress risk increases
1st
order
2.
vu
lN
Er
ab
iliT
y m
ap
piN
g a
Nd
wh
aT
iT
TE
ll
S u
S

24
2.2.6 Pafuri Triangle (South Africa, Zimbabwe and Mozambique)
the pafuri triangle is the second point (after the shashe–limpopo confluence further upstream) where three of the four basin countries share a common point, making collaborative governance of water and biodiversity a critical response to vulnerability in the area. the area has a particularly harsh, arid climate, with low rainfall, intense summer heat, droughts and the occasional flood. the habitats of the levuvhu tributary provide a refuge for many plant and animal species which are currently adapted to these conditions. climate change will have an exacerbating effect on these ecosystems. compared to other areas of the basin, the pafuri triangle has a relatively small population; however, land use and competing interests in the area for water and natural resources have made the area particularly vulnerable to climate stress.
large-scale efforts to achieve transboundary conservation of a unique natural and cultural heritage, with benefits to the divergent peoples of all three countries, will require good communication and collaborative governance to succeed.
FUTURE POSSIBLE IMPACTS:
Possible transition to arid in areas, especially Zimbabwe and Mozambique areas; 10% decrease in annual rainfall (mainly summer); small reduction in mean number of rain days; later start and earlier end to rainy season; rainfall changes strongly influenced by changes in cyclones from Indian Ocean (possibly more intense, less frequent); warming by 1°C, highest in spring; increase in heat extremes; additional heat stress to living organisms; risk of droughts and floods remains.
What does this mean for the basin?erratic weather patterns in the region scale through the system with significant impacts to livestock and crop productivity. climate variability also impacts on eco-tourism, further reducing the ability of the population to make a living
agricultural livelihoods become marginal, while alternative livelihoods decline as eco-tourism is impacted. Migration becomes an even more significant feature of this transboundary region. Human health is challenged by poor nutrition, migration and transhumance. Collaborative governance becomes of critical importance.
4th
order
Vegetation cover decreases and species range changes. Productivity of grazing is reduced and livestock/game production becomes more variable and at higher risk of drought. There is increased cross-border animal movement and lower rainfall crop yields.
3rd
order
High rainfall variability leads to severe water stress in this region, with longer periods of low flows in the rivers. Episodic flash floods occur after heavy rainfall. Groundwater levels become more variable and are often decreasing.
2nd
order
TEMPEraTurE: increase by 1°C, increase in heat extremes, heat stressraiNfaLL: 10% decrease in annual rainfall, drought risk increases, flood risks remain
1st
order
Figure 2.10: Pafuri Triangle – 1st-to-4th Order Impact Assessment
2.
vu
lN
Er
ab
iliT
y m
ap
piN
g a
Nd
wh
aT
iT
TE
ll
S u
S

25
away from subsistence livelihoods. socio-economic needs and a population that is highly connected regionally (with high rates of cross-border movement of people and goods) could mean that climate-driven hardship and instability may have transboundary impacts. climate variability also imposes risks on the local biodiversity of the region with expected shifts in the range, population size and resilience of animals and plants. the potential for eco-tourism in the area remains; however, to realize the full benefits, the great limpopo transfrontier park requires stronger governance and enforcement of conservation legislation. given the different legislative and management capacities of the different countries that share this region, coordination may experience difficulties.
pafuri represents a microcosm of the greater challenges and opportunities facing the basin, capturing the need for an integrative approach to water and conservation areas across countries, and the need to provide alternative livelihoods in areas that have traditionally relied on rain-fed agriculture. the area also faces water quality challenges and issues related to inequality in natural resource access (notably water) and consumption between users. it could be a useful pilot-project area for a project on alternative livelihoods strategies.
“The water is very salty and not good and I was very very sick ... the Government there is not concerned about the lives of those communities and that those communities need help.” – a researcher from the makuleke community, after travelling extensively in remote rural areas bordering parfuri in both mozambique and Zimbabwe.
What can be done to build resilience?
Biodiversity• continue negotiations and planning between the three
countries to realize the full extent of the great limpopo transfrontier park, with conservation-sensitive land use and economic planning on the periphery
• Develop the potential for further climate-and ecologically-sensitive nature-based and cultural tourism, with the necessary supporting infrastructure such as roads
• identify and act on effective ways to reduce wildlife-human conflict
• monitor, prevent, and respond effectively to wildlife-livestock transmissible diseases
• Joint efforts to control poaching must be enhanced
Water• Where subsistence farming still occurs, develop
adaptation approaches premised on soil water conservation
• monitor climate trends, groundwater and surface water seasonal supply and demand (abstraction) in the limpopo River and joining tributaries – take mitigating action when demand exceeds supply
• maintain trilateral discussions and implement binding agreements on flexible and adaptive use and management of shared water resources
• exercise keen oversight of current and planned future water use for mining and other water-consumptive activities, and interrogate changes in viability and sustainability
Climate Resilient Development• manage potential conflicts between land and water
users, and avoid detrimental conversion of landscapes, which could reduce the future socio-economic potential of climate-adapted resource use
• identify and develop diversified livelihood options offering better security and a more resilient future (for example, the development of game ranching in communal areas)
• involve all stakeholders in planning and decision making
2.
vu
lN
Er
ab
iliT
y m
ap
piN
g a
Nd
wh
aT
iT
TE
ll
S u
S
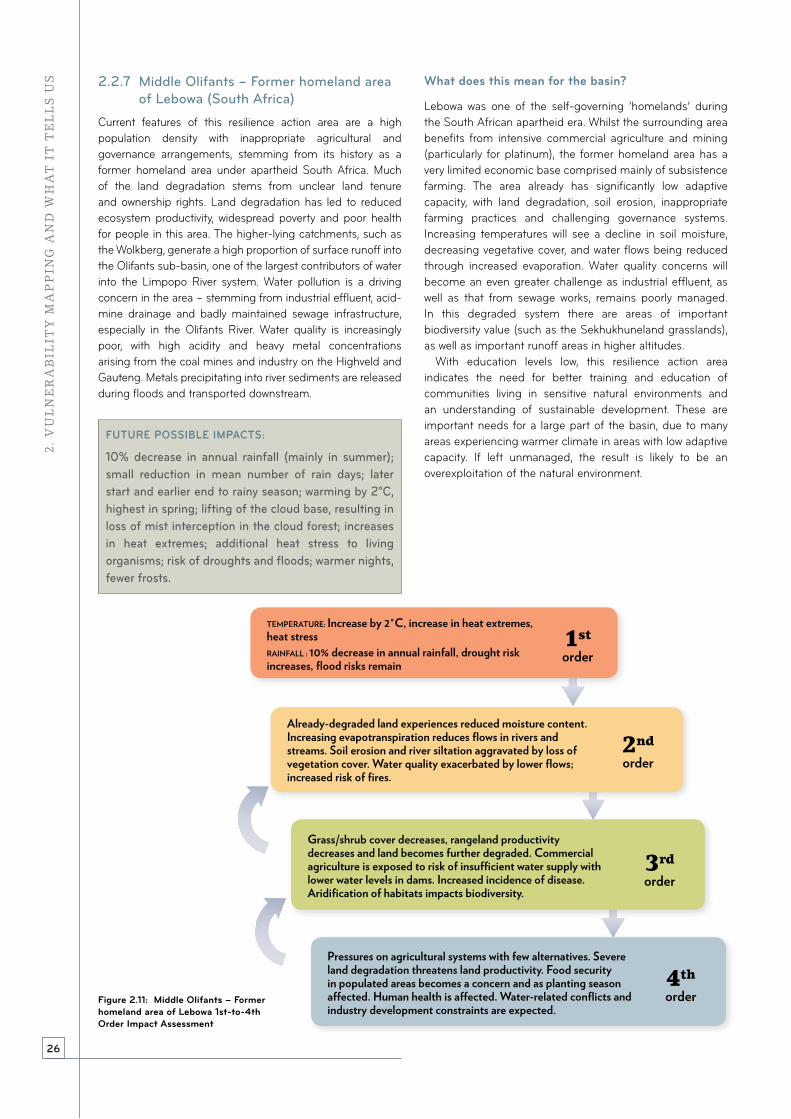
26
2.2.7 Middle Olifants – Former homeland area of Lebowa (South Africa)
current features of this resilience action area are a high population density with inappropriate agricultural and governance arrangements, stemming from its history as a former homeland area under apartheid south africa. much of the land degradation stems from unclear land tenure and ownership rights. land degradation has led to reduced ecosystem productivity, widespread poverty and poor health for people in this area. the higher-lying catchments, such as the Wolkberg, generate a high proportion of surface runoff into the olifants sub-basin, one of the largest contributors of water into the limpopo River system. Water pollution is a driving concern in the area – stemming from industrial effluent, acid-mine drainage and badly maintained sewage infrastructure, especially in the olifants River. Water quality is increasingly poor, with high acidity and heavy metal concentrations arising from the coal mines and industry on the highveld and gauteng. metals precipitating into river sediments are released during floods and transported downstream.
FUTURE POSSIBLE IMPACTS:
10% decrease in annual rainfall (mainly in summer); small reduction in mean number of rain days; later start and earlier end to rainy season; warming by 2°C, highest in spring; lifting of the cloud base, resulting in loss of mist interception in the cloud forest; increases in heat extremes; additional heat stress to living organisms; risk of droughts and floods; warmer nights, fewer frosts.
What does this mean for the basin?
lebowa was one of the self-governing ‘homelands’ during the south african apartheid era. Whilst the surrounding area benefits from intensive commercial agriculture and mining (particularly for platinum), the former homeland area has a very limited economic base comprised mainly of subsistence farming. the area already has significantly low adaptive capacity, with land degradation, soil erosion, inappropriate farming practices and challenging governance systems. increasing temperatures will see a decline in soil moisture, decreasing vegetative cover, and water flows being reduced through increased evaporation. Water quality concerns will become an even greater challenge as industrial effluent, as well as that from sewage works, remains poorly managed. in this degraded system there are areas of important biodiversity value (such as the sekhukhuneland grasslands), as well as important runoff areas in higher altitudes.
With education levels low, this resilience action area indicates the need for better training and education of communities living in sensitive natural environments and an understanding of sustainable development. these are important needs for a large part of the basin, due to many areas experiencing warmer climate in areas with low adaptive capacity. if left unmanaged, the result is likely to be an overexploitation of the natural environment.
Pressures on agricultural systems with few alternatives. Severe land degradation threatens land productivity. food security in populated areas becomes a concern and as planting season affected. Human health is affected. Water-related conflicts and industry development constraints are expected.
4th
order
Grass/shrub cover decreases, rangeland productivity decreases and land becomes further degraded. Commercial agriculture is exposed to risk of insufficient water supply with lower water levels in dams. increased incidence of disease. aridification of habitats impacts biodiversity.
3rd
order
already-degraded land experiences reduced moisture content. increasing evapotranspiration reduces flows in rivers and streams. Soil erosion and river siltation aggravated by loss of vegetation cover. Water quality exacerbated by lower flows; increased risk of fires.
2nd
order
TEMPEraTurE: increase by 2°C, increase in heat extremes, heat stressraiNfaLL : 10% decrease in annual rainfall, drought risk increases, flood risks remain
1st
order
Figure 2.11: Middle Olifants – Former homeland area of Lebowa 1st-to-4th Order Impact Assessment
2.
vu
lN
Er
ab
iliT
y m
ap
piN
g a
Nd
wh
aT
iT
TE
ll
S u
S

27
What can be done to build resilience?
Biodiversity• legislate or provide other means for high level
conservation protection for the biodiverse sekhukhuneland grassland ecosystem
• Remove alien vegetation and invasive species
Water• monitor climate trends, groundwater and surface water
seasonal supply and demand (abstraction) in the olifants River and its tributaries – take mitigating action when demand exceeds supply
• adopt best practice industrial and domestic waste and sewerage management to ensure no accidental spills or pollution into water bodies
• Develop adaptation approaches premised on soil water conservation; this will utilize the water storage capacity of the soils in the catchment
• exercise keen oversight of current and planned future water use for mining and irrigation development, and systematically interrogate trade-offs between different opportunities and their long-term economic and ecological sustainability
• establish strong governance of the water resource and its associated infrastructure, taking into account the climate change projections for this sub-basin
Climate Resilient Development• Develop scenarios of future climate-adapted land use
and farming systems, together with feasible alternative economic growth and livelihood pathways and associated infrastructure development needs
• establish strong and just governance of access to, and use of, productive natural resources
2.
vu
lN
Er
ab
iliT
y m
ap
piN
g a
Nd
wh
aT
iT
TE
ll
S u
S
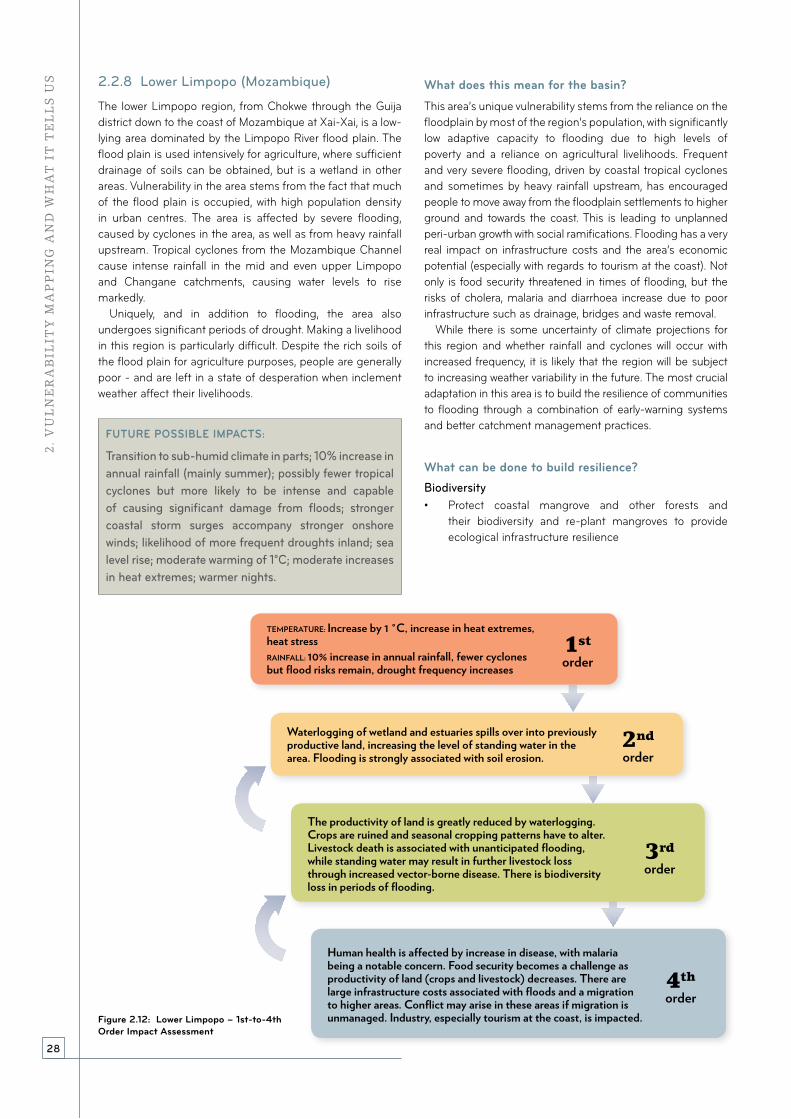
28
2.2.8 Lower Limpopo (Mozambique)
the lower limpopo region, from chokwe through the guija district down to the coast of mozambique at xai-xai, is a low-lying area dominated by the limpopo River flood plain. the flood plain is used intensively for agriculture, where sufficient drainage of soils can be obtained, but is a wetland in other areas. vulnerability in the area stems from the fact that much of the flood plain is occupied, with high population density in urban centres. the area is affected by severe flooding, caused by cyclones in the area, as well as from heavy rainfall upstream. tropical cyclones from the mozambique channel cause intense rainfall in the mid and even upper limpopo and changane catchments, causing water levels to rise markedly.
Uniquely, and in addition to flooding, the area also undergoes significant periods of drought. making a livelihood in this region is particularly difficult. Despite the rich soils of the flood plain for agriculture purposes, people are generally poor - and are left in a state of desperation when inclement weather affect their livelihoods.
FUTURE POSSIBLE IMPACTS:
Transition to sub-humid climate in parts; 10% increase in annual rainfall (mainly summer); possibly fewer tropical cyclones but more likely to be intense and capable of causing significant damage from floods; stronger coastal storm surges accompany stronger onshore winds; likelihood of more frequent droughts inland; sea level rise; moderate warming of 1°C; moderate increases in heat extremes; warmer nights.
What does this mean for the basin?
this area’s unique vulnerability stems from the reliance on the floodplain by most of the region’s population, with significantly low adaptive capacity to flooding due to high levels of poverty and a reliance on agricultural livelihoods. Frequent and very severe flooding, driven by coastal tropical cyclones and sometimes by heavy rainfall upstream, has encouraged people to move away from the floodplain settlements to higher ground and towards the coast. this is leading to unplanned peri-urban growth with social ramifications. Flooding has a very real impact on infrastructure costs and the area’s economic potential (especially with regards to tourism at the coast). not only is food security threatened in times of flooding, but the risks of cholera, malaria and diarrhoea increase due to poor infrastructure such as drainage, bridges and waste removal.
While there is some uncertainty of climate projections for this region and whether rainfall and cyclones will occur with increased frequency, it is likely that the region will be subject to increasing weather variability in the future. the most crucial adaptation in this area is to build the resilience of communities to flooding through a combination of early-warning systems and better catchment management practices.
What can be done to build resilience?Biodiversity• protect coastal mangrove and other forests and
their biodiversity and re-plant mangroves to provide ecological infrastructure resilience
Figure 2.12: Lower Limpopo – 1st-to-4th Order Impact Assessment
Human health is affected by increase in disease, with malaria being a notable concern. food security becomes a challenge as productivity of land (crops and livestock) decreases. There are large infrastructure costs associated with floods and a migration to higher areas. Conflict may arise in these areas if migration is unmanaged. industry, especially tourism at the coast, is impacted.
4th
order
The productivity of land is greatly reduced by waterlogging. Crops are ruined and seasonal cropping patterns have to alter. Livestock death is associated with unanticipated flooding, while standing water may result in further livestock loss through increased vector-borne disease. There is biodiversity loss in periods of flooding.
3rd
order
Waterlogging of wetland and estuaries spills over into previously productive land, increasing the level of standing water in the area. flooding is strongly associated with soil erosion.
2nd
order
TEMPEraTurE: increase by 1 °C, increase in heat extremes, heat stressraiNfaLL: 10% increase in annual rainfall, fewer cyclones but flood risks remain, drought frequency increases
1st
order
2.
vu
lN
Er
ab
iliT
y m
ap
piN
g a
Nd
wh
aT
iT
TE
ll
S u
S

29
Water• complete the rehabilitation of large and smaller irrigation
schemes to standards that are climate-resilient, as well as other neglected infrastructure (such drainage systems)
• increase the mobility of the region so that effective disaster responses can be carried out
• identify weaknesses in flood early warning systems and disaster responses and continue improving on these
Climate Resilient Development• strengthen alternative economic growth avenues away
from climate-dependent subsistence (e.g. through the mozambique-south africa economic development corridors)
• strengthen land use planning and spatial development to ensure that infrastructure, settlement and agricultural development are aligned with climate-related risks
• improve the understanding of the health impacts of climate change and strengthen the public health service accordingly
• strengthen the role of women in disaster risk management structures and processes, and in diversifying livelihood opportunities
Insights“If the Government wants to appease these communities, let’s start with the river” – peter phefo, Bahurutse Boo-mokgatla traditional authority
in broad terms, the most important driver of vulnerability is sufficient access to water, as is evidenced by water stress in many of the resilience action areas. vulnerability is also defined by the high reliance of livelihoods on rainfed agriculture and population density. population density becomes an indicator of vulnerability when there are low levels of infrastructure and low adaptive capacity. in the Botswana, Zimbabwean and mozambican parts of the basin, data quality was poor or lacking in places, resulting in a more pixelated gis image. Despite the poor data quality, the methods used in this study were relatively robust as variables were chosen according to relevance, and weighted according to their quality. this shortcoming might be improved by better spatial resolution of national data collection.
an underpinning question in each resilience action area analysis is whether there is a danger of climate impacts placing a given system close to (or at) a critical threshold. Further research is needed for a detailed answer to this question. however, it is evident in the eight resilience action areas represented here that the high altitude catchments generate much of the water needed downstream in the basin (highest runoff per unit area), and that these are also locations of the highest biodiversity and levels of endemism in the basin system. Whilst these areas cannot currently be defined as facing tipping points, it is essential that they do not reach a critical threshold given their strategic importance to the basin – a ‘closed’ system.
2.
vu
lN
Er
ab
iliT
y m
ap
piN
g a
Nd
wh
aT
iT
TE
ll
S u
S

30
wa
TE
r r
ES
Ou
rC
ES
30

31
3
governance in the limpopo river basin – a systems approach
as the water sector is more mature than ecosystem services and biodiversity, with stronger institutions and a solid research foundation, there is more information available and it is easy to emphasize this sector. however, the focus on ecosystems services and biodiversity is increasing. Furthermore, the global political economy has brought climate change and variability into sharp focus with concomitant evolution of institutional arrangements – indeed, the issue of climate governance is fast gaining global and regional traction. the political economy of both the national and sub-region system further drives complexity in the governance arrangements.
3.1 Water3.1.1 The evolution of regimes
A history of bilateral agreementssmall-scale irrigation in the south african part of the limpopo River Basin first took off around 1907 and the first irrigation district was declared in 1923 (ashton et al., 2008). since then, bilateral water-use agreements have been an important feature in regime creation in the basin system, based on a series of agreements between south africa and portugal beginning in 1926. an agreement around the building of the massingir dam on the confluence of the olifants and letaba tributaries followed in 1971. these recognized the ‘mutual interests’ of the colonial powers in the basin. although concluded at a time when water was considered an infinite resource, these agreements provide important insight into south africa’s ability to wield power and advance the nation’s economic interests within the bounds of bilateral cooperative agreements, which placed no restrictions on south africa developing its water resources (Unep, 2005).
in 1983, mozambique, south africa, and swaziland established the tripartite permanent technical commission (tptc) to guide the management of water usage in the limpopo, nkomati, and maputo rivers. this was the first attempt to establish a multilateral cooperative regime and it failed to make a meaningful impact, stemming from the fact that it did not include Botswana or Zimbabwe, and did not have the political backing of mozambique. south africa and Botswana established the Joint permanent technical committee (Jptc) in 1983, which was later upgraded to a commission in 1989. the bilateral arrangement functioned well, producing the Joint Upper limpopo Basin study (JUlBs) in 1991, which evaluated water levels and quality; the
current and future requirements of water for both countries; and the feasibility of constructing three dams to regulate the river flow for development purposes, particularly water supplies to gaborone from the molatedi Dam. this fostered clear collaboration between south africa and Botswana.
3.1.2 A basin-wide regime
The Limpopo Watercourse Commission (LIMCOM)Resolving the flaws of the tptc led to the establishment of the limpopo Basin permanent technical commission (lBptc).
Regional agreements are a relatively recent feature of the basin (aurecon, 2013). Until the lBptc was established in 1986 as the first basin-wide regime to include all the limpopo River Basin countries, agreements were bilateral in nature. initially, progress was slow due to political friction caused by mozambique and Zimbabwe’s support for the south african liberation movement under the apartheid regime. Under a new climate of building peace and good political will after 1994, the lBptc, a non-functional organization for nearly a decade, readdressed its mandate and initiated a new round of negotiations between the four riparian states. the renewed effort resulted in (1) the agreement on the establishment of the limpopo Watercourse commission, signed in 2003; (2) the limcom action plan, produced in 2005 in partnership with saDc/ WD; and (3) the Joint limpopo scoping study, completed in 2010. in 2011, the limcom agreement was ratified and replaced the lBptc as the acting body for transboundary water governance in the basin.
Toward a Shared Vision for the Limpopo River Basintoday, limcom is still an embryonic institution. the institution needs to develop into a significant catalyst for transboundary collaboration. Developing an agreed, shared vision is at the forefront of the number of issues that need to be addressed to position limcom as this catalyst. there are important decisions being made about sharing regional water resources that fall on limcom to implement. an inter-basin transfer is envisaged between the Zambezi and limpopo Basins, to supplement the Dikgatlhong dam via the north-south carrier in the Botswana portion of the basin. limcom will be required to facilitate this transfer through the Zambezi Watercourse commission (Zamcom). at present, limcom is mandated as an advisor to the parties, and carries out a primarily data-sharing function (aurecon, 2013).

32
3. g
Ov
Er
Na
NC
E i
N T
hE
lim
pO
pO
riv
Er
ba
SiN
– a
Sy
ST
Em
S a
pp
rO
aC
h
3.1.3 The regional regimeThe SADC Water Division (SADC/WD)housed within the Directorate of infrastructure and services, the saDc Water Division (saDc/WD) is an important institutional actor in the governance of the limpopo River Basin. saDc/WD’s mandate is to promote regional cooperation. the large number (14) of international river basins within the saDc makes transboundary water management a key element of the regional body’s operation. the division’s main objectives are to develop, implement, and monitor a regional water policy and strategy that reflects the international water management norms advanced by the Un Watercourse convention, the helsinki Rules, and the Dublin principles. established in 2003, the development of the saDc/WD has been largely supported and funded by the german government through the state-owned german technical cooperation agency (gtZ), now giZ. at this stage in the saDc/WD’s development, there are two main causes of concern. Firstly, the division does not have adequate financial, technical, and personnel capacity to coordinate the management of the 14 international basins in the regional economic community (Rec). secondly, the lines of division and roles and responsibilities between saDc/WD and the River Basin organizations (RBos) in the region are not clear. this is partly because of the way the Revised saDc protocol (saDc, 2000) is structured. as it stands, it is a framework for managing shared rivers but does not outline explicit basin-specific rules (aurecon, 2013). the protocol provides general principles for future water management, while allowing RBos autonomy in how they will implement these principles. the situation is further complicated by the embryonic status of some RBos. as a result, limcom is significantly under-resourced and saDc/WD is currently supplementing limcom’s capacity.
3.1.4 Toward decentralized national water structures
Despite this drive for regional cooperation, water management is essentially still implemented on a country-by-country basis in the limpopo River Basin. national political economies are thus the main driver of water governance in the region. this poses a direct contradiction for regional cooperation and transboundary water management.
nonetheless, guided in part by the saDc regional strategic framework, the past two decades have seen all basin countries undergoing a degree of water policy reform. Despite being designed to incorporate new international norms for integrated water management, these nationally driven processes have resulted in water policies that are not harmonized. this poses a further challenge for transboundary water governance. the water policy reforms are briefly discussed below.
BotswanaBotswana is characterized by significant rural-urban migration and a declining rain-fed agricultural sector. increasing domestic and industrial demand places additional
stress on water supply. most of the farms along the limpopo River are game and cattle ranches, and land ownership is not widespread. private farms dominate land use and private landowners therefore drive governance and influence most key decisions. as a result, community-based natural resource management (cBnRm) activity does not feature.
this is enabled by the centralized institutional structure of Botswana’s water policy. most water reforms in southern africa have taken water policy toward decentralized management approaches. however, Botswana remains the most centralized of the four riparians. national water policy is still regulated by the Water act of 1968 – which is outdated in terms of water allocation and use. additionally the act does not deal with water quality cconcerns; management of water quality is currently the responsibility of a number of acts dealing with pollution. this adds further complexity to water management in the country (aurecon, 2013). the DWa, housed within the ministry of minerals, energy, and Water Resources (mmeWa) is mandated with the efficient management of water resources for socio-economic benefit.
a few water sector reforms have taken place, although these have not been wholly successful. the Water Utilities corporation (WUc), established in 1970, is a state-owned enterprise tasked with the provision, management, and development of the nation’s water resources, a mandate that previously sat with DWa. WUc’s mandate has expanded over the years to include supplying potable water to urban centers and villages and managing wastewater. since these reforms were implemented, making WUc the sole supplier of water, there have been widespread water shortages, mainly due to lack of capacity or infrastructure. also, mandates are not always well defined. For example, mining, a significant threat to the future of water in Botswana, falls outside of WUc’s mandate. Botswana does, however, have the Water Resources council (WRc), an independent regulatory body that advises the minister of minerals, energy, and Water Resources on the allocation of water resources to the industry, mining, agriculture, and urban sectors. national and sectoral development plans are dominated by allocations of water to mining and agriculture, with little emphasis on allocations to maintaining biodiversity.
in 2008, Botswana initiated a Water sector Reforms project with the objective of reforming the institutional structures and policies that guide water management. this is a work in progress and the country authorities concerned are focusing on decentralizing water resource management along the lines of integrated Water Resource management (iWRm) principles. at present, Botswana has created no legal or institutional framework that incorporates iWRm principles or provides a legal body for stakeholder participation, although traditional community councils are recognized as playing a role in resolving water disputes at the local level. three new institutions that will be established as part of the sector Reform include the Water Resources Board, advising the mmeWa on water management policy; Water management area Bodies, responsible for the development and management of water in their jurisdictions; and village Water Development committees, responsible for the management of water in village areas. While these changes are still to be implemented, the government has recognized that further reforms will be necessary in order to meet the needs of its citizens.

33
3. g
Ov
Er
Na
NC
E i
N T
hE
lim
pO
pO
riv
Er
ba
SiN
– a
Sy
ST
Em
S a
pp
rO
aC
h
Mozambiquemozambique is currently in the process of transforming its water sector by implementing its Water policy of 2007. the policy clearly recognizes iWRm principles and, consequently, there is a shift to decentralized management. this policy also acknowledges the role of the private sector in water management and recognizes water and sanitation as a social and economic good. it is built on the principle of demand-responsive provision of resources and aims to reduce the direct influence of central government (aurecon, 2013). the national Water council and the national Directorate for Water (Dna), housed in the Department of public Works and housing, are jointly responsible for the planning, operation and monitoring functions regarding water resources (aurecon, 2013). the national Water law of 1991 provides a critical legal framework, emphasizing the need for inter-sectoral coordination of water management. this law also delegates water management to five Regional Water authorities established around the main water basins. the law establishes two general classifications of water bodies – common and private. common waters are free to use and do not require any license or payment, while private water use requires authorization by license or concession (aurecon, 2013). the national Directorate for agricultural hydraulics (Dnha), within the ministry of agricultural and Rural Development, directs water management for irrigation and drainage. together, the national Water law of 1991 and the Water policy of 2007 lay the legal and policy foundation for water management in mozambique, with the primary objective of creating a decentralized institutional structure organized by river basins to ensure local participation.
South Africasouth africa has been actively pursuing its decentralization agenda in water management, with the establishment of nine regional Department of Water affairs (DWa) offices. these have both a regulatory and sector support mandate, meaning that they each have a quality, allocation and disaster management function (aurecon, 2013). Water resource management is governed by the national Water act (36 of 1998), a document which mentions meeting international obligations as one of its purposes (aurecon, 2013). the act acknowledges the right to water for both basic human needs and for maintaining ecosystem functioning. this document is supported by the national Water Resource strategy (1997), which establishes catchment management authorities (cmas) and Water User associations (WUas). the policy reforms of 1997 and 1998 transformed water management structures, dividing the country into nineteen Water management areas (Wmas), four of which are located in the south african portion of the limpopo River Basin – the limpopo, luvuvhu and letaba, olifants, and crocodile Wma. the purpose of these Wmas is to delegate water management to the catchment level while involving communities in decision making. Despite this apparent devolution of decision-making and management, the Wmas are not yet functional entities, hence decision-making is still centralized at DWa. this has obvious implications for resolving highly localized challenges inherent in south africa’s water
system. local needs are de-emphasized in decision-making process, potentially reducing the appropriateness of policies.
the south african Department of Water affairs (DWa) is responsible for the nation’s water management system. it oversees the provision of water by provincial and municipal authorities and regulates the allocation of water through controlling the licensing process. the Water tribunal is an independent body that handles legal disputes over water resources. in the past, the Water tribunal has been able to provide an expeditious means of implementing the national Water act; however, there remains some confusion over its authority and functioning since its effective disbandment at the end of august 2012 (vermaak and strydom van Dyk, 2013). given the importance of water to south africa’s economy, increasing the authority and efficiency of the tribunal would encourage stronger water management in south africa.
Zimbabwethe ministry of Water Resources management and Development is the custodian for water rights, policies and development (aurecon, 2013). the year 1998 saw a significant shift in water policy, with the passing of the Water act and the establishment of the Zimbabwe national Water authority (ZinWa). these two changes shifted policies in Zimbabwe toward decentralized management, structured around catchments and sub-basins. the Zimbabwe national Water authority (ZinWa), a government-owned enterprise under the ministry of Water Resources Development and management, is responsible for urban water planning and supply, water allocation and provision for industry, agriculture and mining, dam management, and catchment council oversight, while the national action committee for Water and sanitation under the ministry of local government is responsible for rural water supply (aurecon, 2013). as with the current system in mozambique and south africa, Zimbabwe has a framework for decentralized water management, but it has not yet been fully implemented. similar to the south african case, having centralized decisions decreases the likelihood that local needs are met with appropriate policy changes and interventions. Zimbabwe has a new ministry for environment, Water and climate change (established in september 2013). this replaces the ministry for environment and natural Resource management and highlights climate change as a key issue in the broader frame of ministries.
3.1.5 Stakeholder participation and data sharing
in the Limpopo River Basin systemThe principles of IWRM have underpinned water reform but the voice of local stakeholders remains unheard. the acceptance of iWRm principles by most stakeholders has led to an increasing effort by saDc/WD, limcom, and the national water departments to promote greater participation in local water management. iWRm has been integrated into many of the region’s policies and management frameworks, and even into national growth and development plans in a few countries (notably Zambia in their 5th national Development plan). much of this change calls for decentralized decision

34
making; however, the lack of operational and technical capacity required for successful iWRm implementation prevents agencies from fulfilling their mandates. inevitably, local stakeholders’ voices remain unheard. this is an example of policies developed at a political economy level that prove difficult to implement at a local economy level. this is because the technical and operational aspects (and impacts) of implementation have not been clearly thought through. collaborative efforts by local communities, environmental ngos, and commercial farmers (e.g. the tuli Block Farmers association) have had limited success in countering mining and energy interests. noticeably missing from the debate are the voices of the subsistence farmers and the rural poor who populate the nearby areas.
3.1.5.1 The downstream vulnerability of Mozambiqueemerging from an extended period of civil war and political conflict, mozambique is only just beginning to realize its economic growth and development potential. continued, accelerated development in mozambique is dependent upon the supply of water resources for growing industrial, agricultural, and domestic use. over half the country’s area is positioned in an international water basin, with more than 50% of the country’s surface water emanating from river inflows from upstream countries (tauacale, 2002). mozambique serves as the downstream riparian for eight international river basins systems, and this equates to highly vulnerable national water security. mozambique’s dependence on upstream riparians for responsible and equitable water use explains the country’s level of commitment to transboundary water management through saDc/WD, the Zambezi Watercourse commission (Zamcom), and limcom. the dependency of flow-through into mozambique is contingent on south africa maintaining a high level of water governance, allocating a fair share downstream and being efficient in its use of water.
3.1.5.2 Information and Communication Systems in the Limpopo River Basin system
Robust communications enable the essential tools of transboundary water management, governance arrangements and policy. the accurate and consistent collection of many different types of data across many different fields of expertise is essential. an important role for limcom is data quality assurance, including the methodology of collection. critically, limcom (and saDc/WD) acts as the information communication mechanism. Fieldwork underpinning this analysis has shown that good data exists to support water management, but is not well communicated nor widely disseminated to users and decision makers – particularly at localized levels. local stakeholders will therefore continue to lack influence over national policies that affect them. moreover, this is not a solid foundation for regional cooperation and effective transboundary water management. Benefit sharing, a central enabler of regional cooperation, can only be effected when stakeholders understand benefits and consequences. Devolved communications are a critical success factor.
it is also the role of water management entities to continuously identify significant information gaps and
to secure feasible ways of resolving these. For example, telemetric monitoring of water levels is deficient, particularly in the Botswana and Zimbabwean portions of the basin, resulting in a paucity of much-needed data. national mechanisms for data management are outlined below.
BotswanaUnder the ministry of minerals, energy and Water Resources (mmeWR), the Department of geological survey is charged with conducting groundwater assessments, capturing and disseminating data to the public, monitoring private sector groundwater exploration programs, and advising the planning and management of water usage in the country. in the absence of one national platform for hosting hydrogeological data, the DWa maintains several separate datasets, which were last compiled in the national Water master plan Review completed in 2006.
Mozambiquethe Dna oversees the water agency, aRa-sul, which is responsible for the river basins in southern mozambique and the collection and management of hydrogeological data in the limpopo River Basin. Data collection is sparse due to inconsistent accessibility to sample collection sites (due to flooding or physical distance from testing facilities) and few operational hydrometric stations. Data is limited to water levels and stream flow, and does not yet include groundwater levels, water quality or sediment transport. all data collected in mozambique is linked to the saDc hydrological cycle observing system (saDc-hycos) system.
South Africasouth africa has the most advanced data collection and reporting system, and therefore provides the bulk of reliable data for the basin. Data is collected through a network of regional monitoring stations and is compiled by the DWa into the three main systems: surface water, gis data and water quality, and groundwater.
ZimbabweZinWa is responsible for overseeing the collection and publication of hydrogeological data; however, the decentralization processes, along with Zimbabwe’s political instability, has resulted in a paucity of reliable data. very little information exists regarding water quality, surface water levels, borehole locations, or groundwater levels.
3.1.5.3 Regional and Basin-level collaborationRegional collaboration in basin-wide research and communication has been limited. a common platform for data sharing is one of the most important steps toward meaningful transboundary decision making in the basin, yet a functioning platform for hydrologic data has not been realized. Botswana, mozambique, and Zimbabwe lack some of the technical and personnel capacity to implement and maintain extensive data gathering projects. in fairness, most south african data and information regarding water flows, as well as policies and strategic plans, have been placed on the internet as an open resource, free for all riparians to interrogate.
3. g
Ov
Er
Na
NC
E i
N T
hE
lim
pO
pO
riv
Er
ba
SiN
– a
Sy
ST
Em
S a
pp
rO
aC
h

35
Despite the regional recognition of the scarcity of water and of the extent of land degradation in the limpopo River Basin, development of the water resources continues and there are few implemented policies in place to rehabilitate degraded land and declining biodiversity. the long-term future for the basin is extremely constrained by land degradation, reduced biodiversity and limited water resources, as well as the search for large inter-basin transfer schemes. such schemes would bring in more than the four basin riparian parties, expanding them to the eight that are riparian to the Zambezi River, which include angola, malawi, namibia, tanzania and Zambia. the complexity of water management in the limpopo River Basin is thus becoming substantially more complex and will be increasingly constrained by the interests and agendas of a wider community – post-conflict peace building agendas notwithstanding. politically, the region appears to operate on separate internal political agendas with regard to water and biodiversity. climate change is set to exacerbate this situation. Further, with mozambique’s unique position as a receiving country (while all other riparians are contributors), the relationship with respect to water management between the countries is not straight-forward. south africa continues to generate 80% of the flows in the basin and dominates the economics and abstractions.
3.2 Biodiversity Ministries play a vital role in the management of biodiversity across the basin. in order to assess the dynamics of the institutions operating in the limpopo River Basin with a specific focus on biodiversity, a scoping matrix was constructed to link the institutions driving biodiversity management with the biodiversity programs in the basin system (appendix 1). acknowledging the rapidly evolving institutional base in this sector, the biodiversity matrix report shows that there are more than a dozen major institutions working within the biodiversity sector across the basin system. Four of these are environmental ministries, which also hold the mandate for the national climate change portfolio.
Transfrontier Conservation Areas extend conservation efforts beyond national borders. in order to encourage the cooperation of ministries responsible for biodiversity and to extend transboundary conservation efforts, the peace parks Foundation and the international Union for conservation of nature (iUcn) play defining roles in establishing transfrontier conservation areas. the great limpopo transfrontier conservation area is a case in point, which consists of south african, mozambican and Zimbabwean land. the area spans 37 572 square kilometers, comprising the limpopo national park in mozambique, the kruger national park in south africa, the gonarezhou national park, manjinji pan sanctuary and malipati safari area in Zimbabwe, as well as two areas between kruger and gonarezhou, the sengwe communal land in Zimbabwe and the makuleke region in south africa (sanparks, 2014). in mozambique, the government has developed a new conservation policy and the ministry of tourism (mitUR) is responsible for implementing the transfrontier conservation area (tFca) program.
the administração nacional das Áreas de conservação (administration of conservation areas) is an autonomous public agency responsible for managing all of the country’s protected areas, while the establishment of the Foundation for the conservation of Biodiversity (BioFund) provides the institutional framework for long-term management and sustainability of the conservation areas.
SADC plays an important regional strategic and coordination role but legislative authority is lacking. saDc published a Regional Biodiversity strategy in 2006, which aimed to guide sustainable development within the saDc region and to build the region’s capacity to implement the convention on Biological Diversity (cBD). this was a component of the saDc Regional indicative strategic Development plan (RisDp) of 2004, which recognized the importance of natural resources in the attainment of national development goals. an updated saDc Biodiversity action plan – the value of which is still to be determined – was presented by iUcn esaRo and approved in may 2013 (iUcn, 2013). the work done by iUcn and saDc in biodiversity emphasizes the harmonization of biodiversity policies for the region, increased cooperation between countries and a more focused effort by member countries themselves. however, much of the biodiversity agenda remains a national concern, with the guiding role that international organizations could play being limited by the political agenda and mandate of governments. Without legislative authority to conserve certain biodiversity areas, it is unlikely that international organizations will be effective in their conservation mandate without the support of governments.
Most of the well-established biodiversity institutions are located in South Africa. the matrix report shows that south africa has a larger number of well-established biodiversity institutions operating in the limpopo River Basin than Botswana, mozambique and Zimbabwe. the south african national Biodiversity institute (sanBi) and south african national parks (sanparks) are two such institutions, which are relatively well capacitated and provide valuable work in biodiversity conservation and management. it thus seems that south africa possesses comparatively heightened capacity and better resources in relation to the other riparian states of the basin. given the fact that biodiversity conservation remains largely a national prerogative, it is likely that south africa will remain at the forefront of conservation within the basin.
All four countries have committed significant areas to national protection, but the rate of implementation varies. there are national parks implemented across the basin where no hunting or extraction of wildlife or biodiversity is allowed. the success of these formally protected areas depends largely on the ability of the state to ensure their functionality and to prevent poaching; however, if managed with sufficient capacity, the legislative authority of these areas provides the highest level of protection. protected areas include national parks and marine protected areas managed by the national government, public nature reserves managed by provincial and local governments, and private nature reserves managed by private landowners. there are a number of other formally protected areas within all four countries with classifications such as state Forest areas (Zimbabwe), safari areas (south africa,
3. g
Ov
Er
Na
NC
E i
N T
hE
lim
pO
pO
riv
Er
ba
SiN
– a
Sy
ST
Em
S a
pp
rO
aC
h

36
Zimbabwe and mozambique), and national monuments and World heritage sites (Botswana, Zimbabwe, south africa and mozambique); however, levels of protection and effectiveness differ significantly between these countries and sites. according to the World Bank, national terrestrial protected areas (as a percentage of total land area but excluding marine areas) are 6.2 percent in south africa; 27.2 percent in Zimbabwe; 37.2 percent in Botswana and 17.6 percent in mozambique respectively. Difficulty has been experienced in Wildlife management areas (Botswana and Zimbabwe) – areas that are formally recognized as conservation areas but are managed in partnership with local communities. some level of resource use and extraction from these areas is allowed; however, these are not meant to prejudice the health of the ecosystems (parry and campbell, 1990).
There are a significant number of institutions working in the Limpopo River Basin which deal with biodiversity as a sub-sector. these range from academic institutions such as universities, to development banks such as the Development Bank of southern africa (DBsa), and donor organizations such as UsaiD. in terms of regional work, organizations which specialize in biodiversity are the United nations human settlements program and the international Food policy Research institute; however, there are a large number of organizations which deal with a range of themes, including climate change and water, alongside biodiversity. to name just a few, the United nations Development program (UnDp), global Water partnership (gWp), Food, agriculture and natural Resources policy analysis network (FanRpan), and the center for environmental economics and policy in africa (ceepa) are such institutions. interestingly, a similar institutional map of the water sector shows hardly any institutions that have either climate or biodiversity as a sub-sector. the majority of the institutions represented in the ‘water’ matrix are either national water boards and associations, or national ministries in charge of water affairs and water resource management (appendix 2). this may mean that biodiversity is not yet a high enough national priority to demand such state-driven attention, or that biodiversity management is more successfully achieved through cooperative work with other themes such as climate change. the scoping matrix report also reveals a predominance of south african institutions in comparison to those of the other riparian countries of the basin.
3.3 Climate changeThe institutional structure of climate change work in the Limpopo River Basin is much less concentrated than that of water or biodiversity, with many organizations operating with climate as a sub-sector rather than their primary focus. national environmental departments of the four riparian countries are such institutions, dealing with climate change as only one of their many mandates (oneWorld, 2013).
Adaptation to climate change in southern Africa is highly localized and local institutions and government are the mechanism by which external interventions are able to facilitate adaptation. local institutions thus determine the effectiveness of adaptations through the incentives they create in attracting climate change interventions (agrawal, 2010). there is a paucity of literature about the importance
of institutional arrangements in climate change adaptation; however, regional southern african climate change strategies and plans are limited. climate change remains mostly a national agenda within the countries sharing the limpopo River Basin.
All four of the countries within the basin have ratified the important global climate change conventions. these include the Un Framework convention on climate change (UnFccc), which came into force in 1994, and the kyoto protocol. there are several regional responses to climate change which operate through the basin, either implemented by sub-regional inter-government organizations such as saDc, or through development partner funded programs sponsored through civil society organizations and consultancies.
SADC’s focus on climate change tends toward early warning systems of droughts and floods, such as saDc’s task Force for monitoring Weather conditions. the saDc climate services center is located within the saDc Food and natural Resources secretariat, the saDc secretariat that holds the regional mandate for climate change. other saDc climate outlook units include the Regional early Warning Unit, the Regional Remote sensing project, the Famine early Warning system and the climate services center (previously known as the Drought monitoring centre) (chishakwe, 2010).
Much of the authority to respond to climate change remains within national borders. in terms of the national climate change agenda, strategies and programs are spearheaded by national governments with funding from either internal government sources or external funders. although some programs implemented by civil society have support from government, much of the authority as to which institutions will deal with climate change and how strategies and plans will be implemented remains within national borders.
South Africa has by far the largest mitigation, adaptation and supporting measures in place where departments of energy, environment, Water and agriculture are all somewhat involved in the climate change agenda. the climate change agenda has also been incorporated into local government in south africa, with the city of cape town and ethekwini metropolitan municipality being leaders in their approach to localized involvement in climate change. south africa also has a national implementing entity (nie) accredited through the adaptation Fund Board, allowing the country direct access to the adaptation Fund.
Zimbabwe, in comparison, shows a limited amount of national involvement with the climate change agenda, with the initiative of coping with Drought and climate change project being one of the few national initiatives. the country currently has a robust Draft climate change Response strategy and action plan on the table for participatory review and consultation prior to finalizing (takawira and petrie, pers. comms, 2014). the first draft of the national climate change Response strategy has been written and is expected to result in a published climate change policy and a national action plan for adaptation and mitigation in the near future (gogo, 2013).
Botswana’s national approach to climate change has also been relatively limited, with the initiatives of the United
3. g
Ov
Er
Na
NC
E i
N T
hE
lim
pO
pO
riv
Er
ba
SiN
– a
Sy
ST
Em
S a
pp
rO
aC
h

37
nations program on Reducing emissions from Deforestation and Forest Degradation (ReDD) and land Use, land-Use change and Forestry (lUlUcF) being the two main drivers of climate change mitigation initiatives. Botswana, like Zimbabwe, has only recently engaged with the creation of a national climate change strategy. in 2013, Botswana convened an inception workshop to initiate a stakeholder-focused process for the development of a national climate change policy and comprehensive strategy and action plan (nccsap) (musonda, 2013).
mozambique has probably made the most progress in developing both climate change response strategies and establishing clear, mandated institutional arrangements for cross sector collaboration. in terms of policy, the country’s disaster relief agency, instituto nacional de gestão de calamidades (ingc), developed a climate and disasters strategy which was published in 2010 and underpinned by a number of detailed studies and analyses. micoa, the ministry for coordination of environmental affairs, led the
development of an approved climate change response strategy, which included public consultations and was published in late 2012 (artur and tellam, 2013). the country’s institutional arrangements have also been cabinet approved and mandated for cross-sector collaboration in responding to climate change. in February 2013, mozambique launched its green economy policy, while conDes, the ministerial council for sustainable Development, includes climate change under its mandate. a technical committee on climate change, which has a recently appointed, full-time coordinator, advises the conDes ministerial council. this committee comprises representation from the sectors considered to be the most vulnerable to climate change in mozambique. lastly, mozambique has also been positioning itself to improve its climate finance access and absorptive capacity, with its environmental fund, FUnaB, undergoing accreditation for direct access of climate funds from the adaptation Fund. this also positions the country for accessing the green climate Fund (gcF).
3. g
Ov
Er
Na
NC
E i
N T
hE
lim
pO
pO
riv
Er
ba
SiN
– a
Sy
ST
Em
S a
pp
rO
aC
h

38

39
the design of the Resilim program supports much needed endeavors to open the flows of the limpopo River Basin and strengthen important ecosystem services. attaining these two objectives will require interventions to complete critical research gaps, build resilient institutions and implement essential adaptations to climate change, while at the same time enhancing biodiversity conservation and improving water quality and flows, but will result in long-term resilience across the basin system.
Water scarcity and poor water quality (further threatened by climate change) may well become the driver of regional cooperation in saDc’s many shared river basins, including the limpopo River Basin. Ultimately, vested national interests can only be secured in a water secure environment and the resources in the basin are potentially too valuable to let go. the alternative is conflict; however, it is likely that the current post-conflict reconstruction, development and peace building imperative will prevail. it is evident that building resilience and opening water flows in the basin can only be achieved through transboundary and collaborative interventions and through a systems approach. a piecemeal approach will have little, if any, impact.
although south africa, as both the main abstractor and generator of water, is the hegemon in the limpopo River Basin (now and historically), there are drivers at play that point to a different future. Resource competition is becoming fiercer as the basin’s populations grow and urbanize, previously underdeveloped economies enjoy accelerated expansion, political power starts to shift, and the risks of climate change are realized.
4.1 Building institutions for resilience – and strengthening the political economy
Resilient institutions are a critical success factor to strengthening adaptive capacity and building resilience. strong institutions, built on a shared vision, are needed to redress the balance of power in the limpopo River Basin system. the status quo review of the political economy and institutional arrangements at play across the basin system (see chapter 3) highlights the inconsistencies across countries and sectors. south africa stands out as having the most robust institutions across all three sub-systems and, unsurprisingly, the water sector has the most mature regulatory framework. in addition, the challenges of having an embryonic and under-resourced RBo (limcom) leading the way to implementing a shared vision for regional cooperation and benefit sharing is discussed.
Research conducted by various regional institutions and experts (aurecon 2013, ashton, 2008) demonstrates that more rigorous control is required over water abstraction across the basin. this involves transboundary planning, review and decision making, as well as monitored, national implementation. only a coherent body of knowledge, both existing and new, can inform sound transboundary and national decisions and implementation. packaging this strategically to support decision making is an important role for limcom, supported where possible by national water and catchment management agencies, as well as the saDc/WD. as demonstrated by the robust regional research drawn on in developing this report, regional expertise does exist and can be used to enable the RBos to deliver useful, local knowledge and fill critical research gaps.
The basin and national level enabling environment needs to be strengthened. taking the lead from the saDc multi-stakeholder Water Dialogue held in lusaka in october 2013, policy dialogue should be systems-based and coordinated by limcom and saDc/WD. all three sub-systems need to be involved, and strong institutions are needed for effective participation in these processes to ensure both equitable policy development and feasibility of implementation. although most countries in the basin system have undergone water sector reforms, not all are complete, and alignment between countries on some important aspects (such as implementing decentralized approaches to water management and implementing iWRm principles) is needed. moreover, the differences in maturity of policies and regulations between water, biodiversity and climate is significant – although unsurprising. Basin-scale adaptations mean engaging legislative and governance approaches across all sub-systems in all four riparian countries to encourage greater rigor in protecting the resources for the mutual benefit of all. limcom, supported by saDc/WD and regional expertise, can facilitate the process of reducing the differences and aligning the regulatory frameworks where appropriate.
the adaptation strategies to be developed, through Resilim, may well be the working tools with which to catalyze transboundary co-operation and binding regulatory frameworks.
Institutional mandates need to be reconsidered. in all instances, mandates need to be clear, realistic and measurable. For example, what can realistically be expected of limcom in terms of deliverables? What is needed from national institutions and those representing other transboundary sub-systems to promote collaborative resilience building that ultimately enhances national interests?
The political and local economies need to be strengthened
Conclusion: Sustaining the flows
4

40
CO
NC
lu
SiO
N:
Su
ST
aiN
iNg
Th
E f
lO
wS
and brought closer together. south africa, in the role of major abstractor, is in a position to lead, promote and implement regional cooperation, primarily through setting an example – and not as the limpopo River Basin system hegemon. as a recent addition to BRics, south africa is acquiring growing donor status in africa, starting with the re-establishment of the african Renaissance Fund as the south african Development partnership agency (saDpa). saDpa, under its principle, the Department of international Relations and cooperation (DiRco), would do well to promote, in real terms, regional cooperation through partnership (lucey and o’Riordan, 2014) – starting in the water sector in support of limcom. in so doing, it is critical that the needs and practices of the local economy are carefully considered. in other words, policies and regulatory frameworks that promote transboundary cooperation through water management will not work if local level operational and technical issues are not taken into account.
4.2 Important research gaps existas discussed, a strong body of knowledge is a prerequisite to coherent regional and national planning, decision making and implementation. it is also critical that this knowledge is accepted by the basin countries, meaning that the local development context is apparent, transparent and understood.
the studies underpinning this synthesis report have not included an extensive analysis of the research gaps in the basin and so this report draws only on what has been observed. One key research gap (possibly the most important) is an economic analysis for planning and decision making. transboundary and national planners, as well as donors and development partners, need to understand the costs of the different uses of an increasingly scarce resource and the related benefits. cost Benefit analyses (cBa) can guide the resilience building investment process and provide
Developing countries have to find innovative ways of protecting their biodiversity in the face of strong development needs. public budgets are limited and trade-offs are required as to where money is spent. often these choices favor economic growth and job creation rather than ecosystem protection. combining these two – the need for jobs and biodiversity preservation – provides a potentially powerful resilience-building tool for the basin. public Works programs, which aim to alleviate poverty and create employment while providing a public good such as healthy natural resources, are one such tool.
in terms of accelerating the pace of change of policy, using the combined benefit of employment and environmental protection/restoration is useful. additionally, monetizing the cost to society of a decline in an ecosystem can act as further impetus for policy change. in this way, the costs and benefits of such a program can be explicitly weighed up.
the Working for Water, Fire, Wetland and Woodlands projects are part of the south african expanded public Works program policy (located in the Department of environmental affairs) to alleviate poverty by creating employment. they serve as useful examples for the basin about a potential means of protecting/restoring the basin’s biodiversity.
Working for Water: (WfW) initiated in 1995, is an innovative conservation initiative that clears alien invasive plant species (estimated to have reduced south africa’s maR by approximately 7%) along catchment areas. more than one million hectares of invasive alien plants, currently the biggest threat to
plant and animal biodiversity in south africa, have been cleared. WfW has provided jobs and training for about 20,000 people with over 300 projects in all nine provinces and has sustained political support. the WfW program focuses solely on improving water delivery and as a result two programs evolved to promote habitat restoration.
Working for Wetlands: (WfWet) restores and rehabilitates south african wetlands (of which 65% are under threat). Using national Freshwater ecosystem priority areas (nFepa) wetland rehabilitation is planned on a catchment scale and involves re-planting in degraded areas. in the 12 years since its inception, 70,000 hectares of wetland area have been secured or restored, while providing 12,848 work opportunities.
Working for Woodlands: Working for Woodlands incorporated two programs in the albany thicket Biome in the eastern cape, south africa, namely the african Rural initiatives to sustainable environments (aRise) and the sub-tropical thicket Restoration projects. intensive livestock farming has caused extensive degradation of these vulnerable succulent thickets which are part of the maputaland-pondoland-albany Biodiversity hotpot.
Working on Fire: (WoF) launched in september 2003, has fully trained over 5000 veld and forest fire fighters (of which 85% are youth) and appears to have impacted on improving livelihoods. WoF promotes the prevention and control of wildfires and aims to support integrated Fire management (iFm) practises in south africa.
Box 4.1 The role of social programs in securing biodiversity

41
CO
NC
lu
SiO
N:
Su
ST
aiN
iNg
Th
E f
lO
wS
critical information, such as the investment costs and expected economic benefits of resilience building actions (e.g. restoring degraded land along the river – see 4.3 below).
Monitoring the progress of climate change is another critical research gap. Weather prediction systems are needed not only for improved forecasting, but also to monitor the changes in climate, both gradual and extreme. the latter is predicted to become more frequent and intense. it will be immensely useful to the limpopo River Basin system, and the region as a whole, to be able to track the extent of these changes and related impacts (financial, economic and livelihood costs). not only will this aid planning and inform risk management and preparedness, it will also strengthen the region’s arguments in the multilateral negotiations on issues such as loss and Damage.
in terms of enhanced knowledge on biodiversity, nuanced analysis of biodiversity patterns across the Limpopo River Basin system is required. Whilst there is sound knowledge of where the high priority biodiversity areas are, strong evidence of related patterns and trajectories of change is missing. For example, that seasonal rainfall affects vegetation-fire dynamics is understood. however, how these dynamics will shift in the face of changing temperatures, and to what extent, is not known. also, whilst we know which species are endangered, we do not know the related implications for ecosystems services such as food production or eco-tourism, or how the loss of endemic species might impact crucial biodiversity feedback systems. Recent research particularly highlights the need to strengthen understanding of the crucial links between biodiversity and agriculture, since much of the basin’s economic and livelihood activities are based on food production.
Planning for a resilient future in the basin system will benefit from futures scenarios. planning for a changing climate is one issue, but planning for a different climate in a future development context is another. scenarios, as a means of planning for uncertainty, allow for informed, yet flexible decision-making. scenario planning for the future is also useful in bringing different decision making groups and countries together in a collaborative process. these, and other interventions, will be important as the basin organizational system starts planning for proactive conflict management and possible dispute resolution mechanisms in a resilient basin. participatory analysis in scenario planning (and other analyses) is highly recommended as a mechanism for bringing the local and political economies closer together.
there is a paucity of information available on the economic value of biodiversity and related ecosystem services. specifically, understanding the value of biodiversity, as well as the value of eco-reserve or biodiversity buffer zones, will also provide the economic argument for protecting the high altitude catchments in the basin. generally, being able to make an economic case for taking action, alongside a social and/or environmental case, helps promote political will and decision making. in many instances in the field of biodiversity, while important for creating jobs, social programs such as Working for Water (see Box 4.1), are the key
to biodiversity security. the economic benefits of this may only become explicit through ecosystem services (improved food production, enhanced water flows and improved water quality), but are likely to be significant. For example, research has shown that payment for ecosystem services (pes) has emerged in south africa through the establishment of the government’s WfW program, and the way in which the new Water act has paved the way for future development and expansion of this financing system (turpie, 2008).
More detailed analysis of tipping points or critical thresholds and understanding the key risks in the Limpopo River Basin may be required. the analyses underpinning this report have explored possible critical thresholds through the eight representative resilience action areas. these need further participatory-based analysis for validation before definitive statements can be made on which points in the basin system are at a critical threshold and which are not. Further quantification and modeling of some of the identified potential tipping points and risks or consequences (of action or inaction) may also be required.
4.3 Adaptations for resilience-building
the high altitude catchments are centers of endemism and high priority biodiversity areas, water producers, and sustainers of resilience.
strategic interventions for opening river flows are needed at scale throughout the basin. securing the basin’s high altitude catchments secures water flows upstream for downstream benefit. should all the key catchments be secured, water flows will be sustained – increasing resilience in the basin. at the same time, protecting biodiversity to enhance ecosystems also necessitates the conservation of the mountain ranges where the centers of endemism and high biodiversity are located.
protecting and securing the high altitude catchments is therefore well aligned with the overriding principle of taking the ‘low regrets’ option of adaptation, and thus avoiding committing the basin to only one possible path of future water resources management and resilience building. options must be kept open. Based on the above analysis, the following paths suggest themselves: a critical focus on conserving and maintaining the high altitude–high rainfall grassland and forest catchments.
this and the other important resilience building adaptations (securing groundwater, improving water quality and restoring degraded land) will need to proactively be driven by, and implemented in, south africa – along with regional cooperation and support. the largest proportion of the basin is within the borders of south africa, and it too has the highest runoff generation (79%) for the basin in terms of total catchment areas. it follows that south africa has the lion’s share of the responsibility to commit to the protection and efficiency of resource abstraction – all but two of the basin’s high altitude catchments that need to be secured

42
are located within south africa’s borders and fall under south african jurisdiction. most management changes and adaptations for resilience in the basin system therefore must take place in south africa.
4.3.1 Securing high altitude catchmentshigh altitude catchments generate up to 100 times more runoff per unit area than lower-lying, lower rainfall areas (middleton and Bailey, 2008). the impact of securing these across the basin can therefore be at significant scale, as securing even one catchment has multiple downstream benefits. From a hydrological point of view, maintaining sustainable stream flows into lower parts of the catchment, particularly during the dry seasons, will result in the preservation of these areas of water contribution, which are critically important to the water resources of the basin. it is for this reason that maintaining the runoff potential of these areas must be a priority strategy for the continued supply of good quality water to the surrounding and downstream lowland farming areas and towns. this recommendation also supports the published national protected areas expansion strategy of the Department of environment affairs of south africa (Dea, 2008) – a strategy for the conservation of protected areas to promote ecological sustainability and climate change adaptation in south africa. this strategy is also likely to be well received in Botswana and Zimbabwe, as increased levels of protection will be afforded to the tswapong hills and the matopos hills respectively.
Securing high altitude catchments is especially pertinent to South Africa as the country generates 60% of all water in the Limpopo River Basin. ecosystem functioning and biodiversity has the important additional payoff of conserving ecosystem services (water production in the dry season), thereby increasing the resilience of downstream settlements with significant transboundary implications and benefit. additional payoffs cited in the Dea (2008) strategy include promoting rural livelihoods and supporting socio-economic development. it is noteworthy that the report lists areas in the high altitude catchments also identified in this analysis: the Blouberg-langian Reserve (soutpansberg) (focus area #5) and the northeast escarpment (focus area #29), which includes the lekgalameetse and Wolkberg reserves. the Dea (2008) report also identifies the Waterberg region as a further area of concern.
protection of all of these areas is an attainable goal. the north-east escarpment and mountain uplands are already majority owned by the state, and increasing protection through improved governance is achievable. much of the Waterberg is managed through (private) game farms or reserves and is already under a level of protection. the risk and vulnerability analysis underpinning this synthesis report brings additional high altitude catchments into focus as requiring increased protection: sekhukhune, strydpoort (just south of polokwane), the tswapong hills and the matopos hills.
4.3.2 Restoring degraded landa strategy of re-establishing the vegetative (biomass) cover over large areas of degradation needs to be considered.
Widespread soil erosion is the largest symptom of this degradation and apart from loss of water-holding capacity and productivity, it results in high levels of sedimentation in the rivers and reservoirs. as most of this degradation is a result of heavy livestock grazing pressure, even in parts of the basin such as Botswana where population density is low, reducing the number of livestock on the land is required. most of the degraded land is held under customary tenure and on communal land (Fao, 2004), although privately owned commercial farms (game, cattle, crops) are a significant feature of the south african and Botswana limpopo River frontage. livestock farming is one of the few wealth generating options open to people and is a low or zero-input based system. veld management tends to be poor, increasing the vulnerability of the farmers to climate shocks, particularly drought (Fao, 2004).
an increased vegetative cover is important for combating soil erosion, as it reduces the erosive impacts of intense convective rainfalls which drive erosion and sediment transport. healthy vegetation is also adaptive to higher air temperatures brought on by global warming. such adaptations would be focused on the sekhukune, capricorn and vhembe district municipalities where the problem of environmental degradation is most severe. changes in cultural approaches to land management, as well as farming systems and land tenure, would be required (Fao, 2004). this will not be easy to achieve because there is a strong focus in these areas on maintaining traditional approaches to communal land management and allocation. issues pertaining to improving land tenure remain the stand-out features necessary for securing increased investments into reducing the degradation and restoring land quality. changes such as moving from open access of grazing lands - in terms of both restricted usage and decreased livestock density whereby water flows and stability should increase - would need to be undertaken incrementally. land tenure changes are complex, necessitating new approaches to policy and traditional, private and public land usage. Diversion of people into other economic opportunities is urgently needed as a way of managing the effects of such a change. although options for diversification are often not available, the land restoration process can be designed to include socio-economic opportunities such as alternative farming practices and diversification of farming activities. these activities could, for example, include ‘farming water’ where government programs, or private industry, pay for the benefit of increased water conservation and flows (see Box 4.1).
4.3.3 Enhancing water quality the problem of poor water quality, particularly in the olifants and crocodile (West) river systems, requires sustained efforts towards improvement. improved quality of water in the river systems means a greater quantity of water is available for maintaining aquatic ecosystems and for abstraction and use in domestic and farming systems. there is, however, little information regarding the necessary ecological reserve across the limpopo River Basin, evident by the scant attention given to it by recent basin-wide assessments (see aurecon, 2013). this gap in knowledge needs to be redressed. the acidic decant from defunct coal mines
CO
NC
lu
SiO
N:
Su
ST
aiN
iNg
Th
E f
lO
wS

43
on the mpumalanga highveld must be neutralized. new mining ventures in this region require close attention to their environmental management and waste streams, meaning a more stringent regulatory environment and enforcement thereof. the problem is best tackled on a sub-basin by sub-basin approach, in which the greatest contributors to poor water quality are resolved first. this might be the decant from defunct coal mines in the upper olifants River tributary or the exceptional eutrophication in the crocodile River.
4.3.4 Seasonal weather forecasting an improvement in the understanding of regional climate circulation and behavior with respect to the el niño southern oscillation (enso) and the indian ocean dynamics is required. current seasonal climate projections for southern africa at the saDc climate services centre, as well as other academic institutions in south africa, have had a relatively limited success rate in forecasting seasonal rainfalls. coupled with a lack of capacity regarding utilization of the outputs, this begs the question as to whether they add sufficient value (Dr p Johnston, pers. comm.). improving the situation would require some sustained investment into regional climate modeling and climate behavior. this should be aimed at a more accurate medium-term prediction of droughts, which will enable decision makers within the region to implement change management strategies of, for example, water
resources. this intervention will require a focus on the climate science of the region and should specifically look at the relationships between enso, the indian ocean dipole and the position of the intertropical convergence Zone (itcZ). climate-land surface interactions will also need to be better accommodated into this research. at present, much of the climate-based science appears to be going into global circulation models (gcm) projections five to seven decades into the future. it would be more useful to focus on a shorter-term objective of understanding how regional atmospheric circulatory changes and pacific and indian ocean dynamics can be used to derive improved shorter- to medium-term projections of the likelihood of drought.
severe storm warnings are already a focus of the south african Weather service (saWs), which serves the southern african (saDc) region, but there remains a large amount of work to be done to reduce the human impact and severe displacement of people when major floods occur in the lower limpopo region. much of this has to do with farming systems within the lower limpopo River floodplain, which is intensively cultivated. Floods will be unavoidable and people will continue to farm the floodplain, therefore, the most effective responses will be to target how and where settlements are located, how early warnings are distributed, and what the appropriate responses are in the face of an oncoming flood.
Indian Ocean
Zimbabwe
Botswana
Mozambique
South Africa Swaziland
Maputo Pretoria
Gaborone
Bulawayo
Figure 4.1 High biodiversity, high runoff catchment areas (green) juxtaposed against lowland degraded land (red) in the Limpopo River Basin.
CO
NC
lu
SiO
N:
Su
ST
aiN
iNg
Th
E f
lO
wS

44
Box 4.2 Adaptations in Mozambique
4.3.5 Groundwatera greater focus on groundwater is required throughout the limpopo River Basin. the 2009 saDc multi-stakeholder Water Dialogue, held in Johannesburg, correctly introduced a focus on this often ignored issue. groundwater will be one of the key resources that will maintain the economy in the basin (ashton et al., 2008; aurecon, 2013), and these have already occurred to some extent in parts of south africa and Botswana. Forward thinking, careful monitoring and the management of the land surface (e.g. not locating pit latrines on a shallow dolomitic aquifer system as is the case in Ramotswa) are required. Future developments and exploitation of groundwater resources in the mozambican part of the basin are an important opportunity in this drought-prone area that is primarily dependent on agriculture for its economy and livelihoods. the careful management and preservation of groundwater resources across the basin will become a critical element of future sustainability.
climate change will likely have a large impact on groundwater in the basin if it affects the rate of recharge (the water flux from the surface to the water table, replenishing depleted reserves that may have been drawn down through borehole abstraction). this will happen primarily if the frequency and intensity of severe weather can generate sufficient surface flow to produce enough percolating water able to penetrate beyond the root zones of most plants, and then contribute to rising groundwater levels. groundwater levels respond most strongly to severe storms, with minor storms appearing to have little impact. the zones with the highest recharge tend to be those with the highest rainfall, i.e. the higher altitude catchments. the use of mean annual precipitation (map) to estimate recharge is a crude device and recharge estimates might be better undertaken by measuring rainfalls over certain high thresholds. other options for improving matters could be to undertake the following:
1. establish the locations of preferential recharge zones2. Research recharge (spatially and over time) 3. Better identify sustainable abstraction rates over
different parts of the basin4. Better understand the hydrological dynamics of the
fractured system aquifers, including their sustainable yield (the unconfined alluvial systems seem to have been relatively well understood and are exploited very heavily in some instances)
5. create physical infrastructure that enhances recharge, which might include structures to temporarily pool surface water and encourage infiltration.
6. apply much greater attention to maintaining the groundwater infrastructure, including borehole integrity and pumping capacity.
overall, groundwater in the basin is the one remaining water resource that will allow further exploitation, but obviously substantial caution must be applied in order to maintain a sustainable groundwater supply.
4.4 The way forwardthe transition of the limpopo River from an ‘open’ river system to one that is ‘closed’ is well documented in the Water Resource commission Report # 1220/1/04 (turton et al., 2004).
a ‘closed’ system status, meaning there is no water left to allocate, indicates that an important threshold has been reached. Rapidly growing populations, urbanization, accelerated economic development (increasing abstraction needs for agriculture and industry), along with climate change, is pushing the limpopo River Basin system to a critical threshold, placing existing flows in the basin at risk and threatening livelihoods, economies and biodiversity. the only way to avoid this tipping point is to protect critical biodiversity and what it represents, thereby opening and sustaining flows in the basin.
taking an adaptive management, or learning by doing approach, in undertaking the restorative and protection measures (outlined in 4.3) will largely mitigate the risk of the basin system reaching this point of no return – particularly if these actions are taken collectively. in particular, participatory analysis emphasizes that high level governance arrangements, including developing and entrenching a shared vision for managing the basin – or top-down solutions – need to be developed simultaneously with bottom-up adaptation options. this is because solutions are needed at both the political and local economy levels, and such an inclusive, integrated approach has the added advantage of improving policy.
in their capacity as decision makers, people are the key to unlocking the basin’s potential and to preserving what exists. therefore, as the remainder of the Resilim program moves from gathering evidence to focusing on validating and designing the key transboundary adaptation and resilience building strategies that will secure the future of the basin, a stakeholder–led process that includes participatory analysis is recommended.
in order to build a localized effective early warning system in flood-prone areas in mozambique, a decentralized system has been implemented in key areas. For example, a simple system is used whereby selected individuals in villages are entrusted to measure precipitation levels and gauge river levels. if the level increases beyond a certain point, radio messages are immediately sent by trained assistants from the local population, and a coordination center assesses whether to issue a flood warning. megaphones or radio announcements are then used to spread the message rapidly. in order to increase local resilience, structural disaster reduction strategies are used via buildings that serve a dual purpose. For example, a classroom block in maniquenique functions as a classroom in low risk periods and as a safe haven in high risk periods. the building was built with wooden poles, cemented pillars and lateral structures, corrugated iron sheets and a reinforced roof (cadribo, 2012).
CO
NC
lu
SiO
N:
Su
ST
aiN
iNg
Th
E f
lO
wS

45
acronyms
aR4 Fourth assessment ReportaRise african Rural initiatives to sustainable
environmentsBic Bushveld igneous complex cBa cost Benefit analysiscBD convention on Biological Diversity cBnRm community-based natural resource
management ccam cubic conformal atmospheric modelceepa center for environmental economics and
policy in africacmas catchment management authorities comesa common market for eastern and southern
africaDBsa Development Bank of south africa Dea Department of environmental affairs DiRco Department of international Relations and
cooperation Dna national Directorate of Water affairs Dnha national Directorate for agricultural
hydraulics DWa Department of Water affairsenso el niño southern oscillation FanRpan Food, agriculture and natural Resources
policy analysis network Fao United nations Food and agricultural
organization gcF green climate Fund gcms general circulation models gis geographical information systemsgiZ german technical cooperation agency gRip groundwater Resource information project gWp global Water partnership iFm integrated Fire management ingc instituto nacional de gestão de
calamidades ipcc intergovernmental panel on climate
changeisDR international strategy for Disaster
Reduction itcZ intertropical convergence ZoneiUcn international Union for the conservation of
nature saDc FanRiWRm integrated Water Resource management Jptc Joint permanent technical committee JUlBs Joint Upper limpopo Basin study lBptc limpopo Basin permanent technical
commission limcom limpopo Watercourse commission ltas long-term adaptations scenarios
ResearchlUlUcF land Use, land-Use change and Forestry
mai massingir agro-industrial project mam march-april-may map mean annual precipitation micoa ministry for coordination of environmental
affairsmitUR ministry of tourism mmeWa ministry of minerals, energy, and Water
Resources mmeWR ministry of minerals, energy and Water
Resourcesnccsap national climate change policy and
comprehensive strategy and action plan nFepa national Freshwater ecosystem priority
areasnie national implementing entitypes payment for ecosystem servicesResilim Resilience in the limpopo River Basin
program RBo River Basin organization saDc southern african Development communitysaDc DRR saDc Disaster Risk ReductionsaDc RisDp saDc Regional indicative strategic
Development plan saDc/WD saDc Water Division saDc-hycos saDc hydrological cycle observing
system saDpa south african Development partnership
agencysanBi south african national Biodiversity institute sanparks south african national parks saWs south african Weather service son september-october-novembertFca transfrontier conservation area tptc tripartite permanent technical commissionUnDp United nations Development programme UnFccc United nations Framework convention on
climate changeUn-ReDD United nations Reducing emissions from
Deforestation and Forest DegradationUsaiD United states agency for international
Development Wci Water crowding index WfW Working for WaterWfWet Working for WetlandsWmas Water management areas Wmo World meteorological organization WoF Working on Fire WRc Water Resources councilWUa Water User associationWUc Water Utilities corporation Zamcom Zambezi Watercourse commissionZinWa Zimbabwe national Water authority
aC
rO
Ny
mS

46
dE
fiN
iTiO
NS definitions
Exposure: the character, magnitude and rate of climate change and variation to which a system is exposed.
Sensitivity: the degree to which a system is affected, either adversely or beneficially, by climate variability or change. the effect may be direct or indirect.
Adaptive capacity: the ability of a system to adjust to climate change (including climate variability and extremes) to moderate potential damages, to take advantage of opportunities, or to cope with the consequences.
Impact: the effects of climate change on natural and human systems. (potential impacts: all impacts that may occur given a projected change in climate, without considering adaptation)
Risk: the probability or threat of quantifiable damage, loss, or any other negative impact that is caused by external/ internal vulnerabilities, and that could be avoided by pre-emptive measures
Vulnerability: the degree to which a system is susceptible to, and unable to cope with, adverse effects of climate change, including climate variability and extremes. vulnerability is a function of the character, magnitude and rate of climate change and variation to which a system is exposed, its sensitivity, and its adaptive capacity.

47
rE
fE
rE
NC
ESreferences
agrawal, a. (2010) chapter seven: local institutions and adaptation to climate change. social Dimensions of climate change: equity and vulnerability in a Warming World. the World Bank. Washington, Dc.
allafrica, author unknown. (2012). mozambique: guebuza visits sugar project in massingir. allafrica news. 11 november 2012. online: http://allafrica.com/stories/201211120298.html
artur, l. and tellam, i. (2013). tracking adaptation and measuring Development (tamD) in mozambique. oecD environmental Directorate. online: http://pubs.iied.org/pdfs/g03621.pdf
artur, lu., hilhorst, D. (2012). everyday realities of climate change adaptation in mozambique. global environmental change 22 (2012) 529–536. online: http://www.sciencedirect.com/science/journal/09593780/open-access
ashton, p.; hardwick, D. and Breen, c. (2008). changes in Water availability and Demand withing south africa’s shared River Basins as Determinants of Regional social and ecological Resilience. in: (eds.) m. Burns and a. Weaver. exploring sustainability science: a southern african perspective sUn pRess. pp 279–310.
ashton, pJ and turton, aR. (2008). Water and security in sub-saharan africa: emerging concepts and their implications for effective Water Resource management in the southern african Region. technical report, in (eds).) in Brauch, h.g., grin, J., mesjasz, c., Behera, n.c., chourou, B., spring, U.o., liotta, p.h. and kameira-mbote, p. globalisation and environmental challenges: Reconceptualizing security in the 21st century. Berlin: springer verlag. chapter 56.
aurecon (2011). Development of a Reconciliation strategy for the olifants River Water supply system: Wp10197. technical report, Water Quality Report, Report no.: p Wma 04/B50/00/8310/7, Report submitted to the Department of Water affairs by aurecon.
aurecon. (2013). limpopo River Basin monograph lRBms-81137945: Draft Final monograph, technical report, aurecon amei (pty) ltd Report number 8337. prepared for limcom with the support of giZ.
Bank, t. W. (2010). people, pathogens and our planet. volume 1: towards a one health approach for controlling Zoonotic Diseases. World Bank Report no. 50833-glB. online: http://siteresources.worldbank.org/intaRD/Resources/ppp_Web.pdf
Basson, m., van niekerk, p. and van Rooyen, J. (1997). overview of Water Resources availability and Utilisation in south africa. technical report, Department of Water affairs and Forestry, pretoria. p.72.
Boko, m. niang, i. nyong, a. vogel, c. githeko, a. medany, m. osman-elasha, B. tabo, R. and yanda, p. (2007), africa. climate change 2007: impacts, adaptation and vulnerability. contribution of Working group ii to the Fourth assessment Report of the intergovernmental panel on climate change, technical report, in: (eds.), m.l. parry, o.F. canziani, J.p. palutikof, p.J. van der linden and c.e. hanson, cambridge University press, cambridge Uk, pp. 433–467.
Bond WJ, midgley gF and Woodward Fi. (2003). What controls south african vegetation – climate or fire? south african Journal of Botany 69, pp. 79–91.
Booth, v in peake,D. controversy over sustainable use in southern africa. online. http://www.iucn.org/about/union/commissions/sustainable_use_and_livelihoods_specialist_group/sulinews/issue_7/sn7_sucontroversy/
Boroto, R. and görgens, a. (1999). hydrological modeling of the limpopo River main stem. technical report, Report by Department of civil engineering, University of stellenbosch and ninham shand consulting engineers, to Department of Water affairs and Forestry. DWaF Report no. pa000/00/0399. p. 105
Bruijnzeel, l. (2004). hydrological functions of tropical forests: not seeing the soil for the trees?. agriculture ecosystems and environment 104, pp. 185–228.
cadribo, R. (2012). Flood Risk management in mozambique and sub-regional trans-boundary issues: UnFccc regional expert meeting on loss and damage in addis ababa, ethiopia from 13 to 15 June 2012. online: http://unfccc.int/files/adaptation/cancun_adaptation_framework/loss_and_damage/application/pdf/cadribo_session2.pdf
cardinale, B. (2011). Biodiversity improves water quality through niche partitioning. nature 472, pp. 86–89 doi:10.1038/nature09904.
chapman, a. (2006). hydrology and land use in the ga-selati catchment. csiR, pretoria, south africa and international institute for environment and Development, london, Uk.
chapman, a. (2013). towards options for adaptations at scale in the limpopo River Basin: a conceptual Framework. oneWorld sustainable investments: technical Report v2.
chaunza,g. (2013). Zimbabwe Finally Working on climate change policy (podcast). ips news. online: http://www.ipsnews.net/author/garikai-chaunza/
chishakwe, n. (2010). 1st Draft (Working Document) southern africa sub-Regional Framework on climate change programmes Report
ciesin. (2005). poverty mapping project: global subnational prevalence of child malnutrition. gis Dataset. new york: ciesin, columbia University.
cobbing, J. hobbs, p. meyer, R. and Davies, J. (2008). a critical overview of transboundary aquifers shared by south africa, hydrogeology Journal 16 (6). 10.1007/s10040-008-0285-2, 1207-1214.
csiR. (2003). protection and strategic Uses of groundwater Resourcers in Drought prone areas of the saDc Region: groundwater situation analysis of the limpopo River Basin, technical report, Report no. env-p-c-2003-047, Division of Water environment and Forestry technology csiR, pretoria, south africa.
Dabrowski, J. and de klerk, l. (2013). an assessment of the impact of different land use activities on water quality in the upper olifants River catchment. Water sa 39(2), pp.

48
rE
fE
rE
NC
ES
231–244.Dabrowski, J. and de klerk, l. (2013). an assessment of the
impact of different land use activities on water quality in the upper olifants River catchment. Water sa 39(2), pp. 231–244.
Davis, c., archer, e., landman, W., stevens, n., l.a., s., nkambule, c., maseramule, R. and van der merwwe, m. (2010). a climate change handbook for north-eastern south africa. technical report, council for scientific and industrial Research.
De Wit, m.p. (2009). hunger in saDc with specific reference to climate change: a longer-term, regional analysis. For the Regional climate change programme for southern africa (Rccp), Uk Department for international Development (DFiD). cape town: oneWorld sustainable investments and De Wit sustainable options.
Dea. (2010). national protected area expansion strategy for south africa 2008: priorities for expanding the protected area network for ecological sustainability and climate change adaptation. technical report, Department of environmenta affairs, government of south africa.
Dea. (2013a). trends and scenarios for south africa. long-term adaptation scenarios Flagship Research programme (ltas) for south africa.climate. technical report, long-term adaptation scenarios Flagship Research programme (ltas) for south africa. ltas phase 1, technical Report (no. 1 of 6). Department of environmental affairs. pretoria, south africa. p. 136.
Dea. (2013c). long-term adaptation scenarios Flagship Research programme (ltas) for south africa. climate change implications for the Biodiversity. technical report, long-term adaptation scenarios Flagship Research programme (ltas) for south africa. ltas phase 1, technical Report (no. 6 of 6). Department of environmental affairs. pretoria, south africa. p. 44.
Deat. (2009). national environmental management: protected areas act, 2003 (act no. 57 of 2003} online: https://www.environment.gov.za/sites/default/files/gazetted_notices/nempaa_naturereserves_g32472gen1029.pdf
Department of Water affair. (2013). strategic plan for the fiscal years 2013/14 to 2017/18, technical report, Department of Water affairs, government of south africa.
Department of Water affairs. (2013). no. 36798, government gazette, pretoria 578.
Department of Water affairs, D. & Forestry (2004), internal strategic perspective: crocodile West marico Water management area: crocodile River (West) catchment pWma 03/000/00/0303, technical report, Department of Water affairs, government of south africa, pretoria.
Department of Water affairs, D. & Forestry (2004), internal strategic perspective: limpopo Water management area. pWma 01/000/00/0304, technical report, Department of Water affairs, government of south africa, pretoria.
DFa. (2003). transfrontier conservation areas (tFcas). online: http://www.dfa.gov.za/foreign/multilateral/inter/tfcas.htm
DmR. (2013) annual Report. Financial year (2012/2013). online: http://www.dmr.gov.za/publications/annual-report/viewcategory/26-annual-reports.html
DmR. (2014). operating mines and Quarries and mineral processing plants in the Republic of south africa,D1 operating mines information 2014 (spreadsheet). online: http://www.dmr.gov.za/publications/viewcategory/121-directories.html
Doll, c.n.h., muller, J.-p. and elvidge, c.D. (2000). night-time imagery as a tool for global mapping of socioeconomic parameters and greenhouse gas emissions. ambio 29, pp. 157–162.
DWa & mmeWR. (2013). Botswana integrated Water Resources management & Water efficiency plan. in: l. Dikobe, (ed.) Department of Water affairs ministry of minerals, energy & Water Resources.: government of Botswana. gaborone, Botswana.
Dye, p. (1996). climate, forest and streamflow relationships in south african afforested catchments. commonwealth Forestry Review 75, pp. 31–38.
elvidge, c.D., sutton, p.c., ghosh, t., tuttle, B.t., Baugh, k.e., Bhaduri, B. and Bright, e. (2009). a global poverty map derived from satellite data. computers and geosciences 35, pp. 1652–1660.
engelbrecht, c., engelbrecht, F. and Dyson, l. (2012). high-resolution model-projected changes in mid-tropospheric closed-lows and extreme rainfall events over southern africa. int. J. climatol. Wiley online library.
Falkenmark, m. (1989). the massive water scarcity threatening africa-why isn’t it being addressed. ambio 18 (2), pp. 12–118.
FanRpan. (2008). limpopo River Basin Focul project Brochure. agricultural Research council (aRc) of sa. online: http://www.fanrpan.org/documents/d00502/
Fao and iiasa. (2007). mapping biophysical factors that influence agricultural production and rural vulnerability. Rome: Food and agriculture organization of the United nations: p. 96.
Fao. (2004). Drought impact mitigation and prevention in the limpopo River basin: a situation analysis. (proceedings of the land and water discussion paper 4 in 2004). Rome: Food and agriculture organization of the United nations.
gazette, g. (2013). national Water policy Review: Updated policy positions to overcome the water challenges of our developmental state to provide for improved access to water, equity and sustainability. technical report, Department of Water affairs. published in the government gazette on 30 august 2013, gazette number 36798.
gibson, D. (2006). land degradation in the limpopo province, south africa. technical report, m.sc. thesis, school of animal, plant and environmental sciences, University of the Witwatersrand, Johannesburg, south africa.
gogo, J. ( 2013). Zimbabwe: climate change strategy Review gathers pace. online: http://allafrica.com/stories/201309090313.html
hahn, n. (2003). Botanical Diversity: a First synthesis of the environmental, Biological and cultural assets of the soutpansberg. institute of conservation and natural history of the soutpansberg, herbarium soutpansbergensis (ZpB) , technical report, institute of conservation and natural history of the soutpansberg,

49
rE
fE
rE
NC
ES
herbarium soutpansbergensis (ZpB).hansen, m.c., stehman, s.v. and potapov, p.v. (2010).
Quantification of global gross forest cover loss. proceedings of the national academy of sciences of the United states of america 107 (19), pp. 8650–8655.
hay, s.i., okiro, e.a., gething, p.W., patil, a.p., tatem, a.J., et al. (2010). estimating the global clinical Burden of plasmodium falciparum malaria in 2007. plosmed 7(6): e1000290. doi:10.1371/journal.pmed.1000290.
hijmans, R.J., cameron, s.e., parra, J.l., Jones, p.g. and Jarvis, a. (2005). very high resolution interpolated climate surfaces for global land areas. international Journal of climatology 25, pp. 1965–1978.
huang, c. lee, t.-y. & lee, J. (2014). observed magnified runoff response to rainfall intensification under global warming. environmental Research letters. 9(3): 1 -7.
huber, D and gulledge, J. 2011. extreme weather and climate change. centre for energy and climate solutions. online at [http://www.c2es.org/publications/extreme-weather-and-climate-change]. accessed 20-8-2014.
ilRi. (2006). mapping climate vulnerability and poverty in africa. Report to the Department for international Development, ilRi, po Box 30709, nairobi 00100, kenya, p. 200.
imhoff, m.l., Bounoua, l., Ricketts, t., loucks, c., harriss, R. and lawrence, W.t. (2004). global patterns in human consumption of net primary production. nature 429, 24 June 2004, pp. 870–873.
intergovernmental panel on climate change (ipcc). 2000a. presentation of Robert Watson, chair, intergovernmental panel on climate change, at the sixth conference of the parties to the United nations Framework convention on climate change, the hague, 13 november 2000.
iUcn. (2013). a new saDc Biodiversity action plan endorsed for approval
kori, e. and mathada, h. (2012). an assessment of environmental impacts of sand and gravel mining in nzhelele valley, limpopo province, south africa. 3rd international conference on Biology, environment and chemistry ipcBee vol.46 (2012) iacsit press, singapore Doi: 10.7763/ipcBee, pp. 137–141
kruger, a. mcBride, c. & thiaw, W. (2014), southern africa. pages s178. in: sánchez-lugo, a and Renwick, Ja and thiaw, Wm and Weaver, sJ (section eds.).technical report, in: Blunden, J., and D. s. arndt, (eds.). state of the climate in 2013. Bull. amer. meteor. soc., 95 (7), s1–s257.
le maitre, D.,Forsyth, g., Dzikiti, s. and gush, m. (2013). estimates of the impacts of invasive alien plants on water flows in south africa. technical report, council for scientific and industrial Research, Draft Report prepared for andrew Wannenburg, Working for Water programme, cape town.
le maitre, D., van Wilgen, B., gelderblom, c., Bailey, c., chapman, R. and nel, J. (2002). invasive alien trees and water resources in south africa: case studies of the costs and benefits of management. Forest ecology and management 160, pp. 143–159.
le maitre, D., versfeld, D. and chapman, R. (2000).
technical note: the impact of invading alien plants on surface water resources in south africa: a preliminary assessment. Water sa 26, pp. 397 – 408.
lee, k. & Brumme, Z. (2012). operationalizing the one health approach: the global governance challenges, health policy and planning, 1-8.
lieth, h. (1972). modelling the primary productivity of the earth. nature and resources. Unesco, viii, 2: pp. 5–10.
limpopo Basin permanent technical commission (lBptc) (2010). Joint limpopo River Basin study Final Report. prepared by Bigcon consortium. gtZ, FmecD and DFiD. online: http://www.limcom.org/_system/writable/Dmsstorage/1031en/limcom2010_scopingstudy_eng.pdf
local government handbook municipal Fact sheet. (2011). Ramotshere moiloa local municipality (nW385). census data. online: http://www.localgovernment.co.za/locals/demographics/204/Ramotshere-moiloa-local-municipality.
love, D., taigbenu, a.e. and Jonker, l. (2005). an overview of the mzingwane catchment, Zimbabwe, a contribution to the Waternet challenge program project 17 “integrated Water Resource management for improved Rural livelihoods: managing risk, mitigating drought and improving water productivity in the water scarce limpopo Basin”. Waternet Working paper 1. Waternet, harare.
lucey, a. and o’Riordan, a., institute for security studies (iss). (2014). south africa and aid effectiveness: lessons for saDpa as a development partner. iss paper 25 January 2013.
malherbe, J., J., engelbrecht, F., landman, W., lumsden, t. and theale, c. (2013). tropical systems from the southwest indian ocean into southern africa: impacts, dynamics and projected changes. technical report, Water commission Report WRc Report no. 1847/1/12, pretoria.
malherbe, J.; engelbrecht, F.a. landman, W. and engelbrecht, c. (2012). tropical systems from the southwest indian ocean making landfall over the limpopo River Basin, southern africa: a historical perspective. international Journal of climatology 32, pp. 1018–1032.
mccarthy, t. (2011). the impact of acid mine drainage in south africa. south african Journal of science 107(5/6), art. ##712. doi:10.4102/sajs.v107i5/6.71.
mckee, t.B., Doesken, n.J. and kleist, J. (1993). the Relationship of Drought Frequency and Duration to time scales. proc. 8th conf. on appl. clim. 17–22. Jan 1993, anaheim, ca. pp. 179–184.
middleton, B. and Bailey, a. (2008). Water Resources of south africa, 2005 study (WR 2005), technical report, WR2005 consortium report to the Water Research commission, WRc Report number tt 381/08.
midgley, s, chapman, R. Whande, W. parker, R and petrie, B. (2013). What does climate change mean in the limpopo Basin. oneWorld sustainable invesments: technical Report vs2
midgley, s., petrie, B., martin, l., chapman, R., Whande, W. and parker, R. (2013). the limpopo River Basin system: climate impacts and the political economy. technical report, For the Resilient limpopo programme (Resilim), Usaid. oneWorld sustainable investments, cape town, pp. 139.

50
rE
fE
rE
NC
ES
midgley, s.J.e., Davies, R.a.g. and chesterman, s. (2012). climate Risk and vulnerability mapping: status quo (2008) and future (2050) for southern africa. For the Regional climate change programme (Rccp), Uk Department for international Development. oneWorld sustainable investments, cape town.
mørck-Jensen, k., petrie, B., and Baadsgaard lange, R. (2013). staying afloat: River Basin organizations in transboundary Waters. Diis policy Brief. online: http://en.diis.dk/files/publications/policyBriefs2013/pB2013_staying%20afloat_kjm_web.pdf
morgan, g. (2011). national assembly: Question no. 3327 for Written Reply. technical report, Department of Water affairs.
mostert, t., Bredenkamp, g., klopper, h., verwey, c., mostert, R. and hahn, n. (2008). major vegetation types of the soutpansberg conservancy and the Blouberg nature Reserve, south africa. koedoe 50(1), pp. 34–48.
moyo, n. (2014). Zimbabwe: Bulawayo’s Water Rationing Regime to stay. online: http://allafrica.com/stories/201401080567.html
musonda, l. (2013). Botswana gears up for climate change; embarks on preparing a policy, Response strategy and action plan online: http://www.undp.org/content/botswana/en/home/presscenter/pressreleases/2013/08/28/botswana-gears-up-for-climate-change-embarks-on-preparing-a-policy-response-strategy-and-action-plan-/
mzingwane catchment council (mcc) (2010). towards effective Water governance and improved livelihoods in the mzingwane catchment area. a strategy 2010–2015
nelson, a. (2008). accessibility model and population estimates. Background paper for the World Bank’s World Development Report 2009.
oldeman, l.R., hakkeling, R.t.a. and sombroek, W.g. (1990). World map of the status of human-induced soil Degradation; explanatory note. isRic and Unep in cooperation with the Winand staring centre, isss, Fao and itc. p. 27.
olivier, J. and Rautenbach, c. d. W. (2002). the implementation of fog water collection systems in south africa. atmos. Res. 64, pp. 227–238.
oneWorld. (2013). Resilim: systems analysis scoping matrix .
ostrom, e. (1990). governing the commons: the evolution of institutions for collective action. cambridge University press.
parry, D. and campbell, B. (1990). Wildlife management areas of Botswana. Botswana society. 22(1): pp. 65–77. online: http://www.jstor.org/discover/10.2307/40979856?uid=3739368anduid=2anduid=4andsid=21103467974181
paterson, a. (2009). legal Framework for protected areas: south africa. technical report, internatioanal Union for the conservation of nature (iUcn). pub. iUcn-eplp no. 8. pp 47.
phiri, s. (2011). impact of artisanal small scale gold mining in Umzingwane District (Zimbabwe), a potential for ecological Disaster. a masters thesis submitted to the University of the Free state
Raleigh, c. and hegre, h. (2005). introducing acleD:
an armed conflict location and event Dataset. paper presented to the conference on ‘Disaggregating the study of civil War and transnational violence’, san Diego, ca: University of california institute of global conflict and cooperation, 7–8 march.
Reuters. (2012). planned power projects will beat southern africa’s energy blues. online: http://www.iol.co.za/business/features/planned-power-projects-will-beat-southern-africa-s-energy-blues-1.1305571#.Uwx99Wksxjc
Reyers, B., Wessels, k. and van Jaarsveld, a. (2002). an assessment of biodiversity surrogacy options in the limpopo province of south africa. african Zoology 37(2), pp. 185–195.
saDc. (2014). 17th southern african Regional climate outlook Forum. online: http://www.sadc.int/news-events/events/17th-southern-african-regional-climate-outlook-forum/
saDc. (2008). achieving compatibility between the transfrontier conservation area (tFca) concept and international standards for the management of trans-boundary animal Diseases (taDs). technical report, saDc FmD project, FanR, saDc secretariat, gaborone. Report of the workshop held at chobe marina lodge, kasane, Botswana 11 to 14 november 2008.
sanBi (2010). national protected areas expansion strategy (npaes). technical report, south african national Biodiversity institute. online: http://bgis.sanbi.org/nsba/conservationareas.asp
sanpark (2014). great limpopo transfrontier park. online: http://www.sanparks.co.za/conservation/transfrontier/great_limpopo.php
scholes, R.; Biggs, R.; cooper, J.; Fleming, g.; malungani, t. and misselhorn, a. (2004). ecosystem services in southern africa: a Regional perspective. in R.J. scholes and R. Biggs, ed., technical report, a contribution to the millennium ecosystem assessment, prepared by the regional-scale team of the southern african millennium ecosystem assessment. csiR, a contribution to the millennium ecosystem assessment, prepared by the regional-scale team of the southern african millennium ecosystem assessment..
siebert, s., van Wyk, a. and Bredenkamp, g. (2002). the physical environment and major vegetation types of sekhukhuneland, south africa. south african Journal of Botany 67, pp. 127–142.
siebert, s.; van Wyk, a. and Bredenkamp, g. (2001). endemism in the flora of ultramafic areas of sekhukhune– land. south african Journal of science 97, pp. 529–532.
sonnekus, c. (2011). hydro census data report and cost estimate to refurbish groundwater pump installations: limpopo province sekhukhune District municipality elias motsoaledi local municipality. technical report, Worley parsons Report-vsaleB/pR11/052a to the Department of Water affairs, south africa.
struckmeier, W, gilbrich, W, gun, J, maurer, t, puri, s, Richts, a, Winter, p, & Zaepke, m. (2006). Whymap and the World map of transboundary aquifer systems at the scale of 1:50 000 000., technical report, special edition for the 4th World Water Forum. mexico city. march 2006. BgR, hannover and Unesco, paris.

51
rE
fE
rE
NC
ES
sutton, p.c., elvidge, c.D. and gosh, t. (2007). estimation of gross domestic product at sub-national scales using night time satellite imagery. international Journal of ecological economics and statistics 8: pp. 5–21.
tauacale, Dr. F. (2002) Water Resources of mozambique and the situation of the shared rivers. River Basin information systems meeting, nairobi – kenya, 13 – 14 February 2002. Department of geography. eduardo mondlane University. maputo. mozambique. online: www.unep.org/dewa/water
thomson, g. tambi, e. hargreaves, s. leyland, t. catley, a. van’t klooster, g. & penrith, m.-l. (2004). international trade in livestock and livestock products: the need for a commodity-based approach, veterinary Record 155, 429-433.
trenberth, k.; Dai, a.; Rasmussen, R. and parsons, D. (2003). the changing character of precipitation. american meteorological society 84, pp. 1205–1217.
turpie, J.k., marais, c., Blignaut, J.n. (2008) the working for water programme: evolution of a payments for ecosystem services mechanism that addresses both poverty and ecosystem service delivery in south africa. University of pretoria, south africa. online: http://www.dspace.up.ac.za/bitstream/handle/2263/5811/turpie_Working(2008).pdf?sequence=1
turton, a. and ashton, p. (2008). Basin closure and issues of scale: the southern african hydropolitical complex. international Journal of Water Resources Development 24(2), pp. 305–318.
tyler s.J. and Bishop D.R. (1998). important Bird areas of Botswana. in: Barnes k.n. (ed.). the important Bird areas of southern africa. pp. 333–354. Birdlife south africa, Johannesburg. Unep (2005). Facing the Facts: assessing the vulnerability of africa’s Water Resources to environmental change. United nations environmental program. online: http://www.unep.org/DeWa/products/publications/2006/Facing_Facts_prelims.pdf
Unesco (2013). Unesco’s man and the Biosphere programme. online: http://downtoearth.danone.
com/2013/04/23/unescos-man-and-the-biosphere-programme-is-40-years-old/
Unesco (2014). tswapong hills cultural landscape. technical report, United nations educational, scientific and cultural organization. online: http://whc.unesco.org/en/tentativelists/5560/
United nations Development program. (2007). human Development Report 2007/2008. new york: UnDp. p. 399.
van Wyk, a. and van Wyk, p. (1997), Field guide to trees of southern africa, struik, cape town.
van Wyk, a.e., and smith, g.F. (2001). Regions of floristic endemism in southern africa: a review with emphasis on succulents 2001. Umdaus press, pretoria.
vermaak, m. and strydom van Dyk, m. (2013). national Water act: challenging appeal decisions. technical report. online: http://www.internationallawoffice.com/newsletters/detail.aspx?g=8ff67c47-aeb1-4bf4-88cd-bf0dcbc3371c.
verster, h. (2012). Report on groundwater levels 1 may 2011 - 1may 2012: limpopo Region, technical report, online at: groundwater Resource information Department (gRip): http://griplimpopo.co.za/ Directorate Water Regulation and Use status, Department of Water affairs, pretoria.
victor, J., siebert,s., hoare, D.and van Wyk,B. (2005).sekhukhune land grasslands: a treasure house of biodiversity. sanBi, capetown. technical report, south african national Biodiversity institute (sanBi),capetown. online: http://www.fao.org/ag/agp/agpc/doc/show/safrica/sapaper/saessay.htm
visser, a., olorunju, s., Dippenaar, s. and moilwa, n. (2005). an analysis of the livelihoods of communities of the upper selati catchment, south africa. international institute for environment and Development. online. http://pubs.iied.org/pdfs/g00355.pdf
Wepener, v. (1997). metal ecotoxicology of the olifants River in the kruger national park and the effect thereof on fish haematology. phD thesis, University of Johannesburg, Johannesburg.
Wilson, e. (1992), the Diversity of life. Belknap, cambridge, massachusetts.

52
ap
pE
Nd
ix 1 appENdix 1
Biod
iversi
ty as
Main
Sec
tor
Biod
iversi
ty as
Sub
-Sec
tor
Link
s to w
ater
Link
s to c
limat
e
KE
Y
Mai
N S
ECTO
r:
BiO
DiV
ErSi
Ty
Dev
elopm
ent B
ank
of S
outh
afri
ca
unite
d N
atio
nsD
evelo
pmen
t Pro
gram
inte
rnat
iona
l uni
on fo
r Co
nser
vatio
n of N
atur
e
afric
an D
evelo
pmen
t Ban
k
Wor
ld B
ank
GiZ
Glo
bal E
nviro
nmen
t fac
ility
unite
d N
atio
ns H
uman
Settl
emen
ts Pr
ogra
mm
e
Dep
artm
ent o
f En
viron
men
tal a
ffairs
an
d To
urism
, Sou
th a
frica
Min
istry
for C
oord
inat
ion
of E
nviro
nmen
tal a
ffairs
, M
ozam
biqu
e
unite
d N
atio
nsEn
viron
men
t Pro
gram
Sout
h afri
can N
atio
nal
Biod
iversi
ty in
stitu
teKa
lahar
i Con
serv
atio
n Soc
iety
Min
istry
of T
ouris
m,
Moz
ambi
que
Wild
life r
ancin
g So
uth a
frica
inte
rnat
iona
l foo
d Po
licy
rese
arch
insti
tute
Min
istry
of E
nviro
nmen
t an
d N
atur
al re
sour
ces
Man
agem
ent,
Zim
babw
e
Glo
bal W
ater
Pa
rtner
ship
– Sou
ther
n afri
ca
agric
ultu
ral r
esea
rch
Coun
cil
Min
istry
of E
nviro
nmen
t, W
ildlif
e and
Tour
ism,
Botsw
ana
Peac
e Par
ks fo
unda
tion
food
, agr
icultu
re an
dN
atur
al re
sour
ces
Sout
h afri
can N
atio
nal P
arks
foun
datio
n for
the C
onse
rvat
ion
of B
iodi
versi
ty (B
iofu
nd),
Moz
ambi
que
Nat
iona
l adm
inist
ratio
n of
Cons
erva
tion a
reas
(aN
aC),
Moz
ambi
que
unive
rsity
of B
otsw
ana un
iversi
dade
Edu
ardo
Mon
dlan
e(E
duar
do M
ondl
ane u
nive
rsity
)
unive
rsity
of P
reto
ria
inst
itu
tion
s w
orki
ng
in t
he
lim
pop
o b
asin
, mai
n S
ecto
r b
ein
g b
iod
iver
sity
Bio
div
ersi
ty a
s su
B -s e
cto
r
Cent
er fo
r Env
ironm
enta
lEc
onom
ics an
d Po
licy i
n afri
ca
Cent
er fo
r in
tern
atio
nal
fore
stry r
esea
rch
unive
rsity
of Z
imba
bwe
Coun
cil fo
r Scie
ntifi
c and
indu
strial
res
earc
h
uSai
D
rESi
LiM
rESi
LiM
– O

53
ap
pE
Nd
ix 2
inst
itu
tion
s w
orki
ng
in t
he
lim
pop
o b
asin
, mai
n S
ecto
r b
ein
g w
ater
appENdix 2
Mai
N S
ECTO
r:
WaT
Er
Lepe
lle N
orth
ern W
ater
Mag
alies
Wat
er
afric
an M
inist
ers
Co
uncil
on W
ater
Botsh
elo
Edua
rdo M
ondl
ane
unive
rsity
GiZ
Dev
elopm
ent B
ank
of S
outh
afri
ca
afric
an D
evelo
pmen
t Ba
nk
Wor
ld B
ank
The i
nstit
ute o
f W
ater
and
Sani
tatio
n D
evelo
pmen
t
The i
nstit
ute o
f Wat
er an
d Sa
nita
tion D
evelo
pmen
t
afric
an r
egio
nal C
entre
(S
iWi)
Lim
popo
Wat
er C
ourse
Co
mm
issio
nBu
shbu
ckrid
ge
ikan
gala
Wat
er
Zam
bezi
Wat
er
Cour
se C
omm
issio
n
Oka
vang
o rive
r Ba
sin C
omm
issio
n
rand
Wat
er
Sout
h afri
can a
ssoc
iatio
n of
Wat
er u
tiliti
es
Stoc
khol
m in
tern
atio
nal
Wat
er in
stitu
te
SaD
C W
ater
Divi
sion
Glo
bal W
ater
Par
tner
ship
– Sou
ther
n afri
ca
Wat
er r
esea
rch
Com
miss
ion
asso
ciatio
n for
Wat
er an
d ru
ral D
evelo
pmen
t
inte
rnat
iona
l Wat
er
Man
agem
ent
insti
tute
Dep
artm
ent o
f Wat
er
affair
s, So
uth a
frica
Dep
artm
ent o
f Wat
er
affair
s, Bo
tswan
a
Nat
iona
l Dire
ctor
ate o
f W
ater
, Moz
ambi
que
Zim
babw
e Nat
iona
l Wat
er
auth
ority
Min
istry
of W
ater
, Zim
babw
e
Wat
erN
et
Lim
popo
Cat
chm
ent
Man
agem
ent a
genc
y, So
uth a
frica
The M
zingw
ane C
atch
men
t Co
uncil
, Zim
babw
e
ara-
Sul, M
ozam
biqu
e
unive
rsity
of P
reto
ria
One
Wor
ld S
usta
inab
le in
vestm
ents
Pega
sys S
trate
gy an
d D
evelo
pmen
t
Wat
er as
Main
Sec
tor
Wat
er as
Sub
-Sec
tor
Link
s to b
iodi
versi
ty
Link
s to c
limat
e
KE
Y
wat
er a
s su
B -s e
cto
r
Cent
er fo
r Env
ironm
enta
l Ec
onom
ics an
d Po
licy i
n afri
ca
inte
rnat
iona
l uni
on
for C
onse
rvat
ion o
f N
atur
e
Coun
cil fo
r Scie
ntifi
c and
in
dustr
ial r
esea
rch
unive
rsity
of L
impo
po
rESi
LiM
rESi
LiM
– O
uSai
D

54
appENdix 3
Clim
ate a
s Main
Sec
tor
Clim
ate a
s Sub
-Sec
tor
Link
s to w
ater
Link
s to b
iodi
versi
ty
KE
Y
ap
pE
Nd
ix 3
agricultural research Council
Mai
N S
ECTO
r:
CLiM
aTE
CHaN
GE
Capa
city S
treng
then
ing
of L
east
Dev
elope
d Co
untri
es fo
r ada
ptat
ion
to C
limat
e Cha
nge –
Com
mun
ity
Org
aniza
tions
reg
iona
l Net
work
(C
OrN
)
Clim
ate S
yste
ms a
nalys
is G
roup
, uni
versi
ty of
Ca
pe To
wn
The W
ahen
ga in
stitu
te
Sout
h afri
can N
atio
nal
Biod
iversi
ty in
stitu
te
GiZ
Dep
artm
ent f
or in
tern
atio
nal
Dev
elopm
ent (
uKai
D)
Wor
ld M
eteo
rolo
gica
l O
rgan
izatio
n
Cent
er fo
r int
erna
tiona
lfo
restr
y res
earc
h
Chris
tian a
ctio
n res
earc
h an
d Ed
ucat
ion
Min
istry
of E
nviro
nmen
t and
N
atur
al re
sour
ces M
anag
emen
t, Zi
mba
bwe
Dep
artm
ent o
f En
viron
men
tal a
ffairs
and
Tour
ism, S
outh
afri
ca
Min
istry
for C
oord
inat
ion o
fEn
viron
men
tal a
ffairs
, M
ozam
biqu
e unite
d N
atio
ns
Envir
onm
ent P
rogr
am
unite
d N
atio
ns
Dev
elopm
ent P
rogr
am
Glo
bal E
nviro
nmen
t fa
cility
One
Wor
ld
Susta
inab
le in
vestm
ents
Wat
erN
etSa
DC
faN
r
Min
istry
of E
nviro
nmen
t, W
ildlif
e and
Tour
ism, B
otsw
ana
food
, agr
icultu
re an
d N
atur
al re
sour
ces
Dep
artm
ent o
f int
erna
tiona
l re
latio
ns an
d Co
oper
atio
nPe
gasy
s Stra
tegy
and
Dev
elopm
ent G
loba
l Wat
er P
artn
ersh
ip
– Sou
ther
n afri
ca
Min
istry
for P
lanni
ng
and
Dev
elopm
ent
inst
itu
tion
s w
orki
ng
in t
he
lim
pop
o b
asin
, mai
n S
ecto
r b
ein
g C
lim
ate
inte
rnat
iona
l uni
on fo
r Co
nser
vatio
n of N
atur
e
Wor
ld B
ank
afric
an D
evelo
pmen
t Ba
nk
Dev
elopm
ent B
ank
of S
outh
afri
ca
Cent
er fo
r Env
ironm
enta
l Ec
onom
ics an
d Po
licy i
n afri
ca
cli
mat
e a
s su
B -s e
cto
r
uSai
D
rESi
LiM
rESi
LiM
– O
Sout
h afri
ca C
limat
e Ch
ange
act
ion N
etwo
rk
Dep
artm
ent o
f Geo
grap
hy,
GiS
& M
eteo
rolo
gy, u
nive
rsity
of
Pre
toria
Clim
ate a
ctio
n Net
work

55
ap
pE
Nd
ix 4appENdix 4
variables and equations used for risk and vulnerability mapping
the equations for mapping risk and vulnerability, their variable names, weightings and sources of data are explained below. the original reference for this approach is midgley et al., (2012).
EquationsExposure summary layer (status quo ca. 2008): (max2methsraincv * 2) + (e_mcv_monthly * 2) + (e_cyclones * 2) + (floodfreq * 2) + (spi * 2) + (firefreq * 1) + (e_dis_event * 1) + (e_dis_affect * 1)Sensitivity summary layer:(s_irrigated * 3) + (s_app_npp * 2) + (s_rain_pp_crop * 3) + (s_popd_agric * 2) + (s_lgp * 2) + (s_avail_soilm * 3) + (s_soil_deg * 2) + (s_slope * 2) + (s_npp * 2) + (s_agric_syst * 1) + (s_food_prod * 1) + (s_prot_cons * 1) + (s_diet_div * 1) + (s_waterwithd * 2) + (s_water_str * 2) + (s_forestloss * 2)Adaptive capacity summary layer:(a_pov_infra * 2) + (a_gDp_pc * 3) + (a_abovewt * 3) + (a_educ_ind * 2) + (a_health_exp * 2) + (a_malaria * 1) + (a_tsetse * 1) + (a_hiv_neg * 2) + (a_imp_water * 3) + (a_cell_subs * 1) + (a_travelt * 2) + (a_nightlights * 3) + (a_agric_gDp * 2) + (a_water_dis * 1) + (a_irrigpot * 2) + (a_conflicts * 1) + (a_governance * 2) + (a_forestres * 1) + (a_biodiv * 2)
Table A 4.1: Exposure indicators used under the categories exposure (present), sensitivity and adaptive capacity.
For the assumed relationship between the indicator and the vulnerability category, the following was used: positive = the higher the indicator value the greater the vulnerability; negative = the lower the indicator value the lower the vulnerability. (source midgley et al., 2012)
Variable Indicator Assumed relationship between indicator and category
Relative weighting within category
Web links, sources, credits, references
max2methsraincv coefficient of variation for inter-annual rainfall
positive 2 international Water management institute (iWmi), using the 100 year gridded precipitation dataset (cRU ts 2.0) developed by the University of east anglia. eriyagama et al. 2009.
global Risk Data platform (preventionWeb), World Bank, Unep, UnDp, Un/isDR. credit: iRi and ciesin (columbia University). mckee et al., 1993.
e_mcv_monthly coefficient of variation for monthly rainfall
positive 2 Worldclim (hijmans et al., 2005) Bioclimatic variable ‘Bio15’
e_cyclones Risk of cyclones positive 2 center for hazards and Risk Research (chRR), Dilley et al., 2005; center for international earthscience information network (ciesin), columbia University; international Bank for Reconstruction and Development/the World Bank; United nations environment programme global Resource information Database geneva (Unep/gRiDgeneva).

56
ap
pE
Nd
ix 4
Variable Indicator Assumed relationship between indicator and category
Relative weighting within category
Web links, sources, credits, references
floodfreq Risk of floods positive 2 global Risk Data platform (preventionWeb), World Bank, Unep, UnDp, Un/isDR. credit: gis processing Unep/gRiD-europe, with key support from Usgs eRos Data center, Dartmouth Flood observatory 2008.
spi standardised precipitation index
positive 2 global Risk Data platform (preventionWeb), World Bank, Unep, UnDp, Un/isDR. credit: iRi and ciesin (columbia University). mckee et al., 1993.
firefreq Fire frequency positive 2 global Risk Data platform (preventionWeb), World Bank, Unep, UnDp, Un/isDR. credit: gisprocessing World Fire atlas (esa-esRin).
e_dis_event Disaster events: number of events by area
positive 2 Who collaborating centre for Research on the epidemiology of Disasters (cReD): emergency events Database em-Dat
e_dis_affect Disaster events: numbers affected per population
positive 2 Who collaborating centre for Research on the epidemiology of Disasters (cReD): emergency events Database em-Dat
Table A 4.2: Sensitivity indicators used under the categories exposure (present), sensitivity and adaptive capacity.
For the assumed relationship between the indicator and the vulnerability category, the following was used: positive = the higher the indicator value the greater the vulnerability; negative = the lower the indicator value the lower the vulnerability. (source midgley et al., 2012)
Variable Indicator Assumed relationship between indicator and category
Relative weighting within category
Web links, sources, credits, references
s_irrigated percent land under irrigation
negative 3 the data are an iiasa modification of Fao and University of kassel (2002), Digital global map of irrigated areas v. 2.1.
s_app_npp human appropriation of net primary productivity
positive 2 columbia University center for international earth science information network (ciesin). imhoff et al., 2004.
s_rain_pp_crop
volume of rainfall per person on agricultural land
negative 3 Unep population database. Fao/iiasa gaeZ. Worldclim. hijmans et al., 2005.
s_popd_agric crowding on agricultural land
positive 2 Unep population database. Fao/iiasa gaeZ.
Table A 4.1 (cont.)

57
ap
pE
Nd
ix 4
Variable Indicator Assumed relationship between indicator and category
Relative weighting within category
Web links, sources, credits, references
s_lgp length of growing
period
negative 2 the FggD Digital atlas: this dataset is contained in module 4 environmental conditions” of Food insecurity, poverty and environment global gis Database (FggD) (Fao and iiasa, 2007). ilRi, 2006.
s_lgp easily available soil moisture
negative 3 Fao; derived from Digital soil map of the World
s_soil_deg soil degradation positive 2 global assessment of human induced soil Degradation (glasoD). credit: international soil Reference and information centre (isRic) at Wageningen, the netherlands, and United nations environment programme (Unep). oldeman et al., 1990.
s_slope slope positive 2 shuttle Radar topography mission. U.s. geological survey center for earth Resource observation and
science (eRos), national aeronautics and space administration (nasa), national geospatial- intelligence agency (nga), esRi
s_npp net primary productivity
negative 2 global climatological net primary production of Biomass dataset from climpag, Fao. lieth, 1972.
s_agric_syst major agricultural systems
1 World Bank, Fao
s_food_prod own food production
negative 1 Fao. De Wit, 2009.
s_prot_cons protein consumption
negative 1 Fao. De Wit, 2009.
s_diet_div Dietary diversity s negative 1 Fao
s_waterwithd Water withdrawals positive 2 Fao: aQUastat
s_water_str people living in water stress
positive 2 WWDRii. african Water stress study. vörösmarty et al., 2005.
s_forestloss Forest loss positive 2 global gross Forest loss; Wcmc global Forests Dataset: disturbed forests and historic extent of forests; current extent of forest cover moDis vegetation continuous Fields. hansen et al., 2010.

58
Table A 4.3: Adaptive capacity indicators used under the categories exposure (present), sensitivity and adaptive capacity.
For the assumed relationship between the indicator and the vulnerability category, the following was used: positive = the higher the indicator value the greater the vulnerability; negative = the lower the indicator value the lower the vulnerability. (source midgley et al., 2012)
Variable Indicator Assumed relationship between indicator and category
Relative weighting within category
Web links, sources, credits, references
a_pov_infra infrastructure poverty
negative 2 noaa: noaa websites are provided as a public service by the U.s. Department of commerce, national oceanic and atmospheric administration, national environmental satellite, Data and information service. information presented on these web pages is considered public information and may be distributed or copied.. Doll et al., 2000; sutton et al., 2007; elvidge et al., 2009; World Bank, 2006.
a_gDp_pc economic wealth positive 3 United nations Development programme (2007)
a_abovewt malnourishment in children under 5 years old
negative 3 center for international earth science information network (ciesin, 2005), columbia University.
a_educ_ind education index positive 2 United nations Development programme (2007)
a_health_exp health expenditure positive 2 United nations Development programme (2007)
a_malaria malaria incidence negative 1 malaria atlas project (map); hay et al., (2010)
a_tsetse tsetse fly habitat suitability
negative 1 Fao and DFiD. credit: environmental Research group oxford (eRgo ltd) in collaboration with the trypanosomosis and land Use in africa (tala) research group at the Department of Zoology, University of oxford
a_hiv_neg hiv prevalence negative 2 United nations Development programme (2007)
a_imp_water access to improved water
positive 3 United nations Development programme (2007)
a_cell_subs subscribers to a cellular network
positive 1 United nations Development programme (2007)
a_travelt travel time to nearest city
negative 2 european commission and World Bank. nelson (2008)
a_nightlights night lights positive 3 http://www.ngdc.noaa.gov/dmsp/download.html image and data processing by noaa’s national geophysical Data center. Dmsp data collected by Us air Force Weather agency. Doll et al., 2000; sutton et al., 2007.
ap
pE
Nd
ix 4

59
ap
pE
Nd
ix 4
Variable Indicator Assumed relationship between indicator and category
Relative weighting within category
Web links, sources, credits, references
a_agric_gDp contribution of agriculture to gross Domestic product
negative 2 http://web.worldbank.org/WBsite/exteRnal/Datastatistics/0,,contentmDk:21298138~pagepk:64133150~pipk:64133175~thesitepk:239419,00.html World Bank (2007). World Development indicators (2007) World Bank, Washington. 432pp.
a_water_dis Water discharge positive 1 http://wwdrii.sr.unh.edu/download.html vörösmarty et al., 2005
a_irrigpot irrigation potential positive 2 http://www.ifpri.org/publication/what-irrigationpotential- africa
a_conflicts conflicts negative 1 http://www.prio.no/cscW/Datasets/armed-conflict/armed-conflict-location-and-event-Data/; http://www.ucdp.uu.se/gpdatabase/search.php. Raleigh et al., (2005).
a_governance governance negative 2 http://www.moibrahimfoundation.org/en/section/the-ibrahim-index
a_forestres Forest resources positive 1 http://glcf.umiacs.umd.edu/data/vcf/
a_biodiv Forest resources positive 2 http://www.zmuc.dk/commonWeb/research/biodata.htm
Table A 4.3 (cont.)

60
copyright © oneWorld 2015
all rights reserved. apart from any use as permitted under the copyright act, no part may be reproduced by any process without prior written permission from:
oneWorld sustainable investments 2nd Floor, 4 church square
spin street cape town
south africa

compileD By:


![[Luthar, 2003]Resilience and Vulnerability](https://static.fdocuments.in/doc/165x107/55cf8f38550346703b9a245f/luthar-2003resilience-and-vulnerability.jpg)