Applied Information Economics: Kickoff for Risk Return Analysis
Upload
fatimabawanyCategory
view
35download
1description

FINANCIAL MANAGEMENT (FIN401)
Lecture 1:Risk & Return Analysis
By: Sana Tauseef, CFA, MBA Lecturer, Department of Economics and Finance Institute of Business Administration, Karachi Email: [email protected]
Risk
and
Ret
urn
Anal
ysis
Investment return is what you get over and above your invested capital…
The rate of return on an investment can be calculated as follows:
(Amount received – Amount invested)
Return = ____________________
Amount invested
For example, if $1,000 is invested and $1,100 is returned after one year, the rate of return for this investment is:
($1,100 - $1,000) / $1,000 = 10% 2

Risk
and
Ret
urn
Anal
ysis
Typically, investment returns are not known with certainty…
Risk is related to the probability of having a return different from the
expected return. It is measured through calculating the variance or standard
deviation of the distribution of returns.
3
Risk
and
Ret
urn
Anal
ysis
Risk & Return may be computed using
historical (realized) data or prospective
(anticipated) data…
4
Risk
and
Ret
urn
Anal
ysis
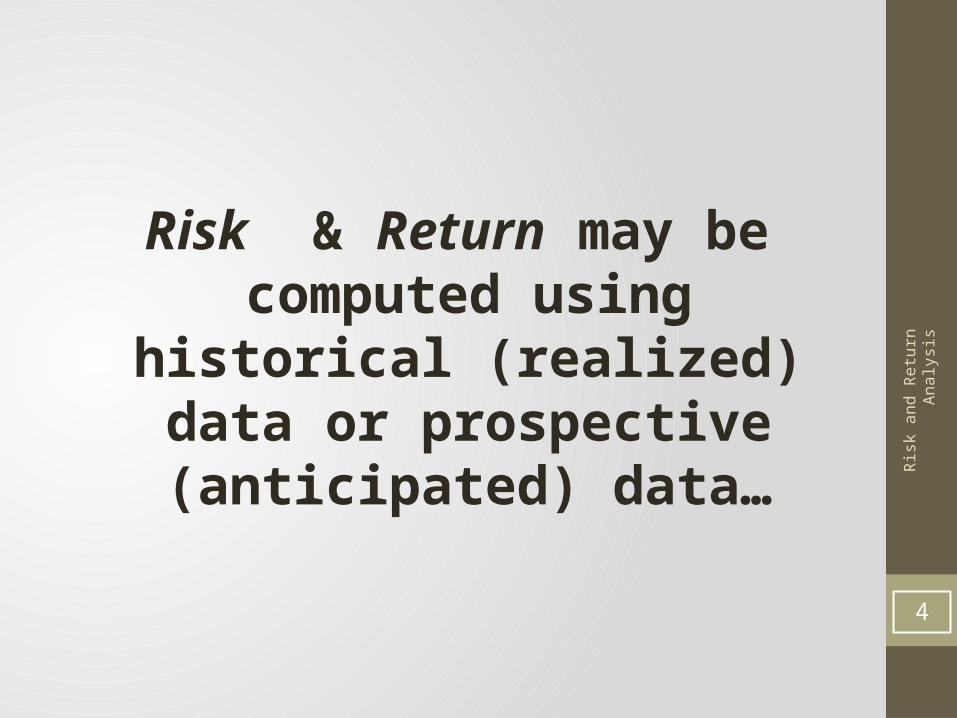
Historical returns* give an idea of how an investment (stock) performed in the past…
YearNestle
Pakistan BAHL
2003 72.08 52.29
2004 38.16 16.99
2005 48.22 45.21
2006 35.71 -2.84
2007 72.26 12.70
2008 -25.92 -67.78
2009 -6.56 31.72
2010 90.60 10.68
2011 59.89 -21.32
2012 24.66 11.22
Average Return 40.41 8.89
Historical Risk 36.3 34.55
*Dividends are not included in the calculation of returns.5

Risk
and
Ret
urn
Anal
ysis
Historical returns are adjusted based on future forecasts…
State of Economy Probability
Forecasted ReturnNestle
Pakistan
Good 30% 73%
Average 60% 40%
Poor 10% 28%
Expected Return 48.70%
Expected Risk 16.29%6
Risk
and
Ret
urn
Anal
ysis
In an efficient market, risk and return factors are always positively related…
7

Risk
and
Ret
urn
Anal
ysis
Co-efficient of variation is a standardized measure of dispersion about the expected value, that shows the risk per unit of return...
Mean
dev Std CV
8
Risk
and
Ret
urn
Anal
ysis
Combining stocks in a portfolio generally lowers risk…
• Unsystematic risk is the firm-specific risk and can be eliminated through diversification.
• Systematic risk is the market risk and can not be diversified away.
9

Risk
and
Ret
urn
Anal
ysis
Modern portfolio theory (mean-variance approach) was introduced by Harry Markowitz with his paper "Portfolio Selection," which appeared in the 1952 Journal of Finance. 38 years later, he shared a Nobel Prize with Merton Miller and William Sharpe for what has become a broad theory for portfolio selection.
10

Risk
and
Ret
urn
Anal
ysis
Rational investors choose to hold securities as part of a diversified portfolio...
Portfolio return is the weighted average return of component stocks
Portfolio Risk is lesser than the weighted average risk of component stocks
11
Risk
and
Ret
urn
Anal
ysis
The variance/standard deviation of a portfolio also reflects how the returns on the stocks which comprise the portfolio vary together…
• If the stocks are perfectly positively correlated, there is no risk diversification.• If the stocks are perfectly negatively correlated,
there is maximum risk diversification.• If the correlation is between -1 and +1, there is
some risk diversification.• Lower the correlation value, higher is the risk
diversification.12
Risk
and
Ret
urn
Anal
ysis
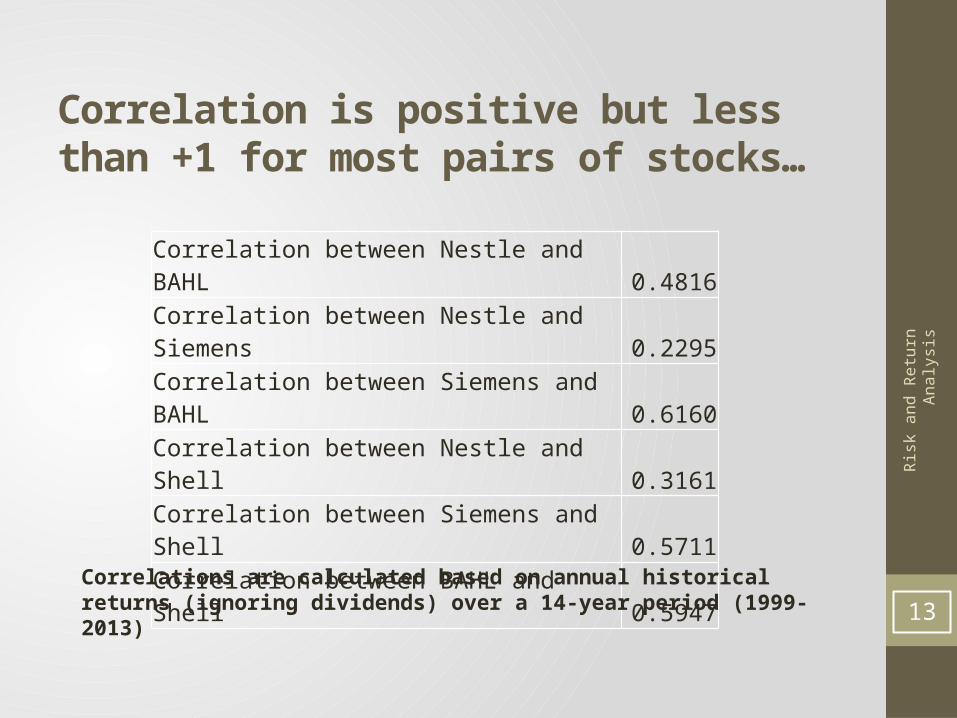
Correlation is positive but less than +1 for most pairs of stocks…
Correlation between Nestle and BAHL 0.4816Correlation between Nestle and Siemens 0.2295Correlation between Siemens and BAHL 0.6160
Correlation between Nestle and Shell 0.3161Correlation between Siemens and Shell 0.5711
Correlation between BAHL and Shell 0.5947
Correlations are calculated based on annual historical returns (ignoring dividends) over a 14-year period (1999-2013) 13
Risk
and
Ret
urn
Anal
ysis
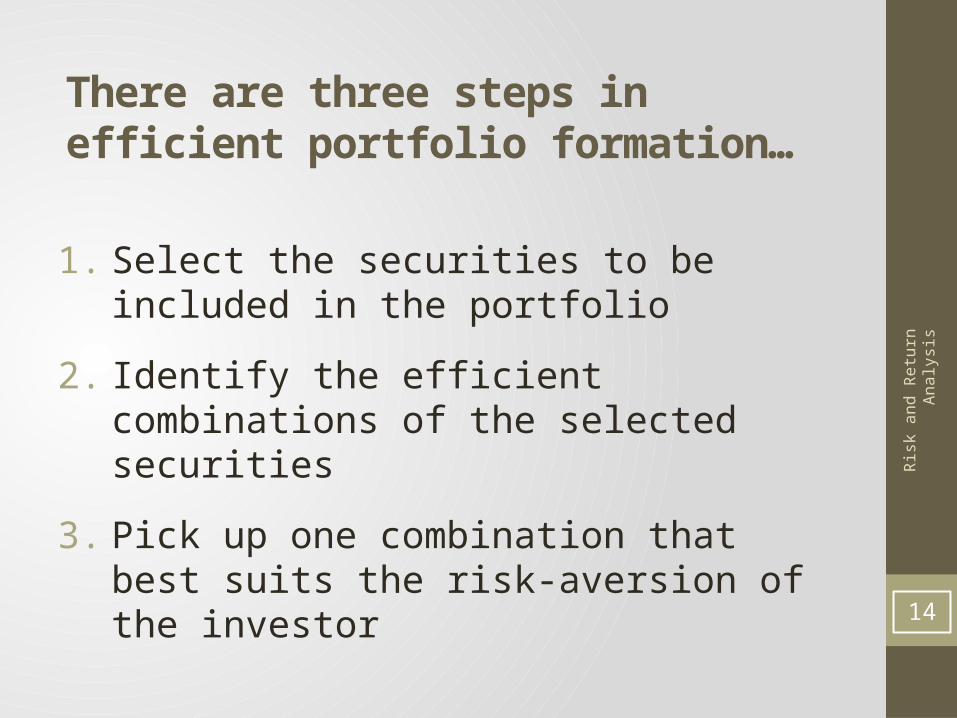
There are three steps in efficient portfolio formation…
1. Select the securities to be included in the portfolio
2. Identify the efficient combinations of the selected securities
3. Pick up one combination that best suits the risk-aversion of the investor
14

Risk
and
Ret
urn
Anal
ysis
An investor’s objective in using the mean-variance approach to portfolio selection is to choose an efficient portfolio…
• Portfolio possibilities curve plots the expected return and risk of the portfolios that can be formed using two assets.
• Efficient frontier shows the efficient portfolios-the combinations which offer higher returns for a given level of risk.
15
Risk
and
Ret
urn
Anal
ysis
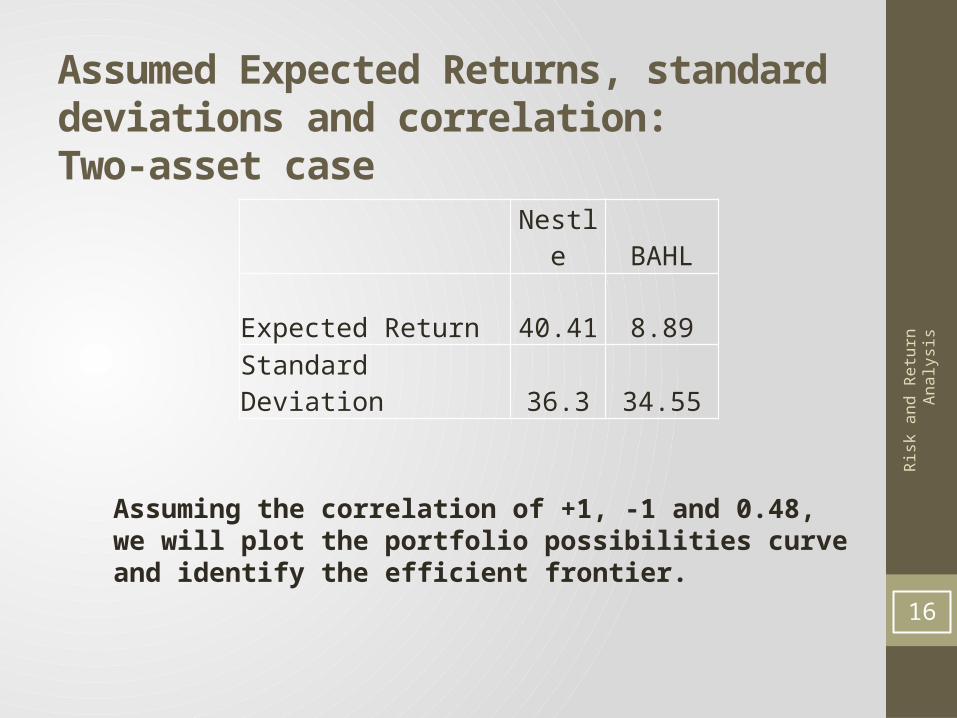
Assumed Expected Returns, standard deviations and correlation: Two-asset case
Nestle BAHL
Expected Return 40.41 8.89
Standard Deviation 36.3 34.55
Assuming the correlation of +1, -1 and 0.48, we will plot the portfolio possibilities curve and identify the efficient frontier.
16
Risk
and
Ret
urn
Anal
ysis
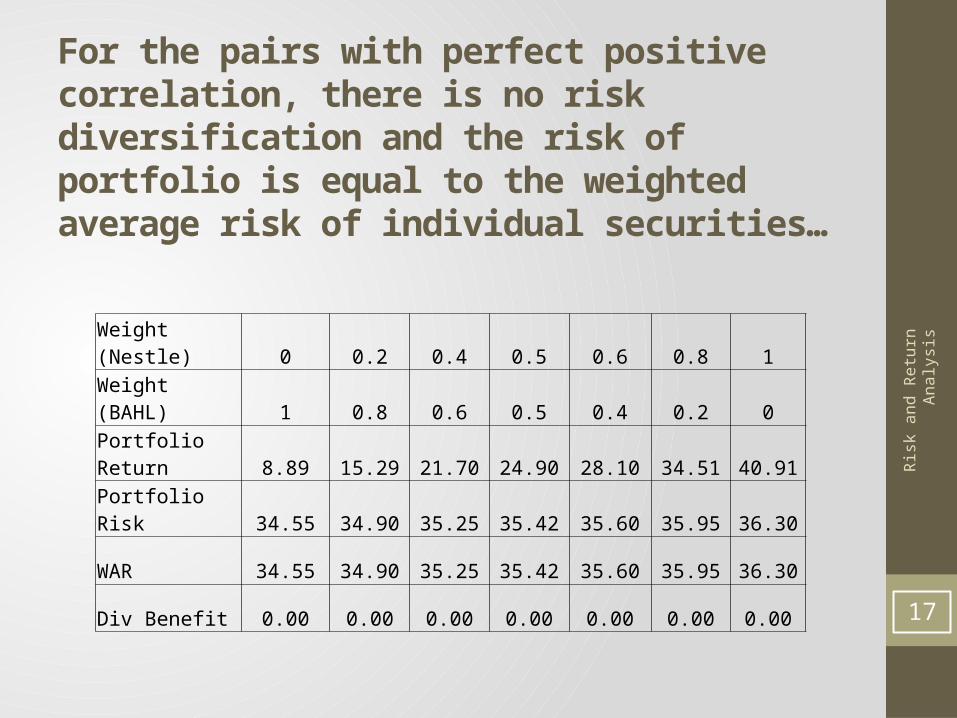
For the pairs with perfect positive correlation, there is no risk diversification and the risk of portfolio is equal to the weighted average risk of individual securities…
Weight (Nestle) 0 0.2 0.4 0.5 0.6 0.8 1Weight (BAHL) 1 0.8 0.6 0.5 0.4 0.2 0Portfolio Return 8.89 15.29 21.70 24.90 28.10 34.51 40.91
Portfolio Risk 34.55 34.90 35.25 35.42 35.60 35.95 36.30
WAR 34.55 34.90 35.25 35.42 35.60 35.95 36.30
Div Benefit 0.00 0.00 0.00 0.00 0.00 0.00 0.0017
Risk
and
Ret
urn
Anal
ysis
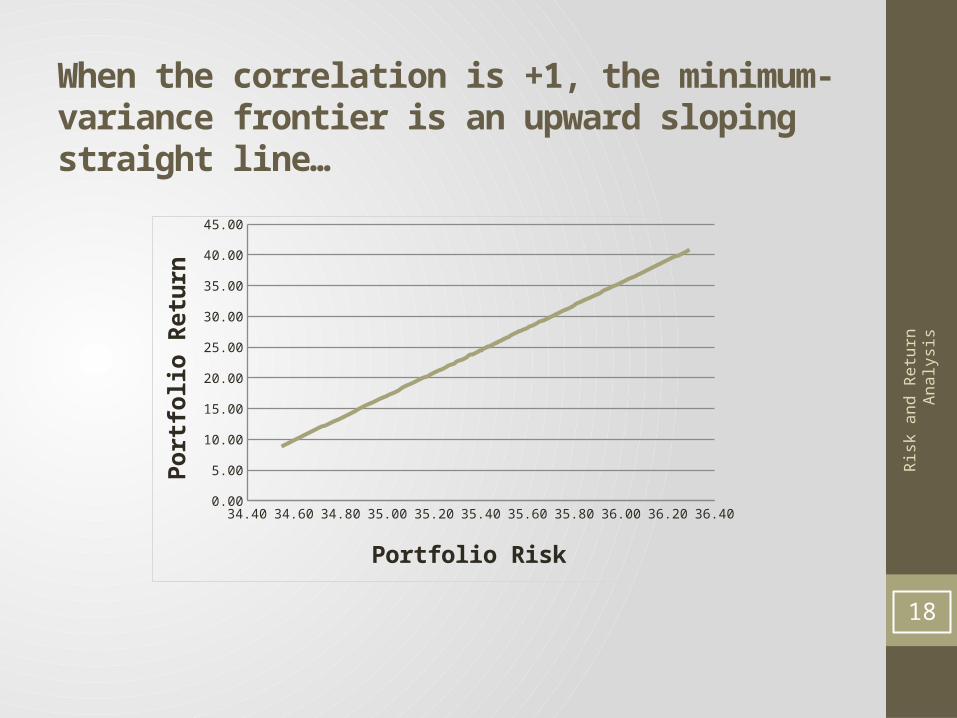
When the correlation is +1, the minimum-variance frontier is an upward sloping straight line…
34.40 34.60 34.80 35.00 35.20 35.40 35.60 35.80 36.00 36.20 36.400.00
5.00
10.00
15.00
20.00
25.00
30.00
35.00
40.00
45.00
Portfolio Risk
Portf
olio
Ret
urn
18
Risk
and
Ret
urn
Anal
ysis
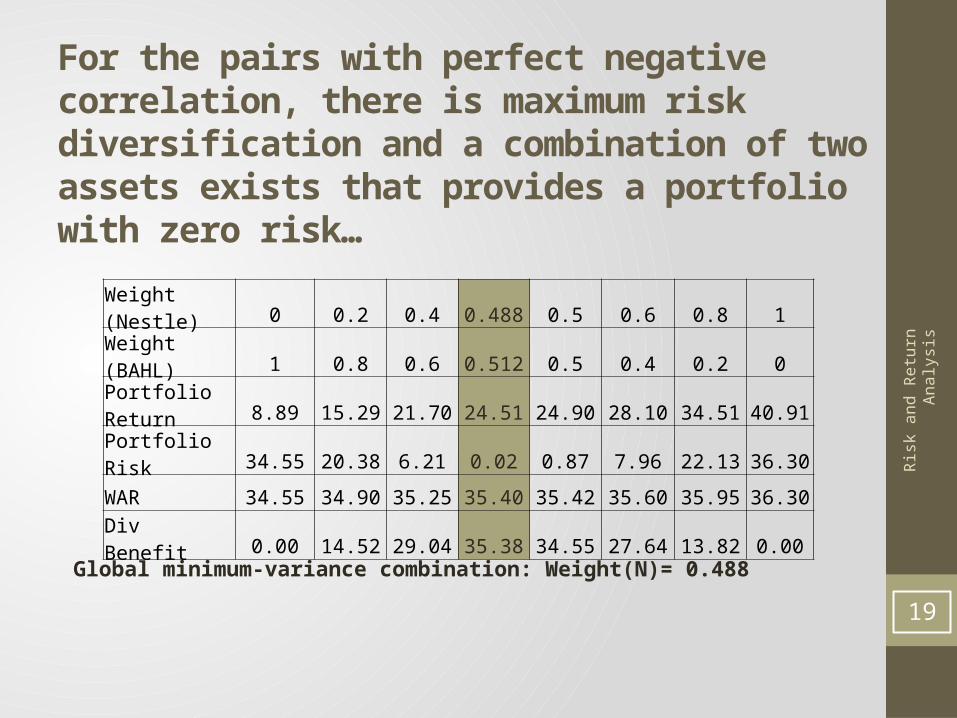
For the pairs with perfect negative correlation, there is maximum risk diversification and a combination of two assets exists that provides a portfolio with zero risk…
Global minimum-variance combination: Weight(N)= 0.488
Weight (Nestle) 0 0.2 0.4 0.488 0.5 0.6 0.8 1Weight (BAHL) 1 0.8 0.6 0.512 0.5 0.4 0.2 0Portfolio Return 8.89 15.29 21.70 24.51 24.90 28.10 34.51 40.91
Portfolio Risk 34.55 20.38 6.21 0.02 0.87 7.96 22.13 36.30
WAR 34.55 34.90 35.25 35.40 35.42 35.60 35.95 36.30
Div Benefit 0.00 14.52 29.04 35.38 34.55 27.64 13.82 0.00
19
Risk
and
Ret
urn
Anal
ysis
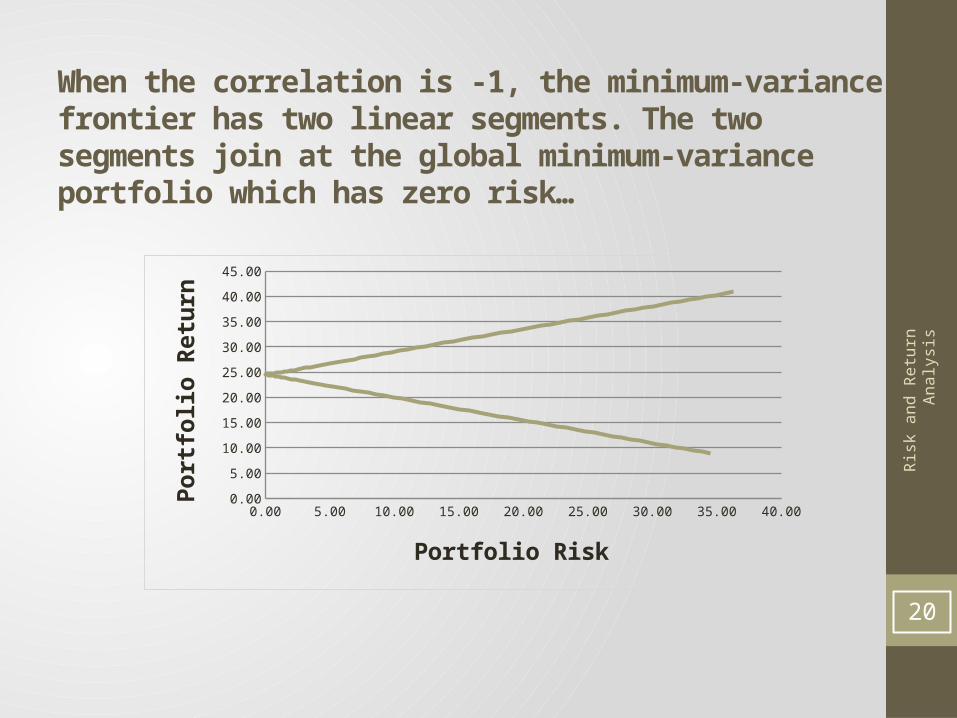
When the correlation is -1, the minimum-variance frontier has two linear segments. The two segments join at the global minimum-variance portfolio which has zero risk…
0.00 5.00 10.00 15.00 20.00 25.00 30.00 35.00 40.000.00
5.00
10.00
15.00
20.00
25.00
30.00
35.00
40.00
45.00
Portfolio Risk
Portf
olio
Ret
urn
20

Risk
and
Ret
urn
Anal
ysis
For the pairs with correlation between -1 and +1, there is some risk diversification and as we lower the correlation, holding other values constant, there are increasingly larger potential benefits of diversification…
Global minimum-variance combination: Weight(N)= 0.45
Weight (Nestle) 0 0.2 0.4 0.5 0.45 0.6 0.8 1Weight (BAHL) 1 0.8 0.6 0.5 0.55 0.4 0.2 0Portfolio Return 8.89 15.29 21.70 24.90 23.30 28.10 34.51 40.91
Portfolio Risk 34.55 31.78 30.50 30.49 30.44 30.90 32.93 36.30
WAR 34.55 34.90 35.25 35.42 35.33 35.60 35.95 36.30
Div Benefit 0.00 3.12 4.75 4.93 4.89 4.69 3.02 0.0021
Risk
and
Ret
urn
Anal
ysis
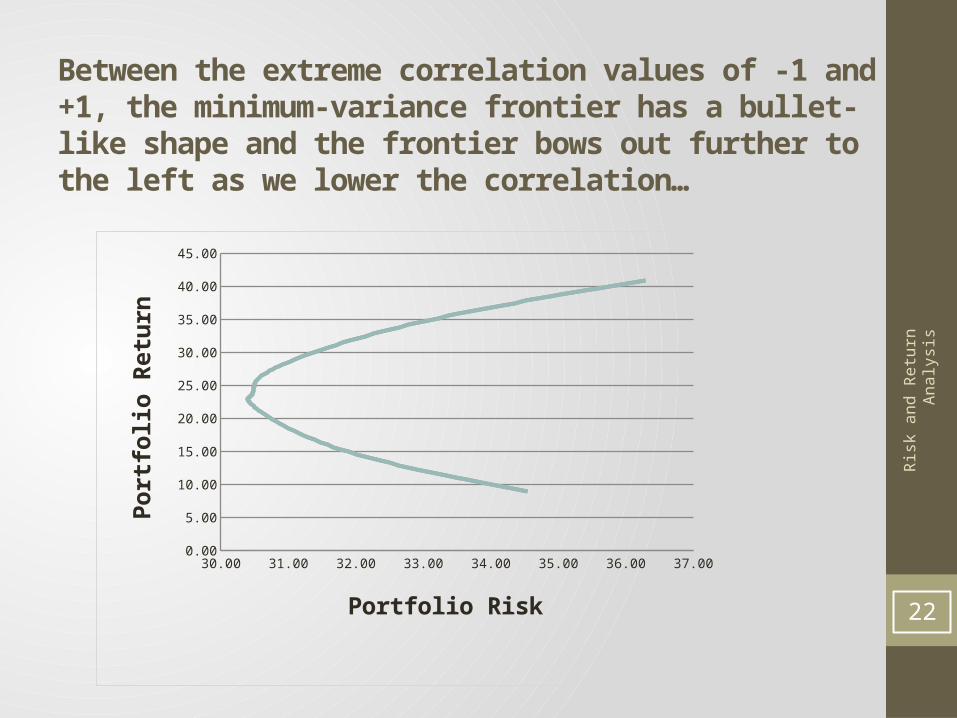
Between the extreme correlation values of -1 and +1, the minimum-variance frontier has a bullet-like shape and the frontier bows out further to the left as we lower the correlation…
30.00 31.00 32.00 33.00 34.00 35.00 36.00 37.000.00
5.00
10.00
15.00
20.00
25.00
30.00
35.00
40.00
45.00
Portfolio Risk
Portf
olio
Ret
urn
22
Risk
and
Ret
urn
Anal
ysis
Would adding third asset improve the available trade-offs between risk and return???
• One is never worse off for having additional choices.
• A new asset permits us to move to a superior minimum-variance frontier.
23

Risk
and
Ret
urn
Anal
ysis
How many different stocks must we hold in order to have a well-diversified portfolio???
• σp decreases as stocks added, because they would not be perfectly correlated with the existing portfolio.• Eventually the diversification benefits of
adding more stocks dissipates (after about 30 stocks), and for large stock portfolios, σp consists of the market risk only.
24

Risk
and
Ret
urn
Anal
ysis
Diversification effect increases as the number of stocks in a portfolio increases…
# Stocks in Portfolio10 20 30 40 2,000+
Company-Specific Risk
Market Risk
20
0
sp (%)35
25
Risk
and
Ret
urn
Anal
ysis
Market risk is measured through Beta… Beta is the variation in the stock return relative to the return of the market portfolio…
• If beta = 0, the asset is risk-free.• If beta = 1.0, the security is just as risky as
the average stock.• If beta > 1.0, the security is riskier than
average.• If beta < 1.0, the security is less risky than
average.• Most stocks have betas in the range of 0.5
to 1.5. 26
Risk
and
Ret
urn
Anal
ysis
Adjusted beta is a better forecast of future beta than is historical beta…
• Betas on average are mean-reverting.• The mean-reverting level of beta is 1.• If the historical beta is above 1, the
adjusted beta will be below historical beta and if the historical beta is below 1, the adjusted beta will be above the historical beta.
Adjusted beta: 2/3*Historical beta+1/3*1
27

Risk
and
Ret
urn
Anal
ysis
Beta instability decreases as the estimation period increases suggesting that the historical beta coefficients calculated using longer estimation period are better in predicting the future beta coefficients...
Beta Calculated Over:
Mean Standard Deviation
Minimum Maximum
1 year 0.646 1.832 -40.029 44.6462 years 0.626 1.166 -27.969 15.1433 years 0.603 1.018 -20.148 9.1674 years 0.577 0.938 -18.698 6.0115 years 0.575 0.857 -17.798 4.2976 years 0.572 0.803 -15.800 3.9557 years 0.574 0.749 -13.957 3.1438 years 0.580 0.700 -12.594 2.5589 years 0.589 0.631 -11.394 2.456
10 years 0.593 0.579 -7.148 2.46211 years 0.582 0.592 -6.911 2.45412 years 0.572 0.618 -6.578 2.17213 years 0.563 0.659 -6.471 1.79114 years 0.561 0.637 -6.163 1.777
Average beta calculated using the total return price data on 325 stocks listed on the Karachi Stock Exchange (KSE), for the period January 1999 to December 2012.
Tauseef, S. (2013). Beta Stationarity and Estimation Period: Evidence from Pakistan’s Equity Market, Working Paper.
28
Risk
and
Ret
urn
Anal
ysis
CAPM makes the following assumptions…
• Investors need only know about expected returns, variances and correlations to determine which asset/portfolio is optimal for them.• Investors have identical views about risky
assets’ returns, variances and correlations.• All assets are marketable and can be traded in
any size.• Investors can borrow or lend at the risk-free
rate without any limit.• There are no taxes, transaction costs and
spreads. 29
Risk
and
Ret
urn
Anal
ysis
CAPM specifies a linear relationship between risk and required return...
CAPM concludes that:The relevant risk of an individual stock is its contribution to the risk of a well-diversified portfolio.The return for a security/portfolio depends on:
I. Risk-free rateII. Risk Premium available in the marketIII. Security/portfolio risk
30

Risk
and
Ret
urn
Anal
ysis
Though CAPM is used widely model in applications; however, the model has failed badly in the empirical tests…
The relationship between beta and average returns disappear when some important fundamentals of the firm are added. The average returns are negatively related to size and positively related to book-to-market ratio.
Fama E.F. and K.R. French (1992). The Cross-Section of Expected Stock Returns, The Journal of Finance, 47, 2, 427-465.
31