Risk Retention and Quali ed Commercial Mortgages
29
Risk Retention and Qualified Commercial Mortgages By Sumit Agarwal and Brent W. Ambrose and Yildiray Yildirim and Jian Zhang * We study the effectiveness of the risk retention rule - requiring 5% of underlying credit risk for commercial mortgage backed secu- rities, that was differentially implemented with differential impact on commercial loan markets. Since the primary objective of this rule is for the deal sponsors to have skin in the game, we expect that underwriting standards should tighten following the implemen- tation of the rule. We find that, treated loans, have a higher time- to-securitization, lower price premium, less rating shopping, and lower default probability. Overall our results show that the Dodd- Frank risk retention rule curtailed credit growth in the commercial real estate market. Keywords: CMBS, Risk Retention * Agarwal: National University of Singapore. Ambrose: Penn State University. Yildirim: Baruch College. Zhang: Hong Kong Baptist University. We thank Andra Ghent for helpful comments and suggestions and the seminar participants at Fudan University, SHUFE University, Baruch College, Xi’an Jiaotong University, the 2018 Multinational Finance Society, the 2018 EFMA, and the 2018 AREUEA International meeting in Guangzhou. We also gratefully acknowledge the financial support of the Real Estate Research Institute. 1
Transcript of Risk Retention and Quali ed Commercial Mortgages
Risk Retention and Qualified Commercial Mortgages
By Sumit Agarwal and Brent W. Ambrose and Yildiray Yildirim
and Jian Zhang∗
We study the effectiveness of the risk retention rule - requiring
5% of underlying credit risk for commercial mortgage backed secu-
rities, that was differentially implemented with differential impact
on commercial loan markets. Since the primary objective of this
rule is for the deal sponsors to have skin in the game, we expect
that underwriting standards should tighten following the implemen-
tation of the rule. We find that, treated loans, have a higher time-
to-securitization, lower price premium, less rating shopping, and
lower default probability. Overall our results show that the Dodd-
Frank risk retention rule curtailed credit growth in the commercial
real estate market.
Keywords: CMBS, Risk Retention
∗ Agarwal: National University of Singapore. Ambrose: Penn State University. Yildirim: BaruchCollege. Zhang: Hong Kong Baptist University. We thank Andra Ghent for helpful comments andsuggestions and the seminar participants at Fudan University, SHUFE University, Baruch College, Xi’anJiaotong University, the 2018 Multinational Finance Society, the 2018 EFMA, and the 2018 AREUEAInternational meeting in Guangzhou. We also gratefully acknowledge the financial support of the RealEstate Research Institute.
1

2
I. Introduction
The Dodd-Frank Wall Street Reform and Consumer Protection Act of 2010
(Dodd-Frank Act) was one of the signature legislative and regulatory actions
arising from the Great Recession and financial crisis.1 The purpose of the Dodd-
Frank Act was to attack perceived structural deficiencies in the financial markets
that led to the Great Recession. Given the central role that mortgage securiti-
zation played in the period prior to the financial crisis, new regulations covering
mortgage origination, securitization, and investment are central features of the
Dodd-Frank legislation. In particular, the Dodd-Frank Act codified a new “Risk
Retention Rule” for issuers of mortgage-backed securities.2 Under the theory
that the creators of securitization deals should have interests aligned with in-
vestors (Demiroglu and James, 2014), this rule requires that sponsors retain 5%
of the credit risk in a deal.3
While the majority of the Dodd-Frank Act regulations center on the residential
mortgage market, many of the Act’s provisions are much broader and target
other areas of the capital markets. For example, the credit risk retention rule
also applies to commercial mortgage backed securities (CMBS) and specifies that
1 The Dodd-Frank Act is available online at http://www.cftc.gov/idc/groups/public/@swaps/documents/file/hr4173_enrolledbill.pdf.
2 The risk retention rule became effective on December 24, 2016 as a joint regulation of the Officeof the Comptroller of the Currency, the Board of Governors of the Federal Reserve System, the FederalDeposit Insurance Corporation, and the Securities and Exchange Commission as specified in Section941 (Regulation of credit risk retention), Subtitle D (Improvements to the Asset-Backed SecuritizationProcess), of Title IX (Investor Protections and Improvements to the Regulation of Securities), whichamended the Securities Exchange Act of 1934 (15 U.S.C. 78a et seq.).
3 See Sweet (2018) and Sargent and Jewesson (2016) for comprehensive overviews of the credit riskretention rule. Furthermore, Floros and White (2016) note that risk retention is designed to attenuatemoral hazard between loan originators and investors.

3
the CMBS sponsor can meet the 5% risk retention through holding a vertical or
horizontal interest in the deal or by selling the credit risk interest to the so-called
“B-Piece Buyer.” A vertical interest refers to the sponsor having an ownership
position of at least 5% in each of the deal classes (or tranches) while a horizontal
interest refers to the first-loss position for the deal. However, regardless of type
of interest, the risk-retention rule effectively requires the issuer to retain exposure
to the underlying mortgage pool.
Interestingly, the risk retention rule created a number of exemptions for se-
curitization deals backed by “Qualified Mortgages” (QM). While most of the
attention surrounding these exemptions focuses on residential mortgages, certain
commercial mortgages also satisfy the regulations for QM status.4 For example,
the exemption applies to mortgages on multifamily or health care facilities that
are insured or guaranteed by the U.S. government or the government sponsored
enterprises (Fannie Mae and Freddie Mac) while they remain in conservatorship
(see Harris et al., 2015). However, the exemptions are narrowly defined such that
the majority of commercial real estate loans that comprise CMBS deals do not
meet these requirements.5
4 Section 15G (Credit Risk Retention) of the Securities Exchange Act of 1934 (as amended by Section941 of the Dodd-Frank Act) outlines the exemptions and exceptions to the credit risk retention rule forQualified Residential Mortgages (see Section 15G.–Credit Risk Retention, paragraph (e)–Exemptions,Exceptions, and Adjustments, subparagraph (B)–Qualified Residential Mortgage.) Furthermore, Sections1234.15 “Qualifying commercial loans, commercial real estate loans, and automobile loans” and 1234.17“Underwriting standards for qualifying CRE loans” of Subpart D–Exceptions and Exemptions of Part1234–Credit Risk Retention (Eff. 2-23-15) of Chapter XII–Federal Housing Finance Agency of Title 12–Banks and Banking of the Code of Federal Regulations outline the exemptions for qualifying commercialreal estate loans.
5McBride (2014) notes that only between 3.6% to 15.6% (by loan balance) of Trepp’s public conduituniverse of CMBS deals issued between 1997 and 2013 would meet the qualified CRE exemption. Thus,the vast majority of CMBS transaction are subject to the risk retention rules set forth by the Dodd-FrankAct.

4
The carve-out for CMBS deals comprising multifamily loans guaranteed by the
GSEs creates a natural experiment for testing the impact of the Dodd-Frank Act
risk retention rules. Since the primary objective of this rule is to require the deal
sponsors to participate in the risks associated with the loans backing CMBS, we
expect that underwriting standards should tighten following the implementation
of the rule. As a result, the Dodd-Frank Act regulations may have a profound
impact on capital costs in the commercial real estate market.
In order to test the impact of the Dodd-Frank risk retention rule on the com-
mercial real estate market, we examine various individual loan risk metrics as
well as changes in issuer actions. For example, one aspect reflecting a change in
risk is the observable ex post default performance for commercial loans. If the
Dodd-Frank regulation altered underwriting and created incentives for less risk
taking, then we should see this change reflected in lower ex post default rates fol-
lowing enactment of the regulations. We also examine changes in loan origination
spreads to see the whether loan pricing reflects the change in risk associated with
the implementation of the risk retention regulation. We then look to the response
of CMBS issuers to changes in the risk retention rule by focusing on loan ware-
house time (time-to-securitization), deal level pricing as reflected in average deal
coupons, and issuer rating shopping. Finally, we focus on the macro-economic
impact by examining whether the risk retention rule reduced the supply of credit.
Our empirical analysis reveals that the Dodd-Frank risk retention rule had a
significant impact on commercial real estate mortgage originations. Following the

5
rule’s implementation, we find that (1) conduit loans saw a significant increase
in the time-to-securitization relative to agency loans, (2) the relative pricing pre-
mium between agency and conduit deals declined, (3) issuers were less likely to
engage in ratings shopping on conduit deals, (4) conduit loans had a decline in
their risk premium relative to agency loans, and (5) the probability of default on
conduit loans declined. Thus, these results are consistent with lenders imposing
tighter underwriting standards on conduit loans following the risk retention rule
implementation. Furthermore, we find that loan growth significantly declined for
lenders who engaged in high conduit volume loan activity prior to the rule imple-
mentation. As a result, we confirm that the Dodd-Frank risk retention rule did
curtail credit growth in the commercial real estate market. Finally, we show that
relatively weaker underwriters (as measured by their capital ratio) reduced their
exposure to CMBS deals subject to risk retention.
Our paper is part of a growing strand of literature examining the incentives as-
sociated with the originate-to-distribute model in the mortgage market and how
government regulations can alter tendencies to take excessive risk.6 Much of this
literature focuses on how asymmetric information between lenders and investors
about the quality of the underlying mortgages can impact incentives in the secu-
ritization model. For example, empirical studies show that higher proportions of
riskier mortgages in MBS deals are often associated with higher retention of the
junior tranche (Begley and Purnanandam, 2017) or that lenders tend to retain
6Frame (2018) provides an exhaustive survey of the existing literature, focusing on securitizaiton ofresidential mortgages.

6
riskier mortgages in portfolio (Ambrose et al., 2005; Agarwal et al., 2012; Jiang
et al., 2014). The empirical findings tend to mirror theoretical models showing
that equity risk retention is not always the optimal mechanism for offsetting the
incentives of lenders to take advantage of asymmetric information in order to se-
curitize risky assets (Hattori and Ohashi, 2011; Fender and Mitchell, 2009; Kiff
and Kisser, 2010).7 In addition, Guo and Wu (2014) develop a formal model that
shows how risk retention can enhance adverse selection on the part of lenders.
As noted by Frame (2018), the take-away from this literature is that partici-
pants in the residential market were aware of the incentives embedded in the
securitization model and thus the need for additional regulation may have been
overstated.8 While much work examines risk retention and securitization in the
residential market, the literature examining effects in the commercial mortgage
space is sparse. However, recent work does focus on the role of risk retention in
the commercial mortgage back security space. For example, Ashcraft et al. (2018)
examines how the sale of junior CMBS tranches into collateralized debt obliga-
tions (CDOs) is correlated with the quality of the overall CMBS deal. As a result,
their study suggests that requiring issuers to retain risk could have positive af-
fects on security performance. Perhaps closest to our paper is the work of Furfine
(2018), however his focus is on the impact of the policy change on observable loan
characteristics such as DSCR and LTV. Our work, on the other hand, focuses on
7See also Bougheas (2014) for a model of the incentives for MBS sponsors to retain risk in securiti-zation deals during the pre-crisis period.
8Willen (2014) is also highly critical of risk retention regulations and points out a number of problemswith justifications for government intervention.

7
the effect of the policy change on the measure of risks such as pricing, default,
rating shopping, and the growth of credit in commercial real estate market.
II. Empirical Method and Data
We obtained data from Trepp for 27,024 commercial mortgages originated be-
tween January 2014 and February 2018.9 These loans were securitized in 490
CMBS deals.
Table 1 reports the deal-level (Panel A) and loan-level (Panel B) descriptive
statistics for the full sample, conduit deals, and non-conduit deals. Consistent
with the Dodd-Frank Act regulations having a significant impact on capital costs
in the commercial real estate loan market, we see substantial differences across
observables with respect to conduit or non-conduit classifications. For example,
conduit deals have higher risk premiums (2.3% versus 1.9%), higher probabilities
of rating shopping (50% versus 15%), and shorter terms to maturity. Further-
more, we note that the number of non-agency (or conduit) CMBS deals declined
60 percent in the first quarter of 2017 from the previous quarter (following the im-
plementation of the risk-retention rule in December 2016). In contrast, issuance
of agency CMBS in the first quarter of 2017 declined 27 percent from the fourth
quarter of 2016. We also note a similar decline in the number of non-agency
loans. The on-line appendix provides greater detail about the sample (including
the geographic distribution of the loans).
9 Trepp is cited as one of the real estate industry’s largest providers of information on securitizedcommercial mortgages. Trepp tracks over 1,500 CMBS deals comprising over 100,000 mortgages. Moreinformation about Trepp is available at http://www.trepp.com/about-us.
8
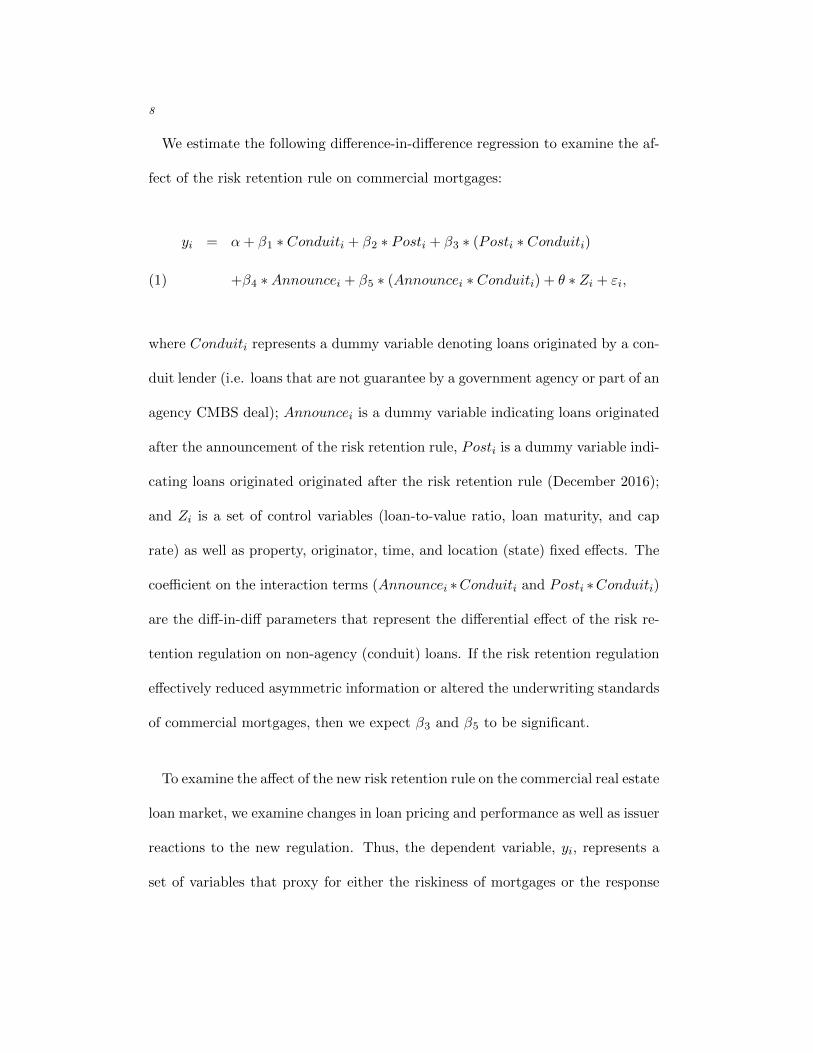
We estimate the following difference-in-difference regression to examine the af-
fect of the risk retention rule on commercial mortgages:
yi = α+ β1 ∗ Conduiti + β2 ∗ Posti + β3 ∗ (Posti ∗ Conduiti)
+β4 ∗Announcei + β5 ∗ (Announcei ∗ Conduiti) + θ ∗ Zi + εi,(1)
where Conduiti represents a dummy variable denoting loans originated by a con-
duit lender (i.e. loans that are not guarantee by a government agency or part of an
agency CMBS deal); Announcei is a dummy variable indicating loans originated
after the announcement of the risk retention rule, Posti is a dummy variable indi-
cating loans originated originated after the risk retention rule (December 2016);
and Zi is a set of control variables (loan-to-value ratio, loan maturity, and cap
rate) as well as property, originator, time, and location (state) fixed effects. The
coefficient on the interaction terms (Announcei ∗Conduiti and Posti ∗Conduiti)
are the diff-in-diff parameters that represent the differential effect of the risk re-
tention regulation on non-agency (conduit) loans. If the risk retention regulation
effectively reduced asymmetric information or altered the underwriting standards
of commercial mortgages, then we expect β3 and β5 to be significant.
To examine the affect of the new risk retention rule on the commercial real estate
loan market, we examine changes in loan pricing and performance as well as issuer
reactions to the new regulation. Thus, the dependent variable, yi, represents a
set of variables that proxy for either the riskiness of mortgages or the response
9
of the CMBS issuer. For example, we examine the log time-to-sale, defined as
the time lag between mortgage origination and CMBS issuance (Titman and
Tsyplakov, 2010), as a measure of the costs associated with securitization. To
the extent that the risk retention regulation altered the liquidity of the CMBS
market, then this should be reflected in a change in the time-to-securitization. We
also examine mortgage performance (probability of default) since the intention
of the risk retention rule is to cause originators to internalize the costs of bad
underwriting (since CMBS originators are now required to hold part of the deal).
To explore issuer responses to changes in the regulation, we examine differences
in mortgage warehouse risk (time-to-securitization), deal level pricing, and the
probability of issuer rating shopping.
Tables 2 and 3 report the estimation results. In table 2, we focus on the
response of the mortgage-backed security issuer to the new regulation stemming
from changes in loan originator underwriting. Our analysis examines changes in
loan time-to-sale, deal level pricing (via the coupon spread), and issuer rating
shopping. In table 3, we focus on changes in risk at the individual loan level (via
mortgage origination spread and ex post probability of default).
III. Results
A. Risk Retention and Issuer Response
Warehouse Risk
We first focus on the time between loan origination and securitization (otherwise

10
known as time-to-sale or warehouse risk) as an observable proxy for the level of due
diligence the CMBS issuer conducts on the mortgage pool prior to securitization.
Since the purpose of the risk retention rule is to require the security issuer to hold
a risk position in the security (i.e. have ‘skin-in-the-game’), we expect a positive
shift in the time-to-sale for affected loans following the rule announcement as
issuers subject individual loans to greater due diligence scrutiny, necessitating a
longer warehouse period. As a result, the risk retention rule should mitigate the
natural tendency for issuers to quickly securitize higher-risk loans.
Column (1) in Table 2 presents the estimation results where the dependent
variable is the time between loan origination and securitization (time-to-sale).
The negative coefficient for Conduit indicates that loans in non-agency CMBS
deals have a significantly shorter period between origination and securitization
than multi-family GSE loans, on average. Again, this is consistent with the view
that time-to-securitization is a proxy for risk appetite on the part of the issuer
since GSE-backed loans are less risky than non-GSE backed loans due to the
credit enhancement provided by the GSEs. As a result, originators are willing to
take on greater warehouse risk for GSE-backed loans as the default risk exposure
on these loans is minimal.
Turning to the impact of the new risk retention rule, we see that the negative
(and statistically significant) coefficients for Announcement and Post-Reform in-
dicate that loans originated in the announcement period and after the regulation
enactment have significantly shorter time-to-securitization than loans originated

11
prior to the discussion of the regulation. In order to assess the differential effect
of the regulation on mortgages subject to the new regulation, we note that the
positive and significant coefficient for Conduit*Announcement implies that the
time-to-securitization for non-agency loans significantly lengthened relative to
agency-backed mortgages following the announcement of the risk-retention rules.
This is consistent with issuers requiring longer periods for due diligence when cre-
ating securities comprising loans subject to the new regulation. Furthermore, the
significant positive coefficient for Conduit*Post-Reform confirms a permanent in-
crease in securitization time for non-agency loans relative to agency-backed mort-
gages. The estimates also display an economically significant effect. For example,
in response to the implementation of risk retention rule, the estimated coefficients
indicate that the securitization time of non-agency loans created following risk
retention requirements is 96-days longer than the corresponding shift for agency-
backed mortgages. Furthermore, when evaluated relative to the sample mean, the
estimates are equivalent to a 73% (96/132) increase in the time-to-securitization.
Finally, with respect to the control variables, we note that LTV and capitaliza-
tion (or cap) rate (NOI/Property Vale) have the expected signs. Consistent with
incentives to quickly securitize higher risk loans, we note that the negative and
statistically significant coefficient for LTV implies that mortgages with higher
loan-to-value ratios (or less equity on the part of the borrower) are securitized
faster than loans with lower LTV ratios. Furthermore, the positive and significant
coefficient for the capitalization rate suggests that, all else equal, loans collater-

12
alized by properties that have higher cap rates are viewed as less risky and thus
have longer times-to-securitization. The intuition is that as borrowers pay higher
values per dollar of cash flow (resulting in lower cap rates), the loans underlying
those properties have greater risk. In contrast, when borrowers pay less per dollar
of cash flow (i.e. a higher cap rate), then the loan underlying the property has
less risk.
Deal Level Pricing
Column (2) in table 2 reports regression coefficients examining the differences
in deal level pricing following the introduction of the risk retention rule. The
negative and statistically significant coefficient for Conduit*Post-Reform suggests
that following the enactment of the risk-retention rule, relative pricing premium
demanded for non-agency CMBS deals declined. Again, this is consistent with
the impact of the regulation reducing the overall risk profile of mortgage-backed
securities. The estimates are, once again, economically meaningful. For example,
the deal spread for non-agency CMBS deals created after the reform is 0.42%
lower in absolute terms compared to the change for agency deals. This reduction
is equivalent to a 20% (0.42/2.11) decline relative to the sample mean.
Issurer Rating Shopping
Finally, column (3) in table 2 turns to the actions of the issuer in securing
ratings for the CMBS deal. In this regression, we exploit a unique feature of
the structured finance product. We note that rating a CMBS tranche that lies
below others in the security waterfall requires an analysis of the interest that the

13
waterfall promises to the tranches above it (Flynn and Ghent, 2018). Thus, the
dependent variable takes a value of one if the deal has a tranche with a missing
rating but the tranche below it in the capital stack is rated. As expected, the
positive and significant coefficient for Conduit indicates that non-agency CMBS
deals are more likely to be associated with issuer rating shopping. However, con-
sistent with the risk retention regulation altering the incentives to originate risky
deals, we see that the coefficient on the interaction term (Conduit*Post-Reform)
is negative and significant. This indicates that following enactment of the risk
retention rule, issuers were less likely to engage in rating shopping. Economically
speaking, the estimated coefficients imply a 65% (53.7/82.7) reduction in issuer
rating shopping propensity for non-agency CMBS deals relative to the agency
deals following the regulation announcement.
B. Risk Retention and Individual Loan Risk
We anticipate that mortgage originators responded to the greater CMBS issuer
due diligence requirements by imposing tighter underwriting standards. Thus,
we expect the outcome of these changes to be reflected in changes in ex post
mortgage default and the individual mortgage risk premium (loan spread).
Loan Pricing
Table 3, column (1) reports the regression results for loan pricing. The depen-
dent variable is the mortgage spread, which is defined as the difference between
the mortgage interest rate at origination and the comparable maturity Treasury

14
rate observed at the mortgage origination date. The spread is thus a proxy for
the loan’s risk premium.
As expected, the difference-in-difference parameter (Conduit*Post-Reform) is
negative and statistically significant, revealing the expected decline in relative
risk premiums on affected mortgages following the introduction of the risk reten-
tion rule. This is consistent with the credit enhancement provided by the GSE’s.
The significant decline in the risk premiums, relative to the non-treated agency
mortgages, is consistent with lenders imposing tighter underwriting standards on
commercial mortgages. The significant decline in the risk premiums, relative to
the non-treated agency mortgages, corresponds to a decline of 16% (0.336/2.12),
which is consistent with lenders imposing tighter underwriting standards on com-
mercial mortgages.
Mortgage Default
In column (2) of table 3, we report the estimated coefficients for the model of the
probability of loan default (90+ days delinquency) over the 24-months following
securitization. The results confirm the view that lenders tightened underwriting
standards following the announcement and enactment of the risk-retention rule.
For example, the difference-in-difference parameters (Conduit*Announcement and
Conduit*Post-Reform) are negative and statistically significant indicating that
the relative probability of default on non-agency mortgages declined following the
risk retention rule announcement and enactment. For instance, the difference-in-
difference estimate shows that the treated mortgages experienced a significant
15
reduction in the default probability by about 0.4% on average during the 2-year
period after the risk retention rule relative to the control group.
C. Macro-Economic Impact
We now turn to the broader outcome of bank operations in order to explore
whether the risk retention rule affected the credit supply. The empirical challenge
is how to identify the extent that different banks are exposed to the regulation.
To do so, we exploit bank-level heterogeneity in the Conduit CMBS business en-
gagement for each time-point and construct time-varying measures. Specifically,
for bank i at quarter t, we trace all its non-agency CMBS underwriting activities
in the past year and obtain the total number as well as total balance of Conduit
CMBS it underwrites.Besides the absolute level, we also create dummy variables
that equal to one if its total number/ total balance of Conduit CMBS business
is above the cross-sectional median.In other words, our approach explores the
cross-sectional variation in bank exposure to the risk retention rule.
Next, we adopt a specification similar to Cornett et al. (2011) to analyze how
the bank’s quarterly credit supply varies with its exposure to the risk retention
rule. Table 4 reports the estimated coefficients for this credit supply model.
Columns (1) and (2) report the OLS estimation results using number of conduit
deals as the proxy for exposure to the regulation.10 The interaction of number
of conduit deals and post is negative and statistically significant, indicating that
10Column (1) includes the variable Post while column (2) includes quarter fixed effects.

16
the relative loan growth declined following the risk retention rule implementation
for lenders that engaged in greater conduit deal origination activity. We find the
same effect in columns (3) through (8) using a dummy variable for high conduit
lenders, the dollar value of conduit deals, and a dummy variable for high dollar
value lenders. Thus, we find evidence that enactment of the risk retention rule
had a significant negative impact on growth in CMBS origination activity.
Finally, in Table 5 we explore the how lender market shares shifted following
implementation of the risk retention rule. Our focus is on the CMBS lead un-
derwriters and we restrict the analysis to bank holding companies that file US
regulatory reports. To ensure the consistency of bank holding company (BHC)
level information, we follow the process outlined in Acharya et al. (2017) to ob-
tain all BHC information from US regulatory reports (FR Y-9C). Foreign bank
offices (FBOs) and other subsidiaries are supervised by the Federal Reserve but
do not file US regulatory reports.11 Thus, based on this restriction, we examine
the commercial loan origination market shares for the ten US banks identified as
lead underwriters for CMBS transactions.12 These ten banks account for 474 of
the 490 deals (97%) in our sample.
Table 5 panel A reports the shift in market shares following implementation of
the risk retention rule for “large” and “small” banks. We define the underwriters
as large (small) if the bank’s average total assets prior to the risk retention rule
11For example, Acharya et al. (2017) note that Nomura Holdings Inc. is among the foreign banks thatdo not file regulatory reports.
12The ten US banks are Bank of America, Barclays Capital, Citigroup, Credit Suisse, Deutsche Bank,Goldman Sachs, JP Morgan, Morgan Stanley, UBS, and Wells Fargo.

17
(2014-2016) is above (below) the sample median.13 The results indicate almost
no change in market shares across underwriters for Conduit CMBS deals (the
average deal volume market share for large underwriters is 57.9% prior to the
reform versus 60.3% following the reform.) However, we see a substantial and
statistically significant increase in Agency CMBS origination market share for
large underwriters (49.2% prior to the reform to 66.4% after the reform.) Thus,
comparing origination market shares before and after the risk retention imple-
mentation shows that the larger underwriters gained greater market power in
deals not subject to the risk retention rule.
Next, in Table 5 panel B we compare the change in origination market shares
after classifying underwriters based on their Tier 1 capital ratios. The capital
ratio is defined as total equity divided by total assets and is used as a measure
of a bank’s financial health. By segmenting banks into high (low) capital ratios
based on whether their average pre-reform capital ratio is above (below) the
sample average, we measure a bank’s financial strength relative to its peers.14 In
contrast to the comparison across bank size, in Panel B we see that underwriters
with relative high capital ratios increase their Conduit CMBS origination market
shares following the risk retention rule (going from 40.9% to 57.8%) while Agency
CMBS origination market shares remain essentially constant (going from 49.1% to
13Based on this classification, small underwriters are Barclays Capital, Credit Suisse, Deutsche Bank,Morgan Stanley, and UBS, while large underwriters are Bank of America, Citigroup, Goldman Sachs, JPMorgan, and Wells Fargo. The classification stays the same if we use post-reform average total assets.
14Note, our analysis does not imply that banks with capital ratios below the sample median are atgreater risk than the other banks, but rather that they are relatively weaker than banks with capitalratios above the median. The banks below the median capital ratio are Barclays Capital, Deutsche Bank,Goldman Sachs, JP Morgan, and Morgan Stanley, while those above the median are Bank of America,Citigroup, Credit Suisse, UBS, and Wells Fargo.
18
48.1%) and not statistically different. Thus the comparison of CMBS origination
market shares shows that relatively weaker underwriters reduced their exposure
to the CMBS market when required to take a risk position in the securitization
deals. In contrast, for the market segment where underwriters are not required
to hold a risk position (Agency CMBS deals), we see no change in underwriting
market shares.
IV. Conclusion
This paper presents an empirical test of the Dodd-Frank Act’s risk retention
rule that is aimed at issuers of mortgage-backed securities. The regulation re-
quires that MBS issuers retain a minimum of 5% of any deal they underwrite.
The rational for this rule is to align the incentives of issuers who create the secu-
rities with those of investors by requiring that issuers retain a portion of the risk
associated with the securities.
We take advantage of an exemption in the risk retention rule for mortgages
insured or guaranteed by the US government or GSEs that created a natural ex-
periment – certain CMBS portfolios that contain mortgages insured by the GSEs
are not subject to the risk retention rule while the remaining commercial mortgage
market is subject to the rule. Thus, we use the CMBS market to test whether
the Dodd-Frank regulation altered underwriter risk taking. Using a difference-in-
difference regression framework, we confirm that underwriting standards on com-
mercial mortgages subject to the risk retention regulation did increase following

19
the regulation’s enactment. Specifically, our analysis shows that risk premiums
on affected mortgages declined following the regulation, which is consistent with
the decline in ex post default probabilities for affected mortgages. Furthermore,
we show that the underwriters with lower relative capital positions reduced their
exposure to the risk retention requirement. Thus, the results are consistent with
lenders responding as expected by tightening underwriting standards following
the regulation’s enactment. Finally, we find evidence that lenders’ reduced the
overall supply of credit following the risk retention rule implementation.
REFERENCES
Acharya, V. V., Afonso, G., and Kovner, A. (2017). How do global banks scramblefor liquidity? evidence from the asset-backed commercial paper freeze of 2007.Journal of Financial Intermediation, 30:1 – 34.
Agarwal, S., Chang, Y., and Yavas, A. (2012). Adverse selection in mortgagesecuritization. Journal of Financial Economics, 105(3):640 – 660.
Ambrose, B. W., LaCour-Little, M., and Sanders, A. B. (2005). Does regulatorycapital arbitrage, reputation, or asymmetric information drive securitization?Journal of Financial Services Research, 28(1):113–133.
Ashcraft, A. B., Gooriah, K., and Kermani, A. (2018).Does skin-in-the-game affect security performance? Avail-able at SSRN: https://ssrn.com/abstract=2437574 orhttp://dx.doi.org/10.2139/ssrn.2437574.
Begley, T. A. and Purnanandam, A. (2017). Design of financial securities: Empir-ical evidence from private-label rmbs deals. The Review of Financial Studies,30(1):120–161.
Bougheas, S. (2014). Pooling, tranching, and credit expansion. Oxford EconomicPapers, 66(2):557–579.
Cornett, M. M., McNutt, J. J., Strahan, P. E., and Tehranian, H. (2011). Liq-uidity risk management and credit supply in the financial crisis. Journal ofFinancial Economics, 101(2):297–312.

20
Demiroglu, C. and James, C. M. (2014). The Dodd-Frank Act and the Regula-tion of Risk Retention in Mortgage-Backed Securities. In Schultz, PH, editor,Perspectives on Dodd-Frank and Finance, pages 201–216.
Fender, I. and Mitchell, J. (2009). Incentives and tranche retention insecuritisation: a screening model. BIS Working Papers, Available at:https://ideas.repec.org/p/bis/biswps/289.html.
Floros, I. and White, J. T. (2016). Qualified residential mortgages and defaultrisk. Journal of Banking & Finance, 70:86–104.
Flynn, S. and Ghent, A. (2018). Competition and credit ratings after the fall.Management Science, 64(4):1672–1692.
Frame, W. S. (2018). Agency conflicts in residential mortgage securitization:what does the empirical literature tell us? Journal of Financial Research,41(2):237–251.
Furfine, C. (2018). The impact of risk retention regulation on the underwritingof securitized mortgages. Available at SSRN: https: // ssrn. com/ abstract=3121219 or http: // dx. doi. org/ 10. 2139/ ssrn. 3121219 .
Guo, G. and Wu, H.-M. (2014). A study on risk retention regulation in assetsecuritization process. Journal of Banking & Finance, 45:61 – 71.
Harris, M., Simonds, R., and Liebherr, L. (2015). Risk Re-tention and RMBS. Alstron & Bird: Finance, https:
//www.alston.com/-/media/files/insights/publications/
2015/10/ifinance-advisoryi-risk-retention-and-rmbs/
files/view-advisory-as-pdf/fileattachment/
15253risk-retention-and-rmbs.pdf:1–7.
Hattori, M. and Ohashi, K. (2011). Detrimental Effects of Reten-tion Regulation: Incentives for Loan Screening in Securitization un-der Asymmetric Information. IMES Discussion Paper Series (11-E-17),https://ideas.repec.org/p/ime/imedps/11-e-17.html.
Jiang, W., Nelson, A. A., and Vytlacil, E. (2014). Securitization and loan perfor-mance: Ex ante and ex post relations in the mortgage market. The Review ofFinancial Studies, 27(2):454–483.
Kiff, J. and Kisser, M. (2010). Asset securitization and optimal retention. IMFWorking Papers.
McBride, J. (2014). What Qualifies? Risk Retention in CMBS.Trepp: Available at http: // info. trepp. com/ TreppTalk/ bid/ 333936/
What-Qualifies-Risk-Retention-in-CMBS , (January 28):.

21
Sargent, P. C. and Jewesson, M. D. (2016). The Dawn of CMBS 4.0: Changes andChallenges in a New Regulatory Regime. Alstron & Bird: Finance, Availableat https://www.alston.com/-/media/files/insights/publications/
2016/10/the-dawn-of-cmbs-40-changes-and-challenges-in-a-ne/
files/thedawnofcmbs40/fileattachment/thedawnofcmbs40.pdf():1–19.
Sweet, C. A. (2018). A Guide to the Credit Risk Retention Rules for Securiti-zations. Morgan Lewis: Available at https: // www. morganlewis. com/ ~ /
media/ files/ handouts/ final_ risk_ retention_ guide_ handout. ashx ,pages 1–32.
Titman, S. and Tsyplakov, S. (2010). Originator Performance, CMBS Struc-tures, and the Risk of Commercial Mortgages. Review of Financial Studies,23(9):3558–3594.
Willen, P. (2014). Mandated Risk Retention in Mortgage Securitization: AnEconomist’s View. American Economic Review, 104(5):82–87.

22
Table 1—Descriptive Statistics
Full Sample Conduit Non-ConduitVariable Mean Std. Dev. Mean Std. Dev. Mean Std. Dev.Panel A Deal-Level CharacteristicsNumber of Deals 490 217 273Conduit (Treated Deal) 0.443 0.497 1.000 0.000 0.000 0.000Deal Coupon (%) 4.232 0.653 4.511 0.263 4.009 0.774Deal Spread (%) 2.110 0.735 2.333 0.384 1.933 0.885D(Rating Shopping) (%) 0.306 0.461 0.498 0.501 0.154 0.361Weighted Average Loan-to-Value (%) 65.024 6.188 61.402 4.725 67.904 5.685Weighted Average Maturity (Months) 113.957 35.538 112.807 4.600 114.872 47.453Share of Top 10 Loans 46.565 17.125 51.351 7.784 42.760 21.125Share of Multifamily Loans 59.438 43.237 11.809 7.458 97.297 8.268Share of Retail Property Loan 11.538 14.084 26.054 8.314 0.000 0.000Share of Office Property Loan 11.670 15.156 26.351 11.461 0.000 0.000Share of Industry Loans 2.295 4.059 5.182 4.720 0.000 0.000Share of Hotel Loans 6.820 8.503 15.399 5.565 0.000 0.000Share of Self-Storage Loans 1.772 3.195 4.002 3.762 0.000 0.000Share of Other Type Loan 6.467 8.738 11.203 6.806 2.703 8.268Panel B Loan-Level CharacteristicsNumber of Loans 27024 12479 14545Mortgage Rate(%) 4.281 0.708 4.629 0.456 3.983 0.749Mortgage Spread(%) 2.117 0.748 2.451 0.505 1.831 0.802Time-to-Sale(days) 132.562 130.638 73.786 56.260 182.988 153.254Delinquency(late payment, %) 6.731 25.056 11.587 32.009 2.564 15.808Delinquency(30 days +, %) 0.437 6.594 0.841 9.135 0.089 2.988Delinquency(60 days +, %) 0.200 4.466 0.353 5.928 0.069 2.621Delinquency(90 days +, %) 0.126 3.545 0.232 4.815 0.034 1.854Loan-to-Value(%) 65.744 5.269 62.239 4.303 68.750 4.015Loan Maturity(months) 125.951 49.552 115.791 16.070 134.667 64.622NOI/(Property value) 0.139 0.226 0.164 0.288 0.117 0.151D(Multifamily Loans) 0.585 0.493 0.147 0.354 0.961 0.193D(Retail Property Loan) 0.138 0.345 0.298 0.458 0.000 0.000D(Office Property Loan) 0.069 0.254 0.150 0.358 0.000 0.000D(Industry Loans) 0.023 0.150 0.050 0.217 0.000 0.000D(Hotel Loan) 0.064 0.245 0.139 0.346 0.000 0.000D(Self-Storage Loan) 0.037 0.188 0.079 0.271 0.000 0.000D(Other Type Loan) 0.084 0.277 0.136 0.343 0.039 0.193

23
Table 2—Risk-Retention Rule and Unobservable Loan Quality
(1) (2) (3)Time-to-sale Deal Rating
Spread ShoppingConduit (Treated) -205.585*** -0.483 0.827**
(-16.94) (-1.12) (2.63)Announcement -91.304*** -0.573*** -0.005
(-9.32) (-3.02) (-0.02)Conduit*Announcement 60.853*** 0.004 -0.126
(5.40) (0.02) (-0.86)Post-Reform -131.119*** -0.555*** 0.113
(-13.07) (-3.52) (0.32)Conduit*Post-Reform 95.743*** -0.415** -0.537***
(9.12) (-2.35) (-4.31)LTV or WLTV -3.331*** -0.046*** 0.002
(-9.15) (-5.86) (1.42)Maturity or WAM -0.015 -0.005** -0.001
(-0.43) (-2.44) (-1.04)NOI/(Property Value) 118.500***
(5.43)Share of Top 10 Loans -0.011*** -0.003***
(-5.10) (-3.99)Property Type Shares (vs other use type)Shares of Multifamily Loans -0.009 0.002
(-1.42) (0.95)Share of Retail Property Loan -0.004 -0.005
(-0.79) (-1.60)Share of Office Property Loan -0.002 0.000
(-0.44) (0.11)Share of Industry Loans -0.003 0.001
(-0.36) (0.11)Share of Hotel Loans 0.008 0.001
(1.09) (0.18)Share of Self-Storage Loans 0.007 0.002
(0.70) (0.34)Constant 449.850*** 7.050*** -0.119
(15.07) (6.21) (-0.35)Property type Fixed effects YesOriginator (or Underwriter) Fixed effects Yes Yes YesOrigination (or Securitization) Month Fixed Effects Yes Yes YesOrigination State Fixed Effects YesObservations 27,024 490 490R-squared 0.55 0.41 0.38
This table presents the regression estimates of the impact of the issuer response to the Risk-Retention-Rule. The dependent variable in column(1) is the loan-level time-to-sale (or shelf risk) for all loans originated from January 2014 to September 2017. Time-to-sale is defined as the timelag between mortgage origination and CMBS issuance (Titman and Tsyplakov, 2010). The column (2) dependent variable is the deal weightedaverage coupon minus the comparable maturity Treasury rate observed at the secrutization date, where linear interpolation is applied to theTreasury rates to obtain the full term structure. The dependent variable in column (3) takes a value of 1 for a CMBS deal for which a tranchein the deal is missing a rating from a credit rating agency but a tranche below it in the waterfall has a rating from the same credit ratingagency. Announcement is a dummy indicating the period of Dec 2014 - Dec 2016. Post-Reform is a dummy variable for CMBS originated afterthe reform, Dec 2016. Conduit is an indicator variable that equals to one for Conduit CMBS and zero for Agency CMBS. Controls include loan-to-value, mortgage maturity (in months) and NOI/(Property value), the ratio of net operating income divided by property value at origination,and property type, originator (or underwriter), origination (or securitization) date, and location fixed effects. Robust t-statistics are reportedin parenthesis and are based on standard errors clustered by originators and state. *, **, and *** indicate significance levels of 10%, 5%, and1%, respectively.

24
Table 3—Risk Retention Rule and Loan Level Risk
(1) (2)Mortgage Spread Default
Conduit (Treated) 0.087 0.003**(0.47) (2.04) )
Announcement -0.107 0.003**(-1.49) (2.38)
Conduit*Announcement -0.029 -0.002*(-0.61) (-1.78)
Post-Reform -0.010 0.002(-0.13) (1.22) )
Conduit*Post-Reform -0.336*** -0.004***(-5.48) (-3.10)
LTV -0.043*** 0.000(-11.20) (0.17)
Maturity -0.004*** 0.000(-13.02) (0.97)
NOI/(Property Value) 0.261** 0.000(2.57) (0.27)
Constant 5.588*** -0.006(16.32) (-1.34)
Property type Fixed effects Yes YesOriginator Fixed effects Yes YesOrigination Month Fixed Effects Yes YesOrigination State Fixed Effects Yes YesObservations 27,024 27,024R-squared 0.49 0.03
This table presents the regression estimates of the impact of the Risk-Retention-Rule on loan-level mortgage rate spread atorigination and the ex post default performance (90-day+ delinquency). The sample includes loans from all CMBS originatedfrom January 2014 to September 2017. The dependent variable in column (1) is the difference between the mortgage rate andthe comparable maturity Treasury rate observed at the loan origination date. Linear interpolation is applied to Treasury ratesto obtain the full term structure. The dependent variable in column (2) equals one if the mortgage is classified either asdelinquent (90-day+), foreclosed or ROE, and zero otherwise. Announcement is a dummy indicating the period of December2014 - November 2016. Post-Reform is a dummy variable for CMBS originated after the reform, December 2016. Conduit is anindicator variable that equals to one for conduit CMBS and zero for Agency CMBS. Controls include loan-to-value, mortgagematurity (in months) and NOI/(Property value), the ratio of net operating income divided by property value at origination, andproperty type, originator, origination time, and location fixed-effects. Robust t-statistics are reported in parenthesis and arebased on standard errors clustered by originators and state. *, **, and *** indicate significance levels of 10%, 5%, and 1%,respectively.

25
Table 4—Macro Impact: Bank Ex Post Credit Supply and Ex Ante Engagement in Conduit CMBS Business
(1) (2) (3) (4) (5) (6) (7) (8)Dependent Var = (Loans growth from t-1 to t)/assets[t-1] (%)
VARIABLES
No. of Conduit Deals*Post -0.821** -0.760**(-2.99) (-2.78)
No. of Conduit Deals 0.479** 0.492**(2.73) (2.90)
No. of Conduit Deals High*Post -0.676* -0.587*(-2.20) (-2.02)
No. of Conduit Deals High 0.471*** 0.368**(3.48) (3.22)
Value of Conduit Deals*Post -0.815** -0.732**(-2.81) (-2.70)
Value of Conduit Deals 0.472** 0.468**(2.32) (2.67)
Value of Conduit Deals High*Post -0.779** -0.758**(-2.71) (-2.93)
Value of Conduit Deals High 0.447*** 0.453***(4.86) (5.25)
Post 1.611** 0.480* 18.482** 0.584**(3.07) (2.22) (2.84) (2.78)
Deposit/Assets[t-1] -0.614 -0.614 -0.624 -0.523 -0.613 -0.610 -0.559 -0.558(-1.55) (-1.67) (-1.13) (-0.92) (-1.67) (-1.70) (-1.04) (-1.03)
Capital/Assets[t-1] 1.749 2.278 2.224 1.590 1.920 2.206 1.127 1.234(1.03) (1.35) (0.82) (0.63) (1.25) (1.37) (0.46) (0.55)
LogAssets[t-1] 0.297** 0.250** 0.221 0.186 0.304** 0.257** 0.222 0.192(2.90) (2.93) (1.69) (1.50) (3.14) (2.91) (1.77) (1.67)
Constant -8.821** -7.205** -6.079 -4.859 -18.817** -17.112** -6.043 -5.020(-2.97) (-3.07) (-1.65) (-1.48) (-3.05) (-3.21) (-1.73) (-1.66)
Quarter Fixed Effects No Yes No Yes No Yes No YesObservations 111 111 111 111 111 111 111 111R-squared 0.17 0.36 0.11 0.30 0.18 0.37 0.13 0.34
In order to identify the impact of the risk retention rule on a lender’s operation, we exploit bank-level heterogeneity in the Conduit CMBS business engagement just prior to the programand classify all banks into two groups: high or low based on their underwriting activities ex ante. We adopt a specification similar to Cornett et al. (2011) to analyze how the bank’squarterly credit supply varies with its exposure to the risk retention rule.

26
Table 5—Underwriter Market Shares by Loan Volume and Number of Deals Based on Underwriter Size and Capital Ratio
Dollar Amount Deal NumberPre-Reform Post=Reform t-statistic By Volume By Number t-statistic
Panel A: Underwriter SizeFull Sample Large Underwriters 0.529 0.644 2.32 0.577 0.685 2.67
Small Underwriters 0.471 0.356 -2.32 0.423 0.315 -2.67
Loans of Conduit CMBS Large Underwriters 0.579 0.603 0.36 0.593 0.591 -0.04Small Underwriters 0.421 0.397 -0.36 0.407 0.409 0.04
Loans of Agency CMBS Large Underwriters 0.492 0.664 3.30 0.567 0.714 3.33Small Underwriters 0.508 0.336 -3.30 0.433 0.286 -3.33
Panel B: Underwriter Capital RatioFull Sample High Capital Ratio 0.469 0.530 1.29 0.472 0.535 1.28
Low Capital Ratio 0.531 0.470 -1.29 0.528 0.465 -1.28
Loans of Conduit CMBS High Capital Ratio 0.390 0.571 2.21 0.409 0.578 2.00Low Capital Ratio 0.610 0.429 -2.21 0.591 0.422 -2.00
Loans of Agency CMBS High Capital Ratio 0.528 0.513 -0.33 0.509 0.519 0.26Low Capital Ratio 0.472 0.487 0.33 0.491 0.481 -0.26

27
Internet Appendix

28
Table A1—Top 10 States Ranked by Market Share Based on Original Balance
Full Sample Before the Reform (2014Q1-2016Q4) After the Reform (2017Q1-2018Q1)State Market Share State Market ShareCA 13.746 CA 16.809TX 11.501 NY 10.860NY 8.370 TX 10.716FL 7.073 FL 6.669VR 4.747 VR 6.417GA 4.168 GA 3.910CO 3.654 CO 3.173MD 3.522 AZ 2.956IL 3.073 MD 2.803VA 3.065 NJ 2.649
Loans of Conduit CMBSCA 14.552 CA 18.857NY 11.622 NY 15.931TX 9.291 VR 11.085VR 8.137 TX 7.526FL 6.339 FL 4.048IL 3.500 PA 3.235PA 3.143 NJ 3.118MI 3.135 OH 3.064NJ 2.846 MI 2.721GA 2.707 IL 2.525
Loans of Agency CMBSTX 14.165 CA 15.252CA 12.774 TX 13.141FL 7.958 FL 8.662GA 5.930 NY 7.003CO 5.835 GA 5.062MD 5.210 CO 4.697NY 4.449 AZ 4.138WA 4.103 MD 4.058VA 3.603 VA 3.273AZ 3.302 WA 3.160
1233

29
Table A2—Top 10 States Ranked by Market Share Based on Number of Loans
Full Sample Before the Reform (2014Q1-2016Q4) After the Reform (2017Q1-2018Q1)State Market Share State Market ShareCA 14.923 CA 13.447TX 12.290 NY 12.842NY 7.560 TX 10.742FL 7.093 FL 6.429GA 4.576 GA 4.122MI 3.235 IL 3.581OH 3.216 CO 3.183WA 3.023 NJ 3.167IL 3.018 AZ 2.976AZ 2.965 OH 2.849
Loans of Conduit CMBSCA 13.335 CA 16.190TX 11.476 NY 12.834NY 7.748 TX 9.297FL 7.271 VR 6.213MI 4.653 FL 5.986VR 4.370 OH 3.537GA 3.884 GA 3.447OH 3.815 MI 3.401IL 3.319 IL 3.311NC 3.047 PA 3.175
Loans of Agency CMBSCA 16.482 NY 12.846TX 13.090 CA 11.964NY 7.376 TX 11.522FL 6.918 FL 6.668GA 5.255 GA 4.486WA 4.443 CO 3.898CO 3.765 IL 3.726AZ 3.411 NJ 3.604NC 2.809 AZ 3.408IL 2.723 WA 2.991