Risk Parity: Theory and Practice - Macquarie Group · Risk Parity: Theory and Practice Edward Qian,...
32
Risk Parity: Theory and Practice Edward Qian, PhD, CFA PanAgora Asset Management Macquarie Global Quantitative Research Conference Hong Kong September 16 – 17, 2013
Transcript of Risk Parity: Theory and Practice - Macquarie Group · Risk Parity: Theory and Practice Edward Qian,...

Risk Parity: Theory and Practice Edward Qian, PhD, CFA PanAgora Asset Management Macquarie Global Quantitative Research Conference Hong Kong September 16 – 17, 2013
1
A short history of Risk Parity
»The present: Google searching “Risk Parity” yields 11 million hits
»The past
» 1990s: Risk budgeting » 2005: the term Risk Parity christened » 2008: GFC – general acceptance of Risk Parity
»The future is here
» Risk Parity applied to every investments » A portfolio construction tool to achieve true diversification
Introduction

2
Outline
»Risk Disparity: traditional portfolios and indices
»Risk Non-parity: trouble with incorrect interpretation
»Risk Parity: “smart” beta
Introduction

3
Eggs (or 95% of it) in one basket
Risk Disparity

4
Lack of diversification (asset allocation)
»Traditional “balanced” asset allocation
• Equity or equity-like assets contribute 95% of risk
Risk Disparity
60%
40% Weight
Equity Bonds 95%
5% Risk Contribution
EquityBonds

5
Risk contribution
»Assumptions: stock volatility 15%, bond volatility 5%, no correlation
»Total risk is
»Risk contributions are • Stock
• Bond
Risk Disparity
( ) ( ) %2.9%54.0%156.0 22 =×+×
( )( ) ( )
%95%54.0%156.0
%156.022
2
≈×+×
×
( )( ) ( )
%5%54.0%156.0
%54.022
2
≈×+×
×

6
Definition of risk contribution
» Marginal contribution :
» Risk contribution :
» Then
» It works both ways
» It also applies to other linear risk measures such as VaR
» Financial interpretation as loss contribution
Risk Disparity
Niwi
,,1, =∂∂σ
Niw
wi
i ,,1, =∂∂σ
%100or ,11
=∂∂
=∂∂ ∑∑
==
N
i
iiN
i ii
ww
ww σ
σ
σσ

7
Lack of diversification (equity)
»Capitalization weighted index : MSCI world Index
• Country bias in risk contribution
Risk Disparity
0%
10%
20%
30%
40%
50%
60%
US JP
G
B
FR
CA
C
H
DE
AU
ES
IT
N
L H
K
SE
FI
SG
DK
B
E N
O
GR
PT
IE
AT
N
Z
Weight
Risk Contribution
US has the highest risk contribution

8
Lack of diversification (bond)
»Capitalization weighted index: WGBI (World Government Bond)
• Country bias in risk contribution
Risk Disparity
0%
5%
10%
15%
20%
25%
30%
35%
40%
US JP
GB
DE IT
FR
ES
BE
NL
CA
GR
AT
PT
DK
IE
CH
SE
PL
FI
AU
SG
NO
Weight
Risk Contribution
Japan is the second
US has the highest risk contribution

9
Lack of diversification (commodity)
»Production weighted index: GSCI (Goldman Sachs Commodity)
• Sector bias in risk contribution
Risk Disparity
0%
10%
20%
30%
40%
50%
60%
WTI
Cru
de …
Bre
nt …
Nat
ural
Gas
Hea
ting
Oil
Gas
Oil
Cop
per
Alu
min
um
Nic
kel
Zinc
Lead
Gol
d
Silv
er
Live
Cat
tle
Feed
er C
attle
Lean
Hog
s
Whe
at …
Cor
n
Soyb
eans
Suga
r
Cot
ton
Whe
at …
Cof
fee
Coc
oa
Risk Contribution
Weight
Energy sector combined has 95% of risk

10
Lack of diversification (stock indices)
»Capitalization weighted index: S&P 500
• Stock bias risk in contribution
Risk Disparity
0.0%
0.5%
1.0%
1.5%
2.0%
2.5%
3.0%
3.5%
4.0%
1 21 41 61 81 101 121 141 161 181 201 221 241 261 281 301 321 341 361 381 401 421 441 461 481
Sorted Stocks
Top 50 stocks contribute close to 50% of risk
Bottom 250 stocks contribute only 14% of risk

11
Lack of diversification (sector)
» Another view in terms of sector risk allocation
Risk Disparity
0%
10%
20%
30%
40%
50%
60%
70%
80%
90%
100%
Dec
-94
Dec
-95
Dec
-96
Dec
-97
Dec
-98
Dec
-99
Dec
-00
Dec
-01
Dec
-02
Dec
-03
Dec
-04
Dec
-05
Dec
-06
Dec
-07
Dec
-08
Dec
-09
Chart Title Consumer Discretionary Consumer Staples Energy Financials Health Care Industrials Materials Technology Telecom Utilities
Tech Bubble
Credit Bubble
Ris
k C
ontr
ibut
ion
12
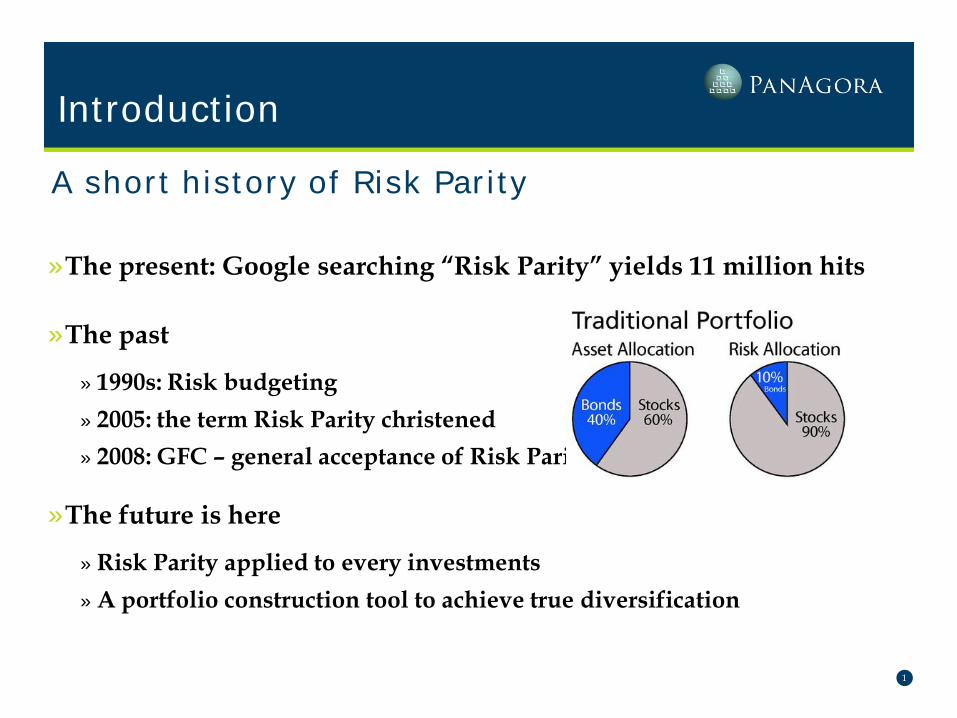
Why invest with such risk concentration?
»Asset allocation: required return from equity investments
»Capitalization–weighted indices: an investing paradigm
Risk Disparity
Beta – Cap-
Weighted Indices
Alpha- Factors
Total Return
“Passive”
“Active”

13
The painful consequences
»Unintended risk concentrations in asset/country/sector/stock
»Volatile returns, sensitivity to macro environment, low Sharpe
ratios
»The reason why hedge funds look attractive!
Risk Disparity
14
Not all Risk Parity are created equal.
Risk Non-parity
Injury risk, parity could prevent Chip Kelly's schemes from succeeding in NFL

15
Equal risk contribution
»Assumptions: stock volatility 15%, bond volatility 5%
»Then equal risk contribution portfolio is 25%/75% in stock/bond
»Risk contributions are • Stock
• Bond
Risk Non-parity
( )( ) ( )
%50%575.0%1525.0
%1525.022
2
=×+×
×
( )( ) ( )
%50%575.0%1525.0
%575.022
2
=×+×
×
60/40
25/75 Risk Parity
Risk Parity Line
Levered Risk Parity
1%
2%
3%
4%
5%
6%
7%
8%
0% 5% 10% 15% 20%
Retu
rn
Risk
Risk Parity Line and Traditional Frontier

16
Equal risk allocation is not necessarily Risk Parity
»Asset class 1/n leads to Risk Non-parity
»Asset category 1/n leads to Risk Non-parity
» 4 equity asset classes plus High Yield, EM Debt, Corporate Bonds, Government Bonds
»The fallacy of 1/n
Risk Non-parity
17
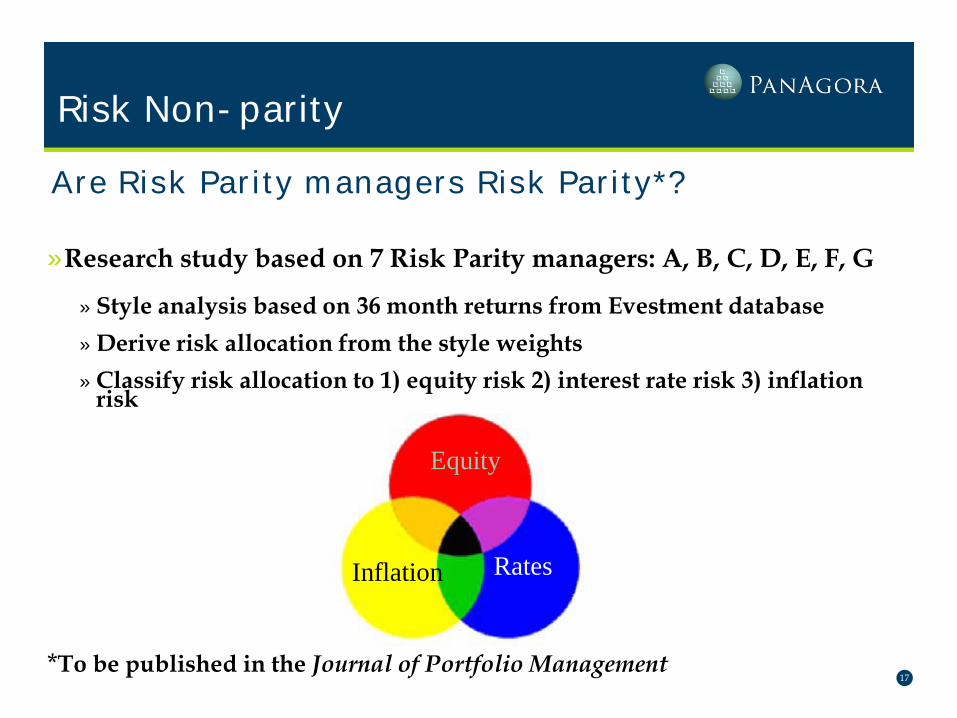
Are Risk Parity managers Risk Parity*?
»Research study based on 7 Risk Parity managers: A, B, C, D, E, F, G
» Style analysis based on 36 month returns from Evestment database » Derive risk allocation from the style weights » Classify risk allocation to 1) equity risk 2) interest rate risk 3) inflation
risk
*To be published in the Journal of Portfolio Management
Risk Non-parity
Equity
Rates Inflation

18
Why three risk premia?
»The short answer: only these three are “independent”
»The long answer
» Asset allocation portfolios are exposed to growth risk and inflation risk » To hedge growth risk, balance risk allocation to equity and interest rate
» To hedge inflation risk, balance risk allocation to nominal assets (equity & interest rate) and real assets (inflation linked bonds & commodities)
»Hybrid asset classes (HY, EMD, Credit, TIPS) are mostly
combinations of the three primary risk premia
Risk Non-parity

19
The three risk premia
Risk Non-parity
Equity
Rates Inflation
Credit/EMD/HY
ILB
MAT/ENE
20
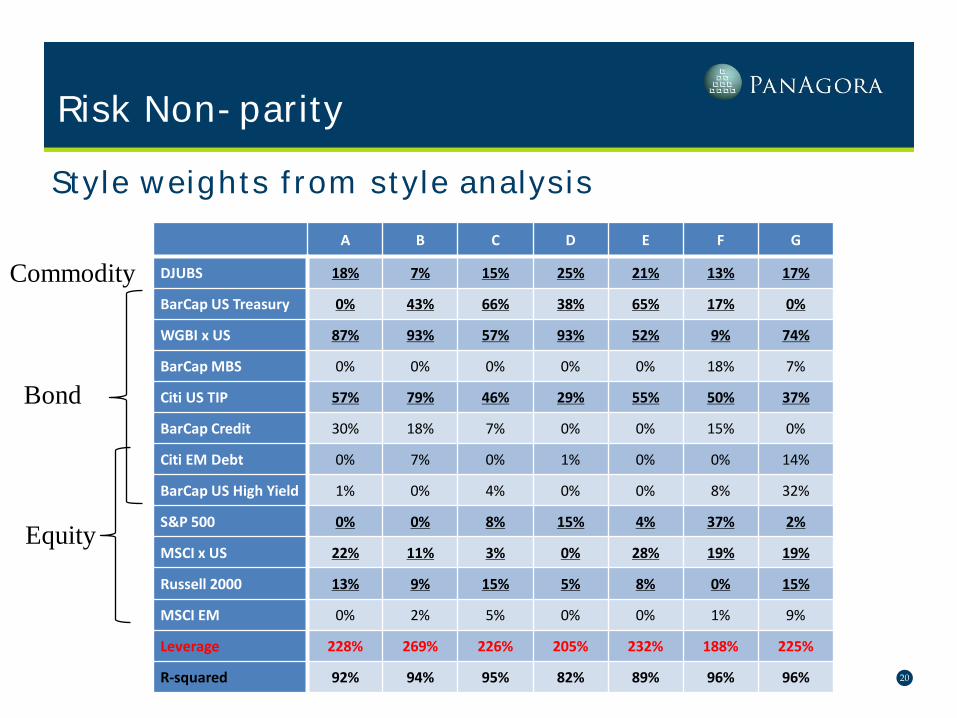
Style weights from style analysis
Risk Non-parity
A B C D E F G
DJUBS 18% 7% 15% 25% 21% 13% 17%
BarCap US Treasury 0% 43% 66% 38% 65% 17% 0%
WGBI x US 87% 93% 57% 93% 52% 9% 74%
BarCap MBS 0% 0% 0% 0% 0% 18% 7%
Citi US TIP 57% 79% 46% 29% 55% 50% 37%
BarCap Credit 30% 18% 7% 0% 0% 15% 0%
Citi EM Debt 0% 7% 0% 1% 0% 0% 14%
BarCap US High Yield 1% 0% 4% 0% 0% 8% 32%
S&P 500 0% 0% 8% 15% 4% 37% 2%
MSCI x US 22% 11% 3% 0% 28% 19% 19%
Russell 2000 13% 9% 15% 5% 8% 0% 15%
MSCI EM 0% 2% 5% 0% 0% 1% 9%
Leverage 228% 269% 226% 205% 232% 188% 225%
R-squared 92% 94% 95% 82% 89% 96% 96%
Bond
Equity
Commodity

21
All look Risk Parity?
Risk Non-parity
A B C D E F G
Commodities 18% 7% 15% 25% 21% 13% 17%
Bonds 174% 239% 180% 161% 172% 118% 163%
Equities 35% 22% 31% 20% 39% 58% 45%
Leverage 228% 269% 226% 205% 232% 188% 225%
R-squared 92% 94% 95% 82% 89% 96% 96%

22
Risk allocation from style analysis – surprise!
Risk Non-parity
0%
10%
20%
30%
40%
50%
60%
70%
80%
90%
A B C D E F G
Equity
Interest Rate
Inflation

23
Risk allocation to risk on risk off
Risk Non-parity
A B C D E F G
Risk on (E & C) 67% 33% 60% 64% 66% 86% 93%
Risk off (Rate) 33% 67% 40% 36% 34% 14% 7%

24
Why some managers are not risk parity?
»High notional allocation to bonds and portfolio leverage do not
equate to Risk Parity
»Equal risk allocation is not Risk Parity
»Oversized strategic bets to either equity or interest rate are not
Risk Parity
Risk Non-parity

25
It is very hard to know who is “smart” in investing.
Risk Parity as “Smart” Beta
26
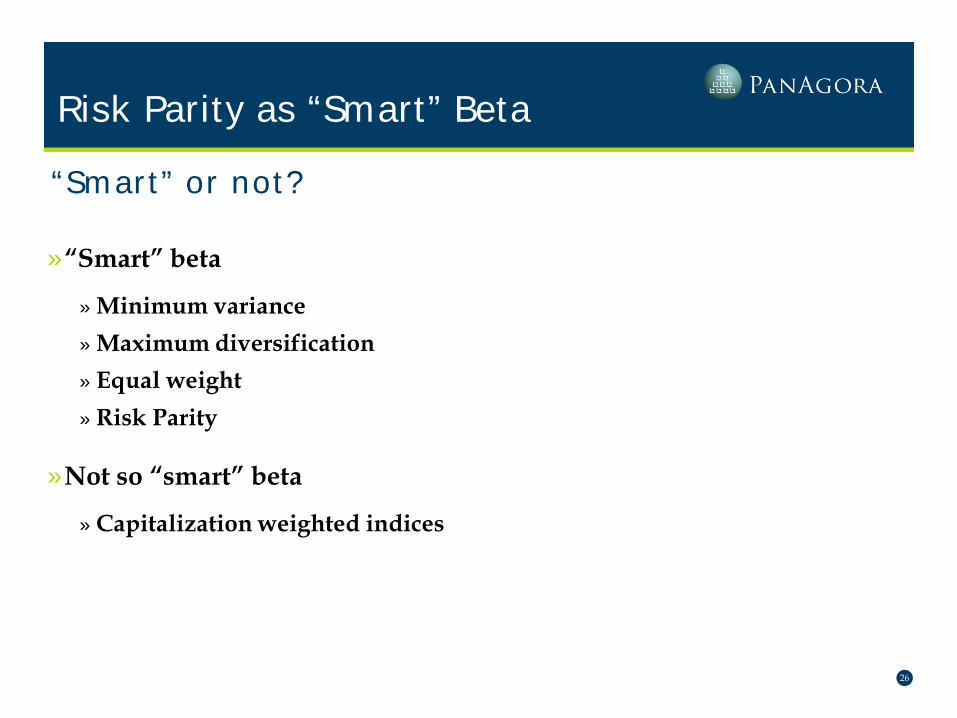
“Smart” or not?
»“Smart” beta
» Minimum variance » Maximum diversification » Equal weight » Risk Parity
»Not so “smart” beta
» Capitalization weighted indices
Risk Parity as “Smart” Beta

27
Why are cap-weighted indices not “smart”?
»Indices are from research of very smart people
»Implied returns of S&P 500 index seem to be “smart”
Risk Parity as “Smart” Beta
Weight
Exp. Return
Volatility
Sharpe Ratio CSD 10.7% 7.7% 26.5% 0.29
CSS 11.3% 4.7% 17.1% 0.27
ENG 12.4% 7.5% 28.0% 0.27
FIN 14.2% 9.5% 33.0% 0.29
HEA 11.8% 4.9% 18.2% 0.27
IND 10.5% 8.2% 27.6% 0.30
MAT 3.6% 8.9% 31.0% 0.29 TEC 18.6% 7.0% 24.4% 0.29
TEL 3.1% 5.1% 20.9% 0.24 UTL 3.7% 4.2% 18.3% 0.23
wΣλµ =
µλ Σ
−= 11w

28
All “smart” betas seem somewhat “naïve”
Risk Parity as “Smart” Beta
0%
2%
4%
6%
8%
10%
12%
1 2 3 4 5 6 7 8 9 10
Wei
ght
Security
Equally Weighted
0%
2%
4%
6%
8%
10%
12%
1 2 3 4 5 6 7 8 9 10
Expe
cted
Ret
urn
Security
Minimum Variance
0%
2%
4%
6%
8%
10%
12%
1 2 3 4 5 6 7 8 9 10
Shar
pe R
atio
Security
"Maximum Diversification"
0%
2%
4%
6%
8%
10%
12%
1 2 3 4 5 6 7 8 9 10
Risk
Allo
catio
n
Security
Risk Parity

29
The value of not knowing
Risk Parity as “Smart” Beta
0.5
1
2
4
8
Dec-9
4
Dec-9
5
Dec-9
6
Dec-9
7
Dec-9
8
Dec-9
9
Dec-0
0
Dec-0
1
Dec-0
2
Dec-0
3
Dec-0
4
Dec-0
5
Dec-0
6
Dec-0
7
Dec-0
8
Dec-0
9
Dec-1
0
Dec-1
1
Dec-1
2
RP CW
EW MV
MD
RP CW EW MV MDExcess Return 7.4% 3.7% 4.6% 3.6% 4.7%Risk 14.5% 15.8% 17.3% 10.6% 11.7%Sharpe Ratio 0.51 0.23 0.27 0.34 0.40
30
Risk Parity everywhere
» Multi Asset portfolio allocation
» Equity investments » Global/US/International/EM/Sector
» Fixed income investments » Government/Credit/Inflation-linked/High Yield
» Commodities
» Factor premia
Risk Parity as “Smart” Beta

31
Conclusion
Risk Parity
» Risk Parity provides a tool to build diversified portfolios with
fundamental intuition
» Diversification works but conventional investment approach
lacks diversification (Risk Disparity)
» Risk Parity is subject to wrong interpretation (Risk Non-parity)
» Risk Parity beta as “smart” beta from top-down to bottom-up