Risk – origin of the term k - Stanford EE Computer...
21
Origin of risk Risk – origin of the term… • The term risk can be traced to several possible origins: • Classical Greek, meaning root, stone or cut from firm land. • Latin: resicum, riscus. • Italian: risico, risco, rischio • Spanish: riesgo. • French: risque. • Today, we talk about risk in terms of any deviation from the optimum solution or process, usually described in terms of expected loss.
Transcript of Risk – origin of the term k - Stanford EE Computer...

1
Orig
in of risk Risk – origin of the term…
• The term risk can be traced to several possible origins: • Classical Greek, meaning root, stone or cut
from firm land. • Latin: resicum, riscus. • Italian: risico, risco, rischio • Spanish: riesgo. • French: risque.
• Today, we talk about risk in terms of any deviation from the optimum solution or process, usually described in terms of expected loss.

Risk – how it began…
Risk With the dissemina-on of quan-ta-ve methods in risk management and advent of complex deriva-ve products, mathema-cal models have come to play an increasingly important role in financial decision making, especially in the context of pricing and hedging of deriva-ve instruments. While the use of models has undeniably led to a be?er understanding of market risks, it has in turn given rise to a new type of risk, known as “model risk” or “model uncertainty,” linked to the uncertainty on the choice of the model itself. -‐ true risk (the actual risk problem) -‐ risk related workflows -‐ HPC accelera-on of these workflows -‐ instead of a single topic, bring a large assortment of topics ini-ally and will see which one
gathers interest
Pre-1494 it’s fate!
1494 - Pacioli coin tossing
puzzle
1654 – Fermi solves puzzle - probability
theory
1711 – Bernoulli law of large
numbers
1738 – deMoivre develops normal
distribution
1763 – Bayes develops idea of
prior beliefs
1800’s – theory of expected loss
developed
From God to measurement in 400 years…
2
Orig
in of risk
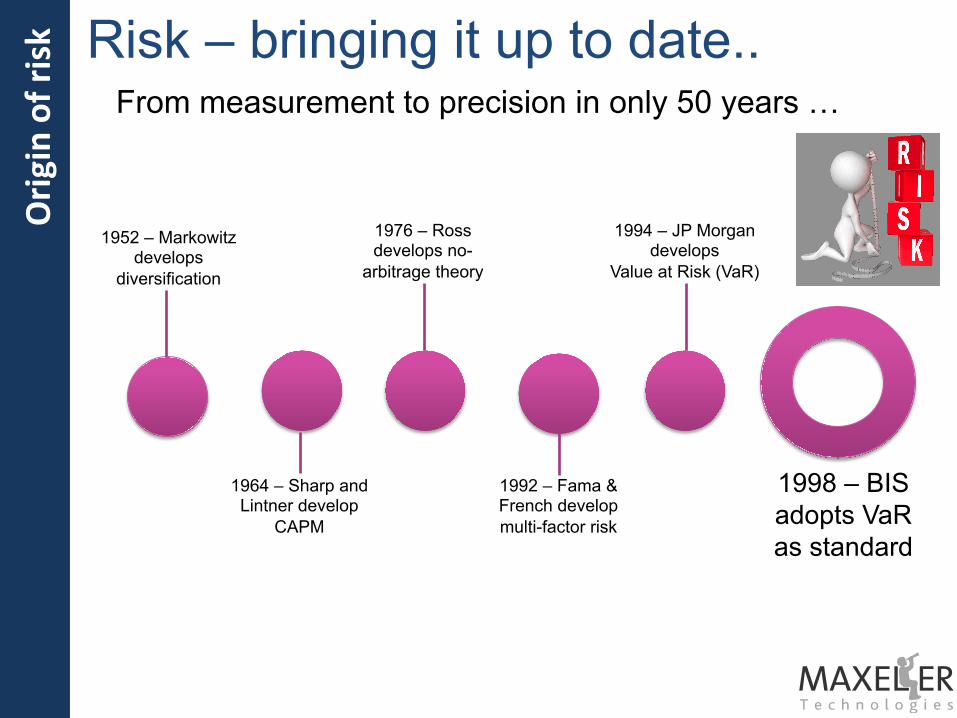
Risk – bringing it up to date..
1952 – Markowitz develops
diversification
1964 – Sharp and Lintner develop
CAPM
1976 – Ross develops no-
arbitrage theory
1992 – Fama & French develop multi-factor risk
1994 – JP Morgan develops
Value at Risk (VaR)
1998 – BIS adopts VaR as standard
From measurement to precision in only 50 years … but just how confident are we about measuring risk?
3
Orig
in of risk

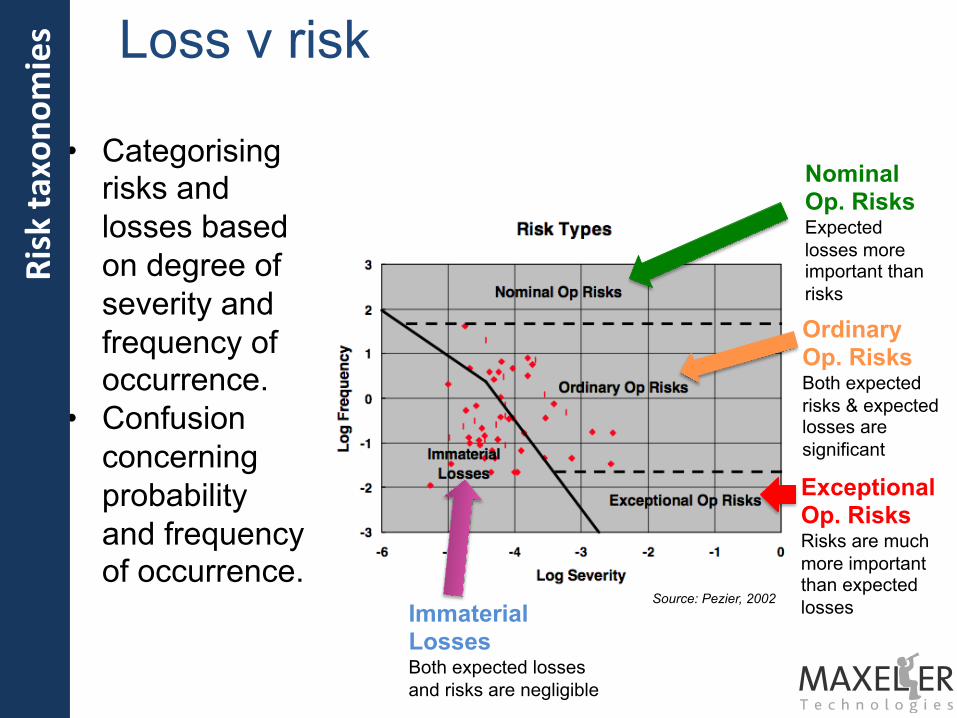
Loss versus risk
Immaterial Losses Both expected losses and risks are negligible
Exceptional Op. Risks Risks are much more important than expected losses
Ordinary Op. Risks Both expected risks & expected losses are significant
Nominal Op. Risks Expected losses more important than risks
• Categorising risks and losses based on degree of severity and frequency of occurrence.
• Confusion concerning probability and frequency of occurrence.
Source: Pezier, 2002
A loss v risk perspective….
4
Orig
in of risk

Risk and uncertainty Uncertainty
• The unknown-unknowns • No probabilities
Risk • The known-unknowns • Probabilities exist and are
assignable • Likelihood and frequency of
occurrence are understood BUT, are frequency, likelihood and chance the same as probability?
Models capture dynamic behaviour but contain uncertainties
5
Risk and
uncertainty

Maximum complexity
Deterministic models
Non-deterministic
models/scenario planning
Minimum complexity
Point estimates
Confidence ranges
Minimum uncertainty
Maximum uncertainty
Risk and uncertainty Risk managers need to understand how uncertainty and complexity can be managed. Model-based scenario analysis is used to identify least attractive outcomes. Creates huge computational requirement.
Dataflow computing is needed to deal with most challenging yet informative modelling situations
6
Risk and
uncertainty
3 2 1
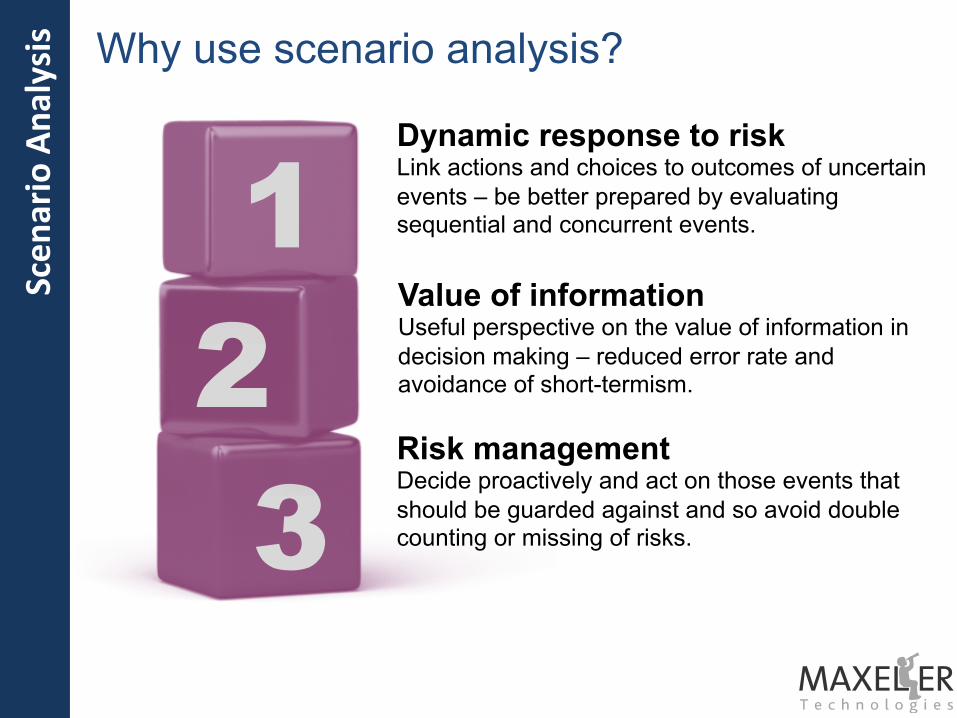
Dynamic response to risk Link actions and choices to outcomes of uncertain events – be better prepared by evaluating sequential and concurrent events.
Value of information Useful perspective on the value of information in decision making – reduced error rate and avoidance of short-termism.
Risk management Decide proactively and act on those events that should be guarded against and so avoid double counting or missing of risks.
Scen
ario Ana
lysis Why use scenario analysis?

4 3 2 1
Identify factors What are the most important factors that drive the change in value and contribute to the risk. What are the relationships between the factors?
Determine number of scenarios Convergence, computational cost and time constraints all contribute to determine the acceptable number of scenarios that can be run.
Compute cash flows/event “payoffs” Select model to compute cash flows that will generate the changes in value associated with the
Assign probabilities Estimate objective and/or subjective probabilities and/or frequencies of occurrence. Assign probabilities to each scenario.
Scen
ario Ana
lysis The scenario analysis process
9
Scen
ario Ana
lysis
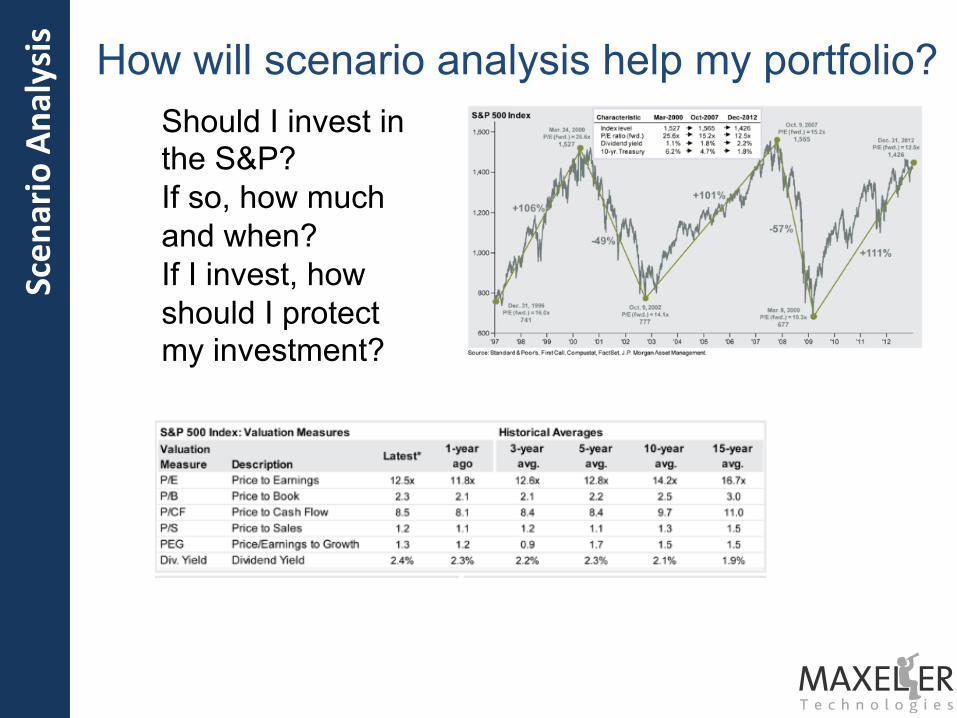
How will scenario analysis help my portfolio? Should I invest in the S&P? If so, how much and when? If I invest, how should I protect my investment?

The need for factor coverage
Macro economic
factors
Global events
10
Rules based algorithmic trading strategies for credit markets
Tsunamis and hurricanes
Scen
ario Ana
lysis

Other problems: Deepwater Horizon • No mechanism for control of riser or
BOP at surface è 5,000 ft of pipe in sea and 13,000 ft in the well.
• All 18,00 ft contained combustible fluids when disaster struck.
• Loss of power è loss of dynamic positioning of vessel è disaster.
• Disconnect from riser too slow and BOP failed.
• Blind sheer ram (part of BOP) failed to cut riser, failed to close top of the well, failed to seal pipe. Fire &
spill
Scen
ario Ana
lysis

12
Scen
ario Ana
lysis
A simple example of a start-up
Venture capitalists value start-ups based on exit value using projected earnings and a multiple in the future, then discount the exit value at a target rate. So, valuing an early-stage firm that is currently losing money, but expected to make profits of, say, $10m in 5 years time – at which point the earnings multiple (EM) will be ~40x. VC’s often use a very high target discount rate – say 35%, which would value the firm as follows: Value of firm in 5 years = Earnings in year 5 x EM = 10 x 40 = $400m Value of firm today = $400m / (1 + 0.35)5 = $89.2m
p
1 - p
Company goes public $400m
Company fails and is worth nothing
E(Value today) = p x 400 / (1 + r) + (1 – p) x 0
Loss v risk
Immaterial Losses Both expected losses and risks are negligible
Exceptional Op. Risks Risks are much more important than expected losses
Ordinary Op. Risks Both expected risks & expected losses are significant
Nominal Op. Risks Expected losses more important than risks
• Categorising risks and losses based on degree of severity and frequency of occurrence.
• Confusion concerning probability and frequency of occurrence.
Source: Pezier, 2002
13
Risk ta
xono
mies
14
Scen
ario Ana
lysis What are the commonalities?
• High dimensionality: • Many causative factors. • Factor interdependence.
• Factor ordering is critical: • Can’t simply run arbitrary combinations of
factors. • Permutative approach required to span event
space – e.g. order of defaults, process failures.
• Need to run large number of scenarios to achieve stable and robust results.
• Very short time available to run computations

Trading risk Credit derivatives risk at JP Morgan – 125x faster American Finance in T
(Runs ~125x end-to-end in production for intraday risk and valuation application)
• PV runs reduced to under 3 seconds/run when running batches of 100 runs.
• Risk runs reduced to under 4 minutes from 8 hours. • Previously impossible permutative and combinatoric
scenarios, run in seconds. • Run hundreds of thousands of scenarios in the trading day. • Enabled optimisation of hedging and capital usage.
Time in seconds per PV run
0.00
20.00
40.00
60.00
80.00
100.00
120.00
140.00
0 10 20 30 40 50 60
Number of PV jobs per runa
End
to e
nd ti
me
0.00%
10.00%
20.00%
30.00%
40.00%
50.00%
60.00%
70.00%
80.00%
90.00%
100.00%
FPG
A u
tilis
atio
n %
FPGA Compute
End2End
FPGAUtilisation
Number ofScenarios FPGA Compute End2End
FPGAUtilisation
1 2.57 125.21 25.99%5 2.35 98.02 38.54%10 2.06 66.68 56.24%20 1.86 30.88 62.63%50 1.80 28.27 91.97%
DFE compute
Scen
ario Ana
lysis

Exchange risk • Continuous trading using a
real-time auction mechanism. • Real-time price dissemination,
order matching and trading. • A fully integrated front-to-back
solution for matching, clearing, pre-trade credit checks and post-trade risk management.
• Solution now handles hundreds of thousands of orders per second - scalable to millions of orders per second.
High frequency
trading
Algorithmic trading
FIX Messaging
FIX Messaging
Pre-trade risk checks
Trade matched & price confirmed
Rejected Executed
Complex, proprietary matching algorithms
Scen
ario Ana
lysis

Low latency High-frequency trading and risk management at major hedge fund
MPT-10G Trading Platform • Multiple 10GE connected
hardware DFEs • Datacenter-ready with simple
deployment • Precision timing support (internal
and external)
MaxCompilerMPT • Integrated hardware and
software programming • Dataflow Technology for
simple development • Simulated DFEs for fast
delivery
Exchange Interfaces • Optimized industry-standard
connectivity • User configurable functionality
and formats
-$2,000
-$1,500
-$1,000
-$500
$0
$500
$1,000
$1,500
$2,000
$2,500
01-Ja
n-13
01-Ja
n-14
01-Ja
n-15
01-Ja
n-16
01-Ja
n-17
01-Ja
n-18
01-Ja
n-19
01-Ja
n-20
01-Ja
n-21
01-Ja
n-22
01-Ja
n-23
01-Ja
n-24
01-Ja
n-25
Profit, Loss & Trading Risk
Trading strategies developed,
evaluated and deployed rapidly
Scen
ario Ana
lysis

Commonality of risk • Reservoir simulation:
• Modelling the geology • Flow modelling
• Financial modelling • Macro-economic • Micro-economic - pricing
• Dataflow based simulation scales across problems:
Portfolio type 1,000 options
Analytic model Black Scholes
Num. Scenarios 10,000,000
Clock Time 11.43 secs
Speedup DFE v CPU 33x
Black-Scholes VaR Portfolio type 100,000 swaptions
Analytic model 3-factor LMM
Num. Scenarios 30,000 paths
Clock Time 15.01 secs
Speedup DFE v CPU 30x
Bermudan Swaptions
Above comparisons are between a Maxeler 1U-node MPC-X Dataflow Engine against a 1U-node Intel Sandybridge EP CPU compiled with AVX and OpenMP
Multiple factors,
multiple MC paths;
consistent speedup
Dataflow can be used to accelerate Mallinson’s work to increase the number of simulations within target timescale. Already developed Monte Carlo framework
Common
ality
of risk

19
Uncertainty to
risk via sc
enarios When order matters…
• Many risk managers run scenarios in an attempt to reduce uncertainty.
• Most scenario analysis is ad hoc: • Application of arbitrary shifts to perceived
“key” variables – simple combinatoric approach.
• Most scenario analysis is designed to find assumed “worst case” outcomes – minimax/maximin.
• But, by using permutation driven scenario analysis, it is possible to span the even space and identify interesting and/or critical cases that may have been missed.

20
Uncertainty to
risk via sc
enarios Maxeler’s risk solutions…
Asset Classes
Agriculture
EnergyEquities
FX
Interest Rates
MetalsOTC
Real Estate
WeatherCredit
Finance Library
Trading Risk
Dynamic Scenario Generation
Models
Monte Carlo
Multinomial Tree
General PDE
DatesAndCashflows
Cashflow generation
Riskless Discounting
Risky Discounting
VaR
CVaR
Expected Loss
Regulatory Risk
Clearing Risk
Basel III Risk
MiFiD II
Permutations
Combinatorics
Business Logic
Interfaces
C/C++
Java
Matlab
Excel
Consistent, real-time, valuation and risk management calculations across all major asset classes
Maxeler’s dataflow accelerated finance library provides ultra high speed
computation of value and risk
Client provides trade, market and static data in own format
Finance appliance covers 10 asset classes
Risk summarizations in hardware avoid use of
complex databases

Maxeler University Program Members