
Risk Models for Alternative Investments - CFA Institute · Risk Models for Alternative Investments...
20
Y our Global Investment Authority Cercle Finance de Québec, November 20 th , 2014 Risk Models for Alternative Investments Sébastien Page, CFA Executive Vice President PIMCO For professional use only
Transcript of Risk Models for Alternative Investments - CFA Institute · Risk Models for Alternative Investments...
Your Global Investment Authority
Cercle Finance de Québec, November 20th, 2014
Risk Models for Alternative Investments
Sébastien Page, CFA
Executive Vice President
PIMCO
For professional use only
pg 1Your Global Investment AuthorityYour Global Investment Authority
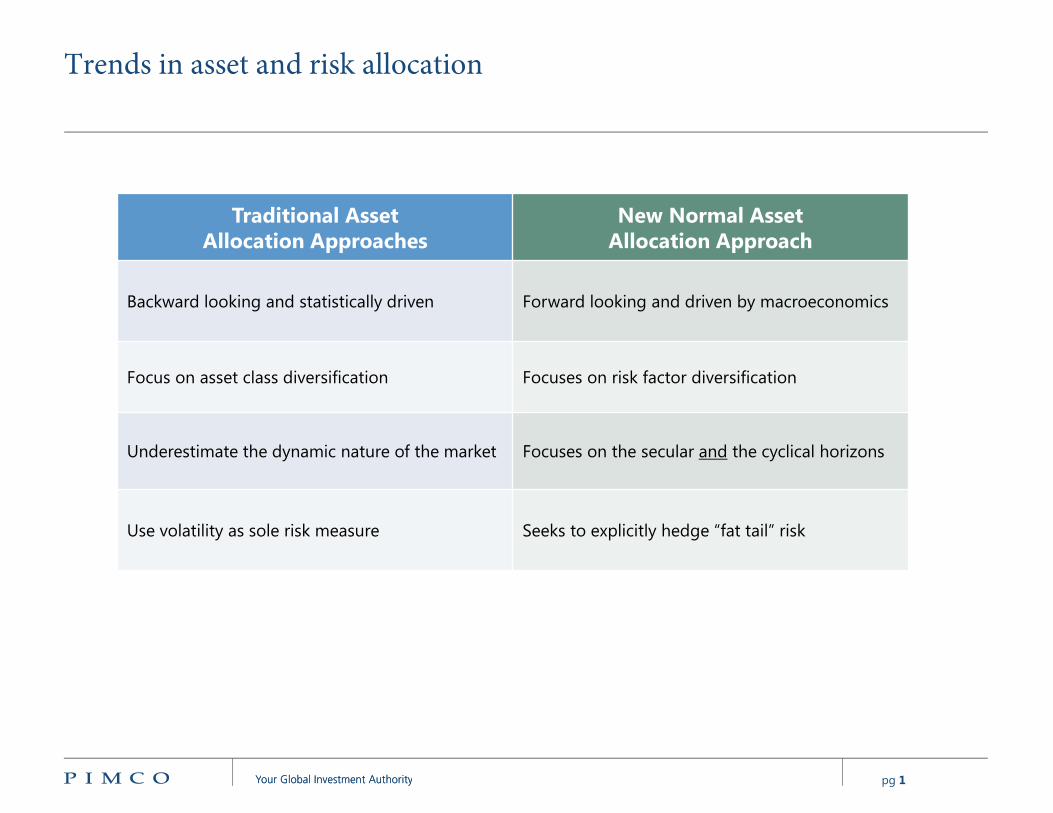
Trends in asset and risk allocation
Traditional Asset Allocation Approaches
New Normal Asset Allocation Approach
Backward looking and statistically driven Forward looking and driven by macroeconomics
Focus on asset class diversification Focuses on risk factor diversification
Underestimate the dynamic nature of the market Focuses on the secular and the cyclical horizons
Use volatility as sole risk measure Seeks to explicitly hedge “fat tail” risk
pg 2Your Global Investment AuthorityYour Global Investment Authority
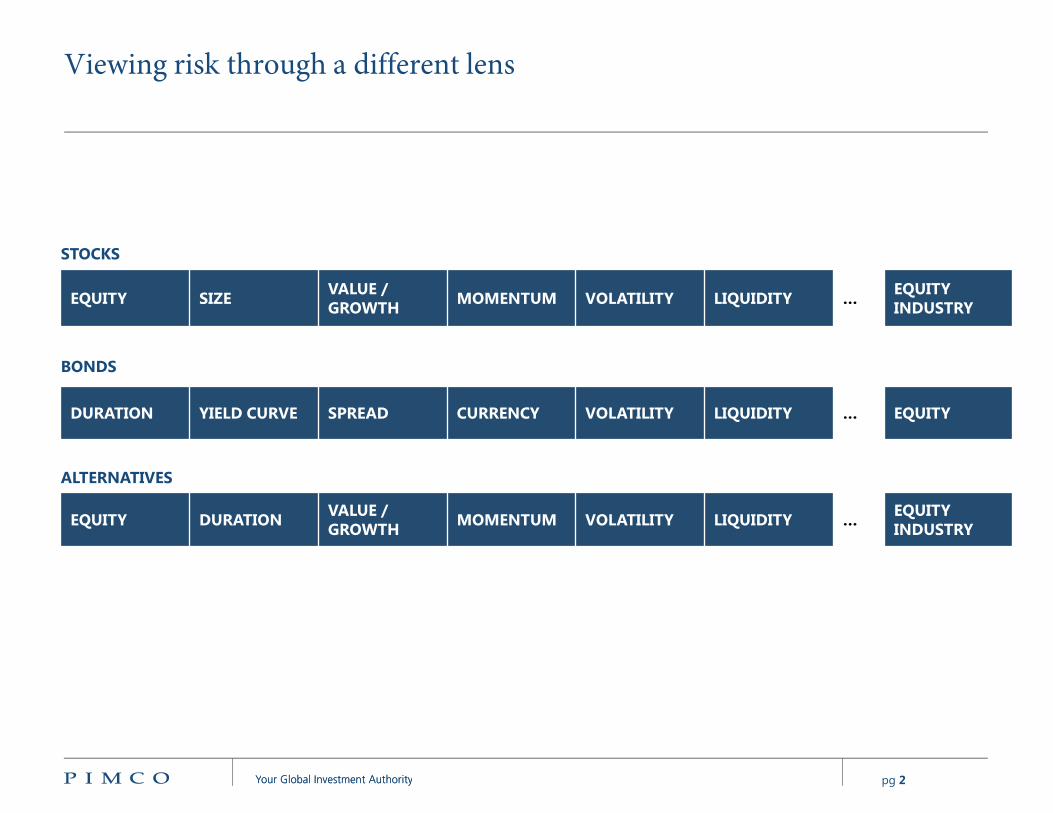
Viewing risk through a different lens
2cs_FE_Risk_Factor_Short
STOCKS
EQUITY SIZEVALUE / GROWTH
MOMENTUM VOLATILITY LIQUIDITY …EQUITY INDUSTRY
BONDS
DURATION YIELD CURVE SPREAD CURRENCY VOLATILITY LIQUIDITY … EQUITY
ALTERNATIVES
EQUITY DURATIONVALUE / GROWTH
MOMENTUM VOLATILITY LIQUIDITY …EQUITY INDUSTRY

pg 3Your Global Investment AuthorityYour Global Investment Authority
Asset class diversification does not equal risk diversification
Domestic
Equity
13%
Global Equity
10%
EM Equity
7%
Domestic
Bonds
(IG/HY)
7%Global/EM
Bonds
1%Real Estate
8%
Hedge Funds
20%
Private Equity
15%
Venture
Capital
5%
Energy and
Natural
Resources
8%
Distressed
Debt
2%
Cash
4%
As of 30 June 2014SOURCE: NCSE, PIMCOHypothetical example for illustrative purposes only.
1 Average Endowment Portfolio information from the 2013 NACUBO-Commonfund Study of Endowments (NCSE). This study is based on information collected as of 30 June 2013. The asset allocation percentages shown are based on the Average Endowment Portfolio as of 30 June 2013 for endowments >$1 billion.
2 See Appendix for additional information regarding volatility estimates. Refer to Appendix for additional endowment style portfolio index sources, hypothetical example and portfolio analysis information.
ASSET ALLOCATION1
(BY MARKET VALUE WEIGHT)RISK ALLOCATION(BY CONTRIBUTION TO ESTIMATED VOLATILITY)2
Equity
78%
Commodities
6%
Corp Spread
5%
EM Currency
3%
Developed
Currency
2%
HY Spread
2%
Other
4%

pg 4Your Global Investment AuthorityYour Global Investment Authority
The intuition
Equity
Fixed Income
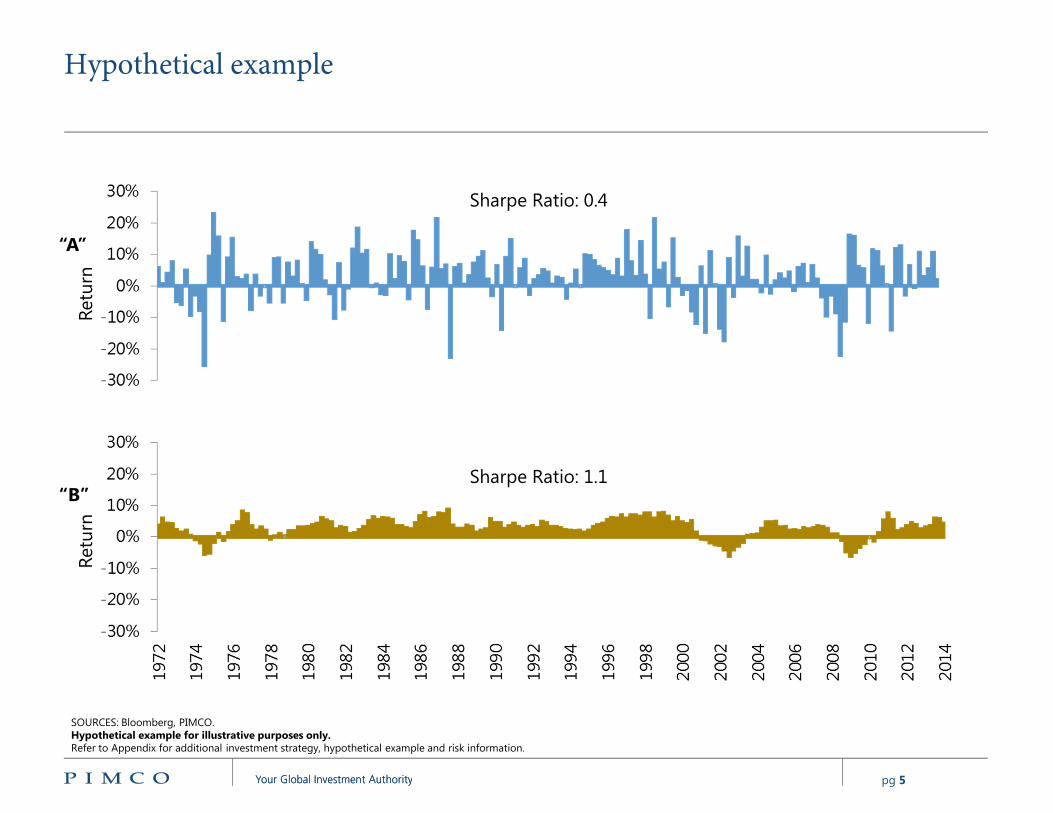
pg 5Your Global Investment AuthorityYour Global Investment Authority
Sharpe Ratio: 0.4
Sharpe Ratio: 1.1
SOURCES: Bloomberg, PIMCO. Hypothetical example for illustrative purposes only. Refer to Appendix for additional investment strategy, hypothetical example and risk information.
“A”
“B”
Hypothetical exampleR
etu
rnR
etu
rn

pg 6Your Global Investment AuthorityYour Global Investment Authority
S&P 500
SOURCES: Bloomberg, PIMCO . As of 3/31/2014. Quarterly data starting in 3/31/1970. Sharpe ratios are net of historical cash returns (Libor). Asset “B” is an 8-quarter moving average, with equal weights. Compounding issues are ignored. Refer to Appendix for additional investment strategy, hypothetical example and risk information.
“A”
“B”
Hypothetical exampleR
etu
rnR
etu
rn
pg 7Your Global Investment AuthorityYour Global Investment Authority
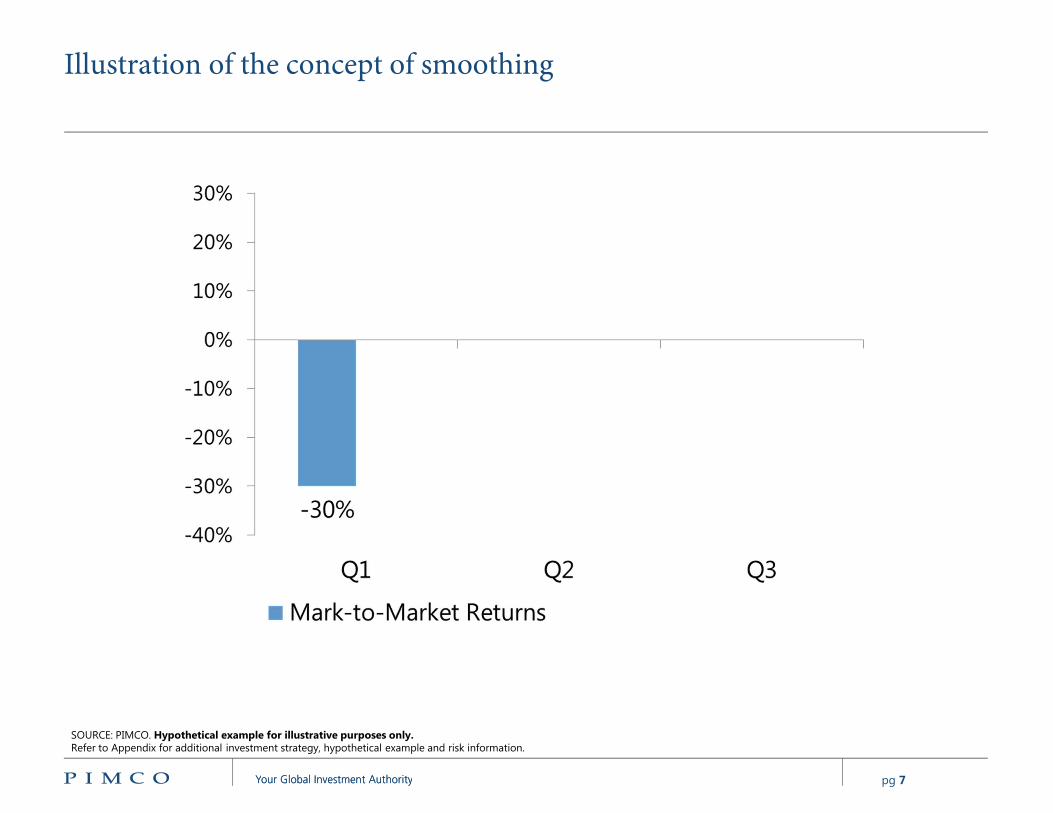
Illustration of the concept of smoothing
SOURCE: PIMCO. Hypothetical example for illustrative purposes only.Refer to Appendix for additional investment strategy, hypothetical example and risk information.

pg 8Your Global Investment AuthorityYour Global Investment Authority
SOURCE: PIMCO. Hypothetical example for illustrative purposes only.Refer to Appendix for additional investment strategy, hypothetical example and risk information.
Illustration of the concept of smoothing

pg 9Your Global Investment AuthorityYour Global Investment Authority
Our model
Reported (or “observed”) returns are smoothed
Mark-to-market returns can be mapped to risk factors
If we smooth risk factors the same way as the index…
…we can recover the “true” betas.

pg 10Your Global Investment AuthorityYour Global Investment Authority
Simplified example: private real estate, last 10 years
SOURCES: NCREIF, PIMCO. As of March 31, 2014. Refer to Appendix for additional investment strategy, hypothetical example and risk information.
Retu
rn

pg 11Your Global Investment AuthorityYour Global Investment Authority
With smoothed S&P 500 (8 quarters)
Hypothetical example for illustrative purposes only.SOURCES: NCREIF, PIMCO. As of March 31, 2014. The S&P 500. Total return index, has been smoothed with eight equally-weighted lags. Refer to Appendix for additional investment strategy, hypothetical example and risk information.
Retu
rn

pg 12Your Global Investment AuthorityYour Global Investment Authority
Risk factor models for alternative assets
SOURCES: NCREIF, PIMCO, Cambridge Associates, Bloomberg. From December 1991 to December 2012. Analysis based on quarterly data, except for Timberland and Farmland which are annualized due to unreliable quarterly data. Numbers in bold are coefficients from regressions estimated on adjusted risk factor returns on based the lag structure in the index data, while numbers in bold are the Newey-West T-Statistics.
pg 13Your Global Investment AuthorityYour Global Investment Authority
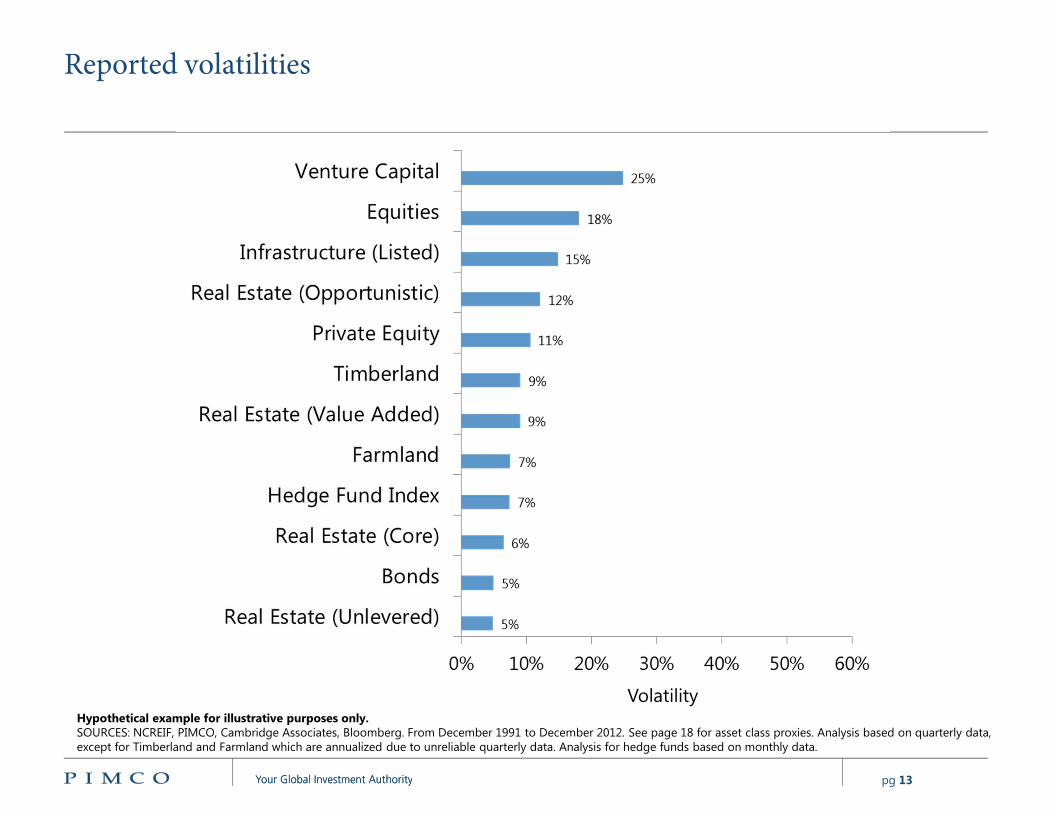
Reported volatilities
Hypothetical example for illustrative purposes only.SOURCES: NCREIF, PIMCO, Cambridge Associates, Bloomberg. From December 1991 to December 2012. See page 18 for asset class proxies. Analysis based on quarterly data, except for Timberland and Farmland which are annualized due to unreliable quarterly data. Analysis for hedge funds based on monthly data.
Volatility

pg 14Your Global Investment AuthorityYour Global Investment Authority
Reported vs. adjusted volatilities
Hypothetical example for illustrative purposes only.SOURCES: NCREIF, PIMCO, Cambridge Associates, Bloomberg. From December 1991 to December 2012. See page 18 for asset class proxies. Analysis based on quarterly data, except for Timberland and Farmland which are annualized due to unreliable quarterly data. Analysis for hedge funds based on monthly data.
Volatility

pg 15Your Global Investment AuthorityYour Global Investment Authority
Portfolio diversification based on reported returns
Hypothetical example for illustrative purposes only.SOURCES: NCREIF, PIMCO, Cambridge Associates, Bloomberg. From December 1991 to December 2012. See page 18 for asset class proxies. Blended portfolios are equal weighted among the asset classes listed. Analysis based on quarterly data, except for Timberland and Farmland which are annualized due to unreliable quarterly data.
pg 16Your Global Investment AuthorityYour Global Investment Authority
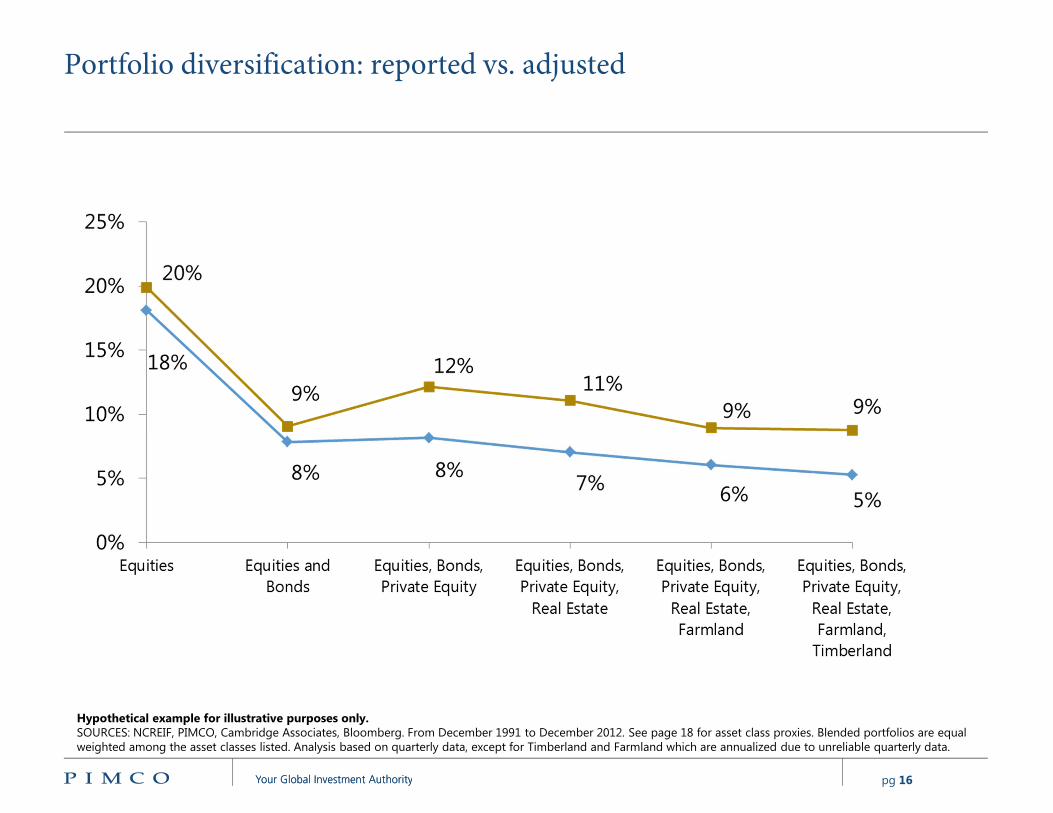
Portfolio diversification: reported vs. adjusted
Hypothetical example for illustrative purposes only.SOURCES: NCREIF, PIMCO, Cambridge Associates, Bloomberg. From December 1991 to December 2012. See page 18 for asset class proxies. Blended portfolios are equal weighted among the asset classes listed. Analysis based on quarterly data, except for Timberland and Farmland which are annualized due to unreliable quarterly data.

pg 17Your Global Investment AuthorityYour Global Investment Authority
Summary
Trends in asset and risk allocation:
� Formulating forward-looking macro views
� Focusing on risk factors
� Adopting a dynamic approach
� Mitigating tail risks
Risk models for alternative investments:
� Focusing on mark-to-market volatility
� Re-assessing diversification benefits

pg 18Your Global Investment AuthorityYour Global Investment Authority
Past performance is not a guarantee or a reliable indicator of future results.
CORRELATIONThe correlation of various indices or securities against one another or against inflation is based upon data over a certain time period. These correlations may vary substantially in the future or over different time periods that can result in greater volatility.
ENDOWMENT STYLE PORTFOLIODomestic Equities: S&P 500; Global Equities: MSCI EAFE Net Dividend Index in USD; EM Equities: MSCI Emerging Markets Index; Domestic (IG/HY) Bonds (IG bonds, HY bonds): 6.75% Investment Grade Bonds - Barclays Capital US Aggregate Index, 0.9% High Yield Bonds - Barclays Capital US High Yield Index; Global Bonds: Barclays Capital Global Aggregate Index; EM Bonds: JP Morgan EMBI Global Index; Real Estate: NCREIF Property Index; Hedge Funds: HFRI Fund Weighted Composite Index; Private Equity: Cambridge Associates LLC U.S. Private Equity Index®; Venture Capital: Cambridge Associates LLC U.S. Venture Capital Index®; Energy and Natural Resources (Energy, Timber, Commodities, Managed Futures): 3.6% Energy - Dow Jones UBS Commodity Energy Index, 1.8% Timber - NCREIF Timberland Index, 1.8% Commodities - Dow Jones UBS Commodity Index, 1.8% Managed Futures: DJCS Managed Futures Index; Distressed Debt: HFRI ED: Distressed/Restructuring Index; Cash: Citigroup 3 Month US T-Bill Index.
HYPOTHETICAL EXAMPLENo representation is being made that any account, product, or strategy will or is likely to achieve profits, losses, or results similar to those shown. Hypothetical or simulated performance results have several inherent limitations. Unlike an actual performance record, simulated results do not represent actual performance and are generally prepared with the benefit of hindsight. There are frequently sharp differences between simulated performance results and the actual results subsequently achieved by any particular account, product, or strategy. In addition, since trades have not actually been executed, simulated results cannot account for the impact of certain market risks such as lack of liquidity. There are numerous other factors related to the markets in general or the implementation of any specific investment strategy, which cannot be fully accounted for in the preparation of simulated results and all of which can adversely affect actual results.
INVESTMENT STRATEGYThere is no guarantee that these investment strategies will work under all market conditions and each investor should evaluate their ability to invest for a long-term especially during periods of downturn in the market.
PORTFOLIO ANALYSISThe portfolio analysis is based on the 2013 NACUBO-Commonfund Study of Endowments and no representation is being made that the structure of the average portfolio or any account will remain the same or that similar returns will be achieved. Results shown may not be attained and should not be construed as the only possibilities that exist. Different weightings in the asset allocation illustration will produce different results. Actual results will vary and are subject to change with market conditions. There is no guarantee that results will be achieved. No fees or expenses were included in the estimated results and distribution. The scenarios assume a set of assumptions that may, individually or collectively, not develop over time. The analysis reflected in this information is based upon data at time of analysis. Forecasts, estimates, and certain information contained herein are based upon proprietary research and should not be considered as investment advice or a recommendation of any particular security, strategy or investment product.
PIMCO routinely reviews, modifies, and adds risk factors to its proprietary models. Due to the dynamic nature of factors affecting markets, there is no guarantee that simulations will capture all relevant risk factors or that the implementation of any resulting solutions will protect against loss. All investments contain risk and may lose value. Simulated risk analysis contains inherent limitations and is generally prepared with the benefit of hindsight. Realized losses may be larger than predicted by a given model due to additional factors that cannot be accurately forecasted or incorporated into a model based on historical or assumed data.
asset_allocation_app_01
Appendix

pg 19Your Global Investment AuthorityYour Global Investment Authority
RISKAbsolute return portfolios may not fully participate in strong positive market rallies. Investing in the bond market is subject to risks, including market, interest rate, issuer, credit, inflation risk, and liquidity risk. The value of most bonds and bond strategies are impacted by changes in interest rates. Bonds and bond strategies with longer durations tend to be more sensitive and volatile than those with shorter durations; bond prices generally fall as interest rates rise, and the current low interest rate environment increases this risk. Current reductions in bond counterparty capacity may contribute to decreased market liquidity and increased price volatility. Bond investments may be worth more or less than the original cost when redeemed. Investing in foreign denominated and/or domiciled securities may involve heightened risk due to currency fluctuations, and economic and political risks, which may be enhanced in emerging markets. Equities may decline in value due to both real and perceived general market, economic, and industry conditions. Tail risk hedging may involve entering into financial derivatives that are expected to increase in value during the occurrence of tail events. Investing in a tail event instrument could lose all or a portion of its value even in a period of severe market stress. A tail event is unpredictable; therefore, investments in instruments tied to the occurrence of a tail event are speculative. Derivatives may involve certain costs and risks such as liquidity, interest rate, market, credit, management and the risk that a position could not be closed when most advantageous. Investing in derivatives could lose more than the amount invested. Derivatives may involve certain costs and risks such as liquidity, interest rate, market, credit, management and the risk that a position could not be closed when most advantageous. Investing in derivatives could lose more than the amount invested. Investor should consult their investment professional prior to making an investment decision.
VOLATILITY (ESTIMATED)We employed a block bootstrap methodology to calculate volatilities. We start by computing historical factor returns that underlie each asset class proxy from January 1997 through the present date. We then draw a set of 12 monthly returns within the dataset to come up with an annual return number. This process is repeated 25,000 times to have a return series with 25,000 annualized returns. The standard deviation of these annual returns is used to model the volatility for each factor. We then use the same return series for each factor to compute covariance between factors. Finally, volatility of each asset class proxy is calculated as the sum of variances and covariance of factors that underlie that particular proxy. For each asset class, index, or strategy proxy, we will look at either a point in time estimate or historical average of factor exposures in order to determine the total volatility. Please contact your PIMCO representative for more details on how specific proxy factor exposures are estimated.
It is not possible to invest directly in an unmanaged index.
This material contains the current opinions of the manager and such opinions are subject to change without notice. This material has been distributed for informational purposes only. Forecasts, estimates, and certain information contained herein are based upon proprietary research and should not be considered as investment advice or a recommendation of any particular security, strategy or investment product. Information contained herein has been obtained from sources believed to be reliable, but not guaranteed. No part of this material may be reproduced in any form, or referred to in any other publication, without express written permission. PIMCO and YOUR GLOBAL INVESTMENT AUTHORITY are trademarks or registered trademarks of Allianz Asset Management of America L.P. and Pacific Investment Management Company LLC, respectively, in the United States and throughout the world. Pacific Investment Management Company LLC, 650 Newport Center Drive, Newport Beach, CA 92660, 800-387-4626.
The products and services provided by PIMCO Canada Corp. may only be available in certain provinces or territories of Canada and only through dealers authorized for that purpose.
PIMCO Canada has retained PIMCO LLC as sub-adviser. PIMCO Canada will remain responsible for any loss that arises out of the failure of its sub-adviser.
asset_allocation_app_01
Appendix