Risk Modeling: The Brazilian Experience - World...
23
Risk Modeling: The Brazilian Experience W A S H I N G T O N D C O C T O B E R 2 0 1 0 Andre Proite Brazilian National Treasury Investor Relations Office- Manager
Transcript of Risk Modeling: The Brazilian Experience - World...

Risk Modeling: The Brazilian Experience
W A S H I N G T O N D C
O C T O B E R 2 0 1 0
Andre Proite
Brazilian National Treasury
Investor Relations Office- Manager

Connecting the Model to Reality
Model Description
2
Cost-Risk Analysis – Long term view
Next Steps
Motivation

Minimize long-term borrowing costs, with maintenance of prudent risk levels; at the same
time, seek to contribute to smooth operation of the public bond market.
What have we pursuit?
3
Besides a well established legal and institutional framework, transparency and
accountability are also requirements for good governance practices
Transparency generates predictability, that reduces market uncertainties about the
Debt Managers objectives and actions, contributing for volatility and risk premium
reduction
The role of transparency

Federal Debt (FPD) Composition
4

Guidelines (World Bank and IMF)
Motivation
5
Brazil walked on thin ice for a long time
poor debt structure
Very risky and volatile
Then public debt was improved: where do we want to go?
Benchmark Optimal composition
Instrument for risk management and for strategic planning
How to measure debt management performance?
According to the their Guidelines, the benchmark could work as a powerful management
instrument as it represents the debt structure that the government would like to have, based on
its expected risk and cost preferences. Thus, the benchmark could guide the debt administrator
in his decisions regarding issuance and risk management

Model Description
Connecting the Model to Reality
Cost-Risk Analysis – Long term view
Next Steps
Motivation
• 1st and 2nd phases
6

The process of debt planning in Brazil is in a sophisticated stage….
… but, it is a result of a long process of institutional advances and of a simultaneous development of the technical framework 7

The Annual Borrowing Plan 2002
ALM as a tool to map and manage risks of the public debt portfolio
ALM: a dynamic analysis of assets and liabilities that takes into consideration the
public debt management strategy and the macroeconomic policies enforced by the
government
the basic premise for outstanding debt insulation is the balancing between the
characteristics of assets and liabilities
Refinancing and market risks are key elements
market risk categories: inflation, exchange rate, floating rate, and fixed rate
refinancing risk
Short-term analysis
1ST
phase – Central Gov’t ALM
8

Integrating assets in the analysis helped identifying opportunities…
-40%
-30%
-20%
-10%
0%
10%
20%
Inflation Linked
FX Linked Floating Rate Fixed Rate Others
% G
DP
dez/02 dez/09
0
50
100
150
200
250
300
350
400
uo to 1 year from 1 to 2 years
from 2 to 3 years
from 3 to 4 years
from 4 to 5 years
above 5 years
Bil
lio
n R
$
Central Government Cashflow
Assets Liabilities
Asset - Liability Mismatch
1ST
phase – Central Gov’t ALM
9

Impact of 1% FX devaluation on Net PS Debt/GDP*
2nd
phase – Sensitivity Analysis and…
-0.09%
-0.20%
-0.10%
0.00%
0.10%
0.20%
0.30%
0.40%
Aug/
02
Feb/0
3
Aug/
03
Feb/0
4
Aug/
04
Feb/0
5
Aug/
05
Feb/0
6
Aug/
06
Feb/0
7
Aug/
07
Feb/0
8
Aug/
08
Feb/0
9
Aug/
09
Feb/1
0
Aug/
10
Source: National Treasury
Note: Stress scenario considered of 3 standard deviations over the medium interest and exchange rate observed at 2002, equivalent of an overshooting of 56.6% on
exchange rate and an increase of 7.8 on the Selic rate.
*Net Public Sector Debt
10

Schematic Summary of the CaR Definition
Relative Cost-at-Risk of DPF*
* Considers the 2007 share for Floating and Exchange Rates plus 10 percentage points.
The 2008 projected composition is estimated as the midpoint value of the target ranges
of the PAF 2008.
Source: National Treasury 11
2nd
phase – … stochastic analysis

INPUTS
•Outstanding Debt
(bonds and contracts)
•Macroeconomic
Scenario: GDP,
inflation,fiscal balance
•Financing Strategy
•Financial Variables:
interest rate, FX-rate
•Dynamic Analysis
Debt
payments flow
forecast
Projected
results:
•Outstanding
•Maturity
•Profile
•Cost
•Risk
Treasury´s
GERIR system
Simulating strategies

Connecting the Model to Reality
Model Description
Cost-Risk Analysis – Long term view
Next Steps
Motivation
13

Stochastic Scenarios – models
Interest rates: Cox, Ingersoll and Ross – CIR
Inflation: Geometric Brownian Motion
Exchange Rate: Chan, Karolyi, Longsta and Sanders – CKLS
Bond Prices
Prices come from CIR
Nelson-Siegel approach to premium
1
1
* )( tttt dzJdtJJdJ
kT
remium eTP )( 210
3
3 tttt dzIdtIdI
A Stochastic Finance Approach
Building a Benchmark Model
14
2
2
* )( tttt dzCdtCCdC
JTtBeTtATtP ),(),(),(

15
Building a Benchmark Model
Debt’s Carrying Cost
Define a Carry cost for each type of bond (y)
Federal Public Debt (FPD) Dynamics
Where Mt, is the monetary base, primt is the primary balance
Debt Sustainability indicator
Because the Treasury control FPD, but the Net Public Sector Debt (NPSD) is the
relevant indicator, it is hereby described as the following function
NTB
NTB
FX
FX
LTN
LTN
LFT
LFT
D
t RRRRR
y
tR
)1)((1
D
ttttt RprimMFPDFPD
othersSelicAssetGDPAssetFXreservesFXLiabSelicLiabMFPDNPSD tttttttt )(

FPD Carrying
Cost
FPD
Composition
NPSD Dynamic Other NPSD
Parameters
Cost and Risk
Stochastic
Scenarios
Benchmark model: Searching the optimal composition of the public debt
16
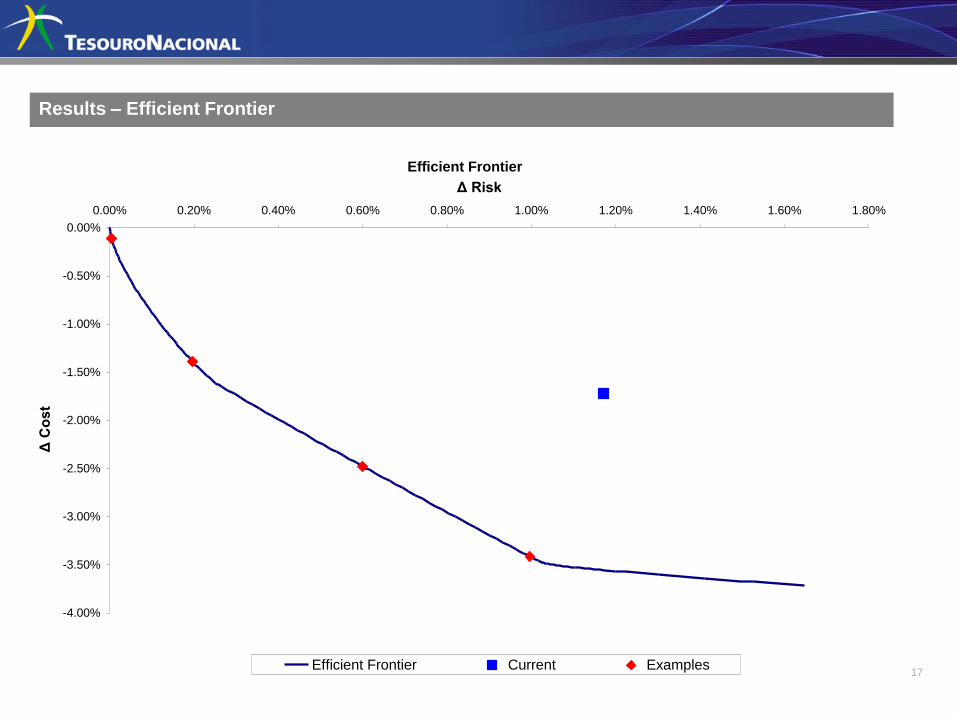
Results – Efficient Frontier
17
Efficient Frontier
-4.00%
-3.50%
-3.00%
-2.50%
-2.00%
-1.50%
-1.00%
-0.50%
0.00%
0.00% 0.20% 0.40% 0.60% 0.80% 1.00% 1.20% 1.40% 1.60% 1.80%
Δ Risk
Δ C
ost
Efficient Frontier Current Examples

Benchmark model: Searching the optimal composition of the public debt
18
Correlation - Single Value Decomposition (SVD)

Connecting the Model to Reality
Model Description
Cost-Risk Analysis – Long term view
Next Steps
Motivation
19

Constraints may be in the way
Development of Debt Management Capability is not necessarily a long process, but it depends on a
number of factors
Public Debt Management
Development
Public Bond
Market
Institutional
Framework
Macroeconomic
Environment
Cost/Risk Analysis
20
Demand
Constraints
Parsimonious usage of the Benchmark Model – 2D analysis

Connecting the Model to Reality
Model Description
Cost-Risk Analysis – Long term view
Next Steps
Motivation
21

Building a more robust macro-structural basis
Next Steps
Work on other functional forms of key variables
Ex: Interest rates: Nelson-Siegel
Having a macro-based description of key variables behind the model will enhance the debt
strategies stories
Incorporate the transition strategy in the optimization model
Long-rung stationary optimal debt story VS today’s problem
22
e
eei tttt
11()( 221

Investor Relations Office
Andre Proite –Manager
Flavia Barbosa –Deputy Manager
David Athayde
Juliana Diniz
Mathias Lenz
You can also reach the Risk Management Unit:
Luiz Alves-Manager
Andre Melo-Deputy
http://www.tesouro.fazenda.gov.br/english/index.asp
Contact
23