Risk Management in the Real Estate Development Industry ...
303
Bond University DOCTORAL THESIS Risk Management in the Real Estate Development Industry Wiegelmann, Thomas Award date: 2012 Link to publication General rights Copyright and moral rights for the publications made accessible in the public portal are retained by the authors and/or other copyright owners and it is a condition of accessing publications that users recognise and abide by the legal requirements associated with these rights. • Users may download and print one copy of any publication from the public portal for the purpose of private study or research. • You may not further distribute the material or use it for any profit-making activity or commercial gain • You may freely distribute the URL identifying the publication in the public portal.
Transcript of Risk Management in the Real Estate Development Industry ...

Bond University
DOCTORAL THESIS
Risk Management in the Real Estate Development Industry
Wiegelmann, Thomas
Award date:2012
Link to publication
General rightsCopyright and moral rights for the publications made accessible in the public portal are retained by the authors and/or other copyright ownersand it is a condition of accessing publications that users recognise and abide by the legal requirements associated with these rights.
• Users may download and print one copy of any publication from the public portal for the purpose of private study or research. • You may not further distribute the material or use it for any profit-making activity or commercial gain • You may freely distribute the URL identifying the publication in the public portal.

I
Risk Management in the Real Estate Development Industry
Investigations into the application of risk management concepts in leading European real estate development organisations
Presented by
Thomas Wolfgang Wiegelmann
Submitted in total fulfillment of the requirements of the degree of
Doctor of Philosophy
Submitted in June 2012
Institute of Sustainable Development & Architecture
Bond University, Australia

II
Abstract
Real estate development is a speculative and entrepreneurial activity. Factors such as
unknown future demand, risks and uncertainty are key elements of real estate devel-
opment (BYRNE, 1996; ISAAC/ O’LEARY/ DALEY, 2010; SCHULTE/ BONE-WINKEL/ ROTTKE, 2002).
Although not always evident during periods of strong economic growth, risk manage-
ment is undoubtedly of paramount importance during economic downturns. The
global financial crisis and the deterioration in real estate markets across large parts of
Europe since 2008/ 2009 - inter alia - demonstrate the significance of the real estate
industry for the world economy.
Despite the structural significance of real estate to the economy and notwithstanding
the thorough analysis of risk management in academic research, only limited substan-
tive research is available on risk management pertaining directly to real estate devel-
opment. Even less empirical data exists that can provide an overview of standard in-
dustry practice with respect to risk management by major development organisations
(GEHNER, 2008; HARTIGAY/ YU, 1993; RICS, 2004; SHUN, 2000).
An in-depth literature study has been undertaken to evaluate the existing knowledge
pool and provide a conceptual framework by reviewing risk management and real es-
tate theory in order to offer real estate developers suitable approaches toward the risk
management process.
As a major contribution the dissertation provides empirical data on a pan-European
perspective with a comparably large size of 69 leading real estate development organi-
zations (response rate of 43.7 per cent) thereby covering various sizes and legal struc-
tures. Statistical analysis using exact Fisher’s Test and Cramer's V has shown some cor-
relations between different structural characteristics of responding organisation (de-
veloper type, geographic scope, ownership structure, project volume) and the conse-
quential understanding and implementation of risk management. Further, the major
findings of the empirical study indicate that:

III
the developers’ approach towards the management of risks tends to be character-
ized by a lack of formalisation and co-ordination and largely rely on individual judg-
ment and experience;
risk management is not regarded as a continuous and dynamic process and is often
fragmented with only few development organisations having formal processes to
align risk management with corporate strategy;
most real estate developers do not conduct their risk management aligned to the
organisation’s specific risk appetite;
many organisations have some measures of risk management activities but few can
claim to have an enterprise wide risk management strategy; and
demand for training and education is vital for a rigorous risk management practise.
Consequently, the results and observations of this research have identified a lack of
understanding in respect of risk management by real estate developers and have also
distinguished weaknesses in addressing risk management issues. Hence, various poten-
tial benefits could be obtained by development organizations through careful review
of their existing risk management practices, which subsequently may also have a posi-
tive impact upon the wider economy.

IV
Declaration
This thesis is submitted to Bond University in fulfilment of the requirements of the de-
gree of Doctor of Philosophy. This thesis represents my own original work towards this
research degree and contains no material which has been previously submitted for a
degree or diploma at this University or any other institution, except where due ac-
knowledgement is made.

V
Acknowledgements
This dissertation on risk management in the real estate development industry stems
primarily from my experience in the real estate business; firstly as participant in the
international management trainee program with Philipp Holzmann AG from 1998
where it was possible to observe first-hand the operations of this German flagship con-
struction and real estate developer and to follow its subsequent demise, secondly as a
Senior Consultant in real estate corporate finance advisory at Ernst & Young in Zurich.
It was during this period that the importance of risk management to individual situa-
tions, organisations and the wider industry was recognised by me. Today and in the
light of the Global Financial Crisis, I am convinced that risk management capabilities
are even more crucial to steer real estate development organisations thru tight capital
and investment markets.
I like to thank Bond University and the Institute of Sustainable Development & Archi-
tecture for providing me with the opportunity to carry out and finalize my dissertation
based on a full Dean’s Scholarship. I would like to thank my supervisors Professor Dr.
George Earl and Professor Dr. Michael Regan as well as Professor Dr. Craig Langston,
Associate Director Research, for their interest in the research subject and their aca-
demic guidance and extraordinarily valuable insights and suggestions.
In addition I thank Professor Dr. Ed Nozeman (University of Groningen) and James W.
DeLoach (COSO Advisory Board) for the discussions on the research topic. Prof. Dr.
Stephan Bone-Winkel (IREBS, University of Regensburg) and Dr. Rainer Suter (AXA Real
Estate, Zurich) and Stefan Pfister (Head of KPMG Real Estate, Zurich) provided valuable
comments on the questionnaire. I express my gratitude to Marlene Havranek for her
valuable advice on structural and language matters.
Most of all, I thank my parents for always providing me with their unfailing support in
all aspects of my life.
Thomas W. Wiegelmann FRICS

VI
Table of contents
Abstract ............................................................................................................................... II
Declaration ......................................................................................................................... IV
Acknowledgements ............................................................................................................. V
Table of contents ................................................................................................................ VI
List of figures ....................................................................................................................... X
List of tables ....................................................................................................................... XII
1 Introduction ............................................................................................................... 13
1.1 Motivation .............................................................................................................. 13
1.2 Research problem .................................................................................................. 18
1.3 Research objectives ................................................................................................ 19
1.4 Research framework .............................................................................................. 20
1.5 Research questions and research approach .......................................................... 21
1.6 Structure of dissertation ........................................................................................ 22
1.7 Limitations .............................................................................................................. 24
2 Real estate development and risk .............................................................................. 25
2.1 Definition of real estate development ................................................................... 25
2.2 Risky nature of real estate development ............................................................... 28
2.2.1 Real estate as a unique asset class ................................................................... 28
2.2.2 Specific characteristics of the real estate market ............................................ 30
2.3 Types of real estate developers ............................................................................. 31
2.4 Definition of risk ..................................................................................................... 34
2.5 The real estate development process and related risks ........................................ 39
2.5.1 Overview to the generic real estate development process ............................. 39
2.5.2 Project initiation ............................................................................................... 41
2.5.3 Project conception............................................................................................ 43
2.5.4 Project realisation / management .................................................................... 52
2.5.5 Project marketing / disposal ............................................................................. 55
2.6 Concluding remarks ................................................................................................ 58

VII
3 Risk management in real estate development .......................................................... 59
3.1 Definition of risk management .............................................................................. 59
3.2 Benefits of an effective risk management system ................................................. 62
3.3 Risk management process ...................................................................................... 63
3.3.1 Strategic objectives and risk appetite .............................................................. 67
3.3.2 Risk identification ............................................................................................. 68
3.3.3 Risk assessment ................................................................................................ 72
3.3.4 Risk control ....................................................................................................... 78
3.3.5 Risk monitoring ................................................................................................. 80
3.3.6 Structure and administration of risk management .......................................... 82
3.4 Propositions on risk management practice in the real estate development industry ................................................................................................................... 83
3.4.1 Risk management a systematic process? ......................................................... 84
3.4.2 Risk management an ongoing challenge? ........................................................ 84
3.4.3 Risk management applied in strategy formulation? ........................................ 85
3.4.4 Risk Management applied across the whole real estate development organisation? .................................................................................................................. 87
3.4.5 Risk Management designed in order to identify, assess and manage events potentially affecting the real estate development organisation?.................................. 87
3.4.6 Risk Management intended to preserve value and allow value to be created?88
3.4.7 The impact of structural characteristics of an organisation on the effectiveness of their risk management system ............................................................ 88
3.5 Concluding remarks ................................................................................................ 91
4 Empirical research design .......................................................................................... 92
4.1 Objective and contents of empirical research ....................................................... 92
4.2 Research purpose ................................................................................................... 93
4.3 Quantitative research approach ............................................................................ 94
4.4 Written survey as choice of research method ....................................................... 95
4.4.1 Questionnaire ................................................................................................... 97
4.4.2 Population ........................................................................................................ 98
4.4.3 Pretest ............................................................................................................ 100
4.4.4 Data collection ................................................................................................ 100
4.4.5 Data analysis ................................................................................................... 101
4.4.6 Presentation of results and determination of propositions ........................... 101
4.4.7 Limitations on the empirical research ............................................................ 102

VIII
5 Results of the empirical research on risk management in the real estate
development industry .............................................................................................. 104
5.1 Response rate ....................................................................................................... 104
5.2 Background characteristics of respondents ......................................................... 105
5.3 Internal corporate environment .......................................................................... 111
5.3.1 Focus on risk perception ................................................................................ 111
5.3.2 Structure and accountability .......................................................................... 114
5.3.3 Risk management strategy ............................................................................. 123
5.3.4 Risk management as an integral aspect of management .............................. 125
5.3.5 Overall confidence in risk management ......................................................... 128
5.4 Risk management process .................................................................................... 131
5.4.1 Setting corporate objectives .......................................................................... 131
5.4.2 Motives and goals of risk management implementation .............................. 132
5.4.3 Risk identification ........................................................................................... 134
5.4.4 Risk assessment .............................................................................................. 139
5.4.5 Risk control ..................................................................................................... 147
5.4.6 Risk monitoring ............................................................................................... 149
5.5 Evaluation of propositions ................................................................................... 154
5.6 Concluding remarks .............................................................................................. 166
6 Reflections on the findings in the light of recent economic events ........................ 170
6.1 Introduction .......................................................................................................... 170
6.2 Reflections on the real estate development market between 2003 and the beginning of the financial crisis ............................................................................ 171
6.3 Reflections on the real estate development market since the financial crisis and declining real estate markets from late 2007 ...................................................... 175
6.4 Reflections on improvements in risk management practice in real estate development ........................................................................................................ 177
6.5 Potential reasons for the difference between the theory of risk management and the practice applied by developers ............................................................... 179
6.5.1 Risk transfer .................................................................................................... 179
6.5.2 Judgement, flexibility and speed .................................................................... 180
6.5.3 Behavioural characteristics ............................................................................ 180
6.5.4 Lack of expertise ............................................................................................. 181
6.5.5 Regulatory oversight ...................................................................................... 181
6.6 Concluding remarks .............................................................................................. 181

IX
7 Conclusion and directions for further research ....................................................... 183
7.1 Implications for real estate research ................................................................... 183
7.2 Directions for further research ............................................................................ 185
7.3 Implications for industry practitioners ................................................................. 186
7.4 Conclusion ............................................................................................................ 188
Bibliography ..................................................................................................................... 190
Appendix A - Developer list (population) ........................................................................ 200
Appendix B - Covering Letter ........................................................................................... 203
Appendix C - Questionnaire ............................................................................................. 204
Appendix D – Statistical analysis ..................................................................................... 212
Appendix E - Results from Cramer’s V / p-value analysis ................................................ 215
Appendix F – Empirical results ........................................................................................ 216
Appendix G - How the propositions were tested ............................................................ 299

X
List of figures
Figure 1-1: Research framework .................................................................................... 20
Figure 2-1: Types of real estate developers ................................................................... 32
Figure 2-2: The spectrum of uncertainty (after HARGITAY / YU, 1993; FISHER/ ROBSON,
2006)........................................................................................................................ 36
Figure 2-3: Generic real estate development process ................................................... 40
Figure 2-4: Conceivable starting-points for a real estate development (SCHULTE / BONE-
WINKEL / ROTTKE, 2002, p. 32) ................................................................................... 42
Figure 2-5: Structure of feasibility analysis (based on ISENHÖFER, 1999, p. 66) .............. 44
Figure 2-6: The developer’s decreasing ability to influence total cost over the life of the
project (based on ISENHÖFER / VÄTH 1998, p. 175) .................................................... 47
Figure 2-7: Potential valuation throughout the development process (ISENHÖFER / VÄTH,
1998, p. 182)............................................................................................................ 51
Figure 3-1: Key elements of enterprise risk management (COSO, 2004, exhibit 1) ...... 64
Figure 3-2: The Risk Management Process (IRM / AIRMIC / ALARM) ............................ 65
Figure 3-3: Risk management process in the real estate development industry (based
on HALLER ,1986, pp. 25 and 27 and WIEDENMANN, 2005, p. 24) .............................. 66
Figure 3-4: Generic corporate risk model (PROTIVITI, 2006, p. 54) .................................. 69
Figure 3-5: Risk categories and risk types in the real estate sector, MAIER (2004) ........ 70
Figure 3-6: Methods of risk identification (ROMEIKE, 2003, p. 174) ................................ 72
Figure 3-7: Example illustration of a risk portfolio ......................................................... 76
Figure 4-1: Structure of empirical research design ........................................................ 96
Figure 5-1: Optimal volume for individual projects ..................................................... 108
Figure 5-2: Usage-focus of development activities ...................................................... 110
Figure 5-3: Development of risk situation .................................................................... 111
Figure 5-4: Risk culture compared to its relevant competitors ................................... 112

XI
Figure 5-5: Common understanding / terminology of risk ........................................... 113
Figure 5-6: Efficiency of structure and culture ............................................................. 115
Figure 5-7: Primary risk management responsibility ................................................... 116
Figure 5-8: Specialized committee overseeing risk management ............................... 118
Figure 5-9: Risk management training ......................................................................... 120
Figure 5-10: IT solutions in risk management .............................................................. 121
Figure 5-11: Tools for risk management ...................................................................... 122
Figure 5-12: Risk management strategy ....................................................................... 123
Figure 5-13: Risk management in strategy, control and monitoring processes .......... 125
Figure 5-14: Written statements on risk management ................................................ 126
Figure 5-15: Risk management capability on organisation level ................................. 128
Figure 5-16: Risk management capability on project level .......................................... 129
Figure 5-17: Overall confidence in risk management .................................................. 130
Figure 5-18: Risk in achievement of objectives ............................................................ 131
Figure 5-19: Drivers for risk management implementation......................................... 133
Figure 5-20: Risk identification ..................................................................................... 134
Figure 5-21 Risk Catalogue ........................................................................................... 135
Figure 5-22: Significance of risks on organisation level ............................................... 137
Figure 5-23: Significance of risks on project level ........................................................ 138
Figure 5-24: Aspects of risk assessment ....................................................................... 139
Figure 5-25: Risk assessment on strategic and operational level ................................ 140
Figure 5-26: Risk assessment methods ........................................................................ 142
Figure 5-27: Information demand on project level ...................................................... 144
Figure 5-28: Time dimension of risk assessment ......................................................... 146
Figure 5-29: Measures to optimize the risk situation .................................................. 148
Figure 5-30: Reporting policies and processes ............................................................. 149

XII
Figure 5-31: Aspects of risk monitoring ....................................................................... 150
Figure 5-32: Key indicators and threshold values ........................................................ 152
Figure 6-1: CB Richard Ellis EU-15 Rental Value Index, February 2012 ........................ 171
Figure 6-2: European direct real estate investment volumes (source: Jones Lang
LaSalle, Property Data, KTI, Akershus Eiendom, Athens Economics, Sadolin &
Albaek, February 2012) ......................................................................................... 172
Figure 6-3: CBOE VIX (8th March 2010), CB Richard Ellis, EU-15 Office Yield Index
February 2012 ....................................................................................................... 173
List of tables
Table 4-1: Relevant situations for different research strategies (YIN, 2003, p. 5) ......... 95
Table 5-1: Questionnaire and response rate (countries in alphabetical order) ........... 105
Table 5-2: Background characteristics of respondents ................................................ 106
Table 5-3: Number of risk assessment methods .......................................................... 143

13
1 Introduction
1.1 Motivation
Risky nature of real estate development
Real estate development is considered to be one of the riskiest corporate activities
there is (BARKHAM, 1997; BYRNE, 1996; ISENHÖFER, 1999). As the creation of real estate
products is in many cases speculative and therefore in anticipation of an unknown fu-
ture demand, risk and uncertainty are key elements of real estate development (BYRNE,
1996; FISHER / ROBSON, 2006); RATCLIFFE / STUBBS / KEEPING, 2009; WIEGELMANN, 2012). The
development business is to be regarded as highly cyclical and volatile (ISAAC / O'LEARY /
DALEY, 2010; TIESDELL / ADAMS, 2011). GEHNER (2008, p.7) asserts that “real estate devel-
opment is knowingly taking risk”. Real estate development is subject to a number of risk
factors (MAC-CRATE / PETERSON, 1999; MORLEY, 2002; CADMAN / TOPPING, 1995; FISHER /
ROBINSON, 2006). Successful development, inter alia, depends on bringing the adequate
real estate product to the market at the right time at the right price. The development
profit depends on achieving all that while balancing costs against value.
Development is fixed both in time and space and involves relatively large amounts of
capital (ZANI, 1993). Furthermore, real estate development is a very complex and cross-
disciplinary task as it typically demands a dedicated team including people with different
skill sets and expertise and the co-ordination of a wide range of interrelated activities.
Local authorities, legal requirements, residents and neighbours are to be satisfied, de-
sign teams and contractors to be managed, time scales, costs and contingencies to be
monitored and lenders and other stakeholders - especially prospective tenants and in-
vestors - to be satisfied. In addition, real estate developers are often faced with consid-
erable changes in their environment and new challenges driven by the macro-economic,
social, urban-planning, political-legal, regulatory, environmental and technological
framework conditions (BRADE, 1998; SHIMPI, 1999).
However, in spite of the high risk factors, the real estate development industry lags
behind other industries in its sophistication and application of risk identification,
evaluation, mitigation and control (GIMPELEVICH, 2011; SCHULTE / BONE-WINKEL / ROTTKE,
2002). As to WILKINSON / REED (2008, p. 120), “developers are often criticised for not suf-
ficiently understanding and analysing risk.”

14
The banking and insurance sectors have long developed and employed sophisticated
systems of risk management techniques and methods and the amount of academic
research in these areas is too numerous to list. Their efficacy is of course debatable
following the global financial crisis, although this is likely to have been due to a lack of
diligent application of said techniques. Compliance with statutory requirements on risk
factors is also well established in the fields of quality, environment and safety. Risks
that remain undetected or are detected too late can trigger crises at project level or
even at corporate level. Often irreversible damage has occurred or losses have been
incurred by then. As a rule, minimal scope for action is left at this late stage and it is
frequently no longer possible to achieve the necessary turnaround.
The real estate development business requires a great awareness of risk and its man-
agement. This not only stems from the risky nature of the development process and
involved complexity but also from the regulatory, capital market and stakeholders
pressures which call for great awareness of risk and risk management. These areas will
be examined in turn.
Regulatory pressure
Regulatory and corporate governance provisions are increasingly requiring greater
awareness of risk and risk management; it is no longer optional but a mandatory re-
quirement in many countries in order to protect the organisation's stakeholders from
the implications of the organisation defaulting on its obligations. The main thrust of
regulation has been aimed at the board of directors, calling for more control and disci-
pline towards effective and efficient operation, reliability of financial reporting as well
as compliance with laws and regulation.
The regulatory reform of the banking sector through the revised guidelines of the Basel
Capital Accord (especially Basel II and III) has an important impact on awareness of risk
and risk management in real estate development. Capital adequacy ratios have to take
into account credit risk, which lenders are now able to estimate based on an ‘Ad-
vanced Internal Rating Based Approach’. This means that demonstrably high levels of
risk management of the borrower increase the risk weighted asset value of its loan and
lower the capital cost of lender (WIEDENMANN, 2005). Therefore Basel should result in
greater awareness of risk and risk management in real estate development and it
should give a competitive advantage to risk management proficient property develop-

15
ers who will be able to borrow at more advantageous rates. As a result of a series of
EU directives, many European States have issued guidelines, which require or encour-
age publicly listed organisations to undertake risk management and to make appropri-
ate disclosure to shareholders. Under these directives, risk management activities are
taken into account in relation to statutory audit and financial reporting requirements.
The audit committee of listed organisations is required to monitor the effectiveness of
the organisation’s risk management systems and publicly listed organisations are re-
quired to publish an annual corporate governance statement including a description of
the main features of any existing risk management systems and internal control sys-
tems in relation to the financial reporting process.
No statutory requirements for risk management exist for private organisations and
several European risk management bodies have promoted the idea of guidelines,
frameworks or general principles of best practice, which have created a greater
awareness of risk and risk management in real estate development. Indeed results
from the 2006 European risk management benchmarking survey conducted by the
Federation of European Risk Management Associations indicate that risk management
has grown in scope and confidence on the establishment of standards (FERMA, ERNST &
YOUNG AND AXA CS, 2006).
Capital markets pressure
In addition to regulatory pressure, the capital market now also requires adequate cor-
porate risk management. In this context, BUTTERWORTH (2001) noted that organisations,
which are able to provide evidence of efficient risk management, may benefit from a
more favourable cost of capital. In contrast, developers who cannot demonstrate sys-
tematic management of risks and opportunities, which is a key component of any cor-
porate control mechanism focused on the creation of value, are not rewarded with a
high level of confidence and are penalised by the capital markets. It can be assumed
that the capital markets are increasingly determining risk management requirements,
with shareholders and stakeholders appearing also as key recipients of risk reporting
(SCHULTE / ROTTKE / PITSCHKE, 2005). Effective risk management assists in the targeted
control, transparency and communication of the corporate risk situation and should
therefore contribute to an improved rating. Thus, against the background of intensified
competition for capital, an established and sound risk management process will pro-

16
vide the organisation with a future cost advantage in terms of borrowing costs and
therefore a significant competitive edge.
Institutional and private investors, as well as other capital sources are increasingly take
the specific risk of an investment and its strategic management into account when al-
locating capital. In general, the higher the ensuing risk is considered to be, the higher
the associated earnings expectations are (AAKER / JACOBSON, 1987). Shareholders expect
an effective allocation and efficient use of capital as well as a risk management strat-
egy aligned to value creation. One of the most common mistakes made by developers
in dealing with institutional capital providers is that they rarely identify and discuss the
risks and their potential conflicts regarding a project sufficiently (THOMAS, 2001).
The impact of the financial crisis and the deterioration in real estate markets across
large parts of Europe since 2007/ 2008 clearly demonstrate the significance of the real
estate industry for the world economy. The financial crisis led by failures in the sub-
prime mortgage market that manifested itself in the USA in early 2007 and resulted
insignificantly reduced real estate valuations across the majority of property sectors in
the USA can be identified as the epicentre of the so called ‘global financial crisis‘. In the
context of the fallout from Greece, significant problems in the Eurozone as well as con-
cerns about sovereign debt actually dominate the European capital markets in 2012.
One of the impacts of the crisis has been to see the lending paradigm shift back from
investment banks to commercial banks and entails a back-to-basics approach for Euro-
pean real estate commercial lending going forward. This means that there is a greater
awareness of risk and risk management in real estate development. Lenders have be-
come extremely cautious about providing debt leading. In this tight capital markets,
real estate development organisations will have to demonstrate strong risk manage-
ment practise not to be shut out of the access to equity or debt sources. On a long
term, the global financial crisis may likely act as a catalyst to a change the mentality of
real estate development organisations making a risk management culture more en-
trenched in the industry.

17
Stakeholders’ pressure
Similarly, other stakeholders of real estate development organisations expect an effec-
tive allocation and use of capital. It is a safe assumption that organisations, which are
able to demonstrate that they are aware of their risks and manage opportunities and
threats in an entrepreneurial and effective manner, are able to inspire confidence
among their stakeholders including any other business partners who are more likely to
consider an organisation managed in a risk-aware manner as being credit-worthy. In
communicating risk-specific aspects to key stakeholders, a significant objective for
management is to assure them that adequate risk management strategies have been
implemented.
Success in winning real estate development mandates or to enter joint venture in-
vestments will depend, amongst other things, on demonstrating that sound assump-
tions regarding risk factors have been taken into account. Without sound risk man-
agement, real estate development organisations are likely to be increasingly penalised
as awareness of risk and risk management comes to the fore.
There is a widely held belief that a structured risk management approach is a critical
success factor for real estate development (MILES / BERENS / EPPLI / WEISS, 2007;
MILLINGTON, 2000) and will in most cases be a determinant factor between success and
failure. Though not always evident during periods of strong economic growth, it is un-
doubtedly of paramount importance during economic downturns. MILLINGTON (2000, p.
220) argues that development organisations “(...) should implement risk reduction and
risk control measures.”
The motivation for this dissertation stems from the realization that the nature of the
real estate development process is complex and high risk and yet little research work
has been done on risk management in this sector. Furthermore, there is rising pressure
for improved risk management from regulators, the capital markets, and other stake-
holders.

18
1.2 Research problem
As discussed in chapter 1.1 awareness of risk and risk management in real estate devel-
opment is of vital importance yet research on the topic is very limited. The importance
of knowledge in of risk management principles in real estate has been pointed out by
GRAASKAMP in 1977. While extensive literature exists on risk, and general risk manage-
ment and a limited amount of empirical data on risk for real estate development pro-
jects, research specifically addressing risk management approaches in real estate devel-
opment is relatively scarce.
Previous research focusing on risk management on the real estate development field
have been undertaken by BYRNE (1996), GEHNER (2008 / 2003), GEHNER / DE JONGE (2005),
MILES / WURTZEBACH (1971), PEISER (1984), PELATT (1972), VAN DENZEN (2009), VERNOR
(1989) and WIEDENMANN (2005).
An extensive survey conducted by NEWELL / MCALLISTER / WORZALA (2004) and NEWELL /
ACHEAMPONG / WORZALA (2002) concluded that property and portfolio risk was consid-
ered as a most under-researched area. The gap between the theory and practice of risk
analysis according to GIMPELEVICH (2011), HARGITAY / YU (1993) and SHUN (2000) is par-
ticularly wide in real estate development. Furthermore, there is limited research about
how professional real estate developers cope with their risky business (GEHNER, 2008).
The empirical research conducted by GEHNER (2008) “Knowingly taking risk: investment
decision-making in real estate development” deserves mention in this context.
Gehner’s work offers insight into the investment decision-making process of three es-
tablished Dutch real estate development organisations. The results created the basis
for a framework, which demonstrates that deriving good investment decisions is not
restricted to analysing risks to support the justification of decisions, but it is also nec-
essary to address decision problems in time, and to ensure that someone is account-
able for the decision. The results indicate that there is a lack of knowledge about how
developers deal with the inherent risks of their business and at the same time, such
knowledge is required to support the further professionalization of the industry.
Gehner’s work concentrates on three Dutch case studies whereas the author’s empha-
sis here is on a larger pan European sample in order to be able to generalise and ex-
pand the insight.

19
1.3 Research objectives
The objective of this dissertation is to enrich the understanding of the implementation
of risk management in the real estate development industry by conducting empirical
research on a broader basis. The dissertation aims to offer an in-depth presentation of
risk management practice in leading European real estate development organizations
in order to provide a comprehensive quantified “map” so far of risk management prac-
tice in leading European real estate development organisations covering all aspects of
the risk management process. It questions, how, if at all, different categories of devel-
opers vary in the way risk management is conducted. It is hoped that the results of the
empirical research will also offer the opportunity for enterprises of drawing conclu-
sions about appropriate approaches towards the risk management process as well as
for benchmarking their risk management process against those of other leading Euro-
pean developers, given that existing systematic empirical information is very limited.
Unlike the only limited empirical research available so far, this research aims to pro-
vide a pan-European perspective with a comparably large sample size of real estate
development organizations. As of today, such an analysis has not been performed and
the success of any such study is dependent on the ability to access critical sources. This
empiricism not only provides evidence to corroborate or disprove preconceived ideas
on actual risk management practice but is also expected to give new insight into the
workings of the real estate development industry and will serve, at a minimum, as a
guide to responsible executives and staff about the practices of other organizations.
On the basis of empirical data and their evaluation, executives may endeavour to de-
rive conclusions on the risk management approach to be taken by their own organiza-
tions and consequently to promote further professionalism of the real estate devel-
opment industry regarding risk management.

20
1.4 Research framework
A distinctive feature of this dissertation is to compare applied risk management stan-
dards against the results of an in-depth empirical study of the industry in question and
to strengthen the findings by further quantitative analysis. The goal is to provide a ho-
listic account of risk management in real estate development, which also highlight
linkages between different aspects of the risk management process and the structural
characteristics of real estate developers.
For this a specific research framework was used (Figure 1-2). The framework defines
the sets of different research areas, which would be evaluated to provide insight into
the complex system of risk management in the real estate development industry and
forms the basis of the research questions outlined in chapter 1.5 below. The disserta-
tion takes the form of a conceptual analysis of risk and risk management and formu-
lates eight propositions on general conclusions derived from business theory, which
will then be tested by much-needed empirical research. The empirical research is
based on as large as possible and practical, a bank of European developers in the area
of risk management in order to provide substantial data to assess and evaluate its
practical implementation. The combination of these three areas will provide valuable
information to identify the risk management approaches that are currently being used
in the industry and to verify the propositions, which have been derived from the theo-
retical study of risk management in the real estate development industry.
Figure 1-1: Research framework

21
1.5 Research questions and research approach
A review and comprehensive summary of relevant literature in risk, risk management
and real estate development is to be undertaken as part of the process of putting the
research into context. The specific research questions explored in this dissertation
have been derived from both literature review and the author’s experience in the field
and are listed below:
1. What are the characteristics, key business processes and associated key risks
of real estate development?
2. What are key principles and process-related aspects of risk management
according to relevant areas of literature?
3. What are the practices among leading European real estate development
organisations concerning risk management?
4. What are the reflections on the findings in light of the global financial crisis
since 2008/9?
5. What are the implications of the findings of this dissertation for academic
research as well as the real estate development industry?
In figure 1-2, triangles 1, 2 and 3 correspond to the research questions 1, 2 and 3,
which are discussed in chapter 1.5. Point 4 in figure 1-2 relates to research question 5
in chapter 1.5. Research question 4 reflects on the changes in the European real estate
environment as a result of the events of 2008/9 and the implications that these
changes may have on the empirical findings.
While the purpose of all studies is concerned with contributing to knowledge, ROBSON
(1993) categorises three possible forms of a study: exploratory, descriptive and ex-
planatory. Exploratory studies seek new insights and ideas and are useful when not
enough is known about the area of research and to decide whether it is worth re-
searching into the issue. Descriptive research aims to describe an accurate profile of
the phenomenon that is being studied as it occurs and is marked by the prior formula-
tion of specific hypotheses (GRAY, 2004). Consequently it requires extensive previous
knowledge of the research area so that sufficient knowledge on appropriate aspects of
the research topic can be pre-planned and structured (ROBSON, 1993). The emphasis of
an explanatory study is to determine the cause and effect relationships between vari-

22
ables in order to explain a problem or situation. Control or manipulation of one or
more independent variables is often used for this purpose.
At the outset of the research, very limited literature was available and it was felt nec-
essary to obtain descriptive information on risk management within the industry in or-
der to set up a theoretical foundation for relevant risk management aspects in real es-
tate development. Research questions one and two adopt a descriptive approach. The
study attempts to apply a generic risk management process to the real estate devel-
opment process by means of an event sequence model in order to provide an accurate
profile of risk management in real estate development (GRAY, 2004). The research
questions in this area focus on the form of “what?” and “which?” questions (ROBSON,
1993; WELLINGTON / SZCZERBINSki, 2007). The questions within the written survey are ex-
pected to provide answers as to how risk management is understood and imple-
mented by leading European development organisations.
Research question three leads on to the empirical research to determine risk manage-
ment practice within the industry and through exploratory quantitative analysis to de-
termine whether there are fundamental connections between independent variables
of developers and risk perception indicators. The explanatory nature of this disserta-
tion becomes evident in research questions four and five where the changing real es-
tate environment as well as explanations as to why developers behave in certain ways
or use certain methods (WELLINGTON / SZCZERBINSKI, 2007) are considered. These expla-
nations provide invaluable insight into risk management attitudes and behaviour,
which has had considerable impact on the industry in the run up to and during the
global financial crisis.
1.6 Structure of dissertation
Chapter two explains real estate development and risk. Its main purpose is to identify
all potential risks, which are typically found in a real estate development project. This
chapter begins with a study of the definition of real estate development and risk
through a comprehensive literature review. The application of an event sequence
model is used to provide a framework for the study of the identification of potentially
associated risks within the different stages of the development process and addresses
research question one.

23
Chapter three addresses research question two by examining risk management in real
estate development; the analysis of existing definitions and underlying concepts of risk
management, from both a general management perspective and from industry specific
academic literature, allows for the formulation of a unique definition which is applied
in this dissertation. A study of various risk management processes that is widely ac-
cepted in the real estate development industry is made to provide a foundation for
core areas, which are to be tested in their practical application. At the end of this chap-
ter, some propositions on risk management in the real estate development industry
are formulated which are to be tested by the empirical research. Chapter four provides
an introduction to the empirical research. The research design is described and ex-
plained. Further statistical analysis was conducted and this is also explained and dis-
cussed in this chapter. In chapter five the results of the empirical study answer re-
search question 3. The chapter highlights the risk management practice among Euro-
pean real estate development organisations and is presented and analysed in chapter
five. Chapter five addresses two main issues: the internal corporate environment and
the risk management process. To complement these results, an evaluation of the eight
propositions as stated at the end of chapter three are presented here. These evalua-
tions provide insights into how real estate developers conduct risk management. Chap-
ter six, reflects on recent economic events in the context of the financial crisis, their
impact on the real estate development industry and the empirical findings of this the-
sis and answers research question 4. During the course of writing the dissertation, the
entire market context for both occupation and investment aspects of the European
real estate market changed dramatically. It became evident that these developments
changed the risk profile of developers and it was necessary therefore to reflect on the
relevance and the veracity of the empirical findings in the aftermath of the economic
crisis. Chapter seven concludes the dissertation with a discussion of the advances
made in the understanding of risk management in the real estate development indus-
try through this study and where these propositions have been confirmed or dis-
proved. Where evidence has been inconclusive, recommendations are made for fur-
ther studies in those areas. Chapter seven provides answers to research question 5.

24
1.7 Limitations
The topic of risk management in real estate development encompasses many aspects
and accordingly there are limitations to this study, which are to be highlighted. This
thesis does not provide an in-depth discussion of the options for strategic action avail-
able in the area of risk management or formulate possible risk strategies. Aspects con-
cerning the real estate markets are addressed at a secondary level only, as an isolated
examination of such aspects would not be expected to offer a significant contribution
to the findings of this dissertation and would therefore fall short of its objective.
Moreover, the legislative framework of real estate development is not examined, as
this framework is subject to constant change at both a national and an international
level and is also not expected to contribute to the findings from a conceptual point of
view. Thus, the author has largely refrained from making specific reference to legal or
tax related issues within the scope of this dissertation.
This dissertation is largely based on the Committee of Sponsoring Organizations of the
Treadway Commission (“COSO”) Risk Management Framework (2004) and on the defi-
nition and the fundamental characteristics of an effective risk management process as
put forward by DELOACH (2000). There is a strong connection between these two pieces
of work; DeLoach’s publications on enterprise-wide risk management, amongst other
things, earned him a seat on the COSO Advisory Board and he therefore had a major
influence on the COSO Framework. The COSO framework was not the only possible
point of reference in terms of risk management standard (see chapter 3.3) but was
considered useful given its general acceptance in the European context. The author
assumes that current accepted views on generic risk management are sound and
therefore no attempt has been made to further explore these ideas on which the dis-
sertation is so dependent. It was felt not only that it would go beyond the scope of the
dissertation to do this but that it was unnecessary in the circumstances as the purpose
of using fundamental ideas and the risk management framework were primarily to
provide a framework against which to analyze risk management practices in real estate
development.

25
2 Real estate development and risk
Chapter two uses the theoretical foundation of research on real estate development in
order to answer the following research question as set out in chapter one:
1 What are the characteristics, key business processes and associated key risks
of real estate development?
The purpose of this chapter is to define risk from the perspective of the developer and
to identify the different categories of risks that a development organisation faces. This
chapter begins with an overview and definition of real estate development (chapter
2.1), its unique and specific characteristics (chapter 2.2) and the different types of real
estate developers (chapter 2.3). This is followed by a study of the general concept of
risk (chapter 2.4). The application of an event sequence model (chapter 2.5) is used to
develop an ideal typical phase model which provides a framework for the study of the
identification of potentially associated risks within the different stages of the devel-
opment process.
2.1 Definition of real estate development
The views expressed in specialist literature regarding the precise definition of the term
‘real estate development’ (also referred as ‘property development’) are varied and, in
part, differ from each other. Most definitions refer to a sense of creativity and focus
and coordination in order to realise real estate assets (NEARY, 2009).
The statutory definition of real estate development as set out in section 55 (i) of the
British Town and Country Planning Act 1990, have been quoted by both CADMAN /
TOPPING (1995, p.177) and MILLINGTON (2000, p. 1). This states that “Development
means the carrying out of building (...) or other operations in, on, over or under land, or
the making of any material change in the use of any buildings or other land.” This defi-
nition reflects the functional characteristics of real estate development and continues
to be widely used. WILKINSON / REED (2008, p. 2) adopt the definition that real estate
development is “a process that involves changing or intensifying the use of land to pro-
duce buildings for occupation”.

26
This description, however, does not sufficiently reflect the original character of real
estate development and the creative function of real estate developers as a prerequi-
site for project initiation.
Real estate is often defined as a triangle of space, money and time. In this sense a par-
ticular usage is attributed to a defined space which generates an estimated cash flow
over a specific period of time. Based on this understanding of real estate, the definition
of development postulated by GRAASKAMP (1992, p. 620) “(...) the creation and man-
agement of space time units is termed real estate development” is applicable. This
definition primarily makes reference to the economic benefit derived from the space
produced by the developer. The definition of the Urban Land Institute, as formulated
by MILES / BERENS / WEISS (2000, p. 4), also refers to the management and entrepreneu-
rial aspect of real estate development: “Development is an idea that comes to fruition
when consumers – tenants or owner occupants - acquire and use the bricks and mortar
(space) put in place by the development team. Land, labor, capital, management, and
entrepreneurship are needed to transform an idea into reality. Value is created by pro-
viding usable space over time with associated services.”
The purpose of real estate development is therefore to recognise the potential oppor-
tunities for increases in value / future cash flows, that are inherent in land or real es-
tate, and to exploit these by suitable measures (BAUM / MACKMIN, 1989; GUY, 1994). The
added value created by the developer does not result solely from the fact that a build-
ing is constructed on an undeveloped plot or that a condemned property is redevel-
oped, but may also be based on other measures of increasing the usage of the prop-
erty and the productivity of space. This includes, in particular, the structural usage of
currently unused space on a plot of land or within a property, as well as conversion /
rebuilding measures, e.g. turning auxiliary space into rentable space.
Generally, the priority goal of a developer is the optimal realization of the capital ap-
preciation that has been created in connection with the real estate development proc-
ess. BARKHAM (2002, p. 53) concludes, “perhaps more than in any other industry the
property development entrepreneur resembles the classic entrepreneur of economic
history”.

27
Similar D'ARCY / KEOGH (2002, p. 19.) state that “(...) the developer's role is essentially
one of supplying a stream of entrepreneurial services to the property market through
both the identification and activation of market opportunities.” As to GELTNER / MILLER
(2001, p. 23) the real estate development industry “assembles and applies the financial
and physical resources to construct new built space” (…) in “its role as a converter of
financial capital into physical capital” (GELTNER / MILLER, 2001, p. 23-24).
To meet its objectives, a developer has to focus on the satisfaction of the needs of
both target and client groups, e.g. the users of the property and the investors. The
quality of a project from the user's perspective (user's goal system) relates primarily to
the three aspects of quality of use, rental price and service or building management.
The investor's goal system arises from the classic investment objectives, namely re-
turn, preservation of value and liquidity. MALIZIA (1992, p. 643) phrased his understand-
ing of the risk-taking function of the developer as follows: “Developers may be viewed
as the risk-taking entrepreneurs who combine land, labour and capital to plan, manage
and market facilities which they believe will provide services demanded by space us-
ers.”
GUY / HENNEBERRY (2002, p. 5) describe development as follows: “Urban development is
a complex process which entails the orchestration of finance, materials, labour and ex-
pertise by many actors within a wider, social, economic and political environment.” Al-
though this definition refers to urban development, it is useful in that it regards devel-
opment from a broader perspective to include a wider range of factors applicable to
real estate development.
MILES / BERENS / WEISS (2000) describe real estate development as a highly synergistic
and creative process in which “... physical ingredients are effectively combined with
financial resources and professional skills, to create a built-environment that is eco-
nomically sound, aesthetically pleasing and environmentally responsive. (...) At its best,
the development process is synergistic – that is, the ultimate combination of resources
has a greater value than the sum of the individual parts.” Within the German-speaking
region, the following integral-systematic definition by DIEDERICHS (1996, p. 29) has been
widely accepted and is favoured for the purposes of this dissertation: “Real estate de-
velopment is required to combine the aspects of location, project concept/ idea and
(use of) capital so as to achieve multiple objectives: the results need to be (micro eco-

28
nomically) competitive on a standalone basis, should create and / or secure employ-
ment, need to be socially, macro economically and environmentally acceptable and
they need to generate a positive return over their life-cycle in the long term.”
Diederichs distinguishes between real estate development in the strict sense, which
comprises the period from project initiation until the decision regarding the further
procedure within the conceptual framework, and real estate development in the
broader sense, which includes both the planning and construction phase and the usage
phase of real estate.
This conceptual understanding makes stronger reference to the production factors of
location, project idea and capital, which form the starting point of real estate devel-
opment and whose effective combination results in a specific investment (HEALEY,
1992). This definition addresses both the macro-economic and the micro-economic
effect level of real estate development. From a macro-economic perspective, it is re-
quired that the real estate, as the outcome of development process, meets public de-
mand, while it must be competitive, profitable and sustainable from a micro-economic
perspective. The dissertation focuses on the micro-economic level. Further, the core
focus is to be on the development of real estate assets. Although development organi-
sations may engage in the construction of roads, drainage, water facilities, power gen-
eration and other infrastructure, these projects should be ancillary to the core activity
of developing buildings for occupation.
2.2 Risky nature of real estate development
2.2.1 Real estate as a unique asset class
When addressing real estate issues, it is necessary to make reference to a number of
specifics that are not, or not as prominently, encountered in connection with other in-
vestment / asset classes. The most important specific characteristics of real estate as
an investment good are described, inter alia, by BONE-WINKEL (1994); BROWN (1971),
GESCHWENDER (2010) and MILLINGTON (2000).
The most prominent characteristics of real estate are that it is tied to its location, it is
heterogeneous, it is scarce and it has limited substitutability. These factors have far-
reaching economic, legal and factual implications. The geographic location alone fre-

29
quently determines the most likely use as well as the physical and / or structural possi-
bilities, and the value of real estate is largely determined by external factors such as
the condition and the possible uses of adjacent properties as well as the infrastructural
facilities provided by the public sector.
Land cannot be reproduced, any structures built or developed on a specific piece of
land are characterised by a high degree of uniqueness. The heterogeneity of real es-
tate can be derived from its immobility. Low level of heterogeneity results in the crea-
tion of material and regional sub-markets, thereby restricting the comparability of real
estate. The heterogeneity results in sub-market risks as well as property and valuation
risks. Heterogeneity leads to both scarcity and limited substitutability. The possible
uses of real estate are largely determined by the combination of geographical location,
structural conditions and legal parameters. Thus, real estate is characterised by both
scarcity and limited substitutability.
Real estate development is a highly complex, dynamic and multi-disciplinary challenge.
The duration and complexity of the development process involves a considerable
amount of time (BARKHAM, 1997; BRAUER, 2003; BYRNE, 1996; GEHNER, 2008) and, as a
consequence, real estate developers lack the relative flexibility to respond and adjust
quickly to any fluctuations in tenant and investment markets. This results in increased
economic risk. Furthermore, the construction of real estate and the acquisition of a
completed property require a considerable investment (DUBBEN / SAYCE, 1991). Against
this background and also in view of the objective of maximising the return on equity,
external funds are often necessary to cover capital needs as not all property develop-
ers are also property investors. As a result, the development industry and capital mar-
ket are closely interrelated.
Finally, real estate is also characterised by its long life cycle and useful life. Depending
on the purpose of real estate, its capability of being used by third parties and its usage
concept, the economic life of real estate ranges between 20 and 100+ years. During
this long period of time properties have to be maintained, refurbished or re-
positioned.

30
2.2.2 Specific characteristics of the real estate market
Given the unique characteristics of real estate as an asset class, it follows that the real
estate market, defined as a mechanism by which real estate-related assets and ser-
vices are exchanged (JAFFE / SIRMANS, 1995) - possesses special characteristics in com-
parison to markets for other goods. The specific features of the real estate market
manifest themselves through the creation of sub-markets, the dependence of and in-
teraction with upstream and downstream markets, intransparency and government
influence (SCHULTE / VOGLER, 1998).
The real estate market is fundamentally an open, generally accessible market. At the
same time, professional development of larger schemes has certain major entry barri-
ers. In general and in terms of matured European countries, the real estate market is a
regulated and organised market to a large extent. The allocation of land is not gener-
ally left to unrestricted market forces, both by the state and in the interest of as well as
for the protection of the common welfare. The state, for instance, exerts its influence
through social and tax policy in the form of rent regulations or depreciation allow-
ances, and more directly by setting planning policy frameworks. Moreover, because of
the particular characteristics of real estate as an economic asset, the real estate mar-
ket deviates clearly from the ideal of a perfect market. The most prominent character-
istic in this context is the fact that real estate is tied to its location and the immobility
that this entails. In addition to being clearly associated with a specific location, real es-
tate is also limited in terms of territory. Thus the catchment area of a property is lim-
ited and not fungible. It follows from this that real estate can, in principle, not be du-
plicated and is differentiated essentially by location, size, use and architectural design
(BONE-WINKEL, 1994). In this imperfect market, tenant and landlord or buyer and seller
respectively do not possess complete information about all transactions (leases and
sales respectively). Generally, the market participants only have access to limited com-
parables from sales transactions, which circumstance makes the valuation of real es-
tate more difficult. The real estate market thus regularly shows a lack of transparency
and complexity and, in part, inefficiency, since the prices do not fully and immediately
reflect all facts that constitute drivers of value. It is not possible, on the one hand, to
immediately validate current pricing, while it is made significantly more difficult, on
the other hand, to ascertain the comparability of the observed (lease and sales) prices.

31
Regular information bottlenecks and the limited individual possibilities of obtaining,
processing and disseminating information interfere with the decisions of the market
participants as well as communication between the individual market segments.
The cyclical nature of real estate markets requires strategic planning and sound market
analysis. Risk management should be on a development organisation’s radar during all
phases of the market cycle. Because of the comparably long development phase of
schemes, there is always a realistic possibility that the completed real estate product
will be delivered to the (tenancy and investment) market in a changing phase within
the cycle. Analysing and planning for the different phases within the cycle is therefore
a key activity and risk management tool for developers. It is beyond the scope of this
dissertation to examine the variables that drive real estate prices but it is necessary to
note that real estate markets have always been characterized by cyclical market fluc-
tuations.
2.3 Types of real estate developers
There are many types of developers and an all-encompassing definition is thus hard to
present (RATCLIFFE / STUBBS / KEEPING, 2009; NEARY, 2009; NOZEMAN / DORENBOS, 2006). De-
velopers may have an independent background but are also often affiliated to financial
or construction mother organisations.
Developers may be classified by their strategic capital role, geographic scope, owner-
ship structure, and product type. These structural characteristics are expected to have
an impact on the complexity of risks which would affect the organisation and therefore
impinge on the risk management approach. Since no previous empirical research has
been conducted on this aspect of risk management in development it is felt that some
exploratory research is useful in this respect (chapter 3.4.7).
Essentially, real estate developers operate as either trader or investor developers
(WILKINSON / REED, 2008). In addition to both types, SCHULTE / BONE-WINKEL / ROTTKE
(2002) distinguish a third category, namely the service developer. In this context
MORLEY (2002) notes that different developer types might follow different objectives
and also show different risk profiles, which at the same time could have an influence
on the risk management approach.

32
Figure 2-1: Types of real estate developers
Trader-developers typically assume the entire risk until completion of the relevant
property, which is then sold together with the land (property and land may even be
sold in an earlier development phase in way of forward sales). Their primary corporate
goal focuses on exploiting the profit margins throughout the various phases both be-
fore and after the actual construction work in the form of development gains. At the
end of the development, the trader developer typically decides to sell the property to
an investor.
Investor-developers carry out projects to establish a portfolio or for use as owner-
occupiers (ISENHÖFER / VÄTH, 1998) and are responsible for the entire project, from its
inception to its completion, and then transfer the real estate into their own portfolio.
By combining property development with portfolio investment activities, organisation
management can use the steady cash flow from investment properties to finance de-
velopments even in times when capital markets are generally not focused on real es-
tate projects or the specific project does not match the financing partner criteria. Thus
investor-developers do - in addition to development profits - capitalise on capital ap-
preciation.
Investor-developers and trader-developers share many characteristics. However, as
the time of project exit shifts (i.e. the point in time when the developer has divested all

33
its interest in the assets, and only post-contractual obligations may exist), the objec-
tives may differ. (SCHULTE / BONE-WINKEL / ROTTKE, 2002). WILKINSON / REED (2008) state
that trader-developers may evolve to a investor-developer profile over time, once
profits from trading are available to be retained in completed real estate schemes for
the own portfolio.
Service developers render specific real estate development services as a service pro-
vider for third parties in the name and for the account of the client without assuming a
majority of risks themselves. This role is often assumed by large, mostly international
agency firms or specialist management consultancy firms. Service developers typically
focus on the process between project conception and planning stage or, respectively,
completion of the building permit process. This is often followed by coordination, pro-
ject management and coaching tasks (KALUSCHE, 2002). Financially, service developers
commit themselves to the extent that they bear the ongoing costs of preliminary ana-
lytical and planning work in connection with the relevant project. Service developers
are typically investing only very limited capital at risk into project schemes and aim to
generate fee income. Therefore they bear an operating risk role instead of a capital
risk role. The clients of service developers are usually owner-operators or investment
organisations without any particular expertise in the development field. In the event of
capacity constraints or highly complex or specialised projects, other developer types
also engage service developers for individual, clearly defined tasks. However, this type
of developer is more the exception than the rule (ISENHÖFER / VÄTH, 1998).
In addition to the principal types of developers described herein, hybrid forms also ex-
ist, with their differences not being clearly distinguishable. With regards to the geo-
graphical focus of developer´s activities, a differentiation into global, national and re-
gional scope may be taken into consideration. The product categories (residential,
commercial, special use) may serve as another classification scheme. With respect to
the ownership structure, listed and unlisted development organisations may be differ-
entiated.
In order to distinguish between different development projects, it would be advisable
or even imperative to base any such differentiation on the investment volumes
(DIEDERICHS, 1996). Typically, high-volume developments are usually associated with
longer development times, entailing greater risks and will likely have an impact on the

34
risk management strategy. In addition to the investor, upon whose requirements and
investment criteria a project should be structured, the project size must also take into
consideration the working capital, expertise, capacities and resources of the real estate
developer.
Organisational size could potentially act as a further classification aspect for develop-
ment companies. However, developers are typically not disclosing detailed information
on their organisations size, therefore information on the structure of human capital is
widely only available to a very limited degree. A reason could be that the human capi-
tal aspect is indeed one of the most valuable assets and that information on this topic
is therefore kept ‘confidential’. As a result, it is difficult to draw conclusions on differ-
ences in organisational size of development organisations. Developers typically ap-
point consultants, the number of which will depend on the developer’s ability to un-
dertake certain activities in-house and on the complexity and scale of the proposed
development. Thus, the number of senior management and staff may vary significantly
from developer to developer (MILLINGTON, 2000). Against this background, the above
mentioned criteria ‘project volume’ may serve as an adequate indicator of organisa-
tional size.
2.4 Definition of risk
The application of any risk management process requires an interpretation of ‘risk’
which varies by specific application and situational context. A discussion of the various
components of the term risk is necessary in order to pinpoint the nature of risk within
the real estate development industry.
In general, risk has a mostly negative connotation and describes the possibility of unfa-
vourable future developments. Semantic roots of the term risk are related to the Ital-
ian ‘risco’, ‘rischio’ (verb forms: ‘risicare’ and ‘ris-chare’), which emerged during the
renaissance, the Spanish ‘(ar)risco’ (verb form: ‘ariscar’) and the classical Greek word
‘rhiza’. The Italian and Spanish nouns mean ‘danger / venture’ and the verbs ‘to ven-
ture’, ‘to run the risk’. The classical Greek ‘rhiza’ is translated as ‘root / rock / obstacle’.
According to BANSE (1996) it is to be assumed that this meaning was included in the
Italian verb ‘risicare’, which is roughly translated as ‘to negotiate obstacles’. Even in
the area of macro-economic analysis, an almost exclusively negative interpretation of

35
risk as a risk of loss, and therefore a threat to one's financial situation, pervades
(AMHOF / SCHWEIZER, 2000; HOEVE / SCHWEIZER, 2001; MAYNARD, 1999; ROWE, 1977).
Accordingly, risk is generally perceived as an undesirable situation and therefore
should be avoided. However, such interpretation does not always include the insight
that the assumption of risk is an integral part of entrepreneurial action, or only notes
this fact in passing. Hence, a business activity that promises profits or other positive
effects for an enterprise is nearly always exposed to potential negative effects.
A risk definition restricted to the risk of loss therefore falls short of today's understand-
ing of a risk concept (DUNCAN, 2002). As only losses constitute a serious threat to the
continued existence of an enterprise, the risk concept is often restricted to being a
“downside risk”. The possibility of a positive discrepancy between the actual value and
the expected value (a profit, for example) can therefore be described as an opportu-
nity or upside potential (LEWIN, 2001). Accordingly, both positive and negative devia-
tions from a pre-defined objective with “(...) uncertainty of outcome, whether positive
opportunity or negative threat” (ROYAL INSTITUTION OF CHARTERED SURVEYORS, 2003) are
conceivable. HALLER (1986, p. 18) defines the risk as “(...) die Summe der Möglichkeiten,
dass sich Erwartungen des Systems Unternehmung aufgrund von Störprozessen nicht
erfüllen.” This is confirmed by VAUGHAM (1996, p. 8): “Risk is a condition in which there
is a possibility of an adverse deviation from a desired outcome that is expected or
hoped for.”
As an example of broadening the definition of risk, the Australian/ New Zealand Stan-
dard for Risk Management (AS/NZ 4360, 2004) previously defined risk as “(...) the pos-
sibility of something happening that impacts on your objectives. It is the chance to ei-
ther make a gain or a loss. It is measured in terms of likelihood and consequence”. In
2009, adopting the international framework, the revised Australian/ New Zealand
Standard for Risk Management known as AS/NZS/ISO 3100 defined risk as “the effect
of uncertainty on objectives”.
Similarly, DICKINSON (2001, p. 361) also notes “Enterprise risk is the extent to which the
outcomes from the corporate strategy of an organisation may differ from those speci-
fied in its corporate objectives, or the extent to which they fail to meet these objec-
tives.”

36
The relevant definitions imply that both positive and negative deviations from the ex-
pected outcome are conceivable. While potential negative deviations are often de-
scribed as risks in the strictest sense, the possibility of a positive or negative deviation
entails a risk in the widest sense, with the positive divergence constituting an opportu-
nity (HOMMEL / LEHMANN, 2002). A positive deviation generally consists in the over-
fulfilment of the initial expectations.
Another source of ambiguity is found in the distinction between risk and uncertainty.
With regard to real estate development, definitions and discussions about risk and un-
certainty are presented in a number of academic sources - most notably, BYRNE /
CADMAN (1984), HARGITAY / YU (1993), PELLAT (1972), WHIPPLE (1988). HARGITAY / YU (1993)
present a spectrum from certainty to total uncertainty, which is shown in Figure 2-1
below. HARGITAY / YU imply that if all future outcomes can be identified and the likeli-
hood of occurrence can be estimated then there would be no uncertainty. This per-
spective could be misleading as even if it were possible to identify all future events or
outcomes and assess their relative likelihood of occurrence, uncertainty would still ex-
ist as it is not possible to identify which of those future events or outcomes would oc-
cur. The future is always uncertain. If the future were certain there would be no risk.
Figure 2-2: The spectrum of uncertainty (after HARGITAY / YU, 1993; FISHER/ ROBSON, 2006)
Is the outcome known?
Yes No
Yes
Certainty
No
Can alternative outcomes be identified?
Can probabilities be estimated?
Yes No
Risk Partial uncertainty Total uncertainty

37
Decision-making takes place in an environment, which has three components: cer-
tainty, (partial) uncertainty and risk (NORMAN / FLANAGAN, 1993). Certainty may be de-
fined as a situation in which all relevant factors can be exactly specified and known by
the decision-maker. If probabilities may be estimated then risk exists rather than un-
certainty (FISHER / ROBSON, 2006). BYRNE (1996) and WIEDENMANN (2005) define risk as a
term appropriate for situations where it is possible to define probability distributions
for probable outcomes, whereas uncertainty is a term that better suits situations
where such probability distributions cannot be made. Thus, the major difference be-
tween risk and uncertainty is related to its quantification. The measure of uncertainty
refers only to the probabilities assigned to outcomes, while the measure of risk re-
quires both probabilities for outcomes and losses quantified for outcomes. The ROYAL
INSTITUTION OF CHARTERED SURVEYORS (2004, p.7) defines “Risk is the combination of the
probability of an event and its consequences”. This can be expressed by way of the fol-
lowing formula:
Risk = Probability of event x magnitude of loss / gain
From the point of view of the real estate developer, two essential missing elements of
the above definition are risk appetite and time horizon. Risk appetite is the degree of
uncertainty an enterprise is willing to accept to reach its goals, meaning the point of
balance between risk and reward at which a decision-maker feels comfortable in pur-
suit of stakeholder value (COSO, 2009). Risk appetite is a key factor in evaluating stra-
tegic options. An organisation’s appetite or tolerance for risk will vary with its strategy
as well as evolving conditions in its industry and markets and therefore it is unique to
most organisations. Hence, in connection with the decision-making process in real es-
tate development, an unfavourable development consists of the ex post realisation
that a decision failed to render the intended result. The decision itself depends on the
level of information regarding future situation, on the one hand and on specific risk
appetite on the other.
Further, there is substantial uncertainty around estimating the likelihood of occur-
rence. Figure 2-2 points out that uncertainties are derived from either outcomes which
are not identified or for which the likelihood of occurrence is unknown. These uncer-
tainties result in a decision-making process, which relies on multiple views or scenarios

38
to which the likelihood of occurrence is estimated and which occur over a predefined
time horizon. The time horizon has a significant impact on the perception of risk. In
conclusion, a definition of risk as best applied to the real estate development industry
should consist of the following components:
It takes into consideration the element of uncertainty in connection with events and
their implications;
It stresses that risk considerations must be aligned with the normative objectives of
a real estate development organisation and be in a direct relationship with the rele-
vant expectations and objectives of the organisation within a specified time horizon;
It includes the principle of materiality that is well established in the financial audit
area; and
It differentiates between negative (threat) and positive (opportunity) aspects of
risk, thereby reflecting the fundamental nature of entrepreneurial action within the
real estate development industry.
For this dissertation, the following definition shall be used for ‘risk’, which incorporates
the above components and specifically refers to the real estate development industry:
Risk is the uncertainty expressed through the significance and likelihood of events
and their outcomes that could have a material effect on the goals of a real estate
development organisation over a stated time horizon.

39
2.5 The real estate development process and related risks
Developers typically take significant risks at the various stages of the development
process (ROBSON, 2009). This section provides a thorough understanding of the nature
and processes of real estate development. Besides breaking down the real estate de-
velopment processes into ideal-typical phases by means of an event-sequence model,
the emphasis of this section is on the presentation of potential risks associated with
the various stages of the process.
2.5.1 Overview to the generic real estate development process
Real estate development is a highly complex, dynamic and multi-disciplinary endeav-
our, which would be well described in terms of its actual content by means of a proc-
ess-related perspective. GRAASKAMP (1992, p. 639) notes with regard to the fundamen-
tal significance of the real estate development process: “The development process is
our most challenging manufacturing process because its sub-systems are complex and
because it is the instrument of change which affects all of a community and a society.”
Within the context of the present study, the real estate development process as such
is based on the understanding formulated by HEALEY (1992, p. 36): “(...) the transforma-
tion of the physical form, bundle of rights, and material and symbolic value of land and
buildings from one state to another, through the effort of agents with interests and
purposes in acquiring and using resources, operating rules and applying and developing
ideas and values.”
In the case of real estate development, the process starts with the three factors of lo-
cation, project idea and capital and ends with the real estate object being ready for
occupation. Various authors take different approaches, with differing degrees of detail,
in mapping the real estate development process by defining its individual phases.
BYRNE / CADMAN (1984) for example, propose a 3-tier model, distinguishing between
‘Acquisition’, ‘Production’ and ‘Disposal’. Others such as CADMAN / TOPPING (1995); MILES
/ BERENS / WEISS (2000) or WILKINSON / REED (2008) differentiate between eight phases,
which are ‘Initiation’, ‘Evaluation’, ‘Acquisition’, ‘Design and costing’, ‘Permissions’,
‘Commitment’, ‘Implementation’, ‘Let / manage / dispose’. Despite the existence of
different process models with varying numbers of phases, however such models gen-
erally cover mostly the same tasks performed by a developer.

40
For purposes of this dissertation, the processes identified are consolidated into four
main phases, namely
Project initiation
Project conception
Project realisation / management
Project marketing / disposal
A similar phasing is presented by GEHNER (2003), WIEDENMANN (2005) and NOZEMAN
(2008). A generic flow diagram of the development process is presented in Figure 2-3.
The figure illustrates how a project passes through the various stages of its develop-
ment.
Figure 2-3: Generic real estate development process

41
Due to the differing strategic starting points the development of a process model is
necessarily an organisation-specific task. In order to arrive at an ideal-typical approach
for the process model design, the following assumes a developer who carries out all
tasks of the real estate development process (in reality, there may be market partici-
pants who specialise in certain parts of the overall development process only).
In summary, it should be noted that the complexity and dynamics of the real estate
development process might be reflected in ideal-typical form by means of phase mod-
els. Nonetheless, it must be conceded that, in reality, the individual phases do not al-
ways take place in the sequence stated. In fact, real-life projects are generally charac-
terised by overlaps, parallel operations and feedback effects, which cannot be mapped
to a sufficient degree using phase models (ISAAC / O'LEARY / DALEY, 2010). A good exam-
ple is project marketing whose tools can (or should) be used in an early phase of the
real estate development process, as the conclusion of lease agreements at an early
project stage will reduce risk and promote the project success or the saleability of the
project to investors (WIEGELMANN, 2012).
2.5.2 Project initiation
The initiation phase commences the development process. A main expertise of a de-
velopment organisation is to identify the future demand on space market to create
and provide an adequate supply and thereby to create value (GEHNER, 2008). Creativity
and drive are essential for a projects’ success. Generating ideas within the framework
of project initiation can, in principle, be divided into a level of factual analysis and sec-
ondly a level of inspiration and vision (NELL / EMENLAUER, 2002).
Accordingly, the starting situation (cf. Figure 2-4) for a development may either be
an existing plot of land, for which a use / project concept must be found and financ-
ing required;
a project idea for which a suitable location must be procured respectively capital in
search;
the availability of capital seeking investment in a real estate project and thus a
property / micro location and project idea / project concept.

42
Figure 2-4: Conceivable starting-points for a real estate development (SCHULTE / BONE-WINKEL / ROTTKE,
2002, p. 32)
Accurate and pre-planned ‘timing‘ is a critical success factor in this context. This de-
pends on the one hand on project-specific market conditions (tenant and transaction
market) and the relevant market cycle and on the other hand on the availability of at-
tractive land plots. In this respect, the developer supplies entrepreneurial services to
the property market by identifying and activating market opportunities (D'ARCY /
KEOGH, 2002).
Main activities within the project initiation phase are commencing specific market re-
search to ascertain demand from potential users / tenants and potential investor pro-
files for the proposed development as well as preparing rudimentary development ap-
praisals that will comprise the design, cost and programme elements of the develop-
ment. In case of a unsatisfying outcome of the concept and its initial economics, the
project will likely not be pursued any further.
Based on a positive evaluation, the next major step is to typically obtain approval from
the developer’s senior management board and other significant stakeholders to pro-
ceed with the initial concept.
If the preliminary review is positive, the next step is to secure the required land in case
the site is not already in the developer´s possession or under exclusivity. In that case, a
strategy for identifying and securing a site of suitable size, budget and location is to be

43
elaborated. Often it is preferred by developers not to purchase the land at this stage
but ensure exclusivity with the owner(s), given that a full feasibility analysis has not yet
been completed. Option agreements or a purchase subject to conditions precedent are
possible routes to achieve this. In case the land has to be acquired with immediate ef-
fect, a developer is likely to first undertake the following phase of the development
process, the project conception phase, prior to signing a purchase agreement.
2.5.3 Project conception
The conception phase starts with the project feasibility analysis and ends in the im-
plementation decision, or in abandoning the project. This phase can be qualified as
one of the most important ones in the development process given its influence to the
decision-making of the developer (WILKINSON / REED, 2008).
Once the rough contours of the project have become visible in the preliminary acquisi-
tion review, what matters next is to outline the content of intellectual construct that
was created in the initiation phase and to document it as a detailed project concept.
This is ultimately intended to answer the question whether and in which manner the
project is capable of being realized. According to NOZEMAN (2002, p. 206) real estate
concepts “comprise a great number of elements: function(s), location, size, branch
(mix), target group(s), positioning, design, technical implementation / level of finishing,
legal structure, marketing strategy, exploitation and management model.” The term
‘feasibility analysis’ has become accepted as a general term for the many types of
analyses in advance of project implementation that are covered in this phase.
The goal of a feasibility study is to articulate a finding about the economic sustainabil-
ity (feasibility) of the project under review. “A real estate project is ‘feasible’ when the
real estate analyst determines that there is a reasonable likelihood of satisfying explicit
objectives when a selected course of action is tested for fit of a context of specific con-
straints and limited resources” (GRAASKAMP, 1972).
Prior to committing funds to a development project, a developer as well as his stake-
holders and financing partners need a confirmation that market fundamentals will
support the values assumed in the project appraisal (BARKHAM, 2002; GRISSOM, 1984).
In terms of content, the feasibility analysis is based on detailed market and location
analyses, building code reviews, design studies, use analyses, risk assessments, com-

44
petitive analyses as well as profitability calculations. Figure 2-5 shows an outline struc-
ture of the feasibility analysis. The challenge at this early and uncertain phase of the
project is finding a balance between costs (potentially sunk costs), project uncertainty
and the necessary quality and detailed specification of the usage concept.
Figure 2-5: Structure of feasibility analysis (based on ISENHÖFER, 1999, p. 66)
2.5.3.1 Market analysis
The market analysis concerns itself with the supply and demand situation in the short
to medium term. It identifies the specific market segment (in terms of use and location
- geographical and technical sub-markets) applicable to the project. The main criteria
to be considered are the requirements of potential users, how readily the project will
be absorbed by the market, and subject to the effects of this absorption, the rent and
property values applicable to the project. The market analysis should be an objective
view of the market, and allow the developer to understand the market dynamics and
review, which to its own strengths can be utilised to take advantage of those dynam-
ics.
Market- analysis
Location analysis
Project concept analysis
Risk analysis
• Quantitative analy-
sis & prognosis
of space offer- and
demand situation
• Qualitative analysis
& prognosis of
user requirements
• Rent / Yield Expec-
tations
...
Feasibility analysis
• Macro location
analysis
• Micro location
analysis
• Analysis of hard
location factors
• Analysis of soft
location factors
• …
• Initial planning
documents:
- function
- quality
- resources
• Cost analysis
• Timetable
• …
• Development risk
• Time risk
• Cost risk
• Financing risk
• Building site risk
• Approval risk
• Letting risk
• ...
Profitability analysis
Competitive analysis
Determination of relative
market position of the
existing project concept
(analysis of strengths/
weaknesses)

45
2.5.3.2 Location analysis
The analysis of the location should critically verify the findings of the inception phase
as documented in the preliminary acquisition review. The objective must be to obtain
verifiable data that can be analysed and presented in a manner to demonstrate to
third parties the planned use of the land. These analyses are concerned with the long
term-effective characteristics of micro- and macro locations. The location factors are
both easily quantifiable “hard” criteria, as well as more ‘soft‘ criteria, which will always
retain some level of subjectivity.
2.5.3.3 Project concept analysis
The building or usage concept for the use of the property must be based on the market
and location analyses (micro and macro) discussed above. It examines the architectural
and technical design of the building. Important criteria are the standard of specifica-
tions and the flexibility of the use of the building and its space efficiency. The objective
is to meet market demand while minimising cost (to build and operate) and maximis-
ing flexibility.
2.5.3.4 Competition analysis
The three above aspects of market, location and usage concept typically run parallel
and are combined as the basis of a competition analysis, comparing the market posi-
tion of the evaluated project with properties, which are or will be in direct competi-
tion. The first stage is the identification of appropriate benchmark properties. The ob-
jectives are to meet client needs while differentiating the development as much as
possible from competitors. However, the weighting of criteria will always retain an
element of subjectivity, which leads to residual risk.
2.5.3.5 Risk analysis
While risks are present at all stages of property development, the feasibility analysis
offers the opportunity to analyse them at a preliminary stage and review their impact
prior to commitment of capital, as well as documenting and trying to mitigate such
identified risks during later implementation.

46
To some extent, the progress of a development project through the phases of devel-
opment has a general impact on its risk levels.
In its early stages of the development process, the initiation phase is characterised by a
high degree of uncertainty and, in particular, creative and complex search and analysis
procedures. At the end of this phase, success potentials and competitive advantages of
real estate projects are identified and the project fundamentals defined.
The project-specific manoeuvrability, i.e. the scope for structuring architectural, tech-
nical, economic and legal aspects, mostly decreases the further the development ad-
vances. As a project progresses, types and extent of risks may change; new risks may
emerge and existing risks may change in their importance (RAHMAN / KUMARASWAMY,
2002). Of particular importance is the relationship between time and flexibility (BYRNE /
CADMAN, 1996) note: “As the process takes place, the developer's knowledge of the
likely outcome increases but, at the same time, the room for manoeuvre decreases.
Thus, while at the start of the process developers have maximum uncertainty and ma-
noeuvrability, at the end they know all but can do nothing to change their product
which has been manufactured on an essentially once and for all basis”. Risk manage-
ment should therefore be a continuing activity throughout duration of the project.
Furthermore, although the overall complexity of the project decreases during the
stages of the development process, the ability to influence the project - especially with
respect to the commitment of capital or tied-up costs - declines (FISHER / ROBSON, 2006;
LONG, 2011). A high level of uncertainty occurs in the early stages of a project, which is
also when business decisions of major impact for the success of a project are made. It
is therefore imperative that potential risks are identified, assessed and allowed for at
the outset of any project.
The developer should consider the risks to the project, attempt to quantify them
within the feasibility analysis and potentially adjust the project so as to minimise them,
where possible.

47
Figure 2-6: The developer’s decreasing ability to influence total cost over the life of the project (based
on ISENHÖFER / VÄTH 1998, p. 175)
Development risk
Development risk is defined as the risk that the leasing or sale of the project will gen-
erate insufficient returns to cover cost and create the desired return due to a lack of
sales or inadequately meeting the needs of the market in terms of type and location.
The more unusual a particular type of project is for the developer, the higher the
chance that the developer will misread the market and the higher the development
risk.
Forecasting and planning risk are also part of risk management. The former describes
the risk that forecast data used for the evaluation of a project is proven incorrect in
relation to the actual outcomes. Planning risk is caused due to sunk costs that need to
be borne when a project is aborted during the planning phases. As mentioned above,
this should be minimised by appropriate project reviews prior to engagement of exter-
nal service providers. However, even internal costs as well as the opportunity cost of
using internal resources lead to an ever present planning risk. Some ways to mitigate
development risk inter alia include a sound and realistic evaluation of the developer’s
own abilities, the selection of qualified and experienced external suppliers and part-
Project-
initiation
Project-
conception
Project realisation/
management
Project-
Marketing/ disposal Usage
Time
Costs
Cost trend
Start of construction Completion
Planning costs
Planning costs
Cost
of
lan
d
Con
stru
ctio
n co
sts
/ Fin
ancing
cos
ts, e
tc.
Usage costs
Manouverability

48
ners, a systematic and comprehensive feasibility analysis, a timely start to the market-
ing of the project and potentially the sharing of risks through the formation of strategic
alliances.
Time risk
In general, exceeding the planned project time line leads to two main risks: cost of
capital such as interest increases with delays reducing project returns, and market
conditions change over time reducing the reliability of forecast data. This is especially
relevant as usually top of the market conditions trigger developers to pursue marginal
opportunities. As markets turn and consolidate, delays in the completion of such pro-
jects aggravate losses.
The time risk can be addressed by professional best practice project management in-
cluding clear documentation, co-ordination and communication between project par-
ties, selection of experienced and qualified external suppliers, and timely commence-
ment of marketing. An overall understanding of market forces and dynamics is critical.
Cost risk
The cost risk is closely related to time risk, as the time needed for real estate develop-
ment enables cost factors to vary and reduces the reliability of cost forecasts on which
the feasibility analysis is based. This means that all the above risk categories also affect
the cost risk. Professional project management, in line with corporate best practise, is
especially important for effective cost control.
Financing risk
Typically, developers have to obtain appropriate financing schemes at favourable
terms, which shall cover the entire length of the development (WILKINSON / REED, 2008).
Thus financing partners and financing conditions are crucial. Often, developers seek to
obtain a ‘forward funding‘ of a project. In a nutshell, the developer agrees to sell the
development on completion to an investor who provides financing during the devel-
opment process.
Interest rates and financing conditions affect developers both directly and indirectly:
as few projects are entirely equity financed, the availability and cost of debt financing
affects the overall return and feasibility (also see chapter 5 on current financing envi-
ronment). Increasing interest rates also increase the expected yield of investment,

49
thus reducing the sale value of the project at the same level of rental income. Both fac-
tors combine to make the feasibility of a project highly sensitive to increasing interest
rates.
Also, time and finance risk are driven by related factors, so delays in the timely imple-
mentation of the project will also increase the financing risk as interest rates may go
up during that period and the additional time needed to completion will add interest
cost on the debt financing required.
To reduce financing risk, it is advisable to avoid financial commitment to a project prior
to completion of the final feasibility analysis and making a decision to implement. The
form of financing should also be considered: interest rates may be hedged, and devel-
opers may use strategic alliances introducing joint venture and mezzanine finance,
thus reducing the need for outright loan financing.
It should also be considered that there are significant differences between a develop-
ment financing and a long term financing for a developed and leased property. The
lender can only base its risk assessment (and therefore interest rate risk premium de-
manded) on forecast and projected data, as well as general view on the developer’s
capital resources and professional competence. In order to secure financing at afford-
able rates, it is therefore imperative to perform, document and present the prelimi-
nary and feasibility analyses in a format useful to potential lenders.
Building site risk
This is the risk that the selected site is unsuitable, or needs to be modified at cost to
become suitable, for the intended use due to environmental issues (such as contami-
nation) or its natural characteristics (stability, water levels, subsidence etc.).To mini-
mise these risks appropriate external technical and engineering due diligence is to be
sought and acquisition contracts drafted so as to retain a right of redress if the site
does not meet expected and agreed criteria. Further, risks on the construction site,
which comprise safety of employees, contractors and visitors as well as to assets,
should be minimised with appropriate workplace health and safety practises, regulated
areas, and use of corporate best practise for safety on construction sites.

50
Approval risk
All development is subject to planning, and while developers in general apply for per-
missions that are in line with official planning rules and development plans, the multi-
tude of affected stakeholder interests can lead to specific conditions that affect the
cost and feasibility of a project. Also, delays in the planning approval process increase
the above mentioned time risk. The approval process should be project managed pro-
fessionally to minimise this risk. Potentially ‘soft‘ factors such as early communication
with other stakeholders and the projection of a positive organisation image can be
helpful. Depending on the size and complexity of the development, developers will
consider whether it is appropriate to approach the planning authorities for their initial
view on the proposed development. Involved architects and planning consultants typi-
cally take a lead function when liaising with the planning authorities.
2.5.3.6 Profitability analysis
Combining the results of the five analyses above (market, location, project concept,
risk and competitive analysis), the developer needs to calculate a detailed profitability
analysis showing appropriate sensitivities for the risks identified.
As to WILKINSON / REED (2008), the profitability of a real estate development project
with an already fixed land purchase price is mostly affected by short-term interest
rates, building cost, rental values and investment yield. Rental values are largely de-
termined by the demand for and supply of space, whereas the investment yield is
driven by capital market perceptions of real estate as an investment asset in general
and the evaluation of the specific project concerned. The maturity and liquidity of real
estate markets is a key factor for investors to correctly prize markets and projects.
The profitability analysis should use clearly defined quantitative measures of a pro-
ject’s robustness and return, such as net operating income to cover debt service, oper-
ating costs (i.e. break-even test), net cash flow after debt service to provide adequate
risk adjusted returns on equity, net present value of returns to exceed project cost,
and net present value analysis to cover construction, absorption and operations peri-
ods.
Figure 2-7 graphically illustrates the possible outcomes of a development project, plot-
ting the expected market value and depreciated replacement value respectively over

51
the project phases for best, base and worst-case scenarios. The value in use assumes a
completion of the project and thus smoothes out differences between phases.
Figure 2-7: Potential valuation throughout the development process (ISENHÖFER / VÄTH, 1998, p. 182)
2.5.3.7 Concluding the feasibility analysis
Having assembled the above data and analysed it based on appropriate assumptions,
the results need to be presented and the developer will make a decision whether to
proceed with the project. Progressing the feasibility analysis and making the project
more concrete involves more effort and cost than optimal in case the project. The risk
of sunk costs is ever present, but the level of detail required before a decision can be
made should be obtained at reasonable cost, both internal and external. In the frame-
work of the project initiation, it is the objective to answer the question in which man-
ner and in what time the factors location, project idea and capital can be combined
against the background of the strategy concept in order to produce a property that is
competitive and acceptable in macro-economic terms. MILES / HANEY / BERENS (1995,
p.4) have described this relationship as follows: “Land, labour, capital, management,
and entrepreneurship are needed to transform an idea into reality.” In case the project
concept phase did not indicate that the developer’s business requirements and objec-
tives could be met, the project will likely be aborted. In the case of a satisfying out-
come and outlook, the phase of project realization / management will be entered.

52
2.5.4 Project realisation / management
The confirmation of the project's potential for success by the feasibility analysis trig-
gers the initiation of negotiation and decision in the realisation phase. At this point, at
the very latest, the other parties to the project enter into the development process.
These include the property owners, architects and engineers, building authorities and
other representatives of the public interest, construction contractors, financial institu-
tions, user groups, special service providers to the real estate industry (project manag-
ers, consultants, brokers, etc.) and - unless this is a development for own use - inves-
tors.
While the decision to realize the project was only provisional until that time, it can ul-
timately be made only with the final issuance of the building permit and subject to the
presumption that the other negotiations have reached the stage where they meet a
certain level of requirements as stipulated by the developer, for instance with respect
to financing commitments, leasing status and construction service contracts awarded.
The acquisition is made in the project realisation phase by means of a binding right of
purchase or the actual acquisition of the property to be developed. Finalising the pur-
chase can present unexpected difficulties and changes compared to the feasibility
study base case as time has passed and stakeholder expectations are evolving. The
price offered and agreed should be within the forecast parameters. Legal documents
should be subject to appropriate due diligence and mitigation of execution risks. Gen-
eral risks that can occur during this phase include title issues which may not be satis-
factorily resolved, inability to reach agreement on purchase / sale terms or inability to
achieve a favourable quality of purchase agreement, purchase / sale terms which are
less favourable than market comparables, as well as after purchase / sale additional
issues that should have been discovered during entitlement and due diligence process.
Another goal of preparing a more detailed usage concept is the definition of an opti-
mal user mix on the basis of the feasibility study, which typically already includes a pre-
liminary usage concept. In the sequence of the development process, this phase of the
work is either performed after the acquisition of the property and in the course of the
project planning process or - in a case of adequate or guaranteed certainty relative to
planning - already during the feasibility study.

53
Questions of building functionality, flexibility of use, building efficiency and architec-
tural design are discussed as part of the usage concept. Thus a further core task in
connection with this phase is the preparation of a planning, implementation and con-
tracting concept.
Obtaining adequate financing on competitive terms is a complex activity that requires
for specialist knowledge. The availability and cost of third party financing has a consid-
erable effect on the success of a development and the profit margin of the developer.
Depending on the intended holding period of the development project, the developer
may pay off a short term financing from the sale of the completed property in order to
realise his profit from the development process. Alternatively, the developer may wish
to hold the completed asset as investment property (or owner occupied property) and
as a result seek to place long term financing.
The (notarized) execution of the negotiated final purchase contract or all contracts re-
quired for the acquisition of the property is the basis for the closing of the legal trans-
action. Inadequate due diligence procedures create potential post-sales risks such as a
failure to properly identify environmental issues, or failure to obtain and confirm clean
title of the property. Once a transaction is closed, only limited activities along the spe-
cific reps & warranty catalogues may be taken to deal with negative aspects, which
have not been identified and adequately addressed in the context of a due diligence.
Project design
The objectives of the project design should be to balance the requirements of the in-
tended user (functionality) with construction costs and sustainable operating and facil-
ity management costs, the expertise of construction firms, planning requirements, en-
gineering considerations and aesthetic preferences in order to produce a project-
specific optimum design for the site.
Detailed plans for land, structural and capital improvements have to be prepared and
necessary permits and licences obtained.
With the intended marketing and leasing in mind, the design of the structure to be
built and / or capital improvements to be made to an existing structure (taking into
account tenant specifications) has to be completed and documented in detailed work-
ing drawings and specifications. The feasibility analysis should be kept updated with

54
the approved development / capital improvement plans, intelligence on competitor
activities, engineering analyses, regulatory requirements, detailed land development,
architectural and capital improvement plans and drawings for project, project budget,
and approved building permits.
A significant risk is that the project design does not meet market needs and results in
lower than anticipated rents or sales proceeds. Also, the initial project design may not
address all regulatory issues. Costs to comply with regulatory requirements may re-
duce projected margin or return.
Procurement
One of the main procurement tasks of the real estate developer is to obtain a building
permit within the schedule and on the basis of the previously developed usage type.
The usual risk during this stage is that bids from vendors / contractors require more
time and / or money than originally anticipated in the feasibility study, and that satis-
factory vendors / contractors cannot be identified. Vendor/ contractor negotiations
may result in substantial revisions to project design.
Construction
The construction phase starts with the granting of the building permit and the aim is
the completion of the project within the planned framework of schedules, costs and
quality. Once all necessary permits have been obtained, the developer gives the orders
to start work.
The real estate developer retains a coordination and internal reporting function. The
building owner's functions that cannot be delegated are performed within the context
of corporate management. All construction, planning and consulting contracts are en-
tered into, and project controlling / project accounting tasks are performed in this con-
text. There are further obligations to act as representative vis-à-vis all project partici-
pants and especially vis-à-vis the public during the entire development period, as well
as the task of reporting to the principal / investor or the providers of outside capital.
The high portion of outside financing makes real estate developers very susceptible to
variations in the project yield because of the leverage effect. Negative as well as posi-
tive events have an over-proportional influence on the developer's equity yield. Risks
during this phase include the weather affecting building time, the viability and reliabil-

55
ity of vendors and contractors, change in prices for materials and labour, as well as
physical characteristics of property and improvements and changes to building code,
labour laws and regulations driving time and cost changes. The availability of financing
depends on credit market conditions, economic conditions and industry trends, which
are affecting construction prices, availability and letting prospects. Even changes in
such inconspicuous items as accounting rules may result in differences to forecasted (if
not underlying commercial) profit and affect investors’ and lenders’ perception. Failure
to meet construction deadlines will result in penalties, and inadequate procurement
process may lead to excessive costs, as would poor construction management over-
sight.
The marketing of the project via leasing or sale can begin at any time in the process,
but is likely to occur towards the end or after completion. This is however, a market
driven and asset type related decision. Typically it is the objective of the trader devel-
oper to market as early as possible, as an early leasing or sale will reduce financing
costs and minimise the risk that specific tenants requirements necessitate late and
costly changes to design and construction. Thus, the project marketing must be a prior-
ity in the developer’s initiation / concept from the very beginning.
2.5.5 Project marketing / disposal
In real estate industry practice, distribution policy is often characterized by specific
forms of in-house and third party sales. Specialized forms, such as the sale of shares in
open-ended or closed real estate funds will not be more closely considered at this
point. As the completion of the construction project approaches, activities shift in-
creasingly in favour of project marketing, while some individual marketing tasks have
already proceeded in parallel with the entire development process. The tasks associ-
ated with marketing can be assigned to third parties, i.e. brokerage organisations.
Since the long-term success of the property is very strongly dependant on an effective
leasing strategy in general and on finding an appropriate mix of tenants in particular,
many developers retain marketing in house.
The focus is therefore on developing and safeguarding a ‘unique selling proposition‘
(USP), which endows the project with advantages or benefits in the eyes of later users

56
or investors compared to competing projects or properties, and in this way introduces
important determinants of competition in addition to price.
A generally applicable incorporation of the leasing performance phase into the devel-
opment process is not possible and not required. Leasing activities commence with the
initial contacts with users. The earlier leasing takes place, the greater will be the (fi-
nancial) security of the entire development project.
Marketing and prospecting aim to provide promotional materials and information to
prospects and enable to identify tenants to lease the property.
As part of this task it is necessary to plan and budget a detailed marketing, advertising,
and promotion program. Cooperative agreements with brokers need to be developed
and managed, and leasing staff and internal procedures have to be in compliance with
government regulations. After initially providing promotional materials to prospective
tenants, it is necessary to collect their data and conduct follow-up contacts.
Significant risks relate to the effectiveness of marketing: advertisements may not be
placed effectively and may be unable to reach its target market, the advertising may
be excessive and not cost effective, advertisements and promotional materials may be
visually unappealing, and promotional materials may not contain sufficient information
to satisfy prospective tenant’s questions.
Lease negotiation and execution involves the screening of prospective tenants, and
negotiating, preparing, and executing lease agreements, thus allowing the property to
be leased at the highest possible rent to tenants with low credit risk. Ideally, the qual-
ity of the tenant will enhance the value of the location.
Key performance indicators to evaluate the effectiveness of the leasing process are
brokerage expense as a percentage of annual rental income, advertising money spent
per prospect or advertising money spent per square meter leased. A comparison of
budgeted rent to actual rent should be made throughout the leasing process, and the
occupancy rate should be monitored. Other data to be collected and analysed includes
leasing and marketing expense as per cent of revenue, and average free rent (or con-
cessions) on new leases.
Significant risks of the leasing process are that not sufficient tenants are attracted to
the development. In a bid to achieve full occupancy, larger incentives may have to be

57
provided to tenants and sub-optimal contracts are signed, ultimately resulting in lower
returns. Insufficient occupancy may be because contracts cannot be executed due to
qualification issues, or tenants decide not to lease space due to market reasons or as-
set type. Further, sub-optimal contracts arise if lease agreements are not prepared in
accordance with legal requirements, clauses in lease agreements are vague and cause
misunderstandings, and uncompetitive lease terms are granted because of a lack of
market knowledge or negotiation skills. There is a significant risk that a tenant can
terminate a legally faulty agreement prematurely, especially after market rents have
declined, forcing the owner to seek a new tenant in adverse market conditions. Other
risks include the possibility of breaching laws if leasing agents do not produce suffi-
cient documentation to comply with laws of equity. Finally, a less quantifiable risk is to
generate an unattractive tenant mix, which affects the perceived popularity of the pro-
ject and negatively affects long term rent levels achievable by the property.
The development process ends with the completion, handover for use and / or dis-
posal of the project. In the event that the project is not intended for sale, it is trans-
ferred into the developer's own holdings. From the perspective of the property life cy-
cle, this initiates the property and asset management phase, which extends until the
redevelopment of the property. The timing of the property sale is dependent on the
exit strategy of the project sponsors. Accordingly, it is not possible to assign a generally
applicable place within the overall development process to this stage in the value-
added chain. Risks related to exit can be caused by a failure to exit at the right time.
Capital tied up in excess / underutilized real estate undermines returns and prevents it
being recycled into higher yielding projects. Also, if the selected exit strategy does not
correctly reflect market conditions, it will not maximize return. Limited access to capi-
tal markets (e.g. IPO, securitization) may negatively affect returns and prevent exits
altogether. If the developer is unable to manage flow of information to prospective
purchasers, or has insufficient contact management, the selection of potential pur-
chasers will be sub-optimal and potentially lead to lower than possible sales prices be-
ing achieved. There are also execution risks in the form of inadequate due diligence
procedures (post-sales risk) and mismanagement of the closing process. Both can
cause uncertainty, delays and financial loss. An insufficient executive approval process
shows the failure of internal risk management.

58
2.6 Concluding remarks
The concept of risk from the perspective of real estate development comprises four
fundamental components; it carries an element of uncertainty, it affects the objectives
of the development organisation, it potentially has a material effect on the organisa-
tion and it is viewed not only as a threat but also as an opportunity thereby reflecting
the entrepreneurial nature of the industry. The identification of risks involves identify-
ing those incidents occurring internally and externally that could affect the strategy
and achievability of the objectives of the development organisation. The multi dimen-
sional study of risks provides the criteria by which to analyse risks in the real estate
development sector. The characteristics of real estate development can be divided into
those that are unique, those that are generic and those that are specific. Real estate
development is unique in that it is inherently risky; it is tied to its location, is heteroge-
neous, scarce and has limited substitutability. The generic characteristics of real estate
development are that it is complex, dynamic and is a multi-disciplinary challenge. The
duration and complexity involves time to complete a project and a lack of flexibility to
react to changes in demand. Furthermore acquisition and contracting requires consid-
erable investment, which usually is also provided by external sources. The long life cy-
cle means that refurbishment and repositioning are required at specific points in the
lifespan of the asset. The specific characteristics encompass the existence of sub mar-
kets, the dependency of and interrelation with upstream and downstream markets,
intransparency and government influence. The study of risk from the perspective of
the developer has given a clear insight into the research question, which this chapter
addressed:
1 What are the characteristics, key business processes and associated key risks of
real estate development?
Due to the complex and unique nature of real estate development, event-sequence
modelling of the development process provides a clear understanding of the different
process stages. During each stage of a real estate development - project initiation
phase, project conception, project realisation and management, and project marketing
and disposal - a range of process specific areas of risk has been identified which could
materialise, leaving a significant to high impact on the outcome of the project.

59
3 Risk management in real estate development
Chapter three examines the academic and applied considerations which underlie the
risk management aspect of this dissertation and provides insight into the following re-
lated research question:
2 What are key principles and process-related aspects of risk management ac-
cording to relevant areas of literature?
In this context, definitions, fundamental characteristics and approaches of risk man-
agement are explained, utilising existing concepts. The generic risk management proc-
esses described in existing risk management standards such as COSO and the UK risk
Management Standard are being considered to provide a foundation for devising a
model to be discussed in the context of the real estate development industry. The
common core elements in the generic processes are identified and combined with
academic research on the risk management process in order to arrive at a simple
model for application in the real estate development industry. The relevant fields of
literature relating to this question are presented and reviewed and a criterion for ef-
fective risk management is established. The examination is performed with a focus on
risk management as part of general management theory, drawing upon and applying it
to the real estate development industry as appropriate. This is followed by establishing
eight propositions on how real estate developers practice risk management, which are
to be tested by empirical research in the following chapters. In this context, insights
are drawn from previous research and other literature conducted in this area and oth-
ers are based on the author’s working experience in the real estate development sec-
tor.
3.1 Definition of risk management
Risk management is a rapidly developing discipline and there are many and varied
views and descriptions of what risk management involves, how it should be conducted
and what it is for. The handling of risk has been an issue from time immemorial. While
the role of a risk manager has been described as one of the very first challenges faced
by mankind, risk management as a business concept and strategy emerged during the

60
course of the economic developments of the 19th century. BERNSTEIN (1996, p. 3) de-
scribes risk appetite and management as the key to economic prosperity as follows:
“The capacity to manage risk, and with it the appetite to take risk and make forward-
looking choices, are key elements of the energy that drives the economic system for-
ward.”
As with the definition of risk, there are equally various definitions of risk management
in use (MAIER, 2004). LASTER (1999b, p. 15) noted that: “Since the whole idea of a pro-
fessional risk management is fairly recent, there are many different definitions of just
what management is.”
If management is understood, as per ULRICH / DYLLICK / PROBST (1984), as a task encom-
passing the structure, control and development of social, purpose-oriented systems,
risk management should be perceived as a discipline that addresses the systematic and
successful handling of risks arising within an organisation. HOEVE / SCHWEIZER (2001)
state that an ‘enterprise-wide’ or ‘integrated risk management’ is the most compre-
hensive and consistent form of risk management which links the risk management
process in all areas of the organisation with its strategy and ongoing planning, control
and other corporate processes. DICKINSON (2001, p. 360) further defines the enterprise
risk management as: “(…).a systematic and integrated approach to the management of
the total risk that a company faces.” The essence of an integrated risk management
according to DOWD (1998, p. 230) is the “(...) management of overall institutional risk
across all risk categories and business units”.
The aim of risk management is to improve the risk situation of an enterprise to achieve
a higher level of corporate security, thereby supporting value and success-oriented
corporate governance. For PEZIER (2002), risk management is to be regarded as an inte-
gral part of good management. It is therefore the task of risk management to continu-
ously provide management with the best possible information, systems and proce-
dures to form a solid foundation for the risk decision-making process regarding uncer-
tainties and / or potential opportunities and risks. This includes, in particular, informa-
tion that is relevant for executive decisions as well as information regarding factors
which have an impact on risk and, their possible implications and which strategies and
options the management can resort to when handling risks. However, the objective of
corporate risk management cannot be the minimisation of all risks. Rather, given the

61
fact that entrepreneurial action is always associated with the assumption of risks, the
goal must be to attain a well-balanced situation between risks and expected returns
(risk / reward), taking into consideration the comparative advantages of the enterprise
and the risk appetite of the decision-makers. Thus, the management of risks must be
based on the top corporate objectives and results in the management being perma-
nently faced with considerations regarding opportunities and risks. Risk management
must enable the organisation’s management to actively influence the corporate risk as
an additional operational parameter in order to reflect the pre-set corporate objec-
tives and the risk policy requirements.
This dissertation is based on a risk management understanding in accordance with
DELOACH (2000).
Risk management is a structured and disciplined approach that aligns strategy,
processes, people, technology and knowledge with the purpose of evaluating and
managing the uncertainties a real estate development organisation faces as it cre-
ates value.
This definition reflects certain fundamental ideas, namely that risk management is
a systematic process;
an ongoing challenge;
applied in strategy formulation;
aligned with the real estate development organisation's specific risk appetite;
applied across the whole real estate development organisation, involving every unit
and level;
designed in order to identify events potentially affecting the real estate develop-
ment organisation; and
intended to preserve value and allow value to be created.

62
3.2 Benefits of an effective risk management system
An effective risk management system should potentially benefit the organisation in a
number of ways (JORION, 2001; MEULBROEK, 2001). These have been divided into internal
and external benefits for discussion below.
The most obvious of the internal benefits are the ability to gain a much better under-
standing of the risks that are potentially facing a development organisation and its ac-
tivities and viewing risks as opportunities rather than solely as threats. Risk manage-
ment therefore shall support a sound decision-making, balancing risks and rewards
(GEHNER, 2008; PEZIER, 2002). Risk management provides valuable information for stra-
tegic planning and decision-making by the organisation and facilitates a sound identifi-
cation and assessment of risks. As a result of this, decision-makers in the development
industry are expected to make better decisions with respect to strategic and opera-
tional choices. An organisation may pursue opportunities with greater confidence
knowing that it understands the risks inherent in its development activities. At senior
management and board level both accountability for and confidence in managing risks
are increased, thereby enhancing corporate governance through oversight structure
and systematically aligning risk management activities with business strategies. This
flows through in terms of aggregating risks and opportunities for improving results,
leading to sustainable capital allocation. Finally formalized risk management proce-
dures and documentation result in the identification of opportunities to share knowl-
edge and best practice. It acts as an appropriate working tool, creating transparency
and confidence in the organisation's business processes.The external benefits encom-
pass the areas capital raising, insurance and meeting regulatory requirements. Formal-
ised risk management processes are important when raising capital from banks and
other capital partners or in order to demonstrate to the public the credit worthiness in
connection with the handling of risk. With regard to buying insurance solutions, the
organisation benefits from the possibility of risk-adjusted insurance premiums with
corresponding surplus sharing if there is evidence of a well-developed risk manage-
ment culture within the organisation. A documented risk management system facili-
tates the documentation of compliance with statutory requirements in the areas of
product liability, occupational safety and data protection. Thus, effective risk manage-
ment supports increasingly demanding investor’s and regulator’s requirements.

63
3.3 Risk management process
A risk management process is comprised of all organisational rules and procedures for
the identification, analysis, assessment and control of all potential risks as well as the
control and supervision of the profitability and efficiency of any measures taken. Risk
management practices vary greatly and the process itself has meant different things to
different people. As a result, risk management operations run the risk of being frag-
mented and lack central visibility and overview.
In its practical implementation, a risk management system requires a clearly defined
risk policy, a uniform risk terminology, a uniform risk management process, standard-
ised tools and an appropriate risk management organisation. To this end, various risk
management bodies have provided risk management frameworks to provide the struc-
tured generic guidance to help enterprise to enhance their risk management efforts
and to better deal with risks in achieving their objectives. These standards enable or-
ganisations to compare their own risk management procedures against best practice
and what is regarded as acceptable by other organisations.
Recent risk management standards and guidelines include inter alia: the risk manage-
ment standards of the Canadian Standards Association (1997), the Standards Austra-
lian and Standards New Zealand (2004) or the Federation of European risk Manage-
ment Associations (2002). The International Organization for Standardization (ISO) has
published the so-called ISO 31000: “Risk Management – Principles and Guidelines”. All
these standards are similar with regard to the generic process of risk management. In
addition, the Practice Standard for Project Risk Management (2009) published by the
Project Management Institute provides benchmark for project management profes-
sionals for single projects.
Two important risk management standards frequently used in Europe are The Commit-
tee of Sponsoring Organisations of the Treadway Commission (known as COSO) ‘Enter-
prise Risk Management (ERM) – Integrated Framework‘ published in 2004 and the ‘Risk
Management Standard‘‘, published in the United Kingdom in 2002. These two stan-
dards will be presented in further detail in this dissertation. The COSO standard is a
comprehensive guide to effective ERM, which is defined by COSO (2004, executive
summary, p.4) as:

64
“Enterprise risk management is a process, effected by an entity’s board of directors,
management and other personnel, applied in strategy setting and across the enter-
prise, designed to identify potential events that may affect the entity, and manage risk
to be within its risk appetite, to provide reasonable assurance regarding the achieve-
ment of entity objectives.”
It covers all aspects of ERM including definitions, language, roles and responsibilities
within the organisation, criteria for determining risk management effectiveness and
provides detailed guidance. The COSO standard also provides examples of approaches
used by various risk management practitioners.
The framework considers objectives at the various corporate levels in four categories:
strategic, operations, reporting and compliance. In parallel, it focuses on eight interre-
lated components of the risk management process as shown in the diagram below:
Figure 3-1: Key elements of enterprise risk management (COSO, 2004, exhibit 1)

65
The UK Risk Management Standard is the result of a joint effort by AIRMIC (the private
sector risk management association) and ALARM (the public sector risk management
association) and IRM (the profession's educational body). The intention of the stan-
dard was fourfold: to provide agreed terminology, process, organisational structure
and objective for risk management.
The purpose was to develop a practical standard which was not rigid but instead set
out the principles to be followed. Risk was defined using ISO/IEC guide 73 which en-
compasses both the upside as well as downside. The standard sees risk management
as an ongoing process, which is core to both strategic management and organisation’s
culture. The standard outlines the strategic process, starting with an organisation's ob-
jectives through to the identification, evaluation, mitigation and transfer of risk.
Figure 3-2: The Risk Management Process (IRM / AIRMIC / ALARM)
It is beyond the scope of this dissertation to conduct an in-depth study and comparison
of the various aspects of these standards. However, for the purpose of this disserta-
tion, the standards provide a sound basis for reviewing the various stages of a system-
atic risk management process, which has been identified as one of the fundamental
elements of risk management. In general, each risk management framework consti-
tutes a permanent, dynamic and systematic process in the sense of a control loop, with

66
the risk management process essentially consisting of four phases, namely identifica-
tion, assessment, control and documentation (or monitoring). Although each individual
framework has these four core areas in common, the terminologies, components and
complexities of the control loop vary. The risk identification process is to identify pos-
sible risks which may affect, either negatively or positively, the objectives of the busi-
ness and the activity under analysis. Risk assessment is defined as the overall process
of risk analysis and risk evaluation (ISO/IEC Guide 73) and will help in determining
which risks have a greater consequence and impact than others as well as the prob-
ability of the event occurring. This is followed by the risk control phase, which evalu-
ates whether the level of risk found during the assessment process requires manage-
ment attention. Risk monitoring is the periodic tracking of risks and reviews the effec-
tiveness of the treatment plan.
This approach has been widely used by many academic researchers such as HALLER
(1986) and WIEDENMANN (2005) and will be further examined below from the perspec-
tive of the real estate development industry.
Figure 3-3: Risk management process in the real estate development industry (based on HALLER ,1986,
pp. 25 and 27 and WIEDENMANN, 2005, p. 24)
The safeguarding of corporate objectives; output-related, financial as well as social en-
compasses all areas of the risk management process. All development risk manage-
ment begins with the assessment of the corporate appetite and capacity for risk fol-

67
lowed by the four core risk management activities, namely risk identification, risk as-
sessment, risk control and risk monitoring. These are discussed below.
3.3.1 Strategic objectives and risk appetite
The fundamentals of risk management must be formulated in the form of a risk policy,
which is considered part of the general business policy (KNIGHT / PRETTY, 2001). The risk
policy focuses on safeguarding the corporate objectives, particularly regarding the con-
tinuation of a company as a going concern. While the practical implementation can
take on very different forms, it is possible to summarize some characteristics of an or-
ganisation's risk policy:
it constitutes a 'system of policy decisions' for the purpose of guiding operating ac-
tivities with respect to the problem of risk;
as a specific segment of general corporate policy, risk policy articulates the organi-
sation's fundamental approach to risk, security and control;
risk policy sets the principal direction intended to serve as the established objective
for any risk management program from a strategic perspective.
The risk strategy is therefore a key component of the overall corporate strategy and
indicates the risk / reward ratio the organisation is prepared to accept. GEHNER (2008)
points out that the acceptable level of project related risks in relation to the organisa-
tional objective of continuity (risk appetite) is that the total risk of all projects must not
jeopardize the survival of the organisation.
A common understanding of how risk and its management is to be defined in the or-
ganisation and a uniform use of language and terms are indispensable. With increasing
globalisation of real estate development organisations, a common organisational cul-
ture becomes increasingly more challenging. DORENBOS / HAGENBEEK / NOZEMAN (2007)
point out the respective idiosyncrasies of various cultures in regard to risk and note
that some corporations avoid activities with a totally different culture for this reason.
The creation of a uniform risk culture thus becomes a management task comprising
the use of common definitions, support and understanding of risk management, clear
concepts and approaches as well as all of management acting as a model. It should
also be noted that the quality of the entire risk management process depends on ap-
propriate definition and classification.

68
3.3.2 Risk identification
The primary objective of this phase is the comprehensive identification of any disrup-
tive factors and their effects within the overall context of corporate practice (HALLER,
1986; HANLEY, 2001). The categorization of risk can be used to give an insight into the
various types of risks and can also be used for structuring the identification of risk and
placing the identified risks on to the critical path of the real estate development proc-
ess (GEHNER 2008, p.30). According to ROTH / ESPERSEN (2002) such risk categorisation
achieves two important goals, namely (a) the identification of the existing risks within
an organisation and (b) the combination of risk information within one consistent ref-
erence framework, which permits the mutual understanding and monitoring of the
risks identified.
Risk categorization may differentiate, amongst others, between strategic and opera-
tional risks, output-related and financial risks, internal and external risks, individual
and aggregated risks (cf. Inter alia COSO 2004; DOHERTY, 2000; MILLER, 1992; SANTOMERO
/ OLDFIELD, 1997; VAUGHAM, 1997).
For the purpose of this dissertation, a general risk categorization as referred to by
DELOACH (2000) is favored, which differentiates risks into the following three main
categories:
i) Environmental: uncertainties affecting viability of the business model (when ex-
ternal forces affect the organization’s performance, or make its choices regarding
its strategy, operations, client relationships, organisational structure or financing
obsolete or ineffective)
ii) Process risks: uncertainties affecting the execution of the business model (arising
when internal processes do not achieve the objectives they were implemented
for)
iii) Information for decision-making risks: uncertainties over the relevance and relia-
bility of information that support value creation decisions (arising when informa-
tion used to support business decisions is incomplete, not actual, inaccurate and
not liable or also irrelevant for a decision to be made)
This categorization benefits from giving due weight to both internal and external fac-
tors and also from being integrative through its cross functionality. It also benefits

69
from being highly adaptable to change which, in times of economic uncertainty when
risk management is most important, is essential. An example of general corporate risks
classified in three categories is shown in Figure 3-4.
Figure 3-4: Generic corporate risk model (PROTIVITI, 2006, p. 54)

70
From the perspective of real estate risks, MAIER (2004) presents a risk matrix as shown
below.
Figure 3-5: Risk categories and risk types in the real estate sector, MAIER (2004)
This draws a distinction between systematic risk in general market development which
cannot be influenced and unsystematic risk in micro economic determinants which can
be directly influenced to some degree.
A further distinction is made according to their areas of origin, between existential and
financial risks. Existential risks result from the property-specific uncertainties of a real
estate investment (or enterprise) and reflect an operational uncertainty. Similar to un-
systematic risks, existential risks can be reduced through diversification. Financial risks
are independent of the individual property and originate from financial transactions
and/or strategies. A wide range of tools offered by modern financial management may
facilitate the control these risks.
• Lending value risk
• Consultancy risk
• Valuation risk
• Credit risk
• Business partner risk
• Capital structure risk
• Know-how risk
• Pricing risk
• Default risk
• Leverage risk
• Liquidity risk
• Planning risk
• Realisation risk
• Fixed-rate risk
• Interest rate risk
• Base risk
• Capital market risk
• Conversion risk
• Transfer risk
• Currency risk
• Exchange rate risk
• Interest rate risk
• Term structure exposure
• Interest volatility risk
Financial
risks
• Risk of inherited environmental
liabilities
• Structural construction risk
• Taxation risk
• Operator risk
• Land risk
• Revenue risk
• Completion risk
• Investment risk
• Cost overrun risk
• Management risk
• Market transparency risk
• Property risk
• Risk of accidental loss/destruction
• Location risk
• Environmental risk
• Depreciation risk
• Administrative risk
• Employment market risk
• Employment risk
• Income risk
• Inf lation risk
• Inf rastructure risk
• Communication risk
• Economic risk
• Culture risk
• Country risk
• Nature risk
• Regulatory risk
• Political risk
• Price risk
• Legal risk
• Socio-demographic risk
• Tax risk
Existential
risks
Unsystematic risksSystematic risksRisk-
categories

71
The effectiveness of risk identification has a marked impact on downstream manage-
ment processes. It is important to ensure that each risk is carefully defined and ex-
plained to facilitate further analysis and this is critical to successful risk management.
Only those risks that have been identified can be analysed and controlled. Errors in risk
identification only become apparent when an undetected risk becomes acute and
therefore potentially threatens the very existence of the enterprise. The challenge is to
achieve a degree of risk identification that is as comprehensive and up-to-date as pos-
sible. The risk identification process is usually both time-consuming and complex, par-
ticularly in the case of initial identification (HOBUSS, 1999).
To a certain degree, the identification of risk in real estate development is expected to
be performed intuitively and therefore based on subjective experience. The level of
knowledge, the qualifications and the experience of the personnel involved in risk
identification play a significant role within the identification process. In order to obtain
a wide variety of subjective risk identification perspectives, a diversified and robust
employment program should be in place. The risk management program should incor-
porate the subjective experiences of the specialist personnel and have an enterprise
wide input in the risk management system. This however, must be a controlled proc-
ess. According to CAREY / TURNBULL (2001), risk identification must be performed sys-
tematically and by using appropriate methods in order to increase effectiveness (also
HÖLSCHER, 1999). In this context, a close connection to the specific industry as well as
the specific situation of the individual organisation at a given key date, which forms
the starting point for risk identification purposes, is decisive (CAREY / TURNBULL, 2001).
The UK risk management standard recognises that this process can be carried out by
outside consultants but it promotes an ‘in-house’ approach as a preference for better
effectiveness (section 4.1 Risk Identification, p.5 of the Standard). ROMEIKE breaks
down the methods available for risk identification into collection and search methods
as presented in Figure 3-6.

72
Figure 3-6: Methods of risk identification (ROMEIKE, 2003, p. 174)
The COSO ERM Framework states that companies more advanced in enterprise risk
management typically employ a combination of techniques that consider both past
and potential future events. It recommends that an organisation should select tech-
niques, which are in line with corporate philosophy, and that resources are made
available for training and appropriate tools for the process (COSO, 2004, section 4).
3.3.3 Risk assessment
Risk assessment is the process of evaluating identified risks and the interrelation be-
tween risks. During the risk assessment, the individual risk situation of any given or-
ganisation (risk portfolio) is mapped, forming the basis for subsequent risk control. In
order to derive an overview of the appropriate actions required in respect of the risks
identified, these risks are therefore, in a second step, analysed and evaluated. The aim
is to obtain insights into the expected value of risk and the degree to which risks may
jeopardise the achievement of corporate objectives (GLEISSNER / WIEGELMANN, 2012;
HÖLSCHER, 1999). In addition, the higher the expected likelihood of occurrence, the less
the potential future event is a risk and the more it is an operational issue. This rela-
tionship between strategic and operational risks is discussed above.
The meaningfulness of the assessment models used depends significantly on the
amount of data available and the specific data quality. Due to the significance of the
data, many organisations establish a special data management capability, which is
generally considered a critical success factor in risk management.

73
3.3.3.1 Assessment methods
The methods used for risk assessment depend on the wealth and quality of available
information (WIEGELMANN, 2012). Assessment methods can be broken down into quan-
titative methods and qualitative methods. The quantitative approaches are based on
mathematical methods and only apply if sufficient risk-specific data are available. In
the ideal scenario and where sufficient data is available, both significance and likeli-
hood can be derived on a quantitative, and therefore objective, basis. Quantitative as-
sessment techniques can be broken down into benchmarking, probabilistic and non
probabilistic methods (COSO, 2004, exhibit 5.2, p.52). The most rudimentary form of
risk analysis takes the form of simple adjustments of development variables along the
lines of a worst-case scenario (DUBBEN / SAYCE, 1991; HARVEY, 2000). For example, con-
struction costs can be calculated at higher than current estimates and rental values can
be calculated at lower than current figures. However, such rudimentary risk-
adjustment is deterministic and highly subjective, leading to rather questionable esti-
mates.
A more systematic approach to risk analysis is sensitivity / scenario analysis. Sensitivity
analysis examines the effects on profitability of changes (such as high, low and me-
dium values) of any of the key variables (GLEISSNER / WIEGELMANN, 2012). It identifies the
key variables and how changes in individual variables might impact on the final value.
Scenario testing is a methodical improvement on sensitivity analysis. Its aim is to ex-
amine how a combination of changes in the development variables in an appraisal af-
fects the outcome (RODNEY / VENMORE-ROWLAND, 1996). In the UK, MARSHAL / KENNEDY
(1992) found sensitivity analysis was used by 95 per cent of developers. While sensitiv-
ity / scenario analyses are useful as rudimentary risk analysis techniques that allow de-
velopers to arrive at a decision, they fail to identify the chances of the possible varia-
tions becoming fact (BAUM / CROSBY, 1988).
Probabilistic risk evaluation techniques, which came in the early 1960s, are a system-
atic advance on sensitivity / scenario analysis. According to BYRNE / CADMAN (1984),
probabilistic techniques are a way of measuring uncertainty. They assist the appraiser
in progressing from identifying a range of outcomes for control variables to assigning
probabilities to each of these variables.

74
A methodical improvement in probabilistic techniques is Monte Carlo simulation, ini-
tially developed by HERTZ (1964). A study by MARSHALL / KENNEDY (1992) shows that only
5 per cent of UK practitioners claimed to occasionally use it, owing to its academic na-
ture. This is despite the vast expansion in the use of spread sheets, which facilitate
simulation exercises.
3.3.3.2 Differentiation of degrees of urgency
Risk as such entails a potential threat to the achievement of corporate objectives,
which has a certain probability of materialising. The assessment of risk is therefore in-
tended to indicate how great a deviation from corporate objectives is to be expected,
i.e. it is intended to express the urgency of a risk. As a first step, a rough classification
of the different degrees of urgency is carried out as follows (HALLER, 1975; HÖLSCHER,
1999):
The first category includes 'small risks' which are characterised by a low degree of ur-
gency. The frequent occurrence of small risks generally results in an even burden on
liquidity, which can be addressed accordingly.
The occurrence of 'medium risks' may pose major problems for an organisation and
therefore requires coordinated risk management measures. While a medium risk may
cause a significant deviation from key corporate objectives, it does not threaten the
sustained existence of an organisation. In contrast, a 'major risk' not only threatens the
achievement of a specific goal, but also the sustained existence of an organisation..
Major risks, in particular the risk of natural disasters, should be avoided when possible
or at least reduced to a level that is viable for the enterprise.
The above classifications of the levels of urgency are used in corporate practice when-
ever risks are to be expressed verbally. However, an adequate differentiation between
the degrees of urgency of any specific risk is hardly feasible on this purely qualitative
basis.
In order to form a sound opinion on a risk and its degree of urgency, an in-depth as-
sessment of its likelihood as well as significance is needed.
An assessment may be performed on a quantitative or qualitative basis. In addition to
the primary risk type, the possibility of carrying out a measurement is decisively de-

75
termined by its ability to be performed, utilising an appropriate input of time and re-
sources, and the available data. Models should be realistic enough to provide valuable
results, but also compact enough to be used frequently and rapidly.
3.3.3.3 Expected value and risk portfolio
The determination of different degrees of risk urgency in its original form is the so-
called expected value. This value is derived from the multiplication of the likelihood by
the significance of a given risk (BANSE / BECHMANN, 2001). All other things being equal,
the greater the likelihood and the significance of the deviation from the target are, the
higher is the urgency of any given risk.
As BERNSTEIN (2000, p. 634) states “Measuring risk without consideration of conse-
quences converts risk management into little more than a game for mathematicians to
play. (…) The focus of risk management must be on consequences.”
The utilisation of a variety of assessment methods is intended to enable the mapping
of the current risk situation of an organisation. This is often done by way of a risk port-
folio which, in an ideal scenario, maps all the inherent risks of an organisation. This
'risk mapping' (SHIMPI, 1999 and HANLEY, 2001) enables the management to obtain a
pragmatic overview of all relevant risks within the organisation. During the risk map-
ping process, the relevant process owners record and assess any risks identified in
their area. DELOACH (2000, p. 118) describes risk mapping as “(...) by far the most useful
and widely deployed tool for risk identification and prioritization.”
A risk area which is acceptable for the organisation and an unacceptable risk area are
then determined for the risk portfolio, taking into consideration the risk policy. This
will, in all probability, also necessitate the inclusion of aspects such as risk appetite and
risk-carrying capability.

76
Figure 3-7: Example illustration of a risk portfolio
The translation of all risks shown in the above matrix results in the risk profile of a de-
velopment project on an enterprise. The likelihood is indicated on the ordinate and the
significance on the abscissa. In addition, it must be determined which fields within the
matrix will trigger the need for further action.
It is possible to differentiate risk areas - on the basis of the formulated risk policy as
well as the risk appetite of the responsible executive management - that are indicators
of a specific need for action. Using the risk tolerance limit or a defined target margin of
safety (target value), the tolerance limits can easily be recorded in the risk matrix in
the form of a boundary line. All risks outside this line are in the range that is no longer
tolerable and must be addressed by appropriate measures (critical risks). In aggregate,
the overall risk situation thus serves to reveal priorities and constitutes a well-founded
basis for decisions about precautions and control measures to be taken.
The basic principles of established methods for the assessment of likelihood and im-
pact are set out below. In order to develop a more in-depth understanding of the pos-
sibilities for measuring risk, this is preceded by a categorisation of the different levels
of uncertainty and the associated implications for assessment.
Risk 4
Risk 3
Risk 1
Risk 2
Risk 5
Risk 6
Risk 7
0
5
10
15
20
0% 20% 40% 60% 80% 100%
Likelihood [in %]
Sig
nif
ica
nc
e [
in E
UR
m]

77
3.3.3.4 Relevant requirements for risk assessment methods in real estate devel-opment
The goal of risk assessment is to measure the risks assumed by an organisation and to
express these risks in the form of an indicator. However, this indicator is not only in-
tended to serve risk assessment but also the subsequent risk management and control.
To ensure this, the risk assessment method for the developer must meet the following
requirements:
The measure used for risk should be transparent and easily interpretable; otherwise it
will not be accepted within the organisation. The risk measurement is likely to be in-
terpretable as an impending monetary loss or gain. Moreover, as practice shows, risks
that are not quantifiable in monetary terms are often excluded from risk management.
As risk is not only determined by the potential deviation from the target but also by
probability considerations, any risk indicator should also include the probability aspect.
Where risk is intended to be measured at a higher aggregation level, the existing com-
pensatory effects must be identified by means of diversification, as a simple adding up
would considerably over-estimate the actual risk. Where feasible, the risk measure-
ment should be carried out in an objective manner by using market prices or other ex-
ternal data. Corporate risk control can only be effective if it is based on a consistent
system of risk measurement. The processes used for risk measurement must therefore
be defined for the entire organisation. Finally, it would be desirable if the risk measure
was suitable for the early detection of threats to the organisation and therefore for
utilisation within an early warning system.
3.3.3.5 Risk catalogue
The insights gained during the risk identification and risk assessment are compiled in a
risk catalogue for further analysis.
The development of a risk catalogue should fulfil two criteria. Firstly, a mutual under-
standing and / or a common definition of risk within an enterprise must be established.
Secondly, all relevant risks must be identified but should only be included once in the
risk catalogue (ERNST & YOUNG AG, 2002). It typically contains the following data for
each risk identified:

78
general categorisation the risk falls under (e.g. financial risk);
specific categorisation of risk (e.g. interest rate risk);
qualitative description of risk (perhaps coupled with an example scenario);
assessment of probability of the risk identifies of how likely this risk is to occur, clas-
sified into low, medium and high assessment of the impact of the risk as an assump-
tion as to how sensitive the output is to this specific risk.
3.3.4 Risk control
Once risks have been identified and evaluated, it must be determined which risks re-
quire further action. Risk control is intended to actively influence the risks identified
and assessed in order to manage all significant loss exposures through the targeted use
of risk management measures. Those business processes, process components or audit
areas for review having the highest risks should be prioritised. According to MCNAMEE /
SELIM (1998), the audit areas must meet the following three requirements: (1) they
must contribute to the achievement of the enterprise's objectives (effectiveness); (2)
they must be material with regard to their influence on the business processes (effi-
ciency) and (3) the probability and the implications of a loss must be greater than the
expenses incurred for control and management (profitability).
Fundamentally there are four risk control strategies (COSO, 2004; HALLER, 1986; LASTER,
1999a; NOZEMAN, 2008). Firstly, risks can be avoided by refraining from transacting
high-risk business. Secondly, risk reduction can also be achieved by a timely reduction
of the expected value of loss. Thirdly, transferring them to third parties may outsource
risks. Finally, the acceptance of the residual risk that remains after taking risk control
measures is also an option. There are a number of cause-related and effect-related
strategies to handle the identified risks. Both active and passive risk management rep-
resent a further possibility for systemisation (HÖLSCHER, 1999). Active risk management
directly affects the risk determinants by influencing the likelihood and / or significance
of a given risk. In contrast to active measures, the tools of passive risk management do
not alter the actual risk. Instead, passive risk management aims at enabling the organi-
sation to cope with a risk when it materialises.

79
3.3.4.1 Risk avoidance
Where the risk assessment determines that particular risk position significantly exceed
the limits of the risk strategy, risk control must be intensified. The most radical form of
risk management is risk avoidance, which prevents any risks from materialising by re-
ducing their likelihood to nil. Given an existing risk, risk avoidance implies the inten-
tional exclusion of potential opportunities (HALLER, 1986). Therefore, risk avoidance will
generally apply only where a risk represents a significant exposure potential when us-
ing alternative management measures and if it exceeds the risk appetite of an organi-
sation (FÜRER, 1990; LASTER, 1999a).
Every entrepreneurial activity has an element of risk as it is impossible to eradicate risk
completely. It is only possible to optimize risk outside of the risk appetite of an organi-
zation. Characteristic strategies in this area are retreat and exit strategies that aim at
not assuming risks in the first place, or at eliminating such risks as quickly as possible
should they arise.
3.3.4.2 Risk reduction
The prevention or limitation of loss by decreasing the likelihood of a disturbance oc-
curring and its significance is called risk reduction (HALLER, 1986). For risks that do not
appear suddenly, but rather emerge over a period of time, risk-reducing measures (so-
called reactive measures) may be taken even after the risk has materialised. Another
form of risk reduction is risk diversification whereby a single risk is disaggregated into
several individual risks, which should, where possible, not be positively correlated
(LASTER, 1999a).
3.3.4.3 Risk transfer
In the case of risk transfer, an organisation transfers the business implications of risks
to external risk bearers (LASTER, 1999a). In principle, this strategy does not eliminate
the cause of risk but merely passes the implications of risks on to third parties. On the
one hand, the risk can be spread across multiple partners, with not only the risk but
also the profit being shared among the partners; alternatively it is possible to transfer
risk to third parties entirely:

80
The shifting of risk is the safest type of risk management; however, it is associated with
relatively high costs and limited applicability. Certain risks, for example, may be trans-
ferred to suppliers or customers by way of contractual arrangements.
3.3.4.4. Risk retention
Risk retention entails the voluntary and involuntary assumption of possible risk impli-
cations (LASTER, 1999a). In this case, when safeguarding against risks, the relevant risks
and their possible impact on the investment decision are deliberately accepted, with
the risk appetite of the individual investor being the principal criterion for this deci-
sion.
3.3.5 Risk monitoring
The goal of risk monitoring is to examine to what extent operating processes adhere to
the planned standards. In the monitoring phase, the primary focus is on evaluating the
risk management process across all units and functions. Risk monitoring is multi-tiered
and is primarily intended to determine whether
the established goals have been met,
risk management complies with risk policy;
the organisation is efficiently designed and a corresponding risk culture is in place,
and whether
responsibilities have been clearly defined.
Risk monitoring consists of two core elements: control and reporting. During the con-
trol stage, risk management data are gathered and analysed through key indicator
analysis and benchmark comparisons, among others, and reported both internally to
the responsible functions and externally to its stakeholders.
Controls are generally related to operational or strategic aspects. While operational
controls monitor the achievement of predefined targets, thereby performing a correc-
tive function, strategic controls perform an anticipatory function in support of plan-
ning. The major risk control tools are systematic key indicator comparisons in the form
of period, cross-section and target-to-actual comparisons. This tests the risk position of
the organisation at a specific point in time. In this connection, value-at-risk is increas-

81
ingly used as a control. These tools represent a major contribution to the mapping of
the risk position.
A risk management system must be adequately documented and the safeguards and
control measures that have been adopted must be recorded in a summary report. This
documentation serves not only to protect internal and external confidence but, in a
loss event, is also considered important proof that a risk management system was cre-
ated, that corporate risk management was improved and that the necessary loss pre-
vention measures were taken. Further good reporting practises are an indication of
continued corporate governance, which is important for fincanciers, investors, and
other stakeholders of the project or organization. This is discussed further in the dis-
sertation.
Reporting is vital at all levels of an organisation for risk monitoring. Management re-
ports are designed in line with the information needs of individuals who are responsi-
ble for executing processes in line with the risk strategy / appetite of the development
organisation.
Typically, the Board of Directors is primarily responsible for ensuring that an effective
risk management system is in place. From an internal reporting perspective, communi-
cation of information is required in the first instance to establish a foundation by pro-
viding a tone from the top that stresses the importance of monitoring (COSO Guidance
on Monitoring).
Risk monitoring is the final stage within the risk management process, but it does not
represent the end of the risk management cycle. Up until now, the project risks have
been identified, assessed, analysed, and some kind of risk handling strategy has been
adopted for them. It is vital to continuously assess the effectiveness and efficiency of
risk management in order to be able to identify areas for possible improvement
(DELOACH, 2000). The risk management process must in no way be interpreted as a one-
off event, but is necessarily subject to an ongoing adjustment and improvement proc-
ess. Also risks are time-based and as such their impact and probability will vary with
time. DELOACH (2000, p. 4) concludes, “(...) redefining the value proposition of risk
management is vital in this day and age.”

82
The ongoing monitoring and control of the entire risk management process generally
results in a noticeable increase in process quality. Effective risk monitoring should have
the following characteristics:
the monitoring process is built into the daily working activities of the organisation
as much as possible;
when performed properly, risk monitoring will provide objective assessments of the
effectiveness of the internal control system;
it will use knowledgeable evaluators who fully understand the evaluation process
and the organisation’s objectives and are able to evaluate how they relate to each
other;
management and the board should be open to feedback on the effectiveness of the
internal control system; and
evaluations should be adjusted in its scope and frequency depending on the impor-
tance of the underlying controls and on the results of other monitoring procedures.
3.3.6 Structure and administration of risk management
Risk management is a critical task and part of the responsibilities of the Managing Di-
rectors or the Board of Management respectively. It is implemented in the organisa-
tion by way of a delegation of tasks, though the overall responsibility and the supervi-
sory role remain with the Managing Directors or the Board of Management. The or-
ganisation’s risk management policy and its characteristics have been discussed in
chapter 3.3.1. This document sets down the organisation’s risk strategy, appetite and
management approach. Business unit management has primary responsibility to im-
plement the daily workings of the risk management system.
Risk management’s roles and responsibilities must be firmly established to cover as
much as possible of the entire organisation. The objective is to avert undesirable
events proactively through responsible action wherever possible; in terms of response,
a detailed allocation of responsibilities promises quicker action in the event of a dis-
ruption, which has a positive effect on overcoming such incidents.
As a general overview, there are several possible approaches to implementing the risk
management system within an organisation, with various options for structuring the
organisational allocation of responsibilities:

83
Specialized risk management function
Depending on the size of the organisation and the specific characteristics of the indus-
try, it may be advisable to establish a central risk management organisation. In prac-
tice, this area reports most frequently either to the CFO or directly to the CEO.
Risk management committee (Steering Committee)
Under this form of organisational implementation, a permanent project committee is
formed, which is charged as a ‘Risk Panel‘, monitoring the activities of the organisa-
tion, and serving as an advisory body to senior management.
Risk management outsourcing
The risk management tasks are assumed by an external partner, which provides the
desired services to the organisation. However, the responsibility for strategic risk man-
agement always rests with senior management and / or the organisation's Supervisory
Board.
Chief Risk Officer (CRO)
Under this approach, the responsibility for risk management is vested in the person of
the ‘Risk Manager‘ or possibly under the responsibility of the Compliance Officer. Thus
this function is becoming increasingly prevalent in larger organisations along with the
CEO and the CFO. In most cases, the area of the ‘Chief Risk Officer‘ reports directly to
the CEO and is thus very favourably established in the hierarchy. The assignment of
personnel to a specialized function offers the advantage of enabling the monitoring
and the reporting of risk situations to be centrally coordinated and implemented with
clear roles and responsibilities.
3.4 Propositions on risk management practice in the real estate devel-opment industry
The analysis of risk management within real estate development in chapter 3.1 pre-
sents seven fundamental characteristics of an effective risk management system. This
section utilises these characteristics to provide a framework for presenting the propo-
sitions on whether and to what extent real estate development organisations imple-
ment effective risk management. These propositions are formulated in order to repre-
sent what would be considered best practice and are used in the dissertation as an ob-

84
jective benchmark against which practice in the industry can be measured. Proposi-
tions based on the structural characteristics of the development organisation are also
presented afterwards. These propositions form the basis for the second part of this
dissertation where empirical research is conducted to determine their validity.
3.4.1 Risk management a systematic process?
The successful implementation of an ERM framework within the development organi-
sation provides a high standard for a systematic risk management process (see chapter
3.3 for a discussion of the risk management process). A risk management approach
that is characterized by a low degree of formalization and co-ordination may result in
the application of differing terminologies and methods during risk identification,
measurement and control by different individuals. In such a situation, there is no
shared understanding of risks that may threaten a project or the development organi-
sation as a whole. It is directly linked with the overall strategy and decision-making
processes of the organisation. Threats and opportunities are identified and managed
and risk optimization is an ongoing process.
Proposition 1: Developers have a structured approach towards the management of
risks.
This would be evidenced by the presence of a formalised and integrated risk manage-
ment framework to a large extent, standardised risk management processes being for
the major risk categories, risk management being a topic at management level with a
clear definition of duties and responsibilities, regular reporting of risk and risk man-
agement and there being suitable tools and systems available for identification, meas-
urement and control of risk.
3.4.2 Risk management an ongoing challenge?
Risk management should be a continuous and dynamic process that is not limited to
one-time actions and application. Rather it should be a regular process, which is em-
bedded in other management activities. As an intrinsic component of daily activities, it
means that a proactive rather than a reactive approach is taken to the management of
risks. In practice, there is evidence that the development industry is practicing varying
degrees of risk management. At the very least, feasibility analyses of projects are gen-

85
erally conducted at the onset of a project where the analyst would measure the incom-
ing flows and outflows which require proper market analysis (BOYKIN, 1985). GEHNER /
HALMAN / DE JONGE (2006) found that development sector made use of decision criteria
to decide on the continuation of a project for example at the start of development and
at the start of construction. These decision criteria can be seen as risk measures to
keep the development process under control.
Proposition 2: Risk Management tends to be a regular process within real estate de-
velopment organisations.
This would be evidenced by frequent risk reviews, systematic and defined control and
monitoring procedures, ease with which the organisation performs the risk manage-
ment process and the existence of an effective specialised risk management commit-
tee to oversee and manage the risk management process.
3.4.3 Risk management applied in strategy formulation?
The COSO ERM Framework requires that risk is managed from the top down rather
than driven from the bottom up. Strong support from top management instils a sense
of responsibility for risk management throughout the organisation. Objectives, strate-
gies, policies and guidelines should be actively supported and communicated by the
board and are executed and updated dynamically. The process of framing a risk policy
helps executives and the board clarify to their understanding of the risks and their re-
lated impact on the business. The board of directors and senior management are re-
sponsible for establishing the appropriate culture to facilitate an effective internal con-
trol process and for continuously monitoring its effectiveness. A comprehensive ap-
proach for real estate developers to managing risk must take into consideration the
reality that the organisation is managed within an environment of uncertainty. Risk
management must be embedded in both the strategic planning process as well as the
operations of the development business.
As a result, it is believed that real estate developers perform in line with regulatory re-
quirements in this aspect, that is, that management of listed real estate developers
have set objectives, strategies and guidelines and have communicated these to the
adequate level of the divisions. It is believed that these are derived from the organisa-
tion’s objectives, are updated on an annual basis and that the implementation and

86
execution of the guidelines are dynamically and actively supported by all business units
and divisions. It is however unknown as whether there is a difference between the ap-
proaches of listed and non listed real estate developers. The main obstacles in applying
risk management at the initial stage of the project life cycle have been identified as
inadequate knowledge of risk assessment techniques and the lack of understanding of
its potential benefits (GEHNER / HALMAN / DE JONGE, 2006; UHER / TOAKLEY, 1999). At the
same time in early stages of the development process there is typically the most op-
portunity. In applying this to the development industry, it needs to be established
whether organisations have formal processes to align risk management with corporate
strategy which is an essential element for embedding a risk culture throughout the or-
ganisation.
Proposition 3: Risk management is an integrated process and development organisa-
tions have formal processes to align risk management with corporate strategy.
This would be evidenced by an enterprise wide strategy for risk management, and the
recognition of the intrinsic benefits of risk management by the drivers and the compo-
sition of the risk management committee. Risk management should also be within the
real estate development organisation's specific risk appetite.
According to the COSO ERM Framework, the risk appetite of the organisation acts as ‘a
guidepost’ in setting the strategy of the organisation. Only after fully understanding
the risk appetite, should the organisation set its objectives in the areas of strategy, op-
erations, reporting and compliance. The risk appetite is in turn based on the corporate
philosophy and the management style of senior management and indicates the risk /
reward trade-offs within the organisation. A common definition of risk concepts, a
common understanding of risk management and a uniform risk culture are indispensa-
ble in this context.
Proposition 4: Real estate developers conduct their risk management within the or-
ganisation’s specific risk appetite.
This would be evidenced by a uniform understanding of the concept of risk and the
awareness of the organisation’s objectives and risk appetite, and these organisations
have a risk management process, which is sufficiently effective in dealing with identi-
fied risks.

87
3.4.4 Risk Management applied across the whole real estate develop-ment organisation?
The COSO ERM Framework encourages organisations to take a holistic approach to risk
management rather than confining risk management to various individual depart-
ments such as compliance, internal audit or insurance. In performing risk management
in aggregate, this provides for uniformity, gives clarity, reduces overall costs and allows
long-term value to be created for the organisation.
Proposition 5: Most development organisations have some measure of risk man-
agement activities and can claim to have an enterprise wide risk management strat-
egy, i.e. risk management tends to be applied across the whole real estate develop-
ment organisation.
This would be evidenced by a consistent and adequate risk management process; fre-
quent risk reviews, systematic and defined control and monitoring procedures, the
ease with which the organisation performs the risk management process and the ef-
fectiveness of a specialised risk management committee to oversee and manage the
risk management process.
3.4.5 Risk Management designed in order to identify, assess and manage events potentially affecting the real estate development organisa-tion?
Risk identification is considered to be the most important phase in the risk manage-
ment process, for the very reason that, without identifying a risk, it is impossible to
analyse, assess, or control it. Its function is threefold: to detect risks, which have not
yet been recognized; to detect changes in those, which have already been recognized;
and to detect emerging risks. During risk identification, an inventory of risks is taken
for each process and function throughout all the levels of the organisation so that
every potential risk may be identified (see chapter 2 for risk identification of potential
risks which may affect the real estate development organisation).
Proposition 6: Risk management is implemented to identify, assess and manage all
events potentially affecting the real estate development organisation.
This is evidenced by an apparent awareness of risk priority as well as the use of a com-
prehensive risk catalogue, the presence of clear reporting lines and receptiveness to

88
communication on all aspects of risk and adequate staff training to ensure suitable ca-
pabilities for the risk management process.
3.4.6 Risk Management intended to preserve value and allow value to be created?
Value creation has been associated with strong corporate governance and the
achievement of the organisation’s long-term objectives in order to protect the inter-
ests of all its stakeholders. The implementation of effective risk management may also
reveal areas where undiscovered value may be found. The COSO ERM framework ad-
vocates achieving good corporate governance through effective risk monitoring, com-
prehensive understanding of risk management and of the organisation’s risk appetite.
For an environment that allows the development organisation to create value, the as-
sets and processes to create value need to be reviewed for vulnerability to major un-
certainties and to identify opportunities within this context. This balancing between
appropriate corporate governance measures and aggressive value creation strategies
is one of the most important objectives of risk management.
Proposition 7: Development organisations have intended and designed their risk
management for the purpose of strong corporate governance, which would preserve
and allow value to be created.
This would be evidenced by finding that the drivers for the implementation of risk
management are for reporting requirements as well as good corporate governance
and intrinsic value creation, the presence of a uniform understanding of the concept of
risk, the awareness of the organisation’s objectives and risk appetite, and most organi-
sations have a risk management process which is sufficiently effective in dealing with
identified risks.
3.4.7 The impact of structural characteristics of an organisation on the effectiveness of their risk management system
The study of real estate development is generally based on a uniform group and no
differentiation has previously been made amongst the different structural characteris-
tics of an organisation. The author believes that the structural characteristics are inde-
pendent variables that are likely to influence some aspects of risk management. The
main structural differences are developer type, ownership structure, the geographic

89
scope as well as the optimal investment volume for individual development projects
(cf. chapter 2.5). If there are differences in approach among the categories, further re-
search may be possible in the individual categories and it may provide further depth in
understanding the tendencies of different organisations in their approach. These dif-
ferences in approach to risk management are considered below:
Developer type and risk management approach
It is believed that investor developers are more risk averse than trader developers. This
may be because the investor developer intends to hold the developed asset for the
long term as an investment in the portfolio, which will demand, for an even more care-
ful assessment of risk.
The trader developer is more focused on a comparably fast exit of the development
and therefore requires a more short-term assessment of risk.
Ownership structure and risk management approach
It is believed that, publicly listed real estate development corporations at least satisfy
statutory and corporate governance obligations with regards to risk management. Pri-
vate real estate development organisations are encouraged to implement risk man-
agement systems although there is no legal requirement to do so. As a result, it is be-
lieved that real estate developers perform in line with regulatory requirements in this
aspect, that is, that management of publicly listed real estate developers have set ob-
jectives, strategies and guidelines and have communicated these to the adequate level
of the divisions. These are derived from the organisation’s objectives, and are updated
on an annual basis. The implementation and, execution of the guidelines need to be
dynamically and actively supported by all business units and divisions. It needs to be
established whether there is a difference between listed and non listed real estate de-
velopers towards meeting the recommended practice and formalizing and updating
these guidelines.
Project size and risk management approach
It can be expected that the larger the project, the longer the time to completion giving
greater risk that market conditions could change. This makes the monitoring process
within risk management significantly more important. The complexity of the risk man-
agement system increases with large-scale projects as the number of different parties,

90
processes and complexities involved becomes very large. It is noted also that the effec-
tiveness of the risk management process will in part be dependent on the developer
staying within a predetermined project size. Empirical research may give some indica-
tion on whether there is an inter-dependence between size of project and risk man-
agement approach. For example, larger projects would be expected to have a unique
set of risks whereas smaller and mid-size projects could be expected to be more stan-
dardized.
Geographic scope and risk management approach
Cross border organisations are expected to have a more effective risk management
system as the risks are more diverse operating across a range of different factors
which affect different geographical markets. These factors include political, economic,
cultural and environmental issues. Due to the variety and complexity of risk related
issues that they face, international organisations require very structured and efficient
risk management systems with a uniform risk culture, which comprise the use of
common definitions, support and understanding of risk management.
Proposition 8: Different structural characteristics of a development organisation are
expected to have an impact on the risk management approach. Specifically the inde-
pendent variables considered are developer type (investor developers are more risk
than trader developers?), ownership structure (determined by regulatory require-
ments?), project size (the larger the more unique the risks?), geographic risk (the
greater the spread the more effective the risk management?).
The proposition will be tested by statistical analysis. In order to determine whether
there is dependence between specific structural characteristics of the responding de-
velopment organisation and responses regarding risk management practise, tests of
significance will be used. The results of the tests of significance would indicate whether
the research results have occurred by chance or whether there is a relationship among
the variables.

91
3.5 Concluding remarks
The preceding sections have addressed the following research question:
2 What are the characteristics, key business processes and associated key risks of
real estate development?
The concept of risk management is recognized and established in the relevant fields of
literature. Risk management is fairly well developed in both the academic and applied
literature with regard to generic risk management theory and practice. It is noteworthy
that both the academic and applied literature on risk management specific to real es-
tate development is not so well developed. The definition of risk management as pro-
posed by DeLoach has been found to be the most appropriate for real estate develop-
ment. This definition comprises seven fundamental characteristics and is used to pro-
vide a framework to study the risk management approaches in the real estate devel-
opment sector in the empirical part of this dissertation. The study of the risk manage-
ment process is based on the approach taken by the COSO ERM Framework and the
UK Risk Management Standard. In its practical implementation, risk management con-
stitutes a permanent, active and systematic process in the sense of a control loop, with
the risk management process consisting of four constitutive phases, namely identifica-
tion, assessment, control and monitoring. A risk management control loop in the real
estate development industry based on Haller and Wiedenmann was presented and the
individual phases and their main characteristics and methods are outlined for the real
estate development industry.
In order to verify the propositions, empirical research was deemed necessary. A series
of industry specific questions were formulated to determine how and to what extent
developers practice risk management and to determine corporate philosophy. The un-
derstanding in chapter 2 on the generic process of real estate development and the
identification of related risks provides the basis for the understanding of the risks in-
volved are used for the elaboration and structuring of the questionnaire. The study in
chapter 3 on generic risk management concepts and processes has formed the basis
for a questionnaire by applying it to the real estate development market. The method-
ology of the empirical research is presented in chapter 4 and the results and interpre-
tation of the empirical research are to be found in chapter 5.

92
4 Empirical research design
4.1 Objective and contents of empirical research
While the theoretical foundation of risk management in general has largely been ex-
plored in the field of general management research, this dissertation focuses on an
industry, which is of macro-economic significance but is characterised by a knowledge
gap in the area of risk management. Primary empirical research was deemed necessary
in order to provide much needed factual data against which to compare and analyse
the theoretical framework and existing research presented in the subsequent chapter.
A considerable advantage can be gained from an empirical study because it reflects
actual rather than merely theoretical data. The success of any such complex study is
highly dependent on the ability to access critical sources. This empiricism not only pro-
vides evidence to corroborate or disprove preconceived ideas on prevailing practice
but is intended to also give new insight into the workings of the real estate develop-
ment industry.
The present study ventures to offer an in-depth presentation of risk management
practice in leading European real estate development organisations. The content of
the study is derived from the objectives of the dissertation and the specific issues re-
searched therein. Its main focus is on the findings relating to risk management in real
estate development. It is the primary goal of this empirical study to obtain information
about risk management practice among real estate development organisations in or-
der to analyse current practice relative to theory.
It aims to answer the following research question presented in the introduction
3 What are the practices among leading European real estate development
organisations concerning risk management?
There has only been limited previous research conducted on how development organi-
sations structure their risk management processes and thus this study is intended to
expand knowledge on existing risk management practices in real estate development
to allow the confrontation of theory with practice to verify theory. On the basis of em-

93
pirical data analysis, this dissertation will determine conclusions that allow existing
theory to be confirmed or modified.
The study centres on micro-economic aspects of risk management in a real estate de-
velopment context. To ensure a clear focus, the following distinctions are drawn:
The study primarily addresses the following research areas: risk management ap-
proach, risk identification, assessment and analysis, control, monitoring, review and
reporting, organisation and culture;
The survey relates to leading European real estate development organisations en-
gaged in the development of different properties, from the more general forms of
commercial and residential developments to the more specialist such as hotel, lo-
gistics, production and leisure developments.
4.2 Research purpose
The empirical part of this dissertation aims to explore, describe and explain actual risk
management practise in real estate development. The general purpose here is to de-
scribe current practice as accurately and thoroughly as possible, to highlight any ques-
tions which need to be resolved and to provide valuable input for explanation (VAUS,
1996). The formulation of some conceptual propositions (BAILEY 1994) on the modi op-
erandi of risk management in real estate development and the research in the theo-
retical part of this dissertation were used as foundations for empirical research in or-
der to gather information to describe appropriate aspects of risk management. This
was achieved by means of a quantitative cross-sectional survey (chapter 4.3).
In the first instance, results will be analysed (chapter 4.5.5), interpreted and reported
to describe the a priori categories within the risk management process (WELLINGTON /
SZCZERBINSKI 2007). Then the data will be rearranged in order to test the propositions
(chapter 3.4). The exploratory aspect of the dissertation also aim to identifying rela-
tionships between the independent variables and dependent variables; statistical tests
of significance will be performed to identify statistical dependences and to ensure that
the results have not occurred by chance (see chapter 4.5.5.1 proposition 8). Where
strong associations are evident, some ex post facto postulations (rather than explana-
tions) will be put forward for explanation (BAILEY, 1994; VAUS, 1996).

94
The research methods related to this approach strive to gather data that is as reliable
and accurate as possible to support the depiction of the studied item. The author’s
sound previous knowledge of the real estate development industry was beneficial in
gathering the appropriate information relating to the various aspects of risk manage-
ment. The research methods adopted in this dissertation are explored in greater detail
below.
4.3 Quantitative research approach
In the world of social research methodologies the qualitative and the quantitative ap-
proach may be differentiated. The quantitative approach was selected for the reasons
given below:
Quantitative research methods are generally linked to positivist research approaches
(MILES / HUBERMAN, 1994) and refer to methodologies that primarily seek to express in-
formation numerically in terms of measurements and counts. This offers a high degree
of standardisation (REMENYI / WILLIAMS / MONEY / SCHWARTZ, 1998). Quantitative research
- quantitative surveys in particular - is widespread and has enjoyed a long tradition in
the field of social studies.
The underlying objective of quantitative research is to identify common processes and
/ or patterns characterizing a population to be examined and to derive explanations of
cause-and-effect relationships (BENTZ / SHAPIRO, 1998). By quantifying the relevant
characteristics under examination, research aims at enabling the comparison of data
and making it suitable for statistical evaluation processes. This allows ascertainment of
comparisons and interdependencies if appropriate. A major strength of the quantita-
tive approach is, that it offers peer researchers the opportunity of relatively easy repli-
cation of studies in order to corroborate or disprove previous evidence (REMENYI /
WILLIAMS / MONEY / SCHWARTZ, 1998). Quantitative approaches enable the examination
of a large sample, therefore facilitating representative findings with results generated
often referred to as being 'rigorous' or 'hard' and, due to a large sample, enjoy a com-
paratively high external validity. On the other hand, in the high degree of standardisa-
tion lies a material disadvantage of the quantitative approach, as this does not permit
the depiction of complex interrelationships that characterise corporate practice, which
cannot be reduced to figures alone (BENTZ / SHAPIRO, 1998).

95
4.4 Written survey as choice of research method
A written survey was chosen as the most effective method to meet the objective of
this study. This method would enable obtaining data that is not at hand so far, and the
written format maximises the chances of response from the target population.
MANNING / HARRISON / ROULAC / LIZIERI / KAISER / CASE (2008), suggest for those wishing to
do Applied Research publishable in academic journals that inductive investigation of
primary data using Delphi or another survey method stands at the beginning of applied
research, followed by other methods such as grounded theory or case study research
methodology. This research approach is believed to be the most adequate research
methodology for several reasons. During the study of relevant literature, a dearth of
empirical data was noted within the context of the formulated issue. A broad analysis
of the risk management practice among real estate developers would therefore appear
to be the most appropriate option. For this purpose, a fully standardised survey was
initiated in order to obtain broad-based insights into the industry examined. The issues
being researched that require answering as part of the empirical research were mainly
formulated in the form of ‘what‘ questions. As in YIN (2003) the answer to ‘what‘ ques-
tions may be answered in the way of surveys or archival analysis (cf. table below).
Strategy Form of research
question
Required control of
behavioral events?
Focuses on
contemporary
events?
Experiment how, why? Yes Yes
Survey who, what, where, how
many, how much?
No Yes
Archival analysis who, what, where, how
many, how much?
No Yes/No
History how, why? No No
Case study how? why? No Yes
Table 4-1: Relevant situations for different research strategies (YIN, 2003, p. 5)
This dissertation is based on an survey conducted among leading European real estate
developers by way of questionnaires (SCHNELL / HILL / ESSER, 1999) sent out by regular
mail. As the group to be assessed was quiet homogenous, a written survey was consid-
ered to be more cost-efficient (CZAJA / BLAIR, 1996) than an oral survey. In addition, it

96
was possible to structure the subject matter of the survey to a higher degree in a writ-
ten survey.
A decisive disadvantage of this written survey is the fact that there is virtually no con-
trol over the circumstances under which the questionnaires are completed. For exam-
ple, it is even hard to verify whether or not the target person addressed has in fact
completed the questionnaire him / herself (ATTESLANDER, 1991). Moreover, individual
questions may be overlooked or answered incompletely. The design of a questionnaire
therefore required a high level of care and consideration (SCHNELL / HILL / ESSER, 1999) in
order to minimise these problems.
In general terms, it should also be noted that one of the most significant restrictions in
the collection of data by way of surveys is their typically low response rate (BEREKHOVEN
/ ECKERT / ELLENRIEDER, 2006). This is even more the case when surveying industrial
populations, with the potential participants receiving the questionnaire at their work
place. In these cases, factors such as high workload, organisation policies and confi-
dentiality of information result in a lower response rate than is the case for consumer
populations (MILES / HUBERMAN, 1994). In order to overcome this problem, the survey
relied heavily on personal contacts and networks to produce maximum participation.
Figure 4-1 summarises the research design that was elaborated in the context of this
dissertation:
Figure 4-1: Structure of empirical research design
A questionnaire was prepared and send to collect data in order to provide an accurate
profile of how risk management was practiced in real estate development between

97
October 2004 and March 2005, following earlier rigorous preparation, identification of
population, pre-test procedures and adjustments of the questionnaire based on in-
sights gained during pre-tests. Evaluation, interpretation and documentation of results
from the empirical survey were completed by mid of 2007. These results underwent
further statistical analyses, the interpretation of which were finalised by end of 2008.
In September 2009, because of the time that had elapsed between the collection of
the data and the finalisation of the thesis, it was felt necessary to review subsequent
developments, especially in view of the financial crisis, which came to light in the sec-
ond half of 2008 (see inter alia chapter 6).
4.4.1 Questionnaire
The questionnaire (see Appendix C) translates the terms and concepts outlined in the
previous chapters into terms and questions easily understandable by the survey par-
ticipants. The survey questions focus on three main areas: the structural characteristics
of the respondents, the internal corporate environment and the risk management
process. These are discussed in detail below in 4.5.6.
As the survey results provide the decisive data material for the empirical part of this
study, a considerable amount of time and care went into designing the questionnaire
and its technical implementation / realisation. As a matter of principle, great attention
was paid to formulating short and simple but precise questions. Particular focus was
given to the wording of the questions and the specialist terms used to prevent any
possible misinterpretations.
With a view to evaluating questionnaires, closed questions are preferable to open
questions because the respondents know clearly the purpose of the question and are
limited to a set of choices where one answer is right for them. Therefore, most ques-
tions were intentionally worded as closed questions with preset answers to choose
from. When offering rating scales for answering purposes, the medium / neutral cate-
gory was often intentionally left out, leaving only positive and negative answer op-
tions. This was intended to avoid respondents falling back, by default, on one of the
more evasive answers available. Where an exhaustive selection of multiple-choice
questions was not feasible, semi-open (hybrid) questions were asked which entailed
‘Other‘ as a possible answer. The preset answers were formulated in such a way that

98
either single response only would be appropriate or multiple responses could be given
by selecting several preset answers with a cross simultaneously. In these cases, the
relevant questions stated the fact that multiple responses were possible.
4.4.2 Population
The study relates to organisations whose core competency is real estate development.
Due to its focus on the developer function, the empirical research is designated as an
industry-specific study. The developers targeted were not selected randomly, but were
chosen because of their recognized leading position in their respective market. In or-
der to achieve further comparability within the elementary unit, organisations were
selected as the target group of the study whose primary business activity is the initia-
tion and realisation of real estate projects (‘pure developer‘). Moreover, organisations
which have (re-)discovered real estate development as a lucrative business segment
and have been able to successfully develop this segment are also included in the study
if they have a leading position in their relevant market. This includes, for example, fi-
nancial services institutions, construction organisations, as well as strategic and institu-
tional investors. As organisations within this industry are increasingly competing on
global markets, it appeared appropriate or even necessary to base such a study not
only on geographical parameters but examine organisation attributes within a pan-
European context. For this reason, the author has concentrated on developers in seven
countries, the Netherlands, Germany, the United Kingdom, France, Spain, Italy and
Switzerland. The choice for these countries is particularly made out of practical rea-
sons. As in NOZEMAN / DORENBOS (2006), the Netherlands, France, Germany and the
United Kingdom can be characterized as mature markets.
The identification of development organisations to be included in the population
proved to be a major and time consuming challenge, given that there was no generally
accepted ranking list of developers in the relevant countries in early 2004. Statistical
information on organisations in the real estate sector is only available to a limited ex-
tent and also difficult to compare at an international level due to a multitude of defini-
tions (NOZEMAN, 2004). In addition, it was felt that in order to obtain meaningful results
for this survey, it was critical that personal working judgement and networks would be
necessary in order to attain viable participation. The discussion on response rates in
chapter 5.3.4 below highlight how critical this was to attain the best response. As a re-

99
sult of this, Belgium, Austria and Scandinavia were regrettably omitted from the sur-
vey. However, it was felt that as the purpose of this dissertation was to gain good ac-
cess to data rather than for a comparison of risk management practice amongst the
European countries, this was not considered material to the dissertation.
In the light of the above mentioned aspects, various sources were used to identify po-
tential target organisations:
Listing and position of development organisations in the business information sys-
tem ‘OneSource‘. OneSource is a comprehensive source for global information on
organisations, industries and executives. Research was undertaken under the cate-
gories ‘developer‘, ‘construction services‘ and ‘real estate operations‘. Organisation
data have been analysed based on turnover figures, numbers of employees as well
as - when available - project volume.
Listing of organisations in so-called ‘expert‘ or ‘Top‘ lists provided by experts on
country level.
Information provided by the European Public Real Estate Association (EPRA) on de-
velopment organisations.
Involvement of expertise from national experts such as CB Richard Ellis, Cushman &
Wakefield Healey & Baker, Ernst & Young, Jones Lang LaSalle, KPMG and PriceWa-
terhouseCoopers.
Finally, 158 organisations (see Appendix A) were selected on the basis that they were
reputable market players in the selected countries and were known to industry ex-
perts. The author believes that the selection criteria have substantially enhanced the
response rate (see chapter 4.3.4.).
Since 2004, more ranking tables of real estate developers have become available. Ex-
amples for so called ‘Top Lists‘ are amongst others: ‘Top 25 pan-European Players‘ /
‘Leading Developers in Europe‘, both published by the PropertyEU Magazine (2008),
‘Top 101 Ontwikkelaars‘ published by PropertyNL Magazine (2007) or ‘Ranking Immo-
biliarias, specifically Ranking Promotoras‘ by Metros² (2008), Even though ‘Top Lists‘
are highly dynamic, they provide a basis to determine the leading organisations which
are generally regarded as stable and established players in the relevant markets.

100
Most of the 158 organisations which have been targeted in this research are found
amongst those reported as leading developers in available ‘Top Lists‘ which confirms
the quality of the population selection for this dissertation.
In January 2012 a further review of the population has been undertaken in order to
verify whether the companies included in the selection have had significant changes in
their ‘standing’. As a result it can be quoted that there has only been limited changes
in terms of mergers or bankruptcies. The Amadeus data file was used to check the
status of the 69 responding organisations. This is one of the few semi-public sources
containing balance sheet totals of European development companies derived from an-
nual reports sent in to the Chamber of Commerce. It is noteworthy that it does not
contain data of companies, which are a subsidiary of a larger corporation (consolidated
figures). Moreover much financial data is missing for various countries.
4.4.3 Pretest
To verify the feasibility of the survey, the author conducted a pre-test, taking into ac-
count feedback from both practitioners and academics. The pre-test concentrated on
the comprehensibility of the questions and the verification of clarity and completeness
of the preset answers. In addition, the time required to complete the questionnaire
was ascertained. As in MAYER (2004), it is rather difficult to assess the time required for
completion of a questionnaire as it depends on the respondent's motivation and cur-
rent frame of mind. However, in the context of the specific research, it was important
to ensure that no more than 40 minutes were required for answering the questions.
4.4.4 Data collection
158 organisations were included in the sample. The questionnaire was accompanied by
a covering letter (Appendix B). In order to ensure a target-group-specific approach, the
questionnaire was made available in English, French and German. In most cases the
questionnaire was addressed to the CEO, CFO or managing partner of the selected or-
ganisations. Where no reply was received by the deadline stated in the questionnaire,
addressees were chased by e-mail and telephone.

101
4.4.5 Data analysis
The objective of the evaluation is to ascertain how responses and the characteristics of
the responding organisations are correlated, and to verify the propositions made in
formulating the research questions for the questionnaire. The response received were
recorded and analysed in MS Excel spread sheets. The statistical software SPSS (Statis-
tical Package for the Social Sciences) was then used to calculate statistical values. The
analysis conducted in this research concentrated mainly on obtaining percentage
shares of the answers. Both description and analysis of the results are supported by
the presentation in the form of graphics and tables (MS Excel and Amigo).
Some findings and trends relate to respondents in general while others relate to spe-
cific respondent categories. In the event that there was only a small number of a re-
spondent within a specific category, where all respondents showed similar answers, a
common position was deemed to have been established. One can state with some
confidence as to a common position when all respondents show similar answers.
4.4.6 Presentation of results and determination of propositions
The presentation of the data in chapter 5 fulfills the three research purposes of the
empirical study as discussed in chapter 4.2. The outcome of all the questions posed in
the questionnaire is presented in chapter 5.1 to 5.4. This essentially describes risk
management attitudes and behavior by presenting a comprehensive ‘map’. This is fol-
lowed by the results of the evaluation of the eight propositions; the first seven of
which measure risk management practice against an objective benchmark and the
eighth proposition, which explores the possibility of a dependence between structural
characteristics of respondents and their responses. The author felt that the results in
chapter 5.1 to 5.4 were a prerequisite to the evaluation of the eight propositions and
hence both sets of results were inextricably connected in the understanding of risk
management practice in real estate development.
Chapter 5 presents the analysed results under three headings:
The structural characteristics cover areas of classification and categorization of re-
spondents, namely development activities of the organisation, geographic scope, own-
ership structure, usage distribution of the real estate development activities and opti-
mum volume for individual projects (cf. question numbers 1, 2, 3, 4, 5).

102
The internal corporate environment covers both the conceptual views of risk percep-
tion, risk management approach and drivers in the implementation of their risk man-
agement (cf. question 6, 7, 8, 9, 10, 11 12) and the more practical aspects of account-
ability (cf. question 13) structure, training and IT solutions of risk management within
the organisation (cf. question 21, 22, 23, 24, 25).
Questions on the risk management process include areas discussed in chapter 3.3.1 to
3.3.6 on setting corporate objectives (cf. question 11, 12), risk identification (cf. ques-
tion 7, 8, 14, 15, 20), risk assessment (cf. question 14, 16, 17, 18), risk control (cf. ques-
tion 19) and risk monitoring (cf. question 21, 24).
The survey questions focus on a number of key areas comprising fundamental charac-
teristics of an effective risk management as laid out in chapter 3.1. In order to arrive at
a decision based on the confrontation between each proposition stated in chapter 3.4
versus praxis (hereafter referred to as the ‘determination’), responses from the ques-
tionnaire were regrouped and analysed by means of investigations relating to specific
areas and presented in chapter 5.5 as follows. A detailed description of how the
propositions were tested is given in Appendix G. The approach and data of the
statistical analysis are presented in Appendix D,E and F.
4.4.7 Limitations on the empirical research
Subjective view
Where respondents were required to give a self-rating or a subjective point of view on
an aspect of the organisation’s risk management, the answers provided would neces-
sarily suffer from subjective bias. In this context a limitation may be seen in the fact
that questionnaires were addressed to the CEO, CFO or managing partner of the se-
lected organisations (see chapter 4.5.4). However, as a general aspect of question-
naires, the recipient was at liberty to pass the questionnaire onto another person
within the organisation, which may have influenced the responses in terms of bias. At
the same time it may be assumed that given the specific nature of the questionnaire
will be handled over to specialized experts within the team (if at all). The data never-
theless provide an indication as to the self-perception of survey participants'. It was
expected that overall these answers would be more positive than reality, due to a po-
tential lack of objectivity.

103
Collection of data
The most notable shortcoming regarding data collection has been that the size of or-
ganisation has not been chosen as part of the structural characteristic information.
There were a number of reasons for this. An organisation can be sized according to
turnover, assets and number of employees. However often these do not reflect the
true size of the organisation. Most real estate developers are an arm of a larger com-
pany that is involved in a range of activities with turnover and assets of real estate de-
velopment not being split out. In addition it is very difficult to have valid information
on size in terms of employees given that many aspects may be outsourced and there-
fore comparability is not a given. Although this information would have provided a
more detailed picture, it was felt that there was a danger that the information gath-
ered could be misinterpreted and therefore misleading.

104
5 Results of the empirical research on risk management in the real estate development industry
In order to put the results of the study into context, an analysis of the response rate
(chapter 5.1) and background characteristics of the respondents (chapter 5.2) have
been made. This is followed by a discussion of the results under three main headings;
internal corporate environment (chapter 5.3), the risk management process (chapter
5.4) and the evaluation of propositions (chapter 5.5). The internal corporate environ-
ment corresponds to the discussion in chapter 3.3.1 (including 3.3.7) relating to strate-
gic objectives and risk appetite, which are the prerequisites for establishing an effec-
tive risk management system. The risk management process refers to the four core risk
management activities as discussed in chapter 3.3.2 - 3.3.6 (risk identification, risk as-
sessment, risk control and risk monitoring). The evaluation of propositions relates to
the discussion in chapter 3.1 and chapter 3.4 on the components of effective risk man-
agement. The chapter concludes with a reflection of the findings in relation to the re-
search question, which the survey aims to address.
5.1 Response rate
A total of 69 completed questionnaires suitable for evaluation were returned, from
158 questionnaires dispatched. This corresponds to an overall response rate of 43.7
per cent. The response rate was comfortably high; according to BEREKHOVEN / ECKERT /
ELLENRIEDER (2006), 15 to 60 per cent may generally be expected as a response rate
range for written surveys.
The overall high response rate is a further indication of the high level of interest re-
spondents took in the subject matter of the survey. Response rates from Switzerland,
the United Kingdom, Germany and the Netherlands were noticeably higher than those
from France, Italy and Spain. Although it took a considerable length of time for com-
pleted questionnaires to be returned, the direct approach to target organisations
through building direct contacts and work with reminders sent to non-respondents
contributed to the comparably high response rate.

105
Table 5-1: Questionnaire and response rate (countries in alphabetical order)
Comparatively low response rates were received from organisations in France, Italy
and Spain. Without any further research into the matter it could be assumed that the
lower response rate is due to a weaker personal link with the organisations polled in
these countries as well as a language barrier in Spain and Italy given the questionnaire
was presented in English, French and German
However, as all respondents answered not all questions, the survey sample size varies
for each question evaluated. Therefore, as part of the following elaborations, the indi-
vidual survey samples (R= number of responses) do not refer to the entire survey
population but only to the specific respondents who answered the relevant question
or partial question.
5.2 Background characteristics of respondents
Chapter 2.4 has presented classification aspects of developer types. In the context of
the survey, a series of questions were formulated to establish a classification of the
responding organisations’ structural characteristics; the questions covered the owner-
ship structure, the geographic scope as well as the optimal investment volume for in-
dividual development projects. The structural characteristics are considered as inde-
pendent variables that were believed likely to influence most aspects of risk manage-
ment and provide a broad platform from which further survey results could be ana-
lysed to a higher degree of differentiation.

106
Table 5-2: Background characteristics of respondents
Developer type
As outlined in chapter 2.4, various types of developers may be differentiated. To carry
out a preliminary structuring of the empirical data collected, the organisations polled
were asked to state the type of their development venture (cf. Appendix C - Question
1). All 69 participating organisations responded to this question. Within the survey,
53.6 per cent of respondents were trader-developers and 46.4 per cent were investor-
developers (for a differentiation of key characteristics of developer types see chapter
2.3).
Ownership structure
Of the 69 respondents (R= 69), only 33.3 per cent are listed organisations with the re-
maining 66.7 per cent being unlisted organisations. This low level of listed organisa-
tions is believed to be as a result of the complexity and high level of volatility associ-
ated with property development (DORENBOS / NOZEMAN, 2006).
Against this background, the study investigates how organisations with various owner-
ship structures implement risk management and whether there are significant differ-
ences in risk management between listed and unlisted developers. Although informa-
tion is limited, due to statutory audit and financial reporting requirements, knowledge
of some risk management practices in publicly listed organisations is generally re-
ported and therefore available. Publicly listed organisations are believed to have more
developed risk management systems because of the reporting requirements and
therefore the results are likely to be biased towards a less effective risk management
process due to the higher proportion of unlisted respondents.
Number in % Number in % Number in %
Ownership Structure Listed 12 17,4% 11 15,9% 23 33,3%
Unlisted 25 36,2% 21 30,4% 46 66,7%
Total 37 32 69
Geographic Scope Regional 2 2,9% 4 5,8% 6 8,7%
National 21 30,4% 15 21,7% 36 52,2%
International 14 20,3% 13 18,8% 27 39,1%
Total 37 32 69
Project Size Classification Small (EUR < 5 - 10 million) 4 5,8% 3 4,3% 7 10,1%
Medium (EUR > 10 - 50 million) 24 34,8% 16 23,2% 40 58,0%
Large (EUR > 50 - 250 million) 9 13,0% 13 18,8% 22 31,9%
Total 37 32 69
Mainly
Investor-Developer
(R= 32)
Mainly
Trader-Developer
(R= 37)
Total

107
The higher percentage of unlisted respondents is encouraging as this provides insight
into this sector where previously there was no information available. Their participa-
tion also indicates that they understand the importance of information sharing in or-
der to benchmark and / or improve their risk management systems.
Geographic scope
52.2 per cent of respondents (R= 69), which geared towards their relevant domestic
market, accounted for the largest share, followed by 39.1 per cent of international
players. Furthermore, six completed questionnaires (8.7 per cent) were received from
organisations operating regionally (cf. Appendix C - Question 2). It is believed that the
more international an organisation is, the more important political risk becomes a part
of the risk management process. Due to the variety and complexity of risk related is-
sues that they face, international organisations require more structured risk manage-
ment systems with a uniform risk culture which comprises the use of common defini-
tions, support and understanding of risk management. The responses are likely to be
slightly more biased towards the behaviour of organisations, which operate within the
domestic market.
Investment volumes of individual projects
In addition to representation across developer classification and geographic scope, the
survey participants included a broad range of project sizes measured in terms of an
optimal volume for individual projects. The size categories used in the questionnaire
were selected on an exponentially increasing range size to facilitate responding and
subsequent analysis.
The question regarding the optimum individual investment volume for real estate pro-
jects was answered by 69 respondents (cf. Appendix C - Question 5); the results are
shown below.

108
Figure 5-1: Optimal volume for individual projects
It is interesting to note that, with 20.3 per cent (R= 69, multiple responses are possi-
ble), individual investments ranging from EUR 50 to 100 million were cited more often
as the optimum investment volume than the segments involving lower investment
volumes, i.e. EUR 30 to 40 million (17.4 per cent) and EUR 40 to 50 million (14.5 per
cent). Overall, there appear to be two peaks of favourite investment size, namely be-
tween EUR 10 and 30 million (50.7 per cent) and between EUR 50 and 100 million.
Only 2.9 per cent of organisations polled cited projects having volumes over EUR 250
million as being optimal. In the author’s opinion, this result also reflects the respon-
dent organisations' assessment of the fungibility of projects with differing volumes. It
should be noted that the respondents have very little inclination to accept size disad-
vantages such as cluster risks and a lack of disposability in connection with any in-
tended sale.
It can be assumed that the individual project volumes specified also take into account
the investment volume expectations of potential investors in addition to the tenancy
market situation, location, usage and the developer's competencies. This way, the de-

109
veloper wishes to secure good selling opportunities and the broadest possible buyer
spectrum.
Based on the replies to this question, the data has been re-analysed within broader
categories of project volumes into ‘small‘ (EUR < 5 - 10 million), ‘medium‘ (EUR > 10 -
50 million) and ‘large‘ (EUR > 50 - 250 million) projects. Where an organisation pro-
vided multiple responses, the allocation to a particular category depended on the
highest individual project volume specified. 10.1 per cent (R= 69) of survey participants
stated that they focus on a project volume of up to EUR 10 million. Real estate devel-
opers involved in target projects that fall into medium-size categories (between EUR
10 and 50 million) represent the largest group with 58.0 per cent. With 31.9 per cent,
organisations specialised in large-scale projects also account for a significant share.
Generally speaking, the larger the project size, the greater the time that it takes for
completion of the project. During the time of the development, market conditions
could change and the monitoring process within risk management becomes para-
mount importance. The large numbers of different parties involved in the develop-
ment of a large-scale project increases the complexity of the risk management system.
The bias towards medium and larger project volumes suggests that the results show a
more effective monitoring process than the norm due to the perception of a higher
level of risk.
Usage focus of development activities
A further question on the respondents' background relates to the usage type focus of
their products and services (cf. Appendix C - Question 4). The majority of developers
who responded pursue a product development strategy geared towards a broad spec-
trum of usage types. The development of office space and residential construction pro-
jects are the prevailing usage type among the survey participants whilst by contrast,
the development of hotels, logistics, production space and leisure facilities play only a
secondary role.

110
Figure 5-2: Usage-focus of development activities
The examination of the individual types of usage shows that, with 63 responses, the
development of office space is the prevailing usage type among the survey partici-
pants. This applies to all size categories and developer types. 17.5 per cent (R= 63)
base their strategy, either largely or exclusively, on the development of office space
(share ranging from 61 to 100 per cent). 47 developers initiate or realise housing con-
struction projects, while 36 organisations include mixed-use projects in their product
strategy. The weighting of the shopping centre / retail category is also worth mention-
ing: 34 organisations stated they have their focus in this development segment. Only
21 organisations include the development of hotels in their strategy. Real estate de-
velopments to meet the demand for logistics (R= 15) and production (R= 9) space or
leisure facilities (R= 14) play only a secondary role. This also applies to other usage
segments (R= 8), such as the development of hospitals, assisted-living facilities and
parking garages, which were mentioned by some respondents. It is interesting to note
that there is a tendency to integrate special uses and theme properties in the product
spectrum; this applies primarily to smaller organisations focused on the development
of specialised real estate and established big players. Such specialised developers typi-
cally establish long-term relationships with favoured anchors and other key tenants.

111
The advantages for developers are that they understand how these tenants run their
business, what their specifications and requirements for location are and under what
circumstances they will perform well. With that partnership-oriented background, the
development activity often becomes less speculative.
5.3 Internal corporate environment
5.3.1 Focus on risk perception
Figure 5-3 shows how the sample population’s perception of increasing risk in their
marketplace has grown over the last five years (cf. Appendix C - Question 9).
Figure 5-3: Development of risk situation
The survey results confirm the original impression that, from the developer’s perspec-
tive, the risk situation of the corporate environment has clearly intensified. 56.5 per
cent of all respondent organisations (R= 69) stated that the level of risk they face has
increased over recent years. This is of particular importance as it suggests that either
there is an increase in the perception of risk levels or a lower tolerance of risk. It is also
likely that both explanations may be applicable at the same time. Moreover, this find-
ing may also serve as an empirical confirmation of the topicality of the present study.
Of particular interest are the survey results when analysed according to size classes.
Fisher’s exact test and Cramer’s V tests show dependence between this question and
project size (Cramer’ V= 0.377; p-value= 0.002). The project size influences the assess-
ment of the development of the level of risk; companies with bigger project sizes con-

112
ceive an increased level of risk. As stated by 71.4 per cent of respondents (R= 7) active
in this size class rate, it seems obvious that the level of perception of risk for smaller
projects has decreased in recent years. The perception of risk for medium and large-
scale developments has increased. 62.5 per cent of medium size project developers
(R= 40) and 63.6 per cent of large-scale project developer (R= 22) rated the level of risk
as having increased.
Risk appetite by comparison with competitors
The question relating to the risk appetite of the respondents' own organisations, when
compared to their competitors, was intended to ascertain the survey participants' self-
image (cf. Appendix C - Question 10).
Figure 5-4: Risk culture compared to its relevant competitors
Developers tend to regard their activities as comparable as or even more cautious than
those of their competitors. 55.1 per cent of respondents (R= 69) claim a comparable
risk attitude to their relevant competitors, while 30.4 per cent position themselves as
being more risk adverse. Only 14.5 per cent stated that they have cultivated a higher
risk tolerance than their competitors.
When broken down by ownership structure, it becomes evident that privately owned
organisations tend to be more risk taking compared to publicly held organisations. Pri-
vately held developers rate themselves to 17.4 per cent (R= 46) as taking more risks
than their competitors, whereas only 8.7 per cent of publicly held organisations (R= 23)
join this self-image. At the same time, 39.1 per cent of publicly owned state to be more
risk averse, compared to 26.1 per cent held privately.

113
Concept
While the majority of respondents agree with a balanced approach to risk, far fewer
appear to have clearly defined concepts of it.
Risk in the context of real estate development has been defined as “(…) a concept used
to express the significance and likelihood of events and / or their outcomes that could
have a material effect on the goals of a real estate development organisation” (cf.
chapter 2.4). Differing points of view exist within corporate risk management, ranging
from emphasis on the potential negative impacts to focusing on improved results
through risk-oriented corporate governance. Ideally, both risks and rewards should be
taken into consideration in equal measures. An evaluation of how participating organi-
sations regard risk as a concept in their business objectives and a common understand-
ing of the concept of risk (cf. Appendix C - Question 12) is illustrated by Figure 5-5 be-
low.
Figure 5-5: Common understanding / terminology of risk
As the survey shows, 81.8 per cent (R= 66) of the developers polled follow a reward-
oriented interpretation of the concept of risk. In this regard, the relevant organisations
largely follow the principles advocated in theory. 16.7 per cent of all respondents do
not perceive a link between risks and rewards, with one organisation completely re-
jecting the reward aspect of risk. Accordingly, the expectation that developers closely
associate risk with an upside potential seems plausible. The results suggest that devel-
oper’s understanding of risk management is definitely not about completely eliminat-

114
ing risk, or not taking risks at all. Rather, developers generate value and business con-
fidence by their ability to balance and accept opportunities and risks.
The fact that 37.3 per cent (R= 67) of the survey participants did not indicate a com-
mon definition of risk across their organisation suggests that the practice of risk man-
agement has yet to be integrated into many organisations. There was an association
found during the Fisher’s exact test and Cramer’s V analyses between geographic
scope and the common understanding of risk management (Cramer’s V= 0.365; p-
value= 0.016). In this context it is to note that especially internationally active devel-
opers showed a common understanding of risk management across the organisation
with 80.8 per cent (R= 26) agreeing or strongly agreeing to this question.
5.3.2 Structure and accountability
The organisational risk management framework must ensure the proper identification,
assessment and development of suitable measures for optimizing the risk profile by
the decision makers. One condition for the effective functioning of a risk management
system is that it must be firmly rooted in the corporate organisation and corporate
management processes.
The risk and control culture is one of the vital determinants of effective risk manage-
ment. It reflects the shared fundamental framework of standards and values of organi-
sation management as well as the employees. Standards and values are part of any
corporate culture. This culture promotes the development of the organisation and its
competitive success by influencing the behaviour of the organisation’s employees. An
active risk and control culture as part of a risk-oriented organisation culture ensures
the necessary risk awareness on the part of the staff and reinforces the general accep-
tance of the risk management system.
Figure 5-6 relates to the organisation and the degree to which structure and culture
support risk management (cf. Appendix C - Question 24).

115
Figure 5-6: Efficiency of structure and culture
An organisational structure depends inter alia on its size and the nature of its activities.
A highly structured procedure with formal decision-making and reporting levels and
responsibilities may be adequate for a large organisation that has numerous divisions.
However such a structure could impede the necessary flow of information in a small
and highly entrepreneurial organisation. The organisational structure should enable
effective risk management and the carrying out of business activities to achieve the
organisation‘s objectives. The responses show that only a small minority of respon-
dents believe to have structures and cultures in place that do not support effective risk
management. However, somewhat less than half of the answers indicate improve-
ments are needed. 47.0 per cent of the responding development organisations (R= 66)
report that the organisation structure supports effective risk management. 43.9 per
cent report that there is significant potential for optimizing the organisational struc-
ture with respect to its support of risk management. Just 3.0 per cent report that the
organisational structure makes only inadequate provision for risk management re-
quirements. 6.1 per cent of the survey participants were not able to respond to this
question. 42.4 per cent of the responding development organisations (R= 66) - accord-
ing to their own reporting - enjoy a suitable corporate culture that meets the require-
ments of effective risk management. At 48.5 per cent of survey participants, the corpo-
rate culture needs improvement in terms of functional support for corporate risk man-
agement. 6.1 per cent describe their corporate culture as not supportive of risk man-
agement and 3.0 per cent of the survey participants were not able to respond to this
question.

116
Primary responsibility
In order to provide an insight into the organisational structure and relevance of risk
management in practice, the survey participants were asked to state who is primarily
responsible for the risk management within their respective organisations (cf. Appen-
dix C - Question 13). The result, which is based on the responses from 67 organisa-
tions, is summarised in Figure 5-7 (multiple responses were possible).
Figure 5-7: Primary risk management responsibility
The survey results indicate corporate practice within the real estate development in-
dustry. They show that primary responsibility for risk management clearly lies with or-
ganisation management. 67.2 per cent (R= 67) parties polled stated that risk manage-
ment is primarily the responsibility of the CEO and therefore ‘a matter for the boss‘.

117
This result indicates again the high priority of risk management. But this result begs the
question as to whether the responsible executives have sufficient knowledge and ex-
pertise to make the required decisions necessary for risk management. Real estate de-
velopment involves areas such as treasury, hedging, or environmental claims which
require a high degree of specialisation which may not be the particular strength of sen-
ior executives. An effective and transparent involvement of subordinate experts and
professional advisors is often required and often leads to the establishment of risk
management committees.
In 46.3 per cent of cases, business unit executives are responsible for risk manage-
ment. From the point of view of the relevant survey participants, a tight integration of
risk management objectives and tasks with strategic and operative development activi-
ties opens up the greatest synergy potential.
Often, this responsibility is assigned to the finance and accounting function, bringing
risk management under the ‘jurisdiction‘ of the Chief Financial Officer (41.8 per cent)
or the Financial Controller (14.9 per cent). The preference of attaching the risk man-
agement supervisory function to the financial division can, at least in part, be justified
by the fact that the financial function is responsible for summarising the presentation
of the overall business situation of a real estate development organisation. Moreover,
the advantages arising from the co-operation with external experts and auditors, who
also collect and evaluate information in the organisation's risk situation, can be effi-
ciently leveraged. 10.4 per cent of the responding development organisations have es-
tablished a centralized coordinating point to facilitate risk management within the or-
ganisation. In such organisations, a dedicated Chief Risk Officer takes ownership for a
continual examination of risk management issues. Within 4.5 per cent of organisations,
the organisational structure in terms of the allocation of responsibilities and compe-
tencies is defined either only in part or not at all. These organisations may be charac-
terised by a certain lack of consensus as to who is responsible for systematic risk as-
sessment, risk control and a timely reporting process as appropriate for the individual
levels.
The results support the thesis, that as a rule, there is no ‘one size fits all‘ answer to the
allocation of internal responsibility for risk management. Rather, the specific allocation
will depend on the individual situation of each organisation. Nonetheless, organisa-

118
tions that have assigned responsibility for the implementation of risk management to
two or more different divisions have to ask themselves whether or not a uniform ap-
proach is perhaps more effective than where tasks and responsibilities are fragmented.
Risk management committee
In order to support organisation management and / or those in charge of risk man-
agement, a function or a body may be created which handles the tasks arising from a
centralised and organisation-wide control of risk management and risk aspects of spe-
cific development projects. 66 developers answered the question regarding the exis-
tence and the composition of a risk management committee (cf. Appendix C - Question
25). 47 organisations stated that they have a risk management committee. Where such
a committee is established, 44 survey respondents provided information on the com-
position of the committee.
Figure 5-8: Specialized committee overseeing risk management

119
The management of development organisations enjoys top priority within the compo-
sition of any monitoring body. This result is also reflected in the evaluation of the
question regarding primary responsibility for risk management. If and when required,
13 per cent, (R= 44), external experts are involved in an advisory capacity. External pro-
fessionals provide management a unique, independent and therefore more objective
view, which can contribute to the achievement of organisation’s objectives.
Thus, the composition of risk management committees combines a high level of exper-
tise and decision-making authority. It would appear that this combination has also
proven successful with regard to the examination and approval of real estate projects
and the possible imposition of conditions and / or the development of project-related
risk management measures to be taken.
The comparatively low level of involvement of the internal audit function is an inter-
esting aspect to note, since the monitoring of risk management effectiveness by way
of regular checks is one of its foremost tasks.
Exact Fisher and Cramer’s V tests show an association between project size and the
existence of a specialised risk management committee (Cramer’s V= 0.398; p-value=
0.005). The project size of a company influences if there exists a specialised risk man-
agement committee or not. The majority of developers of smaller and larger scale pro-
jects have a risk management committee. Most of the medium projects incline on hav-
ing no specialized committee.
Training
The question regarding adequate risk management training for organisation manage-
ment and staff (cf. Appendix C - Question 24) is of paramount importance and has
been answered by 66 survey participants.
The potential for improvements is evident: for instance, only 16.7 per cent of all re-
spondents (R= 66) stated that they receive adequate training. A further 77.2 per cent
reported that they receive no suitable or, at best, inadequate training. 6.1 per cent of
responding developers do not know if adequate risk management is provided.

120
Figure 5-9: Risk management training
This survey result allows two interpretations: on the one hand, it could be concluded
that real estate development organisations provide insufficiently for the training of
their staff and that risk management expertise and skills are insufficiently reinforced
by training measures. On the other hand, the survey result could be interpreted as be-
ing indicative of a lack of suitable training offers addressing risk management. This is a
more likely interpretation. Chapter one has already identified a lack of industry-specific
insights, both from a scientific and a practice-oriented perspective. This result under-
scores the need for industry-specific risk management know-how and therefore the
topicality and the importance of the study of this empirical data
IT solutions to support effective risk management
Modern information technology plays a key role in achieving risk management objec-
tives, offering a multitude of ways to optimize the processes and data that constitute
the foundations of risk management. Effectiveness and efficiency of risk management
during all phases depend inter alia on the performance of the organisation's IT sys-
tems. A distinction can be drawn between simple and complex systems, with inte-
grated management information systems probably having the highest degree of com-
plexity (cf. Appendix C - Question 23).

121
Figure 5-10: IT solutions in risk management
The survey revealed that 41.5 per cent of all respondents (R= 65) support risk man-
agement via IT solutions, with the use of standardised stand-alone solutions, such as
Microsoft Excel, dominating. These solutions are characterised by a comparatively low
level of automation and networking, which - in principal - favours the development of
island solutions. 15.4 per cent of respondents use stand-alone applications, with a
preference for networking while 10.8 per cent do not operate with an interface to
other organisation applications or systems. Only 16.9 per cent of all respondents oper-
ate a comprehensive and fully integrated management information system (MIS),
while 15.4 per cent of all survey participants reported that they have not integrated
risk management into their corporate IT solutions. The degree of complexity of an IT
system (which is an integral part of an organisational structure) is generally a good in-
dication of the importance that an organisation places on risk control and the re-
sources made available for this purpose.
The survey results would indicate a lack of adequate IT products that meet the specific
requirements of risk analysis for real estate developments. Increased activities on the
part of software developers would certainly be required to improve this situation by
facilitating the cost-efficient adjustment to the specific circumstances of individual or-
ganisations. Exact Fisher and Cramer’s V analyses reveal that there is an association

122
between project size and IT support for risk management systems (Cramer’s V= 0.359;
p-value= 0.019). The project size of the companies affects the use of IT in their risk
management system. All companies with large project sizes use IT as part of their risk
management, whereas, some companies with smaller and medium project schemes do
not use the IT as part of their risk management. The larger the project size of the de-
veloper, the complexity of the project is likely higher. IT is being involved to reduce the
complexity and to enhance efficiency.
The effective and efficient execution of an organisation-wide risk management process
requires the use of an adequate software solution. 67 organisations responded to the
question whether appropriate tools are being used in support of risk management (cf.
Appendix C - Question 21).
Figure 5-11: Tools for risk management
More than 60 per cent see need for improvement or have no appropriate IT tools,
which is a very large portion. Thus 28.4 per cent of the responding organisations (R=
67) confirmed that appropriate tools support risk management. With 34.3 per cent of
respondents, certain tools have been established, but do not adequately satisfy the
requirements of the organisations in question. Moreover, about 29.9 per cent of the
organisations map the risk management process entirely without appropriate software
solutions. Another 7.5 per cent were not able to respond to this question because they
did not know the answer.

123
Many organisations in the size ranges surveyed sooner or later come up against their
limits when using standard products as well as IT solutions developed in-house.
Fisher’s exact test and Cramer’s V have indicated an association between ownership
structure and appropriate tools to support risk management (Cramer’s V= 0.351; p-
value= 0.027). The ownership structure has influence on supportive risk management
tools. Only approximately 20 per cent of the listed respondents do not have risk man-
agement tools to support their risk management process. However, a much larger
proportion of approximately 50 per cent of unlisted respondents do not make use of
any such tools. This association is expected to result from accounting standards (such
as the German §289 HGB or IFRS 7) which request listed companies to establish appro-
priate tools to support, inter alia, the reporting.
5.3.3 Risk management strategy
In order to obtain an overview of the status quo of risk management based on empiri-
cal data, developers were asked to provide information on the existence of an organi-
sation-wide risk management strategy (cf. Appendix C - Question 6). The results are
summarised in Figure 5-12 below.
Figure 5-12: Risk management strategy
The results of this study can be broken down into two distinct categories: organisa-
tions with a defined risk management strategy (39.1 per cent, R= 69), and those with-
out risk management or overarching strategies or where risk management and over-
arching strategies are only established in parts of the organisation (60.9 per cent). No

124
less than 36.2 per cent of all developers polled stated that they had not yet finalised
the formulation of a risk management strategy or have identified a need for optimiza-
tion with regard to material strategic issues. A value of this order allows two interpre-
tations: a number of organisations may have corporate strategies in place that entail
some risk policy implications but do not fulfil the requirements of an organisation-wide
risk management or that, as a first implementation step, initially concentrate on meet-
ing the minimum statutory requirements. As compliance with regulatory requirements
was not a key driver of creating a risk management system in most cases but rather
the provision of support for management in their decision-making process, this would
tend to support the first interpretation. 24.7 per cent of all respondents reported hav-
ing no enterprise-wide risk management, with 11.6 per cent of all organisations polled
planning the development of risk-related strategic approaches. It would appear self-
evident that the lack of a formulated and frequently communicated risk management
strategy does not support consistent risk awareness in relevant organisations, nor is it
likely to induce the staff members to be uniformly conscious of risk in their actions.
However, the statements derived from the overall picture cannot necessarily be ap-
plied to the evaluation results of different ownership categories. Exact Fisher and
Cramer’s V analyses show a very strong association between ownership structure and
formulation of an enterprise wide strategy for managing risks (Cramer’s V= 0.412; p-
value=0.007). The ownership-based analysis reveals a tendency towards increasing
professionalism of risk management on listed organisations. For instance, 65.2 per cent
of the relevant organisations (R= 23) apply an organisation-wide risk strategy. A further
26.1 per cent has developed initial risk strategy approaches but stated that there is a
significant need for improvement. In contrast, 32.6 per cent of non-listed organisations
do not have an enterprise-wide risk management strategy in place.

125
5.3.4 Risk management as an integral aspect of management
A key principle of risk management is that it should be fully integrated into an organi-
sation‘s business planning processes. The question as to whether organisations include
risk management as an integral component in all the relevant strategy, control and
monitoring processes is therefore of interest in order to be able to analyse risk man-
agement practice among leading European real estate development organisations (cf.
Appendix C - Question 12). Figure 5-13 presents the answers of 67 responding organi-
sations.
Figure 5-13: Risk management in strategy, control and monitoring processes
A majority of organisations agreed (49.3 per cent, R= 67) or strongly agreed (23.8 per
cent) including risk management as an integral component in all relevant processes.
25.4 per cent disagreed, reflecting a fragmented approach towards the management
of risks.
Risk management principles
It is normally at Board level that the parameters of systematic risk management are
determined and consequently applied across all corporate levels. These parameters
are then outlined in the form of risk management policies and principles. A formal pol-
icy framework includes specific guidelines as well as the more general principles that
shall apply to the aspects of the business and the management of its risks. This in-
cludes, inter alia, binding statements on security objectives, selected assessment

126
methods, decision-making criteria for risk prevention measures, organisational aspects
of risk management and reporting parameters. At the same time, a standardised no-
menclature is included for reference in order to facilitate clear interpretation. Policies
enable risk owners to understand what the organisation intends to accomplish.
The relevant rules and regulations may range from written general frameworks to de-
tailed directives and comprehensive manuals. Moreover, policies can also consist of an
implicit understanding of the orientation of risk-policy aspects, without being docu-
mented in writing. This would appear especially true for smaller organisations.
The survey participants were asked to provide details on the existence of written
statements regarding risk management (cf. Appendix C - Question 24). This question
was based on the preliminary impression that the majority of developers do not base
their risk management on written guidelines.
Figure 5-14: Written statements on risk management
As illustrated by Figure 5-14, this assumption can now be considered as having been
essentially verified by 40.9 per cent of respondents (R= 66). The survey results show
that clearly defined, written risk policies are not widely used in practice. 53 per cent of
all respondents stated that they use written risk management statements. In the case
of approx. 28.8 per cent, risk-policy objectives seem to be firmly entrenched at man-
agement level, but are not sufficiently or conclusively set down in writing and show
potential for improvement. The fact that 6.1 per cent did not have the knowledge to
answer this question would indicate that an organisation-wide risk management ap-
proach has not yet been established within these organisations. Exact Fisher and

127
Cramer’s V analyses show a strong association between written risk management
statements and developer type (Cramer’s V= 0.405; p-value= 0.009) and geographic
scope (Cramer’s V= 0.381; p-value= 0.001) of the respondents. Approximately 75 per
cent of the investor developers have clear and written management statements on risk
management and approx. 60 per cent of the responding trader developers have no
management statements on risk management.
The comparatively small number of employees, flat hierarchies and strong corporate
culture would suggest that highly formalised risk management processes may be re-
garded as not appropriate within the real estate development industry. This assump-
tion is supported by the fact that organisations may reinforce their risk management
philosophy not only through written statements and policies but also through every-
day actions.
However, this assumption is clearly refuted by the results regarding the uniform un-
derstanding and definition of risk that applies organisation-wide (cf. Figure 5-7), indi-
cating that in a large number of cases a uniform understanding has only partially been
established, if at all. As a consequence, risk management will be characterised by a
lack of consistency and uniformity, with the risk tolerance of the individual staff mem-
bers being the primary driver of their decision-making behaviour. However, consistent
and risk-sensitive behaviour of all employees is an indispensable prerequisite for effi-
cient risk management. Significant improvements in risk management should be
achieved if staff was sufficiently aware of the risk management policies and strategies
formulated by organisation management and were therefore better equipped to re-
spond to risks and opportunities in a more effective manner and in accord with the or-
ganisation's level of risk tolerance.

128
5.3.5 Overall confidence in risk management
Figure 5-15 illustrates the effectiveness of the risk management processes to handle
selected risks at corporate level from the perspective of the developers polled. While
using self-rating on the effectiveness of the respondents’ risk management may suffer
from subjective bias, this question nevertheless provides an indication as to the self-
perception of survey participants. It was expected that the answers would be, overall,
rather positive.
Figure 5-15: Risk management capability on organisation level

129
Figure 5-16 evaluates how the developers view the effectiveness of their risk manage-
ment processes to deal with risks, which the participants consider to have a significant
impact on the organisation’s objectives on a project level.
Figure 5-16: Risk management capability on project level

130
Undoubtedly there is a very high level of confidence amongst real estate developers
that their risk management is in fact effective, with significant risks being identified,
assessed and managed as part of the entire process. Figure 5-17 illustrates the fre-
quency distribution with regard to the developers' confidence in their own risk man-
agement (cf. Appendix C - Question 22).
Figure 5-17: Overall confidence in risk management
3.0 per cent (R= 66) are absolutely convinced of the quality of their risk management
system, 89.4 per cent of responding developers believe, to a greater or lesser extent,
that their own risk management process identifies all potential risks that could jeop-
ardize their existence, that it assesses these risks and has them adequately under con-
trol. Only 7.6 per cent stated that their confidence in their own risk management ca-
pabilities is either limited or non-existent.

131
5.4 Risk management process
5.4.1 Setting corporate objectives
As was ascertained in the theoretical part of this study, the definition of corporate ob-
jectives is a vital prerequisite for the effective management of risks. It was noted, for
instance, that risk is, inter alia, defined as the possibility of deviating from a given tar-
get. All organisations set themselves specific strategic and operative goals, with a dis-
tinction to be drawn between output-related, financial and social goals. The signifi-
cance of effective risk management for the achievement of corporate objectives will
be described below (cf. Appendix C - Question 12).
Figure 5-18: Risk in achievement of objectives
98.5 per cent of respondents (R= 67) agree or strongly agree that effective risk man-
agement is important for the achievement of corporate objectives. This result demon-
strates that effective risk management is indispensable for sustained corporate success
in real estate development. There is also an inter-dependence found between devel-
oper type and the importance of risk management (Cramer’s V= 0.342; p-value= 0.013)
during the Exact Fisher and Cramer’s V analyses; the results of the questionnaire con-
firm that issue that especially investor developer strongly agree (71 per cent, R= 31)
with the importance of risk management in achieving corporate objectives.
85.1 per cent (R= 67) agreed or strongly agreed that their organisations have a correct
understanding of the scope of risks they are required to assume in order to achieve

132
corporate goals. However, 14.9 per cent of the respondents stated that they are not
aware of the risks to be assumed. In all probability, the relevant organisations will not
be able to determine their appropriate and individual level of risk appetite.
Almost all respondents affirmed their belief in the significance of risk management and
awareness of the risk appetite of their organisations, yet 21.2 per cent of all respon-
dents (R= 66) stated that their organisations fail to encourage the conscious assump-
tion of risk in order to achieve corporate goals. Consequently a confirmative associa-
tion has been identified between the ownership structure of the respondent and the
risk attitude to achieving the organisation’s objectives during the Exact Fisher and
Cramer’s V tests (Cramer’s V= 0.356; p-value= 0.023).
5.4.2 Motives and goals of risk management implementation
The importance and benefits of risk management have already been outlined in the
theoretical part of this thesis. The presentation and description of the objectives and
motives of real estate development organisations are intended to illustrate the fun-
damental role in the formulation and definition of a risk policy. The starting point of
the analysis is the expectation that the optimization of corporate decisions lies at the
heart of the real estate developers' risk-policy considerations.
In order to test this, the organisations polled were presented (cf. Appendix C - Ques-
tion 11) with a catalogue of potential drivers for the implementation of risk manage-
ment (multiple responses were possible). The following Figure 5-19 shows the ranking,
in order of importance, of the key risk management drivers for the 69 developers
polled that formed the survey population.

133
Figure 5-19: Drivers for risk management implementation
Having been identified by 69.6 per cent (R= 69), the request by senior leadership is the
primary driver for the implementation of risk management in corporate practice. The
results strongly points to the conclusion that the respondents' risk management phi-
losophy is driven from the top down and consequently that value contribution attrib-
uted to effective risk management is considered very high. The creation of a competi-
tive advantage ranks second with 46.4 per cent. Accordingly, developers do not view
risk management as a bureaucratic tool favoured by auditors, but rather as a control
instrument to ensure sound business decisions on a sustainable basis. For instance,
43.5 per cent of all organisations polled integrate risk management as an additional
control instrument for a successful decision-making process. Taking this result into ac-
count, survey participants demonstrate confidence that the corporate decision-making
process, which is - at present - strongly characterised by intuitive judgement calls, will
become increasingly objective and fact-based by the incorporation of risk management
techniques. Other drivers are the control and / or reduction of operational losses (43.5

134
per cent) as well as the optimization of capital allocation processes (27.5 per cent).
Overall, the survey findings suggest that senior management expectations and busi-
ness imperatives - rather than regulatory requirements (21.7 per cent) or industry
trends (5.8 per cent) - are driving forces in risk management. This indicates that devel-
opers try to realize the benefits of effective risk management.
5.4.3 Risk identification
During the risk identification phase, all operational risks should be identified in a sys-
tematic and timely manner, assessing their potential impact on a real estate project
and the overall risk position of the organisation. This is a prerequisite for any evalua-
tion of the risks identified and the subsequent focus areas of the risk management
strategy.
Thorough and comprehensive identification of risks is therefore of vital importance.
The survey on the ability of organisations to identify its main risks showed that 92.8
per cent of all survey participants (R= 69) almost unanimously stated that they do not
consider the identification of risks to be difficult (cf. Appendix C - Question 14). Further
statistical analyses show that there is an association especially between developer
type and risk identification during the Exact Fisher and Cramer’s V tests (Cramer’s V=
0.341; p-value= 0.025).
Figure 5-20: Risk identification

135
The method by which the organisations identify their risks appears to be unsystematic
as only 17.4 per cent of the 69 respondents stated that they use a comprehensive risk
catalogue for risk identification purposes (cf. Appendix C - Question 15). A further 33.3
per cent possess and use risk catalogues of sorts but recognise that there are deficien-
cies. In contrast, 49.3 per cent stated that they do not maintain any risk catalogues. It
seems doubtful whether such organisations are in fact able to carry out a comprehen-
sive identification and assessment of their risk position. This reveals that there is a lot
of room for improvement in this respect. At least, 26.5 per cent of all organisations
that do not use a risk catalogue for risk identification (R= 34) recognise this as a short-
coming and plan to remedy this situation.
Figure 5-21 Risk Catalogue

136
Relevance of risk types for development organisations
In order to perform an in-depth assessment of the relevance of different risk types, the
survey participants were presented with a catalogue of risk types (cf. Appendix C -
Questions 7 and 8). They were asked to apply these firstly at organisational level and
then at project level.
As a first step, a scale ranging from ‘low‘ through ‘medium‘ to ‘high‘ and ‘very high‘
was used to obtain information on the relevance of certain risks regarding their signifi-
cance to achieving the organisation’s objectives. The next question asked the partici-
pants to describe the effectiveness of their own risk management to cope with those
risks, choosing one out of five options, namely ‘very ineffective‘, ‘ineffective‘, ‘effec-
tive‘, ‘very effective‘ and ‘don't know‘.
The risk universe at corporate level is highly complex. For practical reasons, the par-
ticipants were presented with a list of 14 different options and a 15th ‘other’ option to
cover for significant omissions. Figure 5-22 illustrates the relevance of selected risks at
corporate level from the perspective of the developers polled, with the various risk
types being ranked in their order of significance for the responding organisations.

137
Figure 5-22: Significance of risks on organisation level
The risk universe, which is associated with real estate investments in general and real
estate development in particular, was documented in the theoretical part of this study.
The developers polled were given 17 different options and an 18th ‘other’ option to
cover for significant omissions. The following Figure 5-23 highlights the risks on project
level that participants consider to have a significant impact on the organisation’s ob-
jectives

138
Figure 5-23: Significance of risks on project level
Most development organisations face a number of principal business risks that are
critical to their success, survival and strategy. It is important that developers under-
stand what these risks are and what risks are regarded by the industry as being ‘top
risks‘. There is a high consensus amongst participants on the categories of risks which
have a significant impact on the real estate developer both at project and corporate

139
levels. However, there are fewer consensuses amongst the participants with regards to
the ranking order on corporate level than at project level. For example the highest
consensus was only 44.1 per cent of participants ranking ‘high’ or ‘very high’ the sig-
nificance of ‘unfavourable financial market events’ to achieving the organisation’s ob-
jective but 63.7 per cent ranked development / conception risk, which tops the list, as
‘high’ or ‘very high’.
5.4.4 Risk assessment
The consistent application of risk assessment methods constitutes a critical success
factor for risk management, which provides the framework for ascertaining the signifi-
cance of risks and their probability in order to derive appropriate risk management and
monitoring measures. The survey results reveal a substantial deficit in such a consis-
tent risk assessment concept (cf. Appendix C - Question 14).
Figure 5-24: Aspects of risk assessment
44.1 per cent of respondents (R= 68) stated that they do not apply an integrated com-
prehensive risk assessment approach. This result is surprising in that the survey par-
ticipants are, according to their own assessment, convinced that their own risk man-
agement is, in principle, effective. It would be reasonable to assume that organisations
focusing on projects with higher investment volumes apply a more professional ap-
proach. However, an analysis of the answers, when differentiated according to size
categories, refutes this assumption. Exact Fisher and Cramer’s V analyses show a very

140
strong association between ownership structure and the assessment of potential im-
pacts of risk materialising (Cramer’s V= 0.489; p-value= 0.000). About 9 per cent of the
responding unlisted companies find risk assessment difficult compared to 35 per cent
of listed companies
When evaluating and analysing risk, any given real estate developer will be required to
determine two factors: firstly, the probability of risk and secondly, the extent of the
possible damage in case the relevant risk materialises. The survey results reveal a
trend that the survey participants have fewer difficulties in making an informed as-
sessment of the possible implications of an event than in estimating its probability. No
less than 80.1 per cent (R= 68) stated that they had no difficulties assessing the impli-
cations of risk, while 72.1 per cent (R= 68) stated that they had no difficulties estimat-
ing the probability of any given risk materialising.
Risk assessment on strategic and operational level
The results to the question, whether developers implement risk assessments across
the organisation in a timely way at strategic and operational level (cf. Appendix C -
Question 16), are illustrated in Figure 5-25.
Figure 5-25: Risk assessment on strategic and operational level
Organisation-wide risk management should, as a rule, take into consideration all stra-
tegic and operational levels within the organisation. 30.9 per cent (R= 68) of all survey
participants agree with this approach. A total of 22.1 per cent stated that they do not

141
take strategic or operational aspects into consideration, with 11.8 per cent intending
to rectify this situation. The majority of 47.1 per cent of all respondents, initiate regu-
lar risk assessments at both the strategic and operational level, but recognise that
there is significant room for improvement.
Methods and method sets of risk assessment
The theoretical realm of literature provides a host of methods and techniques for the
general assessment of risk. Figure 5-26 illustrates the frequency distribution of the
methods used by the survey participants (cf. Appendix C - Question 18) for the assess-
ment of risk (multiple responses were possible). Overall, subjective assessment meth-
ods (‘gut feeling‘) appear by far the most popular.
Even today, with the availability of sophisticated analysis methods, the determination
of the risk associated with individual developments depends primarily on the subjec-
tive and intuitive view of the relevant developer. For example, when assessing risks,
69.9 per cent (R= 69) prefer an assessment based on subjective views of individual rep-
resentatives. In this case, great stock is being placed on the personal experience of the
person carrying out the assessment as well as that person's ‘common sense‘ or ‘gut
feeling‘.
With 43.5 per cent each, scenario techniques and sensitivity analysis are also popular
risk assessment methods. 34.8 per cent stated that they use external experts and spe-
cialists. However, this does not mean that the risk assessment function is outsourced:
all of the organisations polled carry out their own assessments of the risk situation,
even when using third-party services. This study would allow for the conclusion that
developers avail themselves of independent expert opinions in order to verify their
own assumptions. 17.4 per cent consider a risk-specific approach to premiums or dis-
counts on multipliers as being suitable to assess identified risks. The use of simulation
methods is lower than expected at 10.1 per cent of responding developers. It is also
noted that with 7.2 per cent, the application of the value-at-risk method is not a popu-
lar technique within this industry. Having been mentioned by only 4.3 per cent, deci-
sion tree procedures are largely unused.

142
Figure 5-26: Risk assessment methods
The reasons for the preferred application of these assessment approaches and proc-
esses are likely to be based on their ease of use and staff qualifications.
In theory, the application of suitable analytical techniques, the assimilation of realistic
information and a comprehensive understanding of risk enable developers to assess
risks both accurately and conclusively. In addition to the generally large amount of
risks as well as financial and time-related restrictions, further critical factors include
the incompleteness of data in many real estate (sub-)markets in particular. For this

143
reason, a wide range of models for the quantification of risks arising within the real
estate sector may be of considerable benefit from a theoretical perspective. Yet their
practical use and the feasibility of calculations of risk measures, such as standard de-
viation, variance or value-at-risk, appear limited. Insufficient depth and density of
comparable data as well as the lack of sufficiently long running time series may be the
reason for its limited use. Table 5-3 provides an overview of a range of risk assessment
methods
Table 5-3: Number of risk assessment methods
Only 8.7 per cent of all real estate developers (R= 69) use one single evaluation
method alone, with the emphasis being on the individual subjective assessment (five
out of six responses).
91.3 per cent of all survey participants prefer the use of multiple criteria as part of
their risk evaluation. The focus is on a method set consisting of at least two different
methods, with the use of three methods being ranked first (29.0 per cent). Not less
than 40 per cent of all survey participants use four or more methods. On average, the
survey participants use a method mix consisting of 3.5 different methods for risk as-
sessment.
The most common combination of methods was a combination of the creation of sce-
narios, sensitivity analyses and insights gained from subjective evaluations of individu-
als. This would seem to indicate that quantitative results gained from any evaluations
play a supplementary role to subjective personal evaluation, which is far easier to carry
out.
The preference for method sets over any single method can be explained by the fact
that the main problem encountered during risk assessment is the procurement of data
material and only to a lesser extent the processing of such data using the appropriate
methods. Moreover, owing to the use of information technology, the application of
method sets reduces the input in terms of time, costs and labour.
Number of methods 1 2 3 4 5 6 7 Total
Total number of responses 6 16 20 10 5 8 4 69
Responses in % (R= 69) 8,7% 23,2% 29,0% 14,5% 7,2% 11,6% 5,8% 100,0%

144
Information needs at project level
The existence of an in-depth analysis of project information is a crucial factor of the
investment decision process and the evaluation of a risk profile. Indeed, 66 survey par-
ticipants reported a comprehensive need for information (cf. Appendix C - Question
20). The results are summarised in Figure 5-27 (multiple responses were possible).
Figure 5-27: Information demand on project level

145
An analysis of the priority of information for real estate developers at project level re-
vealed that information on the tenancy market is clearly the most important. The real
estate developers polled named both the demand (84.8 per cent, R= 66) and the sup-
ply (62.1 per cent) on the tenancy markets and market rents (71.2 per cent) as the
three most important types of information for risk assessment purposes in connection
with real estate projects. Information regarding vacancy rates (57.6 per cent) and ab-
sorption times (33.3 per cent) complete the evaluation of the relevant tenancy market.
The significance of this information may also be driven by the growing popularity of
transparent valuation methods, such as the discounted cash flow (DCF) method. A DCF
valuation is therefore, among other things, based on assumptions regarding market
rents, vacancy and absorption scenarios as well as rent increases. Accordingly, a thor-
ough evaluation requires in-depth and current knowledge of the relevant market seg-
ment.
Further significant information needs to exist with respect to data on demand in the
transaction market (53.0 per cent) and transaction market liquidity (27.3 per cent). An
informed assessment of disposability and developer profit is only possible on the basis
of this information. 47.0 per cent of respondents take into consideration information
on the general economic forecasts.
Only 18.2 per cent survey participants have an information need for project-related
data on the general framework of taxation. Tax aspects such as land tax, property
transfer tax and depreciation options are specific to the real estate development in-
dustry. When a completed property is intended for sale, tax-related ‘deal-breakers‘ for
potential investors are fully researched.
The reason for the comparatively low level of interest in the transaction markets may
be found in the lack of statistically valid historical and actual data regarding compara-
ble transactions of the various usage segments. As a consequence, substantiated re-
search is difficult to carry out. It is in particular the information on yields, liquidity of
various markets and segments that would constitute a solid basis for the investment
decision-making process associated with development projects and for ongoing report-
ing and control.

146
Time dimension of risk assessment
Given the constant change in framework conditions, risk management should be a
continuous process throughout the time span of real estate development rather than a
one-off assessment. Risk information should be collected on a regular basis in order to
be able to recognize changes to existing risks as well as the emergence of new risks.
The routine assessment of the risk situation of any given organisation and its potential
impact on the business are vital components of risk management. In order to gain in-
sights into the frequency of risk analysis, the survey participants were given the choice
between five different frequencies (cf. Appendix C - Question 17). The results of the
survey revealed that quarterly / tertially assessment is most popular, but no single fre-
quency was chosen by a majority of respondents (cf. Figure 5-28).
Figure 5-28: Time dimension of risk assessment
In this context it is quite remarkable that the focus is not so much on longer periods
(“yearly” was cited by 12.1 per cent of the survey respondents (R= 66) and “half-
yearly” by 10.6 per cent), but rather on short intervals (42.4 per cent) in the form of
quarterly or tertiary analysis. The emphasis on this time interval could be a reflection
of or coincides with financial reporting requirements; both publicly traded and pri-
vately held organisations must disclose material changes to their risk position to

147
shareholders in order to present a fair view of future business trends in the context of
their quarterly reporting.
19.7 per cent of developers polled carry out a monthly assessment of the risk situation.
Only 15.2 per cent do not routinely assess their overall risk situation at pre-defined in-
tervals. However, the fact that no specific evaluation period has been determined is
not necessarily an indication of less systematic risk management. The survey partici-
pants cited project-related factors and ad-hoc evaluations as appropriate times for an
assessment of the risk situation. Another organisation stated that its assessment inter-
vals are aligned with the timing of board meetings.
5.4.5 Risk control
Risk control is one of the core activities, consisting of a tool set consisting of various
measures. It is intended to improve the risk position as part of risk optimisation. The
aim is to initiate suitable measures, using the data collected and interpreted, in order
to achieve corporate objectives while taking into consideration the specific risk appe-
tite of the organisation. This may result in the prevention, reduction or transfer of risk.
The question of how developers address material risks that may threaten their organi-
sation (cf. Appendix C - Question 19) has been answered by 67 organisations (multiple
responses were possible). The results are summarised in Figure 5-29 below.
With 67.2 per cent (R= 67), the situation-specific derivation of ad-hoc measures consti-
tutes the preferred practice for the optimisation of the risk situation. The systematic
development of an action task list is carried out by 47.8 per cent of the responding or-
ganisations, with the risk-policy measures being subject to periodic monitoring. 21.4
per cent organisations stated that a pre-defined risk owner controls the relevant
measures. However, only 29.9 per cent document the measures used in order to ana-
lyse their effect. 1.5 per cent does not take or complete any measures for the optimi-
sation of the risk situation.

148
Figure 5-29: Measures to optimize the risk situation
These results would permit the conclusion that developers essentially respond to their
risk situation in a reactive manner. Ultimately, the preference for ad-hoc measures im-
plies that a deviation from the target has occurred or that the relevant risks have in
some part materialised. Active risk management, by contrast, is proactive, directing
management attention to uncertainties and risks before the events have happened,
when there are still opportunities to do something to avoid, mitigate, or manage them
or to stop a project if they cannot be managed (cf. chapter 3.3.5). It should be feasible
to achieve an increase in efficiency if developers designed their risk management as a
proactive process that is integrated into their business processes and both anticipate
and handle any risks associated with these business processes. Such risk-oriented or-
ganisation management would ultimately facilitate the leveraging of any opportunities
that may arise.

149
5.4.6 Risk monitoring
In this section the questions seek to establish how organisations address or manage
their risks and how management activities and risks are monitored and reported.
Reporting
Figure 5-30 provides an overview of key issues regarding the practical application of
risk-related reporting in the real estate development industry (cf. Appendix C - Ques-
tions 21 and 24).
Figure 5-30: Reporting policies and processes
Of the responding real estate developers, 33.3 per cent (R= 66) report a clearly defined
policy and process for risk reporting. 33.3 per cent report that the beginnings of a re-
porting system are in place, but state nevertheless that there is significant potential for
improvements with respect to risk reporting. As many as 31.8 per cent state that they
have no risk management reporting in place; 1.6 per cent cannot conclusively answer
the question. Exact Fisher and Cramer’s V tests show there is an association between
geographic scope of the respondent’s organisation and a clearly defined risk reporting
process (Cramer’s V= 0.332; p-value= 0.040). The results of the responses emphasize
the test as more companies with an international scope have a clearly defined policy
and process for risk reporting than companies with national scope.

150
A functional reporting concept has been designed by 22.7 per cent per cent of re-
sponding real estate developers (R= 66). 45.5 per cent report that there is significant
potential for improvement with respect to functional risk reporting. As many as 28.8
per cent state that they have no functional risk management reporting in place; 3.0 per
cent cannot conclusively answer the question.
47.7 per cent (R= 65) state that reporting and communication processes between staff
and top management support the effective management of risks. 41.5 per cent iden-
tify a potential for optimization with respect to communications between staff and top
management as regards risk management; only 9.2 per cent state that communication
barriers are an obstacle to effective risk management.
Well over 65.2 per cent (R= 66) indicate, that the senior management is receptive to all
communications about risks, including bad news.
Risk monitoring
In order to gain insights into the risk monitoring of leading developers, a series of
questions (cf. Appendix C - Questions 21 and 24) were formulated whose results are
summarised in Figure 5-31 below. It is noted that as tasks become more specific, fewer
and fewer respondents answered in the affirmative.
Figure 5-31: Aspects of risk monitoring

151
Monitoring and reviewing risks can be described as being established in most of the
industry. This is confirmed by 48.5 per cent of responding developers (R= 66), another
43.9 per cent report that they have developed activities in this area, but that there is
still significant potential for optimization. Only 6.1 per cent do not undertake any
monitoring and review of risks in the achievement of the objectives. This underlines
the significance of risk management. A clear assignment of responsibilities in connec-
tion with continuous monitoring of risk categories is affirmed by 34.8 per cent of the
responding organisations (R = 66). 42.4 per cent have established certain responsibili-
ties, but ultimate accountability has not been fixed in these organisations. 15.2 per
cent of the developers report not having established any responsibilities; 7.6 per cent
are unable to provide a definitive answer to this question.
About 32.8 per cent of respondents (R= 67) monitor the risk environment. In this proc-
ess, changes to risks faced by the organisation are continuously identified, assessed
and reported. 32.8 per cent of responding developers endeavour to maintain adequate
control over changes to the risk situation which could impact their corporate goals, but
report significant need for optimization in this context. 26.9 per cent of responding or-
ganisations do not deal with changes in their risk environment, nor with their assess-
ment and reporting. 7.5 per cent are unable to respond to this question. It is assumed
that the organisations concerned have not implemented suitable concepts, instru-
ments and measures.
The survey results indicate that there is considerable potential to improve risk man-
agement procedures amongst the population. 26.2 per cent of respondents (R= 65) do
not evaluate the effectiveness of risk management activities; 6.1 per cent were not
able to respond to this question; only 20.0 per cent routinely review the effectiveness
of the controls in place to manage risks. While 47.7 per cent conduct efficiency tests,
they have identified that there is significant potential for optimizing the established
practice. Without effective risk monitoring, changes in the organisation's individual risk
positions cannot be identified and communicated on a timely basis. Thus it is not pos-
sible for the elements that have already been successfully implemented in an organisa-
tion, such as
establishment of an organisation-wide risk-management organisation,
periodic and complete risk identification,

152
definition of appropriate, effective and efficient risk control measures
assignment of responsibility for their implementation
integrated internal risk reporting systems
to be fully effective.
Key indicators and threshold values
The establishment of a suitable monitoring system is intended to ensure that substan-
tial risks and changes to these risks are recorded and communicated in such a manner
that management has adequate time for initiating effective control measures. To this
end, the mere monitoring of changes to identified risk positions is a necessary but not
fully sufficient element. Instead in the course of risk monitoring it is necessary to de-
fine appropriate early warning indicators that allow new risks or changes to existing
risk positions to be recognized before the risk analysis is performed in detail.
The setting of threshold values permits the continuous monitoring of quantifiable risks
and the associated predefined indicators. Where the relevant threshold values are ex-
ceeded, a risk warning will be triggered. The setting of individual threshold values will
depend on corporate strategy and risk policy or risk appetite.
The following survey results were ascertained to determine whether real estate devel-
opers have derived key indicators and threshold values for the monitoring of material
risks (cf. Appendix C - Question 21).
Figure 5-32: Key indicators and threshold values

153
Only 17.9 per cent of the survey population (R= 67) assess and analyse material risks
on the basis of operating ratios, taking into account specific threshold values. 70.2 per
cent of all respondents use indicators either partially, or not at all, as a benchmark for
the assessment and evaluation of risk. An astoundingly high share of respondents (11.9
per cent) is unaware of any indicators, which have been established as a basis of or-
ganisation management.
The results of the survey show that many organisations have failed so far to implement
systems and processes to ensure the early identification of risks. For such a system to
be effective, the key prerequisite is a corresponding data matrix with respect to key
indicators and early warning indicators. This may constitute a significant hurdle to im-
plementing such early warning systems.
A differentiated analysis - according to developer types - of those organisations, which
use key indicators and threshold values for efficient risk management, reveals an in-
teresting tendency. Exact Fisher and Cramer’s V test show an association between
these two variables (Cramer’s V= 0.401; p-value= 0.013). The developer type of a com-
pany affects the features of risk management of the company. Most of the investor
developers tend to have key indicators and threshold values for their risk manage-
ment, whereas, most of the trader developers do not make use from key indicators
and threshold values.
An analysis related to the size of individual projects demonstrated that 54.5 per cent
(R= 11) of all developers polled, who apply key indicators, are geared towards the re-
alisation of projects that fall under the ‘large‘ category. The share of organisations fo-
cusing on medium-size project volumes is 27.3 per cent, while organisations concen-
trating on smaller projects account for 18.2 per cent. Again, these results confirm the
expectation that as the complexity of projects increases, more sophisticated manage-
ment and monitoring tools are required to provide effective project- and risk-
management.

154
5.5 Evaluation of propositions
Determination of Proposition 1: The analysis of the results of the survey reveal that
generally developers rely on individual judgement and experience rather than system-
atic enterprise wide risk management frameworks using comprehensive methods and
tools.
Four main areas of investigation were used to determine this proposition: the use of
an enterprise wide risk management framework in the risk management process,
whether the risk management process is methodical and carried out using step-by-step
procedures, whether the process is purposefully regular and whether systematic tools
are utilized.
The results indicate that developers tend to lack a well formulated and well defined
risk management strategy throughout the organisation (Figure 5-12). It is believed that
a number of organisations may have corporate strategies in place that entail some risk
policy implications but do not fulfil the requirements of an organisation-wide risk man-
agement framework.
The empirical data collected on the risk management process suggests the develop-
ment industry lacks a formal systematic and proactive approach and that there is a re-
liance on the traditional method of intuitive judgement dependent on individual skills,
experience and risk appetite of key project participants. There is clear evidence that
the large majority of respondents understand and agree with the concept and scope of
setting corporate objectives and risk appetite (Figure 5-18) but the results suggest a
misalignment between the concept and the practice in this area. A much larger pro-
portion of organisations have a clearly defined corporate definition of risk (Figure 5.5)
than they have an unambiguous written risk management statement on organisation
policy (Figure 5-14).
The survey results indicate that there is considerable potential to improve risk man-
agement procedures amongst the population. The results on the use of a comprehen-
sive risk catalogue for risk identification purposes (Figure 5.21) suggests that organisa-
tions lack a formal and structured approach to the process of risk identification. The
preference for ad-hoc measures for the optimisation of the risk situation (Figure 5-26)
suggests that developers essentially respond to their risk situation in a reactive rather

155
than a proactive manner. The most common mix of assessment methods is qualitative
rather than quantitative risk assessment. Quantitative evaluations play a supplemen-
tary role to subjective personal evaluation, which is far easier to carry out. The pre-
ferred practice of risk control by ad-hoc measures (Figure 5-29) also implies a reactive
rather than a proactive approach to risk control. Monitoring and reviewing risks in the
achievement of objectives can be described as being established in most of the re-
sponding organisations although there is still significant potential for optimization.
Over one third of respondent organisations have a clear assignment of responsibilities
and continuous monitoring and response to changes in the risk environment and un-
der one third of respondents evaluate the effectiveness of risk management activities
(Figure 5-31).
There is strong evidence that the risk management process falls short of the objective
of being purposeful regular management, rather tending to be reactive and secondary
to the reporting cycle. Regular risk assessments at both the strategic and operational
levels are performed by under half of all respondents (Fig. 5-25) with the strongest fo-
cus on quarterly analysis (Figure 5-28). This time interval is believed to coincide with
financial reporting requirements. There is a preference for optimisation of the risk
situation on a reactive rather than a regular proactive review basis (Figure 5-29) and
there is also evidence that there is a preference for responding organisations to carry
out and regularly monitor action task lists only when risks, which may threaten the or-
ganisation, have been identified (Figure 5-29). Only 20 per cent of all respondents per-
form regular monitoring of their overall risk management process (Figure 5-31).
With regard to the utilisation of systematic tools, the results reveal that there is a lot of
room for improvement as evidenced by a small proportion of all respondents having
either a comprehensive risk catalogue (Figure 5-21) or a comprehensive and fully inte-
grated management information system. In general, the most dominant approaches in
risk assessment methods are based on qualitative techniques whereas the least used
methods are reliant on quantitative tools with general IT-support. (Figure 5-26). Al-
though a large number of organisations surveyed use IT support as part of their risk
management system, less than half that number makes only limited use of stand-alone
solutions such as Microsoft Excel (Figure 5-10). Figure 5-11 confirms that unacceptable
numbers of organisations have either insufficient tools to adequately satisfy the needs

156
of the organisations in question or they map the risk management process entirely
without appropriate software solutions.
Determination 1: Developers’ approach towards the management of risks tends to
be characterized by a lack of formalization and co-ordination and largely rely on indi-
vidual judgment and experience.
Determination of Proposition 2: There is conflicting evidence regarding this proposi-
tion. While the results show that risk management is not performed on a regular basis
and support the proposition, the existence of a specialised risk management commit-
tee and the overwhelming confidence that their risk management process is consid-
ered effective appear to contradict the proposition.
Three areas of investigation were taken into consideration to determine this proposi-
tion: the regularity of the risk management process, how difficult the organisation
finds the risk identification and risk assessment processes and the existence of a risk
management committee. The results indicate that the risk management process falls
short of purposeful regular management. Risk management appears to be reactive and
secondary to the reporting cycle. 47.1 per cent (Figure 5-25) of all respondents initiate
regular risk assessments at both the strategic and operational level, but recognise that
there is significant room for improvement with the strongest focus on quarterly analy-
sis (Figure 5-28). This time interval is believed to coincide with financial reporting re-
quirements. 67.2 per cent of respondents have a preference for optimisation of the
risk situation on a reactive rather than a regular proactive review basis (Figure 5-29).
47.8 per cent of the responding organisations carry out and regularly monitor action
task lists when risks which may threaten the organisation have been identified (Figure
5-29) but only 20 per cent of all respondents perform regular monitoring of their over-
all risk management process (Figure 5-31).
The respondent organisations did not find it difficult to identify (Figure 5-20) or assess
(Figure 5-24) the risks, which the organisation was likely to face. The overall confidence
by these organisations would suggest that either their risk management process was
very effective or there was complacency in the organisation with regard to risk man-
agement and this could possibly have led to an ad hoc approach to management.

157
Based on all the evidence collected by this empirical study, the latter explanation is
more likely to be the case.
The existence of a specialised risk management committee in a large proportion of the
organisations in Figure 5-8 suggests that risk management would be systematic rather
than on an ad hoc basis. 71.2 per cent of respondents stated that they have a special-
ised risk management committee to ensure that there is a centralised and organisa-
tion-wide control of risk management and risk aspects of specific development pro-
jects.
Determination 2: Risk Management tends to be performed primarily to coincide with
financial reporting requirements and is not regarded as a continuous and dynamic
process.
Determination of Proposition 3: Developers tend to lack a fully integrated enterprise
wide risk management strategy despite the high priority given to risk management by
senior management.
Three main categories of investigation areas were taken into consideration; whether
the organisation has an enterprise wide strategy for risk management, what drives the
organisation to implement risk management and the composite and primary responsi-
bility of the risk management function?
The results are in line with the expectation that developers tend to lack a well formu-
lated and well defined risk management strategy throughout the organisation (Figure
5-12). This shows that risk management is not aligned with corporate strategy. It is be-
lieved however, that a number of organisations may have corporate strategies in place
that entail some risk policy implications but which do not fulfil the requirements of an
organisation-wide risk management.
The top drivers identified for the implementation of risk management were requested
by senior leadership, the creation of a competitive advantage and the need for more
integrated decision-making and control / reduction of operational losses (Figure 5-19).
Client expectations, response to regulatory activity and following an industry trend
were the least popular drivers amongst the respondents. This suggests that the mo-

158
tives and goals of senior management to realise the intrinsic benefits of effective risk
management is evidenced.
The study of the composition of risk management committees and primary responsibil-
ity for the risk management function indicate a high priority of risk management within
these organisations although only 10.4 per cent of the responding development or-
ganisations had a dedicated Chief Risk Officer acting as a centralized coordinating point
to facilitate risk management within the organisation (Figure 5-7). Where a specialised
risk management committee existed, senior management of the organisation appear
to dominate the composition of the committee; the CEO and Board members and the
CFO (Figure 5-8).
Determination 3: Risk management is often fragmented and few development or-
ganisations have formal processes to align risk management with corporate strategy.
Determination of Proposition 4: The majority of real estate developers appear to con-
duct risk management within their organisation’s specific risk appetite and they are
particularly confident of their risk management on project levels. This determination is
mainly based on two areas. The first one is the awareness and understanding of the
concept of risk and risk appetite and the second one on the effectiveness of the risk
management process in dealing with identified risks. In spite of increasing perception
of risk in real estate development, it is surprising that only 56.5 per cent of all respon-
dent organisations stated that the level of risk they face has increased over the preced-
ing years (Figure 5-3). A similar result (55.1 per cent) has indicated that they have a
comparable risk attitude to their relevant competitors (Figure 5-4).
In terms of understanding the concept, 81.8 per cent of developers polled follow a re-
ward-oriented interpretation of the concept of risk (Figure 5-5) and almost unani-
mously, 98.5 per cent of respondents agree or strongly agree that effective risk man-
agement is important for the achievement of corporate objectives and 85.1 per cent
agreed or strongly agreed that organisations have a correct understanding of the scope
of risks they are required to assume in order to achieve corporate goals (Figure 5-18).
Despite so many organisations having this clear interpretation of the concept of risk,
37.3 per cent of organisations polled did not have a common definition on risk

159
throughout their organisations (Figure 5-5) and 14.9 per cent of the respondents
stated that they are not aware of the risks to be assumed (Figure 5-18).
The empirical data above suggest that the majority of developers have a clear aware-
ness and understanding of the concept of risk and risk appetite and that it is necessary
to balance and accept opportunities and risks. Developers tend to regard their activi-
ties as comparable to/ or even more cautious than those of their competitors. There is
however a significant minority that do not have a common organisation wide defini-
tion of risk and a further though smaller minority that are not aware of the risk appe-
tite of the organisation.
With regards to the effectiveness of the risk management process in dealing with iden-
tified risks, developers showed more confidence about their risk management skills at
project rather than corporate level; seven areas of risks on corporate level were identi-
fied as areas in which the risk management processes were ‘very ineffective’ compared
to only one area on project level and there is a greater agreement with regards to the
ranking order of significance of risks at project level than at corporate level. The high-
est consensus was only 44.1 per cent of participants ranking ‘high’ or ‘very high’ the
significance of ‘unfavourable financial market events’ to achieving the organisation’s
objective but 63.7 per cent ranked development / conception risk, which tops the list,
as ‘high’ or ‘very high’. Undoubtedly there is a very high level of confidence amongst
real estate developers that their risk management is in fact effective, with significant
risks being identified, assessed and managed as part of the entire process. There is
strong evidence that developers are highly comfortable with the risk management
process and believe in their own ability to cope with risks more confidently on project
rather than corporate levels.
Determination 4: Most real estate developers do not conduct their risk management
in alignment with the organisation’s specific risk appetite.

160
Determination of Proposition 5: The majority of development organisations do not
have risk management, which is applied across the whole organisation.
A direct survey as to whether the organisation has an enterprise-wide strategy for risk
management has been conducted. In addition, the existence of a specialised risk man-
agement committee within the organisation has also provided evidence of a higher
probability that the organisation would have an enterprise wide risk management
strategy.
Figure 5-12 shows that 39.1 per cent of respondents have a defined risk management
strategy and 60.9 per cent of respondent organisations either have an unsatisfactory
or no enterprise wide strategy for risk management. This also indicates that there is
not an inclusive strategy in place taking into account the experiences and knowledge of
the employees, specialists and key decision makers in the organisation.
Contrary to the proposition, developers tend to lack a well formulated and well de-
fined risk management strategy applied across the organisation. However a number of
organisations do have corporate strategies in place that entail some risk policy implica-
tions but do not fulfil the requirements of an organisation-wide risk management.
The majority of respondents stated that they have a specialised risk management
committee to ensure that there is a centralised and organisation-wide control of risk
management and risk aspects of specific development projects (Figure 5-8).
Those organisations which have a specialised risk management committee are more
likely to have risk management which is operational throughout the organisation but
as this is not reflected in the area of investigation above, it is probable that these
committees are not as systematic and all encompassing as they should be.
Determination 5: Many organisations have some measure of risk management activi-
ties but few can claim to have an enterprise wide risk management strategy, i.e. risk
management tends not to be applied across the whole real estate development or-
ganisation.

161
Determination of proposition 6: Contrary to the proposition, risk management within
many responding organisations is not implemented in a way that it allows to identify,
assess and manage all events potentially affecting the real estate development organi-
sation.
The lack of utilisation of systematic tools, formal reporting lines and staff training indi-
cate that the process is unlikely to be robust in spite of the fact that there is high con-
fidence by the organisations themselves.
Four main areas of investigation were used to determine this proposition: how confi-
dent the organisation is in their risk management process, whether systematic tools
are utilised, whether there are effective reporting lines and whether there is adequate
risk management training.
There is a high level of confidence by the respondents that their risk management is
effective (Figure 5-17). This is also confirmed by the fact that the respondent organisa-
tions did not find it difficult to identify or assess the risks, which the organisations were
likely to face (Figure 5-20 / Figure 5-24). The overall confidence by these organisations
would suggest that either their risk management process was very effective or there
was complacency in the organisation with regard to risk management. Based on all the
evidence collected by this empirical study, the latter explanation is more likely to be
the case.
The tools taken into account include the use of a risk catalogue, suitable IT-support,
appropriate tools and risk assessment methods. The results reveal that there is a lot of
room for improvement with regard to the utilisation of systematic tools as evidenced
by fewer than 20 per cent having either a comprehensive risk catalogue or a compre-
hensive and fully integrated management information system.
Only 17.4 per cent of the respondents use a comprehensive risk catalogue for risk
identification purposes. A further 33.3 per cent possess and use risk catalogues of sorts
but recognise that there are deficiencies. In contrast, 49.3 per cent stated that they do
not maintain any risk catalogues (Figure 5-21). In general, the most dominant ap-
proaches in risk assessment methods are based on qualitative techniques whereas the
least used methods are reliant on quantitative tools which require IT-support (Figure 5-
26). Although 84.6 per cent of organisations surveyed use IT support as part of their

162
risk management system, 41.5 per cent make only limited use of stand-alone solutions
such as Microsoft Excel. 16.9 per cent of all respondents operate a comprehensive and
fully integrated management information system (Figure 5-10). 28.4 per cent of the
responding organisations confirmed that there are appropriate tools in place to sup-
port risk management. With 34.3 per cent of respondents, certain tools have been es-
tablished, but do not adequately satisfy the needs of the organisations in question.
29.9 per cent of the organisations map the risk management process entirely without
appropriate software solutions (Figure 5-11).
The empirical data collected on risk reporting policies and processes indicate that de-
velopers lack a formal and clearly defined policy and process (Figure 5-30). However,
they state that communication processes between staff and senior management are
effective and this suggests that risks impacting the organisation are communicated
throughout the organisation, which can then be managed effectively. The lack of suit-
able risk management training is evident (Figure 5-9) and consequently a lack of exper-
tise and specialist knowledge required for effective risk management may be expected
to be missing to a significant degree.
Determination 6: The actual status of risk management implementation does not al-
low for the identification, assessment and management of all events potentially af-
fecting many responding real estate development organisations.
Determination of Proposition 7: The empirical data suggests that real estate develop-
ers have intended and designed their risk management systems to preserve and allow
value to be created. The motivation, goals and awareness of risk concept are positive
and in line with risk management theory as evidenced by their perceived effectiveness
of the risk processes.
Three areas of investigation were used to determine this proposition: the drivers for
implementing risk management in the organisation, the organisation’s awareness and
understanding of the concept of risk and risk appetite and the effectiveness of the risk
management process in dealing with identified risks. The survey findings suggest that
senior management recognizes the intrinsic benefits of effective risk management for
value creation and preservation (Figure 5-19).

163
The results of the investigation into common understanding/terminology of risk sug-
gest that the majority of developers have a clear awareness and understanding of the
concept of risk and risk appetite and that there is the recognition of upside potential
through effective risk management which would preserve and create value (Figure 5-5
and 5-18). There is, however, a significant minority that do not have a common organi-
sation wide definition of risk and a further though smaller minority that is not aware of
the risk appetite of the organisation, which may impair the implementation of its risk
management.
This study of effectiveness of the risk management process in dealing with identified
risks takes the form of a study into the data collected for the significance of risks on
organisational and project levels and the respective risk management capability in
dealing with those risks. If the organisations can manage the most significant risks then
it shows that their risk management systems are effective and would create value. The
study indicates that at corporate level, the four most significant risks identified were
unfavourable financial market events, human resources lack the expertise to meet or-
ganisation’s goals, loss or impairment of reputation and liquidity risk from investments
not matching needed liquidity (Figure 5-22). All but the unfavourable financial market
events were felt to be dealt with effectively by 80 per cent or more of respondents as
compared to an average of 76.4 per cent for all risks (Figure 5-15). At project level, the
four most significant risks identified were development / conception risk, location risk,
market potential on sale / disposal of project and first time leasing risk (Figure 5-23).
Developers were highly effective with regard to managing the first two types of risk
and were comfortable with the last two types (Figure 5-16).
Undoubtedly there is a very high level of confidence amongst real estate developers
that their risk management is in fact effective, with significant risks being identified,
assessed and managed as part of the entire process. This would seem to indicate that
majority of real estate development organisations have intended and designed their
risk management systems to be effective at preserving and allowing value to be cre-
ated.
Determination 7: The majority of development organisations have intended and de-
signed their risk management in order to preserve and allow value to be created.

164
Determination of Proposition 8: It is necessary to put the results of the statistical
analysis into perspective; the number of instances where dependencies have been
identified has not been great in relation to the number of variables, which have been
tested. Nevertheless, there are some trends, which have been suggested by the re-
sults, and these provide additional insight on the impact of structural characteristics on
the understanding and implementation of risk management of the responding organi-
sations. The strong dependencies found within each structural category are examined
below:
Three types of statistical measures were selected as being the most appropriate for
assessing the dependencies between independent variables; these were Fisher’s exact
test, Phi and Cramer’s V (chapter 4.5.5.1 and Appendix D, E and F). The use of these
tests gave more depth into the analysis of the structural background of the respon-
dents and their responses on risk management. The results confirmed dependencies
which were believed to be relevant and in some instances highlighted dependencies
which otherwise may not have been identified. There were 18 sets of variables, which
proved to be significant (significance level (p) was less than 0.05 and the Cramer’s V
was more than 0.03).
Developer type
Results from the exact Fisher test and Cramer’s V analyses have indicated strong asso-
ciations between developer type and clear and written management statements on
risk management (Cramer’s V= 0.405; p-value= 0.009), key indicators for controlling
material risks and defined threshold values (Cramer’s V= 0.401; p-value= 0.013), the
importance of risk management for the achievement of the company’s objective
(Cramer’s V= 0.342; p-value = 0.013) and risk identification (Cramer’s V= 0.341; p-
value= 0.025). These associations support the belief that generally investor developers
take a more considerate approach to risk management than trader developers as they
have a longer commitment to development projects.
Ownership structure
The exact Fisher test and Cramer’s V analyses have shown that there are strong asso-
ciations between ownership structure and risk assessment of potential impacts of risks
materialising (Cramer’s V= 0.489; p-value= 0.000), the formulation of an overall, enter-
prise-wide strategy for managing risks (Cramer’s V= 0.412; p-value= 0.007), risk atti-

165
tude to achieving objectives (Cramer’s V= 0.356; p-value=0.023), effective risk man-
agement (Cramer’s V= 0.755; p-value=0.000) and appropriate tools to support risk
management (Cramer’s V= 0.351; p-value=0.027). These results suggests that publicly
listed companies are more inclined to have effective risk management systems due to
corporate governance and reporting requirements than unlisted companies.
Geographic scope
Exact Fisher and Cramer’s V analyses show that there are strong associations between
geographic scope and clear written management statements on risk management
(Cramer’s V= 0.381; p-value= 0.001), clearly defined policy and process for the report-
ing of risks and risk management (Cramer’s V= 0.332; p-value= 0.040), optimum pro-
ject volume (Cramer’s V= 0.454; p-value= 0.003) and understanding of risk manage-
ment (Cramer’s V= 0.295; p-value= 0.032). It is believed that the more international an
organisation is, the more important political risk becomes a part of the risk manage-
ment process. Due to the variety and complexity of risk related issues that they face,
international organisations require more structured risk management systems with a
uniform risk culture which comprises the use of common definitions, support and un-
derstanding of risk management.
Investment volumes of individual projects
The exact Fisher test and Cramer’s V analyses have shown strong associations between
project size with specialised risk management committee for the organisation
(Cramer’s V= 0.398; p-value= 0.005), the perception of the level of risk that the com-
pany has experienced (Cramer’s V=0.377; p-value= 0.002), the comprehension of the
concept of risk as an opportunity as well as a threat (Cramer’s V= 0.365; p-value=
0.016) and I.T. support for risk management (Cramer’s V= 0.359; p-value= 0.019). Gen-
erally speaking, the larger the project size, the greater the time that it takes for com-
pletion of the project. During the time of the development, market conditions could
change and the monitoring process within risk management becomes significantly im-
portant. The large numbers of different parties involved in the development of a large-
scale project increases the complexity of the risk management system.

166
Determination 8: Different structural characteristics of an organisation have a clear
little impact on the understanding and implementation of risk management, i.e.:
investor developers have a more considered approach to risk management than
trader developers;
publicly listed companies are more inclined to have effective risk management
systems due to corporate governance and reporting requirements than unlisted
companies;
developers with larger project sizes have more complex risk management systems
than developers with small or medium project sizes;
cross border organisations consider to have more effective risk management sys-
tems than national organisations.
5.6 Concluding remarks
It is the primary goal of chapters four and five to obtain information and to provide an
overview of the risk management practice among leading real estate development or-
ganisations (research question 3) thereby contributing to the limited previous aca-
demic research so far conducted on this topic and also to provide executives, on the
basis of this empirical data and their evaluation, a benchmark against which to com-
pare their own risk management practices. The empirical study is based on a written
survey carried out in late 2004/5. Due to an evaluable response rate of 43.7 per cent,
which documents a great level of interest among the target group, highly meaningful
results were obtained. The results provided a reliable and accurate profile in regards to
the risk management practice in the industry and also reflect the success of the selec-
tion and targeting process, which was adopted in the preparation of this survey. The
background characteristics showed that the study is biased towards unlisted organisa-
tions, which operate in medium sized domestic projects. The implication of the bias of
each structural variable tended to offset each other and consequently taken as a
whole these have little significance on the results of the empirical data collected.

167
Internal corporate environment
The results confirm that developers generally regard risk management as a means to
generate value and business confidence by their ability to balance and accept oppor-
tunities and risks. The primary drivers for the implementation of risk management in
corporate practice indicate an understanding of the benefits of effective risk manage-
ment. Compliance with regulatory requirements and industry trends were not domi-
nant drivers. 90.9 per cent report that the organisational structure enables effective
risk management and carrying out business activities to achieve the organisation‘s ob-
jectives with primary responsibility of risk management mainly resting on the Chief Ex-
ecutive Officer and / or the Chief Finance Officer.
There is conflicting evidence on how much organisational support there is for risk
management. The most tangible evidence that there is organisational support for risk
management arises from the analysis of risk management committees. 70 per cent of
all participating organisations have a risk management committee. However, this re-
sult is not compatible with those found in the analysis of the use of appropriate soft-
ware and the provision of adequate risk management training. 29.9 per cent of the or-
ganisations map the risk management process entirely without appropriate software
solutions and only 16.7 per cent of all respondents believe that they receive adequate
training.
Whilst it is particularly encouraging that developers are confident that their risk man-
agement system is effective, the organisational structure enables effective risk man-
agement, and that the majority of developers have a balanced approach to risk, there
is evidence to suggest that there is a misalignment between this opinion and the be-
havioural changes that they are prepared to make in order to achieve this.
Risk management process
There is strong evidence that developers are highly comfortable with the risk man-
agement process and believe in their own ability to cope with risks at both project and
corporate levels. Developers showed more confidence about their risk management
skills at project rather than corporate level; 7 areas of risks on corporate level were
identified as areas in which the risk management processes were ‘very ineffective’
compared to only one area on project level and there is a greater agreement with re-
gards to the ranking order of significance of risks at project level than at corporate

168
level. The highest consensus was only 44.1 per cent of participants ranking ‘high’ or
‘very high’ the significance of ‘unfavourable financial market events’ to achieving the
organisation’s objective but 63.7 per cent ranked development / conception risk,
which tops the list, as ‘high’ or ‘very high’.
Empirical data collected suggests that risk management is often dependent on individ-
ual skills, experience and risk appetite of key project participants. Without an enter-
prise-wide and inclusive risk management strategy this knowledge bank of information
may not be collected within the organisation and further, the information risks being
lost when key project participants leave the organisation. With responses indicating
such an emphasis on personal judgement as a key risk minimisation strategy, it is as-
tonishing to note that the formal strategy does not encompass this. Only a small per-
centage of the respondents use a comprehensive risk catalogue for risk identification
purposes and there is inefficient use of an integrated comprehensive risk assessment
approach. When assessing risks, the preference is for method sets over any single
method. Nevertheless, the single most significant method employed is assessment
based on personal experience and subjective views of the risk assessor at 69.9 per
cent. These findings are significant as they suggest that reliance on the traditional
method of intuitive judgement is still very much in evidence.
There is evidence that developers tend to take a more reactive rather than a proactive
approach to managing risks. The preference for ad-hoc measures for the optimisation
of the risk situation at 67 per cent suggests that developers essentially respond to their
risk situation in a reactive rather than a proactive manner.
There are indications that at least a substantial part of the development industry lacks
a formal and structured approach throughout the risk management process. The quota
for use of a comprehensive risk catalogue for risk identification purposes was 17.4 per
cent, an integrated comprehensive risk assessment approach was 44.1 per cent, a sys-
tematic action task list to carry out risk control was 47.8 per cent, a clearly defined pol-
icy and process for risk reporting was 33.3 per cent, a clearly defined corporate defini-
tion of risk was just under two-thirds, unambiguous written risk management state-
ments on organisation policy was 24.2 per cent and 29.9 per cent of the organisations
map the risk management process entirely without appropriate software solutions.

169
These figures show that the risk management process fall short of a fully integrated
enterprise wide risk management framework.
Evaluation of proposition
The results of the evaluation confirm the view that where risk management is per-
formed, there is a tendency for it to be an ad-hoc and unstructured process where in-
tuition, the experience and risk-orientation of the decision-maker dominates (chapter
3.4.1). Of the seven fundamental characteristics of effective risk management (chapter
3.1), only two were evident from the empirical data; that risk management is within
the organisation’s specified risk appetite and that risk management is intended to pre-
serve value and allow value to be created. These two characteristics reflect the es-
sence of the developer’s purpose and its priority goal to recognise and consequently to
exploit potential opportunities for increases in value as discussed in chapter 2.3. The
remaining five characteristics, however, refer to the mechanism and application in the
synthesis of risk management. These characteristics were not so well defined; there
was evidence that risk management tended to be unstructured, irregularly employed,
not applied across all departments and levels, not applied in strategic formulation, not
supported by comprehensive methods and tools and as a consequence, not designed,
inter alia, to identify events potentially affecting the real estate development organisa-
tion,
In conclusion, the evidence points towards developers managing their risks intuitively,
based on the confidence that their risk management is effective. At the same time
their practice of risk management does not satisfy ‘risk management’ as defined in
chapter three.
The results of the statistical analysis have established some strong dependencies be-
tween different structural characteristics of a real estate development organisation
and its understanding and implementation of risk management. These dependencies
uphold the theory that such structural differences are significant not only on under-
standing risk management within the industry but the industry as a whole.

170
6 Reflections on the findings in the light of recent economic events
6.1 Introduction
Recent history makes the findings of this dissertation all the more relevant as events
have shown that in many cases the implementation of risk management within the de-
velopment industry was not well developed which could well have contributed to the
severe impact of events of the last few years. The results of the empirical work showed
that risk management is lacking understanding and implementation in the real estate
development industry (see chapter five). The most notable of the conclusions is that
risk management in the real estate development industry is largely intuitive. In spite of
this, management generally has confidence that the risk management is effective even
though it does not satisfy ‘risk management’ as defined by the theoretical concepts
and best practice. Against the background of the high-risk world of real estate devel-
opment, these findings were astonishing.
The findings of the thesis have led the author to a period of reflections on a number of
areas that will be considered in this chapter to answer the following question:
4 What are the reflections on the findings in light of the global financial crisis
since 2008/9?
Three areas will be covered in this chapter, which will demonstrate that the empirical
research within this dissertation still has validity in 2012. Firstly reflections on the de-
velopment of mature European real estate markets since 2003/4 will be discussed. This
takes into account shifts of real estate market environment before, during and subse-
quent to collection of the empirical data. Secondly, consideration will be given to the
proposition that risk management practice in the real estate development industry is
not expected to having improved significantly since 2004/5 when the empirical data
was derived. Thirdly, some thoughts on the reasons for the identified gap between risk
management theory and the practice in the real estate development industry will be
presented.

171
6.2 Reflections on the real estate development market between 2003 and the beginning of the financial crisis
The empirical survey was prepared and conducted in the end of 2004 and in the first
half of 2005. Since the collection of the empirical data, there have been two distinct
phases in the environment for real estate developers. The first started in around
2003/4 and extended up to 2007. This period may be qualified as one of the most un-
usual periods in European real estate history; a time of market recovery in terms of
tenancy market demand combined with a much greater strength and activity in the
investment market. In particular, the real estate and capital market environment was
driven by a number of separate but linked aspects, such as:
underlying economic trends and occupier demand;
property supply, development activity and rents;
the emerging integration of Europe following the introduction of the Euro as a cur-
rency in January 2002;
prevailing low inflation and comparably low interest rates;
innovation in the financial (particularly debt) markets; and
yields and the behaviour of real estate investors.
Particularly in the early stages of an economic upturn, investors tend to base their pric-
ing decisions on the expectation of enhanced future income.
Figure 6-1: CB Richard Ellis EU-15 Rental Value Index, February 2012
-15%
-10%
-5%
0%
5%
10%
15%
20
03
20
05
20
07
20
09
20
11
Retail Industrial Office

172
The middle of 2003 and 2004 marked the point at which expectations of economic
growth began to strengthen significantly. As illustrated by CB Richard Ellis EU-15 Rental
Value Index, rents and capital values were at a relative low level from a historic per-
spective. At that time, a significant improvement of the economy was a widely fol-
lowed expectation as the recovery gathered pace.
Since the middle of 2003 up to the end of 2007 the investment market environment
was driven by yield compression. By the middle of 2007, the European real estate mar-
ket had experienced a sustained period of significant value increase and unprece-
dented growth in investment activity. Capital values (as measured inter alia by the CB
Richard Ellis EU-15 all Sector Prime Capital Value Index) rose by approximately 60 per
cent from September 2003 to September 2007. The volume of investment transactions
had more than tripled from around EUR 80 billion in 2003 to EUR 255 billion in 2007
allowing for a significant liquidity in major European markets.
Figure 6-2: European direct real estate investment volumes (source: Jones Lang LaSalle, Property Data,
KTI, Akershus Eiendom, Athens Economics, Sadolin & Albaek, February 2012)
As a general observation, it may be well stated that investor perceptions of volatility
and risk fell progressively from early 2003 to 2007. This observation may be supported
by the development of the CBOE Volatility Index, which serves as a key measure of
market expectations of near-term volatility conveyed by S&P 500 stock index option
prices. Since its introduction in 1993, the VIX has been considered as the world's pre-
48,0 51,073,8 77,0 76,7
96,8 90,652,0 36,1 48,6 51,9
24,9 34,0
56,074,2
97,2
156,4 153,5
62,5
33,7
55,066,8
0
50
100
150
200
250
300
2001 2002 2003 2004 2005 2006 2007 2008 2009 2010 2011
€ bn
Cross-Border
Domestic

173
mier barometer of investor sentiment and market volatility. As indicated in the follow-
ing figure, the investment community generally saw minor risk in the global economies
and/ or investment markets during 2003 and mid of 2007. In combination with steadily
falling yields in the same period, the same conclusion may also be drawn for the ma-
ture European real estate markets.
Figure 6-3: CBOE VIX (8th March 2010), CB Richard Ellis, EU-15 Office Yield Index February 2012
Yields were continuing to fall resulting in rising market values, investors still had the
appetite to invest, and rents were being underpinned by healthy tenant demand. The
financial markets generally operated in an environment, which may be characterised
by:
a comparably low risk expectation/ economic outlook with historically cheap debt
funding opportunities and strong competition amongst debt providers to capture
and secure market share lead to competitive financing conditions;
increasing global capital markets integration and development of complex synthetic
investment products;
strong emerging markets growth;
rapid capital markets innovations within a relatively deregulated operating envi-
ronment; and
strong investor appetite for the resulting attractive availability and cost of debt.
Oct 97Asian Debt
Autumn 98
Russian Bonds
2000/1
Dot Coms
Sept 01
9/11
Aug 02Enron Mid 07
Sub-Prime
Sept/Oct 08Lehmans & Banking Crisis
Mid 10 & Mid 11Sovereign Debt
Crisis

174
Of these various factors, it was availability of comparably “cheap” money coupled with
the innovation in financial markets, with their combined effects on the availability of
low cost debt, that were to have key implications for the real estate market. In the
booming markets, real estate investors as well as developers were players in a lender’s
market and found comparatively cheap and readily available sources of lending at fa-
vourable terms with which to finance their development respectively investment ac-
tivities.
The following criteria may be taken into consideration when describing the lending
situation:
lenders were generally able to secure loans of 80 to 85 per cent or more (even up to
95 per cent) of the value of the investment (LTV) or alternatively acquisition costs
(LTC);
valuations on which loans were based incorporated expectations of future income
growth;
lending margins fell to 50-90 bps over swap rates;
repayments were often on ‘interest only’ terms basis;
no prepayment penalties, allowing easy refinancing if more attractive terms be-
came available;
borrowers were allowed to take equity out of refinancing/ distributions;
most arrangements were structured as non-recourse debt (secured against the
property and pledges, rather than the overall assets of beneficial shareholder);
most terms and conditions in the loan documentation were favourably negotiable
for the lenders;
due diligence and information gathering by the banks (and also some investors) was
comparably limited in quality and extent, especially as profitability became linked to
the volume and speed with which deals could be securitised.
When the empirical data on risk management in the real estate development industry
was collected in 2004/5, markets for developer tended to be forgiving and for the un-
wary allowed risk management practices to continue unaltered, i.e. in many cases
rather under-developed. During this period there was little apparent incentive for de-
velopers to improve their risk management disciplines and for the unwary there was

175
the potential for the build up of considerable additional risk; with hindsight it can be
seen that many were unaware of the actual market fundamentals. The results of the
empirical work of this study bear this out, especially in view of subsequent events, and
the lack of concern for risk management is likely to have become more acute during
this period.
6.3 Reflections on the real estate development market since the finan-cial crisis and declining real estate markets from late 2007
The worsening global economic climate has had a visible influence on real estate mar-
kets. From mid-late 2007 the entire market context for both tenant and investment
aspects of the European real estate market changed dramatically; the financial crisis
having lead to weakened global property fundamentals.
In the four economies that make up approximately 80 per cent of the Euro-area econ-
omy - Germany, France, Italy and Spain - unemployment has rising since the financial
crisis, which is expected to have a negative impact on the demand for office space and
increase sub-letting, which may not be reflected in official vacancy or market activity
monitors. As a result of the sinking occupier market, rental expectations are now
rather negative across most European regions, with weaker occupier demand likely to
lead to further rises in the available space and looser market conditions across all
emerging and development markets.
In addition the landscape in the financing sector has changed dramatically since the
financial crisis. Construction loans - especially for speculative developments - remain
amongst the hardest types of financing to secure since the middle of calendar year
2008. Lenders generally remain discerning on the standing and track record of pro-
spective borrowers and more demanding on loan-to-value ratios, lending margins and
pre-let requirements. With many banks struggling to come to terms with rapidly falling
collateral values from their existing loan book, a significant number simply stopped
lending. The handful of lenders that remained active were issuing loans to be held on
balance sheet as the securitisation market evaporated overnight and has, at the time
of writing of this dissertation, yet to return. At the low point for the market in late
2008/ early 2009, with no clear indication that the market had bottomed the only
means to protect themselves was to lend on significantly tighter terms and in smaller
volumes, than previously, e.g.:

176
reduced loan volumes (debt volumes of over EUR 70 plus million being difficult to
be secured and rarely from a single lender);
LTVs fell to 50-60 per cent of the value of the investment respectively costs (LTC);
lending margins increased to up to 280 bps or more over swap rates;
loans became amortising rather than being ‘interest only’;
reintroduction of penalties for early prepayment;
stricter financing terms and conditions, which were hardly negotiable;
valuations on which lending was based reflected only contractual rent receivable
rather than rent potential (no ‘discounted hope’ in markets);
due diligence and information gathering by the banks became much more exten-
sive, in relation to both the development project / property and the borrower and
his track-record;
lease length and covenant strength of the tenants were key to loan availability;
many banks would only lend to borrowers with whom they had existing, strong re-
lationships;
financing for development projects was available only to a very limited extent; and
traditional long term financing has been significantly cut back to shorter lending ex-
posure periods.
Investors and developers with strong equity sources are (more or less) aware of the
lending market situation and their good position in the investment market because of
the very limited competition. Active institutional investors in times of the financial cri-
sis are insurance companies, single open-ended and closed funds as well as special and
pension funds. Private equity funds which have (mostly temporarily limited) access to
equity also become visible on the buy side. Such investors only buy real estate prod-
ucts when they feel like they have reached a price level at which they ‘can do no wrong
purchase’, reflecting a very low risk profile. Therefore the investment demand in 2008
to late 2011 was highly focused on real estate opportunities if they were to be consid-
ered ‘very competitive’ in terms of risk-adjusted pricing or in case the product is ‘core’
(well-let, prime assets with high creditability of tenants and long term leases). Due to a
lack of suitable core investment opportunities and to some degree investment pres-

177
sure from the investor side, this has the potential to exert downward pressure on
prime yields in this specific sector.
Most market experts expect that the investment market will remain under pressure or
partially illiquid due to a significant bid-ask-spread in yields in 2012. Investment values
are expected to reflect lower or more volatile income expectations, and increased
views of the risks attaching to this income.
In the shadow of the current banking and investment environment, one critical issue
for both investors and lenders is cash flow security of the underlying assets. More risks
have therefore been passed back from the investor and lender sphere to the developer
and, with construction finance and also re-financing market likely to remain difficult to
secure, many developers will face considerable challenges over the next few years. The
impact of these dramatic changes to the real estate development market has been to
bring risk management back into the spotlight again. Also the fast and severe devel-
opment of economies as well as real estate markets demonstrated the importance of a
close monitoring and risk management function to facilitate the prediction of down-
turns or other adverse conditions. Every development organisation should monitor the
marketplace in regards to their business and develop strategies to act in the face of
such changing conditions (HEWLETT, 2008). This is clearly not what was happening in
most real estate development companies prior to the recent financial crisis.
6.4 Reflections on improvements in risk management practice in real estate development
As explained before, the mature European real estate markets have been subject to
dramatic changes in the course of the financial crisis, which changed the risk profile of
developers. Exit risk has increased most notably and makes the results of this study
even more relevant than they were in 2005. As investors faced greater difficulty in
finding standing investments in stagnant transaction markets, many investors began to
focus on forward-funding or forward-purchasing developments (sometimes whole pro-
ject pipelines) as a means of securing investment stock. Such agreements are typically
subject to rent guarantees and other conditions, whereby the developer agrees to se-
cure a tenant and underwrite the rental income for a given period of time. However, as
competition amongst investors increased, developers were more and more able to
forward-sell much of their development pipeline at favourable conditions. The market

178
environment allowed developers to transfer major proportions of risks, which are usu-
ally transferred by the developer to investors, at comparably early stages of the devel-
opment process. This had a number of consequences: not least, it allowed developers
to recycle their invested capital efficiently and to move on to initiate new projects
fairly quickly. This in turn may inevitably have encouraged some developers to focus
on rapidly securing new scheme opportunities to sell on to investors, with less concern
over the quality and viability of those schemes than if they were carrying a higher risk
profile by themselves. In addition, the debt markets may have motivated developers to
increase the leverage on a project basis.
In the course of the financial crisis, these circumstances have changed dramatically.
Developers are finding it far harder to sell anything other than assets being in line with
‘core’ criteria (cf. Chapter 6.3). Investors are conducting more detailed due diligence,
and demanding more stringent guarantees and conditions associated with any risk
element of a scheme, which has not been completed. MAC RUAIRI / SEEBUS (2010) state
that “the days that a developer could get forward funding with an investor for a new
development culminating in a sale at a fixed yield at the end of the process are over”
(MAC RUAIRI / SEEBUS, 2010, p. 50). One of the ways in which the financial crisis and re-
cession have affected the real estate industry has been to cause a sharp reduction and
deferrals in the scale of development activity in most of the main European markets.
Significant restrictions in the availability and cost of development financing, coupled
with a weakening tenant demand and falling values are main drivers for this develop-
ment. As a result it is to be expected, that speculative development schemes will only
be brought to market to a very limited extent the 2012.
It is believed from the author’s experience that the inability to pass on risk has resulted
in a decrease in projects rather than significant improvement in risk management prac-
tice. This is in contrast to the pre-credit crunch period when the approach was pre-
dominantly opportunistic. COSO (2009) noted that there has been improved supervi-
sion on the part of company boards for some organisations but this has yet to feed
through generally across the market and will be in large part dependent on the atti-
tude of the banks going forward. If the availability of credit improves again then an
opportunistic approach by developers is likely to predominate.

179
6.5 Potential reasons for the difference between the theory of risk management and the practice applied by developers
Reflecting on the results of this dissertation, it became apparent to the author that
there were a number of reasons why there was a difference between the theory of risk
management and the practice applied by developers. Underlying these is the fact that
developers are masters of ‘opportunism’ and ‘the transfer of risk’. In addition develop-
ers tend to have to be very flexible; looking for the most optimistic investor for their
projects rather than building long-term relationships. Indeed it is difficult to find a de-
veloper that carries out risk management according to the theoretical frameworks. The
reasons for the difference between theory and practice of risk management are con-
sidered in more detail below:
6.5.1 Risk transfer
One of the key characteristics of successful developers is that they specialize in risk
transfer and opportunism, which was very prevalent prior to the credit crunch. During
the development process, major risks were transferred in various ways. A Special Pur-
pose Vehicle (SPV) would be created to isolate the developer’s exposure to risks that
may arise during the development process and transfer risk to the various parties that
are dealt with during the development process. Loan to cost (LTC) financing was com-
mon before the credit crunch and transferred a lot of risk to the banks. The buying of
the project by an investor would usually remove the letting risk from the developer.
Other examples of risk transfer were option agreements made with the seller of the
ground, which is to be developed, and the construction company taking the major con-
struction risks.
In addition the risk of the developer was further limited to the equity employed, which
can be quite limited. The developers are always trying to be risk averse – they co-
ordinate the project but transfer all the risk to third parties. These risk transfers miti-
gate risks for the development organisation and consequently the perceived need for
risk management as expressed in theory is reduced in practice.
Since the credit crunch though, the ability to transfer risk has been much more limited
especially with regard to the banks hence the emergence of greater interest in theo-
retical risk management. Whether this continues is believed to very much dependent

180
on the banking sector – should banks become more aggressive in their lending prac-
tices again then LTC lending will resume and formal risk management will once again
move down the agenda.
6.5.2 Judgement, flexibility and speed
Flexibility is regarded as more relevant than sophisticated risk management processes
by practitioners, given that the development process itself is iterative and hardly
straightforward. GEHNER (2008, p. 34) summarizes “the success of a project largely de-
pends on the developer’s expertise to coordinate the development activities in such a
way that either enough flexibility remains to deal with external influences and market
dynamics or other activities do not affect this activity anymore.” Compared to other
industries ‘gut feeling’ and intuitiveness are very important coupled with the ability to
react quickly. It is this flexibility that is often key to the profit maximization objectives
of the developer. The whole development process tends to be dynamic and from the
author’s experience not too many processes are replicable between projects. The fo-
cus is on maximizing profits from the sale of the project as rapidly as possible.
6.5.3 Behavioural characteristics
The risk attitude of senior management and development team members will have
implications for the risk management approach. According to HILLSON / MURRAY-WEBSTER
(2007), risk seekers are attracted by challenges and are likely orientated to underesti-
mate threats and overestimate opportunities. This tends to create an environment
where the need for risk management is not always to the fore. Developers tend to be
‘chance-orientated’ rather than seeing the potential negative downside in a situation.
This is a significant and in many ways necessary characteristics of developers as they
have to motivate others to undertake the development. Development tends to be a
creative, flexible, complex and partly intuitive process, these characteristics in many
ways being essential for a projects success. Thus this does not create an environment
in which a structured approach to risk management is always encouraged

181
6.5.4 Lack of expertise
The level of risk management understanding, implementation and sophistication still
remains fairly immature for most responding organisations to the empirical survey.
GEHNER (2003) argues that the reasons for using sophisticated quantitative risk analy-
sis methods much less than qualitative techniques may be due to a lack of familiarity
and expertise as well as a lack of reliable data and understanding of the potential
benefits.
6.5.5 Regulatory oversight
There is no official regulatory body that oversees the real estate development industry
neither in individual countries nor across the mature markets of Europe as a whole.
This is very different from the financial industry where there are regulatory bodies
across each individual country and at a higher level across the European Union. As a
result there is no obligatory external regulatory input for a standard minimum risk
management system and practice in real estate development companies, with the ex-
ception of requirements of listed organisations generally and the occasional non-
binding guidelines of industry and professional bodies. This leaves it to the responsibil-
ity of the management of the real estate development company and the providers of
finance to ensure that adequate risk management is pursued. As recent developments
in the banking sector have shown though the existence of a regulator does not on its
own ensure that risk management is effective.
6.6 Concluding remarks
The empirical research explores the practice of risk management by developers as of
2004/5, which has been reflected in the light of the current environment. At the time
of the data collection, developers enjoyed a largely positive macro-economic environ-
ment and comparably liquid investment, tenancy and lending markets with a variety of
international investors being interested to acquire project schemes in the early stages
of development. Also, competition for projects was strong. The combination of these
positive overall economic market factors caused due diligence (for both developers
and investors) not to be given a particularly high priority. Investors and developers

182
who applied rigorous analysis that were time-intensive in the transaction phase, may
have lost transactions to others who did not apply the same scope of due diligence.
The author recognises the time differential between the data collection (2004/5) and
the final presentation of the study. It is felt that nevertheless the applicability of the
results and the conclusions remains highly relevant and has been more than borne out
by events since 2007. The empirical research provides highly valuable data for analysis
of the pre credit crunch situation. The economic environment has clearly changed
since 2004/5 but based on the author’s industry experience, it is the author’s opinion
that to date developers’ behaviour towards risk management has not changed to a
comparable degree. The results and observations of this research nevertheless lead to
the conclusion that there are significant potential benefits that could be realized by
having development organisations carefully reviewing and optimizing their existing risk
management practice. According to COSO (2009, p.3) states that the “financial crisis,
coupled with global integration and the rapidity of change, has highlighted the benefits
of more sophisticated risk management practices among senior leadership and im-
proved risk oversight on the part of boards of directors for some organisations.” But
whether this will be borne out in significantly changed practice across the industry will
be very much dependent on the banks attitude to lending in the future.

183
7 Conclusion and directions for further research
The objective of this dissertation is to gain an understanding of the implementation of
risk management in the real estate development industry by conducting empirical re-
search on a broader basis. Through the literature review, the dissertation has given a
detailed overview of the subject. The empirical part of this dissertation, a survey
among leading European real estate development organisations, reviewed specific as-
pects of the actual risk management approach of such organisations. The discussions
and remarks presented in the previous chapters have given a detailed account of the
main findings of the research undertaken. This chapter closes this dissertation and is
intended to give answer to the following question:
5 What are the implications of the findings of this dissertation for academics as
well as the real estate development industry?
7.1 Implications for real estate research
A major contribution of this study to theory has been to provide a theoretical founda-
tion for identifying, assessing and analysing risks in the real estate development indus-
try. A considerable amount of research has been undertaken on risk management
generally and to a lesser extent on real estate development. However as existing re-
search on risk management in the real estate development industry is comparably lim-
ited, one of the reasons for writing this dissertation was to bring together existing re-
search on risk management and research on real estate development. The principle
contributions of the dissertation to real estate theory is epitomised in the following
ways:
1. A simple yet comprehensive definition of risk management in the context of real
estate development has been presented, referring to a structured and disciplined
approach that aligns strategy, processes, people, technology and knowledge with
the purpose of evaluating and managing the uncertainties a real estate develop-
ment organisation faces as it creates value.
2. This dissertation has applied general principles of risk management specifically to
the real estate development industry. The analysis of the development process and

184
key risks by means of a phase model has provided a theoretical foundation for risk
management analysis in the industry. It is anticipated this will have utility for both
academics and practitioners in the industry.
3. The study provides information concerning applied risk management in the sector.
This was achieved through the collection and analysis of empirical data on corpo-
rate practice from 69 established development organisations in seven European
countries. The comprehensive analysis shows the positions against upper and lower
benchmarks on major aspects of the risk management process. More specifically,
key aspects risk management have been cross-referenced with structural character-
istics of developers in order to provide greater depth in understanding the real es-
tate development industry. The findings provide a useful benchmarking tool both
for the survey participants as well as for the larger real estate development indus-
try. The work presented in the empirical part of this study represents a considerable
advance in our understanding of risk management practice by providing a broad
pattern of empirical evidence.
4. Previous practise that traditionally risk management has been carried out largely on
an ad-hoc and subjective basis and the lack of literature or academic research in this
area leaves us to believe this has not changed. This study has used empirical re-
search to verify the status by means of a written survey. The results of which have
shown that developers believe that they are undertaking effective risk manage-
ment; however based upon this study’s empirical research, there is strong evidence
that developers tend to take a more reactive rather than proactive stance to man-
aging risks and there are also indications that the development industry lacks a for-
mal and structured approach throughout the risk management process. This disser-
tation consequently previous knowledge about developers’ approach to risk man-
agement.
5. The dissertation has presented a comprehensive review of important and influential
literature about risk management and the real estate development industry to date.
Risk management theories have been documented and discussed. The incorpora-
tion of a broad range of literature, from academic sources on risk, risk management
and real estate development, best practice standards, has provided a sound basis
for the research.

185
7.2 Directions for further research
This dissertation represents a considerable advance in our understanding of the risk
management practice within the real estate development industry. The primary em-
pirical data has been used to identify areas of strengths and weaknesses in status of
implementation of risk management and it has also highlighted a number of areas,
which may be considered for further study:
1. Further work may be carried out to establish if there is causality between risk man-
agement and enhanced performance. It could look to answer questions of whether
better risk management indicates a more successful business and whether good
performance indicates good risk management. Organisations are likely to adopt
better practice more readily on their own accord if they see its value.
2. A study of which methods of risk analysis / assessment are most effective in the real
estate development industry through a modelling approach would provide a useful
contribution to the development of the risk management process.
3. It would be beneficial to conduct an empirical investigation, through the use of case
studies, into the relationship between perceived and actual risk in the real estate
development industry and to investigate the factors, for example geographical loca-
tion or ownership structure, which affect the risk categories.
4. It would be insightful to conduct research into the extent to which real estate de-
velopment organisations have used risk transfer and flexibility as a substitute for
more systematic risk management systems and if this will continue in the current
economic climate.
5. A comparative study of risk management approaches could be made between the
real estate development industry and another industry, for example, private equity
investment or infrastructure. This would provide further information to further de-
velop the risk management concept for the real estate development industry.
6. It would be meaningful to conduct research on how knowledge management ap-
proaches can help to secure personal experience and expertise of key development
professionals within an organisation given the strong role of individual judgement
and ‘gut feeling’ within the real estate development industry.

186
7.3 Implications for industry practitioners
The implications of this dissertation are significant as they suggest that the system of
risk management in practice is far from systematic or holistic. The author’s perception
is that organisations, who fail to implement a risk management system beyond the
relevant regulatory requirements, will find themselves increasingly penalised by the
capital markets and financing partners and particularly so during times of economic
turbulence. The implementation of new and the enhancement of existing risk man-
agement concepts within the real estate development industry will result in a sustain-
able optimisation in the handling of business risks and enhance developers’ ability to
profitably complete riskier or tighter margined projects. As regulators can only set up
risk management guidelines, it is ultimately up to the management to determine an
organisation’s risk appetite and to identify measure and control the risk exposure of
the organisation. Furthermore, the real estate development industry is a multi billion
Euro industry and the complexities of the systems and stakeholders involved should
not be underestimated. In the event that a high profile real estate developer fails, it
would not only affect the immediate parties within the corporation but also a wide
range of other stakeholders.
Various shortcomings in the risk management methods and systems, which are cur-
rently employed in the sector, have been identified in detail in the previous chapters
and recommendations have been made to improve these. It is one thing to address
these shortcomings but another to deal with the underlying issues, which are funda-
mental to the industry. Despite some efforts to improve risk management in the real
estate development industry over the years a number of fundamental problems per-
sist.
First and foremost is the low awareness, understanding and co-operation across the
industry to address the problems of ineffective risk management systems that cur-
rently exist.
A more proactive culture must prevail not only at project and corporate levels but also
at industry level. The danger is that the optimistic attitude towards current risk man-
agement practices within the industry reflects the optimism of the global real estate
prices boom of the last decade rather than the effectiveness of the systems employed
or the current harsh economic reality across Europe. Secondly, the need to invest the

187
time and resources necessary to develop effective strategies, systems, methodologies
and processes specific to the industry. Significant amounts of money are spent every
year in the real estate development industry and yet the analysis of IT support and risk
management training as confirmed by the author’s working knowledge of the industry
together with the results of the industry survey suggest that the amount invested in
research, education and development of effective risk management systems is, dispro-
portionately small as compared to the amounts spent on other aspects of corporate
activities.
Thirdly, there is a lack of high quality industry specific data and research to provide the
necessary theoretical framework and strategies, which key personnel can apply. To this
end, leading international property professional bodies should work closely with the
industry and academics to facilitate the sharing of data and other information thereby
enhancing the reliability and accuracy of real estate information.
The impact of the current economic environment on real estate developers has been
discussed in chapter 1.1 and chapter 6. The lack of financing availability and the down-
turn in the investment market have caused an increase in exit risk and much pricing
insecurity. These conditions would most likely affect risk management practices of real
estate developers in a number of ways: higher industry standards emphasizing a more
rigorous risk management approach will be inevitable, difficult market conditions will
require a much more detailed due diligence, demand for more sophistication in risk
management of development organisations and their counterparties and clients (both
tenants and investors) will become more evident and there will also likely be more in-
dustry emphasis on formal documentation and greater concern and awareness of legal
liabilities.

188
7.4 Conclusion
This chapter has addressed research question 5. Concluding that on the one level, it
reflects the need for responsibility in the handling of money and the conduct of com-
mercial activities; while risk management is a rather technical term to professionals
and academics, the fundamental issues are judgement and value. At another level, it
refers to the system by which key personnel are to be accountable and transparent. By
using a systemic process of risk management, in a worst case scenario, could provide a
“box ticking” compliance mentality in some organisations but it is hoped that in most
instances it would provide the necessary framework to develop risk management
strategies and systems that may sustain individual projects and the organisation as a
whole through the inevitable down cycles that occur. A lack of understanding, imple-
mentation of risk management and risk awareness exposes a development organisa-
tion to unnecessary threats and disruptive processes, thereby restricting the organisa-
tion’s scope for realizing opportunities on the one hand and in circumventing threats
on the other hand. The early recognition of risks and opportunities, as well as the abil-
ity to manage these pro-actively, are critical success factors for the long-term prosper-
ity of development organisations. It is to be assumed that management is often unable
to properly assess risk. The lack of research has shown that it lags other industries; a
multi billion industry with high relevance to various stakeholders should rather set the
direction for risk management rather than lag other sectors. The price of poor risk
management processes can result not only in the failure of individual projects but also
whole organisations which have proven to have devastating effects not only on the
organisation itself but on the other stakeholders involved such as employees, suppli-
ers, tenants and financiers. There is a limited amount of academic research done in the
area of risk management in real estate development. This failing is detrimental to the
real estate development industry as it inhibits the exchange of information and learn-
ing. This means that risk management tends to be less structured in its approach and
suffers from being unable to draw upon the experience of others and on past experi-
ence indicating an inability to develop a sustainable and ongoing knowledge bank on
risk management.
The author hopes that this dissertation will contribute to an increasingly conscious
handling and management of risks and a focus on “risk adjusted” decisions-making, so

189
that the incidence of poor risk management which may lead to negative impacts on
projects or entire organisation and even - in the extreme case - systems, risks can
thereby be reduced. MILES / BERENS/ WEISS (2000, p.3) did not underestimate the risky
nature of this industry by saying that "Few business ventures are as heavily leveraged
as traditional real estate development projects, magnifying the risk of ruin but also in-
creasing the potential for high returns to equity." On the other hand, taking the posi-
tive aspect of risk into account, it allows for the possibility not just to generate attrac-
tive profits when developments are completed with a high level of expertise, but also
to positively manage risk in order to maximise long-term returns for all stakeholders
involved. At the same time it became clear that despite all of the technological innova-
tions of the past years, a simple truth remains: it is people that make business success-
ful.

190
Bibliography
AAKER, D. A. / JACOBSON, R. (1987): The role of risk in explaining differences in profitabili-ty, in: Academy of Management Journal, 30, 2, pp. 277-296.
AGRESTI, A. (2007): An introduction to categorical data analysis, Wiley Series in Probabil-ity and Statistics.
AKINTOYE, A.S. / MACLEOD, M.J. (1997): Risk analysis and management in construction, in: International Journal of Project Management, 15(1), pp. 31-38.
AMHOF, R. / SCHWEIZER, M. (2000): Positives Risikomanagement, in: Der Schweizer Treu-
händer, 8, pp. 713-722.
ATTESLANDER, P. (1991): Methoden der empirischen Sozialforschung, Walter de Gruyter.
AVIS, M. R. (1989): Introduction: The development process, in: Topping, R. / Avis, M. R.: Property development, 3rd ed. Spon Press, pp. 1-18.
BABBIE, E. R. (1990): Survey research methods, Belmont, 2nd ed., Wadsworth Publishing.
BAILEY, K. (1994): Methods of social research, 4th ed., Free Press.
BANSE, G. (1996): Herkunft und Anspruch der Risikoforschung, in: Banse, G.: Risikofor-schung zwischen Disziplinarität und Interdisziplinarität von der Illusion der Sicherheit
zum Umgang mit Unsicherheit, Edition Sigma, pp. 15-72.
BANSE, G. / BECHMANN, G. (2001): Interdisziplinäre Risikoforschung - Von der Risikoanaly-se zum Risikomanagement, in: Allenspach, M.: Integriertes Risiko-Management - Per-spektiven einer chancenorientierten Unternehmensführung, St. Gall.
BARKHAM, R. (1997): The financial structure and ethos of property companies: An em-pirical analysis, in: Construction Management & Economics, 15, 5, pp. 441-456.
BARKHAM, R. (2002): Market research for office real estate, in: Guy, S. / Henneberry, J.: Development and developers: Perspectives on property, Blackwell Publishing, pp. 53-
72.
BAUM, A. E. / CROSBY, N. (1988): Property investment appraisal, Wiley-Blackwell.
BAUM, A. E. / MACKMIN, D. (1989): The income approach to property valuation, 3rd ed., Routledge.
BENTZ, V. M. / SHAPIRO, J. J. (1998): Mindful inquiry in social research, Thousand Oaks.
BEREKHOVEN, L. / ECKERT, W. / ELLENRIEDER, P. (2006): Marktforschung: methodische Grund-lagen und praktische Anwendung, Gabler.
BERNSTEIN, P. L. (1996): Against the gods: the remarkable story of risk, John Wiley &
Sons.
BERNSTEIN, P. L. (2000): Risk management, financial markets and insurance: The hidden linkages, in: Geneva Papers on Risk & Insurance, 25, 4, pp. 629-636.

191
BONE-WINKEL, S / ISENHÖFER, B. / HOFMANN, P. (2005): Projektentwicklung, in: Schulte, K.-
W. Immobilienökonomie Band 1: Betriebswirtschaftliche Grundlagen, 3rd ed., Oldenbourg wissenschaftlicher Verlag, pp. 231-299.
BONE-WINKEL, S. (1994): Das strategische Management von offenen Immobilienfonds unter besonderer Berücksichtigung der Projektentwicklung von Gewerbeimmobilien, Schriften zur Immobilienökonomie, Immobilien Informationsverlag Rudolf Müller.
BOYKIN, J. A. (1985): Why real estate projects fail - Beware the feasibility analysis, in: Real Estate Review, 15, 1, pp. 88-91.
BRADE, K. (1998): Strategischer Marketing-Planungsprozess für Büroimmobilien, Schrif-ten zur Immobilienökonomie, Immobilien Informationsverlag Rudolf Müller.
BRAUER, K.-U. (2003): Immobilienprojektentwicklung, in: Brauer, K.-U.: Grundlagen der Immobilienwirtschaft: Recht - Steuern - Marketing - Finanzierung - Bestandsmanage-ment - Projektentwicklung, 4th ed., Gabler, pp. 547-599.
BROWN, R. K. (1971): The investment counsellor’s role in the development process, in: The Appraisal Journal, 39, 3, pp. 374-380.
BUSCH, T. A. (2003): Risikomanagement in Generalunternehmungen: Identifizierung ope-rativer Projektrisiken und Methoden zur Risikobewertung, IBB – Institut für Bauplanung und Baubetrieb, Zurich, 2003.
BUTTERWORTH, M. (2001): The emerging role of the risk manager, in: Pickford, J.: Master-ing risk - Vol. 1: Concepts, Financial Times – Harlow, pp. 21-25.
BYRNE, P. J. (1996): Risk, uncertainty and decision-making in property development, 2nd ed, E. & FN Spon.
BYRNE, P. J. / CADMAN, D. (1984): Risk, uncertainty and decision-making in property de-velopment, E. & FN Spon.
CADMAN, D. / TOPPING, R. (1995): Property development, 4th ed., Chapman & Hall.
CAREY, A. / TURNBULL, N. (2001): The boardroom imperative on internal control, in:
Pickford, J.: Mastering risk - Vol. 1: Concepts, Financial Times - Harlow, pp. 10-14.
CB Richard Ellis (2009): The changing European development cycle, EMEA View Point, December 2009.
COSO (2004): Enterprise Risk Management Framework.
COSO (2009): Strengthening Enterprise Risk Management for Strategic Advantage.
CRESWELL, J. W. (1998): Qualitative inquiry and research design: Choosing among five traditions, Thousand Oaks.
CZAJA, R. / BLAIR, J. (1996): Designing surveys: a guide to decisions and procedures, Sage Publications.
D'ARCY, E. / KEOGH, G. (2002): The market context of property development activities, in: Guy, S. / Henneberry, J.: Development and developers: Perspectives on property, Blackwell Publishing, pp. 19-34.

192
DELOACH, J. W. (2000): Enterprise-wide risk management: Strategies for linking risk and
opportunity, Financial Times Management.
DENZIN, N. K. / LINCOLN, Y. S. (2000): Introduction: The discipline and practice of qualita-tive research, in: Denzin, N. K. / Lincoln, Y. S.: Handbook of qualitative research, 2nd ed., Sage Publications, pp. 1-28.
DICKINSON, G. (2001): Enterprise risk management: Its origins and conceptual founda-tion, in: The Geneva Papers on Risk & Insurance, 26, 3, pp. 360-366.
DIEDERICHS, C. J. (1996): Grundlagen der Projektentwicklung, in: Schulte, K.-W.: Hand-buch Immobilien-Projektentwicklung, Immobilien Manager Verlag, pp. 17-80.
DIPASQUALE, D. / WHEATON, W. (1995): Urban Economics and Real Estate Markets, Pren-tice-Hall.
DOHERTY, N. A. (2000): Integrated risk management: Techniques and strategies for managing corporate risk, McGraw-Hill.
DORENBOS, R.J. / HAGENBEEK, V. / NOZEMAN, E.F. (2007): Growth strategies in the real es-tate sector, proceedings ERES conference London.
DOWD, K. (1998): Beyond value at risk: The New Science of Risk Management, Wiley.
DUBBEN, N. / SAYCE, S. (1991): Property portfolio management: an introduction,
Routledge.
DUNCAN, R. (2002): A question with no answer? in: Internal Auditing and Business Risks, January, pp. 41-45.
ERNST & YOUNG AG (2002): Embedded value and enterprise risk modelling, A White Pa-per for the American Council of Life Insurers.
FEDERATION OF EUROPEAN RISK MANAGEMENT ASSOCIATIONS (2006): Senior management now drives risk management, press release, 11 October 2006.
FERMA, ERNST & YOUNG AND AXA CS (2006): Risk Management Practices in 2006: Are you
ready for change?, FERMA survey & seminar, Brussels.
FISHER, P. / ROBSON, S. (2006): The perception and management of risk in UK office prop-erty development, in: Journal of Property Research, 23 (2), pp. 135-161.
FISHER, R. A. (1934): The concepts of inverse probability and fiducial probability referring to unknown parameters, Proc. Roy. Soc., A 139, pp. 343-348.
FISHER, R. A. (1925): Statistical methods for research workers, Oliver and Boyd.
FLANAGAN, R. / NORMAN, G. (1993): Risk Management and Construction, Wiley-Blackwell.
FRANKE, G. / KRAHNEN, J. P. (2008): The future of securitization, Center of Financial Stu-
dies, Working Paper No. 2008/31.
FREEMAN, G. H. / HALTON, J. H. (1951): Note on an exact treatment of contingency good-ness-of fit and other problems of significance, Biometrika, 38: pp. 141-149.

193
FRITZ, D. F. (2004): Philipp Holzmann AG – Insolvency of a Construction Giant, in: Insol-
vency Law & Practice, Vol. 20, No. 4, pp. 147-151.
FÜRER, G. (1990): Risikomanagement im internationalen Bankgeschäft, Berne.
GEHNER, E (2008): Knowingly taking risk - Investment decision making in real estate de-velopment, eburon.
GEHNER, E (2003): Risicoanalyse bij projectontwikkeling, Sun (TUD).
GEHNER, E. / DE JONGE, H. (2005): A behavioral perspective on risk management in real estate development, in: Y Wang & Q Shen (Eds.), Conference on construction & real estate management: challenge of innovation in construction and real estate, Vol. 2 (pp.
739-744). S.l.: China Architecture & Building Press.
GEHNER, E. / HALMAN, J. I. M. / DE JONGE, H. (2006): Risk management in the Dutch real es-tate development sector: a survey; in: Amaratunga, D. / Haigh, R. / Vrijhoef, R. / Ham-blett, M. / van den Broek, C. (Eds.): Proceedings of the 6th International postgraduate research conference in the built and human environment , Delft, The Netherlands, 6-7 April 2006 (pp. 541-552).
GELTNER, D. / MILLER, N.G. (2001): Commercial Real estate Analysis and Investments, Ma-son.
GESCHWENDER, A. (2010): Real Estate: Principles and Practices, 8th ed., Cengage Learning.
GIMPELEVICH, D. (2011): Simulation-based excess return model for real estate develop-ment, in: Journal of Property Investment & Finance, Vol. 29 No. 2, pp. 115-144.
GLEISSNER, W. / WIEGELMANN, T. (2012): Immobilienrating im Zusammenhang mit der Risi-koanalyse, in: Immobilien & Finanzierung, 10 - 2012.
GORE, T. / NICHOLSON, D. (1991): Models of the land-development process: a critical re-view, in: Environment and Planning, Vol. 26, pp. 705-730.
GRAASKAMP, J. A. (1972): A rational approach to feasibility analysis, in: The Appraisal Journal, 40, 4, pp. 513-521.
GRAASKAMP, J. A. (1977): An approach to real estate finance education by analogy to risk management principles, in: Real Estate Issues, Summer 1997, pp. 53-70.
GRAASKAMP, J. A. (1992): Fundamentals of real estate development, in: Journal of Prop-erty Valuation & Investment, 10, pp. 619-639.
GRAY, D. E. (2004): Doing research in the real world, Sage Publications.
GRENADIER, S. R. (1995): The persistence of real estate cycles, in: Journal of Real Estate Finance and Economics, pp. 95-119.
GRISSOM, T. V. (1984): A feasibility process: The benefits of land economics and risk management, in: The Appraisal Journal, 52, 3, pp. 356-374.
GUY, C. (1994): The retail development process - location, property and planning, GUY, C. (1994): The retail development process - location, property and planning.

194
GUY, S. / HENNEBERRY, J. (2002): Approaching development, in: Guy, S. H., J.: Develop-
ment and developers: Perspectives on property, Blackwell Publishing, pp. 1-18.
HALLER, M. (1975): Sicherheit durch Versicherung? Gedanken zur künftigen Rolle der Versicherung, Lang.
HALLER, M. (1986): Risiko-Management - Eckpunkte eines integrierten Konzepts, in: Ja-cob, H.: Schriften zur Unternehmensführung, Wiesbaden, pp. 7-43.
HANLEY, M. (2001): Lowering exposure by spreading the risk, in: Pickford, J.: Mastering risk - Vol. 1: Concepts, , Financial Times - Harlow, pp. 53-57.
HARGITAY, S. E. / YU, S.-M. (1993): Property investment decisions: a quantitative ap-
proach, E & FN Spon.
HEALEY, P. (1991): Models of the development process: A review, in: Journal of Property Research, 8, 3, pp. 219-238.
HEALEY, P. (1992): An institutional model of the development process, in: Journal of Property Research, 9, pp. 33-44.
HERTZ, D. (1964): Risk analysis in capital investment, in: Harvard Business Review, Vol. 42, pp. 95-106.
HEWLETT, C. / KAUFMANN, G. (2008): Strategy for real estate companies, Urban Land Insti-
tute.
HOBUSS, W. (1999): Comprehensive risk management and the role of internal audit, in: Riskmanagement Bulletin, April.
HOEVE, P. / SCHWEIZER, M. (2001): Vom strategischen Controlling zum integrierten Risi-komanagement - alter Wein in neuen Schläuchen?, in: Allenspach, M.: Integriertes Risi-ko-Management - Perspektiven einer chancenorientierten Unternehmensführung, St. Gall, pp. 103-117.
HÖLSCHER, R. (1999): Gestaltungsformen und Instrumente des industriellen Risikomana-gements, in: Schierenbeck, H.: Risk Controlling in der Praxis, NZZ Verlag, pp. 297-363.
HOMMEL, U. / LEHMANN, H. (2002): Risiko-Management in der Immobilienfinanzierung, in: Schulte, K.-W. / Achleitner, A.-K. / Schäfers, W. / Knobloch, B.: Handbuch Immobilien-Banking: Von der traditionellen Finanzierung zum Investment-Banking, Immobilien In-formationsverlag Rudolf Müller, pp. 229-253.
INTERNATIONAL ORGANIZATION FOR STANDARDIZATION (2009): ISO 31000: Risk Management – Principles and Guidelines
ISAAC, D. / O'LEARY, J. / DALEY, M. (2010): Property Development: Appraisal and Finance, 2nd ed., Palgrave Macmillan.
ISENHÖFER, B. (1999): Strategisches Management von Projektentwicklungsunternehmen, Schriften zur Immobilienökonomie, Immobilien Informationsverlag Rudolf Müller..
ISENHÖFER, B. / VÄTH, A. (1998): Projektentwicklung, in: Schulte, K. W.: Immobilienöko-nomie Band 1: Betriebswirtschaftliche Grundlagen, Oldenbourg, pp. 149-228.

195
JAFFE, A. J. / SIRMANS, C. F. (1995): Fundamentals of Real Estate Investment, 3rd ed., Pren-
tice Hall College Div.
KALUSCHE, W. (2002): Projektmanagement für Bauherren und Planer, Oldenbourg.
KNIGHT, R. F. / PRETTY, D. J. (2001): Philosophies of risk, shareholder value and the CEO, in: Pickford, J.: Mastering risk - Vol. 1: Concepts, Financial Times - Harlow, pp. 311-315.
LAI, S.-K. (2001): Property Rights: acquisition and land development behaviour, in: Plan-ning Forum, 7, pp. 21-27.
LASTER, D. S. (1999a): The conventional approach to risk management, New York.
LASTER, D. S. (1999b): Everyone is a risk manager, in: Shimpi, P. A.: Integrating corporate
risk management, Swiss Re Markets, pp. 8-18.
LARYEA, S. (2008): RISK pricing practices in finance, insurance, and construction. In: RICS
Construction and Building Research Conference, 4-5 September 2008, Dublin Institute
of Technology, Dublin, Ireland.
LONG, C. (2011): Finance for Real Estate Development, Urban Land Institute.
LYONS, T. / SKITMORE, M. (2004): Project risk management in the Queensland engineering
construction industry: a survey, in: International Journal of Project Management, 22(1),
pp. 51-61.
LEWIN, C. (2001): Refining the art of the probable, in: Pickford, J.: Mastering risk - Vol. 1: Concepts, Financial Times - Harlow, pp. 35-41.
MACCRATE, J. R. / PETERSON, D. L. (1999): Land investment in the 21st Century, in: Real Es-tate Issues, 24, 2, pp. 15-24.
MAC RUAIRI, C. / SEEBUS, J. (2010): Developers forge new alliances, in: PropertyEU Maga-zine, No. 1, January/ February 2010, pp. 47-53.
MAC RUAIRI, C. / SEEBUS, J. (2008): New stars in emerging markets, in: Property Magazi-neEU, No. 1, February 2008, pp. 41-48.
MAIER, K. M. (2004): Risikomanagement im Immobilien- und Finanzwesen: Leitfaden für Theorie und Praxis, 2nd ed., Knapp Fritz Verlag.
MALIZIA, E. E. (1992): A framework for real estate feasibility research, in: Journal of Property Valuation and Investment, 10, 3, pp. 640-645.
MANNING, C. / HARRISON, D. M. / ROULAC, S. E. / LIZIERI, C. / KAISER, R. W. / CASE, B. (2008): Industry decision-maker use and involvement in academic real estate research, Journal
of Real estate Literature, Volume 16, Number 2, 2008, pp. 135-166.
MARSHALL, K. / KENNEDY, C. (1992): Development valuation techniques, in: Journal of Property Valuation and Investment, 1, pp. 57-66.
MAYNARD, G. R. (1999): Embracing risk, in: Internal Auditor, 56, 1, pp. 24-28.

196
MCCLAVE, J. T. / BENSON, P., G. / SINCICH, T (2007): Statistics for business and economics,
10th ed., Prentince Hall.
MCNAMARA, P. (1983): Towards a classification of land developers, in: Urban Law and Policy, pp. 87-94.
MCNAMEE, D. / SELIM, G. M. (1998): Riskmanagement: Changing the internal auditor's perspective, Paperback, The IIA Research Foundation.
MEULBROEK, L. (2001): Total strategies for company-wide risk control, in: Pickford, J.: Mastering risk - Vol. 1: Concepts, Financial Times – Harlow, pp. 67-73.
MILES, M. B. / HUBERMAN, A. M. (1994): Qualitative data analysis: an expanded source-
book, 2nd ed., Sage Publications.
MILES, M. B. / WURTZEBACH, C. (1971): Risk analysis in the real estate development proc-ess: a conceptual framework and computer simulation model, in: Journal of Business Research, Vol. 5, pp. 325-357.
MILES, M. E. / BERENS, G. / EPPLI, M., WEISS, M.A. (2007): Real estate development: princi-ples and process, 4th ed., Urban Land Institute.
MILES, M. E. / BERENS, G. / WEISS, M. A. (2000): Real Estate Development: Principles and Process, 3rd ed., Urban Land Institute.
MILES, M. E. / HANEY, R. L. / BERENS, G. (1995): Real Estate Development: Principles and Process, Urban Land Institute.
MILLER, K. D. (1992): A framework for integrated risk management in international busi-ness, in: Journal of International Business Studies, 23, 2, pp. 311-331.
MILLINGTON, A. F. (2000): Property development, Estates Gazette.
MORLEY, S. (2002): The financial appraisal of development projects, in: Guy, S. / Henne-berry, J.: Development and developers: Perspectives on property, Blackwell Publishing, pp. 73-95.
NEARY, N. (2009): Growth strategies for real estate developers - Motives, experiences and strategies in entering foreign markets, MSRE Master Thesis, Amsterdam School of Real Estate, May 2009.
NELL V. J. / EMENLAUER, R. (2002): Die Entwicklung einer Nutzungskonzeption als Grund-stein der Projektentwicklung, in: Schulte, K.-W. / Bone-Winkel, S.: Handbuch Immobi-lien-Projektentwicklung, 2nd ed., Immobilien Informationsverlag Rudolf Müller, pp. 113-128.
NEWELL, G. / ACHEAMPONG, P. / WORZALA, E. (2002): Property research priorities, in: Pacific Rim Property Research Journal, Vol. 8 No. 2, pp. 127-39.
NEWELL, G. / MCALLISTER, P. / WORZALA, E. (2004): Property research priorities in the UK, in: Journal of Property Investment & Finance, Vol. 22, No. 3, pp. 269-282.
NORMAN, G. / FLANAGAN. R. (1993): Risk Management & Construction, Blackwell Publish-ers.

197
NOZEMAN, E. F. (2008): Handboek projectontwikkeling, Reed Business BV, 2008.
NOZEMAN, E.F. / DORENBOS, R.J. (2006): The European real estate development industry: Structure and dynamics, Paper prepared for the 13th Annual European Real Estate So-ciety Conference, Weimar, Germany, 7-10 June 2006.
NOZEMAN, E. F. (2004): Transparency in the real estate sector: Achieveable ideal or fata morgana?, in: Dijkman, M.: Holland Real Estate Yearbook 2004, Holland Real Estate Publishers B.V., pp. 252-255.
NOZEMAN, E. F. (2002): Viable concepts: challenge to real estate, in: Dijkman, M.: Hol-land Real Estate Yearbook 2002, Holland Real Estate Publishers B.V., pp. 206-209.
OWENS, R. W. (1998): Subdivision development: Bridging theory and practice, in: The Appraisal Journal, 66
PEISER, R. / FREJ, A. B. (2003): Professional Real Estate Development, The ULI Guide to the Business, 2nd ed., Urban Land Institute.
PEISER, R. (1984): Risk analysis in land development, in: Journal of the American Real Estate and Urban Economics Association, Vol. 12, pp. 12-29.
PELLAT, P. G. K. (1972): The analysis of real estate investments under uncertainty, in: Journal of Finance, Vol. 27, pp. 459-471.
PEZIER, J. (2002): Operational Risk Management, in: ICMA Centre Discussion Papers, Fi-nance from Henley Business School, Reading University, September 2002
PROTIVITI (2006): Guide to enterprise risk management – frequently asked questions, protiviti.com
RAHMAN, M. M. / KUMARASWAMY, M. M. (2002): Risk management trends in the construc-tion industry: Moving towards joint risk management, in: Engineering Construction & Architectural Management, 9, 2, pp. 131-151.
RATCLIFFE, J. / STUBBS, M. / KEEPING, M. (2009): Urban planning and real estate develop-ment, 3rd. ed., ROUTLEDGE.
REMENYI, D. / WILLIAMS, B. / MONEY, A. / SCHWARTZ, E. (1998): Doing research in business and management: An introduction to process and method, Sage Publications.
ROBSON, C. (1993): Real world research: a resource for social scientists and practitioner, Blackwell.
ROBSON, S. (2009): The use of judgement by commercial property developers, RICS COBRA Research Conference, University of Cape Town, 10-11th September 2009.
ROMEIKE, F. (2003): Risikoidentifikation und Risikokategorien, in: Romeike, F. / Finke, R. B.: Erfolgsfaktor Risiko-Management Chance für Industrie und Handel Methoden, Bei-
spiele, Checklisten, Gabler, pp. 165-180.
ROTH, J. / ESPERSEN, D. (2002): Categorizing risk, in: Internal Auditor, 59, 2, pp. 57-59.
ROWE, W. D. (1977): Anatomy of risk, John Wiley & Sons.

198
ROYAL INSTITUTION OF CHARTERED SURVEYORS (2003): The management of risk - yours, mine
and ours, RICS Project Management Faculty, London.
SANTOMERO, A. M. / OLDFIELD, G. S. (1997): Risk management in financial institutions, in: Sloan Management Review, Fall, pp. 33-46.
SCHULTE, K.-W. / BONE-WINKEL, S. / ROTTKE, N. (2002): Grundlagen der Projektentwicklung aus immobilienwirtschaftlicher Sicht, in: Schulte, K.-W. / Bone-Winkel, S.: Handbuch Immobilien-Projektentwicklung, 2nd ed., Immobilien Informationsverlag Rudolf Müller, pp. 27-90.
SCHULTE, K.-W. / VOGLER, J. H. (1998): Grundlagen der Immobilieninvestition, in: Schulte, K.-W. / Bone-Winkel, S. / Thomas, M.: Handbuch Immobilien Investition, Immobilien
Informationsverlag Rudolf Müller, pp. 17-33.
SCHULTE, K.-W. / ROTTKE, N. / PITSCHKE, C. (2005): Transparency in the German real estate market, in: Journal of Property Investment & Finance, Vol. 23 No. 1, pp. 90-108.
SCHNELL, R. / HILL, P. / ESSER, E. (1999): Methoden der empirischen Sozialforschung, 6th ed., Oldenbourg.
SHIMPI, P. A. (1999): Risk mapping, in: Shimpi, P. A.: Integrating corporate risk manage-ment, Swiss Re Markets, pp. 58-77.
SHUN, C. K. L. (2000): Review of risk management techniques for property development,
Henley Working Paper.
SLOVIC, P. / FINUCANE, M. L. / PETERS, E. / MACGREGOR, D.G. (2004): Risk as analysis and risk as feelings: some thoughts about affect, reason, risk and rationality, in: Risk analysis, 24 (2), pp. 311-322.
STRAUSS, A. L. / CORBIN, J. M. (1990): Basics of qualitative research: grounded theory pro-cedures and techniques, Sage Publications.
THOMAS, J. E. (2001): Structuring development joint ventures, in: Briefings in Real Estate Finance, 1, 2, pp. 103-111.
TIESDELL, S. / ADAMS, D. (2011): Real estate development, urban design and the tools ap-proach to public policy, in: TIESDELL, S. / ADAMS, D.: Urban Design in the Real Estate De-velopment Process, Wiley-Blackwell, pp. 1-33.
UHER, T.E./ TOAKLEY, A.R. (1999): Risk management in the conceptual phase of a project, in: International Journal of Project Management, 17(3), pp. 161-169.
ULRICH, H. / DYLLICK, T. / PROBST, G. J. B. (1984): Management, Paul Haupt.
VAN DENZEN, O. M. (2009): Riisiico-rendement afwegiing biijj acquiisiittiie van onttwiikkellposiittiies iin besttaand bebouwd gebiied, MSRE Masterthesis, Amsterdam School of Real Estate, February 2009.
VAUGHAM, E. (1996): Risk management, Wiley.
VAUS, D. A. (1996): Surveys in social research, UCL Press.

199
VERNOR, J. (1989): Identifying real estate investment risk, in: The Appraisal Journal, Vol.
57, pp. 266-270.
WELLINGTON, J. / SZCZERBINSKI, M. (2007): Research Methods for the Social Sciences, Con-tinuum International Publishing Group.
WHEATON, W. C. (1987): The cyclical behaviour of the national office market, in: AREUEA Journal, Vol. 15, pp. 281-299.
Whipple, R. T. M. (1988): Evaluation development projects, in: Journal of Valuation, Vol. 6, No. 3, pp. 253-286.
WIEDENMANN, M. (2005): Risikomanagement bei der Immobilien-Projektentwicklung un-
ter besonderer Berücksichtigung der Risikoanalyse und Risikoquantifizierung, Books on Demand, Norderstedt.
WIEGELMANN, T. (2012): Risikoeinschätzung in der Immobilien-Projektentwicklung, in: Immobilien & Finanzierung, 08 - 2012, pp. 261-263.
WILKINSON, S. / REED, R. (2008): Property Development, 5th ed., Routledge.
YIN, R. K. (2003): Case study research: design and methods, 3rd ed., Sage Publications.
ZANI, W. M. (1993): Reducing the cyclical volatility of real estate development, in: Real Estate Review, 22, 4, pp. 76-82.

200
Appendix A - Developer list (population)

201

202

203
Appendix B - Covering Letter

204
Appendix C - Questionnaire

205

206

207

208

209

210

211

212
Appendix D – Statistical analysis
The questionnaire only consists of nominal variables that can be illustrated in contin-
gency tables. The first step of statistical analysis is to analyse whether row and column
variable are independent or not. By default the chi-square test is used for this prob-
lem. The chi-square statistic compares the observed frequencies with the expected
frequencies. The latter are frequencies that result when the independence assumption
is complied
Afterwards the test statistic is compared to the critical value of a chi-square distribu-
tion with (r-1)(c-1) degrees of freedom. However, this method is an asymptotic one.
Given a sufficiently large sample size, this means that values are estimated based
on the assumption that the data conform to a particular distribution. The common rule
to produce reliable results indicates that you should not use a chi-square test when at
least one expected frequency is less than five (AGRESTI, 2007).
Considering the data of the questionnaire several expected frequencies in the
contingency tables are less than five and the chi-square test cannot be used. In this
case, calculating a significance level based on the exact distribution of the test statistic
is preferable. Consequently an accurate value is obtained without relying on any as-
sumptions.
An alternative for testing independence of variables with the asymptotic chi-square
test is Fisher’s exact test (FISHER, 1934). It is traditionally associated with a con-
tingency table. FREEMAN / HALTON (1951) first proposed an extension to tables.
The hypotheses are denoted by
: Row variable and column variable are independent
: Row variable and column variable are not independent.
Let denote the contingency table actually observed and denote a
contingency table of a reference set of contingency tables that could have been
observed. The reference set is defined as follows:
)(
)()()(ˆ
N
lColumntotaRowtotalNE IJ
p
cr
p
22
cr
0H
1H
x cr y cr
cr

213
.
It can be shown that, under the hypothesis of independence, the probability of observ-
ing any is
.
The test statistic for any observed contingency table is computed by
,
where
.
Following notations were used in the precedent formulas: The number of rows is ,
is the number of columns, is the number of all observations, is the total sum of
row , is the total sum of columns .
The exact value is defined as the sum of null probabilities of all the tables in the
reference set that are at least as extreme as the observed table with respect to
:
,
where denotes probability.
As the exact value is calculated, in this approach no distribution is taken as a basis
for the test. Consequently no critical value is needed and the decision if is rejected
or not only base on the exact value:
The null hypothesis is rejected, if the exact value is bigger than 0.05.
The null hypothesis is accepted if the exact value is smaller or equal to 0.05.
In this work, the value is used for assessing significance and the significance level ()
is 0.05. (FISHER, 1925) If the value is bigger than 0.05, the null hypothesis is accepted
and the results show that there is no association among the variables and the risk per-
ception indications. If the null hypothesis is rejected the result of depending variables
jinymycrisyy j
r
i
iji
c
j
ij ,;;:11
y
r
i
ij
c
j
r
i
i
c
j
j
yN
mn
yP
11
11
!!
!!
)(
cr
))(log(2)( xPxFI
r
i
c
i
c
j
r
j
rccr mnN1
2/)1(
1
2/)1(2/)1(2/)1)(1( )()()2(
r c
N im
ijn j
p
x
)(xFI
)()(
)()(Pr)(xFIyFI
xFIyFIyPp
Pr
p
0H
p
p
p
p
p

214
is considered to be significant. To get uniform results for all contingency tables Fisher’s
exact test is applied to all tables even if the chi-square test could have been used.
For all calculated statistical values the statistical software SPSS (Statistical Package for
the Social Sciences) was used.

215
Appendix E - Results from Cramer’s V / p-value analysis
p-valueCramer's
ValueAssociation found between
Question no. in
questionnaire
0,000 0,489 Risk Assessment and Ownership Structure 14(4)
0.000 0,413 Geographic scope and Project Size 2
0,000 0,755 Effective Risk Management and Ownership Structure 12(1)
0,001 0,381 Risk Management Principles and Geographic Scope 24(5)
0,002 0,377 Risk Perception and Project Size 9
0,003 0,454 Optimum project volume and Geographic Scope 5
0.005 0,398 Risk Management Committee and Project Size 25(1)
0,007 0,412 Risk Management Strategy and Ownership Structure 6
0,009 0,405 Risk Management Principles and Developer Type 24(5)
0.013 0,401 Key Indicators/threshold values and Developer Type 21(6)
0,013 0,342 Setting Corporate Objectives and Developer Type 12(1)
0,016 0,365 Setting Corporate Objectives and Project Size 12(4)
0,019 0,359 IT Support and Project Size 23
0,023 0,356 Setting Corporate Objectives and Ownership Structure 12(2)
0,025 0,341 Risk Identification and Developer Type 14(2)
0,027 0,351 Appropriate Tools and Ownership Structure 21(7)
0,032 0,295 Understanding of Risk Management and Geographic Scope 12(5)
0,040 0,332 Risk Reporting and Geographic Scope 21(3)

216
Appendix F – Empirical results
1) Under which developer category would you classify the development activities of your enterprise?
Total Respondants 37 53,6% 32 46,4% 69 100,0%
Ownership structure
- Listed 12 52,2% 11 47,8% 23 33,3%
- Unlisted 25 54,3% 21 45,7% 46 66,7%
Total Ownership Structure 37 53,6% 32 46,4% 69 100,0%
p value (Fisher's exact test) 1,000 φ(Phi) -0,021 Cramer`s V 0,021
Geographic Scope
- Regional 2 33,3% 4 66,7% 6 8,7%
- National 21 58,3% 15 41,7% 36 52,2%
- International 14 51,9% 13 48,1% 27 39,1%
Total Geographic Scope 37 53,6% 32 46,4% 69 100,0%
p value (Fisher's exact test) 0,514 φ(Phi) 0,140 Cramer`s V 0,140
Project Size Classification
- Small (EUR < 5 - 10 million) 4 57,1% 3 42,9% 7 10,1%
- Medium (EUR > 10 - 50 million) 24 60,0% 16 40,0% 40 58,0%
- Large (EUR > 50 - 250 million) 9 40,9% 13 59,1% 22 31,9%
Total Project Size Classification 37 53,6% 32 46,4% 69 100,0%
p value (Fisher's exact test) 0,349 φ(Phi) 0,175 Cramer`s V 0,175
Number of
Responses
Mainly
Investor-
Developer
(Development
for own
portfolio)
Mainly Trader-
Developer
(Development
including project
sale)

217
2) What is the geographic scope of the company’s activities?
Total Respondants 6 8,7% 36 52,2% 27 39,1% 69 100,0%
Developer Classification
- Mainly Trader-Developer 2 5,4% 21 56,8% 14 37,8% 37 53,6%
- Mainly Investor-Developer 4 12,5% 15 46,9% 13 40,6% 32 46,4%
Total Developer Classification 6 8,7% 36 52,2% 27 39,1% 69 100,0%
p value (Fisher's exact test) 0,514 φ(Phi) 0,140 Cramer`s V 0,140
Ownership structure
- Listed 3 13,0% 11 47,8% 9 39,1% 23 33,3%
- Unlisted 3 6,5% 25 54,3% 18 39,1% 46 66,7%
Total Ownership Structure 6 8,7% 36 52,2% 27 39,1% 69 100,0%
p value (Fisher's exact test) 0,610 φ(Phi) 0,113 Cramer`s V 0,113
Project Size Classification
- Small (EUR < 5 - 10 million) 2 28,6% 3 42,9% 2 28,6% 7 10,1%
- Medium (EUR > 10 - 50 million) 4 10,0% 28 70,0% 8 20,0% 40 58,0%
- Large (EUR > 50 - 250 million) 0 0,0% 5 22,7% 17 77,3% 22 31,9%
Total Project Size Classification 6 8,7% 36 52,2% 27 39,1% 69 100,0%
p value (Fisher's exact test) 0,000 φ(Phi) 0,584 Cramer`s V 0,413
Number of
ResponsesRegional National International

218
3) Please provide details on the ownership structure of your company
Total Respondants 46 66,7% 23 33,3% 69 100,0%
Developer Classification
- Mainly Trader-Developer 25 67,6% 12 32,4% 37 53,6%
- Mainly Investor-Developer 21 65,6% 11 34,4% 32 46,4%
Total Developer Classification 46 66,7% 23 33,3% 69 100,0%
p value (Fisher's exact test) 1,000 φ(Phi) 0,021 Cramer`s V 0,021
Geographic Scope
- Regional 3 50,0% 3 50,0% 6 8,7%
- National 25 69,4% 11 30,6% 36 52,2%
- International 18 66,7% 9 33,3% 27 39,1%
Total Geographic Scope 46 66,7% 23 33,3% 69 100,0%
p value (Fisher's exact test) 0,930 φ(Phi) 0,113 Cramer`s V 0,113
Project Size Classification
- Small (EUR < 5 - 10 million) 3 42,9% 4 57,1% 7 10,1%
- Medium (EUR > 10 - 50 million) 27 67,5% 13 32,5% 40 58,0%
- Large (EUR > 50 - 250 million) 16 72,7% 6 27,3% 22 31,9%
Total Project Size Classification 46 66,7% 23 33,3% 69 100,0%
p value (Fisher's exact test) 0,335 φ(Phi) 0,177 Cramer`s V 0,177
Number of
ResponsesUnlisted Listed

219
4) What is the distribution of the project development services across the various types of usage? (total = 100%):
Residential
Total Respondants 19 40.4% 9 19.1% 8 17.0% 10 21.3% 1 2.1% 47 100.0%
Developer Classification
- Mainly Trader-Developer 8 28.6% 9 32.1% 3 10.7% 8 28.6% 0 0.0% 28 59.6%
- Mainly Investor-Developer 11 57.9% 0 0.0% 5 26.3% 2 10.5% 1 5.3% 19 40.4%
Total Developer Classification 19 40.4% 9 19.1% 8 17.0% 10 21.3% 1 2.1% 47 100.0%
Ownership structure
- Listed 7 38.9% 2 11.1% 4 22.2% 4 22.2% 1 5.6% 18 38.3%
- Unlisted 12 41.4% 7 24.1% 4 13.8% 6 20.7% 0 0.0% 29 61.7%
Total Ownership Structure 19 40.4% 9 19.1% 8 17.0% 10 21.3% 1 2.1% 47 100.0%
Geographic Scope
- Regional 0 0.0% 1 25.0% 2 50.0% 1 25.0% 0 0.0% 4 8.5%
- National 11 42.3% 5 19.2% 3 11.5% 6 23.1% 1 3.8% 26 55.3%
- International 8 47.1% 3 17.6% 3 17.6% 3 17.6% 0 0.0% 17 36.2%
Total Geographic Scope 19 40.4% 9 19.1% 8 17.0% 10 21.3% 1 2.1% 47 100.0%
Project Size Classification
- Small (EUR < 5 - 10 million) 1 20.0% 1 20.0% 1 20.0% 2 40.0% 0 0.0% 5 10.6%
- Medium (EUR > 10 - 50 million) 9 33.3% 6 22.2% 4 14.8% 7 25.9% 1 3.7% 27 57.4%
- Large (EUR > 50 - 250 million) 9 60.0% 2 13.3% 3 20.0% 1 6.7% 0 0.0% 15 31.9%
Total Project Size Classification 19 40.4% 9 19.1% 8 17.0% 10 21.3% 1 2.1% 47 100.0%
61-80%Number of
Responses81-100%1-20% 21-40% 41-60%
4) What is the distribution of the project development services across the various types of usage? (total = 100%):
Office
Total Respondants 20 31.7% 19 30.2% 13 20.6% 6 9.5% 5 7.9% 63 100.0%
Developer Classification
- Mainly Trader-Developer 13 37.1% 9 25.7% 6 17.1% 5 14.3% 2 5.7% 35 55.6%
- Mainly Investor-Developer 7 25.0% 10 35.7% 7 25.0% 1 3.6% 3 10.7% 28 44.4%
Total Developer Classification 20 31.7% 19 30.2% 13 20.6% 6 9.5% 5 7.9% 63 100.0%
Ownership structure
- Listed 8 40.0% 6 30.0% 2 10.0% 2 10.0% 2 10.0% 20 31.7%
- Unlisted 12 27.9% 13 30.2% 11 25.6% 4 9.3% 3 7.0% 43 68.3%
Total Ownership Structure 20 31.7% 19 30.2% 13 20.6% 6 9.5% 5 7.9% 63 100.0%
Geographic Scope
- Regional 1 20.0% 2 40.0% 2 40.0% 0 0.0% 0 0.0% 5 7.9%
- National 10 27.8% 12 33.3% 7 19.4% 4 11.1% 3 8.3% 36 57.1%
- International 9 40.9% 5 22.7% 4 18.2% 2 9.1% 2 9.1% 22 34.9%
Total Geographic Scope 20 31.7% 19 30.2% 13 20.6% 6 9.5% 5 7.9% 63 100.0%
Project Size Classification
- Small (EUR < 5 - 10 million) 1 20.0% 2 40.0% 1 20.0% 1 20.0% 0 0.0% 5 7.9%
- Medium (EUR > 10 - 50 million) 11 28.2% 13 33.3% 11 28.2% 1 2.6% 3 7.7% 39 61.9%
- Large (EUR > 50 - 250 million) 8 42.1% 4 21.1% 1 5.3% 4 21.1% 2 10.5% 19 30.2%
Total Project Size Classification 20 31.7% 19 30.2% 13 20.6% 6 9.5% 5 7.9% 63 100.0%
61-80%1-20% 21-40% 41-60% 81-100%Number of
Responses

220
4) What is the distribution of the project development services across the various types of usage? (total = 100%):
Mixed-use
Total Respondants 18 50.0% 13 36.1% 5 13.9% 0 0.0% 0 0.0% 36 100.0%
Developer Classification
- Mainly Trader-Developer 11 47.8% 7 30.4% 5 21.7% 0 0.0% 0 0.0% 23 63.9%
- Mainly Investor-Developer 7 53.8% 6 46.2% 0 0.0% 0 0.0% 0 0.0% 13 36.1%
Total Developer Classification 18 50.0% 13 36.1% 5 13.9% 0 0.0% 0 0.0% 36 100.0%
Ownership structure
- Listed 5 45.5% 5 45.5% 1 9.1% 0 0.0% 0 0.0% 11 30.6%
- Unlisted 13 52.0% 8 32.0% 4 16.0% 0 0.0% 0 0.0% 25 69.4%
Total Ownership Structure 18 50.0% 13 36.1% 5 13.9% 0 0.0% 0 0.0% 36 100.0%
Geographic Scope
- Regional 1 33.3% 1 33.3% 1 33.3% 0 0.0% 0 0.0% 3 8.3%
- National 12 60.0% 4 20.0% 4 20.0% 0 0.0% 0 0.0% 20 55.6%
- International 5 38.5% 8 61.5% 0 0.0% 0 0.0% 0 0.0% 13 36.1%
Total Geographic Scope 18 50.0% 13 36.1% 5 13.9% 0 0.0% 0 0.0% 36 100.0%
Project Size Classification
- Small (EUR < 5 - 10 million) 1 50.0% 1 50.0% 0 0.0% 0 0.0% 0 0.0% 2 5.6%
- Medium (EUR > 10 - 50 million) 11 47.8% 7 30.4% 5 21.7% 0 0.0% 0 0.0% 23 63.9%
- Large (EUR > 50 - 250 million) 6 54.5% 5 45.5% 0 0.0% 0 0.0% 0 0.0% 11 30.6%
Total Project Size Classification 18 50.0% 13 36.1% 5 13.9% 0 0.0% 0 0.0% 36 100.0%
Number of
Responses1-20% 21-40% 41-60% 61-80% 81-100%
4) What is the distribution of the project development services across the various types of usage? (total = 100%):
Shopping centre/ Retail
Total Respondants 17 50.0% 12 35.3% 3 8.8% 1 2.9% 1 2.9% 34 100.0%
Developer Classification
- Mainly Trader-Developer 8 53.3% 5 33.3% 2 13.3% 0 0.0% 0 0.0% 15 44.1%
- Mainly Investor-Developer 9 47.4% 7 36.8% 1 5.3% 1 5.3% 1 5.3% 19 55.9%
Total Developer Classification 17 50.0% 12 35.3% 3 8.8% 1 2.9% 1 2.9% 34 100.0%
Ownership structure
- Listed 4 44.4% 5 55.6% 0 0.0% 0 0.0% 0 0.0% 9 26.5%
- Unlisted 13 52.0% 7 28.0% 3 12.0% 1 4.0% 1 4.0% 25 73.5%
Total Ownership Structure 17 50.0% 12 35.3% 3 8.8% 1 2.9% 1 2.9% 34 100.0%
Geographic Scope
- Regional 0 0.0% 1 100.0% 0 0.0% 0 0.0% 0 0.0% 1 2.9%
- National 8 50.0% 6 37.5% 1 6.3% 1 6.3% 0 0.0% 16 47.1%
- International 9 52.9% 5 29.4% 2 11.8% 0 0.0% 1 5.9% 17 50.0%
Total Geographic Scope 17 50.0% 12 35.3% 3 8.8% 1 2.9% 1 2.9% 34 100.0%
Project Size Classification
- Small (EUR < 5 - 10 million) 1 50.0% 1 50.0% 0 0.0% 0 0.0% 0 0.0% 2 5.9%
- Medium (EUR > 10 - 50 million) 10 52.6% 7 36.8% 1 5.3% 1 5.3% 0 0.0% 19 55.9%
- Large (EUR > 50 - 250 million) 6 46.2% 4 30.8% 2 15.4% 0 0.0% 1 7.7% 13 38.2%
Total Project Size Classification 17 50.0% 12 35.3% 3 8.8% 1 2.9% 1 2.9% 34 100.0%
61-80%Number of
Responses1-20% 21-40% 41-60% 81-100%

221
4) What is the distribution of the project development services across the various types of usage? (total = 100%):
Hotel
Total Respondants 20 95.2% 1 4.8% 0 0.0% 0 0.0% 0 0.0% 21 100.0%
Developer Classification
- Mainly Trader-Developer 9 90.0% 1 10.0% 0 0.0% 0 0.0% 0 0.0% 10 47.6%
- Mainly Investor-Developer 11 100.0% 0 0.0% 0 0.0% 0 0.0% 0 0.0% 11 52.4%
Total Developer Classification 20 95.2% 1 4.8% 0 0.0% 0 0.0% 0 0.0% 21 100.0%
Ownership structure
- Listed 6 100.0% 0 0.0% 0 0.0% 0 0.0% 0 0.0% 6 28.6%
- Unlisted 14 93.3% 1 6.7% 0 0.0% 0 0.0% 0 0.0% 15 71.4%
Total Ownership Structure 20 95.2% 1 6.7% 0 0.0% 0 0.0% 0 0.0% 21 100.0%
Geographic Scope
- Regional 1 100.0% 0 0.0% 0 0.0% 0 0.0% 0 0.0% 1 4.8%
- National 12 92.3% 1 7.7% 0 0.0% 0 0.0% 0 0.0% 13 61.9%
- International 7 100.0% 0 0.0% 0 0.0% 0 0.0% 0 0.0% 7 33.3%
Total Geographic Scope 20 95.2% 1 4.8% 0 0.0% 0 0.0% 0 0.0% 21 100.0%
Project Size Classification
- Small (EUR < 5 - 10 million) 2 100.0% 0 0.0% 0 0.0% 0 0.0% 0 0.0% 2 9.5%
- Medium (EUR > 10 - 50 million) 10 90.9% 1 9.1% 0 0.0% 0 0.0% 0 0.0% 11 52.4%
- Large (EUR > 50 - 250 million) 8 100.0% 0 0.0% 0 0.0% 0 0.0% 0 0.0% 8 38.1%
Total Project Size Classification 20 95.2% 1 4.8% 0 0.0% 0 0.0% 0 0.0% 21 100.0%
Number of
Responses1-20% 21-40% 41-60% 61-80% 81-100%
4) What is the distribution of the project development services across the various types of usage? (total = 100%):
Production
Total Respondants 5 55.6% 4 44.4% 0 0.0% 0 0.0% 0 0.0% 9 100.0%
Developer Classification
- Mainly Trader-Developer 3 75.0% 1 25.0% 0 0.0% 0 0.0% 0 0.0% 4 44.4%
- Mainly Investor-Developer 2 40.0% 3 60.0% 0 0.0% 0 0.0% 0 0.0% 5 55.6%
Total Developer Classification 5 55.6% 4 44.4% 0 0.0% 0 0.0% 0 0.0% 9 100.0%
Ownership structure
- Listed 1 100.0% 0 0.0% 0 0.0% 0 0.0% 0 0.0% 1 11.1%
- Unlisted 4 50.0% 4 50.0% 0 0.0% 0 0.0% 0 0.0% 8 88.9%
Total Ownership Structure 5 55.6% 4 44.4% 0 0.0% 0 0.0% 0 0.0% 9 100.0%
Geographic Scope
- Regional 0 0.0% 1 100.0% 0 0.0% 0 0.0% 0 0.0% 1 11.1%
- National 3 50.0% 3 50.0% 0 0.0% 0 0.0% 0 0.0% 6 66.7%
- International 2 100.0% 0 0.0% 0 0.0% 0 0.0% 0 0.0% 2 22.2%
Total Geographic Scope 5 55.6% 4 44.4% 0 0.0% 0 0.0% 0 0.0% 9 100.0%
Project Size Classification
- Small (EUR < 5 - 10 million) 1 50.0% 1 50.0% 0 0.0% 0 0.0% 0 0.0% 2 22.2%
- Medium (EUR > 10 - 50 million) 4 57.1% 3 42.9% 0 0.0% 0 0.0% 0 0.0% 7 77.8%
- Large (EUR > 50 - 250 million) 0 0.0% 0 0.0% 0 0.0% 0 0.0% 0 0.0% 0 0.0%
Total Project Size Classification 5 55.6% 4 44.4% 0 0.0% 0 0.0% 0 0.0% 9 100.0%
61-80%Number of
Responses1-20% 21-40% 41-60% 81-100%

222
4) What is the distribution of the project development services across the various types of usage? (total = 100%):
Logistics
Total Respondants 10 66.7% 3 20.0% 0 0.0% 0 0.0% 2 13.3% 15 100.0%
Developer Classification
- Mainly Trader-Developer 4 80.0% 0 0.0% 0 0.0% 0 0.0% 1 20.0% 5 33.3%
- Mainly Investor-Developer 6 60.0% 3 30.0% 0 0.0% 0 0.0% 1 10.0% 10 66.7%
Total Developer Classification 10 66.7% 3 20.0% 0 0.0% 0 0.0% 2 13.3% 15 100.0%
Ownership structure
- Listed 6 75.0% 0 0.0% 0 0.0% 0 0.0% 2 25.0% 8 53.3%
- Unlisted 4 57.1% 3 42.9% 0 0.0% 0 0.0% 0 0.0% 7 46.7%
Total Ownership Structure 10 66.7% 3 20.0% 0 0.0% 0 0.0% 2 13.3% 15 100.0%
Geographic Scope
- Regional 1 50.0% 1 50.0% 0 0.0% 0 0.0% 0 0.0% 2 13.3%
- National 6 75.0% 2 25.0% 0 0.0% 0 0.0% 0 0.0% 8 53.3%
- International 3 60.0% 0 0.0% 0 0.0% 0 0.0% 2 40.0% 5 33.3%
Total Geographic Scope 10 66.7% 3 20.0% 0 0.0% 0 0.0% 2 13.3% 15 100.0%
Project Size Classification
- Small (EUR < 5 - 10 million) 1 33.3% 1 33.3% 0 0.0% 0 0.0% 1 33.3% 3 20.0%
- Medium (EUR > 10 - 50 million) 8 72.7% 2 18.2% 0 0.0% 0 0.0% 1 9.1% 11 73.3%
- Large (EUR > 50 - 250 million) 1 100.0% 0 0.0% 0 0.0% 0 0.0% 0 0.0% 1 6.7%
Total Project Size Classification 10 66.7% 3 20.0% 0 0.0% 0 0.0% 2 13.3% 15 100.0%
Number of
Responses1-20% 21-40% 41-60% 61-80% 81-100%
4) What is the distribution of the project development services across the various types of usage? (total = 100%):
Leisure
Total Respondants 14 100.0% 0 0.0% 0 0.0% 0 0.0% 0 0.0% 14 100.0%
Developer Classification
- Mainly Trader-Developer 8 100.0% 0 0.0% 0 0.0% 0 0.0% 0 0.0% 8 57.1%
- Mainly Investor-Developer 6 100.0% 0 0.0% 0 0.0% 0 0.0% 0 0.0% 6 42.9%
Total Developer Classification 14 100.0% 0 0.0% 0 0.0% 0 0.0% 0 0.0% 14 100.0%
Ownership structure
- Listed 5 100.0% 0 0.0% 0 0.0% 0 0.0% 0 0.0% 5 35.7%
- Unlisted 9 100.0% 0 0.0% 0 0.0% 0 0.0% 0 0.0% 9 64.3%
Total Ownership Structure 14 100.0% 0 0.0% 0 0.0% 0 0.0% 0 0.0% 14 100.0%
Geographic Scope
- Regional 2 100.0% 0 0.0% 0 0.0% 0 0.0% 0 0.0% 2 14.3%
- National 8 100.0% 0 0.0% 0 0.0% 0 0.0% 0 0.0% 8 57.1%
- International 4 100.0% 0 0.0% 0 0.0% 0 0.0% 0 0.0% 4 28.6%
Total Geographic Scope 14 100.0% 0 0.0% 0 0.0% 0 0.0% 0 0.0% 14 100.0%
Project Size Classification
- Small (EUR < 5 - 10 million) 1 100.0% 0 0.0% 0 0.0% 0 0.0% 0 0.0% 1 7.1%
- Medium (EUR > 10 - 50 million) 10 100.0% 0 0.0% 0 0.0% 0 0.0% 0 0.0% 10 71.4%
- Large (EUR > 50 - 250 million) 3 100.0% 0 0.0% 0 0.0% 0 0.0% 0 0.0% 3 21.4%
Total Project Size Classification 14 100.0% 0 0.0% 0 0.0% 0 0.0% 0 0.0% 14 100.0%
61-80%Number of
Responses1-20% 21-40% 41-60% 81-100%

223
4) What is the distribution of the project development services across the various types of usage? (total = 100%):
Other
Total Respondants 4 50.0% 2 25.0% 0 0.0% 0 0.0% 2 25.0% 8 100.0%
Developer Classification
- Mainly Trader-Developer 3 50.0% 2 33.3% 0 0.0% 0 0.0% 1 16.7% 6 75.0%
- Mainly Investor-Developer 1 50.0% 0 0.0% 0 0.0% 0 0.0% 1 50.0% 2 25.0%
Total Developer Classification 4 50.0% 2 25.0% 0 0.0% 0 0.0% 2 25.0% 8 100.0%
Ownership structure
- Listed 2 40.0% 2 40.0% 0 0.0% 0 0.0% 1 20.0% 5 62.5%
- Unlisted 2 66.7% 0 0.0% 0 0.0% 0 0.0% 1 33.3% 3 37.5%
Total Ownership Structure 4 50.0% 2 25.0% 0 0.0% 0 0.0% 2 25.0% 8 100.0%
Geographic Scope
- Regional 0 0.0% 0 0.0% 0 0.0% 0 0.0% 0 0.0% 0 0.0%
- National 4 66.7% 0 0.0% 0 0.0% 0 0.0% 2 33.3% 6 75.0%
- International 0 0.0% 2 100.0% 0 0.0% 0 0.0% 0 0.0% 2 25.0%
Total Geographic Scope 4 50.0% 2 25.0% 0 0.0% 0 0.0% 2 25.0% 8 100.0%
Project Size Classification
- Small (EUR < 5 - 10 million) 0 0.0% 1 100.0% 0 0.0% 0 0.0% 0 0.0% 1 12.5%
- Medium (EUR > 10 - 50 million) 3 60.0% 1 20.0% 0 0.0% 0 0.0% 1 20.0% 5 62.5%
- Large (EUR > 50 - 250 million) 1 50.0% 0 0.0% 0 0.0% 0 0.0% 1 50.0% 2 25.0%
Total Project Size Classification 4 50.0% 2 25.0% 0 0.0% 0 0.0% 2 25.0% 8 100.0%
Number of
Responses1-20% 21-40% 41-60% 61-80% 81-100%

224
5)
Wh
at
vo
lum
e d
oes y
ou
r co
mp
an
y r
eg
ard
as b
ein
g a
n o
pti
mu
m f
or
ind
ivid
ual p
roje
ct
vo
lum
es?
Mu
ltip
le r
esp
on
ses a
re p
ossib
le
To
tal R
es
po
nd
an
ts1
1,1
%9
10
,0%
18
20
,0%
17
18
,9%
12
13
,3%
10
11
,1%
14
15
,6%
77
,8%
22
,2%
00
,0%
90
10
0,0
%
De
ve
lop
er
Cla
ss
ific
ati
on
- M
ain
ly T
rader-
Deve
loper
12,2
%5
10,9
%10
21,7
%11
23,9
%5
10,9
%4
8,7
%6
13,0
%3
6,5
%1
2,2
%0
0,0
%46
51,1
%
- M
ain
ly In
vesto
r-D
eve
loper
00,0
%4
9,1
%8
18,2
%6
13,6
%7
15,9
%6
13,6
%8
18,2
%4
9,1
%1
2,3
%0
0,0
%44
48,9
%
To
tal D
ev
elo
pe
r C
las
sif
ica
tio
n1
1,1
%9
10,0
%18
20,0
%17
18,9
%12
13,3
%10
11,1
%14
15,6
%7
7,8
%2
2,2
%0
0,0
%90
100,0
%
p v
alu
e (
Fis
he
r's e
xact
test)
0,9
00
φ(P
hi)
0,2
09
Cra
me
r`s V
0,2
09
Ow
ne
rsh
ip s
tru
ctu
re
- L
iste
d1
3,2
%3
9,7
%7
22,6
%9
29,0
%3
9,7
%2
6,5
%4
12,9
%2
6,5
%0
0,0
%0
0,0
%31
34,4
%
- U
nlis
ted
00,0
%6
10,2
%11
18,6
%8
13,6
%9
15,3
%8
13,6
%10
16,9
%5
8,5
%2
3,4
%0
0,0
%59
65,6
%
To
tal O
wn
ers
hip
Str
uc
ture
11,1
%9
10,0
%18
20,0
%17
18,9
%12
13,3
%10
11,1
%14
15,6
%7
7,8
%2
2,2
%0
0,0
%90
100,0
%
p v
alu
e (
Fis
he
r's e
xact
test)
0,5
85
φ(P
hi)
0,2
87
Cra
me
r`s V
0,2
87
Ge
og
rap
hic
Sc
op
e
- R
egio
nal
111,1
%2
22,2
%2
22,2
%2
22,2
%1
11,1
%1
11,1
%0
0,0
%0
0,0
%0
0,0
%0
0,0
%9
10,0
%
- N
atio
nal
00,0
%5
10,2
%14
28,6
%11
22,4
%8
16,3
%6
12,2
%4
8,2
%1
2,0
%0
0,0
%0
0,0
%49
54,4
%
- In
tern
atio
nal
00,0
%2
6,3
%2
6,3
%4
12,5
%3
9,4
%3
9,4
%10
31,3
%6
18,8
%2
6,3
%0
0,0
%32
35,6
%
To
tal G
eo
gra
ph
ic S
co
pe
11,1
%9
10,0
%18
20,0
%17
18,9
%12
13,3
%10
11,1
%14
15,6
%7
7,8
%2
2,2
%0
0,0
%90
100,0
%
p v
alu
e (
Fis
he
r's e
xact
test)
0,0
03
φ(P
hi)
0,6
42
Cra
me
r`s V
0,4
54
Pro
jec
t S
ize
Cla
ss
ific
ati
on
- S
mall
(EU
R <
5 -
10 m
illio
n)
114,3
%6
85,7
%0
0,0
%0
0,0
%0
0,0
%0
0,0
%0
0,0
%0
0,0
%0
0,0
%0
0,0
%7
7,8
%
- M
ediu
m (
EU
R >
10 -
50 m
illio
n)
00,0
%3
5,8
%16
30,8
%16
30,8
%10
19,2
%7
13,5
%0
0,0
%0
0,0
%0
0,0
%0
0,0
%52
57,8
%
- L
arg
e (
EU
R >
50 -
250 m
illio
n)
00,0
%0
0,0
%2
6,5
%1
3,2
%2
6,5
%3
9,7
%14
45,2
%7
22,6
%2
6,5
%0
0,0
%31
34,4
%
To
tal P
roje
ct
Siz
e C
las
sif
ica
tio
n1
1,1
%9
10,0
%18
20,0
%17
18,9
%12
13,3
%10
11,1
%14
15,6
%7
7,8
%2
2,2
%0
0,0
%90
100,0
%
p v
alu
e (
Fis
he
r's e
xact
test)
0,0
00
φ(P
hi)
1,1
58
Cra
me
r`s V
0,7
57
EU
R 4
0 t
o 5
0
millio
n<
EU
R 5
millio
nE
UR
5 t
o 1
0
millio
n
EU
R 1
0 t
o 2
0
millio
n
EU
R 2
0 t
o 3
0
millio
n
EU
R 3
0 t
o 4
0
millio
n
EU
R 5
0 t
o 1
00
millio
n
EU
R 1
00 t
o
250 m
illio
n
EU
R 2
50 t
o
500 m
illio
n
> E
UR
500
millio
nT
ota
l

225
6) Has the company formulated an overall, enterprise-wide strategy for managing risks yet?
Total Respondants 27 39,1% 25 36,2% 8 11,6% 9 13,0% 69 100,0%
Developer Classification
- Mainly Trader-Developer 11 29,7% 15 40,5% 4 10,8% 7 18,9% 37 53,6%
- Mainly Investor-Developer 16 50,0% 10 31,3% 4 12,5% 2 6,3% 32 46,4%
Total Developer Classification 27 39,1% 25 36,2% 8 11,6% 9 13,0% 69 100,0%
p value (Fisher's exact test) 0,241 φ(Phi) 0,251 Cramer`s V 0,251
Ownership structure
- Listed 15 65,2% 6 26,1% 2 8,7% 0 0,0% 23 33,3%
- Unlisted 12 26,1% 19 41,3% 6 13,0% 9 19,6% 46 66,7%
Total Ownership Structure 27 39,1% 25 36,2% 8 11,6% 9 13,0% 69 100,0%
p value (Fisher's exact test) 0,007 φ(Phi) 0,412 Cramer`s V 0,412
Geographic Scope
- Regional 3 50,0% 3 50,0% 0 0,0% 0 0,0% 6 8,7%
- National 10 27,8% 13 36,1% 6 16,7% 7 19,4% 36 52,2%
- International 14 51,9% 9 33,3% 2 7,4% 2 7,4% 27 39,1%
Total Geographic Scope 27 39,1% 25 36,2% 8 11,6% 9 13,0% 69 100,0%
p value (Fisher's exact test) 0,369 φ(Phi) 0,326 Cramer`s V 0,231
Project Size Classification
- Small (EUR < 5 - 10 million) 3 42,9% 2 28,6% 0 0,0% 2 28,6% 7 10,1%
- Medium (EUR > 10 - 50 million) 15 37,5% 14 35,0% 5 12,5% 6 15,0% 40 58,0%
- Large (EUR > 50 - 250 million) 9 40,9% 9 40,9% 3 13,6% 1 4,5% 22 31,9%
Total Project Size Classification 27 39,1% 25 36,2% 8 11,6% 9 13,0% 69 100,0%
p value (Fisher's exact test) 0,742 φ(Phi) 0,237 Cramer`s V 0,168
Yes,
implemented
Yes, but
needs
improvement
No, but
planned No
Number of
Responses

226
7)
Ris
k is a
co
ncep
t u
sed
to
exp
ress u
ncert
ain
ty a
bo
ut
even
ts a
nd
/or
their
ou
tco
mes t
hat
co
uld
have a
mate
rial eff
ect
on
th
e g
oals
of
the c
om
pan
y.
P
lease e
valu
ate
th
e f
ollo
win
g r
isks o
n c
om
pan
y level re
gard
ing
th
eir
sig
nif
ican
ce t
o a
ch
ievin
g y
ou
r co
mp
an
y´s
ob
jecti
ves a
s w
ell a
s t
he e
ffecti
ven
ess o
f yo
ur
risk m
an
ag
em
en
t
p
rocesses t
o c
op
e w
ith
th
ose r
isks.
1 C
om
peti
tor
thre
ats
to
co
mp
an
y’s
mark
et
po
sit
ion
To
tal
Res
po
nd
an
ts2
43
5.3
%3
04
4.1
%1
31
9.1
%1
1.5
%6
81
00
.0%
11
.5%
57
.4%
43
63
.2%
91
3.2
%1
01
4.7
%6
81
00
.0%
Deve
lop
er
Cla
ss
ific
ati
on
- M
ain
ly T
rader-
Develo
per
10
27.8
%18
50.0
%7
19.4
%1
2.8
%36
52.9
%0
0.0
%4
11.1
%21
58.3
%6
16.7
%5
13.9
%36
52.9
%
- M
ain
ly I
nvesto
r-D
evelo
per
14
43.8
%12
37.5
%6
18.8
%0
0.0
%32
47.1
%1
3.1
%1
3.1
%22
68.8
%3
9.4
%5
15.6
%32
47.1
%
To
tal
Deve
lop
er
Cla
ss
ific
ati
on
24
35.3
%30
44.1
%13
19.1
%1
1.5
%68
100
.0%
11
.5%
57
.4%
43
63.2
%9
13.2
%10
14.7
%68
100
.0%
Ow
ners
hip
str
uctu
re -
Lis
ted
52
2.7
%13
59.1
%4
18.2
%0
0.0
%22
32.4
%0
0.0
%4
18.2
%15
68.2
%2
9.1
%1
4.5
%22
32.4
%
- U
nlis
ted
19
41.3
%17
37.0
%9
19.6
%1
2.2
%46
67.6
%1
2.2
%1
2.2
%28
60.9
%7
15.2
%9
19.6
%46
67.6
%
To
tal
Ow
ners
hip
Str
uctu
re24
35.3
%30
44.1
%13
19.1
%1
1.5
%68
100
.0%
11
.5%
57
.4%
43
63.2
%9
13.2
%10
14.7
%68
100
.0%
Ge
og
rap
hic
Sc
op
e -
Regio
nal
35
0.0
%3
50.0
%0
0.0
%0
0.0
%6
8.8
%1
16.7
%1
16.7
%2
33.3
%1
16.7
%1
16.7
%6
8.8
%
- N
ational
14
38.9
%16
44.4
%5
13.9
%1
2.8
%36
52.9
%0
0.0
%2
5.6
%23
63.9
%4
11.1
%7
19.4
%36
52.9
%
- I
nte
rnational
72
6.9
%11
42.3
%8
30.8
%0
0.0
%26
38.2
%0
0.0
%2
7.7
%18
69.2
%4
15.4
%2
7.7
%26
38.2
%
To
tal
Ge
og
rap
hic
Sc
op
e24
35.3
%30
44.1
%13
19.1
%1
1.5
%68
100
.0%
11
.5%
57
.4%
43
63.2
%9
13.2
%10
14.7
%68
100
.0%
Pro
jec
t S
ize
Cla
ss
ific
ati
on
- S
mall
(EU
R <
5 -
10 m
illio
n)
22
8.6
%3
42.9
%1
14.3
%1
14.3
%7
10.3
%0
0.0
%1
14.3
%5
71.4
%1
14.3
%0
0.0
%7
10.3
%
- M
ediu
m (
EU
R >
10 -
50 m
illio
n)
12
30.0
%20
50.0
%8
20.0
%0
0.0
%40
58.8
%1
2.5
%3
7.5
%24
60.0
%5
12.5
%7
17.5
%40
58.8
%
- L
arg
e (
EU
R >
50 -
250 m
illio
n)
10
47.6
%7
33.3
%4
19.0
%0
0.0
%21
30.9
%0
0.0
%1
4.8
%14
66.7
%3
14.3
%3
14.3
%21
30.9
%
To
tal
Pro
jec
t S
ize
Cla
ss
ific
ati
on
24
35.3
%30
44.1
%13
19.1
%1
1.5
%68
100
.0%
11
.5%
57
.4%
43
63.2
%9
13.2
%10
14.7
%68
100
.0%
Ho
w s
ign
ific
an
t is
th
is r
isk
to
ac
hie
vin
g y
ou
r o
bje
cti
ve
s?
Ho
w e
ffe
cti
ve
are
yo
ur
pro
ce
ss
es
at
ma
nag
ing
th
is r
isk
?
Lo
wM
ed
ium
Hig
hV
ery
hig
hN
um
be
r o
f
Res
po
nse
s
Ve
ry
Ine
ffe
cti
ve
Ine
ffe
cti
ve
Eff
ec
tive
Ve
ry e
ffe
cti
ve
Do
n't
kn
ow
Nu
mb
er
of
Res
po
nse
s

227
7)
Ris
k is a
co
ncep
t u
sed
to
exp
ress u
ncert
ain
ty a
bo
ut
even
ts a
nd
/or
their
ou
tco
mes t
hat
co
uld
have a
mate
rial eff
ect
on
th
e g
oals
of
the c
om
pan
y.
P
lease e
valu
ate
th
e f
ollo
win
g r
isks o
n c
om
pan
y level re
gard
ing
th
eir
sig
nif
ican
ce t
o a
ch
ievin
g y
ou
r co
mp
an
y´s
ob
jecti
ves a
s w
ell a
s t
he e
ffecti
ven
ess o
f yo
ur
risk m
an
ag
em
en
t
p
rocesses t
o c
op
e w
ith
th
ose r
isks.
2 S
overe
ign
or
po
liti
cal ri
sk
To
tal
Res
po
nd
an
ts2
84
1.2
%3
14
5.6
%9
13
.2%
00
.0%
68
10
0.0
%4
5.9
%1
62
3.5
%3
34
8.5
%2
2.9
%1
31
9.1
%6
81
00
.0%
Deve
lop
er
Cla
ss
ific
ati
on
- M
ain
ly T
rader-
Develo
per
11
30.6
%19
52.8
%6
16.7
%0
0.0
%36
52.9
%1
2.8
%9
25.0
%19
52.8
%1
2.8
%6
16.7
%36
52.9
%
- M
ain
ly I
nvesto
r-D
evelo
per
17
53.1
%12
37.5
%3
9.4
%0
0.0
%32
47.1
%3
9.4
%7
21.9
%14
43.8
%1
3.1
%7
21.9
%32
47.1
%
To
tal
Deve
lop
er
Cla
ss
ific
ati
on
28
41.2
%31
45.6
%9
13.2
%0
0.0
%68
100
.0%
45
.9%
16
23.5
%33
48.5
%2
2.9
%13
19.1
%68
100
.0%
Ow
ners
hip
str
uctu
re -
Lis
ted
62
7.3
%14
63.6
%2
9.1
%0
0.0
%22
32.4
%1
4.5
%7
31.8
%11
50.0
%0
0.0
%3
13.6
%22
32.4
%
- U
nlis
ted
22
47.8
%17
37.0
%7
15.2
%0
0.0
%46
67.6
%3
6.5
%9
19.6
%22
47.8
%2
4.3
%10
21.7
%46
67.6
%
To
tal
Ow
ners
hip
Str
uctu
re28
41.2
%31
45.6
%9
13.2
%0
0.0
%68
100
.0%
45
.9%
16
23.5
%33
48.5
%2
2.9
%13
19.1
%68
100
.0%
Ge
og
rap
hic
Sc
op
e -
Regio
nal
35
0.0
%3
50.0
%0
0.0
%0
0.0
%6
8.8
%1
16.7
%1
16.7
%3
50.0
%0
0.0
%1
16.7
%6
8.8
%
- N
ational
19
52.8
%12
33.3
%5
13.9
%0
0.0
%36
52.9
%1
2.8
%5
13.9
%21
58.3
%1
2.8
%8
22.2
%36
52.9
%
- I
nte
rnational
62
3.1
%16
61.5
%4
15.4
%0
0.0
%26
38.2
%2
7.7
%10
38.5
%9
34.6
%1
3.8
%4
15.4
%26
38.2
%
To
tal
Ge
og
rap
hic
Sc
op
e28
41.2
%31
45.6
%9
13.2
%0
0.0
%68
100
.0%
45
.9%
16
23.5
%33
48.5
%2
2.9
%13
19.1
%68
100
.0%
Pro
jec
t S
ize
Cla
ss
ific
ati
on
- S
mall
(EU
R <
5 -
10 m
illio
n)
22
8.6
%3
42.9
%2
28.6
%0
0.0
%7
10.3
%0
0.0
%3
42.9
%3
42.9
%0
0.0
%1
14.3
%7
10.3
%
- M
ediu
m (
EU
R >
10 -
50 m
illio
n)
19
47.5
%16
40.0
%5
12.5
%0
0.0
%40
58.8
%3
7.5
%8
20.0
%21
52.5
%2
5.0
%6
15.0
%40
58.8
%
- L
arg
e (
EU
R >
50 -
250 m
illio
n)
73
3.3
%12
57.1
%2
9.5
%0
0.0
%21
30.9
%1
4.8
%5
23.8
%9
42.9
%0
0.0
%6
28.6
%21
30.9
%
To
tal
Pro
jec
t S
ize
Cla
ss
ific
ati
on
28
41.2
%31
45.6
%9
13.2
%0
0.0
%68
100
.0%
45
.9%
16
23.5
%33
48.5
%2
2.9
%13
19.1
%68
100
.0%
Ho
w s
ign
ific
an
t is
th
is r
isk
to
ac
hie
vin
g y
ou
r o
bje
cti
ve
s?
Ho
w e
ffe
cti
ve
are
yo
ur
pro
ce
ss
es
at
ma
nag
ing
th
is r
isk
?
Lo
wM
ed
ium
Hig
hV
ery
hig
hN
um
be
r o
f
Res
po
nse
s
Ve
ry
Ine
ffe
cti
ve
Ine
ffe
cti
ve
Eff
ec
tive
Ve
ry e
ffe
cti
ve
Do
n't
kn
ow
Nu
mb
er
of
Res
po
nse
s

228
7)
Ris
k is a
co
ncep
t u
sed
to
exp
ress u
ncert
ain
ty a
bo
ut
even
ts a
nd
/or
their
ou
tco
mes t
hat
co
uld
have a
mate
rial eff
ect
on
th
e g
oals
of
the c
om
pan
y.
P
lease e
valu
ate
th
e f
ollo
win
g r
isks o
n c
om
pan
y level re
gard
ing
th
eir
sig
nif
ican
ce t
o a
ch
ievin
g y
ou
r co
mp
an
y´s
ob
jecti
ves a
s w
ell a
s t
he e
ffecti
ven
ess o
f yo
ur
risk m
an
ag
em
en
t
p
rocesses t
o c
op
e w
ith
th
ose r
isks.
3 U
nfa
vo
rab
le f
inan
cia
l m
ark
et
even
ts
To
tal
Res
po
nd
an
ts7
10
.3%
31
45
.6%
27
39
.7%
34
.4%
68
10
0.0
%1
1.5
%1
31
9.7
%3
95
9.1
%9
13
.6%
46
.1%
66
10
0.0
%
Deve
lop
er
Cla
ss
ific
ati
on
- M
ain
ly T
rader-
Develo
per
51
3.9
%12
33.3
%16
44.4
%3
8.3
%36
52.9
%0
0.0
%5
14.3
%18
51.4
%8
22.9
%4
11.4
%35
53.0
%
- M
ain
ly I
nvesto
r-D
evelo
per
26
.3%
19
59.4
%11
34.4
%0
0.0
%32
47.1
%1
3.2
%8
25.8
%21
67.7
%1
3.2
%0
0.0
%31
47.0
%
To
tal
Deve
lop
er
Cla
ss
ific
ati
on
71
0.3
%31
45.6
%27
39.7
%3
4.4
%68
100
.0%
11
.5%
13
19.7
%39
59.1
%9
13.6
%4
6.1
%66
100
.0%
Ow
ners
hip
str
uctu
re -
Lis
ted
29
.1%
11
50.0
%9
40.9
%0
0.0
%22
32.4
%0
0.0
%4
19.0
%15
71.4
%1
4.8
%1
4.8
%21
31.8
%
- U
nlis
ted
51
0.9
%20
43.5
%18
39.1
%3
6.5
%46
67.6
%1
2.2
%9
20.0
%24
53.3
%8
17.8
%3
6.7
%45
68.2
%
To
tal
Ow
ners
hip
Str
uctu
re7
10.3
%31
45.6
%27
39.7
%3
4.4
%68
100
.0%
11
.5%
13
19.7
%39
59.1
%9
13.6
%4
6.1
%66
100
.0%
Ge
og
rap
hic
Sc
op
e -
Regio
nal
00
.0%
35
0.0
%3
50.0
%0
0.0
%6
8.8
%0
0.0
%2
33.3
%4
66.7
%0
0.0
%0
0.0
%6
9.1
%
- N
ational
61
6.7
%14
38.9
%14
38.9
%2
5.6
%36
52.9
%1
2.9
%4
11.4
%22
62.9
%6
17.1
%2
5.7
%35
53.0
%
- I
nte
rnational
13
.8%
14
53.8
%10
38.5
%1
3.8
%26
38.2
%0
0.0
%7
28.0
%13
52.0
%3
12.0
%2
8.0
%25
37.9
%
To
tal
Ge
og
rap
hic
Sc
op
e7
10.3
%31
45.6
%27
39.7
%3
4.4
%68
100
.0%
11
.5%
13
19.7
%39
59.1
%9
13.6
%4
6.1
%66
100
.0%
Pro
jec
t S
ize
Cla
ss
ific
ati
on
- S
mall
(EU
R <
5 -
10 m
illio
n)
11
4.3
%2
28.6
%3
42.9
%1
14.3
%7
10.3
%0
0.0
%2
28.6
%3
42.9
%2
28.6
%0
0.0
%7
10.6
%
- M
ediu
m (
EU
R >
10 -
50 m
illio
n)
51
2.5
%18
45.0
%15
37.5
%2
5.0
%40
58.8
%1
2.6
%8
20.5
%23
59.0
%6
15.4
%1
2.6
%39
59.1
%
- L
arg
e (
EU
R >
50 -
250 m
illio
n)
14
.8%
11
52.4
%9
42.9
%0
0.0
%21
30.9
%0
0.0
%3
15.0
%13
65.0
%1
5.0
%3
15.0
%20
30.3
%
To
tal
Pro
jec
t S
ize
Cla
ss
ific
ati
on
71
0.3
%31
45.6
%27
39.7
%3
4.4
%68
100
.0%
11
.5%
13
19.7
%39
59.1
%9
20.4
%4
6.1
%66
100
.0%
Ho
w s
ign
ific
an
t is
th
is r
isk
to
ac
hie
vin
g y
ou
r o
bje
cti
ve
s?
Ho
w e
ffe
cti
ve
are
yo
ur
pro
ce
ss
es
at
ma
nag
ing
th
is r
isk
?
Lo
wM
ed
ium
Hig
hV
ery
hig
hN
um
be
r o
f
Res
po
nse
s
Ve
ry
Ine
ffe
cti
ve
Ine
ffe
cti
ve
Eff
ec
tive
Ve
ry e
ffe
cti
ve
Do
n't
kn
ow
Nu
mb
er
of
Res
po
nse
s

229
7)
Ris
k is a
co
ncep
t u
sed
to
exp
ress u
ncert
ain
ty a
bo
ut
even
ts a
nd
/or
their
ou
tco
mes t
hat
co
uld
have a
mate
rial eff
ect
on
th
e g
oals
of
the c
om
pan
y.
P
lease e
valu
ate
th
e f
ollo
win
g r
isks o
n c
om
pan
y level re
gard
ing
th
eir
sig
nif
ican
ce t
o a
ch
ievin
g y
ou
r co
mp
an
y´s
ob
jecti
ves a
s w
ell a
s t
he e
ffecti
ven
ess o
f yo
ur
risk m
an
ag
em
en
t
p
rocesses t
o c
op
e w
ith
th
ose r
isks.
4 A
vailab
ilit
y o
f cap
ital to
meet
bu
sin
ess r
eq
uir
em
en
ts
To
tal
Res
po
nd
an
ts1
92
9.2
%2
33
5.4
%1
72
6.2
%6
9.2
%6
51
00
.0%
00
.0%
57
.6%
36
54
.5%
21
31
.8%
46
.1%
66
10
0.0
%
Deve
lop
er
Cla
ss
ific
ati
on
- M
ain
ly T
rader-
Develo
per
11
33.3
%12
36.4
%7
21.2
%3
9.1
%33
50.8
%0
0.0
%1
2.9
%16
45.7
%14
40.0
%4
11.4
%35
53.0
%
- M
ain
ly I
nvesto
r-D
evelo
per
82
5.0
%11
34.4
%10
31.3
%3
9.4
%32
49.2
%0
0.0
%4
12.9
%20
64.5
%7
22.6
%0
0.0
%31
47.0
%
To
tal
Deve
lop
er
Cla
ss
ific
ati
on
19
29.2
%23
35.4
%17
26.2
%6
9.2
%65
100
.0%
00
.0%
57
.6%
36
54.5
%21
31.8
%4
6.1
%66
100
.0%
Ow
ners
hip
str
uctu
re -
Lis
ted
63
0.0
%9
45.0
%3
15.0
%2
10.0
%20
30.8
%0
0.0
%2
9.5
%12
57.1
%6
28.6
%1
4.8
%21
31.8
%
- U
nlis
ted
13
28.9
%14
31.1
%14
31.1
%4
8.9
%45
69.2
%0
0.0
%3
6.7
%24
53.3
%15
33.3
%3
6.7
%45
68.2
%
To
tal
Ow
ners
hip
Str
uctu
re19
29.2
%23
35.4
%17
26.2
%6
9.2
%65
100
.0%
00
.0%
57
.6%
36
54.5
%21
31.8
%4
6.1
%66
100
.0%
Ge
og
rap
hic
Sc
op
e -
Regio
nal
12
0.0
%3
60.0
%0
0.0
%1
20.0
%5
7.7
%0
0.0
%0
0.0
%5
83.3
%0
0.0
%1
16.7
%6
9.1
%
- N
ational
11
30.6
%13
36.1
%10
27.8
%2
5.6
%36
55.4
%0
0.0
%4
11.4
%16
45.7
%14
40.0
%1
2.9
%35
53.0
%
- I
nte
rnational
72
9.2
%7
29.2
%7
29.2
%3
12.5
%24
36.9
%0
0.0
%1
4.0
%15
60.0
%7
28.0
%2
8.0
%25
37.9
%
To
tal
Ge
og
rap
hic
Sc
op
e19
29.2
%23
35.4
%17
26.2
%6
9.2
%65
100
.0%
00
.0%
57
.6%
36
54.5
%21
31.8
%4
6.1
%66
100
.0%
Pro
jec
t S
ize
Cla
ss
ific
ati
on
- S
mall
(EU
R <
5 -
10 m
illio
n)
35
0.0
%1
16.7
%2
33.3
%0
0.0
%6
9.2
%0
0.0
%0
0.0
%4
57.1
%2
28.6
%1
14.3
%7
10.6
%
- M
ediu
m (
EU
R >
10 -
50 m
illio
n)
12
30.0
%13
32.5
%10
25.0
%5
12.5
%40
61.5
%0
0.0
%3
7.7
%22
56.4
%14
35.9
%0
0.0
%39
59.1
%
- L
arg
e (
EU
R >
50 -
250 m
illio
n)
42
1.1
%9
47.4
%5
26.3
%1
5.3
%19
29.2
%0
0.0
%2
10.0
%10
50.0
%5
25.0
%3
15.0
%20
30.3
%
To
tal
Pro
jec
t S
ize
Cla
ss
ific
ati
on
19
29.2
%23
35.4
%17
26.2
%6
9.2
%65
100
.0%
00
.0%
57
.6%
36
54.5
%21
31.8
%4
6.1
%66
100
.0%
Ho
w s
ign
ific
an
t is
th
is r
isk
to
ac
hie
vin
g y
ou
r o
bje
cti
ve
s?
Ho
w e
ffe
cti
ve
are
yo
ur
pro
ce
ss
es
at
ma
nag
ing
th
is r
isk
?
Lo
wM
ed
ium
Hig
hV
ery
hig
hN
um
be
r o
f
Res
po
nse
s
Ve
ry
Ine
ffe
cti
ve
Ine
ffe
cti
ve
Eff
ec
tive
Ve
ry e
ffe
cti
ve
Do
n't
kn
ow
Nu
mb
er
of
Res
po
nse
s

230
7)
Ris
k i
s a
co
nc
ep
t u
se
d t
o e
xp
ress
un
ce
rta
inty
ab
ou
t e
ve
nts
an
d/o
r th
eir
ou
tco
mes
th
at
co
uld
ha
ve a
mate
ria
l eff
ect
on
th
e g
oa
ls o
f th
e c
om
pan
y.
P
lease e
valu
ate
th
e f
ollo
win
g r
isks o
n c
om
pan
y level re
gard
ing
th
eir
sig
nif
ican
ce t
o a
ch
ievin
g y
ou
r co
mp
an
y´s
ob
jecti
ves a
s w
ell a
s t
he e
ffecti
ven
ess o
f yo
ur
risk m
an
ag
em
en
t
p
rocesses t
o c
op
e w
ith
th
ose r
isks.
5 L
eg
al ri
sk (
e.g
. b
usin
ess law
su
its)
To
tal
Res
po
nd
an
ts2
13
0.9
%3
04
4.1
%1
62
3.5
%1
1.5
%6
81
00
.0%
11
.5%
71
0.4
%3
65
3.7
%2
02
9.9
%3
4.5
%6
71
00
.0%
Deve
lop
er
Cla
ss
ific
ati
on
- M
ain
ly T
rader-
Develo
per
12
33.3
%13
36.1
%10
27.8
%1
2.8
%36
52.9
%0
0.0
%3
8.3
%16
44.4
%14
38.9
%3
8.3
%36
53.7
%
- M
ain
ly I
nvesto
r-D
evelo
per
928.1
%17
53.1
%6
18.8
%0
0.0
%32
47.1
%1
3.2
%4
12.9
%20
64.5
%6
19.4
%0
0.0
%31
46.3
%
To
tal
Deve
lop
er
Cla
ss
ific
ati
on
21
30.9
%30
44.1
%16
23.5
%1
1.5
%68
100.0
%1
1.5
%7
10.4
%36
53.7
%20
29.9
%3
4.5
%67
100.0
%
Ow
ners
hip
str
uctu
re -
Lis
ted
627.3
%12
54.5
%4
18.2
%0
0.0
%22
32.4
%0
0.0
%2
9.1
%10
45.5
%10
45.5
%0
0.0
%22
32.8
%
- U
nlis
ted
15
32.6
%18
39.1
%12
26.1
%1
2.2
%46
67.6
%1
2.2
%5
11.1
%26
57.8
%10
22.2
%3
6.7
%45
67.2
%
To
tal
Ow
ners
hip
Str
uctu
re21
30.9
%30
44.1
%16
23.5
%1
1.5
%68
100.0
%1
1.5
%7
10.4
%36
53.7
%20
29.9
%3
4.5
%67
100.0
%
Ge
og
rap
hic
Sc
op
e -
Regio
nal
116.7
%4
66.7
%1
16.7
%0
0.0
%6
8.8
%0
0.0
%1
16.7
%4
66.7
%1
16.7
%0
0.0
%6
9.0
%
- N
ational
15
41.7
%10
27.8
%11
30.6
%0
0.0
%36
52.9
%1
2.9
%2
5.7
%20
57.1
%10
28.6
%2
5.7
%35
52.2
%
- I
nte
rnational
519.2
%16
61.5
%4
15.4
%1
3.8
%26
38.2
%0
0.0
%4
15.4
%12
46.2
%9
34.6
%1
3.8
%26
38.8
%
To
tal
Ge
og
rap
hic
Sc
op
e21
30.9
%30
44.1
%16
23.5
%1
1.5
%68
100.0
%1
1.5
%7
10.4
%36
53.7
%20
29.9
%3
4.5
%67
100.0
%
Pro
jec
t S
ize
Cla
ss
ific
ati
on
- S
mall
(EU
R <
5 -
10 m
illio
n)
228.6
%3
42.9
%2
28.6
%0
0.0
%7
10.3
%0
0.0
%0
0.0
%5
71.4
%2
28.6
%0
0.0
%7
10.4
%
- M
ediu
m (
EU
R >
10 -
50 m
illio
n)
13
32.5
%16
40.0
%10
25.0
%1
2.5
%40
58.8
%1
2.6
%4
10.3
%21
53.8
%12
30.8
%1
2.6
%39
58.2
%
- L
arg
e (
EU
R >
50 -
250 m
illio
n)
628.6
%11
52.4
%4
19.0
%0
0.0
%21
30.9
%0
0.0
%3
14.3
%10
47.6
%6
28.6
%2
9.5
%21
31.3
%
To
tal
Pro
jec
t S
ize
Cla
ss
ific
ati
on
21
30.9
%30
44.1
%16
23.5
%1
1.5
%68
100.0
%1
1.5
%7
10.4
%36
53.7
%20
29.9
%3
4.5
%67
100.0
%
Ho
w s
ign
ific
an
t is
th
is r
isk
to
ac
hie
vin
g y
ou
r o
bje
cti
ve
s?
Ho
w e
ffe
cti
ve
are
yo
ur
pro
ce
ss
es
at
ma
nag
ing
th
is r
isk
?
Lo
wM
ed
ium
Hig
hV
ery
hig
hN
um
be
r o
f
Res
po
nse
s
Ve
ry
Ine
ffe
cti
ve
Ine
ffe
cti
ve
Eff
ec
tive
Ve
ry e
ffe
cti
ve
Do
n't
kn
ow
Nu
mb
er
of
Res
po
nse
s

231
7)
Ris
k is a
co
ncep
t u
sed
to
exp
ress u
ncert
ain
ty a
bo
ut
even
ts a
nd
/or
their
ou
tco
mes
th
at
co
uld
have a
mate
rial eff
ect
on
th
e g
oals
of
the c
om
pan
y.
P
lease e
valu
ate
th
e f
ollo
win
g r
isks o
n c
om
pan
y level re
gard
ing
th
eir
sig
nif
ican
ce t
o a
ch
ievin
g y
ou
r co
mp
an
y´s
ob
jecti
ves a
s w
ell a
s t
he e
ffecti
ven
ess o
f yo
ur
risk m
an
ag
em
en
t
p
rocesses t
o c
op
e w
ith
th
ose r
isks.
6 In
eff
icie
nt
key p
rocesses
To
tal
Res
po
nd
an
ts2
33
4.8
%2
94
3.9
%1
21
8.2
%2
3.0
%6
61
00
.0%
11
.5%
91
3.4
%4
16
1.2
%1
21
7.9
%4
6.0
%6
71
00
.0%
Deve
lop
er
Cla
ss
ific
ati
on
- M
ain
ly T
rader-
Develo
per
13
37.1
%16
45.7
%5
14.3
%1
2.9
%35
53.0
%0
0.0
%4
11.1
%21
58.3
%8
22.2
%3
8.3
%36
53.7
%
- M
ain
ly I
nvesto
r-D
evelo
per
10
32.3
%13
41.9
%7
22.6
%1
3.2
%31
47.0
%1
3.2
%5
16.1
%20
64.5
%4
12.9
%1
3.2
%31
46.3
%
To
tal
Deve
lop
er
Cla
ss
ific
ati
on
23
34.8
%29
43.9
%12
18.2
%2
3.0
%66
100.0
%1
1.5
%9
13.4
%41
61.2
%12
17.9
%4
6.0
%67
100.0
%
Ow
ners
hip
str
uctu
re -
Lis
ted
942.9
%6
28.6
%5
23.8
%1
4.8
%21
31.8
%0
0.0
%2
9.1
%12
54.5
%6
27.3
%2
9.1
%22
32.8
%
- U
nlis
ted
14
31.1
%23
51.1
%7
15.6
%1
2.2
%45
68.2
%1
2.2
%7
15.6
%29
64.4
%6
13.3
%2
4.4
%45
67.2
%
To
tal
Ow
ners
hip
Str
uctu
re23
34.8
%29
43.9
%12
18.2
%2
3.0
%66
100.0
%1
1.5
%9
13.4
%41
61.2
%12
17.9
%4
6.0
%67
100.0
%
Ge
og
rap
hic
Sc
op
e -
Regio
nal
233.3
%3
50.0
%1
16.7
%0
0.0
%6
9.1
%0
0.0
%0
0.0
%4
66.7
%2
33.3
%0
0.0
%6
9.0
%
- N
ational
13
38.2
%12
35.3
%7
20.6
%2
5.9
%34
51.5
%1
2.9
%5
14.3
%20
57.1
%6
17.1
%3
8.6
%35
52.2
%
- I
nte
rnational
830.8
%14
53.8
%4
15.4
%0
0.0
%26
39.4
%0
0.0
%4
15.4
%17
65.4
%4
15.4
%1
3.8
%26
38.8
%
To
tal
Ge
og
rap
hic
Sc
op
e23
34.8
%29
43.9
%12
18.2
%2
3.0
%66
100.0
%1
1.5
%9
13.4
%41
61.2
%12
17.9
%4
6.0
%67
100.0
%
Pro
jec
t S
ize
Cla
ss
ific
ati
on
- S
mall
(EU
R <
5 -
10 m
illio
n)
342.9
%1
14.3
%3
42.9
%0
0.0
%7
10.6
%0
0.0
%2
28.6
%4
57.1
%1
14.3
%0
0.0
%7
10.4
%
- M
ediu
m (
EU
R >
10 -
50 m
illio
n)
15
37.5
%17
42.5
%6
15.0
%2
5.0
%40
60.6
%1
2.6
%5
12.8
%25
64.1
%7
17.9
%1
2.6
%39
58.2
%
- L
arg
e (
EU
R >
50 -
250 m
illio
n)
526.3
%11
57.9
%3
15.8
%0
0.0
%19
28.8
%0
0.0
%2
9.5
%12
57.1
%4
19.0
%3
14.3
%21
31.3
%
To
tal
Pro
jec
t S
ize
Cla
ss
ific
ati
on
23
34.8
%29
43.9
%12
18.2
%2
3.0
%66
100.0
%1
1.5
%9
13.4
%41
61.2
%12
17.9
%4
6.0
%67
100.0
%
Ho
w e
ffe
cti
ve
are
yo
ur
pro
ce
ss
es
at
ma
nag
ing
th
is r
isk
?
Lo
wM
ed
ium
Hig
hV
ery
hig
hN
um
be
r o
f
Res
po
nse
s
Ho
w s
ign
ific
an
t is
th
is r
isk
to
ac
hie
vin
g y
ou
r o
bje
cti
ve
s?
Ve
ry
Ine
ffe
cti
ve
Ine
ffe
cti
ve
Eff
ec
tive
Ve
ry e
ffe
cti
ve
Do
n't
kn
ow
Nu
mb
er
of
Res
po
nse
s

232
7)
Ris
k i
s a
co
nc
ep
t u
se
d t
o e
xp
ress
un
ce
rta
inty
ab
ou
t e
ve
nts
an
d/o
r th
eir
ou
tco
me
s t
ha
t co
uld
ha
ve
a m
ate
ria
l e
ffe
ct
on
th
e g
oa
ls o
f th
e c
om
pa
ny.
P
lease e
valu
ate
th
e f
ollo
win
g r
isks o
n c
om
pan
y level re
gard
ing
th
eir
sig
nif
ican
ce t
o a
ch
ievin
g y
ou
r co
mp
an
y´s
ob
jecti
ves a
s w
ell a
s t
he e
ffecti
ven
ess o
f yo
ur
risk m
an
ag
em
en
t
p
rocesses t
o c
op
e w
ith
th
ose r
isks.
7 L
oss o
r im
pair
men
t o
f re
pu
tati
on
To
tal
Res
po
nd
an
ts2
13
0.9
%2
23
2.4
%1
72
5.0
%8
11
.8%
68
10
0.0
%0
0.0
%1
11
6.4
%3
85
6.7
%1
52
2.4
%3
4.5
%6
71
00
.0%
Deve
lop
er
Cla
ss
ific
ati
on
- M
ain
ly T
rader-
Develo
per
11
30.6
%10
27.8
%11
30.6
%4
11.1
%36
52.9
%0
0.0
%4
11.1
%24
66.7
%6
16.7
%2
5.6
%36
53.7
% -
Main
ly I
nvesto
r-D
evelo
per
10
31.3
%12
37.5
%6
18.8
%4
12.5
%32
47.1
%0
0.0
%7
22.6
%14
45.2
%9
29.0
%1
3.2
%31
46.3
%
To
tal
Deve
lop
er
Cla
ss
ific
ati
on
21
30.9
%22
32.4
%17
25.0
%8
11.8
%68
100.0
%0
0.0
%11
16.4
%38
56.7
%15
22.4
%3
4.5
%67
100.0
%
Ow
ners
hip
str
uctu
re -
Lis
ted
731.8
%6
27.3
%7
31.8
%2
9.1
%22
32.4
%0
0.0
%3
13.6
%12
54.5
%6
27.3
%1
4.5
%22
32.8
% -
Unlis
ted
14
30.4
%16
34.8
%10
21.7
%6
13.0
%46
67.6
%0
0.0
%8
17.8
%26
57.8
%9
20.0
%2
4.4
%45
67.2
%
To
tal
Ow
ners
hip
Str
uctu
re21
30.9
%22
32.4
%17
25.0
%8
11.8
%68
100.0
%0
0.0
%11
16.4
%38
56.7
%15
22.4
%3
4.5
%67
100.0
%
Ge
og
rap
hic
Sc
op
e -
Regio
nal
233.3
%3
50.0
%1
16.7
%0
0.0
%6
8.8
%0
0.0
%1
16.7
%3
50.0
%2
33.3
%0
0.0
%6
9.0
% -
National
11
30.6
%13
36.1
%7
19.4
%5
13.9
%36
52.9
%0
0.0
%6
17.1
%20
57.1
%7
20.0
%2
5.7
%35
52.2
% -
Inte
rnational
830.8
%6
23.1
%9
34.6
%3
11.5
%26
38.2
%0
0.0
%4
15.4
%15
57.7
%6
23.1
%1
3.8
%26
38.8
%
To
tal
Ge
og
rap
hic
Sc
op
e21
30.9
%22
32.4
%17
25.0
%8
11.8
%68
100.0
%0
0.0
%11
16.4
%38
56.7
%15
22.4
%3
4.5
%67
100.0
%
Pro
jec
t S
ize
Cla
ss
ific
ati
on
- S
mall
(EU
R <
5 -
10 m
illio
n)
342.9
%2
28.6
%1
14.3
%1
14.3
%7
10.3
%0
0.0
%1
14.3
%4
57.1
%2
28.6
%0
0.0
%7
10.4
% -
Mediu
m (
EU
R >
10 -
50 m
illio
n)
12
30.0
%14
35.0
%9
22.5
%5
12.5
%40
58.8
%0
0.0
%6
15.4
%25
64.1
%8
20.5
%0
0.0
%39
58.2
% -
Larg
e (
EU
R >
50 -
250 m
illio
n)
628.6
%6
28.6
%7
33.3
%2
9.5
%21
30.9
%0
0.0
%4
19.0
%9
42.9
%5
23.8
%3
14.3
%21
31.3
%
To
tal
Pro
jec
t S
ize
Cla
ss
ific
ati
on
21
30.9
%22
32.4
%17
25.0
%8
11.8
%68
100.0
%0
0.0
%11
16.4
%38
56.7
%15
22.4
%3
4.5
%67
100.0
%
Ho
w s
ign
ific
an
t is
th
is r
isk
to
ac
hie
vin
g y
ou
r o
bje
cti
ve
s?
Ho
w e
ffe
cti
ve
are
yo
ur
pro
ce
ss
es
at
ma
nag
ing
th
is r
isk
?
Lo
wM
ed
ium
Hig
hV
ery
hig
hN
um
be
r o
f
Res
po
nse
s
Ve
ry
Ine
ffe
cti
ve
Ine
ffe
cti
ve
Eff
ec
tive
Ve
ry e
ffe
cti
ve
Do
n't
kn
ow
Nu
mb
er
of
Res
po
nse
s

233
7)
Ris
k is a
co
ncep
t u
sed
to
exp
ress u
ncert
ain
ty a
bo
ut
even
ts a
nd
/or
their
ou
tco
mes t
hat
co
uld
have a
mate
rial eff
ect
on
th
e g
oals
of
the c
om
pan
y.
P
lease e
valu
ate
th
e f
ollo
win
g r
isks o
n c
om
pan
y level re
gard
ing
th
eir
sig
nif
ican
ce t
o a
ch
ievin
g y
ou
r co
mp
an
y´s
ob
jecti
ves a
s w
ell a
s t
he e
ffecti
ven
ess o
f yo
ur
risk m
an
ag
em
en
t
p
rocesses t
o c
op
e w
ith
th
ose r
isks.
8 H
um
an
resso
urc
es lack t
he e
xp
ert
ise t
o m
eet
co
mp
an
y´s
go
als
To
tal
Res
po
nd
an
ts2
23
2.8
%1
92
8.4
%2
02
9.9
%6
9.0
%6
71
00
.0%
00
.0%
91
3.4
%4
05
9.7
%1
52
2.4
%3
4.5
%6
71
00
.0%
Deve
lop
er
Cla
ss
ific
ati
on
- M
ain
ly T
rader-
Develo
per
11
31.4
%12
34.3
%9
25.7
%3
8.6
%35
52.2
%0
0.0
%4
11.1
%20
55.6
%9
25.0
%3
8.3
%36
53.7
% -
Main
ly I
nvesto
r-D
evelo
per
11
34.4
%7
21.9
%11
34.4
%3
9.4
%32
47.8
%0
0.0
%5
16.1
%20
64.5
%6
19.4
%0
0.0
%31
46.3
%
To
tal
Deve
lop
er
Cla
ss
ific
ati
on
22
32.8
%19
28.4
%20
29.9
%6
9.0
%67
100
.0%
00
.0%
91
3.4
%40
59.7
%15
22.4
%3
4.5
%67
100
.0%
Ow
ners
hip
str
uctu
re -
Lis
ted
62
7.3
%7
31.8
%7
31.8
%2
9.1
%22
32.8
%0
0.0
%3
13.6
%17
77.3
%2
9.1
%0
0.0
%22
32.8
% -
Unlis
ted
16
35.6
%12
26.7
%13
28.9
%4
8.9
%45
67.2
%0
0.0
%6
13.3
%23
51.1
%13
28.9
%3
6.7
%45
67.2
%
To
tal
Ow
ners
hip
Str
uctu
re22
32.8
%19
28.4
%20
29.9
%6
9.0
%67
100
.0%
00
.0%
91
3.4
%40
59.7
%15
22.4
%3
4.5
%67
100
.0%
Ge
og
rap
hic
Sc
op
e -
Regio
nal
23
3.3
%2
33.3
%2
33.3
%0
0.0
%6
9.0
%0
0.0
%2
33.3
%3
50.0
%1
16.7
%0
0.0
%6
9.0
% -
National
10
27.8
%10
27.8
%11
30.6
%5
13.9
%36
53.7
%0
0.0
%2
5.7
%22
62.9
%10
28.6
%1
2.9
%35
52.2
% -
Inte
rnational
10
40.0
%7
28.0
%7
28.0
%1
4.0
%25
37.3
%0
0.0
%5
19.2
%15
57.7
%4
15.4
%2
7.7
%26
38.8
%
To
tal
Ge
og
rap
hic
Sc
op
e22
32.8
%19
28.4
%20
29.9
%6
9.0
%67
100
.0%
00
.0%
91
3.4
%40
59.7
%15
22.4
%3
4.5
%67
100
.0%
Pro
jec
t S
ize
Cla
ss
ific
ati
on
- S
mall
(EU
R <
5 -
10 m
illio
n)
45
7.1
%0
0.0
%3
42.9
%0
0.0
%7
10.4
%0
0.0
%2
28.6
%3
42.9
%2
28.6
%0
0.0
%7
10.4
% -
Mediu
m (
EU
R >
10 -
50 m
illio
n)
10
25.0
%11
27.5
%14
35.0
%5
12.5
%40
59.7
%0
0.0
%4
10.3
%25
64.1
%10
25.6
%0
0.0
%39
58.2
% -
Larg
e (
EU
R >
50 -
250 m
illio
n)
84
0.0
%8
40.0
%3
15.0
%1
5.0
%20
29.9
%0
0.0
%3
14.3
%12
57.1
%3
14.3
%3
14.3
%21
31.3
%
To
tal
Pro
jec
t S
ize
Cla
ss
ific
ati
on
22
32.8
%19
28.4
%20
29.9
%6
9.0
%67
100
.0%
00
.0%
91
3.4
%40
59.7
%15
22.4
%3
4.5
%67
100
.0%
Ho
w s
ign
ific
an
t is
th
is r
isk
to
ac
hie
vin
g y
ou
r o
bje
cti
ve
s?
Ho
w e
ffe
cti
ve
are
yo
ur
pro
ce
ss
es
at
ma
nag
ing
th
is r
isk
?
Ve
ry e
ffe
cti
ve
Do
n't
kn
ow
Nu
mb
er
of
Res
po
nse
sE
ffe
cti
ve
Lo
wM
ed
ium
Hig
hV
ery
hig
hN
um
be
r o
f
Res
po
nse
s
Ve
ry
Ine
ffe
cti
ve
Ine
ffe
cti
ve

234
7)
Ris
k is a
co
ncep
t u
sed
to
exp
ress u
ncert
ain
ty a
bo
ut
even
ts a
nd
/or
their
ou
tco
mes t
hat
co
uld
have a
mate
rial eff
ect
on
th
e g
oals
of
the c
om
pan
y.
P
lease e
valu
ate
th
e f
ollo
win
g r
isks o
n c
om
pan
y level re
gard
ing
th
eir
sig
nif
ican
ce t
o a
ch
ievin
g y
ou
r co
mp
an
y´s
ob
jecti
ves a
s w
ell a
s t
he e
ffecti
ven
ess o
f yo
ur
risk m
an
ag
em
en
t
p
rocesses t
o c
op
e w
ith
th
ose r
isks.
9 A
ccid
en
ts c
au
se e
nvir
on
men
tal d
am
ag
e
To
tal
Res
po
nd
an
ts4
46
4.7
%1
82
6.5
%5
7.4
%1
1.5
%6
81
00
.0%
11
.5%
12
17
.9%
33
49
.3%
15
22
.4%
69
.0%
67
10
0.0
%
Deve
lop
er
Cla
ss
ific
ati
on
- M
ain
ly T
rader-
Develo
per
23
63.9
%9
25.0
%4
11.1
%0
0.0
%36
52.9
%1
2.8
%5
13.9
%18
50.0
%9
25.0
%3
8.3
%36
53.7
%
- M
ain
ly I
nvesto
r-D
evelo
per
21
65.6
%9
28.1
%1
3.1
%1
3.1
%32
47.1
%0
0.0
%7
22.6
%15
48.4
%6
19.4
%3
9.7
%31
46.3
%
To
tal
Deve
lop
er
Cla
ss
ific
ati
on
44
64.7
%18
26.5
%5
7.4
%1
1.5
%68
100
.0%
11
.5%
12
17.9
%33
49.3
%15
22.4
%6
9.0
%67
100
.0%
Ow
ners
hip
str
uctu
re -
Lis
ted
15
68.2
%7
31.8
%0
0.0
%0
0.0
%22
32.4
%0
0.0
%3
13.6
%10
45.5
%7
31.8
%2
9.1
%22
32.8
%
- U
nlis
ted
29
63.0
%11
23.9
%5
10.9
%1
2.2
%46
67.6
%1
2.2
%9
20.0
%23
51.1
%8
17.8
%4
8.9
%45
67.2
%
To
tal
Ow
ners
hip
Str
uctu
re44
64.7
%18
26.5
%5
7.4
%1
1.5
%68
100
.0%
11
.5%
12
17.9
%33
49.3
%15
22.4
%6
9.0
%67
100
.0%
Ge
og
rap
hic
Sc
op
e -
Regio
nal
58
3.3
%1
16.7
%0
0.0
%0
0.0
%6
8.8
%0
0.0
%0
0.0
%5
83.3
%1
16.7
%0
0.0
%6
9.0
%
- N
ational
22
61.1
%9
25.0
%4
11.1
%1
2.8
%36
52.9
%1
2.9
%8
22.9
%17
48.6
%6
17.1
%3
8.6
%35
52.2
%
- I
nte
rnational
17
65.4
%8
30.8
%1
3.8
%0
0.0
%26
38.2
%0
0.0
%4
15.4
%11
42.3
%8
30.8
%3
11.5
%26
38.8
%
To
tal
Ge
og
rap
hic
Sc
op
e44
64.7
%18
26.5
%5
7.4
%1
1.5
%68
100
.0%
11
.5%
12
17.9
%33
49.3
%15
22.4
%6
9.0
%67
100
.0%
Pro
jec
t S
ize
Cla
ss
ific
ati
on
- S
mall
(EU
R <
5 -
10 m
illio
n)
57
1.4
%1
14.3
%1
14.3
%0
0.0
%7
10.3
%0
0.0
%0
0.0
%7
100
.0%
00
.0%
00
.0%
71
0.4
%
- M
ediu
m (
EU
R >
10 -
50 m
illio
n)
23
57.5
%13
32.5
%4
10.0
%0
0.0
%40
58.8
%1
2.6
%9
23.1
%20
51.3
%8
20.5
%1
2.6
%39
58.2
%
- L
arg
e (
EU
R >
50 -
250 m
illio
n)
16
76.2
%4
19.0
%0
0.0
%1
4.8
%21
30.9
%0
0.0
%3
14.3
%6
28.6
%7
33.3
%5
23.8
%21
31.3
%
To
tal
Pro
jec
t S
ize
Cla
ss
ific
ati
on
44
64.7
%18
26.5
%5
7.4
%1
1.5
%68
100
.0%
11
.5%
12
17.9
%33
49.3
%15
22.4
%6
9.0
%67
100
.0%
Ve
ry e
ffe
cti
ve
Hig
hV
ery
hig
hD
on
't k
no
wN
um
be
r o
f
Res
po
nse
s
Nu
mb
er
of
Res
po
nse
s
Ve
ry
Ine
ffe
cti
ve
Ine
ffe
cti
ve
Eff
ec
tive
Lo
wM
ed
ium
Ho
w s
ign
ific
an
t is
th
is r
isk
to
ac
hie
vin
g y
ou
r o
bje
cti
ve
s?
Ho
w e
ffe
cti
ve
are
yo
ur
pro
ce
ss
es
at
ma
nag
ing
th
is r
isk
?

235
7)
Ris
k is a
co
ncep
t u
sed
to
exp
ress u
ncert
ain
ty a
bo
ut
even
ts a
nd
/or
their
ou
tco
mes t
hat
co
uld
have a
mate
rial eff
ect
on
th
e g
oals
of
the c
om
pan
y.
P
lease e
valu
ate
th
e f
ollo
win
g r
isks o
n c
om
pan
y level re
gard
ing
th
eir
sig
nif
ican
ce t
o a
ch
ievin
g y
ou
r co
mp
an
y´s
ob
jecti
ves a
s w
ell a
s t
he e
ffecti
ven
ess o
f yo
ur
risk m
an
ag
em
en
t
p
rocesses t
o c
op
e w
ith
th
ose r
isks.
10 E
xecu
tives, em
plo
yees o
r ag
en
ts e
xceed
th
eir
au
tho
rity
To
tal
Res
po
nd
an
ts4
16
0.3
%1
52
2.1
%1
11
6.2
%1
1.5
%6
81
00
.0%
00
.0%
46
.0%
35
52
.2%
26
38
.8%
23
.0%
67
10
0.0
%
Deve
lop
er
Cla
ss
ific
ati
on
- M
ain
ly T
rader-
Develo
per
21
58.3
%7
19.4
%8
22.2
%0
0.0
%36
52.9
%0
0.0
%3
8.3
%19
52.8
%12
33.3
%2
5.6
%36
53.7
%
- M
ain
ly I
nvesto
r-D
evelo
per
20
62.5
%8
25.0
%3
9.4
%1
3.1
%32
47.1
%0
0.0
%1
3.2
%16
51.6
%14
45.2
%0
0.0
%31
46.3
%
To
tal
Deve
lop
er
Cla
ss
ific
ati
on
41
60.3
%15
22.1
%11
16.2
%1
1.5
%68
100
.0%
00
.0%
46
.0%
35
52.2
%26
38.8
%2
3.0
%67
100
.0%
Ow
ners
hip
str
uctu
re -
Lis
ted
14
63.6
%5
22.7
%2
9.1
%1
4.5
%22
32.4
%0
0.0
%1
4.5
%11
50.0
%10
45.5
%0
0.0
%22
32.8
%
- U
nlis
ted
27
58.7
%10
21.7
%9
19.6
%0
0.0
%46
67.6
%0
0.0
%3
6.7
%24
53.3
%16
35.6
%2
4.4
%45
67.2
%
To
tal
Ow
ners
hip
Str
uctu
re41
60.3
%15
22.1
%11
16.2
%1
1.5
%68
100
.0%
00
.0%
46
.0%
35
52.2
%26
38.8
%2
3.0
%67
100
.0%
Ge
og
rap
hic
Sc
op
e -
Regio
nal
58
3.3
%0
0.0
%1
16.7
%0
0.0
%6
8.8
%0
0.0
%0
0.0
%3
50.0
%3
50.0
%0
0.0
%6
9.0
%
- N
ational
21
58.3
%7
19.4
%7
19.4
%1
2.8
%36
52.9
%0
0.0
%1
2.9
%21
60.0
%12
34.3
%1
2.9
%35
52.2
%
- I
nte
rnational
15
57.7
%8
30.8
%3
11.5
%0
0.0
%26
38.2
%0
0.0
%3
11.5
%11
42.3
%11
42.3
%1
3.8
%26
38.8
%
To
tal
Ge
og
rap
hic
Sc
op
e41
60.3
%15
22.1
%11
16.2
%1
1.5
%68
100
.0%
00
.0%
46
.0%
35
52.2
%26
38.8
%2
3.0
%67
100
.0%
Pro
jec
t S
ize
Cla
ss
ific
ati
on
- S
mall
(EU
R <
5 -
10 m
illio
n)
34
2.9
%1
14.3
%3
42.9
%0
0.0
%7
10.3
%0
0.0
%1
14.3
%5
71.4
%1
14.3
%0
0.0
%7
10.4
%
- M
ediu
m (
EU
R >
10 -
50 m
illio
n)
24
60.0
%9
22.5
%6
15.0
%1
2.5
%40
58.8
%0
0.0
%1
2.6
%24
61.5
%14
35.9
%0
0.0
%39
58.2
%
- L
arg
e (
EU
R >
50 -
250 m
illio
n)
14
66.7
%5
23.8
%2
9.5
%0
0.0
%21
30.9
%0
0.0
%2
9.5
%6
28.6
%11
52.4
%2
9.5
%21
31.3
%
To
tal
Pro
jec
t S
ize
Cla
ss
ific
ati
on
41
60.3
%15
22.1
%11
16.2
%1
1.5
%68
100
.0%
00
.0%
46
.0%
35
52.2
%26
38.8
%2
3.0
%67
100
.0%
Do
n't
kn
ow
Nu
mb
er
of
Res
po
nse
s
Nu
mb
er
of
Res
po
nse
s
Ve
ry
Ine
ffe
cti
ve
Ine
ffe
cti
ve
Eff
ec
tive
Lo
wM
ed
ium
Hig
hV
ery
hig
hV
ery
eff
ec
tive
Ho
w s
ign
ific
an
t is
th
is r
isk
to
ac
hie
vin
g y
ou
r o
bje
cti
ve
s?
Ho
w e
ffe
cti
ve
are
yo
ur
pro
ce
ss
es
at
ma
nag
ing
th
is r
isk
?

236
7)
Ris
k i
s a
co
nc
ep
t u
se
d t
o e
xp
ress
un
ce
rta
inty
ab
ou
t e
ve
nts
an
d/o
r th
eir
ou
tco
me
s t
ha
t co
uld
ha
ve
a m
ate
ria
l e
ffe
ct
on
th
e g
oa
ls o
f th
e c
om
pa
ny.
P
lease e
valu
ate
th
e f
ollo
win
g r
isks o
n c
om
pan
y level re
gard
ing
th
eir
sig
nif
ican
ce t
o a
ch
ievin
g y
ou
r co
mp
an
y´s
ob
jecti
ves a
s w
ell a
s t
he e
ffecti
ven
ess o
f yo
ur
risk m
an
ag
em
en
t
p
rocesses t
o c
op
e w
ith
th
ose r
isks.
11 In
ad
eq
uate
mo
tivati
on
s lead
to
un
der-
perf
orm
an
ce
To
tal
Re
sp
on
da
nts
30
44
.8%
26
38
.8%
91
3.4
%2
3.0
%6
71
00
.0%
00
.0%
81
1.9
%3
95
8.2
%1
62
3.9
%4
6.0
%6
71
00
.0%
De
ve
lop
er
Cla
ss
ific
ati
on
- M
ain
ly T
rader-
Develo
per
13
37.1
%17
48.6
%4
11.4
%1
2.9
%35
52.2
%0
0.0
%2
5.6
%21
58.3
%9
25.0
%4
11.1
%36
53.7
%
- M
ain
ly I
nvesto
r-D
evelo
per
17
53.1
%9
28.1
%5
15.6
%1
3.1
%32
47.8
%0
0.0
%6
19.4
%18
58.1
%7
22.6
%0
0.0
%31
46.3
%
To
tal
De
ve
lop
er
Cla
ss
ific
ati
on
30
44.8
%26
38.8
%9
13.4
%2
3.0
%67
100.0
%0
0.0
%8
11.9
%39
58.2
%16
23.9
%4
6.0
%67
100.0
%
Ow
ne
rsh
ip s
tru
ctu
re -
Lis
ted
11
52.4
%7
33.3
%2
9.5
%1
4.8
%21
31.3
%0
0.0
%0
0.0
%17
77.3
%3
13.6
%2
9.1
%22
32.8
%
- U
nlis
ted
19
41.3
%19
41.3
%7
15.2
%1
2.2
%46
68.7
%0
0.0
%8
17.8
%22
48.9
%13
28.9
%2
4.4
%45
67.2
%
To
tal
Ow
ne
rsh
ip S
tru
ctu
re30
44.8
%26
38.8
%9
13.4
%2
3.0
%67
100.0
%0
0.0
%8
11.9
%39
58.2
%16
23.9
%4
6.0
%67
100.0
%
Ge
og
rap
hic
Sc
op
e -
Regio
nal
466.7
%2
33.3
%0
0.0
%0
0.0
%6
9.0
%0
0.0
%1
16.7
%5
83.3
%0
0.0
%0
0.0
%6
9.0
%
- N
ational
16
44.4
%12
33.3
%6
16.7
%2
5.6
%36
53.7
%0
0.0
%5
14.3
%17
48.6
%11
31.4
%2
5.7
%35
52.2
%
- I
nte
rnational
10
40.0
%12
48.0
%3
12.0
%0
0.0
%25
37.3
%0
0.0
%2
7.7
%17
65.4
%5
19.2
%2
7.7
%26
38.8
%
To
tal
Ge
og
rap
hic
Sc
op
e30
44.8
%26
38.8
%9
13.4
%2
3.0
%67
100.0
%0
0.0
%8
11.9
%39
58.2
%16
23.9
%4
6.0
%67
100.0
%
Pro
jec
t S
ize
Cla
ss
ific
ati
on
- S
mall
(EU
R <
5 -
10 m
illio
n)
457.1
%3
42.9
%0
0.0
%0
0.0
%7
10.4
%0
0.0
%0
0.0
%6
85.7
%1
14.3
%0
0.0
%7
10.4
%
- M
ediu
m (
EU
R >
10 -
50 m
illio
n)
17
42.5
%15
37.5
%6
15.0
%2
5.0
%40
59.7
%0
0.0
%7
17.9
%22
56.4
%9
23.1
%1
2.6
%39
58.2
%
- L
arg
e (
EU
R >
50 -
250 m
illio
n)
945.0
%8
40.0
%3
15.0
%0
0.0
%20
29.9
%0
0.0
%1
4.8
%11
52.4
%6
28.6
%3
14.3
%21
31.3
%
To
tal
Pro
jec
t S
ize
Cla
ss
ific
ati
on
30
44.8
%26
38.8
%9
13.4
%2
3.0
%67
100.0
%0
0.0
%8
11.9
%39
58.2
%16
23.9
%4
6.0
%67
100.0
%
Ve
ry e
ffe
cti
ve
Hig
hV
ery
hig
hD
on
't k
no
wN
um
be
r o
f
Re
sp
on
se
s
Nu
mb
er
of
Re
sp
on
se
s
Ve
ry
Ine
ffe
cti
ve
Ine
ffe
cti
ve
Eff
ec
tive
Lo
wM
ed
ium
Ho
w s
ign
ific
an
t is
th
is r
isk
to
ac
hie
vin
g y
ou
r o
bje
cti
ve
s?
Ho
w e
ffe
cti
ve
are
yo
ur
pro
ce
ss
es
at
ma
na
gin
g t
his
ris
k?

237
7)
Ris
k is a
co
ncep
t u
sed
to
exp
ress u
ncert
ain
ty a
bo
ut
even
ts a
nd
/or
their
ou
tco
mes t
hat
co
uld
have a
mate
rial eff
ect
on
th
e g
oals
of
the c
om
pan
y.
P
lease e
valu
ate
th
e f
ollo
win
g r
isks o
n c
om
pan
y level re
gard
ing
th
eir
sig
nif
ican
ce t
o a
ch
ievin
g y
ou
r co
mp
an
y´s
ob
jecti
ves a
s w
ell a
s t
he e
ffecti
ven
ess o
f yo
ur
risk m
an
ag
em
en
t
p
rocesses t
o c
op
e w
ith
th
ose r
isks.
12 L
ack o
f n
eed
ed
hard
- an
d s
oft
ware
to
su
pp
ort
th
e b
usin
ess
To
tal
Res
po
nd
an
ts4
26
1.8
%1
82
6.5
%6
8.8
%2
2.9
%6
81
00
.0%
00
.0%
46
.0%
44
65
.7%
15
22
.4%
46
.0%
67
10
0.0
%
Deve
lop
er
Cla
ss
ific
ati
on
- M
ain
ly T
rader-
Develo
per
20
55.6
%11
30.6
%3
8.3
%2
5.6
%36
52.9
%0
0.0
%2
5.6
%23
63.9
%8
22.2
%3
8.3
%36
53.7
%
- M
ain
ly I
nvesto
r-D
evelo
per
22
68.8
%7
21.9
%3
9.4
%0
0.0
%32
47.1
%0
0.0
%2
6.5
%21
67.7
%7
22.6
%1
3.2
%31
46.3
%
To
tal
Deve
lop
er
Cla
ss
ific
ati
on
42
61.8
%18
26.5
%6
8.8
%2
2.9
%68
100
.0%
00
.0%
46
.0%
44
65.7
%15
22.4
%4
6.0
%67
100
.0%
Ow
ners
hip
str
uctu
re -
Lis
ted
12
54.5
%8
36.4
%2
9.1
%0
0.0
%22
32.4
%0
0.0
%1
4.5
%16
72.7
%3
13.6
%2
9.1
%22
32.8
%
- U
nlis
ted
30
65.2
%10
21.7
%4
8.7
%2
4.3
%46
67.6
%0
0.0
%3
6.7
%28
62.2
%12
26.7
%2
4.4
%45
67.2
%
To
tal
Ow
ners
hip
Str
uctu
re42
61.8
%18
26.5
%6
8.8
%2
2.9
%68
100
.0%
00
.0%
46
.0%
44
65.7
%15
22.4
%4
6.0
%67
100
.0%
Ge
og
rap
hic
Sc
op
e -
Regio
nal
58
3.3
%1
16.7
%0
0.0
%0
0.0
%6
8.8
%0
0.0
%1
16.7
%3
50.0
%2
33.3
%0
0.0
%6
9.0
%
- N
ational
21
58.3
%9
25.0
%4
11.1
%2
5.6
%36
52.9
%0
0.0
%3
8.6
%24
68.6
%5
14.3
%3
8.6
%35
52.2
%
- I
nte
rnational
16
61.5
%8
30.8
%2
7.7
%0
0.0
%26
38.2
%0
0.0
%0
0.0
%17
65.4
%8
30.8
%1
3.8
%26
38.8
%
To
tal
Ge
og
rap
hic
Sc
op
e42
61.8
%18
26.5
%6
8.8
%2
2.9
%68
100
.0%
00
.0%
46
.0%
44
65.7
%15
22.4
%4
6.0
%67
100
.0%
Pro
jec
t S
ize
Cla
ss
ific
ati
on
- S
mall
(EU
R <
5 -
10 m
illio
n)
57
1.4
%1
14.3
%1
14.3
%0
0.0
%7
10.3
%0
0.0
%1
14.3
%5
71.4
%1
14.3
%0
0.0
%7
10.4
%
- M
ediu
m (
EU
R >
10 -
50 m
illio
n)
23
57.5
%14
35.0
%1
2.5
%2
5.0
%40
58.8
%0
0.0
%2
5.1
%29
74.4
%7
17.9
%1
2.6
%39
58.2
%
- L
arg
e (
EU
R >
50 -
250 m
illio
n)
14
66.7
%3
14.3
%4
19.0
%0
0.0
%21
30.9
%0
0.0
%1
4.8
%10
47.6
%7
33.3
%3
14.3
%21
31.3
%
To
tal
Pro
jec
t S
ize
Cla
ss
ific
ati
on
42
61.8
%18
26.5
%6
8.8
%2
2.9
%68
100
.0%
00
.0%
46
.0%
44
65.7
%15
22.4
%4
6.0
%67
100
.0%
Do
n't
kn
ow
Nu
mb
er
of
Res
po
nse
s
Nu
mb
er
of
Res
po
nse
s
Ve
ry
Ine
ffe
cti
ve
Ine
ffe
cti
ve
Eff
ec
tive
Lo
wM
ed
ium
Hig
hV
ery
hig
hV
ery
eff
ec
tive
Ho
w s
ign
ific
an
t is
th
is r
isk
to
ac
hie
vin
g y
ou
r o
bje
cti
ve
s?
Ho
w e
ffe
cti
ve
are
yo
ur
pro
ce
ss
es
at
ma
nag
ing
th
is r
isk
?

238
7)
Ris
k is a
co
ncep
t u
sed
to
exp
ress u
ncert
ain
ty a
bo
ut
even
ts a
nd
/or
their
ou
tco
mes t
hat
co
uld
have a
mate
rial eff
ect
on
th
e g
oals
of
the c
om
pan
y.
P
lease e
valu
ate
th
e f
ollo
win
g r
isks o
n c
om
pan
y level re
gard
ing
th
eir
sig
nif
ican
ce t
o a
ch
ievin
g y
ou
r co
mp
an
y´s
ob
jecti
ves a
s w
ell a
s t
he e
ffecti
ven
ess o
f yo
ur
risk m
an
ag
em
en
t
p
rocesses t
o c
op
e w
ith
th
ose r
isks.
+
13 L
iqu
idit
y r
isk f
rom
in
vestm
en
ts n
ot
matc
hin
g n
eed
ed
liq
uid
ity
To
tal
Res
po
nd
an
ts2
33
4.8
%1
92
8.8
%1
82
7.3
%6
9.1
%6
61
00
.0%
00
.0%
57
.5%
33
49
.3%
22
32
.8%
71
0.4
%6
71
00
.0%
Deve
lop
er
Cla
ss
ific
ati
on
- M
ain
ly T
rader-
Develo
per
11
31.4
%12
34.3
%9
25.7
%3
8.6
%35
53.0
%0
0.0
%4
11.1
%17
47.2
%10
27.8
%5
13.9
%36
53.7
%
- M
ain
ly I
nvesto
r-D
evelo
per
12
38.7
%7
22.6
%9
29.0
%3
9.7
%31
47.0
%0
0.0
%1
3.2
%16
51.6
%12
38.7
%2
6.5
%31
46.3
%
To
tal
Deve
lop
er
Cla
ss
ific
ati
on
23
34.8
%19
28.8
%18
27.3
%6
9.1
%66
100
.0%
00
.0%
57
.5%
33
49.3
%22
32.8
%7
10.4
%67
100
.0%
Ow
ners
hip
str
uctu
re -
Lis
ted
73
3.3
%6
28.6
%6
28.6
%2
9.5
%21
31.8
%0
0.0
%0
0.0
%12
54.5
%8
36.4
%2
9.1
%22
32.8
%
- U
nlis
ted
16
35.6
%13
28.9
%12
26.7
%4
8.9
%45
68.2
%0
0.0
%5
11.1
%21
46.7
%14
31.1
%5
11.1
%45
67.2
%
To
tal
Ow
ners
hip
Str
uctu
re23
34.8
%19
28.8
%18
27.3
%6
9.1
%66
100
.0%
00
.0%
57
.5%
33
49.3
%22
32.8
%7
10.4
%67
100
.0%
Ge
og
rap
hic
Sc
op
e -
Regio
nal
00
.0%
36
0.0
%1
20.0
%1
20.0
%5
7.6
%0
0.0
%0
0.0
%4
66.7
%1
16.7
%1
16.7
%6
9.0
%
- N
ational
15
41.7
%8
22.2
%9
25.0
%4
11.1
%36
54.5
%0
0.0
%3
8.6
%16
45.7
%13
37.1
%3
8.6
%35
52.2
%
- I
nte
rnational
83
2.0
%8
32.0
%8
32.0
%1
4.0
%25
37.9
%0
0.0
%2
7.7
%13
50.0
%8
30.8
%3
11.5
%26
38.8
%
To
tal
Ge
og
rap
hic
Sc
op
e23
34.8
%19
28.8
%18
27.3
%6
9.1
%66
100
.0%
00
.0%
57
.5%
33
49.3
%22
32.8
%7
10.4
%67
100
.0%
Pro
jec
t S
ize
Cla
ss
ific
ati
on
- S
mall
(EU
R <
5 -
10 m
illio
n)
00
.0%
35
0.0
%3
50.0
%0
0.0
%6
9.1
%0
0.0
%1
14.3
%5
71.4
%0
0.0
%1
14.3
%7
10.4
%
- M
ediu
m (
EU
R >
10 -
50 m
illio
n)
15
37.5
%9
22.5
%11
27.5
%5
12.5
%40
60.6
%0
0.0
%2
5.1
%19
48.7
%16
41.0
%2
5.1
%39
58.2
%
- L
arg
e (
EU
R >
50 -
250 m
illio
n)
84
0.0
%7
35.0
%4
20.0
%1
5.0
%20
30.3
%0
0.0
%2
9.5
%9
42.9
%6
28.6
%4
19.0
%21
31.3
%
To
tal
Pro
jec
t S
ize
Cla
ss
ific
ati
on
23
34.8
%19
28.8
%18
27.3
%6
9.1
%66
100
.0%
00
.0%
57
.5%
33
49.3
%22
32.8
%7
10.4
%67
100
.0%
Ve
ry e
ffe
cti
ve
Hig
hV
ery
hig
hD
on
't k
no
wN
um
be
r o
f
Res
po
nse
s
Nu
mb
er
of
Res
po
nse
s
Ve
ry
Ine
ffe
cti
ve
Ine
ffe
cti
ve
Eff
ec
tive
Lo
wM
ed
ium
Ho
w s
ign
ific
an
t is
th
is r
isk
to
ac
hie
vin
g y
ou
r o
bje
cti
ve
s?
Ho
w e
ffe
cti
ve
are
yo
ur
pro
ce
ss
es
at
ma
nag
ing
th
is r
isk
?

239
7)
Ris
k is a
co
ncep
t u
sed
to
exp
ress u
ncert
ain
ty a
bo
ut
even
ts a
nd
/or
their
ou
tco
mes t
hat
co
uld
have a
mate
rial eff
ect
on
th
e g
oals
of
the c
om
pan
y.
P
lease e
valu
ate
th
e f
ollo
win
g r
isks o
n c
om
pan
y level re
gard
ing
th
eir
sig
nif
ican
ce t
o a
ch
ievin
g y
ou
r co
mp
an
y´s
ob
jecti
ves a
s w
ell a
s t
he e
ffecti
ven
ess o
f yo
ur
risk m
an
ag
em
en
t
p
rocesses t
o c
op
e w
ith
th
ose r
isks.
14 M
easu
res o
f th
e c
om
pan
y´s
qu
ality
, ti
me a
nd
co
st
ob
jecti
ves a
re irr
ele
van
t o
r u
nre
liab
le
To
tal
Res
po
nd
an
ts3
45
0.7
%1
42
0.9
%1
31
9.4
%6
9.0
%6
71
00
.0%
11
.5%
71
0.4
%3
45
0.7
%1
72
5.4
%8
11
.9%
67
10
0.0
%
Deve
lop
er
Cla
ss
ific
ati
on
- M
ain
ly T
rader-
Develo
per
16
45.7
%8
22.9
%8
22.9
%3
8.6
%35
52.2
%0
0.0
%5
13.9
%17
47.2
%9
25.0
%5
13.9
%36
53.7
%
- M
ain
ly I
nvesto
r-D
evelo
per
18
56.3
%6
18.8
%5
15.6
%3
9.4
%32
47.8
%1
3.2
%2
6.5
%17
54.8
%8
25.8
%3
9.7
%31
46.3
%
To
tal
Deve
lop
er
Cla
ss
ific
ati
on
34
50.7
%14
20.9
%13
19.4
%6
9.0
%67
100
.0%
11
.5%
71
0.4
%34
50.7
%17
25.4
%8
11.9
%67
100
.0%
Ow
ners
hip
str
uctu
re -
Lis
ted
11
50.0
%4
18.2
%5
22.7
%2
9.1
%22
32.8
%0
0.0
%2
9.1
%10
45.5
%6
27.3
%4
18.2
%22
32.8
%
- U
nlis
ted
23
51.1
%10
22.2
%8
17.8
%4
8.9
%45
67.2
%1
2.2
%5
11.1
%24
53.3
%11
24.4
%4
8.9
%45
67.2
%
To
tal
Ow
ners
hip
Str
uctu
re34
50.7
%14
20.9
%13
19.4
%6
9.0
%67
100
.0%
11
.5%
71
0.4
%34
50.7
%17
25.4
%8
11.9
%67
100
.0%
Ge
og
rap
hic
Sc
op
e -
Regio
nal
46
6.7
%2
33.3
%0
0.0
%0
0.0
%6
9.0
%0
0.0
%0
0.0
%3
50.0
%2
33.3
%1
16.7
%6
9.0
%
- N
ational
18
50.0
%6
16.7
%8
22.2
%4
11.1
%36
53.7
%0
0.0
%5
14.3
%17
48.6
%10
28.6
%3
8.6
%35
52.2
%
- I
nte
rnational
12
48.0
%6
24.0
%5
20.0
%2
8.0
%25
37.3
%1
3.8
%2
7.7
%14
53.8
%5
19.2
%4
15.4
%26
38.8
%
To
tal
Ge
og
rap
hic
Sc
op
e34
50.7
%14
20.9
%13
19.4
%6
9.0
%67
100
.0%
11
.5%
71
0.4
%34
50.7
%17
25.4
%8
11.9
%67
100
.0%
Pro
jec
t S
ize
Cla
ss
ific
ati
on
- S
mall
(EU
R <
5 -
10 m
illio
n)
45
7.1
%2
28.6
%1
14.3
%0
0.0
%7
10.4
%0
0.0
%1
14.3
%4
57.1
%1
14.3
%1
14.3
%7
10.4
%
- M
ediu
m (
EU
R >
10 -
50 m
illio
n)
19
47.5
%9
22.5
%7
17.5
%5
12.5
%40
59.7
%0
0.0
%5
12.8
%19
48.7
%12
30.8
%3
7.7
%39
58.2
%
- L
arg
e (
EU
R >
50 -
250 m
illio
n)
11
55.0
%3
15.0
%5
25.0
%1
5.0
%20
29.9
%1
4.8
%1
4.8
%11
52.4
%4
19.0
%4
19.0
%21
31.3
%
To
tal
Pro
jec
t S
ize
Cla
ss
ific
ati
on
34
50.7
%14
20.9
%13
19.4
%6
9.0
%67
100
.0%
11
.5%
71
0.4
%34
50.7
%17
25.4
%8
11.9
%67
100
.0%
Do
n't
kn
ow
Nu
mb
er
of
Res
po
nse
s
Nu
mb
er
of
Res
po
nse
s
Ve
ry
Ine
ffe
cti
ve
Ine
ffe
cti
ve
Eff
ec
tive
Lo
wM
ed
ium
Hig
hV
ery
hig
hV
ery
eff
ec
tive
Ho
w s
ign
ific
an
t is
th
is r
isk
to
ac
hie
vin
g y
ou
r o
bje
cti
ve
s?
Ho
w e
ffe
cti
ve
are
yo
ur
pro
ce
ss
es
at
ma
nag
ing
th
is r
isk
?

240
7)
Ris
k is a
co
ncep
t u
sed
to
exp
ress u
ncert
ain
ty a
bo
ut
even
ts a
nd
/or
their
ou
tco
mes t
hat
co
uld
have a
mate
rial eff
ect
on
th
e g
oals
of
the c
om
pan
y.
P
lease e
valu
ate
th
e f
ollo
win
g r
isks o
n c
om
pan
y level re
gard
ing
th
eir
sig
nif
ican
ce t
o a
ch
ievin
g y
ou
r co
mp
an
y´s
ob
jecti
ves a
s w
ell a
s t
he e
ffecti
ven
ess o
f yo
ur
risk m
an
ag
em
en
t
p
rocesses t
o c
op
e w
ith
th
ose r
isks.
15 O
ther
To
tal
Res
po
nd
an
ts0
0.0
%0
0.0
%1
10
0.0
%0
0.0
%1
10
0.0
%0
0.0
%0
0.0
%1
10
0.0
%0
0.0
%0
0.0
%1
10
0.0
%
Deve
lop
er
Cla
ss
ific
ati
on
- M
ain
ly T
rader-
Develo
per
00
.0%
00
.0%
11
00
.0%
00
.0%
11
00
.0%
00
.0%
00
.0%
11
00
.0%
00
.0%
00
.0%
11
00
.0%
- M
ain
ly I
nvesto
r-D
evelo
per
00
.0%
00
.0%
00
.0%
00
.0%
00
.0%
00
.0%
00
.0%
00
.0%
00
.0%
00
.0%
00
.0%
To
tal
Deve
lop
er
Cla
ss
ific
ati
on
00
.0%
00
.0%
11
00
.0%
00
.0%
11
00
.0%
00
.0%
00
.0%
11
00
.0%
00
.0%
00
.0%
11
00
.0%
Ow
ners
hip
str
uctu
re -
Lis
ted
00
.0%
00
.0%
10
.0%
00
.0%
11
00
.0%
00
.0%
00
.0%
10
.0%
00
.0%
00
.0%
11
00
.0%
- U
nlis
ted
00
.0%
00
.0%
01
00
.0%
00
.0%
00
.0%
00
.0%
00
.0%
01
00
.0%
00
.0%
00
.0%
00
.0%
To
tal
Ow
ners
hip
Str
uctu
re0
0.0
%0
0.0
%1
100
.0%
00
.0%
11
00
.0%
00
.0%
00
.0%
11
00
.0%
00
.0%
00
.0%
11
00
.0%
Ge
og
rap
hic
Sc
op
e -
Regio
nal
00
.0%
00
.0%
10
.0%
00
.0%
11
00
.0%
00
.0%
00
.0%
10
.0%
00
.0%
00
.0%
11
00
.0%
- N
ational
00
.0%
00
.0%
01
00
.0%
00
.0%
00
.0%
00
.0%
00
.0%
01
00
.0%
00
.0%
00
.0%
00
.0%
- I
nte
rnational
00
.0%
00
.0%
00
.0%
00
.0%
00
.0%
00
.0%
00
.0%
00
.0%
00
.0%
00
.0%
00
.0%
To
tal
Ge
og
rap
hic
Sc
op
e0
0.0
%0
0.0
%1
100
.0%
00
.0%
11
00
.0%
00
.0%
00
.0%
11
00
.0%
00
.0%
00
.0%
11
00
.0%
Pro
jec
t S
ize
Cla
ss
ific
ati
on
- S
mall
(EU
R <
5 -
10 m
illio
n)
00
.0%
00
.0%
00
.0%
00
.0%
00
.0%
00
.0%
00
.0%
00
.0%
00
.0%
00
.0%
00
.0%
- M
ediu
m (
EU
R >
10 -
50 m
illio
n)
00
.0%
00
.0%
11
00
.0%
00
.0%
11
00
.0%
00
.0%
00
.0%
11
00
.0%
00
.0%
00
.0%
11
00
.0%
- L
arg
e (
EU
R >
50 -
250 m
illio
n)
00
.0%
00
.0%
00
.0%
00
.0%
00
.0%
00
.0%
00
.0%
00
.0%
00
.0%
00
.0%
00
.0%
To
tal
Pro
jec
t S
ize
Cla
ss
ific
ati
on
00
.0%
00
.0%
11
00
.0%
00
.0%
11
00
.0%
00
.0%
00
.0%
11
00
.0%
00
.0%
00
.0%
11
00
.0%
Ve
ry e
ffe
cti
ve
Hig
hV
ery
hig
hD
on
't k
no
wN
um
be
r o
f
Res
po
nse
s
Nu
mb
er
of
Res
po
nse
s
Ve
ry
Ine
ffe
cti
ve
Ine
ffe
cti
ve
Eff
ec
tive
Lo
wM
ed
ium
Ho
w s
ign
ific
an
t is
th
is r
isk
to
ac
hie
vin
g y
ou
r o
bje
cti
ve
s?
Ho
w e
ffe
cti
ve
are
yo
ur
pro
ce
ss
es
at
ma
nag
ing
th
is r
isk
?

241
8)
A l
arg
e n
um
be
r o
f ri
sks
, w
hic
h m
ay a
ffe
ct
the
pro
jec
ted
re
turn
, ari
se
du
rin
g p
roje
ct
de
ve
lop
me
nt.
Ple
as
e f
ind
be
low
a n
on
-ex
ha
us
tive
lis
t o
f th
es
e r
isk
s.
P
lease e
valu
ate
th
e f
ollo
win
g r
isks o
n p
roje
ct
level re
gard
ing
th
eir
sig
nif
ican
ce t
o a
ch
ievin
g y
ou
r co
mp
an
y´s
ob
jecti
ves a
s w
ell a
s t
he e
ffecti
ven
ess o
f yo
ur
risk m
an
ag
em
en
t
p
rocesses t
o c
op
e w
ith
th
ose r
isks.
1 D
eve
lop
me
nt/
co
nc
ep
tio
n r
isk
To
tal
Res
po
nd
an
ts8
12
.1%
16
24
.2%
31
47
.0%
11
16
.7%
66
10
0.0
%0
0.0
%2
3.1
%4
06
1.5
%2
03
0.8
%3
4.6
%6
51
00
.0%
Deve
lop
er
Cla
ss
ific
ati
on
- M
ain
ly T
rader-
Develo
per
38
.6%
72
0.0
%17
48.6
%8
22.9
%35
53.0
%0
0.0
%2
5.7
%17
48.6
%13
37.1
%3
8.6
%35
53.8
%
- M
ain
ly I
nvesto
r-D
evelo
per
51
6.1
%9
29.0
%14
45.2
%3
9.7
%31
47.0
%0
0.0
%0
0.0
%23
76.7
%7
23.3
%0
0.0
%30
46.2
%
To
tal
Deve
lop
er
Cla
ss
ific
ati
on
81
2.1
%16
24.2
%31
47.0
%11
16.7
%66
100
.0%
00
.0%
23
.1%
40
61.5
%20
30.8
%3
4.6
%65
100
.0%
Ow
ners
hip
str
uctu
re -
Lis
ted
31
5.0
%3
15.0
%10
50.0
%4
20.0
%20
30.3
%0
0.0
%1
5.0
%15
75.0
%4
20.0
%0
0.0
%20
30.8
%
- U
nlis
ted
51
0.9
%13
28.3
%21
45.7
%7
15.2
%46
69.7
%0
0.0
%1
2.2
%25
55.6
%16
35.6
%3
6.7
%45
69.2
%
To
tal
Ow
ners
hip
Str
uctu
re8
12.1
%16
24.2
%31
47.0
%11
16.7
%66
100
.0%
00
.0%
23
.1%
40
61.5
%20
30.8
%3
4.6
%65
100
.0%
Ge
og
rap
hic
Sc
op
e -
Regio
nal
00
.0%
11
6.7
%5
83.3
%0
0.0
%6
9.1
%0
0.0
%0
0.0
%4
66.7
%2
33.3
%0
0.0
%6
9.2
%
- N
ational
51
3.9
%10
27.8
%13
36.1
%8
22.2
%36
54.5
%0
0.0
%1
2.9
%21
60.0
%11
31.4
%2
5.7
%35
53.8
%
- I
nte
rnational
31
2.5
%5
20.8
%13
54.2
%3
12.5
%24
36.4
%0
0.0
%1
4.2
%15
62.5
%7
29.2
%1
4.2
%24
36.9
%
To
tal
Ge
og
rap
hic
Sc
op
e8
12.1
%16
24.2
%31
47.0
%11
16.7
%66
100
.0%
00
.0%
23
.1%
40
61.5
%20
30.8
%3
4.6
%65
100
.0%
Pro
jec
t S
ize
Cla
ss
ific
ati
on
- S
mall
(EU
R <
5 -
10 m
illio
n)
11
6.7
%1
16.7
%3
50.0
%1
16.7
%6
9.1
%0
0.0
%1
16.7
%3
50.0
%2
33.3
%0
0.0
%6
9.2
%
- M
ediu
m (
EU
R >
10 -
50 m
illio
n)
41
0.3
%8
20.5
%19
48.7
%8
20.5
%39
59.1
%0
0.0
%1
2.6
%25
65.8
%11
28.9
%1
2.6
%38
58.5
%
- L
arg
e (
EU
R >
50 -
250 m
illio
n)
31
4.3
%7
33.3
%9
42.9
%2
9.5
%21
31.8
%0
0.0
%0
0.0
%12
57.1
%7
33.3
%2
9.5
%21
32.3
%
To
tal
Pro
jec
t S
ize
Cla
ss
ific
ati
on
81
2.1
%16
24.2
%31
47.0
%11
16.7
%66
100
.0%
00
.0%
23
.1%
40
61.5
%20
30.8
%3
4.6
%65
100
.0%
Do
n't
kn
ow
Nu
mb
er
of
Res
po
nse
s
Nu
mb
er
of
Res
po
nse
s
Ve
ry
Ine
ffe
cti
ve
Ine
ffe
cti
ve
Eff
ec
tive
Lo
wM
ed
ium
Hig
hV
ery
hig
hV
ery
eff
ec
tive
Ho
w s
ign
ific
an
t is
th
is r
isk
to
ac
hie
vin
g y
ou
r o
bje
cti
ve
s?
Ho
w e
ffe
cti
ve
are
yo
ur
pro
ce
ss
es
at
ma
nag
ing
th
is r
isk
?

242
8)
A larg
e n
um
ber
of
risks, w
hic
h m
ay a
ffect
the p
roje
cte
d r
etu
rn, ari
se d
uri
ng
pro
ject
develo
pm
en
t. P
lease f
ind
belo
w a
no
n-e
xh
au
sti
ve lis
t o
f th
ese r
isks.
P
lease e
valu
ate
th
e f
ollo
win
g r
isks o
n p
roje
ct
level re
gard
ing
th
eir
sig
nif
ican
ce t
o a
ch
ievin
g y
ou
r co
mp
an
y´s
ob
jecti
ves a
s w
ell a
s t
he e
ffecti
ven
ess o
f yo
ur
risk m
an
ag
em
en
t
p
rocesses t
o c
op
e w
ith
th
ose r
isks.
2 L
ocati
on
ris
k
To
tal
Res
po
nd
an
ts9
13
.8%
15
23
.1%
29
44
.6%
12
18
.5%
65
10
0.0
%0
0.0
%4
6.3
%3
65
6.3
%2
23
4.4
%2
3.1
%6
41
00
.0%
Deve
lop
er
Cla
ss
ific
ati
on
- M
ain
ly T
rader-
Develo
per
61
7.6
%8
23.5
%12
35.3
%8
23.5
%34
52.3
%0
0.0
%3
8.8
%16
47.1
%13
38.2
%2
5.9
%34
53.1
%
- M
ain
ly I
nvesto
r-D
evelo
per
39
.7%
72
2.6
%17
54.8
%4
12.9
%31
47.7
%0
0.0
%1
3.3
%20
66.7
%9
30.0
%0
0.0
%30
46.9
%
To
tal
Deve
lop
er
Cla
ss
ific
ati
on
91
3.8
%15
23.1
%29
44.6
%12
18.5
%65
100
.0%
00
.0%
46
.3%
36
56.3
%22
34.4
%2
3.1
%64
100
.0%
Ow
ners
hip
str
uctu
re -
Lis
ted
31
5.0
%3
15.0
%10
50.0
%4
20.0
%20
30.8
%0
0.0
%3
15.0
%13
65.0
%4
20.0
%0
0.0
%20
31.3
%
- U
nlis
ted
61
3.3
%12
26.7
%19
42.2
%8
17.8
%45
69.2
%0
0.0
%1
2.3
%23
52.3
%18
40.9
%2
4.5
%44
68.8
%
To
tal
Ow
ners
hip
Str
uctu
re9
13.8
%15
23.1
%29
44.6
%12
18.5
%65
100
.0%
00
.0%
46
.3%
36
56.3
%22
34.4
%2
3.1
%64
100
.0%
Ge
og
rap
hic
Sc
op
e -
Regio
nal
00
.0%
11
6.7
%4
66.7
%1
16.7
%6
9.2
%0
0.0
%2
33.3
%3
50.0
%1
16.7
%0
0.0
%6
9.4
%
- N
ational
72
0.0
%7
20.0
%16
45.7
%5
14.3
%35
53.8
%0
0.0
%1
2.9
%17
50.0
%15
44.1
%1
2.9
%34
53.1
%
- I
nte
rnational
28
.3%
72
9.2
%9
37.5
%6
25.0
%24
36.9
%0
0.0
%1
4.2
%16
66.7
%6
25.0
%1
4.2
%24
37.5
%
To
tal
Ge
og
rap
hic
Sc
op
e9
13.8
%15
23.1
%29
44.6
%12
18.5
%65
100
.0%
00
.0%
46
.3%
36
56.3
%22
34.4
%2
3.1
%64
100
.0%
Pro
jec
t S
ize
Cla
ss
ific
ati
on
- S
mall
(EU
R <
5 -
10 m
illio
n)
23
3.3
%0
0.0
%3
50.0
%1
16.7
%6
9.2
%0
0.0
%2
33.3
%3
50.0
%1
16.7
%0
0.0
%6
9.4
%
- M
ediu
m (
EU
R >
10 -
50 m
illio
n)
51
3.2
%6
15.8
%19
50.0
%8
21.1
%38
58.5
%0
0.0
%2
5.4
%20
54.1
%15
40.5
%0
0.0
%37
57.8
%
- L
arg
e (
EU
R >
50 -
250 m
illio
n)
29
.5%
94
2.9
%7
33.3
%3
14.3
%21
32.3
%0
0.0
%0
0.0
%13
61.9
%6
28.6
%2
9.5
%21
32.8
%
To
tal
Pro
jec
t S
ize
Cla
ss
ific
ati
on
91
3.8
%15
23.1
%29
44.6
%12
18.5
%65
100
.0%
00
.0%
46
.3%
36
56.3
%22
34.4
%2
3.1
%64
100
.0%
Ve
ry e
ffe
cti
ve
Hig
hV
ery
hig
hD
on
't k
no
wN
um
be
r o
f
Res
po
nse
s
Nu
mb
er
of
Res
po
nse
s
Ve
ry
Ine
ffe
cti
ve
Ine
ffe
cti
ve
Eff
ec
tive
Lo
wM
ed
ium
Ho
w s
ign
ific
an
t is
th
is r
isk
to
ac
hie
vin
g y
ou
r o
bje
cti
ve
s?
Ho
w e
ffe
cti
ve
are
yo
ur
pro
ce
ss
es
at
ma
nag
ing
th
is r
isk
?

243
8)
A larg
e n
um
ber
of
risks, w
hic
h m
ay a
ffect
the p
roje
cte
d r
etu
rn, ari
se d
uri
ng
pro
ject
develo
pm
en
t. P
lease f
ind
belo
w a
no
n-e
xh
au
sti
ve lis
t o
f th
ese r
isks.
P
lease e
valu
ate
th
e f
ollo
win
g r
isks o
n p
roje
ct
level re
gard
ing
th
eir
sig
nif
ican
ce t
o a
ch
ievin
g y
ou
r co
mp
an
y´s
ob
jecti
ves a
s w
ell a
s t
he e
ffecti
ven
ess o
f yo
ur
risk m
an
ag
em
en
t
p
rocesses t
o c
op
e w
ith
th
ose r
isks.
3 A
deaq
uate
so
urc
es o
f fu
nd
s f
or
develo
pm
en
t p
roje
ct
To
tal
Res
po
nd
an
ts1
92
8.8
%2
13
1.8
%2
13
1.8
%5
7.6
%6
61
00
.0%
00
.0%
57
.7%
31
47
.7%
27
41
.5%
23
.1%
65
10
0.0
%
Deve
lop
er
Cla
ss
ific
ati
on
- M
ain
ly T
rader-
Develo
per
92
5.7
%10
28.6
%12
34.3
%4
11.4
%35
53.0
%0
0.0
%3
8.6
%17
48.6
%13
37.1
%2
5.7
%35
53.8
%
- M
ain
ly I
nvesto
r-D
evelo
per
10
32.3
%11
35.5
%9
29.0
%1
3.2
%31
47.0
%0
0.0
%2
6.7
%14
46.7
%14
46.7
%0
0.0
%30
46.2
%
To
tal
Deve
lop
er
Cla
ss
ific
ati
on
19
28.8
%21
31.8
%21
31.8
%5
7.6
%66
100
.0%
00
.0%
57
.7%
31
47.7
%27
41.5
%2
3.1
%65
100
.0%
Ow
ners
hip
str
uctu
re -
Lis
ted
52
5.0
%9
45.0
%5
25.0
%1
5.0
%20
30.3
%0
0.0
%0
0.0
%12
60.0
%8
40.0
%0
0.0
%20
30.8
%
- U
nlis
ted
14
30.4
%12
26.1
%16
34.8
%4
8.7
%46
69.7
%0
0.0
%5
11.1
%19
42.2
%19
42.2
%2
4.4
%45
69.2
%
To
tal
Ow
ners
hip
Str
uctu
re19
28.8
%21
31.8
%21
31.8
%5
7.6
%66
100
.0%
00
.0%
57
.7%
31
47.7
%27
41.5
%2
3.1
%65
100
.0%
Ge
og
rap
hic
Sc
op
e -
Regio
nal
00
.0%
46
6.7
%1
16.7
%1
16.7
%6
9.1
%0
0.0
%0
0.0
%3
50.0
%3
50.0
%0
0.0
%6
9.2
%
- N
ational
13
36.1
%8
22.2
%13
36.1
%2
5.6
%36
54.5
%0
0.0
%2
5.7
%18
51.4
%14
40.0
%1
2.9
%35
53.8
%
- I
nte
rnational
62
5.0
%9
37.5
%7
29.2
%2
8.3
%24
36.4
%0
0.0
%3
12.5
%10
41.7
%10
41.7
%1
4.2
%24
36.9
%
To
tal
Ge
og
rap
hic
Sc
op
e19
28.8
%21
31.8
%21
31.8
%5
7.6
%66
100
.0%
00
.0%
57
.7%
31
47.7
%27
41.5
%2
3.1
%65
100
.0%
Pro
jec
t S
ize
Cla
ss
ific
ati
on
- S
mall
(EU
R <
5 -
10 m
illio
n)
23
3.3
%2
33.3
%1
16.7
%1
16.7
%6
9.1
%0
0.0
%0
0.0
%3
50.0
%3
50.0
%0
0.0
%6
9.2
%
- M
ediu
m (
EU
R >
10 -
50 m
illio
n)
11
28.2
%9
23.1
%16
41.0
%3
7.7
%39
59.1
%0
0.0
%2
5.3
%20
52.6
%16
42.1
%0
0.0
%38
58.5
%
- L
arg
e (
EU
R >
50 -
250 m
illio
n)
62
8.6
%10
47.6
%4
19.0
%1
4.8
%21
31.8
%0
0.0
%3
14.3
%8
38.1
%8
38.1
%2
9.5
%21
32.3
%
To
tal
Pro
jec
t S
ize
Cla
ss
ific
ati
on
19
28.8
%21
31.8
%21
31.8
%5
7.6
%66
100
.0%
00
.0%
57
.7%
31
47.7
%27
41.5
%2
3.1
%65
100
.0%
Do
n't
kn
ow
Nu
mb
er
of
Res
po
nse
s
Nu
mb
er
of
Res
po
nse
s
Ve
ry
Ine
ffe
cti
ve
Ine
ffe
cti
ve
Eff
ec
tive
Lo
wM
ed
ium
Hig
hV
ery
hig
hV
ery
eff
ec
tive
Ho
w s
ign
ific
an
t is
th
is r
isk
to
ac
hie
vin
g y
ou
r o
bje
cti
ve
s?
Ho
w e
ffe
cti
ve
are
yo
ur
pro
ce
ss
es
at
ma
nag
ing
th
is r
isk
?

244
8)
A larg
e n
um
ber
of
risks, w
hic
h m
ay a
ffect
the p
roje
cte
d r
etu
rn, ari
se d
uri
ng
pro
ject
develo
pm
en
t. P
lease f
ind
belo
w a
no
n-e
xh
au
sti
ve lis
t o
f th
ese r
isks.
P
lease e
valu
ate
th
e f
ollo
win
g r
isks o
n p
roje
ct
level re
gard
ing
th
eir
sig
nif
ican
ce t
o a
ch
ievin
g y
ou
r co
mp
an
y´s
ob
jecti
ves a
s w
ell a
s t
he e
ffecti
ven
ess o
f yo
ur
risk m
an
ag
em
en
t
p
rocesses t
o c
op
e w
ith
th
ose r
isks.
4 F
irst-
tim
e leasin
g r
isk
To
tal
Res
po
nd
an
ts1
01
5.6
%1
72
6.6
%2
84
3.8
%9
14
.1%
64
10
0.0
%0
0.0
%6
9.2
%4
06
1.5
%1
42
1.5
%5
7.7
%6
51
00
.0%
Deve
lop
er
Cla
ss
ific
ati
on
- M
ain
ly T
rader-
Develo
per
51
5.2
%10
30.3
%13
39.4
%5
15.2
%33
51.6
%0
0.0
%2
5.7
%18
51.4
%10
28.6
%5
14.3
%35
53.8
%
- M
ain
ly I
nvesto
r-D
evelo
per
51
6.1
%7
22.6
%15
48.4
%4
12.9
%31
48.4
%0
0.0
%4
13.3
%22
73.3
%4
13.3
%0
0.0
%30
46.2
%
To
tal
Deve
lop
er
Cla
ss
ific
ati
on
10
15.6
%17
26.6
%28
43.8
%9
14.1
%64
100
.0%
00
.0%
69
.2%
40
61.5
%14
21.5
%5
7.7
%65
100
.0%
Ow
ners
hip
str
uctu
re -
Lis
ted
21
0.5
%6
31.6
%7
36.8
%4
21.1
%19
29.7
%0
0.0
%1
5.0
%14
70.0
%3
15.0
%2
10.0
%20
30.8
%
- U
nlis
ted
81
7.8
%11
24.4
%21
46.7
%5
11.1
%45
70.3
%0
0.0
%5
11.1
%26
57.8
%11
24.4
%3
6.7
%45
69.2
%
To
tal
Ow
ners
hip
Str
uctu
re10
15.6
%17
26.6
%28
43.8
%9
14.1
%64
100
.0%
00
.0%
69
.2%
40
61.5
%14
21.5
%5
7.7
%65
100
.0%
Ge
og
rap
hic
Sc
op
e -
Regio
nal
00
.0%
00
.0%
58
3.3
%1
16.7
%6
9.4
%0
0.0
%2
33.3
%3
50.0
%1
16.7
%0
0.0
%6
9.2
%
- N
ational
61
7.1
%10
28.6
%13
37.1
%6
17.1
%35
54.7
%0
0.0
%1
2.9
%23
65.7
%8
22.9
%3
8.6
%35
53.8
%
- I
nte
rnational
41
7.4
%7
30.4
%10
43.5
%2
8.7
%23
35.9
%0
0.0
%3
12.5
%14
58.3
%5
20.8
%2
8.3
%24
36.9
%
To
tal
Ge
og
rap
hic
Sc
op
e10
15.6
%17
26.6
%28
43.8
%9
14.1
%64
100
.0%
00
.0%
69
.2%
40
61.5
%14
21.5
%5
7.7
%65
100
.0%
Pro
jec
t S
ize
Cla
ss
ific
ati
on
- S
mall
(EU
R <
5 -
10 m
illio
n)
23
3.3
%0
0.0
%3
50.0
%1
16.7
%6
9.4
%0
0.0
%1
16.7
%4
66.7
%1
16.7
%0
0.0
%6
9.2
%
- M
ediu
m (
EU
R >
10 -
50 m
illio
n)
51
2.8
%12
30.8
%16
41.0
%6
15.4
%39
60.9
%0
0.0
%4
10.5
%22
57.9
%10
26.3
%2
5.3
%38
58.5
%
- L
arg
e (
EU
R >
50 -
250 m
illio
n)
31
5.8
%5
26.3
%9
47.4
%2
10.5
%19
29.7
%0
0.0
%1
4.8
%14
66.7
%3
14.3
%3
14.3
%21
32.3
%
To
tal
Pro
jec
t S
ize
Cla
ss
ific
ati
on
10
15.6
%17
26.6
%28
43.8
%9
14.1
%64
100
.0%
00
.0%
69
.2%
40
61.5
%14
21.5
%5
7.7
%65
100
.0%
Ve
ry e
ffe
cti
ve
Hig
hV
ery
hig
hD
on
't k
no
wN
um
be
r o
f
Res
po
nse
s
Nu
mb
er
of
Res
po
nse
s
Ve
ry
Ine
ffe
cti
ve
Ine
ffe
cti
ve
Eff
ec
tive
Lo
wM
ed
ium
Ho
w s
ign
ific
an
t is
th
is r
isk
to
ac
hie
vin
g y
ou
r o
bje
cti
ve
s?
Ho
w e
ffe
cti
ve
are
yo
ur
pro
ce
ss
es
at
ma
nag
ing
th
is r
isk
?

245
8)
A larg
e n
um
ber
of
risks, w
hic
h m
ay a
ffect
the p
roje
cte
d r
etu
rn, ari
se d
uri
ng
pro
ject
develo
pm
en
t. P
lease f
ind
belo
w a
no
n-e
xh
au
sti
ve lis
t o
f th
ese r
isks.
P
lease e
valu
ate
th
e f
ollo
win
g r
isks o
n p
roje
ct
level re
gard
ing
th
eir
sig
nif
ican
ce t
o a
ch
ievin
g y
ou
r co
mp
an
y´s
ob
jecti
ves a
s w
ell a
s t
he e
ffecti
ven
ess o
f yo
ur
risk m
an
ag
em
en
t
p
rocesses t
o c
op
e w
ith
th
ose r
isks.
5 M
ark
et
po
ten
tial o
n s
ale
/dis
po
sal o
f p
roje
ct
(mark
et
risk)
To
tal
Res
po
nd
an
ts5
7.6
%2
13
1.8
%2
94
3.9
%1
11
6.7
%6
61
00
.0%
00
.0%
91
3.8
%4
16
3.1
%1
32
0.0
%2
3.1
%6
51
00
.0%
Deve
lop
er
Cla
ss
ific
ati
on
- M
ain
ly T
rader-
Develo
per
12
.9%
12
34.3
%18
51.4
%4
11.4
%35
53.0
%0
0.0
%4
11.4
%22
62.9
%7
20.0
%2
5.7
%35
53.8
%
- M
ain
ly I
nvesto
r-D
evelo
per
41
2.9
%9
29.0
%11
35.5
%7
22.6
%31
47.0
%0
0.0
%5
16.7
%19
63.3
%6
20.0
%0
0.0
%30
46.2
%
To
tal
Deve
lop
er
Cla
ss
ific
ati
on
57
.6%
21
31.8
%29
43.9
%11
16.7
%66
100
.0%
00
.0%
91
3.8
%41
63.1
%13
20.0
%2
3.1
%65
100
.0%
Ow
ners
hip
str
uctu
re -
Lis
ted
15
.0%
73
5.0
%9
45.0
%3
15.0
%20
30.3
%0
0.0
%2
10.0
%15
75.0
%3
15.0
%0
0.0
%20
30.8
%
- U
nlis
ted
48
.7%
14
30.4
%20
43.5
%8
17.4
%46
69.7
%0
0.0
%7
15.6
%26
57.8
%10
22.2
%2
4.4
%45
69.2
%
To
tal
Ow
ners
hip
Str
uctu
re5
7.6
%21
31.8
%29
43.9
%11
16.7
%66
100
.0%
00
.0%
91
3.8
%41
63.1
%13
20.0
%2
3.1
%65
100
.0%
Ge
og
rap
hic
Sc
op
e -
Regio
nal
00
.0%
11
6.7
%3
50.0
%2
33.3
%6
9.1
%0
0.0
%1
16.7
%5
83.3
%0
0.0
%0
0.0
%6
9.2
%
- N
ational
25
.6%
13
36.1
%13
36.1
%8
22.2
%36
54.5
%0
0.0
%2
5.7
%24
68.6
%8
22.9
%1
2.9
%35
53.8
%
- I
nte
rnational
31
2.5
%7
29.2
%13
54.2
%1
4.2
%24
36.4
%0
0.0
%6
25.0
%12
50.0
%5
20.8
%1
4.2
%24
36.9
%
To
tal
Ge
og
rap
hic
Sc
op
e5
7.6
%21
31.8
%29
43.9
%11
16.7
%66
100
.0%
00
.0%
91
3.8
%41
63.1
%13
20.0
%2
3.1
%65
100
.0%
Pro
jec
t S
ize
Cla
ss
ific
ati
on
- S
mall
(EU
R <
5 -
10 m
illio
n)
00
.0%
11
6.7
%5
83.3
%0
0.0
%6
9.1
%0
0.0
%2
33.3
%4
66.7
%0
0.0
%0
0.0
%6
9.2
%
- M
ediu
m (
EU
R >
10 -
50 m
illio
n)
25
.1%
12
30.8
%16
41.0
%9
23.1
%39
59.1
%0
0.0
%6
15.8
%25
65.8
%7
18.4
%0
0.0
%38
58.5
%
- L
arg
e (
EU
R >
50 -
250 m
illio
n)
31
4.3
%8
38.1
%8
38.1
%2
9.5
%21
31.8
%0
0.0
%1
4.8
%12
57.1
%6
28.6
%2
9.5
%21
32.3
%
To
tal
Pro
jec
t S
ize
Cla
ss
ific
ati
on
57
.6%
21
31.8
%29
43.9
%11
16.7
%66
100
.0%
00
.0%
91
3.8
%41
63.1
%13
20.0
%2
3.1
%65
100
.0%
Do
n't
kn
ow
Nu
mb
er
of
Res
po
nse
s
Nu
mb
er
of
Res
po
nse
s
Ve
ry
Ine
ffe
cti
ve
Ine
ffe
cti
ve
Eff
ec
tive
Lo
wM
ed
ium
Hig
hV
ery
hig
hV
ery
eff
ec
tive
Ho
w s
ign
ific
an
t is
th
is r
isk
to
ac
hie
vin
g y
ou
r o
bje
cti
ve
s?
Ho
w e
ffe
cti
ve
are
yo
ur
pro
ce
ss
es
at
ma
nag
ing
th
is r
isk
?

246
8)
A larg
e n
um
ber
of
risks, w
hic
h m
ay a
ffect
the p
roje
cte
d r
etu
rn, ari
se d
uri
ng
pro
ject
develo
pm
en
t. P
lease f
ind
belo
w a
no
n-e
xh
au
sti
ve lis
t o
f th
ese r
isks.
P
lease e
valu
ate
th
e f
ollo
win
g r
isks o
n p
roje
ct
level re
gard
ing
th
eir
sig
nif
ican
ce t
o a
ch
ievin
g y
ou
r co
mp
an
y´s
ob
jecti
ves a
s w
ell a
s t
he e
ffecti
ven
ess o
f yo
ur
risk m
an
ag
em
en
t
p
rocesses t
o c
op
e w
ith
th
ose r
isks.
6 C
han
ges in
user´
s / in
vesto
r´s r
eq
uir
em
en
ts
To
tal
Res
po
nd
an
ts1
32
0.3
%3
85
9.4
%9
14
.1%
46
.3%
64
10
0.0
%1
1.5
%6
9.2
%3
65
5.4
%1
42
1.5
%8
12
.3%
65
10
0.0
%
Deve
lop
er
Cla
ss
ific
ati
on
- M
ain
ly T
rader-
Develo
per
61
7.6
%22
64.7
%4
11.8
%2
5.9
%34
53.1
%1
2.9
%1
2.9
%18
51.4
%9
25.7
%6
17.1
%35
53.8
%
- M
ain
ly I
nvesto
r-D
evelo
per
72
3.3
%16
53.3
%5
16.7
%2
6.7
%30
46.9
%0
0.0
%5
16.7
%18
60.0
%5
16.7
%2
6.7
%30
46.2
%
To
tal
Deve
lop
er
Cla
ss
ific
ati
on
13
20.3
%38
59.4
%9
14.1
%4
6.3
%64
100
.0%
11
.5%
69
.2%
36
55.4
%14
21.5
%8
12.3
%65
100
.0%
Ow
ners
hip
str
uctu
re -
Lis
ted
63
3.3
%11
61.1
%0
0.0
%1
5.6
%18
28.1
%0
0.0
%1
5.0
%13
65.0
%2
10.0
%4
20.0
%20
30.8
%
- U
nlis
ted
71
5.2
%27
58.7
%9
19.6
%3
6.5
%46
71.9
%1
2.2
%5
11.1
%23
51.1
%12
26.7
%4
8.9
%45
69.2
%
To
tal
Ow
ners
hip
Str
uctu
re13
20.3
%38
59.4
%9
14.1
%4
6.3
%64
100
.0%
11
.5%
69
.2%
36
55.4
%14
21.5
%8
12.3
%65
100
.0%
Ge
og
rap
hic
Sc
op
e -
Regio
nal
12
0.0
%4
80.0
%0
0.0
%0
0.0
%5
7.8
%0
0.0
%1
16.7
%4
66.7
%0
0.0
%1
16.7
%6
9.2
%
- N
ational
61
6.7
%21
58.3
%6
16.7
%3
8.3
%36
56.3
%1
2.9
%2
5.7
%20
57.1
%8
22.9
%4
11.4
%35
53.8
%
- I
nte
rnational
62
6.1
%13
56.5
%3
13.0
%1
4.3
%23
35.9
%0
0.0
%3
12.5
%12
50.0
%6
25.0
%3
12.5
%24
36.9
%
To
tal
Ge
og
rap
hic
Sc
op
e13
20.3
%38
59.4
%9
14.1
%4
6.3
%64
100
.0%
11
.5%
69
.2%
36
55.4
%14
21.5
%8
12.3
%65
100
.0%
Pro
jec
t S
ize
Cla
ss
ific
ati
on
- S
mall
(EU
R <
5 -
10 m
illio
n)
12
0.0
%4
80.0
%0
0.0
%0
0.0
%5
7.8
%0
0.0
%0
0.0
%5
83.3
%0
0.0
%1
16.7
%6
9.2
%
- M
ediu
m (
EU
R >
10 -
50 m
illio
n)
82
0.5
%21
53.8
%7
17.9
%3
7.7
%39
60.9
%1
2.6
%4
10.5
%20
52.6
%10
26.3
%3
7.9
%38
58.5
%
- L
arg
e (
EU
R >
50 -
250 m
illio
n)
42
0.0
%13
65.0
%2
10.0
%1
5.0
%20
31.3
%0
0.0
%2
9.5
%11
52.4
%4
19.0
%4
19.0
%21
32.3
%
To
tal
Pro
jec
t S
ize
Cla
ss
ific
ati
on
13
20.3
%38
59.4
%9
14.1
%4
6.3
%64
100
.0%
11
.5%
69
.2%
36
55.4
%14
21.5
%8
12.3
%65
100
.0%
Ve
ry e
ffe
cti
ve
Hig
hV
ery
hig
hD
on
't k
no
wN
um
be
r o
f
Res
po
nse
s
Nu
mb
er
of
Res
po
nse
s
Ve
ry
Ine
ffe
cti
ve
Ine
ffe
cti
ve
Eff
ec
tive
Lo
wM
ed
ium
Ho
w s
ign
ific
an
t is
th
is r
isk
to
ac
hie
vin
g y
ou
r o
bje
cti
ve
s?
Ho
w e
ffe
cti
ve
are
yo
ur
pro
ce
ss
es
at
ma
nag
ing
th
is r
isk
?

247
8)
A larg
e n
um
ber
of
risks, w
hic
h m
ay a
ffect
the p
roje
cte
d r
etu
rn, ari
se d
uri
ng
pro
ject
develo
pm
en
t. P
lease f
ind
belo
w a
no
n-e
xh
au
sti
ve lis
t o
f th
ese r
isks.
P
lease e
valu
ate
th
e f
ollo
win
g r
isks o
n p
roje
ct
level re
gard
ing
th
eir
sig
nif
ican
ce t
o a
ch
ievin
g y
ou
r co
mp
an
y´s
ob
jecti
ves a
s w
ell a
s t
he e
ffecti
ven
ess o
f yo
ur
risk m
an
ag
em
en
t
p
rocesses t
o c
op
e w
ith
th
ose r
isks.
7 C
om
ple
tio
n r
isk
To
tal
Res
po
nd
an
ts2
64
0.0
%2
13
2.3
%1
32
0.0
%5
7.7
%6
51
00
.0%
00
.0%
69
.2%
32
49
.2%
22
33
.8%
57
.7%
65
10
0.0
%
Deve
lop
er
Cla
ss
ific
ati
on
- M
ain
ly T
rader-
Develo
per
13
38.2
%10
29.4
%8
23.5
%3
8.8
%34
52.3
%0
0.0
%4
11.4
%14
40.0
%12
34.3
%5
14.3
%35
53.8
%
- M
ain
ly I
nvesto
r-D
evelo
per
13
41.9
%11
35.5
%5
16.1
%2
6.5
%31
47.7
%0
0.0
%2
6.7
%18
60.0
%10
33.3
%0
0.0
%30
46.2
%
To
tal
Deve
lop
er
Cla
ss
ific
ati
on
26
40.0
%21
32.3
%13
20.0
%5
7.7
%65
100
.0%
00
.0%
69
.2%
32
49.2
%22
33.8
%5
7.7
%65
100
.0%
Ow
ners
hip
str
uctu
re -
Lis
ted
94
7.4
%4
21.1
%3
15.8
%3
15.8
%19
29.2
%0
0.0
%1
5.0
%12
60.0
%4
20.0
%3
15.0
%20
30.8
%
- U
nlis
ted
17
37.0
%17
37.0
%10
21.7
%2
4.3
%46
70.8
%0
0.0
%5
11.1
%20
44.4
%18
40.0
%2
4.4
%45
69.2
%
To
tal
Ow
ners
hip
Str
uctu
re26
40.0
%21
32.3
%13
20.0
%5
7.7
%65
100
.0%
00
.0%
69
.2%
32
49.2
%22
33.8
%5
7.7
%65
100
.0%
Ge
og
rap
hic
Sc
op
e -
Regio
nal
11
6.7
%1
16.7
%2
33.3
%2
33.3
%6
9.2
%0
0.0
%1
16.7
%3
50.0
%2
33.3
%0
0.0
%6
9.2
%
- N
ational
16
44.4
%13
36.1
%5
13.9
%2
5.6
%36
55.4
%0
0.0
%2
5.7
%19
54.3
%12
34.3
%2
5.7
%35
53.8
%
- I
nte
rnational
93
9.1
%7
30.4
%6
26.1
%1
4.3
%23
35.4
%0
0.0
%3
12.5
%10
41.7
%8
33.3
%3
12.5
%24
36.9
%
To
tal
Ge
og
rap
hic
Sc
op
e26
40.0
%21
32.3
%13
20.0
%5
7.7
%65
100
.0%
00
.0%
69
.2%
32
49.2
%22
33.8
%5
7.7
%65
100
.0%
Pro
jec
t S
ize
Cla
ss
ific
ati
on
- S
mall
(EU
R <
5 -
10 m
illio
n)
35
0.0
%1
16.7
%2
33.3
%0
0.0
%6
9.2
%0
0.0
%0
0.0
%4
66.7
%2
33.3
%0
0.0
%6
9.2
%
- M
ediu
m (
EU
R >
10 -
50 m
illio
n)
14
35.9
%13
33.3
%8
20.5
%4
10.3
%39
60.0
%0
0.0
%5
13.2
%19
50.0
%13
34.2
%1
2.6
%38
58.5
%
- L
arg
e (
EU
R >
50 -
250 m
illio
n)
94
5.0
%7
35.0
%3
15.0
%1
5.0
%20
30.8
%0
0.0
%1
4.8
%9
42.9
%7
33.3
%4
19.0
%21
32.3
%
To
tal
Pro
jec
t S
ize
Cla
ss
ific
ati
on
26
40.0
%21
32.3
%13
20.0
%5
7.7
%65
100
.0%
00
.0%
69
.2%
32
49.2
%22
33.8
%5
7.7
%65
100
.0%
Do
n't
kn
ow
Nu
mb
er
of
Res
po
nse
s
Nu
mb
er
of
Res
po
nse
s
Ve
ry
Ine
ffe
cti
ve
Ine
ffe
cti
ve
Eff
ec
tive
Lo
wM
ed
ium
Hig
hV
ery
hig
hV
ery
eff
ec
tive
Ho
w s
ign
ific
an
t is
th
is r
isk
to
ac
hie
vin
g y
ou
r o
bje
cti
ve
s?
Ho
w e
ffe
cti
ve
are
yo
ur
pro
ce
ss
es
at
ma
nag
ing
th
is r
isk
?

248
8)
A larg
e n
um
ber
of
risks, w
hic
h m
ay a
ffect
the p
roje
cte
d r
etu
rn, ari
se d
uri
ng
pro
ject
develo
pm
en
t. P
lease f
ind
belo
w a
no
n-e
xh
au
sti
ve lis
t o
f th
ese r
isks.
P
lease e
valu
ate
th
e f
ollo
win
g r
isks o
n p
roje
ct
level re
gard
ing
th
eir
sig
nif
ican
ce t
o a
ch
ievin
g y
ou
r co
mp
an
y´s
ob
jecti
ves a
s w
ell a
s t
he e
ffecti
ven
ess o
f yo
ur
risk m
an
ag
em
en
t
p
rocesses t
o c
op
e w
ith
th
ose r
isks.
8 C
ost
overu
n r
isk
To
tal
Res
po
nd
an
ts1
52
2.7
%3
04
5.5
%1
72
5.8
%4
6.1
%6
61
00
.0%
00
.0%
57
.7%
39
60
.0%
18
27
.7%
34
.6%
65
10
0.0
%
Deve
lop
er
Cla
ss
ific
ati
on
- M
ain
ly T
rader-
Develo
per
92
5.7
%12
34.3
%12
34.3
%2
5.7
%35
53.0
%0
0.0
%4
11.4
%18
51.4
%10
28.6
%3
8.6
%35
53.8
%
- M
ain
ly I
nvesto
r-D
evelo
per
61
9.4
%18
58.1
%5
16.1
%2
6.5
%31
47.0
%0
0.0
%1
3.3
%21
70.0
%8
26.7
%0
0.0
%30
46.2
%
To
tal
Deve
lop
er
Cla
ss
ific
ati
on
15
22.7
%30
45.5
%17
25.8
%4
6.1
%66
100
.0%
00
.0%
57
.7%
39
60.0
%18
27.7
%3
4.6
%65
100
.0%
Ow
ners
hip
str
uctu
re -
Lis
ted
63
0.0
%7
35.0
%4
20.0
%3
15.0
%20
30.3
%0
0.0
%3
15.0
%13
65.0
%3
15.0
%1
5.0
%20
30.8
%
- U
nlis
ted
91
9.6
%23
50.0
%13
28.3
%1
2.2
%46
69.7
%0
0.0
%2
4.4
%26
57.8
%15
33.3
%2
4.4
%45
69.2
%
To
tal
Ow
ners
hip
Str
uctu
re15
22.7
%30
45.5
%17
25.8
%4
6.1
%66
100
.0%
00
.0%
57
.7%
39
60.0
%18
27.7
%3
4.6
%65
100
.0%
Ge
og
rap
hic
Sc
op
e -
Regio
nal
00
.0%
35
0.0
%2
33.3
%1
16.7
%6
9.1
%0
0.0
%0
0.0
%5
83.3
%1
16.7
%0
0.0
%6
9.2
%
- N
ational
92
5.0
%15
41.7
%9
25.0
%3
8.3
%36
54.5
%0
0.0
%3
8.6
%21
60.0
%10
28.6
%1
2.9
%35
53.8
%
- I
nte
rnational
62
5.0
%12
50.0
%6
25.0
%0
0.0
%24
36.4
%0
0.0
%2
8.3
%13
54.2
%7
29.2
%2
8.3
%24
36.9
%
To
tal
Ge
og
rap
hic
Sc
op
e15
22.7
%30
45.5
%17
25.8
%4
6.1
%66
100
.0%
00
.0%
57
.7%
39
60.0
%18
27.7
%3
4.6
%65
100
.0%
Pro
jec
t S
ize
Cla
ss
ific
ati
on
- S
mall
(EU
R <
5 -
10 m
illio
n)
11
6.7
%4
66.7
%1
16.7
%0
0.0
%6
9.1
%0
0.0
%0
0.0
%5
83.3
%1
16.7
%0
0.0
%6
9.2
%
- M
ediu
m (
EU
R >
10 -
50 m
illio
n)
92
3.1
%14
35.9
%12
30.8
%4
10.3
%39
59.1
%0
0.0
%4
10.5
%23
60.5
%11
28.9
%0
0.0
%38
58.5
%
- L
arg
e (
EU
R >
50 -
250 m
illio
n)
52
3.8
%12
57.1
%4
19.0
%0
0.0
%21
31.8
%0
0.0
%1
4.8
%11
52.4
%6
28.6
%3
14.3
%21
32.3
%
To
tal
Pro
jec
t S
ize
Cla
ss
ific
ati
on
15
22.7
%30
45.5
%17
25.8
%4
6.1
%66
100
.0%
00
.0%
57
.7%
39
60.0
%18
27.7
%3
4.6
%65
100
.0%
Ve
ry e
ffe
cti
ve
Hig
hV
ery
hig
hD
on
't k
no
wN
um
be
r o
f
Res
po
nse
s
Nu
mb
er
of
Res
po
nse
s
Ve
ry
Ine
ffe
cti
ve
Ine
ffe
cti
ve
Eff
ec
tive
Lo
wM
ed
ium
Ho
w s
ign
ific
an
t is
th
is r
isk
to
ac
hie
vin
g y
ou
r o
bje
cti
ve
s?
Ho
w e
ffe
cti
ve
are
yo
ur
pro
ce
ss
es
at
ma
nag
ing
th
is r
isk
?

249
8)
A larg
e n
um
ber
of
risks, w
hic
h m
ay a
ffect
the p
roje
cte
d r
etu
rn, ari
se d
uri
ng
pro
ject
develo
pm
en
t. P
lease f
ind
belo
w a
no
n-e
xh
au
sti
ve lis
t o
f th
ese r
isks.
P
lease e
valu
ate
th
e f
ollo
win
g r
isks o
n p
roje
ct
level re
gard
ing
th
eir
sig
nif
ican
ce t
o a
ch
ievin
g y
ou
r co
mp
an
y´s
ob
jecti
ves a
s w
ell a
s t
he e
ffecti
ven
ess o
f yo
ur
risk m
an
ag
em
en
t
p
rocesses t
o c
op
e w
ith
th
ose r
isks.
9 Q
uality
sta
nd
ard
ris
k
To
tal
Res
po
nd
an
ts2
33
4.8
%3
04
5.5
%9
13
.6%
46
.1%
66
10
0.0
%0
0.0
%4
6.2
%3
55
3.8
%2
23
3.8
%4
6.2
%6
51
00
.0%
Deve
lop
er
Cla
ss
ific
ati
on
- M
ain
ly T
rader-
Develo
per
12
34.3
%13
37.1
%6
17.1
%4
11.4
%35
53.0
%0
0.0
%1
2.9
%18
51.4
%12
34.3
%4
11.4
%35
53.8
%
- M
ain
ly I
nvesto
r-D
evelo
per
11
35.5
%17
54.8
%3
9.7
%0
0.0
%31
47.0
%0
0.0
%3
10.0
%17
56.7
%10
33.3
%0
0.0
%30
46.2
%
To
tal
Deve
lop
er
Cla
ss
ific
ati
on
23
34.8
%30
45.5
%9
13.6
%4
6.1
%66
100
.0%
00
.0%
46
.2%
35
53.8
%22
33.8
%4
6.2
%65
100
.0%
Ow
ners
hip
str
uctu
re -
Lis
ted
94
5.0
%7
35.0
%2
10.0
%2
10.0
%20
30.3
%0
0.0
%1
5.0
%12
60.0
%5
25.0
%2
10.0
%20
30.8
%
- U
nlis
ted
14
30.4
%23
50.0
%7
15.2
%2
4.3
%46
69.7
%0
0.0
%3
6.7
%23
51.1
%17
37.8
%2
4.4
%45
69.2
%
To
tal
Ow
ners
hip
Str
uctu
re23
34.8
%30
45.5
%9
13.6
%4
6.1
%66
100
.0%
00
.0%
46
.2%
35
53.8
%22
33.8
%4
6.2
%65
100
.0%
Ge
og
rap
hic
Sc
op
e -
Regio
nal
11
6.7
%4
66.7
%0
0.0
%1
16.7
%6
9.1
%0
0.0
%1
16.7
%3
50.0
%1
16.7
%1
16.7
%6
9.2
%
- N
ational
13
36.1
%15
41.7
%6
16.7
%2
5.6
%36
54.5
%0
0.0
%0
0.0
%22
62.9
%12
34.3
%1
2.9
%35
53.8
%
- I
nte
rnational
93
7.5
%11
45.8
%3
12.5
%1
4.2
%24
36.4
%0
0.0
%3
12.5
%10
41.7
%9
37.5
%2
8.3
%24
36.9
%
To
tal
Ge
og
rap
hic
Sc
op
e23
34.8
%30
45.5
%9
13.6
%4
6.1
%66
100
.0%
00
.0%
46
.2%
35
53.8
%22
33.8
%4
6.2
%65
100
.0%
Pro
jec
t S
ize
Cla
ss
ific
ati
on
- S
mall
(EU
R <
5 -
10 m
illio
n)
23
3.3
%3
50.0
%0
0.0
%1
16.7
%6
9.1
%0
0.0
%0
0.0
%4
66.7
%1
16.7
%1
16.7
%6
9.2
%
- M
ediu
m (
EU
R >
10 -
50 m
illio
n)
11
28.2
%17
43.6
%8
20.5
%3
7.7
%39
59.1
%0
0.0
%3
7.9
%22
57.9
%13
34.2
%0
0.0
%38
58.5
%
- L
arg
e (
EU
R >
50 -
250 m
illio
n)
10
47.6
%10
47.6
%1
4.8
%0
0.0
%21
31.8
%0
0.0
%1
4.8
%9
42.9
%8
38.1
%3
14.3
%21
32.3
%
To
tal
Pro
jec
t S
ize
Cla
ss
ific
ati
on
23
34.8
%30
45.5
%9
13.6
%4
6.1
%66
100
.0%
00
.0%
46
.2%
35
53.8
%22
33.8
%4
6.2
%65
100
.0%
Do
n't
kn
ow
Nu
mb
er
of
Res
po
nse
s
Nu
mb
er
of
Res
po
nse
s
Ve
ry
Ine
ffe
cti
ve
Ine
ffe
cti
ve
Eff
ec
tive
Lo
wM
ed
ium
Hig
hV
ery
hig
hV
ery
eff
ec
tive
Ho
w s
ign
ific
an
t is
th
is r
isk
to
ac
hie
vin
g y
ou
r o
bje
cti
ve
s?
Ho
w e
ffe
cti
ve
are
yo
ur
pro
ce
ss
es
at
ma
nag
ing
th
is r
isk
?

250
8)
A larg
e n
um
ber
of
risks, w
hic
h m
ay a
ffect
the p
roje
cte
d r
etu
rn, ari
se d
uri
ng
pro
ject
develo
pm
en
t. P
lease f
ind
belo
w a
no
n-e
xh
au
sti
ve lis
t o
f th
ese r
isks.
P
lease e
valu
ate
th
e f
ollo
win
g r
isks o
n p
roje
ct
level re
gard
ing
th
eir
sig
nif
ican
ce t
o a
ch
ievin
g y
ou
r co
mp
an
y´s
ob
jecti
ves a
s w
ell a
s t
he e
ffecti
ven
ess o
f yo
ur
risk m
an
ag
em
en
t
p
rocesses t
o c
op
e w
ith
th
ose r
isks.
10 L
eg
al ri
sks
To
tal
Res
po
nd
an
ts2
43
6.4
%2
84
2.4
%1
21
8.2
%2
3.0
%6
61
00
.0%
00
.0%
46
.2%
42
64
.6%
16
24
.6%
34
.6%
65
10
0.0
%
Deve
lop
er
Cla
ss
ific
ati
on
- M
ain
ly T
rader-
Develo
per
12
34.3
%13
37.1
%8
22.9
%2
5.7
%35
53.0
%0
0.0
%3
8.6
%21
60.0
%8
22.9
%3
8.6
%35
53.8
%
- M
ain
ly I
nvesto
r-D
evelo
per
12
38.7
%15
48.4
%4
12.9
%0
0.0
%31
47.0
%0
0.0
%1
3.3
%21
70.0
%8
26.7
%0
0.0
%30
46.2
%
To
tal
Deve
lop
er
Cla
ss
ific
ati
on
24
36.4
%28
42.4
%12
18.2
%2
3.0
%66
100
.0%
00
.0%
46
.2%
42
64.6
%16
24.6
%3
4.6
%65
100
.0%
Ow
ners
hip
str
uctu
re -
Lis
ted
94
5.0
%6
30.0
%4
20.0
%1
5.0
%20
30.3
%0
0.0
%1
5.0
%17
85.0
%2
10.0
%0
0.0
%20
30.8
%
- U
nlis
ted
15
32.6
%22
47.8
%8
17.4
%1
2.2
%46
69.7
%0
0.0
%3
6.7
%25
55.6
%14
31.1
%3
6.7
%45
69.2
%
To
tal
Ow
ners
hip
Str
uctu
re24
36.4
%28
42.4
%12
18.2
%2
3.0
%66
100
.0%
00
.0%
46
.2%
42
64.6
%16
24.6
%3
4.6
%65
100
.0%
Ge
og
rap
hic
Sc
op
e -
Regio
nal
00
.0%
58
3.3
%0
0.0
%1
16.7
%6
9.1
%0
0.0
%1
16.7
%4
66.7
%1
16.7
%0
0.0
%6
9.2
%
- N
ational
16
44.4
%13
36.1
%6
16.7
%1
2.8
%36
54.5
%0
0.0
%1
2.9
%23
65.7
%9
25.7
%2
5.7
%35
53.8
%
- I
nte
rnational
83
3.3
%10
41.7
%6
25.0
%0
0.0
%24
36.4
%0
0.0
%2
8.3
%15
62.5
%6
25.0
%1
4.2
%24
36.9
%
To
tal
Ge
og
rap
hic
Sc
op
e24
36.4
%28
42.4
%12
18.2
%2
3.0
%66
100
.0%
00
.0%
46
.2%
42
64.6
%16
24.6
%3
4.6
%65
100
.0%
Pro
jec
t S
ize
Cla
ss
ific
ati
on
- S
mall
(EU
R <
5 -
10 m
illio
n)
23
3.3
%2
33.3
%1
16.7
%1
16.7
%6
9.1
%0
0.0
%0
0.0
%4
66.7
%2
33.3
%0
0.0
%6
9.2
%
- M
ediu
m (
EU
R >
10 -
50 m
illio
n)
14
35.9
%16
41.0
%8
20.5
%1
2.6
%39
59.1
%0
0.0
%2
5.3
%28
73.7
%7
18.4
%1
2.6
%38
58.5
%
- L
arg
e (
EU
R >
50 -
250 m
illio
n)
83
8.1
%10
47.6
%3
14.3
%0
0.0
%21
31.8
%0
0.0
%2
9.5
%10
47.6
%7
33.3
%2
9.5
%21
32.3
%
To
tal
Pro
jec
t S
ize
Cla
ss
ific
ati
on
24
36.4
%28
42.4
%12
18.2
%2
3.0
%66
100
.0%
00
.0%
46
.2%
42
64.6
%16
24.6
%3
4.6
%65
100
.0%
Ve
ry e
ffe
cti
ve
Hig
hV
ery
hig
hD
on
't k
no
wN
um
be
r o
f
Res
po
nse
s
Nu
mb
er
of
Res
po
nse
s
Ve
ry
Ine
ffe
cti
ve
Ine
ffe
cti
ve
Eff
ec
tive
Lo
wM
ed
ium
Ho
w s
ign
ific
an
t is
th
is r
isk
to
ac
hie
vin
g y
ou
r o
bje
cti
ve
s?
Ho
w e
ffe
cti
ve
are
yo
ur
pro
ce
ss
es
at
ma
nag
ing
th
is r
isk
?

251
8)
A larg
e n
um
ber
of
risks, w
hic
h m
ay a
ffect
the p
roje
cte
d r
etu
rn, ari
se d
uri
ng
pro
ject
develo
pm
en
t. P
lease f
ind
belo
w a
no
n-e
xh
au
sti
ve lis
t o
f th
ese r
isks.
P
lease e
valu
ate
th
e f
ollo
win
g r
isks o
n p
roje
ct
level re
gard
ing
th
eir
sig
nif
ican
ce t
o a
ch
ievin
g y
ou
r co
mp
an
y´s
ob
jecti
ves a
s w
ell a
s t
he e
ffecti
ven
ess o
f yo
ur
risk m
an
ag
em
en
t
p
rocesses t
o c
op
e w
ith
th
ose r
isks.
11 D
esig
n r
isk
To
tal
Res
po
nd
an
ts2
53
8.5
%2
33
5.4
%1
42
1.5
%3
4.6
%6
51
00
.0%
00
.0%
69
.2%
38
58
.5%
15
23
.1%
69
.2%
65
10
0.0
%
Deve
lop
er
Cla
ss
ific
ati
on
- M
ain
ly T
rader-
Develo
per
11
32.4
%12
35.3
%8
23.5
%3
8.8
%34
52.3
%0
0.0
%2
5.7
%17
48.6
%11
31.4
%5
14.3
%35
53.8
%
- M
ain
ly I
nvesto
r-D
evelo
per
14
45.2
%11
35.5
%6
19.4
%0
0.0
%31
47.7
%0
0.0
%4
13.3
%21
70.0
%4
13.3
%1
3.3
%30
46.2
%
To
tal
Deve
lop
er
Cla
ss
ific
ati
on
25
38.5
%23
35.4
%14
21.5
%3
4.6
%65
100
.0%
00
.0%
69
.2%
38
58.5
%15
23.1
%6
9.2
%65
100
.0%
Ow
ners
hip
str
uctu
re -
Lis
ted
12
60.0
%3
15.0
%3
15.0
%2
10.0
%20
30.8
%0
0.0
%3
15.0
%13
65.0
%1
5.0
%3
15.0
%20
30.8
%
- U
nlis
ted
13
28.9
%20
44.4
%11
24.4
%1
2.2
%45
69.2
%0
0.0
%3
6.7
%25
55.6
%14
31.1
%3
6.7
%45
69.2
%
To
tal
Ow
ners
hip
Str
uctu
re25
38.5
%23
35.4
%14
21.5
%3
4.6
%65
100
.0%
00
.0%
69
.2%
38
58.5
%15
23.1
%6
9.2
%65
100
.0%
Ge
og
rap
hic
Sc
op
e -
Regio
nal
23
3.3
%1
16.7
%2
33.3
%1
16.7
%6
9.2
%0
0.0
%2
33.3
%4
66.7
%0
0.0
%0
0.0
%6
9.2
%
- N
ational
15
41.7
%12
33.3
%7
19.4
%2
5.6
%36
55.4
%0
0.0
%1
2.9
%23
65.7
%8
22.9
%3
8.6
%35
53.8
%
- I
nte
rnational
83
4.8
%10
43.5
%5
21.7
%0
0.0
%23
35.4
%0
0.0
%3
12.5
%11
45.8
%7
29.2
%3
12.5
%24
36.9
%
To
tal
Ge
og
rap
hic
Sc
op
e25
38.5
%23
35.4
%14
21.5
%3
4.6
%65
100
.0%
00
.0%
69
.2%
38
58.5
%15
23.1
%6
9.2
%65
100
.0%
Pro
jec
t S
ize
Cla
ss
ific
ati
on
- S
mall
(EU
R <
5 -
10 m
illio
n)
58
3.3
%0
0.0
%1
16.7
%0
0.0
%6
9.2
%0
0.0
%1
16.7
%3
50.0
%2
33.3
%0
0.0
%6
9.2
%
- M
ediu
m (
EU
R >
10 -
50 m
illio
n)
11
28.2
%14
35.9
%11
28.2
%3
7.7
%39
60.0
%0
0.0
%3
7.9
%27
71.1
%7
18.4
%1
2.6
%38
58.5
%
- L
arg
e (
EU
R >
50 -
250 m
illio
n)
94
5.0
%9
45.0
%2
10.0
%0
0.0
%20
30.8
%0
0.0
%2
9.5
%8
38.1
%6
28.6
%5
23.8
%21
32.3
%
To
tal
Pro
jec
t S
ize
Cla
ss
ific
ati
on
25
38.5
%23
35.4
%14
21.5
%3
4.6
%65
100
.0%
00
.0%
69
.2%
38
58.5
%15
23.1
%6
9.2
%65
100
.0%
Do
n't
kn
ow
Nu
mb
er
of
Res
po
nse
s
Nu
mb
er
of
Res
po
nse
s
Ve
ry
Ine
ffe
cti
ve
Ine
ffe
cti
ve
Eff
ec
tive
Lo
wM
ed
ium
Hig
hV
ery
hig
hV
ery
eff
ec
tive
Ho
w s
ign
ific
an
t is
th
is r
isk
to
ac
hie
vin
g y
ou
r o
bje
cti
ve
s?
Ho
w e
ffe
cti
ve
are
yo
ur
pro
ce
ss
es
at
ma
nag
ing
th
is r
isk
?

252
8)
A larg
e n
um
ber
of
risks, w
hic
h m
ay a
ffect
the p
roje
cte
d r
etu
rn, ari
se d
uri
ng
pro
ject
develo
pm
en
t. P
lease f
ind
belo
w a
no
n-e
xh
au
sti
ve lis
t o
f th
ese r
isks.
P
lease e
valu
ate
th
e f
ollo
win
g r
isks o
n p
roje
ct
level re
gard
ing
th
eir
sig
nif
ican
ce t
o a
ch
ievin
g y
ou
r co
mp
an
y´s
ob
jecti
ves a
s w
ell a
s t
he e
ffecti
ven
ess o
f yo
ur
risk m
an
ag
em
en
t
p
rocesses t
o c
op
e w
ith
th
ose r
isks.
12 A
pp
roval p
rocess c
om
ple
xit
y, sati
sfy
ing
pla
nn
ing
, en
vir
on
men
tal an
d t
raff
ic c
on
str
ain
ts
To
tal
Res
po
nd
an
ts1
32
0.0
%1
72
6.2
%2
53
8.5
%1
01
5.4
%6
51
00
.0%
00
.0%
69
.2%
37
56
.9%
17
26
.2%
57
.7%
65
10
0.0
%
Deve
lop
er
Cla
ss
ific
ati
on
- M
ain
ly T
rader-
Develo
per
51
4.3
%8
22.9
%14
40.0
%8
22.9
%35
53.8
%0
0.0
%4
11.4
%20
57.1
%9
25.7
%2
5.7
%35
53.8
%
- M
ain
ly I
nvesto
r-D
evelo
per
82
6.7
%9
30.0
%11
36.7
%2
6.7
%30
46.2
%0
0.0
%2
6.7
%17
56.7
%8
26.7
%3
10.0
%30
46.2
%
To
tal
Deve
lop
er
Cla
ss
ific
ati
on
13
20.0
%17
26.2
%25
38.5
%10
15.4
%65
100
.0%
00
.0%
69
.2%
37
56.9
%17
26.2
%5
7.7
%65
100
.0%
Ow
ners
hip
str
uctu
re -
Lis
ted
63
0.0
%6
30.0
%5
25.0
%3
15.0
%20
30.8
%0
0.0
%2
10.0
%15
75.0
%2
10.0
%1
5.0
%20
30.8
%
- U
nlis
ted
71
5.6
%11
24.4
%20
44.4
%7
15.6
%45
69.2
%0
0.0
%4
8.9
%22
48.9
%15
33.3
%4
8.9
%45
69.2
%
To
tal
Ow
ners
hip
Str
uctu
re13
20.0
%17
26.2
%25
38.5
%10
15.4
%65
100
.0%
00
.0%
69
.2%
37
56.9
%17
26.2
%5
7.7
%65
100
.0%
Ge
og
rap
hic
Sc
op
e -
Regio
nal
00
.0%
23
3.3
%3
50.0
%1
16.7
%6
9.2
%0
0.0
%1
16.7
%4
66.7
%1
16.7
%0
0.0
%6
9.2
%
- N
ational
10
28.6
%8
22.9
%11
31.4
%6
17.1
%35
53.8
%0
0.0
%3
8.6
%17
48.6
%11
31.4
%4
11.4
%35
53.8
%
- I
nte
rnational
31
2.5
%7
29.2
%11
45.8
%3
12.5
%24
36.9
%0
0.0
%2
8.3
%16
66.7
%5
20.8
%1
4.2
%24
36.9
%
To
tal
Ge
og
rap
hic
Sc
op
e13
20.0
%17
26.2
%25
38.5
%10
15.4
%65
100
.0%
00
.0%
69
.2%
37
56.9
%17
26.2
%5
7.7
%65
100
.0%
Pro
jec
t S
ize
Cla
ss
ific
ati
on
- S
mall
(EU
R <
5 -
10 m
illio
n)
11
6.7
%2
33.3
%3
50.0
%0
0.0
%6
9.2
%0
0.0
%1
16.7
%2
33.3
%3
50.0
%0
0.0
%6
9.2
%
- M
ediu
m (
EU
R >
10 -
50 m
illio
n)
92
3.7
%8
21.1
%13
34.2
%8
21.1
%38
58.5
%0
0.0
%3
7.9
%25
65.8
%8
21.1
%2
5.3
%38
58.5
%
- L
arg
e (
EU
R >
50 -
250 m
illio
n)
31
4.3
%7
33.3
%9
42.9
%2
9.5
%21
32.3
%0
0.0
%2
9.5
%10
47.6
%6
28.6
%3
14.3
%21
32.3
%
To
tal
Pro
jec
t S
ize
Cla
ss
ific
ati
on
13
20.0
%17
26.2
%25
38.5
%10
15.4
%65
100
.0%
00
.0%
69
.2%
37
56.9
%17
26.2
%5
7.7
%65
100
.0%
Ve
ry e
ffe
cti
ve
Hig
hV
ery
hig
hD
on
't k
no
wN
um
be
r o
f
Res
po
nse
s
Nu
mb
er
of
Res
po
nse
s
Ve
ry
Ine
ffe
cti
ve
Ine
ffe
cti
ve
Eff
ec
tive
Lo
wM
ed
ium
Ho
w s
ign
ific
an
t is
th
is r
isk
to
ac
hie
vin
g y
ou
r o
bje
cti
ve
s?
Ho
w e
ffe
cti
ve
are
yo
ur
pro
ce
ss
es
at
ma
nag
ing
th
is r
isk
?

253
8)
A larg
e n
um
ber
of
risks, w
hic
h m
ay a
ffect
the p
roje
cte
d r
etu
rn, ari
se d
uri
ng
pro
ject
develo
pm
en
t. P
lease f
ind
belo
w a
no
n-e
xh
au
sti
ve lis
t o
f th
ese r
isks.
P
lease e
valu
ate
th
e f
ollo
win
g r
isks o
n p
roje
ct
level re
gard
ing
th
eir
sig
nif
ican
ce t
o a
ch
ievin
g y
ou
r co
mp
an
y´s
ob
jecti
ves a
s w
ell a
s t
he e
ffecti
ven
ess o
f yo
ur
risk m
an
ag
em
en
t
p
rocesses t
o c
op
e w
ith
th
ose r
isks.
13 S
takeh
old
ers
in
th
e p
roje
ct
havin
g d
iffe
ren
t p
rio
riti
es
To
tal
Res
po
nd
an
ts2
74
1.5
%2
84
3.1
%9
13
.8%
11
.5%
65
10
0.0
%0
0.0
%7
10
.8%
36
55
.4%
13
20
.0%
91
3.8
%6
51
00
.0%
Deve
lop
er
Cla
ss
ific
ati
on
- M
ain
ly T
rader-
Develo
per
15
42.9
%13
37.1
%6
17.1
%1
2.9
%35
53.8
%0
0.0
%5
14.3
%19
54.3
%7
20.0
%4
11.4
%35
53.8
%
- M
ain
ly I
nvesto
r-D
evelo
per
12
40.0
%15
50.0
%3
10.0
%0
0.0
%30
46.2
%0
0.0
%2
6.7
%17
56.7
%6
20.0
%5
16.7
%30
46.2
%
To
tal
Deve
lop
er
Cla
ss
ific
ati
on
27
41.5
%28
43.1
%9
13.8
%1
1.5
%65
100
.0%
00
.0%
71
0.8
%36
55.4
%13
20.0
%9
13.8
%65
100
.0%
Ow
ners
hip
str
uctu
re -
Lis
ted
94
7.4
%6
31.6
%4
21.1
%0
0.0
%19
29.2
%0
0.0
%3
15.0
%12
60.0
%2
10.0
%3
15.0
%20
30.8
%
- U
nlis
ted
18
39.1
%22
47.8
%5
10.9
%1
2.2
%46
70.8
%0
0.0
%4
8.9
%24
53.3
%11
24.4
%6
13.3
%45
69.2
%
To
tal
Ow
ners
hip
Str
uctu
re27
41.5
%28
43.1
%9
13.8
%1
1.5
%65
100
.0%
00
.0%
71
0.8
%36
55.4
%13
20.0
%9
13.8
%65
100
.0%
Ge
og
rap
hic
Sc
op
e -
Regio
nal
00
.0%
58
3.3
%1
16.7
%0
0.0
%6
9.2
%0
0.0
%2
33.3
%3
50.0
%1
16.7
%0
0.0
%6
9.2
%
- N
ational
17
48.6
%11
31.4
%6
17.1
%1
2.9
%35
53.8
%0
0.0
%2
5.7
%21
60.0
%5
14.3
%7
20.0
%35
53.8
%
- I
nte
rnational
10
41.7
%12
50.0
%2
8.3
%0
0.0
%24
36.9
%0
0.0
%3
12.5
%12
50.0
%7
29.2
%2
8.3
%24
36.9
%
To
tal
Ge
og
rap
hic
Sc
op
e27
41.5
%28
43.1
%9
13.8
%1
1.5
%65
100
.0%
00
.0%
71
0.8
%36
55.4
%13
20.0
%9
13.8
%65
100
.0%
Pro
jec
t S
ize
Cla
ss
ific
ati
on
- S
mall
(EU
R <
5 -
10 m
illio
n)
35
0.0
%2
33.3
%1
16.7
%0
0.0
%6
9.2
%0
0.0
%3
50.0
%2
33.3
%1
16.7
%0
0.0
%6
9.2
%
- M
ediu
m (
EU
R >
10 -
50 m
illio
n)
16
42.1
%15
39.5
%6
15.8
%1
2.6
%38
58.5
%0
0.0
%3
7.9
%24
63.2
%6
15.8
%5
13.2
%38
58.5
%
- L
arg
e (
EU
R >
50 -
250 m
illio
n)
83
8.1
%11
52.4
%2
9.5
%0
0.0
%21
32.3
%0
0.0
%1
4.8
%10
47.6
%6
28.6
%4
19.0
%21
32.3
%
To
tal
Pro
jec
t S
ize
Cla
ss
ific
ati
on
27
41.5
%28
43.1
%9
13.8
%1
1.5
%65
100
.0%
00
.0%
71
0.8
%36
55.4
%13
20.0
%9
13.8
%65
100
.0%
Do
n't
kn
ow
Nu
mb
er
of
Res
po
nse
s
Nu
mb
er
of
Res
po
nse
s
Ve
ry
Ine
ffe
cti
ve
Ine
ffe
cti
ve
Eff
ec
tive
Lo
wM
ed
ium
Hig
hV
ery
hig
hV
ery
eff
ec
tive
Ho
w s
ign
ific
an
t is
th
is r
isk
to
ac
hie
vin
g y
ou
r o
bje
cti
ve
s?
Ho
w e
ffe
cti
ve
are
yo
ur
pro
ce
ss
es
at
ma
nag
ing
th
is r
isk
?

254
8)
A l
arg
e n
um
be
r o
f ri
sks
, w
hic
h m
ay a
ffe
ct
the
pro
jec
ted
re
turn
, ari
se
du
rin
g p
roje
ct
de
ve
lop
me
nt.
Ple
as
e f
ind
be
low
a n
on
-ex
ha
us
tive
lis
t o
f th
es
e r
isk
s.
P
lease e
valu
ate
th
e f
ollo
win
g r
isks o
n p
roje
ct
level re
gard
ing
th
eir
sig
nif
ican
ce t
o a
ch
ievin
g y
ou
r co
mp
an
y´s
ob
jecti
ves a
s w
ell a
s t
he e
ffecti
ven
ess o
f yo
ur
risk m
an
ag
em
en
t
p
rocesses t
o c
op
e w
ith
th
ose r
isks.
14 B
ud
gets
an
d b
usin
ess (
pro
ject)
pla
ns a
re n
ot
based
up
on
realisti
c a
ssu
mp
tio
ns
To
tal
Re
sp
on
da
nts
23
34
.8%
20
30
.3%
20
30
.3%
34
.5%
66
10
0.0
%0
0.0
%7
10
.8%
31
47
.7%
24
36
.9%
34
.6%
65
10
0.0
%
De
ve
lop
er
Cla
ss
ific
ati
on
- M
ain
ly T
rader-
Develo
per
13
37.1
%9
25.7
%11
31.4
%2
5.7
%35
53.0
%0
0.0
%2
5.7
%15
42.9
%15
42.9
%3
8.6
%35
53.8
%
- M
ain
ly I
nvesto
r-D
evelo
per
10
32.3
%11
35.5
%9
29.0
%1
3.2
%31
47.0
%0
0.0
%5
16.7
%16
53.3
%9
30.0
%0
0.0
%30
46.2
%
To
tal
De
ve
lop
er
Cla
ss
ific
ati
on
23
34.8
%20
30.3
%20
30.3
%3
4.5
%66
100.0
%0
0.0
%7
10.8
%31
47.7
%24
36.9
%3
4.6
%65
100.0
%
Ow
ne
rsh
ip s
tru
ctu
re -
Lis
ted
840.0
%6
30.0
%4
20.0
%2
10.0
%20
30.3
%0
0.0
%2
10.0
%9
45.0
%8
40.0
%1
5.0
%20
30.8
%
- U
nlis
ted
15
32.6
%14
30.4
%16
34.8
%1
2.2
%46
69.7
%0
0.0
%5
11.1
%22
48.9
%16
35.6
%2
4.4
%45
69.2
%
To
tal
Ow
ne
rsh
ip S
tru
ctu
re23
34.8
%20
30.3
%20
30.3
%3
4.5
%66
100.0
%0
0.0
%7
10.8
%31
47.7
%24
36.9
%3
4.6
%65
100.0
%
Ge
og
rap
hic
Sc
op
e -
Regio
nal
00.0
%3
50.0
%3
50.0
%0
0.0
%6
9.1
%0
0.0
%0
0.0
%3
50.0
%3
50.0
%0
0.0
%6
9.2
%
- N
ational
14
38.9
%10
27.8
%9
25.0
%3
8.3
%36
54.5
%0
0.0
%3
8.6
%18
51.4
%13
37.1
%1
2.9
%35
53.8
%
- I
nte
rnational
937.5
%7
29.2
%8
33.3
%0
0.0
%24
36.4
%0
0.0
%4
16.7
%10
41.7
%8
33.3
%2
8.3
%24
36.9
%
To
tal
Ge
og
rap
hic
Sc
op
e23
34.8
%20
30.3
%20
30.3
%3
4.5
%66
100.0
%0
0.0
%7
10.8
%31
47.7
%24
36.9
%3
4.6
%65
100.0
%
Pro
jec
t S
ize
Cla
ss
ific
ati
on
- S
mall
(EU
R <
5 -
10 m
illio
n)
116.7
%2
33.3
%3
50.0
%0
0.0
%6
9.1
%0
0.0
%0
0.0
%2
33.3
%4
66.7
%0
0.0
%6
9.2
%
- M
ediu
m (
EU
R >
10 -
50 m
illio
n)
12
30.8
%9
23.1
%15
38.5
%3
7.7
%39
59.1
%0
0.0
%3
7.9
%23
60.5
%12
31.6
%0
0.0
%38
58.5
%
- L
arg
e (
EU
R >
50 -
250 m
illio
n)
10
47.6
%9
42.9
%2
9.5
%0
0.0
%21
31.8
%0
0.0
%4
19.0
%6
28.6
%8
38.1
%3
14.3
%21
32.3
%
To
tal
Pro
jec
t S
ize
Cla
ss
ific
ati
on
23
34.8
%20
30.3
%20
30.3
%3
4.5
%66
100.0
%0
0.0
%7
10.8
%31
47.7
%24
36.9
%3
4.6
%65
100.0
%
Ve
ry e
ffe
cti
ve
Hig
hV
ery
hig
hD
on
't k
no
wN
um
be
r o
f
Re
sp
on
se
s
Nu
mb
er
of
Re
sp
on
se
s
Ve
ry
Ine
ffe
cti
ve
Ine
ffe
cti
ve
Eff
ec
tive
Lo
wM
ed
ium
Ho
w s
ign
ific
an
t is
th
is r
isk
to
ac
hie
vin
g y
ou
r o
bje
cti
ve
s?
Ho
w e
ffe
cti
ve
are
yo
ur
pro
ce
ss
es
at
ma
na
gin
g t
his
ris
k?

255
8)
A larg
e n
um
ber
of
risks, w
hic
h m
ay a
ffect
the p
roje
cte
d r
etu
rn, ari
se d
uri
ng
pro
ject
develo
pm
en
t. P
lease f
ind
belo
w a
no
n-e
xh
au
sti
ve lis
t o
f th
ese r
isks.
P
lease e
valu
ate
th
e f
ollo
win
g r
isks o
n p
roje
ct
level re
gard
ing
th
eir
sig
nif
ican
ce t
o a
ch
ievin
g y
ou
r co
mp
an
y´s
ob
jecti
ves a
s w
ell a
s t
he e
ffecti
ven
ess o
f yo
ur
risk m
an
ag
em
en
t
p
rocesses t
o c
op
e w
ith
th
ose r
isks.
15 In
su
ffic
ien
t fo
cu
s o
n v
alu
e, to
mu
ch
em
ph
asis
pla
ced
on
co
st
To
tal
Res
po
nd
an
ts2
63
9.4
%2
53
7.9
%1
11
6.7
%4
6.1
%6
61
00
.0%
00
.0%
91
3.8
%3
65
5.4
%1
62
4.6
%4
6.2
%6
51
00
.0%
Deve
lop
er
Cla
ss
ific
ati
on
- M
ain
ly T
rader-
Develo
per
15
42.9
%12
34.3
%5
14.3
%3
8.6
%35
53.0
%0
0.0
%4
11.4
%20
57.1
%8
22.9
%3
8.6
%35
53.8
%
- M
ain
ly I
nvesto
r-D
evelo
per
11
35.5
%13
41.9
%6
19.4
%1
3.2
%31
47.0
%0
0.0
%5
16.7
%16
53.3
%8
26.7
%1
3.3
%30
46.2
%
To
tal
Deve
lop
er
Cla
ss
ific
ati
on
26
39.4
%25
37.9
%11
16.7
%4
6.1
%66
100
.0%
00
.0%
91
3.8
%36
55.4
%16
24.6
%4
6.2
%65
100
.0%
Ow
ners
hip
str
uctu
re -
Lis
ted
73
5.0
%8
40.0
%3
15.0
%2
10.0
%20
30.3
%0
0.0
%4
20.0
%13
65.0
%3
15.0
%0
0.0
%20
30.8
%
- U
nlis
ted
19
41.3
%17
37.0
%8
17.4
%2
4.3
%46
69.7
%0
0.0
%5
11.1
%23
51.1
%13
28.9
%4
8.9
%45
69.2
%
To
tal
Ow
ners
hip
Str
uctu
re26
39.4
%25
37.9
%11
16.7
%4
6.1
%66
100
.0%
00
.0%
91
3.8
%36
55.4
%16
24.6
%4
6.2
%65
100
.0%
Ge
og
rap
hic
Sc
op
e -
Regio
nal
23
3.3
%1
16.7
%2
33.3
%1
16.7
%6
9.1
%0
0.0
%2
33.3
%3
50.0
%1
16.7
%0
0.0
%6
9.2
%
- N
ational
15
41.7
%13
36.1
%7
19.4
%1
2.8
%36
54.5
%0
0.0
%3
8.6
%22
62.9
%7
20.0
%3
8.6
%35
53.8
%
- I
nte
rnational
93
7.5
%11
45.8
%2
8.3
%2
8.3
%24
36.4
%0
0.0
%4
16.7
%11
45.8
%8
33.3
%1
4.2
%24
36.9
%
To
tal
Ge
og
rap
hic
Sc
op
e26
39.4
%25
37.9
%11
16.7
%4
6.1
%66
100
.0%
00
.0%
91
3.8
%36
55.4
%16
24.6
%4
6.2
%65
100
.0%
Pro
jec
t S
ize
Cla
ss
ific
ati
on
- S
mall
(EU
R <
5 -
10 m
illio
n)
35
0.0
%0
0.0
%3
50.0
%0
0.0
%6
9.1
%0
0.0
%0
0.0
%4
66.7
%2
33.3
%0
0.0
%6
9.2
%
- M
ediu
m (
EU
R >
10 -
50 m
illio
n)
14
35.9
%15
38.5
%7
17.9
%3
7.7
%39
59.1
%0
0.0
%5
13.2
%24
63.2
%7
18.4
%2
5.3
%38
58.5
%
- L
arg
e (
EU
R >
50 -
250 m
illio
n)
94
2.9
%10
47.6
%1
4.8
%1
4.8
%21
31.8
%0
0.0
%4
19.0
%8
38.1
%7
33.3
%2
9.5
%21
32.3
%
To
tal
Pro
jec
t S
ize
Cla
ss
ific
ati
on
26
39.4
%25
37.9
%11
16.7
%4
6.1
%66
100
.0%
00
.0%
91
3.8
%36
55.4
%16
24.6
%4
6.2
%65
100
.0%
Do
n't
kn
ow
Nu
mb
er
of
Res
po
nse
s
Nu
mb
er
of
Res
po
nse
s
Ve
ry
Ine
ffe
cti
ve
Ine
ffe
cti
ve
Eff
ec
tive
Lo
wM
ed
ium
Hig
hV
ery
hig
hV
ery
eff
ec
tive
Ho
w s
ign
ific
an
t is
th
is r
isk
to
ac
hie
vin
g y
ou
r o
bje
cti
ve
s?
Ho
w e
ffe
cti
ve
are
yo
ur
pro
ce
ss
es
at
ma
nag
ing
th
is r
isk
?

256
8)
A larg
e n
um
ber
of
risks, w
hic
h m
ay a
ffect
the p
roje
cte
d r
etu
rn, ari
se d
uri
ng
pro
ject
develo
pm
en
t. P
lease f
ind
belo
w a
no
n-e
xh
au
sti
ve lis
t o
f th
ese r
isks.
P
lease e
valu
ate
th
e f
ollo
win
g r
isks o
n p
roje
ct
level re
gard
ing
th
eir
sig
nif
ican
ce t
o a
ch
ievin
g y
ou
r co
mp
an
y´s
ob
jecti
ves a
s w
ell a
s t
he e
ffecti
ven
ess o
f yo
ur
risk m
an
ag
em
en
t
p
rocesses t
o c
op
e w
ith
th
ose r
isks.
16 C
han
ges in
desig
n a
nd
req
uir
em
en
ts d
uri
ng
co
nstr
ucti
on
ph
ase
To
tal
Res
po
nd
an
ts2
13
1.8
%3
24
8.5
%1
01
5.2
%3
4.5
%6
61
00
.0%
00
.0%
71
0.8
%3
96
0.0
%1
42
1.5
%5
7.7
%6
51
00
.0%
Deve
lop
er
Cla
ss
ific
ati
on
- M
ain
ly T
rader-
Develo
per
10
28.6
%19
54.3
%4
11.4
%2
5.7
%35
53.0
%0
0.0
%3
8.6
%19
54.3
%8
22.9
%5
14.3
%35
53.8
%
- M
ain
ly I
nvesto
r-D
evelo
per
11
35.5
%13
41.9
%6
19.4
%1
3.2
%31
47.0
%0
0.0
%4
13.3
%20
66.7
%6
20.0
%0
0.0
%30
46.2
%
To
tal
Deve
lop
er
Cla
ss
ific
ati
on
21
31.8
%32
48.5
%10
15.2
%3
4.5
%66
100
.0%
00
.0%
71
0.8
%39
60.0
%14
21.5
%5
7.7
%65
100
.0%
Ow
ners
hip
str
uctu
re -
Lis
ted
73
5.0
%9
45.0
%2
10.0
%2
10.0
%20
30.3
%0
0.0
%5
25.0
%10
50.0
%3
15.0
%2
10.0
%20
30.8
%
- U
nlis
ted
14
30.4
%23
50.0
%8
17.4
%1
2.2
%46
69.7
%0
0.0
%2
4.4
%29
64.4
%11
24.4
%3
6.7
%45
69.2
%
To
tal
Ow
ners
hip
Str
uctu
re21
31.8
%32
48.5
%10
15.2
%3
4.5
%66
100
.0%
00
.0%
71
0.8
%39
60.0
%14
21.5
%5
7.7
%65
100
.0%
Ge
og
rap
hic
Sc
op
e -
Regio
nal
00
.0%
46
6.7
%1
16.7
%1
16.7
%6
9.1
%0
0.0
%1
16.7
%5
83.3
%0
0.0
%0
0.0
%6
9.2
%
- N
ational
11
30.6
%20
55.6
%3
8.3
%2
5.6
%36
54.5
%0
0.0
%4
11.4
%22
62.9
%6
17.1
%3
8.6
%35
53.8
%
- I
nte
rnational
10
41.7
%8
33.3
%6
25.0
%0
0.0
%24
36.4
%0
0.0
%2
8.3
%12
50.0
%8
33.3
%2
8.3
%24
36.9
%
To
tal
Ge
og
rap
hic
Sc
op
e21
31.8
%32
48.5
%10
15.2
%3
4.5
%66
100
.0%
00
.0%
71
0.8
%39
60.0
%14
21.5
%5
7.7
%65
100
.0%
Pro
jec
t S
ize
Cla
ss
ific
ati
on
- S
mall
(EU
R <
5 -
10 m
illio
n)
23
3.3
%4
66.7
%0
0.0
%0
0.0
%6
9.1
%0
0.0
%0
0.0
%5
83.3
%1
16.7
%0
0.0
%6
9.2
%
- M
ediu
m (
EU
R >
10 -
50 m
illio
n)
92
3.1
%21
53.8
%6
15.4
%3
7.7
%39
59.1
%0
0.0
%5
13.2
%24
63.2
%7
18.4
%2
5.3
%38
58.5
%
- L
arg
e (
EU
R >
50 -
250 m
illio
n)
10
47.6
%7
33.3
%4
19.0
%0
0.0
%21
31.8
%0
0.0
%2
9.5
%10
47.6
%6
28.6
%3
14.3
%21
32.3
%
To
tal
Pro
jec
t S
ize
Cla
ss
ific
ati
on
21
31.8
%32
48.5
%10
15.2
%3
4.5
%66
100
.0%
00
.0%
71
0.8
%39
60.0
%14
21.5
%5
7.7
%65
100
.0%
Ve
ry e
ffe
cti
ve
Hig
hV
ery
hig
hD
on
't k
no
wN
um
be
r o
f
Res
po
nse
s
Nu
mb
er
of
Res
po
nse
s
Ve
ry
Ine
ffe
cti
ve
Ine
ffe
cti
ve
Eff
ec
tive
Lo
wM
ed
ium
Ho
w s
ign
ific
an
t is
th
is r
isk
to
ac
hie
vin
g y
ou
r o
bje
cti
ve
s?
Ho
w e
ffe
cti
ve
are
yo
ur
pro
ce
ss
es
at
ma
nag
ing
th
is r
isk
?

257
8)
A larg
e n
um
ber
of
risks, w
hic
h m
ay a
ffect
the p
roje
cte
d r
etu
rn, ari
se d
uri
ng
pro
ject
develo
pm
en
t. P
lease f
ind
belo
w a
no
n-e
xh
au
sti
ve lis
t o
f th
ese r
isks.
P
lease e
valu
ate
th
e f
ollo
win
g r
isks o
n p
roje
ct
level re
gard
ing
th
eir
sig
nif
ican
ce t
o a
ch
ievin
g y
ou
r co
mp
an
y´s
ob
jecti
ves a
s w
ell a
s t
he e
ffecti
ven
ess o
f yo
ur
risk m
an
ag
em
en
t
p
rocesses t
o c
op
e w
ith
th
ose r
isks.
17 W
arr
an
ty e
xp
osu
re
To
tal
Res
po
nd
an
ts2
94
4.6
%2
53
8.5
%1
01
5.4
%1
1.5
%6
51
00
.0%
00
.0%
00
.0%
40
61
.5%
20
30
.8%
57
.7%
65
10
0.0
%
Deve
lop
er
Cla
ss
ific
ati
on
- M
ain
ly T
rader-
Develo
per
12
35.3
%15
44.1
%6
17.6
%1
2.9
%34
52.3
%0
0.0
%0
0.0
%18
51.4
%12
34.3
%5
14.3
%35
53.8
%
- M
ain
ly I
nvesto
r-D
evelo
per
17
54.8
%10
32.3
%4
12.9
%0
0.0
%31
47.7
%0
0.0
%0
0.0
%22
73.3
%8
26.7
%0
0.0
%30
46.2
%
To
tal
Deve
lop
er
Cla
ss
ific
ati
on
29
44.6
%25
38.5
%10
15.4
%1
1.5
%65
100
.0%
00
.0%
00
.0%
40
61.5
%20
30.8
%5
7.7
%65
100
.0%
Ow
ners
hip
str
uctu
re -
Lis
ted
13
68.4
%4
21.1
%1
5.3
%1
5.3
%19
29.2
%0
0.0
%0
0.0
%13
65.0
%4
20.0
%3
15.0
%20
30.8
%
- U
nlis
ted
16
34.8
%21
45.7
%9
19.6
%0
0.0
%46
70.8
%0
0.0
%0
0.0
%27
60.0
%16
35.6
%2
4.4
%45
69.2
%
To
tal
Ow
ners
hip
Str
uctu
re29
44.6
%25
38.5
%10
15.4
%1
1.5
%65
100
.0%
00
.0%
00
.0%
40
61.5
%20
30.8
%5
7.7
%65
100
.0%
Ge
og
rap
hic
Sc
op
e -
Regio
nal
11
6.7
%3
50.0
%1
16.7
%1
16.7
%6
9.2
%0
0.0
%0
0.0
%4
66.7
%2
33.3
%0
0.0
%6
9.2
%
- N
ational
19
52.8
%12
33.3
%5
13.9
%0
0.0
%36
55.4
%0
0.0
%0
0.0
%26
74.3
%7
20.0
%2
5.7
%35
53.8
%
- I
nte
rnational
93
9.1
%10
43.5
%4
17.4
%0
0.0
%23
35.4
%0
0.0
%0
0.0
%10
41.7
%11
45.8
%3
12.5
%24
36.9
%
To
tal
Ge
og
rap
hic
Sc
op
e29
44.6
%25
38.5
%10
15.4
%1
1.5
%65
100
.0%
00
.0%
00
.0%
40
61.5
%20
30.8
%5
7.7
%65
100
.0%
Pro
jec
t S
ize
Cla
ss
ific
ati
on
- S
mall
(EU
R <
5 -
10 m
illio
n)
12
0.0
%3
60.0
%1
20.0
%0
0.0
%5
7.7
%0
0.0
%0
0.0
%4
66.7
%1
16.7
%1
16.7
%6
9.2
%
- M
ediu
m (
EU
R >
10 -
50 m
illio
n)
18
46.2
%13
33.3
%7
17.9
%1
2.6
%39
60.0
%0
0.0
%0
0.0
%26
68.4
%11
28.9
%1
2.6
%38
58.5
%
- L
arg
e (
EU
R >
50 -
250 m
illio
n)
10
47.6
%9
42.9
%2
9.5
%0
0.0
%21
32.3
%0
0.0
%0
0.0
%10
47.6
%8
38.1
%3
14.3
%21
32.3
%
To
tal
Pro
jec
t S
ize
Cla
ss
ific
ati
on
29
44.6
%25
38.5
%10
15.4
%1
1.5
%65
100
.0%
00
.0%
00
.0%
40
61.5
%20
30.8
%5
7.7
%65
100
.0%
Do
n't
kn
ow
Nu
mb
er
of
Res
po
nse
s
Nu
mb
er
of
Res
po
nse
s
Ve
ry
Ine
ffe
cti
ve
Ine
ffe
cti
ve
Eff
ec
tive
Lo
wM
ed
ium
Hig
hV
ery
hig
hV
ery
eff
ec
tive
Ho
w s
ign
ific
an
t is
th
is r
isk
to
ac
hie
vin
g y
ou
r o
bje
cti
ve
s?
Ho
w e
ffe
cti
ve
are
yo
ur
pro
ce
ss
es
at
ma
nag
ing
th
is r
isk
?

258
8)
A larg
e n
um
ber
of
risks, w
hic
h m
ay a
ffect
the p
roje
cte
d r
etu
rn, ari
se d
uri
ng
pro
ject
develo
pm
en
t. P
lease f
ind
belo
w a
no
n-e
xh
au
sti
ve lis
t o
f th
ese r
isks.
P
lease e
valu
ate
th
e f
ollo
win
g r
isks o
n p
roje
ct
level re
gard
ing
th
eir
sig
nif
ican
ce t
o a
ch
ievin
g y
ou
r co
mp
an
y´s
ob
jecti
ves a
s w
ell a
s t
he e
ffecti
ven
ess o
f yo
ur
risk m
an
ag
em
en
t
p
rocesses t
o c
op
e w
ith
th
ose r
isks.
18 O
ther
To
tal
Res
po
nd
an
ts0
0.0
%0
0.0
%0
0.0
%1
10
0.0
%1
10
0.0
%0
0.0
%0
0.0
%1
10
0.0
%0
0.0
%0
0.0
%1
10
0.0
%
Deve
lop
er
Cla
ss
ific
ati
on
- M
ain
ly T
rader-
Develo
per
00
.0%
00
.0%
00
.0%
01
00
.0%
00
.0%
00
.0%
00
.0%
01
00
.0%
00
.0%
00
.0%
00
.0%
- M
ain
ly I
nvesto
r-D
evelo
per
00
.0%
00
.0%
00
.0%
10
.0%
11
00
.0%
00
.0%
00
.0%
10
.0%
00
.0%
00
.0%
11
00
.0%
To
tal
Deve
lop
er
Cla
ss
ific
ati
on
00
.0%
00
.0%
00
.0%
11
00
.0%
11
00
.0%
00
.0%
00
.0%
11
00
.0%
00
.0%
00
.0%
11
00
.0%
Ow
ners
hip
str
uctu
re -
Lis
ted
00
.0%
00
.0%
00
.0%
00
.0%
00
.0%
00
.0%
00
.0%
00
.0%
00
.0%
00
.0%
00
.0%
- U
nlis
ted
00
.0%
00
.0%
00
.0%
11
00
.0%
11
00
.0%
00
.0%
00
.0%
11
00
.0%
00
.0%
00
.0%
11
00
.0%
To
tal
Ow
ners
hip
Str
uctu
re0
0.0
%0
0.0
%0
0.0
%1
100
.0%
11
00
.0%
00
.0%
00
.0%
11
00
.0%
00
.0%
00
.0%
11
00
.0%
Ge
og
rap
hic
Sc
op
e -
Regio
nal
00
.0%
00
.0%
00
.0%
00
.0%
00
.0%
00
.0%
00
.0%
00
.0%
00
.0%
00
.0%
00
.0%
- N
ational
00
.0%
00
.0%
00
.0%
10
.0%
11
00
.0%
00
.0%
00
.0%
10
.0%
00
.0%
00
.0%
11
00
.0%
- I
nte
rnational
00
.0%
00
.0%
00
.0%
00
.0%
00
.0%
00
.0%
00
.0%
00
.0%
00
.0%
00
.0%
00
.0%
To
tal
Ge
og
rap
hic
Sc
op
e0
0.0
%0
0.0
%0
0.0
%1
100
.0%
11
00
.0%
00
.0%
00
.0%
11
00
.0%
00
.0%
00
.0%
11
00
.0%
Pro
jec
t S
ize
Cla
ss
ific
ati
on
- S
mall
(EU
R <
5 -
10 m
illio
n)
00
.0%
00
.0%
00
.0%
10
.0%
11
00
.0%
00
.0%
00
.0%
10
.0%
00
.0%
00
.0%
11
00
.0%
- M
ediu
m (
EU
R >
10 -
50 m
illio
n)
00
.0%
00
.0%
00
.0%
01
00
.0%
00
.0%
00
.0%
00
.0%
01
00
.0%
00
.0%
00
.0%
00
.0%
- L
arg
e (
EU
R >
50 -
250 m
illio
n)
00
.0%
00
.0%
00
.0%
00
.0%
00
.0%
00
.0%
00
.0%
00
.0%
00
.0%
00
.0%
00
.0%
To
tal
Pro
jec
t S
ize
Cla
ss
ific
ati
on
00
.0%
00
.0%
00
.0%
11
00
.0%
11
00
.0%
00
.0%
00
.0%
11
00
.0%
00
.0%
00
.0%
11
00
.0%
Ve
ry e
ffe
cti
ve
Do
n't
kn
ow
Nu
mb
er
of
Res
po
nse
s
Nu
mb
er
of
Res
po
nse
s
Ve
ry
Ine
ffe
cti
ve
Ine
ffe
cti
ve
Eff
ec
tive
Lo
wM
ed
ium
Hig
hV
ery
hig
h
Ho
w s
ign
ific
an
t is
th
is r
isk
to
ac
hie
vin
g y
ou
r o
bje
cti
ve
s?
Ho
w e
ffe
cti
ve
are
yo
ur
pro
ce
ss
es
at
ma
nag
ing
th
is r
isk
?

259
9) In the last five years the level of risk faced by the comapany has….
Total Respondants 39 56,5% 14 20,3% 14 20,3% 2 2,9% 69 100,0%
Developer Classification
- Mainly Trader-Developer 21 56,8% 7 18,9% 7 18,9% 2 5,4% 37 53,6%
- Mainly Investor-Developer 18 56,3% 7 21,9% 7 21,9% 0 0,0% 32 46,4%
Total Developer Classification 39 56,5% 14 20,3% 14 20,3% 2 2,9% 69 100,0%
p value (Fisher's exact test) 0,715 φ(Phi) 0,165 Cramer`s V 0,165
Ownership structure
- Listed 12 52,2% 6 26,1% 4 17,4% 1 4,3% 23 33,3%
- Unlisted 27 58,7% 8 17,4% 10 21,7% 1 2,2% 46 66,7%
Total Ownership Structure 39 56,5% 14 20,3% 14 20,3% 2 2,9% 69 100,0%
p value (Fisher's exact test) 0,756 φ(Phi) 0,125 Cramer`s V 0,125
Geographic Scope
- Regional 2 33,3% 3 50,0% 1 16,7% 0 0,0% 6 8,7%
- National 22 61,1% 9 25,0% 4 11,1% 1 2,8% 36 52,2%
- International 15 55,6% 2 7,4% 9 33,3% 1 3,7% 27 39,1%
Total Geographic Scope 39 56,5% 14 20,3% 14 20,3% 2 2,9% 69 100,0%
p value (Fisher's exact test) 0,070 φ(Phi) 0,380 Cramer`s V 0,269
Project Size Classification
- Small (EUR < 5 - 10 million) 0 0,0% 5 71,4% 1 14,3% 1 14,3% 7 10,1%
- Medium (EUR > 10 - 50 million) 25 62,5% 7 17,5% 8 20,0% 0 0,0% 40 58,0%
- Large (EUR > 50 - 250 million) 14 63,6% 2 9,1% 5 22,7% 1 4,5% 22 31,9%
Total Project Size Classification 39 56,5% 14 20,3% 14 20,3% 2 2,9% 69 100,0%
p value (Fisher's exact test) 0,002 φ(Phi) 0,533 Cramer`s V 0,377
Number of
ResponsesIncreased Decreased Not changed Not sure

260
10) Does the company overall regard itself as having a risk taking or risk adverse
culture compared to its relevant competitors?
Total Respondants 10 14,5% 38 55,1% 21 30,4% 69 100,0%
Developer Classification
- Mainly Trader-Developer 5 13,5% 21 56,8% 11 29,7% 37 53,6%
- Mainly Investor-Developer 5 15,6% 17 53,1% 10 31,3% 32 46,4%
Total Developer Classification 10 14,5% 38 55,1% 21 30,4% 69 100,0%
p value (Fisher's exact test) 1,000 φ(Phi) 0,039 Cramer`s V 0,039
Ownership structure
- Listed 2 8,7% 12 52,2% 9 39,1% 23 33,3%
- Unlisted 8 17,4% 26 56,5% 12 26,1% 46 66,7%
Total Ownership Structure 10 14,5% 38 55,1% 21 30,4% 69 100,0%
p value (Fisher's exact test) 0,434 φ(Phi) 0,157 Cramer`s V 0,157
Geographic Scope
- Regional 0 0,0% 4 66,7% 2 33,3% 6 8,7%
- National 4 11,1% 19 52,8% 13 36,1% 36 52,2%
- International 6 22,2% 15 55,6% 6 22,2% 27 39,1%
Total Geographic Scope 10 14,5% 38 55,1% 21 30,4% 69 100,0%
p value (Fisher's exact test) 0,552 φ(Phi) 0,223 Cramer`s V 0,158
Project Size Classification
- Small (EUR < 5 - 10 million) 2 28,6% 3 42,9% 2 28,6% 7 10,1%
- Medium (EUR > 10 - 50 million) 4 10,0% 23 57,5% 13 32,5% 40 58,0%
- Large (EUR > 50 - 250 million) 4 18,2% 12 54,5% 6 27,3% 22 31,9%
Total Project Size Classification 10 14,5% 38 55,1% 21 30,4% 69 100,0%
p value (Fisher's exact test) 0,675 φ(Phi) 0,174 Cramer`s V 0,123
More risk
taking
Comparable
risk taking
More risk
adverse
Number of
Responses

261
1
1)
Wh
at
are
th
e d
rive
rs f
or
imp
lem
en
tin
g r
isk
ma
na
ge
me
nt
in y
ou
r c
om
pa
ny?
Mu
ltip
le r
es
po
ns
es
are
po
ss
ible
To
tal
Res
po
nd
an
ts4
82
2.2
%1
56
.9%
30
13
.9%
15
6.9
%3
21
4.8
%3
01
3.9
%4
1.9
%1
88
.3%
19
8.8
%5
2.3
%2
16
10
0.0
%
Deve
lop
er
Cla
ss
ific
ati
on
- M
ain
ly T
rader-
Develo
per
24
21.1
%7
6.1
%19
16.7
%7
6.1
%15
13.2
%17
14.9
%2
1.8
%9
7.9
%12
10.5
%2
1.8
%114
52.8
%
- M
ain
ly I
nvesto
r-D
evelo
per
24
23.5
%8
7.8
%11
10.8
%8
7.8
%17
16.7
%13
12.7
%2
2.0
%9
8.8
%7
6.9
%3
2.9
%102
47.2
%
To
tal
Deve
lop
er
Cla
ss
ific
ati
on
48
22.2
%15
6.9
%30
13.9
%15
6.9
%32
14.8
%30
13.9
%4
1.9
%18
8.3
%19
8.8
%5
2.3
%216
100.0
%
x2
(ch
i-sq
uare
) 3.7
86
φ(P
hi)
0.1
32
p-v
alu
e0.9
25
Cra
mer`
s V
0.1
32
Ow
ners
hip
str
uctu
re
- L
iste
d18
24.3
%5
6.8
%10
13.5
%4
5.4
%12
16.2
%9
12.2
%1
1.4
%6
8.1
%7
9.5
%2
2.7
%74
34.3
%
- U
nlis
ted
30
21.1
%10
7.0
%20
14.1
%11
7.7
%20
14.1
%21
14.8
%3
2.1
%12
8.5
%12
8.5
%3
2.1
%142
65.7
%
To
tal
Ow
ners
hip
Str
uctu
re48
22.2
%15
6.9
%30
13.9
%15
6.9
%32
14.8
%30
13.9
%4
1.9
%18
8.3
%19
8.8
%5
2.3
%216
100.0
%
x2
(ch
i-sq
uare
) 1.3
04
φ(P
hi)
0.0
78
p-v
alu
e0.9
98
Cra
mer`
s V
0.0
78
Ge
og
rap
hic
Sc
op
e
- R
egio
nal
320.0
%0
0.0
%1
6.7
%2
13.3
%3
20.0
%2
13.3
%1
6.7
%2
13.3
%1
6.7
%0
0.0
%15
6.9
%
- N
ational
23
20.0
%8
7.0
%19
16.5
%9
7.8
%16
13.9
%16
13.9
%2
1.7
%8
7.0
%10
8.7
%4
3.5
%115
53.2
%
- I
nte
rnational
22
25.6
%7
8.1
%10
11.6
%4
4.7
%13
15.1
%12
14.0
%1
1.2
%8
9.3
%8
9.3
%1
1.2
%86
39.8
%
To
tal
Ge
og
rap
hic
Sc
op
e48
22.2
%15
6.9
%30
13.9
%15
6.9
%32
14.8
%30
13.9
%4
1.9
%18
8.3
%19
8.8
%5
2.3
%216
100.0
%
x2
(ch
i-sq
uare
) 9.9
35
φ(P
hi)
0.2
14
p-v
alu
e0.9
34
Cra
mer`
s V
0.1
52
Pro
jec
t S
ize
Cla
ss
ific
ati
on
- S
mall
(EU
R <
5 -
10 m
illio
n)
321.4
%1
7.1
%3
21.4
%1
7.1
%2
14.3
%0
0.0
%0
0.0
%2
14.3
%1
7.1
%1
7.1
%14
6.5
%
- M
ediu
m (
EU
R >
10 -
50 m
illio
n)
26
20.5
%8
6.3
%19
15.0
%9
7.1
%21
16.5
%18
14.2
%4
3.1
%9
7.1
%11
8.7
%2
1.6
%127
58.8
%
- L
arg
e (
EU
R >
50 -
250 m
illio
n)
19
25.3
%6
8.0
%8
10.7
%5
6.7
%9
12.0
%12
16.0
%0
0.0
%7
9.3
%7
9.3
%2
2.7
%75
34.7
%
To
tal
Pro
jec
t S
ize
Cla
ss
ific
ati
on
48
22.2
%15
6.9
%30
13.9
%15
6.9
%32
14.8
%30
13.9
%4
1.9
%18
8.3
%19
8.8
%5
2.3
%216
100.0
%
x2
(ch
i-sq
uare
) 10.3
51
φ(P
hi)
0.2
19
p-v
alu
e0.9
20
Cra
mer`
s V
0.1
55
Req
uest
of
risk
man
ag
e-m
en
t o
r
sen
ior
lead
ers
hip
Cli
en
t
exp
ecta
tio
ns
Co
ntr
ol
/
red
ucti
on
of
op
era
tio
nal
losses
Resp
on
se t
o
reg
ula
tory
acti
vit
y (
e.g
.
Basel
II)
Develo
p a
co
mp
eti
tive
ad
va
nta
ge
Ne
ed
fo
r m
ore
inte
gra
ted
decis
ion
-
ma
kin
g
Fo
llo
win
g a
n
ind
ustr
y t
ren
d
Au
dit
req
uir
e-
men
ts
Cap
ital
all
ocati
on
pro
cess n
eed
s
imp
rovem
en
t
Oth
er
Nu
mb
er
of
Res
po
nse
s

262
12) Please evaluate the following aspects/features of your risk management:
1 Effective risk management is important in the achievement of the company´s objectives
Total Respondants 0 0,0% 1 1,5% 29 43,3% 37 55,2% 67 100,0%
Developer Classification
- Mainly Trader-Developer 0 0,0% 0 0,0% 21 58,3% 15 41,7% 36 53,7%
- Mainly Investor-Developer 0 0,0% 1 3,2% 8 25,8% 22 71,0% 31 46,3%
Total Developer Classification 0 0,0% 1 1,5% 29 43,3% 37 55,2% 67 100,0%
p value (Fisher's exact test) 0,013 φ(Phi) 0,342 Cramer`s V 0,342
Ownership structure
- Listed 0 0,0% 0 0,0% 9 39,1% 14 60,9% 23 34,3%
- Unlisted 0 0,0% 1 2,3% 20 45,5% 23 52,3% 44 65,7%
Total Ownership Structure 0 0,0% 1 1,5% 29 43,3% 37 55,2% 67 100,0%
p value (Fisher's exact test) 0,000 φ(Phi) 0,114 Cramer`s V 0,114
Geographic Scope
- Regional 0 0,0% 1 16,7% 1 16,7% 4 66,7% 6 9,0%
- National 0 0,0% 0 0,0% 17 48,6% 18 51,4% 35 52,2%
- International 0 0,0% 0 0,0% 11 42,3% 15 57,7% 26 38,8%
Total Geographic Scope 0 0,0% 1 1,5% 29 43,3% 37 55,2% 67 100,0%
p value (Fisher's exact test) 0,148 φ(Phi) 0,417 Cramer`s V 0,295
Project Size Classification
- Small (EUR < 5 - 10 million) 0 0,0% 0 0,0% 5 71,4% 2 28,6% 7 10,4%
- Medium (EUR > 10 - 50 million) 0 0,0% 1 2,6% 18 47,4% 19 50,0% 38 56,7%
- Large (EUR > 50 - 250 million) 0 0,0% 0 0,0% 6 27,3% 16 72,7% 22 32,8%
Total Project Size Classification 0 0,0% 1 1,5% 29 43,3% 37 55,2% 67 100,0%
p value (Fisher's exact test) 0,159 φ(Phi) 0,294 Cramer`s V 0,208
AgreeStrongly
agree
Number of
Responses
Strongly
disagreeDisagree

263
12) Please evaluate the following aspects/features of your risk management:
2 The company supports taking risks to achieve objectives
Total Respondants 1 1,5% 13 19,7% 44 66,7% 8 12,1% 66 100,0%
Developer Classification
- Mainly Trader-Developer 1 2,8% 8 22,2% 22 61,1% 5 13,9% 36 54,5%
- Mainly Investor-Developer 0 0,0% 5 16,7% 22 73,3% 3 10,0% 30 45,5%
Total Developer Classification 1 1,5% 13 19,7% 44 66,7% 8 12,1% 66 100,0%
p value (Fisher's exact test) 0,742 φ(Phi) 0,159 Cramer`s V 0,159
Ownership structure
- Listed 0 0,0% 8 36,4% 10 45,5% 4 18,2% 22 33,3%
- Unlisted 1 2,3% 5 11,4% 34 77,3% 4 9,1% 44 66,7%
Total Ownership Structure 1 1,5% 13 19,7% 44 66,7% 8 12,1% 66 100,0%
p value (Fisher's exact test) 0,023 φ(Phi) 0,356 Cramer`s V 0,356
Geographic Scope
- Regional 0 0,0% 1 16,7% 3 50,0% 2 33,3% 6 9,1%
- National 1 2,9% 10 29,4% 19 55,9% 4 11,8% 34 51,5%
- International 0 0,0% 2 7,7% 22 84,6% 2 7,7% 26 39,4%
Total Geographic Scope 1 1,5% 13 19,7% 44 66,7% 8 12,1% 66 100,0%
p value (Fisher's exact test) 0,092 φ(Phi) 0,374 Cramer`s V 0,265
Project Size Classification
- Small (EUR < 5 - 10 million) 0 0,0% 1 14,3% 5 71,4% 1 14,3% 7 10,6%
- Medium (EUR > 10 - 50 million) 1 2,7% 10 27,0% 23 62,2% 3 8,1% 37 56,1%
- Large (EUR > 50 - 250 million) 0 0,0% 2 9,1% 16 72,7% 4 18,2% 22 33,3%
Total Project Size Classification 1 1,5% 13 19,7% 44 66,7% 8 12,1% 66 100,0%
p value (Fisher's exact test) 0,597 φ(Phi) 0,264 Cramer`s V 0,187
Strongly
disagreeDisagree Agree
Strongly
agree
Number of
Responses

264
12) Please evaluate the following aspects/features of your risk management:
3 The company knows how much risk it may take in the achievement of its objectives
Total Respondants 0 0,0% 10 14,9% 38 56,7% 19 28,4% 67 100,0%
Developer Classification
- Mainly Trader-Developer 0 0,0% 7 19,4% 22 61,1% 7 19,4% 36 53,7%
- Mainly Investor-Developer 0 0,0% 3 9,7% 16 51,6% 12 38,7% 31 46,3%
Total Developer Classification 0 0,0% 10 14,9% 38 56,7% 19 28,4% 67 100,0%
p value (Fisher's exact test) 0,174 φ(Phi) 0,229 Cramer`s V 0,229
Ownership structure
- Listed 0 0,0% 4 17,4% 13 56,5% 6 26,1% 23 34,3%
- Unlisted 0 0,0% 6 13,6% 25 56,8% 13 29,5% 44 65,7%
Total Ownership Structure 0 0,0% 10 14,9% 38 56,7% 19 28,4% 67 100,0%
p value (Fisher's exact test) 0,879 φ(Phi) 0,056 Cramer`s V 0,056
Geographic Scope
- Regional 0 0,0% 0 0,0% 5 83,3% 1 16,7% 6 9,0%
- National 0 0,0% 7 20,0% 19 54,3% 9 25,7% 35 52,2%
- International 0 0,0% 3 11,5% 14 53,8% 9 34,6% 26 38,8%
Total Geographic Scope 0 0,0% 10 14,9% 38 56,7% 19 28,4% 67 100,0%
p value (Fisher's exact test) 0,668 φ(Phi) 0,220 Cramer`s V 0,156
Project Size Classification
- Small (EUR < 5 - 10 million) 0 0,0% 1 14,3% 3 42,9% 3 42,9% 7 10,4%
- Medium (EUR > 10 - 50 million) 0 0,0% 6 15,8% 23 60,5% 9 23,7% 38 56,7%
- Large (EUR > 50 - 250 million) 0 0,0% 3 13,6% 12 54,5% 7 31,8% 22 32,8%
Total Project Size Classification 0 0,0% 10 14,9% 38 56,7% 19 28,4% 67 100,0%
p value (Fisher's exact test) 0,841 φ(Phi) 0,139 Cramer`s V 0,099
Strongly
disagreeDisagree Agree
Strongly
agree
Number of
Responses

265
12) Please evaluate the following aspects/features of your risk management:
4 Risk is looked upon as an opportunity as well as a threat by the enterprise in the achievement
of the company’s objectives
Total Respondants 1 1,5% 11 16,7% 29 43,9% 25 37,9% 66 100,0%
Developer Classification
- Mainly Trader-Developer 1 2,9% 5 14,3% 16 45,7% 13 37,1% 35 53,0%
- Mainly Investor-Developer 0 0,0% 6 19,4% 13 41,9% 12 38,7% 31 47,0%
Total Developer Classification 1 1,5% 11 16,7% 29 43,9% 25 37,9% 66 100,0%
p value (Fisher's exact test) 0,971 φ(Phi) 0,135 Cramer`s V 0,135
Ownership structure
- Listed 0 0,0% 6 27,3% 8 36,4% 8 36,4% 22 33,3%
- Unlisted 1 2,3% 5 11,4% 21 47,7% 17 38,6% 44 66,7%
Total Ownership Structure 1 1,5% 11 16,7% 29 43,9% 25 37,9% 66 100,0%
p value (Fisher's exact test) 0,369 φ(Phi) 0,219 Cramer`s V 0,219
Geographic Scope
- Regional 0 0,0% 0 0,0% 3 50,0% 3 50,0% 6 9,1%
- National 1 2,9% 8 22,9% 17 48,6% 9 25,7% 35 53,0%
- International 0 0,0% 3 12,0% 9 36,0% 13 52,0% 25 37,9%
Total Geographic Scope 1 1,5% 11 16,7% 29 43,9% 25 37,9% 66 100,0%
p value (Fisher's exact test) 0,334 φ(Phi) 0,314 Cramer`s V 0,222
Project Size Classification
- Small (EUR < 5 - 10 million) 1 14,3% 0 0,0% 4 57,1% 2 28,6% 7 10,6%
- Medium (EUR > 10 - 50 million) 0 0,0% 6 15,8% 21 55,3% 11 28,9% 38 57,6%
- Large (EUR > 50 - 250 million) 0 0,0% 5 23,8% 4 19,0% 12 57,1% 21 31,8%
Total Project Size Classification 1 1,5% 11 16,7% 29 43,9% 25 37,9% 66 100,0%
p value (Fisher's exact test) 0,016 φ(Phi) 0,517 Cramer`s V 0,365
Strongly
disagreeDisagree Agree
Strongly
agree
Number of
Responses

266
12) Please evaluate the following aspects/features of your risk management:
5 There is a common understanding / terminology of risk management across the company
Total Respondants 1 1,5% 24 35,8% 34 50,7% 8 11,9% 67 100,0%
Developer Classification
- Mainly Trader-Developer 1 2,8% 16 44,4% 16 44,4% 3 8,3% 36 53,7%
- Mainly Investor-Developer 0 0,0% 8 25,8% 18 58,1% 5 16,1% 31 46,3%
Total Developer Classification 1 1,5% 24 35,8% 34 50,7% 8 11,9% 67 100,0%
p value (Fisher's exact test) 0,234 φ(Phi) 0,242 Cramer`s V 0,242
Ownership structure
- Listed 0 0,0% 6 26,1% 14 60,9% 3 13,0% 23 34,3%
- Unlisted 1 2,3% 18 40,9% 20 45,5% 5 11,4% 44 65,7%
Total Ownership Structure 1 1,5% 24 35,8% 34 50,7% 8 11,9% 67 100,0%
p value (Fisher's exact test) 0,589 φ(Phi) 0,181 Cramer`s V 0,181
Geographic Scope
- Regional 0 0,0% 3 50,0% 1 16,7% 2 33,3% 6 9,0%
- National 1 2,9% 16 45,7% 14 40,0% 4 11,4% 35 52,2%
- International 0 0,0% 5 19,2% 19 73,1% 2 7,7% 26 38,8%
Total Geographic Scope 1 1,5% 24 35,8% 34 50,7% 8 11,9% 67 100,0%
p value (Fisher's exact test) 0,032 φ(Phi) 0,417 Cramer`s V 0,295
Project Size Classification
- Small (EUR < 5 - 10 million) 0 0,0% 3 42,9% 3 42,9% 1 14,3% 7 10,4%
- Medium (EUR > 10 - 50 million) 1 2,6% 13 34,2% 20 52,6% 4 10,5% 38 56,7%
- Large (EUR > 50 - 250 million) 0 0,0% 8 36,4% 11 50,0% 3 13,6% 22 32,8%
Total Project Size Classification 1 1,5% 24 35,8% 34 50,7% 8 11,9% 67 100,0%
p value (Fisher's exact test) 0,990 φ(Phi) 0,131 Cramer`s V 0,093
Strongly
disagreeDisagree Agree
Strongly
agree
Number of
Responses

267
12) Please evaluate the following aspects/features of your risk management:
6 The company includes risk management as an integral component in all the relevant strategy,
control and monitoring processes
Total Respondants 1 1,5% 17 25,4% 33 49,3% 16 23,9% 67 100,0%
Developer Classification
- Mainly Trader-Developer 1 2,8% 11 30,6% 16 44,4% 8 22,2% 36 53,7%
- Mainly Investor-Developer 0 0,0% 6 19,4% 17 54,8% 8 25,8% 31 46,3%
Total Developer Classification 1 1,5% 17 25,4% 33 49,3% 16 23,9% 67 100,0%
p value (Fisher's exact test) 0,633 φ(Phi) 0,179 Cramer`s V 0,179
Ownership structure
- Listed 0 0,0% 4 17,4% 11 47,8% 8 34,8% 23 34,3%
- Unlisted 1 2,3% 13 29,5% 22 50,0% 8 18,2% 44 65,7%
Total Ownership Structure 1 1,5% 17 25,4% 33 49,3% 16 23,9% 67 100,0%
p value (Fisher's exact test) 0,359 φ(Phi) 0,217 Cramer`s V 0,217
Geographic Scope
- Regional 0 0,0% 2 33,3% 3 50,0% 1 16,7% 6 9,0%
- National 1 2,9% 11 31,4% 13 37,1% 10 28,6% 35 52,2%
- International 0 0,0% 4 15,4% 17 65,4% 5 19,2% 26 38,8%
Total Geographic Scope 1 1,5% 17 25,4% 33 49,3% 16 23,9% 67 100,0%
p value (Fisher's exact test) 0,370 φ(Phi) 0,292 Cramer`s V 0,206
Project Size Classification
- Small (EUR < 5 - 10 million) 0 0,0% 1 14,3% 5 71,4% 1 14,3% 7 10,4%
- Medium (EUR > 10 - 50 million) 1 2,6% 10 26,3% 16 42,1% 11 28,9% 38 56,7%
- Large (EUR > 50 - 250 million) 0 0,0% 6 27,3% 12 54,5% 4 18,2% 22 32,8%
Total Project Size Classification 1 1,5% 17 25,4% 33 49,3% 16 23,9% 67 100,0%
p value (Fisher's exact test) 0,808 φ(Phi) 0,223 Cramer`s V 0,158
Strongly
disagreeDisagree Agree
Strongly
agree
Number of
Responses

268
13
) W
ho
ha
s p
rim
ary
ris
k m
an
ag
em
en
t re
sp
on
sib
ilit
y?
Mu
ltip
le r
es
po
ns
es
are
po
ss
ible
To
tal
Re
sp
on
da
nts
45
25
.4%
28
15
.8%
74
.0%
74
.0%
84
.5%
31
17
.5%
52
.8%
20
11
.3%
31
.7%
10
5.6
%6
3.4
%3
1.7
%4
2.3
%1
77
10
0.0
%
De
ve
lop
er
Cla
ss
ific
ati
on
- M
ain
ly T
rader-
Develo
per
29
28.7
%15
14.9
%4
4.0
%3
3.0
%4
4.0
%17
16.8
%3
3.0
%13
12.9
%0
0.0
%5
5.0
%4
4.0
%0
0.0
%4
4.0
%101
57.1
%
- M
ain
ly I
nvesto
r-D
evelo
per
16
21.1
%13
17.1
%3
3.9
%4
5.3
%4
5.3
%14
18.4
%2
2.6
%7
9.2
%3
3.9
%5
6.6
%2
2.6
%3
3.9
%0
0.0
%76
42.9
%
To
tal
De
ve
lop
er
Cla
ss
ific
ati
on
45
25.4
%28
15.8
%7
4.0
%7
4.0
%8
4.5
%31
17.5
%5
2.8
%20
11.3
%3
1.7
%10
5.6
%6
3.4
%3
1.7
%4
2.3
%177
100
.0%
Ow
ne
rsh
ip s
tru
ctu
re
- L
iste
d14
23.3
%8
13.3
%3
5.0
%3
5.0
%3
5.0
%13
21.7
%3
5.0
%4
6.7
%2
3.3
%3
5.0
%3
5.0
%0
0.0
%1
1.7
%60
33.9
%
- U
nlis
ted
31
26.5
%20
17.1
%4
3.4
%4
3.4
%5
4.3
%18
15.4
%2
1.7
%16
13.7
%1
0.9
%7
6.0
%3
2.6
%3
2.6
%3
2.6
%117
66.1
%
To
tal
Ow
ne
rsh
ip S
tru
ctu
re45
25.4
%28
15.8
%7
4.0
%7
4.0
%8
4.5
%31
17.5
%5
2.8
%20
11.3
%3
1.7
%10
5.6
%6
3.4
%3
1.7
%4
2.3
%177
100
.0%
Ge
og
rap
hic
Sc
op
e
- R
egio
nal
52
7.8
%2
11.1
%1
5.6
%1
5.6
%2
11.1
%2
11.1
%1
5.6
%1
5.6
%0
0.0
%1
5.6
%1
5.6
%1
5.6
%0
0.0
%18
10.2
%
- N
ational
26
26.8
%16
16.5
%2
2.1
%5
5.2
%2
2.1
%17
17.5
%2
2.1
%10
10.3
%3
3.1
%7
7.2
%3
3.1
%1
1.0
%3
3.1
%97
54.8
%
- I
nte
rnational
14
22.6
%10
16.1
%4
6.5
%1
1.6
%4
6.5
%12
19.4
%2
3.2
%9
14.5
%0
0.0
%2
3.2
%2
3.2
%1
1.6
%1
1.6
%62
35.0
%
To
tal
Ge
og
rap
hic
Sc
op
e45
25.4
%28
15.8
%7
4.0
%7
4.0
%8
4.5
%31
17.5
%5
2.8
%20
11.3
%3
1.7
%10
5.6
%6
3.4
%3
1.7
%4
2.3
%177
100
.0%
Pro
jec
t S
ize
Cla
ss
ific
ati
on
- S
mall
(EU
R <
5 -
10 m
illio
n)
52
2.7
%3
13.6
%1
4.5
%1
4.5
%2
9.1
%4
18.2
%2
9.1
%0
0.0
%0
0.0
%2
9.1
%2
9.1
%0
0.0
%0
0.0
%22
12.4
%
- M
ediu
m (
EU
R >
10 -
50 m
illio
n)
28
28.3
%16
16.2
%3
3.0
%3
3.0
%2
2.0
%18
18.2
%1
1.0
%12
12.1
%2
2.0
%6
6.1
%2
2.0
%2
2.0
%4
4.0
%99
55.9
%
- L
arg
e (
EU
R >
50 -
250 m
illio
n)
12
21.4
%9
16.1
%3
5.4
%3
5.4
%4
7.1
%9
16.1
%2
3.6
%8
14.3
%1
1.8
%2
3.6
%2
3.6
%1
1.8
%0
0.0
%56
31.6
%
To
tal
Pro
jec
t S
ize
Cla
ss
ific
ati
on
45
25.4
%28
15.8
%7
4.0
%7
4.0
%8
4.5
%31
17.5
%5
2.8
%20
11.3
%3
1.7
%10
5.6
%6
3.4
%3
1.7
%4
2.3
%177
100
.0%
Ch
ief
Ex
ec
uti
ve
Off
ice
r (C
EO
)
Ch
ief
Fin
an
cia
l
Off
ice
r (C
FO
)
Ch
ief
Ris
k
Off
ice
r (C
RO
)T
rea
su
rer
Ch
ief
Ad
min
istr
ati
on
or
Op
era
tio
ns
Off
ice
r
Bu
sin
es
s u
nit
ex
ec
uti
ve
s
Cro
ss
-
fun
cti
on
al
or
div
isio
na
l
tea
m
Ex
ec
uti
ve
Co
mm
itte
e
Au
dit
Co
mm
itte
e
Fin
an
cia
l
Co
ntr
oll
er
Ris
k
Ma
na
ge
me
nt
Co
mm
itte
e
No
dir
ec
t
res
po
ns
ibil
ity
de
fin
ed
Oth
er
To
tal

269
14) Please evaluate the following aspects/features of your risk management:
1 There is a consistent risk assessment methodology applied throughout the company, including
estimating the significance of risks, assessing the likelihood of their occurrence, determining
treatments, monitoring and assurance requirements
Total Respondants 3 4,4% 27 39,7% 27 39,7% 11 16,2% 68 100,0%
Developer Classification
- Mainly Trader-Developer 1 2,8% 19 52,8% 12 33,3% 4 11,1% 36 52,9%
- Mainly Investor-Developer 2 6,3% 8 25,0% 15 46,9% 7 21,9% 32 47,1%
Total Developer Classification 3 4,4% 27 39,7% 27 39,7% 11 16,2% 68 100,0%
p value (Fisher's exact test) 0,102 φ(Phi) 0,291 Cramer`s V 0,291
Ownership structure
- Listed 2 8,7% 7 30,4% 9 39,1% 5 21,7% 23 33,8%
- Unlisted 1 2,2% 20 44,4% 18 40,0% 6 13,3% 45 66,2%
Total Ownership Structure 3 4,4% 27 39,7% 27 39,7% 11 16,2% 68 100,0%
p value (Fisher's exact test) 0,401 φ(Phi) 0,205 Cramer`s V 0,205
Geographic Scope
- Regional 0 0,0% 3 50,0% 3 50,0% 0 0,0% 6 8,8%
- National 3 8,3% 14 38,9% 12 33,3% 7 19,4% 36 52,9%
- International 0 0,0% 10 38,5% 12 46,2% 4 15,4% 26 38,2%
Total Geographic Scope 3 4,4% 27 39,7% 27 39,7% 11 16,2% 68 100,0%
p value (Fisher's exact test) 0,695 φ(Phi) 0,267 Cramer`s V 0,189
Project Size Classification
- Small (EUR < 5 - 10 million) 0 0,0% 3 42,9% 4 57,1% 0 0,0% 7 10,3%
- Medium (EUR > 10 - 50 million) 2 5,1% 17 43,6% 13 33,3% 7 17,9% 39 57,4%
- Large (EUR > 50 - 250 million) 1 4,5% 7 31,8% 10 45,5% 4 18,2% 22 32,4%
Total Project Size Classification 3 4,4% 27 39,7% 27 39,7% 11 16,2% 68 100,0%
p value (Fisher's exact test) 0,849 φ(Phi) 0,218 Cramer`s V 0,154
Strongly
disagreeDisagree Agree
Strongly
agree
Number of
Responses

270
14) Please evaluate the following aspects/features of your risk management:
2 The company finds it difficult to identify its main risks
Total Respondants 23 33,3% 41 59,4% 4 5,8% 1 1,4% 69 100,0%
Developer Classification
- Mainly Trader-Developer 10 27,0% 26 70,3% 0 0,0% 1 2,7% 37 53,6%
- Mainly Investor-Developer 13 40,6% 15 46,9% 4 12,5% 0 0,0% 32 46,4%
Total Developer Classification 23 33,3% 41 59,4% 4 5,8% 1 1,4% 69 100,0%
p value (Fisher's exact test) 0,025 φ(Phi) 0,341 Cramer`s V 0,341
Ownership structure
- Listed 11 47,8% 11 47,8% 1 4,3% 0 0,0% 23 33,3%
- Unlisted 12 26,1% 30 65,2% 3 6,5% 1 2,2% 46 66,7%
Total Ownership Structure 23 33,3% 41 59,4% 4 5,8% 1 1,4% 69 100,0%
p value (Fisher's exact test) 0,031 φ(Phi) 0,228 Cramer`s V 0,228
Geographic Scope
- Regional 0 0,0% 6 100,0% 0 0,0% 0 0,0% 6 8,7%
- National 13 36,1% 20 55,6% 2 5,6% 1 2,8% 36 52,2%
- International 10 37,0% 15 55,6% 2 7,4% 0 0,0% 27 39,1%
Total Geographic Scope 23 33,3% 41 59,4% 4 5,8% 1 1,4% 69 100,0%
p value (Fisher's exact test) 0,453 φ(Phi) 0,280 Cramer`s V 0,198
Project Size Classification
- Small (EUR < 5 - 10 million) 1 14,3% 6 85,7% 0 0,0% 0 0,0% 7 10,1%
- Medium (EUR > 10 - 50 million) 15 37,5% 23 57,5% 1 2,5% 1 2,5% 40 58,0%
- Large (EUR > 50 - 250 million) 7 31,8% 12 54,5% 3 13,6% 0 0,0% 22 31,9%
Total Project Size Classification 23 33,3% 41 59,4% 4 5,8% 1 1,4% 69 100,0%
p value (Fisher's exact test) 0,455 φ(Phi) 0,298 Cramer`s V 0,211
Number of
Responses
Strongly
disagreeDisagree Agree
Strongly
agree

271
14) Please evaluate the following aspects/features of your risk management:
3 The company finds it difficult to assess the likelihood of risks occurring
Total Respondants 10 14,7% 39 57,4% 18 26,5% 1 1,5% 68 100,0%
Developer Classification
- Mainly Trader-Developer 4 11,1% 21 58,3% 10 27,8% 1 2,8% 36 52,9%
- Mainly Investor-Developer 6 18,8% 18 56,3% 8 25,0% 0 0,0% 32 47,1%
Total Developer Classification 10 14,7% 39 57,4% 18 26,5% 1 1,5% 68 100,0%
p value (Fisher's exact test) 0,785 φ(Phi) 0,155 Cramer`s V 0,155
Ownership structure
- Listed 6 26,1% 10 43,5% 7 30,4% 0 0,0% 23 33,8%
- Unlisted 4 8,9% 29 64,4% 11 24,4% 1 2,2% 45 66,2%
Total Ownership Structure 10 14,7% 39 57,4% 18 26,5% 1 1,5% 68 100,0%
p value (Fisher's exact test) 0,143 φ(Phi) 0,270 Cramer`s V 0,270
Geographic Scope
- Regional 0 0,0% 3 50,0% 3 50,0% 0 0,0% 6 8,8%
- National 6 17,1% 19 54,3% 9 25,7% 1 2,9% 35 51,5%
- International 4 14,8% 17 63,0% 6 22,2% 0 0,0% 27 39,7%
Total Geographic Scope 10 14,7% 39 57,4% 18 26,5% 1 1,5% 68 100,0%
p value (Fisher's exact test) 0,782 φ(Phi) 0,232 Cramer`s V 0,164
Project Size Classification
- Small (EUR < 5 - 10 million) 1 14,3% 4 57,1% 2 28,6% 0 0,0% 7 10,3%
- Medium (EUR > 10 - 50 million) 7 17,9% 23 59,0% 8 20,5% 1 2,6% 39 57,4%
- Large (EUR > 50 - 250 million) 2 9,1% 12 54,5% 8 36,4% 0 0,0% 22 32,4%
Total Project Size Classification 10 14,7% 39 57,4% 18 26,5% 1 1,5% 68 100,0%
p value (Fisher's exact test) 0,806 φ(Phi) 0,206 Cramer`s V 0,146
AgreeStrongly
agree
Number of
Responses
Strongly
disagreeDisagree

272
14) Please evaluate the following aspects/features of your risk management:
4 The company finds it difficult to assess the potential impacts of risks materialising
Total Respondants 13 19,1% 42 61,8% 12 17,6% 1 1,5% 68 100,0%
Developer Classification
- Mainly Trader-Developer 7 19,4% 22 61,1% 6 16,7% 1 2,8% 36 52,9%
- Mainly Investor-Developer 6 18,8% 20 62,5% 6 18,8% 0 0,0% 32 47,1%
Total Developer Classification 13 19,1% 42 61,8% 12 17,6% 1 1,5% 68 100,0%
p value (Fisher's exact test) 1,000 φ(Phi) 0,118 Cramer`s V 0,118
Ownership structure
- Listed 8 34,8% 7 30,4% 8 34,8% 0 0,0% 23 33,8%
- Unlisted 5 11,1% 35 77,8% 4 8,9% 1 2,2% 45 66,2%
Total Ownership Structure 13 19,1% 42 61,8% 12 17,6% 1 1,5% 68 100,0%
p value (Fisher's exact test) 0,000 φ(Phi) 0,489 Cramer`s V 0,489
Geographic Scope
- Regional 0 0,0% 4 66,7% 2 33,3% 0 0,0% 6 8,8%
- National 9 25,7% 20 57,1% 5 14,3% 1 2,9% 35 51,5%
- International 4 14,8% 18 66,7% 5 18,5% 0 0,0% 27 39,7%
Total Geographic Scope 13 19,1% 42 61,8% 12 17,6% 1 1,5% 68 100,0%
p value (Fisher's exact test) 0,602 φ(Phi) 0,256 Cramer`s V 0,181
Project Size Classification
- Small (EUR < 5 - 10 million) 1 14,3% 5 71,4% 1 14,3% 0 0,0% 7 10,3%
- Medium (EUR > 10 - 50 million) 9 23,1% 24 61,5% 5 12,8% 1 2,6% 39 57,4%
- Large (EUR > 50 - 250 million) 3 13,6% 13 59,1% 6 27,3% 0 0,0% 22 32,4%
Total Project Size Classification 13 19,1% 42 61,8% 12 17,6% 1 1,5% 68 100,0%
p value (Fisher's exact test) 0,788 φ(Phi) 0,222 Cramer`s V 0,157
Strongly
disagreeDisagree Agree
Strongly
agree
Number of
Responses

273
15) Do you have a consistently defined risk catalogue to be used for risk identification purposes?
Total Respondants 12 17,4% 23 33,3% 9 13,0% 25 36,2% 69 100,0%
Developer Classification
- Mainly Trader-Developer 3 8,1% 12 32,4% 6 16,2% 16 43,2% 37 53,6%
- Mainly Investor-Developer 9 28,1% 11 34,4% 3 9,4% 9 28,1% 32 46,4%
Total Developer Classification 12 17,4% 23 33,3% 9 13,0% 25 36,2% 69 100,0%
p value (Fisher's exact test) 0,150 φ(Phi) 0,287 Cramer`s V 0,287
Ownership structure
- Listed 6 26,1% 7 30,4% 2 8,7% 8 34,8% 23 33,3%
- Unlisted 6 13,0% 16 34,8% 7 15,2% 17 37,0% 46 66,7%
Total Ownership Structure 12 17,4% 23 65,2% 9 13,0% 25 36,2% 69 100,0%
p value (Fisher's exact test) 0,597 φ(Phi) 0,175 Cramer`s V 0,175
Geographic Scope
- Regional 0 0,0% 2 33,3% 1 16,7% 3 50,0% 6 8,7%
- National 7 19,4% 8 22,2% 7 19,4% 14 38,9% 36 52,2%
- International 5 18,5% 13 48,1% 1 3,7% 8 29,6% 27 39,1%
Total Geographic Scope 12 17,4% 23 33,3% 9 13,0% 25 36,2% 69 100,0%
p value (Fisher's exact test) 0,203 φ(Phi) 0,340 Cramer`s V 0,240
Project Size Classification
- Small (EUR < 5 - 10 million) 1 14,3% 1 14,3% 1 14,3% 4 57,1% 7 10,1%
- Medium (EUR > 10 - 50 million) 7 17,5% 10 25,0% 6 15,0% 17 42,5% 40 58,0%
- Large (EUR > 50 - 250 million) 4 18,2% 12 54,5% 2 9,1% 4 18,2% 22 31,9%
Total Project Size Classification 12 17,4% 23 33,3% 9 13,0% 25 36,2% 69 100,0%
p value (Fisher's exact test) 0,194 φ(Phi) 0,346 Cramer`s V 0,245
Yes,
implemented
Yes, but
needs
improvement
No, but
planned No
Number of
Responses

274
16) Risk assessments are performed in a timely way at strategic and operational level across the company
Total Respondants 21 30,9% 32 47,1% 8 11,8% 7 10,3% 68 100,0%
Developer Classification
- Mainly Trader-Developer 8 21,6% 19 51,4% 5 13,5% 5 13,5% 37 54,4%
- Mainly Investor-Developer 13 41,9% 13 41,9% 3 9,7% 2 6,5% 31 45,6%
Total Developer Classification 21 30,9% 32 47,1% 8 11,8% 7 10,3% 68 100,0%
p value (Fisher's exact test) 0,350 φ(Phi) 0,230 Cramer`s V 0,230
Ownership structure
- Listed 7 31,8% 13 59,1% 1 4,5% 1 4,5% 22 32,4%
- Unlisted 14 30,4% 19 41,3% 7 15,2% 6 13,0% 46 67,6%
Total Ownership Structure 21 30,9% 32 47,1% 8 11,8% 7 10,3% 68 100,0%
p value (Fisher's exact test) 0,388 φ(Phi) 0,227 Cramer`s V 0,227
Geographic Scope
- Regional 1 16,7% 4 66,7% 0 0,0% 1 16,7% 6 8,8%
- National 12 33,3% 13 36,1% 7 19,4% 4 11,1% 36 52,9%
- International 8 30,8% 15 57,7% 1 3,8% 2 7,7% 26 38,2%
Total Geographic Scope 21 30,9% 32 47,1% 8 11,8% 7 10,3% 68 100,0%
p value (Fisher's exact test) 0,343 φ(Phi) 0,317 Cramer`s V 0,224
Project Size Classification
- Small (EUR < 5 - 10 million) 2 28,6% 4 57,1% 0 0,0% 1 14,3% 7 10,3%
- Medium (EUR > 10 - 50 million) 11 28,2% 17 43,6% 6 15,4% 5 12,8% 39 57,4%
- Large (EUR > 50 - 250 million) 8 36,4% 11 50,0% 2 9,1% 1 4,5% 22 32,4%
Total Project Size Classification 21 30,9% 32 47,1% 8 11,8% 7 31,7% 68 100,0%
p value (Fisher's exact test) 0,858 φ(Phi) 0,212 Cramer`s V 0,150
Yes,
implemented
Yes, but
needs
improvement
No, but
planned No
Number of
Responses

275
17) How often do you prepare a general overview of the current risk situation?
Total Respondants 8 12,1% 7 10,6% 28 42,4% 13 19,7% 10 15,2% 66 100,0%
Developer Classification
- Mainly Trader-Developer 3 8,8% 3 8,8% 17 50,0% 7 20,6% 4 11,8% 34 51,5%
- Mainly Investor-Developer 5 15,6% 4 12,5% 11 34,4% 6 18,8% 6 18,8% 32 48,5%
Total Developer Classification 8 12,1% 7 10,6% 28 42,4% 13 19,7% 10 15,2% 66 100,0%
p value (Fisher's exact test) 0,679 φ(Phi) 0,189 Cramer`s V 0,189
Ownership structure
- Listed 0 0,0% 4 19,0% 9 42,9% 6 28,6% 2 9,5% 21 31,8%
- Unlisted 8 17,8% 3 6,7% 19 42,2% 7 15,6% 8 17,8% 45 68,2%
Total Ownership Structure 8 12,1% 7 10,6% 28 42,4% 13 19,7% 10 15,2% 66 100,0%
p value (Fisher's exact test) 0,093 φ(Phi) 0,341 Cramer`s V 0,341
Geographic Scope
- Regional 1 16,7% 0 0,0% 3 50,0% 1 16,7% 1 16,7% 6 9,1%
- National 2 5,7% 5 14,3% 16 45,7% 6 17,1% 6 17,1% 35 53,0%
- International 5 20,0% 2 0,0% 9 36,0% 6 24,0% 3 12,0% 25 37,9%
Total Geographic Scope 8 12,1% 7 10,6% 28 42,4% 13 19,7% 10 15,2% 66 100,0%
p value (Fisher's exact test) 0,773 φ(Phi) 0,272 Cramer`s V 0,192
Project Size Classification
- Small (EUR < 5 - 10 million) 0 0,0% 1 16,7% 1 16,7% 1 16,7% 3 50,0% 6 9,1%
- Medium (EUR > 10 - 50 million) 4 10,5% 3 7,9% 19 50,0% 8 21,1% 4 10,5% 38 57,6%
- Large (EUR > 50 - 250 million) 4 18,2% 3 0,0% 8 36,4% 4 18,2% 3 13,6% 22 33,3%
Total Project Size Classification 8 12,1% 7 10,6% 28 42,4% 13 19,7% 10 15,2% 66 100,0%
p value (Fisher's exact test) 0,377 φ(Phi) 0,374 Cramer`s V 0,265
Yearly Half-yearlyQuarterly/
tertiallyMonthly Other
Number of
Responses

276
18)
Wh
ich
meth
od
do
es y
ou
r co
mp
an
y u
se f
or
the a
ssessm
en
t o
f id
en
tifi
ed
ris
ks?
Mu
ltip
le r
esp
on
ses a
re p
ossib
le
To
tal
Re
sp
on
da
nts
48
20
.1%
24
10
.0%
24
10
.0%
21
8.8
%2
29
.2%
12
5.0
%7
2.9
%1
14
.6%
52
.1%
31
.3%
30
12
.6%
30
12
.6%
20
.8%
23
9100.0
%
De
ve
lop
er
Cla
ss
ific
ati
on
- M
ain
ly T
rader-
Develo
per
25
21.0
%9
7.6
%16
13.4
%8
6.7
%14
11.8
%6
5.0
%3
2.5
%3
2.5
%1
0.8
%2
1.7
%17
14.3
%14
11.8
%1
0.8
%119
49.8
%
- M
ain
ly I
nvesto
r-D
evelo
per
23
19.2
%15
12.5
%8
6.7
%13
10.8
%8
6.7
%6
5.0
%4
3.3
%8
6.7
%4
3.3
%1
0.8
%13
10.8
%16
13.3
%1
0.8
%120
50.2
%
To
tal
De
ve
lop
er
Cla
ss
ific
ati
on
48
20.1
%24
10.0
%24
10.0
%21
8.8
%22
9.2
%12
5.0
%7
2.9
%11
4.6
%5
2.1
%3
1.3
%30
12.6
%30
12.6
%2
0.8
%239
100.0
%
Ow
ne
rsh
ip s
tru
ctu
re
- L
iste
d17
21.0
%7
8.6
%6
7.4
%9
11.1
%11
13.6
%1
1.2
%0
0.0
%6
7.4
%1
1.2
%3
3.7
%11
13.6
%9
11.1
%0
0.0
%81
33.9
%
- U
nlis
ted
31
19.6
%17
10.8
%18
11.4
%12
7.6
%11
7.0
%11
7.0
%7
4.4
%5
3.2
%4
2.5
%0
0.0
%19
12.0
%21
13.3
%2
1.3
%158
66.1
%
To
tal
Ow
ne
rsh
ip S
tru
ctu
re48
20.1
%24
10.0
%24
10.0
%21
8.8
%22
9.2
%12
5.0
%7
2.9
%11
4.6
%5
2.1
%3
1.3
%30
12.6
%30
12.6
%2
0.8
%239
100.0
%
Ge
og
rap
hic
Sc
op
e
- R
egio
nal
426.7
%2
13.3
%1
6.7
%1
6.7
%2
13.3
%0
0.0
%0
0.0
%1
6.7
%0
0.0
%0
0.0
%2
13.3
%2
13.3
%0
0.0
%15
6.3
%
- N
ational
24
19.2
%8
6.4
%14
11.2
%11
8.8
%10
8.0
%6
4.8
%4
3.2
%6
4.8
%4
3.2
%1
0.8
%19
15.2
%16
12.8
%2
1.6
%125
52.3
%
- I
nte
rnational
20
20.2
%14
14.1
%9
9.1
%9
9.1
%10
10.1
%6
6.1
%3
3.0
%4
4.0
%1
1.0
%2
2.0
%9
9.1
%12
12.1
%0
0.0
%99
41.4
%
To
tal
Ge
og
rap
hic
Sc
op
e48
20.1
%24
10.0
%24
10.0
%21
8.8
%22
9.2
%12
5.0
%7
2.9
%11
4.6
%5
2.1
%3
1.3
%30
12.6
%30
12.6
%2
0.8
%239
100.0
%
Pro
jec
t S
ize
Cla
ss
ific
ati
on
- S
mall
(EU
R <
5 -
10 m
illio
n)
526.3
%3
15.8
%4
21.1
%1
5.3
%1
5.3
%0
0.0
%0
0.0
%1
5.3
%1
5.3
%0
0.0
%2
10.5
%1
5.3
%0
0.0
%19
7.9
%
- M
ediu
m (
EU
R >
10 -
50 m
illio
n)
28
19.4
%13
9.0
%14
9.7
%13
9.0
%14
9.7
%7
4.9
%5
3.5
%7
4.9
%3
2.1
%1
0.7
%20
13.9
%18
12.5
%1
0.7
%144
60.3
%
- L
arg
e (
EU
R >
50 -
250 m
illio
n)
15
19.7
%8
10.5
%6
7.9
%7
9.2
%7
9.2
%5
6.6
%2
2.6
%3
3.9
%1
1.3
%2
2.6
%8
10.5
%11
14.5
%1
1.3
%76
31.8
%
To
tal
Pro
jec
t S
ize
Cla
ss
ific
ati
on
48
20.1
%24
10.0
%24
10.0
%21
8.8
%22
9.2
%12
5.0
%7
2.9
%11
4.6
%5
2.1
%3
1.3
%30
12.6
%30
12.6
%2
0.8
%239
100.0
%
Ind
ivid
ual
su
bje
cti
ve
assessm
en
ts
Su
bje
cti
ve
assessm
en
t (b
y
ind
ivid
ual
off
icers
)
Assessm
en
t b
y
exte
rnal
exp
ert
s
Gro
up
facil
itate
d
assessm
en
t
Qu
ali
tati
ve r
isk
assessm
en
t
based
on
pre
dete
rmin
ed
list
of
key
ind
icato
rs
Syste
mati
c
exp
osu
re a
naly
sis
(severi
ty,
fin
an
cia
l im
pact
an
d l
ikeli
ho
od
of
occu
rren
ce)
Ris
k p
rem
ium
s
or
dis
co
un
ts o
n
retu
rn/
mu
ltip
licato
r
Sim
ula
tio
n
pro
cesses (
e.g
.
Mo
nte
Carl
o
sim
ula
tio
n)
Ris
k s
co
rin
g
tech
niq
ues
Valu
e a
t ri
sk (
or
oth
er
mo
dels
based
on
pro
bab
ilit
y
dis
trib
uti
on
s)
Decis
ion
tre
e
pro
ced
ure
s
Scen
ari
o
tech
niq
ue (
Best-
/ W
ors
t-C
ase)
Sen
sit
ivit
y
an
aly
sis
Oth
er
Nu
mb
er
of
Re
sp
on
se
s

277
19) Assuming you have prepared a list of all material risks that may threat your company. How do you address these? Multiple responses are possible
Total Respondants 45 35,7% 27 21,4% 32 25,4% 20 15,9% 1 0,8% 1 0,8% 126 100,0%
Developer Classification
- Mainly Trader-Developer 24 36,4% 16 24,2% 17 25,8% 9 13,6% 0 0,0% 0 0,0% 66 52,4%
- Mainly Investor-Developer 21 35,0% 11 18,3% 15 25,0% 11 18,3% 1 1,7% 1 1,7% 60 47,6%
Total Developer Classification 45 35,7% 27 21,4% 32 25,4% 20 15,9% 1 0,8% 1 0,8% 126 100,0%
p value (Fisher's exact test) 0,771 φ(Phi) 0,159 Cramer`s V 0,159
Ownership structure
- Listed 15 37,5% 5 12,5% 13 32,5% 6 15,0% 0 0,0% 1 2,5% 40 31,7%
- Unlisted 30 34,9% 22 25,6% 19 22,1% 14 16,3% 1 1,2% 0 0,0% 86 68,3%
Total Ownership Structure 45 35,7% 27 21,4% 32 25,4% 20 15,9% 1 0,8% 1 0,8% 126 100,0%
p value (Fisher's exact test) 0,284 φ(Phi) 0,219 Cramer`s V 0,219
Geographic Scope
- Regional 4 44,4% 1 11,1% 2 22,2% 1 11,1% 0 0,0% 1 11,1% 9 7,1%
- National 24 38,1% 16 25,4% 13 20,6% 9 14,3% 1 1,6% 0 0,0% 63 50,0%
- International 17 31,5% 10 18,5% 17 31,5% 10 18,5% 0 0,0% 0 0,0% 54 42,9%
Total Geographic Scope 45 35,7% 27 21,4% 32 25,4% 20 15,9% 1 0,8% 1 0,8% 126 100,0%
p value (Fisher's exact test) 0,392 φ(Phi) 0,373 Cramer`s V 0,264
Project Size Classification
- Small (EUR < 5 - 10 million) 4 30,8% 3 23,1% 3 23,1% 2 15,4% 0 0,0% 1 7,7% 13 10,3%
- Medium (EUR > 10 - 50 million) 28 38,4% 16 21,9% 20 27,4% 9 12,3% 0 0,0% 0 0,0% 73 57,9%
- Large (EUR > 50 - 250 million) 13 32,5% 8 20,0% 9 22,5% 9 22,5% 1 2,5% 0 0,0% 40 31,7%
Total Project Size Classification 45 35,7% 27 21,4% 32 25,4% 20 15,9% 1 0,8% 1 0,8% 126 100,0%
p value (Fisher's exact test) 0,487 φ(Phi) 0,324 Cramer`s V 0,229
Other
Depending on
the situation, we
take ad-hoc
actions to
improve the risk
situation
We determine
risk owners who
are responsible
for controlling
risk management
actions
We systematically
prepare an action
task list. The
systematic
implementation of
these actions is
monitored on a
regular basis
We record the
existing actions
and analyse
their impact
We identify
material risks
but do not take
any further
action
Number of
Responses
20
) W
ha
t in
form
ati
on
on
pro
jec
t le
ve
l n
ee
ds
ta
ke p
rio
rity
wit
hin
yo
ur
ris
k c
ult
ure
? M
ult
iple
re
sp
on
se
s a
re p
os
sib
le
To
tal
Re
sp
on
da
nts
56
15
.7%
41
11
.5%
18
5.1
%3
59
.8%
28
7.9
%2
36
.5%
47
13
.2%
38
10
.7%
22
6.2
%3
18
.7%
12
3.4
%5
1.4
%3
56
10
0.0
%
De
ve
lop
er
Cla
ss
ific
ati
on
- M
ain
ly T
rader-
Develo
per
29
15.8
%21
11.4
%7
3.8
%23
12.5
%15
8.2
%13
7.1
%24
13.0
%18
9.8
%12
6.5
%15
8.2
%5
2.7
%2
1.1
%184
51.7
%
- M
ain
ly I
nvesto
r-D
evelo
per
27
15.7
%20
11.6
%11
6.4
%12
7.0
%13
7.6
%10
5.8
%23
13.4
%20
11.6
%10
5.8
%16
9.3
%7
4.1
%3
1.7
%172
48.3
%
To
tal
De
ve
lop
er
Cla
ss
ific
ati
on
56
15.7
%41
11.5
%18
5.1
%35
9.8
%28
7.9
%23
6.5
%47
13.2
%38
10.7
%22
6.2
%31
8.7
%12
3.4
%5
1.4
%356
100.0
%
Ow
ne
rsh
ip s
tru
ctu
re
- L
iste
d18
15.0
%13
10.8
%6
5.0
%13
10.8
%11
9.2
%9
7.5
%14
11.7
%12
10.0
%6
5.0
%12
10.0
%5
4.2
%1
0.8
%120
33.7
%
- U
nlis
ted
38
16.1
%28
11.9
%12
5.1
%22
9.3
%17
7.2
%14
5.9
%33
14.0
%26
11.0
%16
6.8
%19
8.1
%7
3.0
%4
1.7
%236
66.3
%
To
tal
Ow
ne
rsh
ip S
tru
ctu
re56
15.7
%41
11.5
%18
5.1
%35
9.8
%28
7.9
%23
6.5
%47
13.2
%38
10.7
%22
6.2
%31
8.7
%12
3.4
%5
1.4
%356
100.0
%
Ge
og
rap
hic
Sc
op
e
- R
egio
nal
520.8
%4
16.7
%0
0.0
%2
8.3
%1
4.2
%2
8.3
%3
12.5
%4
16.7
%0
0.0
%2
8.3
%1
4.2
%0
0.0
%24
6.7
%
- N
ational
30
15.5
%23
11.9
%10
5.2
%17
8.8
%15
7.7
%13
6.7
%27
13.9
%19
9.8
%15
7.7
%15
7.7
%7
3.6
%3
1.5
%194
54.5
%
- I
nte
rnational
21
15.2
%14
10.1
%8
5.8
%16
11.6
%12
8.7
%8
5.8
%17
12.3
%15
10.9
%7
5.1
%14
10.1
%4
2.9
%2
1.4
%138
38.8
%
To
tal
Ge
og
rap
hic
Sc
op
e56
15.7
%41
11.5
%18
5.1
%35
9.8
%28
7.9
%23
6.5
%47
13.2
%38
10.7
%22
6.2
%31
8.7
%12
3.4
%5
1.4
%356
100.0
%
Pro
jec
t S
ize
Cla
ss
ific
ati
on
- S
mall
(EU
R <
5 -
10 m
illio
n)
517.2
%3
10.3
%0
0.0
%3
10.3
%2
6.9
%2
6.9
%4
13.8
%3
10.3
%1
3.4
%3
10.3
%2
6.9
%1
3.4
%29
8.1
%
- M
ediu
m (
EU
R >
10 -
50 m
illio
n)
34
15.5
%26
11.9
%12
5.5
%22
10.0
%17
7.8
%16
7.3
%30
13.7
%25
11.4
%13
5.9
%17
7.8
%5
2.3
%2
0.9
%219
61.5
%
- L
arg
e (
EU
R >
50 -
250 m
illio
n)
17
15.7
%12
11.1
%6
5.6
%10
9.3
%9
8.3
%5
4.6
%13
12.0
%10
9.3
%8
7.4
%11
10.2
%5
4.6
%2
1.9
%108
30.3
%
To
tal
Pro
jec
t S
ize
Cla
ss
ific
ati
on
56
15.7
%41
11.5
%18
5.1
%35
9.8
%28
7.9
%23
6.5
%47
13.2
%38
10.7
%22
6.2
%31
8.7
%12
3.4
%5
1.4
%356
100.0
%
De
ma
nd
in
ten
an
cy
ma
rke
t
Su
pp
ly i
n
ten
an
cy
ma
rke
t
Te
na
nc
y
ma
rke
t
liq
uid
ity
De
ma
nd
in
tra
ns
ac
tio
n
ma
rke
t
Su
pp
ly i
n
tra
ns
ac
tio
n
ma
rke
t
Tra
ns
ac
tio
n
ma
rke
t
liq
uid
ity
Ma
rke
t re
nts
Va
ca
nc
y r
ate
sA
bs
orp
tio
n
tim
es
Ec
on
om
ic
fore
ca
sts
Info
rma
tio
n
on
ta
xa
tio
nO
the
rN
um
be
r o
f
Re
sp
on
se
s

278
20
) W
ha
t in
form
ati
on
on
pro
jec
t le
ve
l n
ee
ds
ta
ke p
rio
rity
wit
hin
yo
ur
ris
k c
ult
ure
? M
ult
iple
re
sp
on
se
s a
re p
os
sib
le
To
tal
Re
sp
on
da
nts
56
15
.7%
41
11
.5%
18
5.1
%3
59
.8%
28
7.9
%2
36
.5%
47
13
.2%
38
10
.7%
22
6.2
%3
18
.7%
12
3.4
%5
1.4
%3
56
10
0.0
%
De
ve
lop
er
Cla
ss
ific
ati
on
- M
ain
ly T
rader-
Develo
per
29
15.8
%21
11.4
%7
3.8
%23
12.5
%15
8.2
%13
7.1
%24
13.0
%18
9.8
%12
6.5
%15
8.2
%5
2.7
%2
1.1
%184
51.7
%
- M
ain
ly I
nvesto
r-D
evelo
per
27
15.7
%20
11.6
%11
6.4
%12
7.0
%13
7.6
%10
5.8
%23
13.4
%20
11.6
%10
5.8
%16
9.3
%7
4.1
%3
1.7
%172
48.3
%
To
tal
De
ve
lop
er
Cla
ss
ific
ati
on
56
15.7
%41
11.5
%18
5.1
%35
9.8
%28
7.9
%23
6.5
%47
13.2
%38
10.7
%22
6.2
%31
8.7
%12
3.4
%5
1.4
%356
100.0
%
Ow
ne
rsh
ip s
tru
ctu
re
- L
iste
d18
15.0
%13
10.8
%6
5.0
%13
10.8
%11
9.2
%9
7.5
%14
11.7
%12
10.0
%6
5.0
%12
10.0
%5
4.2
%1
0.8
%120
33.7
%
- U
nlis
ted
38
16.1
%28
11.9
%12
5.1
%22
9.3
%17
7.2
%14
5.9
%33
14.0
%26
11.0
%16
6.8
%19
8.1
%7
3.0
%4
1.7
%236
66.3
%
To
tal
Ow
ne
rsh
ip S
tru
ctu
re56
15.7
%41
11.5
%18
5.1
%35
9.8
%28
7.9
%23
6.5
%47
13.2
%38
10.7
%22
6.2
%31
8.7
%12
3.4
%5
1.4
%356
100.0
%
Ge
og
rap
hic
Sc
op
e
- R
egio
nal
520.8
%4
16.7
%0
0.0
%2
8.3
%1
4.2
%2
8.3
%3
12.5
%4
16.7
%0
0.0
%2
8.3
%1
4.2
%0
0.0
%24
6.7
%
- N
ational
30
15.5
%23
11.9
%10
5.2
%17
8.8
%15
7.7
%13
6.7
%27
13.9
%19
9.8
%15
7.7
%15
7.7
%7
3.6
%3
1.5
%194
54.5
%
- I
nte
rnational
21
15.2
%14
10.1
%8
5.8
%16
11.6
%12
8.7
%8
5.8
%17
12.3
%15
10.9
%7
5.1
%14
10.1
%4
2.9
%2
1.4
%138
38.8
%
To
tal
Ge
og
rap
hic
Sc
op
e56
15.7
%41
11.5
%18
5.1
%35
9.8
%28
7.9
%23
6.5
%47
13.2
%38
10.7
%22
6.2
%31
8.7
%12
3.4
%5
1.4
%356
100.0
%
Pro
jec
t S
ize
Cla
ss
ific
ati
on
- S
mall
(EU
R <
5 -
10 m
illio
n)
517.2
%3
10.3
%0
0.0
%3
10.3
%2
6.9
%2
6.9
%4
13.8
%3
10.3
%1
3.4
%3
10.3
%2
6.9
%1
3.4
%29
8.1
%
- M
ediu
m (
EU
R >
10 -
50 m
illio
n)
34
15.5
%26
11.9
%12
5.5
%22
10.0
%17
7.8
%16
7.3
%30
13.7
%25
11.4
%13
5.9
%17
7.8
%5
2.3
%2
0.9
%219
61.5
%
- L
arg
e (
EU
R >
50 -
250 m
illio
n)
17
15.7
%12
11.1
%6
5.6
%10
9.3
%9
8.3
%5
4.6
%13
12.0
%10
9.3
%8
7.4
%11
10.2
%5
4.6
%2
1.9
%108
30.3
%
To
tal
Pro
jec
t S
ize
Cla
ss
ific
ati
on
56
15.7
%41
11.5
%18
5.1
%35
9.8
%28
7.9
%23
6.5
%47
13.2
%38
10.7
%22
6.2
%31
8.7
%12
3.4
%5
1.4
%356
100.0
%
De
ma
nd
in
ten
an
cy
ma
rke
t
Su
pp
ly i
n
ten
an
cy
ma
rke
t
Te
na
nc
y
ma
rke
t
liq
uid
ity
De
ma
nd
in
tra
ns
ac
tio
n
ma
rke
t
Su
pp
ly i
n
tra
ns
ac
tio
n
ma
rke
t
Tra
ns
ac
tio
n
ma
rke
t
liq
uid
ity
Ma
rke
t re
nts
Va
ca
nc
y r
ate
sA
bs
orp
tio
n
tim
es
Ec
on
om
ic
fore
ca
sts
Info
rma
tio
n
on
ta
xa
tio
nO
the
rN
um
be
r o
f
Re
sp
on
se
s

279
21) Please evaluate the following aspects/features of your risk management:
1 The company collates risks for decision making on what actions to take
Total Respondants 32 48,5% 30 45,5% 4 6,1% 0 0,0% 66 100,0%
Developer Classification
- Mainly Trader-Developer 17 45,9% 17 45,9% 3 8,1% 0 0,0% 37 56,1%
- Mainly Investor-Developer 15 51,7% 13 44,8% 1 3,4% 0 0,0% 29 43,9%
Total Developer Classification 32 48,5% 30 45,5% 4 6,1% 0 0,0% 66 100,0%
p value (Fisher's exact test) 0,730 φ(Phi) 0,103 Cramer`s V 0,103
Ownership structure
- Listed 13 59,1% 9 40,9% 0 0,0% 0 0,0% 22 33,3%
- Unlisted 19 43,2% 21 47,7% 4 9,1% 0 0,0% 44 66,7%
Total Ownership Structure 32 48,5% 30 45,5% 4 6,1% 0 0,0% 66 100,0%
p value (Fisher's exact test) 0,286 φ(Phi) 0,210 Cramer`s V 0,210
Geographic Scope
- Regional 1 16,7% 4 66,7% 1 16,7% 0 0,0% 6 9,1%
- National 17 50,0% 14 41,2% 3 8,8% 0 0,0% 34 51,5%
- International 14 53,8% 12 46,2% 0 0,0% 0 0,0% 26 39,4%
Total Geographic Scope 32 48,5% 30 45,5% 4 6,1% 0 0,0% 66 100,0%
p value (Fisher's exact test) 0,201 φ(Phi) 0,283 Cramer`s V 0,200
Project Size Classification
- Small (EUR < 5 - 10 million) 5 71,4% 2 28,6% 0 0,0% 0 0,0% 7 10,6%
- Medium (EUR > 10 - 50 million) 16 41,0% 19 48,7% 4 10,3% 0 0,0% 39 59,1%
- Large (EUR > 50 - 250 million) 11 55,0% 9 45,0% 0 0,0% 0 0,0% 20 30,3%
Total Project Size Classification 32 48,5% 30 45,5% 4 6,1% 0 0,0% 66 100,0%
p value (Fisher's exact test) 0,430 φ(Phi) 0,266 Cramer`s V 0,188
Yes
Yes, but
needs
improvement
No Don't knowNumber of
Responses

280
21) Please evaluate the following aspects/features of your risk management:
2 The company monitors and reviews the risks in the achievements of its objectives
Total Respondants 32 48,5% 30 45,5% 4 6,1% 0 0,0% 66 100%
Developer Classification
- Mainly Trader-Developer 17 45,9% 17 45,9% 3 8,1% 0 0,0% 37 56,1%
- Mainly Investor-Developer 15 51,7% 13 44,8% 1 3,4% 0 0,0% 29 43,9%
Total Developer Classification 32 48,5% 30 45,5% 4 6,1% 0 0,0% 66 100,0%
p value (Fisher's exact test) 0,730 φ(Phi) 0,103 Cramer`s V 0,103
Ownership structure
- Listed 13 59,1% 9 40,9% 0 0,0% 0 0,0% 22 33,3%
- Unlisted 19 43,2% 21 47,7% 4 9,1% 0 0,0% 44 66,7%
Total Ownership Structure 32 48,5% 30 45,5% 4 6,1% 0 0,0% 66 100,0%
p value (Fisher's exact test) 0,286 φ(Phi) 0,210 Cramer`s V 0,210
Geographic Scope
- Regional 1 16,7% 4 66,7% 1 16,7% 0 0,0% 6 9,1%
- National 17 50,0% 14 41,2% 3 8,8% 0 0,0% 34 51,5%
- International 14 53,8% 12 46,2% 0 0,0% 0 0,0% 26 39,4%
Total Geographic Scope 32 48,5% 30 45,5% 4 6,1% 0 0,0% 66 100,0%
p value (Fisher's exact test) 0,201 φ(Phi) 0,283 Cramer`s V 0,200
Project Size Classification
- Small (EUR < 5 - 10 million) 5 71,4% 2 28,6% 0 0,0% 0 0,0% 7 10,6%
- Medium (EUR > 10 - 50 million) 16 41,0% 19 48,7% 4 10,3% 0 0,0% 39 59,1%
- Large (EUR > 50 - 250 million) 11 55,0% 9 45,0% 0 0,0% 0 0,0% 20 30,3%
Total Project Size Classification 32 48,5% 30 45,5% 4 6,1% 0 0,0% 66 100,0%
p value (Fisher's exact test) 0,430 φ(Phi) 0,266 Cramer`s V 0,188
Yes
Yes, but
needs
improvement
No Don't knowNumber of
Responses

281
21) Please evaluate the following aspects/features of your risk management:
3 The company has a clearly defined policy and process for the reporting of risks / risk management
Total Respondants 22 33,3% 22 33,3% 21 31,8% 1 1,5% 66 100,0%
Developer Classification
- Mainly Trader-Developer 9 24,3% 11 29,7% 16 43,2% 1 2,7% 37 56,1%
- Mainly Investor-Developer 13 44,8% 11 37,9% 5 17,2% 0 0,0% 29 43,9%
Total Developer Classification 22 33,3% 22 33,3% 21 31,8% 1 1,5% 66 100,0%
p value (Fisher's exact test) 0,067 φ(Phi) 0,317 Cramer`s V 0,317
Ownership structure
- Listed 10 45,5% 8 36,4% 4 18,2% 0 0,0% 22 33,3%
- Unlisted 12 27,3% 14 31,8% 17 38,6% 1 2,3% 44 66,7%
Total Ownership Structure 22 33,3% 22 33,3% 21 31,8% 1 1,5% 66 100,0%
p value (Fisher's exact test) 0,130 φ(Phi) 0,283 Cramer`s V 0,283
Geographic Scope
- Regional 1 16,7% 3 50,0% 2 33,3% 0 0,0% 6 9,1%
- National 10 29,4% 7 20,6% 17 50,0% 0 0,0% 34 51,5%
- International 11 42,3% 12 46,2% 2 7,7% 1 3,8% 26 39,4%
Total Geographic Scope 22 33,3% 22 33,3% 21 31,8% 1 1,5% 66 100,0%
p value (Fisher's exact test) 0,004 φ(Phi) 0,470 Cramer`s V 0,332
Project Size Classification
- Small (EUR < 5 - 10 million) 3 42,9% 2 28,6% 2 28,6% 0 0,0% 7 10,6%
- Medium (EUR > 10 - 50 million) 9 23,1% 13 33,3% 16 41,0% 1 2,6% 39 59,1%
- Large (EUR > 50 - 250 million) 10 50,0% 7 35,0% 3 15,0% 0 0,0% 20 30,3%
Total Project Size Classification 22 33,3% 22 33,3% 21 31,8% 1 1,5% 66 100,0%
p value (Fisher's exact test) 0,269 φ(Phi) 0,318 Cramer`s V 0,225
Number of
ResponsesYes
Yes, but
needs
improvement
No Don't know

282
21) Please evaluate the following aspects/features of your risk management:
4 Changes to the company’s risks are identified, assessed and reported on an ongoing basis as to
their impact on objectives
Total Respondants 22 32,8% 22 32,8% 18 26,9% 5 7,5% 67 100,0%
Developer Classification
- Mainly Trader-Developer 10 27,0% 11 29,7% 12 32,4% 4 10,8% 37 55,2%
- Mainly Investor-Developer 12 40,0% 11 36,7% 6 20,0% 1 3,3% 30 44,8%
Total Developer Classification 22 32,8% 22 32,8% 18 26,9% 5 7,5% 67 100,0%
p value (Fisher's exact test) 0,377 φ(Phi) 0,221 Cramer`s V 0,221
Ownership structure
- Listed 9 40,9% 8 36,4% 4 18,2% 1 4,5% 22 32,8%
- Unlisted 13 28,9% 14 31,1% 14 31,1% 4 8,9% 45 67,2%
Total Ownership Structure 22 32,8% 22 32,8% 18 26,9% 5 7,5% 67 100,0%
p value (Fisher's exact test) 0,602 φ(Phi) 0,176 Cramer`s V 0,176
Geographic Scope
- Regional 1 16,7% 3 50,0% 2 33,3% 0 0,0% 6 9,0%
- National 10 28,6% 12 34,3% 9 25,7% 4 11,4% 35 52,2%
- International 11 42,3% 7 26,9% 7 26,9% 1 3,8% 26 38,8%
Total Geographic Scope 22 32,8% 22 32,8% 18 26,9% 5 7,5% 67 100,0%
p value (Fisher's exact test) 0,749 φ(Phi) 0,243 Cramer`s V 0,172
Project Size Classification
- Small (EUR < 5 - 10 million) 2 28,6% 2 28,6% 3 42,9% 0 0,0% 7 10,4%
- Medium (EUR > 10 - 50 million) 11 27,5% 17 42,5% 8 20,0% 4 10,0% 40 59,7%
- Large (EUR > 50 - 250 million) 9 45,0% 3 15,0% 7 35,0% 1 5,0% 20 29,9%
Total Project Size Classification 22 32,8% 22 32,8% 18 26,9% 5 7,5% 67 100,0%
p value (Fisher's exact test) 0,285 φ(Phi) 0,330 Cramer`s V 0,233
Yes
Yes, but
needs
improvement
No Don't knowNumber of
Responses

283
21) Please evaluate the following aspects/features of your risk management:
5 The company routinely reviews the effectiveness of the controls in place to manage risks
Total Respondants 13 20,0% 31 47,7% 17 26,2% 4 6,2% 65 100,0%
Developer Classification
- Mainly Trader-Developer 6 16,7% 18 50,0% 8 22,2% 4 11,1% 36 55,4%
- Mainly Investor-Developer 7 24,1% 13 44,8% 9 31,0% 0 0,0% 29 44,6%
Total Developer Classification 13 20,0% 31 47,7% 17 26,2% 4 6,2% 65 100,0%
p value (Fisher's exact test) 0,277 φ(Phi) 0,255 Cramer`s V 0,255
Ownership structure
- Listed 5 22,7% 11 50,0% 5 22,7% 1 4,5% 22 33,8%
- Unlisted 8 18,6% 20 46,5% 12 27,9% 3 7,0% 43 66,2%
Total Ownership Structure 13 20,0% 31 47,7% 17 26,2% 4 6,2% 65 100,0%
p value (Fisher's exact test) 0,952 φ(Phi) 0,083 Cramer`s V 0,083
Geographic Scope
- Regional 0 0,0% 5 83,3% 1 16,7% 0 0,0% 6 9,2%
- National 8 24,2% 14 42,4% 9 27,3% 2 6,1% 33 50,8%
- International 5 19,2% 12 46,2% 7 26,9% 2 7,7% 26 40,0%
Total Geographic Scope 13 20,0% 31 47,7% 17 26,2% 4 6,2% 65 100,0%
p value (Fisher's exact test) 0,814 φ(Phi) 0,248 Cramer`s V 0,176
Project Size Classification
- Small (EUR < 5 - 10 million) 0 0,0% 4 57,1% 1 14,3% 2 28,6% 7 10,8%
- Medium (EUR > 10 - 50 million) 6 15,8% 19 50,0% 11 28,9% 2 5,3% 38 58,5%
- Large (EUR > 50 - 250 million) 7 35,0% 8 40,0% 5 25,0% 0 0,0% 20 30,8%
Total Project Size Classification 13 20,0% 31 47,7% 17 26,2% 4 6,2% 65 100,0%
p value (Fisher's exact test) 0,132 φ(Phi) 0,428 Cramer`s V 0,303
Number of
ResponsesYes
Yes, but
needs
improvement
No Don't know

284
21) Please evaluate the following aspects/features of your risk management:
6 The key indicators for controlling material risks have been determined and threshold values
have been defined
Total Respondants 12 17,9% 17 25,4% 30 44,8% 8 11,9% 67 100,0%
Developer Classification
- Mainly Trader-Developer 3 8,1% 7 18,9% 20 54,1% 7 18,9% 37 55,2%
- Mainly Investor-Developer 9 30,0% 10 33,3% 10 33,3% 1 3,3% 30 44,8%
Total Developer Classification 12 17,9% 17 25,4% 30 44,8% 8 11,9% 67 100,0%
p value (Fisher's exact test) 0,013 φ(Phi) 0,401 Cramer`s V 0,401
Ownership structure
- Listed 4 18,2% 8 36,4% 8 36,4% 2 9,1% 22 32,8%
- Unlisted 8 17,8% 9 20,0% 22 48,9% 6 13,3% 45 67,2%
Total Ownership Structure 12 17,9% 17 25,4% 30 44,8% 8 11,9% 67 100,0%
p value (Fisher's exact test) 0,538 φ(Phi) 0,185 Cramer`s V 0,185
Geographic Scope
- Regional 1 16,7% 1 16,7% 4 66,7% 0 0,0% 6 9,0%
- National 5 14,3% 9 25,7% 17 48,6% 4 11,4% 35 52,2%
- International 6 23,1% 7 26,9% 9 34,6% 4 15,4% 26 38,8%
Total Geographic Scope 12 17,9% 17 25,4% 30 44,8% 8 11,9% 67 100,0%
p value (Fisher's exact test) 0,864 φ(Phi) 0,218 Cramer`s V 0,154
Project Size Classification
- Small (EUR < 5 - 10 million) 2 28,6% 1 14,3% 2 28,6% 2 28,6% 7 10,4%
- Medium (EUR > 10 - 50 million) 4 10,0% 11 27,5% 21 52,5% 4 10,0% 40 59,7%
- Large (EUR > 50 - 250 million) 6 30,0% 5 25,0% 7 35,0% 2 10,0% 20 29,9%
Total Project Size Classification 12 17,9% 17 25,4% 30 44,8% 8 11,9% 67 100,0%
p value (Fisher's exact test) 0,266 φ(Phi) 0,325 Cramer`s V 0,230
Yes
Yes, but
needs
improvement
No Don't knowNumber of
Responses

285
21) Please evaluate the following aspects/features of your risk management:
7 There are appropriate tools in place to support risk management (e.g. standard templates,
modelling tools, valuation tools)
Total Respondants 19 28,4% 23 34,3% 20 29,9% 5 7,5% 67 100,0%
Developer Classification
- Mainly Trader-Developer 7 18,9% 11 29,7% 15 40,5% 4 10,8% 37 55,2%
- Mainly Investor-Developer 12 40,0% 12 40,0% 5 16,7% 1 3,3% 30 44,8%
Total Developer Classification 19 28,4% 23 34,3% 20 29,9% 5 7,5% 67 100,0%
p value (Fisher's exact test) 0,061 φ(Phi) 0,335 Cramer`s V 0,335
Ownership structure
- Listed 10 45,5% 8 36,4% 2 9,1% 2 9,1% 22 32,8%
- Unlisted 9 20,0% 15 33,3% 18 40,0% 3 6,7% 45 67,2%
Total Ownership Structure 19 28,4% 23 34,3% 20 29,9% 5 7,5% 67 100,0%
p value (Fisher's exact test) 0,027 φ(Phi) 0,351 Cramer`s V 0,351
Geographic Scope
- Regional 0 0,0% 3 50,0% 3 50,0% 0 0,0% 6 9,0%
- National 9 25,7% 13 37,1% 10 28,6% 3 8,6% 35 52,2%
- International 10 38,5% 7 26,9% 7 26,9% 2 7,7% 26 38,8%
Total Geographic Scope 19 28,4% 23 34,3% 20 29,9% 5 7,5% 67 100,0%
p value (Fisher's exact test) 0,576 φ(Phi) 0,275 Cramer`s V 0,194
Project Size Classification
- Small (EUR < 5 - 10 million) 2 28,6% 2 28,6% 2 28,6% 1 14,3% 7 10,4%
- Medium (EUR > 10 - 50 million) 8 20,0% 15 37,5% 13 32,5% 4 10,0% 40 59,7%
- Large (EUR > 50 - 250 million) 9 45,0% 6 30,0% 5 25,0% 0 0,0% 20 29,9%
Total Project Size Classification 19 28,4% 23 34,3% 20 29,9% 5 7,5% 67 100,0%
p value (Fisher's exact test) 0,415 φ(Phi) 0,293 Cramer`s V 0,207
Yes
Yes, but
needs
improvement
No Don't knowNumber of
Responses

286
22) How confident is your company that its business risk management process is identifying, measuring
and managing mainly all potentially significant risks?
Total Respondants 2 3,0% 18 27,3% 41 62,1% 5 7,6% 66 100,0%
Developer Classification
- Mainly Trader-Developer 1 2,9% 13 37,1% 19 54,3% 2 5,7% 35 53,0%
- Mainly Investor-Developer 1 3,2% 5 16,1% 22 71,0% 3 9,7% 31 47,0%
Total Developer Classification 2 3,0% 18 27,3% 41 62,1% 5 7,6% 66 100,0%
p value (Fisher's exact test) 0,220 φ(Phi) 0,238 Cramer`s V 0,238
Ownership structure
- Listed 1 4,5% 4 18,2% 17 77,3% 0 0,0% 22 33,3%
- Unlisted 1 2,3% 14 31,8% 24 54,5% 5 11,4% 44 66,7%
Total Ownership Structure 2 3,0% 18 27,3% 41 62,1% 5 7,6% 66 100,0%
p value (Fisher's exact test) 0,153 φ(Phi) 0,274 Cramer`s V 0,274
Geographic Scope
- Regional 1 16,7% 1 16,7% 4 66,7% 0 0,0% 6 9,1%
- National 1 2,9% 10 29,4% 20 58,8% 3 8,8% 34 51,5%
- International 0 0,0% 7 26,9% 17 65,4% 2 7,7% 26 39,4%
Total Geographic Scope 2 3,0% 18 27,3% 41 62,1% 5 7,6% 66 100,0%
p value (Fisher's exact test) 0,671 φ(Phi) 0,287 Cramer`s V 0,203
Project Size Classification
- Small (EUR < 5 - 10 million) 0 0,0% 2 28,6% 4 57,1% 1 14,3% 7 10,6%
- Medium (EUR > 10 - 50 million) 2 5,3% 9 23,7% 24 63,2% 3 7,9% 38 57,6%
- Large (EUR > 50 - 250 million) 0 0,0% 7 33,3% 13 61,9% 1 4,8% 21 31,8%
Total Project Size Classification 2 3,0% 18 27,3% 41 62,1% 5 7,6% 66 100,0%
p value (Fisher's exact test) 0,848 φ(Phi) 0,199 Cramer`s V 0,141
Number of
ResponsesNo confidence
More or less
confidenceConfidence
Absolute
confidence

287
23) What kind of IT support do you use as part of your risk management system?
Total Respondants 11 16,9% 10 15,4% 7 10,8% 27 41,5% 10 15,4% 0 0,0% 65 100,0%
Developer Classification
- Mainly Trader-Developer 6 16,7% 4 11,1% 2 5,6% 20 55,6% 4 11,1% 0 0,0% 36 55,4%
- Mainly Investor-Developer 5 17,2% 6 20,7% 5 17,2% 7 24,1% 6 20,7% 0 0,0% 29 44,6%
Total Developer Classification 11 16,9% 10 15,4% 7 10,8% 27 41,5% 10 15,4% 0 0,0% 65 100,0%
p value (Fisher's exact test) 0,097 φ(Phi) 0,346 Cramer`s V 0,346
Ownership structure
- Listed 5 23,8% 5 23,8% 2 9,5% 4 19,0% 5 23,8% 0 0,0% 21 32,3%
- Unlisted 6 13,6% 5 11,4% 5 11,4% 23 52,3% 5 11,4% 0 0,0% 44 67,7%
Total Ownership Structure 11 16,9% 10 15,4% 7 10,8% 27 41,5% 10 15,4% 0 0,0% 65 100,0%
p value (Fisher's exact test) 0,086 φ(Phi) 0,341 Cramer`s V 0,341
Geographic Scope
- Regional 0 0,0% 2 33,3% 0 0,0% 1 16,7% 3 50,0% 0 0,0% 6 9,2%
- National 4 11,8% 6 17,6% 3 8,8% 15 44,1% 6 17,6% 0 0,0% 34 52,3%
- International 7 28,0% 2 8,0% 4 16,0% 11 44,0% 1 4,0% 0 0,0% 25 38,5%
Total Geographic Scope 11 16,9% 10 15,4% 7 10,8% 27 41,5% 10 15,4% 0 0,0% 65 100,0%
p value (Fisher's exact test) 0,073 φ(Phi) 0,479 Cramer`s V 0,339
Project Size Classification
- Small (EUR < 5 - 10 million) 3 42,9% 2 28,6% 0 0,0% 1 14,3% 1 14,3% 0 0,0% 7 10,8%
- Medium (EUR > 10 - 50 million) 4 10,5% 6 15,8% 2 5,3% 17 44,7% 9 23,7% 0 0,0% 38 58,5%
- Large (EUR > 50 - 250 million) 4 20,0% 2 10,0% 5 25,0% 9 45,0% 0 0,0% 0 0,0% 20 30,8%
Total Project Size Classification 11 16,9% 10 15,4% 7 10,8% 27 41,5% 10 15,4% 0 0,0% 65 100,0%
p value (Fisher's exact test) 0,019 φ(Phi) 0,508 Cramer`s V 0,359
Our risk
management
system is
integrated into
the organisation's
central
information
system
We use a stand-
alone risk
management
application with an
interface to our
enterprise
applications
We use a stand-
alone risk
management
application without
interface to any
other systems
Our IT support is
limited to the
utilisation of
standard tools
(e.g. Excel)
We do not use IT
support as part of
our risk
management
system
Other (please
specify)
Number of
Responses

288
24) Please evaluate the following aspects/features of your risk management:
1 The company’s structure supports effective risk management
Total Respondants 31 47,0% 29 43,9% 2 3,0% 4 6,1% 66 100,0%
Developer Classification
- Mainly Trader-Developer 13 35,1% 20 54,1% 1 2,7% 3 8,1% 37 56,1%
- Mainly Investor-Developer 18 62,1% 9 31,0% 1 3,4% 1 3,4% 29 43,9%
Total Developer Classification 31 47,0% 29 43,9% 2 3,0% 4 6,1% 66 100,0%
p value (Fisher's exact test) 0,129 φ(Phi) 0,278 Cramer`s V 0,278
Ownership structure
- Listed 13 59,1% 7 31,8% 0 0,0% 2 9,1% 22 33,3%
- Unlisted 18 40,9% 22 50,0% 2 4,5% 2 4,5% 44 66,7%
Total Ownership Structure 31 47,0% 29 43,9% 2 3,0% 4 6,1% 66 100,0%
p value (Fisher's exact test) 0,334 φ(Phi) 0,235 Cramer`s V 0,235
Geographic Scope
- Regional 3 50,0% 2 33,3% 1 16,7% 0 0,0% 6 9,1%
- National 16 47,1% 15 44,1% 0 0,0% 3 8,8% 34 51,5%
- International 12 46,2% 12 46,2% 1 3,8% 1 3,8% 26 39,4%
Total Geographic Scope 31 47,0% 29 43,9% 2 3,0% 4 6,1% 66 100,0%
p value (Fisher's exact test) 0,542 φ(Phi) 0,301 Cramer`s V 0,213
Project Size Classification
- Small (EUR < 5 - 10 million) 4 57,1% 3 42,9% 0 0,0% 0 0,0% 7 10,6%
- Medium (EUR > 10 - 50 million) 17 43,6% 17 43,6% 1 2,6% 4 10,3% 39 59,1%
- Large (EUR > 50 - 250 million) 10 50,0% 9 45,0% 1 5,0% 0 0,0% 20 30,3%
Total Project Size Classification 31 47,0% 29 43,9% 2 3,0% 4 6,1% 66 100,0%
p value (Fisher's exact test) 0,824 φ(Phi) 0,232 Cramer`s V 0,164
Yes
Yes, but
needs
improvement
No Don't knowNumber of
Responses

289
24) Please evaluate the following aspects/features of your risk management:
2 The company’s culture supports effective risk management
Total Respondants 28 42,4% 32 48,5% 4 6,1% 2 3,0% 66 100,0%
Developer Classification
- Mainly Trader-Developer 12 32,4% 22 59,5% 1 2,7% 2 5,4% 37 56,1%
- Mainly Investor-Developer 16 55,2% 10 34,5% 3 10,3% 0 0,0% 29 43,9%
Total Developer Classification 28 42,4% 32 48,5% 4 6,1% 2 3,0% 66 100,0%
p value (Fisher's exact test) 0,052 φ(Phi) 0,330 Cramer`s V 0,330
Ownership structure
- Listed 10 45,5% 10 45,5% 2 9,1% 0 0,0% 22 33,3%
- Unlisted 18 40,9% 22 50,0% 2 4,5% 2 4,5% 44 66,7%
Total Ownership Structure 28 42,4% 32 48,5% 4 6,1% 2 3,0% 66 100,0%
p value (Fisher's exact test) 0,732 φ(Phi) 0,157 Cramer`s V 0,157
Geographic Scope
- Regional 2 33,3% 3 50,0% 1 16,7% 0 0,0% 6 9,1%
- National 14 41,2% 18 52,9% 1 2,9% 1 2,9% 34 51,5%
- International 12 46,2% 11 42,3% 2 7,7% 1 3,8% 26 39,4%
Total Geographic Scope 28 42,4% 32 48,5% 4 6,1% 2 3,0% 66 100,0%
p value (Fisher's exact test) 0,768 φ(Phi) 0,198 Cramer`s V 0,140
Project Size Classification
- Small (EUR < 5 - 10 million) 5 71,4% 2 28,6% 0 0,0% 0 0,0% 7 10,6%
- Medium (EUR > 10 - 50 million) 13 33,3% 23 59,0% 1 2,6% 2 5,1% 39 59,1%
- Large (EUR > 50 - 250 million) 10 50,0% 7 35,0% 3 15,0% 0 0,0% 20 30,3%
Total Project Size Classification 28 42,4% 32 48,5% 4 6,1% 2 3,0% 66 100,0%
p value (Fisher's exact test) 0,142 φ(Phi) 0,386 Cramer`s V 0,273
Yes
Yes, but
needs
improvement
No Don't knowNumber of
Responses

290
24) Please evaluate the following aspects/features of your risk management:
3 Reporting and communication processes between staff and top management support the
effective management or risk
Total Respondants 31 47,7% 27 41,5% 6 9,2% 1 1,5% 65 100,0%
Developer Classification
- Mainly Trader-Developer 18 50,0% 12 33,3% 5 13,9% 1 2,8% 36 55,4%
- Mainly Investor-Developer 13 44,8% 15 51,7% 1 3,4% 0 0,0% 29 44,6%
Total Developer Classification 31 47,7% 27 41,5% 6 9,2% 1 1,5% 65 100,0%
p value (Fisher's exact test) 0,232 φ(Phi) 0,251 Cramer`s V 0,251
Ownership structure
- Listed 9 40,9% 11 50,0% 2 9,1% 0 0,0% 22 33,8%
- Unlisted 22 51,2% 16 37,2% 4 9,3% 1 2,3% 43 66,2%
Total Ownership Structure 31 47,7% 27 41,5% 6 9,2% 1 1,5% 65 100,0%
p value (Fisher's exact test) 0,764 φ(Phi) 0,147 Cramer`s V 0,147
Geographic Scope
- Regional 3 50,0% 2 33,3% 1 16,7% 0 0,0% 6 9,2%
- National 15 45,5% 15 45,5% 3 9,1% 0 0,0% 33 50,8%
- International 13 50,0% 10 38,5% 2 7,7% 1 3,8% 26 40,0%
Total Geographic Scope 31 47,7% 27 41,5% 6 9,2% 1 1,5% 65 100,0%
p value (Fisher's exact test) 0,870 φ(Phi) 0,187 Cramer`s V 0,132
Project Size Classification
- Small (EUR < 5 - 10 million) 3 42,9% 2 28,6% 2 28,6% 0 0,0% 7 10,8%
- Medium (EUR > 10 - 50 million) 18 47,4% 16 42,1% 3 7,9% 1 2,6% 38 58,5%
- Large (EUR > 50 - 250 million) 10 50,0% 9 45,0% 1 5,0% 0 0,0% 20 30,8%
Total Project Size Classification 31 47,7% 27 41,5% 6 9,2% 1 1,5% 65 100,0%
p value (Fisher's exact test) 0,654 φ(Phi) 0,260 Cramer`s V 0,184
Yes
Yes, but
needs
improvement
No Don't knowNumber of
Responses

291
24) Please evaluate the following aspects/features of your risk management:
4 Roles, responsibilities and accountabilities have been clearly defined
Total Respondants 36 54,5% 21 31,8% 7 10,6% 2 3,0% 66 100,0%
Developer Classification
- Mainly Trader-Developer 21 56,8% 11 29,7% 4 10,8% 1 2,7% 37 56,1%
- Mainly Investor-Developer 15 51,7% 10 34,5% 3 10,3% 1 3,4% 29 43,9%
Total Developer Classification 36 54,5% 21 31,8% 7 10,6% 2 3,0% 66 100,0%
p value (Fisher's exact test) 0,966 φ(Phi) 0,058 Cramer`s V 0,058
Ownership structure
- Listed 9 40,9% 10 45,5% 2 9,1% 1 4,5% 22 33,3%
- Unlisted 27 61,4% 11 25,0% 5 11,4% 1 2,3% 44 66,7%
Total Ownership Structure 36 54,5% 21 31,8% 7 10,6% 2 3,0% 66 100,0%
p value (Fisher's exact test) 0,282 φ(Phi) 0,226 Cramer`s V 0,226
Geographic Scope
- Regional 4 66,7% 2 33,3% 0 0,0% 0 0,0% 6 9,1%
- National 17 50,0% 9 26,5% 7 20,6% 1 2,9% 34 51,5%
- International 15 57,7% 10 38,5% 0 0,0% 1 3,8% 26 39,4%
Total Geographic Scope 36 54,5% 21 31,8% 7 10,6% 2 3,0% 66 100,0%
p value (Fisher's exact test) 0,195 φ(Phi) 0,345 Cramer`s V 0,244
Project Size Classification
- Small (EUR < 5 - 10 million) 5 71,4% 1 14,3% 1 14,3% 0 0,0% 7 10,6%
- Medium (EUR > 10 - 50 million) 17 43,6% 15 38,5% 5 12,8% 2 5,1% 39 59,1%
- Large (EUR > 50 - 250 million) 14 70,0% 5 25,0% 1 5,0% 0 0,0% 20 30,3%
Total Project Size Classification 36 54,5% 21 31,8% 7 10,6% 2 3,0% 66 100,0%
p value (Fisher's exact test) 0,464 φ(Phi) 0,298 Cramer`s V 0,211
Yes
Yes, but
needs
improvement
No Don't knowNumber of
Responses

292
24) Please evaluate the following aspects/features of your risk management:
5 There are clear and written management statements on risk management
Total Respondants 16 24,2% 19 28,8% 27 40,9% 4 6,1% 66 100,0%
Developer Classification
- Mainly Trader-Developer 6 16,2% 7 18,9% 21 56,8% 3 8,1% 37 56,1%
- Mainly Investor-Developer 10 34,5% 12 41,4% 6 20,7% 1 3,4% 29 43,9%
Total Developer Classification 16 24,2% 19 28,8% 27 40,9% 4 6,1% 66 100,0%
p value (Fisher's exact test) 0,009 φ(Phi) 0,405 Cramer`s V 0,405
Ownership structure
- Listed 6 27,3% 9 40,9% 6 27,3% 1 4,5% 22 33,3%
- Unlisted 10 22,7% 10 22,7% 21 47,7% 3 6,8% 44 66,7%
Total Ownership Structure 16 24,2% 19 28,8% 27 40,9% 4 6,1% 66 100,0%
p value (Fisher's exact test) 0,321 φ(Phi) 0,228 Cramer`s V 0,228
Geographic Scope
- Regional 1 16,7% 3 50,0% 2 33,3% 0 0,0% 6 9,1%
- National 11 32,4% 2 5,9% 19 55,9% 2 5,9% 34 51,5%
- International 4 15,4% 14 53,8% 6 23,1% 2 7,7% 26 39,4%
Total Geographic Scope 16 24,2% 19 28,8% 27 40,9% 4 6,1% 66 100,0%
p value (Fisher's exact test) 0,001 φ(Phi) 0,539 Cramer`s V 0,381
Project Size Classification
- Small (EUR < 5 - 10 million) 1 14,3% 3 42,9% 3 42,9% 0 0,0% 7 10,6%
- Medium (EUR > 10 - 50 million) 9 23,1% 8 20,5% 19 48,7% 3 7,7% 39 59,1%
- Large (EUR > 50 - 250 million) 6 30,0% 8 40,0% 5 25,0% 1 5,0% 20 30,3%
Total Project Size Classification 16 24,2% 19 28,8% 27 40,9% 4 6,1% 66 100,0%
p value (Fisher's exact test) 0,498 φ(Phi) 0,284 Cramer`s V 0,201
Yes
Yes, but
needs
improvement
No Don't knowNumber of
Responses
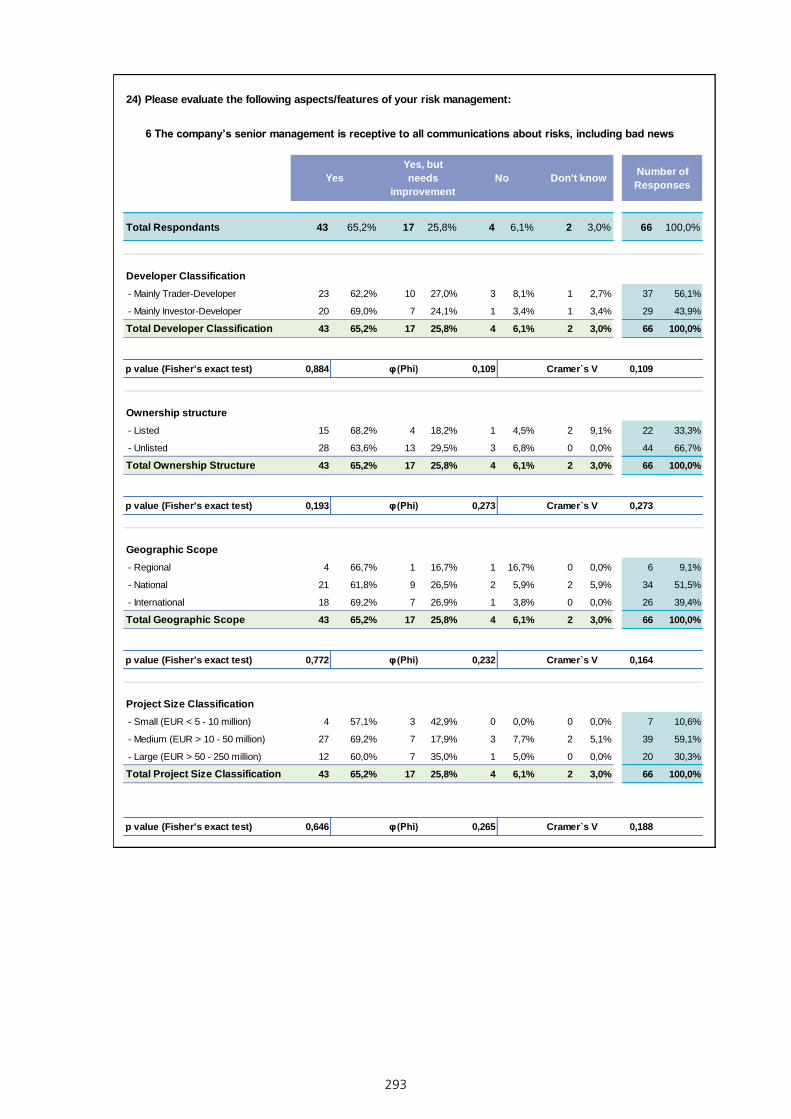
293
24) Please evaluate the following aspects/features of your risk management:
6 The company’s senior management is receptive to all communications about risks, including bad news
Total Respondants 43 65,2% 17 25,8% 4 6,1% 2 3,0% 66 100,0%
Developer Classification
- Mainly Trader-Developer 23 62,2% 10 27,0% 3 8,1% 1 2,7% 37 56,1%
- Mainly Investor-Developer 20 69,0% 7 24,1% 1 3,4% 1 3,4% 29 43,9%
Total Developer Classification 43 65,2% 17 25,8% 4 6,1% 2 3,0% 66 100,0%
p value (Fisher's exact test) 0,884 φ(Phi) 0,109 Cramer`s V 0,109
Ownership structure
- Listed 15 68,2% 4 18,2% 1 4,5% 2 9,1% 22 33,3%
- Unlisted 28 63,6% 13 29,5% 3 6,8% 0 0,0% 44 66,7%
Total Ownership Structure 43 65,2% 17 25,8% 4 6,1% 2 3,0% 66 100,0%
p value (Fisher's exact test) 0,193 φ(Phi) 0,273 Cramer`s V 0,273
Geographic Scope
- Regional 4 66,7% 1 16,7% 1 16,7% 0 0,0% 6 9,1%
- National 21 61,8% 9 26,5% 2 5,9% 2 5,9% 34 51,5%
- International 18 69,2% 7 26,9% 1 3,8% 0 0,0% 26 39,4%
Total Geographic Scope 43 65,2% 17 25,8% 4 6,1% 2 3,0% 66 100,0%
p value (Fisher's exact test) 0,772 φ(Phi) 0,232 Cramer`s V 0,164
Project Size Classification
- Small (EUR < 5 - 10 million) 4 57,1% 3 42,9% 0 0,0% 0 0,0% 7 10,6%
- Medium (EUR > 10 - 50 million) 27 69,2% 7 17,9% 3 7,7% 2 5,1% 39 59,1%
- Large (EUR > 50 - 250 million) 12 60,0% 7 35,0% 1 5,0% 0 0,0% 20 30,3%
Total Project Size Classification 43 65,2% 17 25,8% 4 6,1% 2 3,0% 66 100,0%
p value (Fisher's exact test) 0,646 φ(Phi) 0,265 Cramer`s V 0,188
Yes
Yes, but
needs
improvement
No Don't knowNumber of
Responses

294
24) Please evaluate the following aspects/features of your risk management:
7 There is adequate risk management training provided to management and other personnel in order
to ensure that adequate capability exists within the business.
Total Respondants 11 16,7% 30 45,5% 21 31,8% 4 6,1% 66 100,0%
Developer Classification
- Mainly Trader-Developer 4 10,8% 14 37,8% 16 43,2% 3 8,1% 37 56,1%
- Mainly Investor-Developer 7 24,1% 16 55,2% 5 17,2% 1 3,4% 29 43,9%
Total Developer Classification 11 16,7% 30 45,5% 21 31,8% 4 11,6% 66 100,0%
p value (Fisher's exact test) 0,073 φ(Phi) 0,322 Cramer`s V 0,322
Ownership structure
- Listed 4 18,2% 13 59,1% 3 13,6% 2 9,1% 22 33,3%
- Unlisted 7 15,9% 17 38,6% 18 40,9% 2 4,5% 44 66,7%
Total Ownership Structure 11 16,7% 30 45,5% 21 31,8% 4 6,1% 66 100,0%
p value (Fisher's exact test) 0,111 φ(Phi) 0,284 Cramer`s V 0,284
Geographic Scope
- Regional 1 16,7% 4 66,7% 1 16,7% 0 0,0% 6 9,1%
- National 5 14,7% 12 35,3% 15 44,1% 2 5,9% 34 51,5%
- International 5 19,2% 14 53,8% 5 19,2% 2 7,7% 26 39,4%
Total Geographic Scope 11 16,7% 30 45,5% 21 31,8% 4 6,1% 66 100,0%
p value (Fisher's exact test) 0,429 φ(Phi) 0,296 Cramer`s V 0,209
Project Size Classification
- Small (EUR < 5 - 10 million) 1 14,3% 3 42,9% 3 42,9% 0 0,0% 7 10,6%
- Medium (EUR > 10 - 50 million) 4 10,3% 20 51,3% 12 30,8% 3 7,7% 39 59,1%
- Large (EUR > 50 - 250 million) 6 30,0% 7 35,0% 6 30,0% 1 5,0% 20 30,3%
Total Project Size Classification 11 16,7% 30 45,5% 21 31,8% 4 6,1% 66 100,0%
p value (Fisher's exact test) 0,597 φ(Phi) 0,271 Cramer`s V 0,191
Number of
ResponsesYes
Yes, but
needs
improvement
No Don't know

295
24) Please evaluate the following aspects/features of your risk management:
8 The responsibilities for risk management and continuous monitoring of risk categories have
been defined
Total Respondants 23 34,8% 28 42,4% 10 15,2% 5 7,6% 66 100,0%
Developer Classification
- Mainly Trader-Developer 11 29,7% 17 45,9% 6 16,2% 3 8,1% 37 56,1%
- Mainly Investor-Developer 12 41,4% 11 37,9% 4 13,8% 2 6,9% 29 43,9%
Total Developer Classification 23 34,8% 28 42,4% 10 15,2% 5 7,6% 66 100,0%
p value (Fisher's exact test) 0,833 φ(Phi) 0,121 Cramer`s V 0,121
Ownership structure
- Listed 7 31,8% 11 50,0% 2 9,1% 2 9,1% 22 33,3%
- Unlisted 16 36,4% 17 38,6% 8 18,2% 3 6,8% 44 66,7%
Total Ownership Structure 23 34,8% 28 42,4% 10 15,2% 5 7,6% 66 100,0%
p value (Fisher's exact test) 0,720 φ(Phi) 0,147 Cramer`s V 0,147
Geographic Scope
- Regional 2 33,3% 3 50,0% 1 16,7% 0 0,0% 6 9,1%
- National 10 29,4% 13 38,2% 8 23,5% 3 8,8% 34 51,5%
- International 11 42,3% 12 46,2% 1 3,8% 2 7,7% 26 39,4%
Total Geographic Scope 23 34,8% 28 42,4% 10 15,2% 5 7,6% 66 100,0%
p value (Fisher's exact test) 0,468 φ(Phi) 0,284 Cramer`s V 0,201
Project Size Classification
- Small (EUR < 5 - 10 million) 4 57,1% 1 14,3% 2 28,6% 0 0,0% 7 10,6%
- Medium (EUR > 10 - 50 million) 8 20,5% 21 53,8% 6 15,4% 4 10,3% 39 59,1%
- Large (EUR > 50 - 250 million) 11 55,0% 6 30,0% 2 10,0% 1 5,0% 20 30,3%
Total Project Size Classification 23 34,8% 28 42,4% 10 15,2% 5 7,6% 66 100,0%
p value (Fisher's exact test) 0,067 φ(Phi) 0,410 Cramer`s V 0,290
No Don't knowNumber of
ResponsesYes
Yes, but
needs
improvement

296
24) Please evaluate the following aspects/features of your risk management:
9 A functional reporting concept has been designed and successfully implemented
Total Respondants 15 22,7% 30 45,5% 19 28,8% 2 3,0% 66 100,0%
Developer Classification
- Mainly Trader-Developer 7 18,9% 18 48,6% 11 29,7% 1 2,7% 37 56,1%
- Mainly Investor-Developer 8 27,6% 12 41,4% 8 27,6% 1 3,4% 29 43,9%
Total Developer Classification 15 22,7% 30 45,5% 19 28,8% 2 3,0% 66 100,0%
p value (Fisher's exact test) 0,881 φ(Phi) 0,109 Cramer`s V 0,109
Ownership structure
- Listed 9 40,9% 8 36,4% 4 18,2% 1 4,5% 22 33,3%
- Unlisted 6 13,6% 22 50,0% 15 34,1% 1 2,3% 44 66,7%
Total Ownership Structure 15 22,7% 30 45,5% 19 28,8% 2 3,0% 66 100,0%
p value (Fisher's exact test) 0,060 φ(Phi) 0,324 Cramer`s V 0,324
Geographic Scope
- Regional 1 16,7% 1 16,7% 4 66,7% 0 0,0% 6 9,1%
- National 5 14,7% 16 47,1% 12 35,3% 1 2,9% 34 51,5%
- International 9 34,6% 13 50,0% 3 11,5% 1 3,8% 26 39,4%
Total Geographic Scope 15 22,7% 30 45,5% 19 28,8% 2 3,0% 66 100,0%
p value (Fisher's exact test) 0,066 φ(Phi) 0,396 Cramer`s V 0,280
Project Size Classification
- Small (EUR < 5 - 10 million) 3 42,9% 2 28,6% 2 28,6% 0 0,0% 7 10,6%
- Medium (EUR > 10 - 50 million) 5 12,8% 19 48,7% 13 33,3% 2 5,1% 39 59,1%
- Large (EUR > 50 - 250 million) 7 35,0% 9 45,0% 4 20,0% 0 0,0% 20 30,3%
Total Project Size Classification 15 22,7% 30 45,5% 19 28,8% 2 3,0% 66 100,0%
p value (Fisher's exact test) 0,309 φ(Phi) 0,325 Cramer`s V 0,230
Yes
Yes, but
needs
improvement
No Don't knowNumber of
Responses

297
25.
Is t
here
a s
pecia
lized
co
mm
itte
e t
hat
overs
ees r
isk m
an
ag
em
en
t fo
r th
e c
om
pan
y?
Mu
ltip
le r
esp
on
ses a
re p
ossib
le
To
tal R
es
po
nd
an
ts2
41
9,0
%2
41
9,0
%2
01
5,9
%8
6,3
%5
4,0
%6
4,8
%1
81
4,3
%1
51
1,9
%6
4,8
%1
26
10
0,0
%
De
ve
lop
er
Cla
ss
ific
ati
on
- M
ain
ly T
rader-
Deve
loper
11
17,2
%13
20,3
%11
17,2
%4
6,3
%1
1,6
%2
3,1
%9
14,1
%9
14,1
%4
6,3
%64
50,8
%
- M
ain
ly In
vesto
r-D
eve
loper
13
21,0
%11
17,7
%9
14,5
%4
6,5
%4
6,5
%4
6,5
%9
14,5
%6
9,7
%2
3,2
%62
49,2
%
To
tal D
ev
elo
pe
r C
las
sif
ica
tio
n24
19,0
%24
19,0
%20
15,9
%8
6,3
%5
4,0
%6
4,8
%18
14,3
%15
11,9
%6
4,8
%126
100,0
%
Ow
ne
rsh
ip s
tru
ctu
re
- L
iste
d9
18,8
%10
20,8
%7
14,6
%2
4,2
%2
4,2
%2
4,2
%8
16,7
%6
12,5
%2
4,2
%48
38,1
%
- U
nlis
ted
15
19,2
%14
17,9
%13
16,7
%6
7,7
%3
3,8
%4
5,1
%10
12,8
%9
11,5
%4
5,1
%78
61,9
%
To
tal O
wn
ers
hip
Str
uc
ture
24
19,0
%24
19,0
%20
15,9
%8
6,3
%5
4,0
%6
4,8
%18
14,3
%15
11,9
%6
4,8
%126
100,0
%
Ge
og
rap
hic
Sc
op
e
- R
egio
nal
220,0
%2
20,0
%1
10,0
%1
10,0
%0
0,0
%0
0,0
%2
20,0
%2
20,0
%0
0,0
%10
7,9
%
- N
atio
nal
11
17,5
%13
20,6
%11
17,5
%2
3,2
%3
4,8
%3
4,8
%9
14,3
%9
14,3
%2
3,2
%63
50,0
%
- In
tern
atio
nal
11
20,8
%9
17,0
%8
15,1
%5
9,4
%2
3,8
%3
5,7
%7
13,2
%4
7,5
%4
7,5
%53
42,1
%
To
tal G
eo
gra
ph
ic S
co
pe
24
19,0
%24
19,0
%20
15,9
%8
6,3
%5
4,0
%6
4,8
%18
14,3
%15
11,9
%6
4,8
%126
100,0
%
Pro
jec
t S
ize
Cla
ss
ific
ati
on
- S
mall
(EU
R <
5 -
10 m
illio
n)
317,6
%3
17,6
%2
11,8
%1
5,9
%1
5,9
%1
5,9
%3
17,6
%3
17,6
%0
0,0
%17
13,5
%
- M
ediu
m (
EU
R >
10 -
50 m
illio
n)
12
22,2
%10
18,5
%11
20,4
%2
3,7
%1
1,9
%2
3,7
%7
13,0
%8
14,8
%1
1,9
%54
42,9
%
- L
arg
e (
EU
R >
50 -
250 m
illio
n)
916,4
%11
20,0
%7
12,7
%5
9,1
%3
5,5
%3
5,5
%8
14,5
%4
7,3
%5
9,1
%55
43,7
%
To
tal P
roje
ct
Siz
e C
las
sif
ica
tio
n24
19,0
%24
19,0
%20
15,9
%8
6,3
%5
4,0
%6
4,8
%18
14,3
%15
11,9
%6
4,8
%126
100,0
%
Bo
ard
me
me
be
rs
Ch
ief
Ex
ec
uti
ve
Off
ice
r (C
EO
)
Ch
ief
Fin
an
cia
l
Off
ice
r (C
FO
)
Ch
ief
Ris
k
Off
ice
r (C
RO
)
Inte
rna
l
Au
dit
or
Ex
tern
al
ad
vis
or
Fin
an
cia
l
Co
ntr
olle
r
De
ve
lop
me
nt
ex
ec
uti
ve
sO
the
rN
um
be
r o
f
Re
sp
on
se
s

298
25) Is there a specialized committee that oversees risk management
for thecompany?
Total Respondants 19 28,8% 47 71,2% 66 100,0%
Developer Classification
- Mainly Trader-Developer 12 32,4% 25 67,6% 37 56,1%
- Mainly Investor-Developer 7 24,1% 22 75,9% 29 43,9%
Total Developer Classification 19 28,8% 47 71,2% 66 100,0%
p value (Fisher's exact test) 0,586 φ(Phi) 0,091 Cramer`s V 0,091
Ownership structure
- Listed 3 14,3% 18 85,7% 21 31,8%
- Unlisted 16 35,6% 29 64,4% 45 68,2%
Total Ownership Structure 19 28,8% 47 71,2% 66 100,0%
p value (Fisher's exact test) 0,089 φ(Phi) -0,219 Cramer`s V 0,219
Geographic Scope
- Regional 3 50,0% 3 50,0% 6 9,1%
- National 11 32,4% 23 67,6% 34 51,5%
- International 5 19,2% 21 80,8% 26 39,4%
Total Geographic Scope 19 28,8% 47 71,2% 66 100,0%
p value (Fisher's exact test) 0,264 φ(Phi) 0,202 Cramer`s V 0,202
Project Size Classification
- Small (EUR < 5 - 10 million) 0 0,0% 7 100,0% 7 10,6%
- Medium (EUR > 10 - 50 million) 17 43,6% 22 56,4% 39 59,1%
- Large (EUR > 50 - 250 million) 2 10,0% 18 90,0% 20 30,3%
Total Project Size Classification 19 28,8% 47 71,2% 66 100,0%
p value (Fisher's exact test) 0,005 φ(Phi) 0,398 Cramer`s V 0,398
No YesNumber of
Responses

299
Appendix G - How the propositions were tested
To test proposition 1
The proposition was tested by means of investigations relating to the following ques-
tions:
1. Is the risk management process based on an enterprise wide risk management
framework? Q6
2. Is it methodical and carried out using step-by-step procedures?
a. Setting corporate objectives Q11, Q12, Q24 b, Risk Identification Q 14.2, Q15
c. Risk Assessment Q14.1, Q14.3, Q14.4, Q18
d. Risk Control Q19
e. Risk Monitoring Q21.3, Q24.3, Q24.6, Q24.9
3. Is it purposefully regular Q16, Q17, Q19, Q21.5?
4. Are systematic tools utilised? Q15, Q18, Q21.7, Q23
To test proposition 2
The proposition was tested by means of investigations relating to the following ques-
tions:
Is the risk management process regular? Q17, Q19, Q24.8
How difficult does the organisation find the risk identification and risk assessment
process? Q14.2, Q14.3, Q14.4
Does the organisation have a specialised risk management committee? Q25
To test proposition 3
The proposition was tested by means of investigations relating to the following ques-
tions:
Does the organisation have an enterprise-wide strategy for risk management? Q6
What are the drivers for implementing risk management in the organisation? Q11

300
Who has the primary responsibility of the risk management function and what is the
composition of the risk management committee? Q13, Q25
To test proposition 4
The proposition was tested by means of investigations relating to the following ques-
tions:
What is the awareness and understanding of the concept of risk and risk appetite Q9,
Q10, Q12.2, Q12.3, Q12.4, Q12.5?
What is the effectiveness of the risk management process in dealing with identified
risks Q7, Q8?
To test proposition 5
The proposition was tested by means of investigations relating to the following ques-
tions:
Does the organisation have an enterprise-wide strategy for risk management? Q6
Does the organisation have a specialised risk management committee? Q25
To test proposition 6
The proposition was tested by means of investigation relating to the following ques-
tions:
How confident is the organisation in their risk management process? Q22, Q14.2,
Q14.3, Q14.4
Are systematic tools utilised? Q15, Q18, Q21.7, Q23
Are there effective reporting lines? Q24.6
Is there adequate risk management training? Q24.7

301
To test proposition 7
The proposition was tested by investigations relating to the following questions:
What are the drivers for implementing risk management in the organisation? Q11
What is the awareness and understanding of the concept of risk and risk appetite? Q 9,
Q10, Q12.2, Q12.3, Q12.4, Q12.5
What is the effectiveness of the risk management process in dealing with identified
risks? Q7, Q8
To test proposition 8
The dissertation conducted limited quantitative analysis by means of statistical tech-
niques, namely Fisher’s exact test, Phi and Cramer’s V, to measure the fundamental
connection between empirical observation and mathematical analysis. To assess the
association for two sets of variables the Chi-square test is used by default. However,
the survey data do not satisfy the basic assumptions of the Chi-square test. This test
supposes that the frequencies that are expected under the independence assumption
are at least five. As several expected frequencies in the data of the questionnaire are
less than five the Chi-square test is not applicable. Consequently a transition to the
analogue exact test is necessary. Therefore Fisher’s exact test was chosen to analyse
the dependency structure of the variables. Because of its exact calculation approach
this test has no requirements on the data. The significance of the independent vari-
ables; ownership structure, developer type, investment volumes and geographical
scope on the dependent ones; risk perception indicators was proven by using the exact
test of Fisher. Cramer’s V was then used to determine the strength of association after
Fisher’s exact test determined the existence of significance.
The survey collected a wide range of structural characteristics of the respondent or-
ganisations (Appendix A - Questionnaire Q1 to Q25). The analysis begins with the
grouping of the collected data into classes, in this case a contingency table (MCCLAVE /
BENSON / SINCICH, 2007). Fisher’s exact test of independence was then applied to find
out if there is significant relation between these independent variables (ownership
structure, geographic scope, project size and developer type) and the dependent vari-
ables (the risk perception indicators).

302
The null hypothesis and the alternative hypothesis are formulated. The null hypothesis
is that there is no relation between the risk perception indicators and the variables and
the alternative hypothesis is that there is a relation between them:
H0: There is no association among the variables and the risk perception indicators;
Ha: There is an association among the variables and the risk perception indicators.