
Risk Management in the Intellectual Capital Stock Market · Risk Management in the Intellectual...
25
A paper to be presented at the conference “Beyond Fragmented Government: Governance in the Public Sector”, 15-17 August 2005, Victoria University, Melbourne, Australia Risk Management in the Intellectual Capital Stock Market 1 K. B. Oh Graduate School of Management La Trobe University & Sardar M. N. Islam Centre for Strategic Economic Studies Victoria University 1. Introduction Electronic commerce or e-commerce is a new phenomenon in the financial markets. The rapid advances made in the information and communications technology sector have facilitated the advent of e-commerce and has resulted in global market euphoria over technology stocks in financial markets. This paper is based on the premise that an initial characterisation of the e-commerce sector is necessary as a precursor to a more profound understanding of the financial market mechanism and asset pricing process in the Intellectual Capital sector. The development of e-commerce as a consumer market is reviewed in this study. The issues and factors contributing to this development are identified, analysed and the implications for equity valuation of e-commerce related stocks are discussed and explained. Various economic variables that influenced Australian e-commerce stock returns from July 1999 to June 2000 are examined to support the study of risk management of Intellectual Capital stocks. A critical review of existing theories of stock valuation and their empirical relevance to e-commerce is presented, representing the Intellectual Capital stocks. Investors use valuation models in determining and evaluating stock values. Due to the limitations of existing valuation models, this paper develops a new approach for the valuation of e-commerce stocks. This approach consists of firstly, identifying the pervasive economic factors, both local and international, that influence the Australian financial market; and secondly, conducting tests on the statistical significance of these 1 The authors are grateful for the extensive research assistance provided by Amerta Mardjono in preparing this paper. 1
Transcript of Risk Management in the Intellectual Capital Stock Market · Risk Management in the Intellectual...

A paper to be presented at the conference “Beyond Fragmented Government: Governance in the Public Sector”,
15-17 August 2005, Victoria University,
Melbourne, Australia
Risk Management in the Intellectual Capital Stock Market1
K. B. Oh Graduate School of Management
La Trobe University
&
Sardar M. N. Islam Centre for Strategic Economic Studies
Victoria University
1. Introduction Electronic commerce or e-commerce is a new phenomenon in the financial markets. The rapid advances made in the information and communications technology sector have facilitated the advent of e-commerce and has resulted in global market euphoria over technology stocks in financial markets. This paper is based on the premise that an initial characterisation of the e-commerce sector is necessary as a precursor to a more profound understanding of the financial market mechanism and asset pricing process in the Intellectual Capital sector. The development of e-commerce as a consumer market is reviewed in this study. The issues and factors contributing to this development are identified, analysed and the implications for equity valuation of e-commerce related stocks are discussed and explained. Various economic variables that influenced Australian e-commerce stock returns from July 1999 to June 2000 are examined to support the study of risk management of Intellectual Capital stocks. A critical review of existing theories of stock valuation and their empirical relevance to e-commerce is presented, representing the Intellectual Capital stocks. Investors use valuation models in determining and evaluating stock values. Due to the limitations of existing valuation models, this paper develops a new approach for the valuation of e-commerce stocks. This approach consists of firstly, identifying the pervasive economic factors, both local and international, that influence the Australian financial market; and secondly, conducting tests on the statistical significance of these
1 The authors are grateful for the extensive research assistance provided by Amerta Mardjono in preparing this paper.
1

factors on e-commerce stock valuation. The factor identification process in this study seeks to ensure that equity investments in the e-commerce sector will maximise financial return when these variables are included in the risk analysis. This study adopts an important and recent approach to econometric specification, estimation and testing in relation to e-commerce stock valuation. Econometric analyses including stationarity tests, cointegration modelling, volatility and predictability analyses and efficient market hypothesis checks are performed. Empirical tests are conducted using existent asset pricing models on the e-commerce data, within the context of behavioural study. Three types of risk are analysed in the volatility study as measured by beta – company risk, sector risk and portfolio risk. Portfolio selection analyses are performed on the e-commerce stocks and other assets to highlight their risk-return characteristics in a portfolio context. This allows conclusions to be drawn concerning the investment strategy adopted by portfolio managers in relation to e-commerce stocks. This paper is presented as follows. Section 2 presents the important development of Intellectual Capital sector, as represented by the e-commerce sector in the Australian stock market, while Section 3 depicts the development of e-commerce sector in Australia and Section 4 describes the e-commerce sector companies and the corresponding stocks specific under this study. Section 5 explains the risk management being pursued in this research, with Section 6 documenting the implication of the risk management study in the Australian e-commerce sector. Section 7 presents the conclusion of the risk analyses of the e-commerce sector in the Australian stock market.
2. Intellectual Capital
Tapscott et al. (2000) define Intellectual Capital as the knowledge assets that can be broadly categorised into ‘human capital (what people know), customer capital (who you know, and who knows and values you) and structural capital (how what you know is built into your business system). Intellectual Capital underpins the development of knowledge-based economy. For this aspect, Tegart et al. (1998) sum up the importance of knowledge and people as the core resources in knowledge-based economies and that ‘matching the education of the skills of the workforce [and Government policy]’ are crucial for Australian industry to remain competitive in the global economy. The forces shaping the knowledge sector include the necessary pool of skilled workers able to continually contribute to the development of intellectual property.
The era of increasing returns is upon us. Whereas diminishing returns hold sway in the traditional part of the economy – the processing industries, increasing returns reign in the newer part – the knowledge-based industries (Arthur 1996). New economy businesses are achieving market capitalisations that took old economy firms much longer to achieve. Different understanding of management techniques, strategies and government regulations are needed for the two economies (Bontis 1996). There is wide belief that information technology is a fundamental factor that will sustain the current rate of economic growth and high stock prices. De Long (1996) argues that the level of market valuation for stocks still reflects the underlying
2

fundamentals and information technology is a major fundamental factor transforming the economy and generating a global economic boom. The challenge of this research is to establish and explain, through the use of observable measures, the correlation between stock returns and real activity as a result of information technology infusion in the economy (Figure 1). Investors’ expectations of a firm’s value based on the nascent development of e-commerce are essentially speculative and conjectural to economic performance.
E-Commerce Stock
Returns
Real Activity
Measures (Information
set)
Economy - Physical activities
(Traditional industries)- Virtual activities
(E-commerce sector)
Figure 1. The Valuation Chain
The global market euphoria in e-commerce sector representing Intellectual Capital stocks raises the question of the underlying value of their market capitalisation, which appears contrary to conventional financial valuation wisdom (Desmet et al. 2000). The limitations of conventional approaches compel the use of current salient e-commerce and real economic activities, in an integrated and analytical manner, to visualise the economic logic behind this recent development. A review and investigation of the features, concepts and business models of e-commerce in the context of the financial theories of valuation and the stock market are necessary in order to capture the key elements. These elements will be analysed in the context of mainstream economic theory stressing the importance of financial activities to e-commerce developments in the stock market and the economy generally. The different approaches adopted to develop a coherent analytical framework will provide a detailed and comprehensive explanation of the different aspects of e-commerce development and, in turn, its stock price (returns).
3. E-Commerce Sector in Australia
The movements in the Australian stock prices since World War II have been closely connected to the rate of economic growth and economists had no trouble in explaining the resulting stock returns by standard valuation models where stock prices are determined by market fundamentals. But the recent growth and volatility of the e-commerce stock prices are more troublesome and the question has been asked whether these stock prices can still be explained by fundamentals, or whether speculative bubbles and fads govern these prices. Studies conducted on speculative bubbles have proven unsuccessful in testing directly for them (Ahmed et al. 1997; Hamilton and Whiteman 1985). An argument for the current valuation of the e-commerce sector representing the Intellectual Capital is that information technology, which provides the impetus for the current market boom on a global scale of e-commerce, is a fundamental factor
3

transforming the economy (De Long 1996). The high growth rates observed in the US (and Australia) are the beginning of this transformation and profit growth is expected to continue. The stock market reflects this future growth of the economy because investors, optimistic about the new economy, factor this into their investment decisions. Economic growth in the post-industrial era is expected to occur at a faster rate and earnings growth would also be faster than before and this fundamentally justifies the current stock prices. It follows that the value of e-commerce stocks is currently based on the potential outcomes and economic impacts of e-commerce – the forces underlying its development. Therefore, the market efficiency pertaining to e-commerce stocks is crucial from both the corporate finance and public policy perspectives as it impacts on the continued growth of the Australian economy. In finance the word efficiency is taken to mean that a capital market is said to be (informationally) efficient if it uses all of the available information in setting the prices of assets (Fama 1970; Ross 1980). The basic intuition of efficient markets is that investors process the information that is available to them and would then take investment positions in the market in response to their information as well as in relation to their personal situations. This would eliminate concerns the investor may have about the pricing mechanism and enable a full appreciation of the financial conditions of the capital markets to take positions in assets.
4. E-Commerce Stocks in this Study
Innovation research in economics is extensive and increasing (Cohen and Levin 1989), stimulated primarily by the major role of innovation in the theory of economic growth. The study of information as a key economic variable has been given significantly more attention by disciplines other than economics (Arrow 1996). Information aspects of business have not received the same attention as the trilogy of capital, labour and resources – leading to a situation of uncertainty about the economic impact of information, as a key economic resource, for the exploitation of virtual business or e-commerce. The virtual world is one where many of the conventional constraints of physical economic processes (such as research and development (R&D), manufacturing, distribution and marketing) no longer apply and firms, big or small, can compete with anyone in the world just as easily. Contrary to the conventional economic theory of diminishing returns developed in the nineteenth century, Arthur (1996) advocates the law of increasing returns. The foundations that the law of increasing returns is based upon rely on manipulating and exploiting the information and virtual aspects of a business. According to Arthur, increasing returns ‘are the tendency for that which is ahead to get further ahead, for that which loses advantage to lose further advantage.’ This holds true for industries that have no constraints on resources, such as high technology and knowledge-based industries. The variable factors to be analysed in this research are classified into two categories of economic and capital markets factors and the purpose is to identify the causality relation of these variables to e-commerce stock returns, representing Intellectual Capital sector in Australia.
4

This study selects macroeconomic and financial markets state variables closely related to e-commerce development. In addition, principal economic indicators such as GDP growth, money supply (M1) and industrial production are used as independent variables. Specifically, these categories are identified for their pervasiveness in influencing stock returns generally and e-commerce growth potential (thereby, cash flows). The variable factors identified under each category are listed below and they will be tested within each e-commerce sector to determine the significance of their correlation to stock returns within each sector (time series) and across sectors (sectional analysis).
Economics variables Regressor code Industrial production IP Money supply (M1) M1 Money supply (M3) M3 Credit CR Exchange rate FE Capital imports CI Balance of payment BOP Education expenses ED Retail trade RT Consumer confidence (Westpac) CC
Financial markets variables Regressor code
Market risk premium MRP Market capitalisation MCAP Yield spread YS Market return MR Risk-free rate RF SP/ASX 200 ASX SP/ASX Banks BKI SP/ASX Industrial IND. Nasdaq NAS Dow Jones Industrial Average DJ Daily stock market turnover MTURN Dividend Yield DIV 10-year Treasury bond rates TB 3-month Treasury note rates TN
5. Risks Management in Australian Intellectual Capital (E-Commerce) Stock Market
Risk management in the financial markets has long been a great area of research interest, covering market risk, credit risk, and operational risk management (Allen 2003). In the financial market, Allen (2003) suggests that risk management has become a crucial issue because of the existence of interactions (and sometimes potentially conflicting interests) between stakeholders consisting of among others lenders, regulators and stockholders, particularly due to the presence. A specially important aspect of the development of the new economy, the financial market factors, especially those related to the equity funding activities, are also crucial
5

to the determination of e-commerce stock value and need to be analysed for correlation to stock returns. Roll (1977) and Roll and Ross (1994) studies indicated that stock returns were related to both the riskless rate and the market return. Others have suggested that stock returns over time were a function of returns on industry indexes such as the equity and bond indexes (Sharpe 1970; Sharpe et al. 1995). The analysis in this section is in the context of the Australian market. The market portfolio if one is to carry it to the extreme should include all real and financial assets, which is realistically unobservable. The Australian e-commerce sector, being a small and at a nascent stage of development, is considered to have limited global impact. This precludes the use of a global market index in the simulation models and also avoids the difficulty of estimating a global risk free rate (rf). The simulation models developed were used to test the portfolio characteristics vis-à-vis e-commerce stock returns for the Australian market. From the data available on the e-commerce stocks analysed in this research, an attempt is made to construct an efficient e-commerce stock portfolio reflecting the past variability (July 1999 to June 2000) of returns, based on the assumption that the risk profile of these stocks remains unchanged over time, or at least over the short term. It would be possible to extrapolate future risk from historic risk if the underlying probabilistic structure of these stocks remains unaltered (Thompson and Thore 1992). Generally, where historical measures are used as a proxy for expected future returns, a longer time series may be a better indicator. Fama and French (1988a) and others found that long horizon returns (i.e. over several years) are more forecastable than short horizon (i.e. over a year or a month). Therefore, there are limitations on the results of this study that must be considered when the results are used for extrapolation. 5.1 Portfolio Theory and E-Commerce Stocks The number and trade of e-commerce stocks continue to increase in the market place with the proliferation of e-commerce. Fund managers who include e-commerce stocks in their portfolios would seek to minimise risk for any given level of return. It is therefore imperative that we study the appropriate investment proportion of e-commerce stock in a portfolio given their risk profile. The implications drawn from the portfolio selection analysis would also provide an indication of the investment trend for e-commerce stocks from a market perspective. This in turn allows an insight into and conjecture of the equity funding activities in this sector. It is important to understand the response of individuals to the pricing of e-commerce stocks in the market, according to portfolio theory (Sharpe 1964; Lintner 1965a, 1965b; Mossin 1969; Fama 1968). However, the crux of this study is to construct a risk-return profile for e-commerce portfolio investment using the mean-variance approach showing an efficient frontier of optimal portfolios to suit individual investor’s risk aversion. The mean-variance approach in portfolio analysis is based on a single period model of investment. At the beginning of the period, the investor selects the weights of the various asset classes in the portfolio. In selecting the asset weights, the sum of the weights must equal one. During the period, each portfolio asset generates a random return and at the end of the period, the investor’s wealth would have been changed by the weighted average of the returns. The two important
6

assumptions of portfolio theory are: firstly, that returns are normally distributed and the expected return and the standard deviation are sufficient to describe the returns, and secondly, investors are risk-averse. The CAPM, developed by Sharpe (1964) and Lintner (1965b), captures economy-wide implications and was built on Markowitz’s work to show that if investors have homogeneous expectations and optimally hold mean-variance efficient portfolios, the market portfolio will itself be a mean-variance efficient portfolio, in the absence of market frictions. Thus, the CAPM assumes that only the systematic risk exposure of each individual asset is relevant to portfolio construction. This theory is tested using the e-commerce sector returns. The Sharpe (1964) and Lintner (1965b) version of the CAPM assumes the existence of lending and borrowing at the risk free rate of interest and is tested incorporating e-commerce stocks as a portfolio choice. 5.2 Markowitz Portfolio Theory Modern portfolio theory proposed by Markowitz (1952, 1959), and still the most widely used, utilises the total risk of each individual asset (as opposed to the CAPM approach discussed above), as given by the following model. The principles of the Markowitz portfolio theory are discussed in this section (see also Eichberger et al. 1997; Campbell et al. 1997) and this approach will be applied to the portfolio analysis of e-commerce stocks. The expected return for a portfolio, E(Rp) and the variance of the portfolio are defined below: n
E(R ) = Σx E(R ) (1) p i i i=1 and: n n n
σp i=1 i=1 j=1,i≠j
2 = Σx2i σ2
i + Σi Σj xixj σij (2)
where: Rp = the return of the portfolio; Ri = the return on security i; σi = the standard deviation of the security i; σij = the covariance between securities i and j; xi = the investment proportions (or weights); and σp
2 = the portfolio variance. But σij = ρijσiσj, where ρij is the correlation between securities i and j, then equation (2) can be rewritten as: n n
σ 2 = Σi Σj x x σ (3) i j ijp i=1 j=1
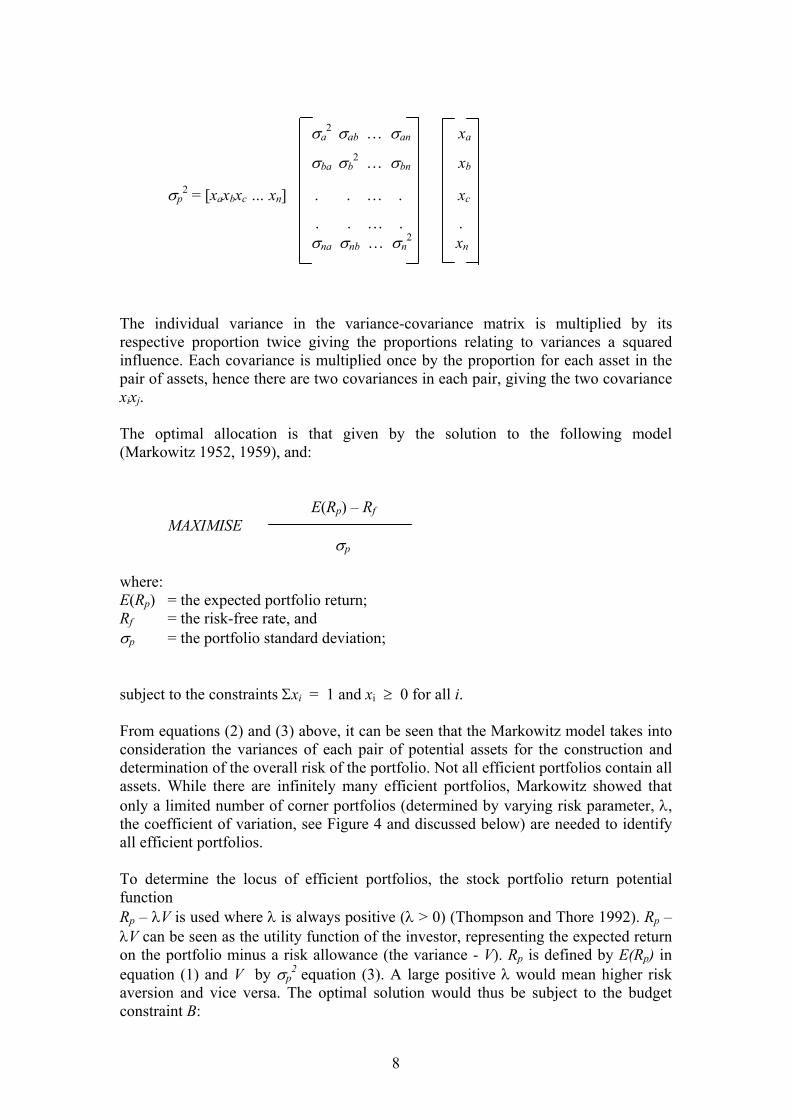
For a portfolio with assets a to n, the matrix format can be written as:
7
σa2 σab … σan xa
σba σb2 … σbn xb
σp2 = [xaxbxc … xn] . . … . xc
. . … . . σna σnb … σn
2 xn
The individual variance in the variance-covariance matrix is multiplied by its respective proportion twice giving the proportions relating to variances a squared influence. Each covariance is multiplied once by the proportion for each asset in the pair of assets, hence there are two covariances in each pair, giving the two covariance xixj. The optimal allocation is that given by the solution to the following model (Markowitz 1952, 1959), and: E(Rp) – Rf
MAXIMISE σp where: E(Rp) = the expected portfolio return; Rf = the risk-free rate, and σp = the portfolio standard deviation; subject to the constraints Σxi = 1 and xi ≥ 0 for all i. From equations (2) and (3) above, it can be seen that the Markowitz model takes into consideration the variances of each pair of potential assets for the construction and determination of the overall risk of the portfolio. Not all efficient portfolios contain all assets. While there are infinitely many efficient portfolios, Markowitz showed that only a limited number of corner portfolios (determined by varying risk parameter, λ, the coefficient of variation, see Figure 4 and discussed below) are needed to identify all efficient portfolios. To determine the locus of efficient portfolios, the stock portfolio return potential function Rp – λV is used where λ is always positive (λ > 0) (Thompson and Thore 1992). Rp – λV can be seen as the utility function of the investor, representing the expected return on the portfolio minus a risk allowance (the variance - V). Rp is defined by E(Rp) in equation (1) and V by σp
2 equation (3). A large positive λ would mean higher risk aversion and vice versa. The optimal solution would thus be subject to the budget constraint B:
8

Maximise Rp – λV (4) n subject to Σ xi E(Ri) ≤ B i=1
where: Rp = stock portfolio return; xi ≥ 0; and i = 1, … , n. The values of λ can be parametrically changed to allow the optimal solution to identify the locus of all the efficient portfolios. By inserting (1) and (3) into (4) the following quadratic programming problem is derived:
n n n
Maximise z = Σx E(R ) – λ Σi Σj xixj σij (5) i i i=1 i=1 j=1
n subject to Σ xi E(Ri) ≤ B i=1
where: z = the maximand; xi ≥ 0; and i = 1, … , n. The Markowitz model is used for two-asset portfolio analysis and the analysis is based on the assumption that investors will hold a combination of e-commerce stocks and a portion of stocks of the market portfolio that mimics the S&P/ASX 200. The data used to solve the portfolio optimisation problem include the expected returns on all assets, variances and co-variances of all asset returns and the assumptions are that investors have homogeneous expectations (agreement on the means and standard deviations and see the same efficient frontier of risky assets); that investors have a common single period time horizon for investment decision making; and that stocks are traded in a perfect market (no transaction or taxes). The investors will also see the same capital market line (CML) with the introduction of the riskless asset later in the analysis. This will introduce the transformation line, which gives a linear relationship (Cuthbertson 1997) between expected return and portfolio risk for any two-asset portfolio consisting of a risky portfolio and risk-free asset.
9

5.3 The CAPM Implications of Portfolio Theory This section addresses the theoretical implications for portfolio selection of both the classical capital asset pricing model based on a risk-free asset (Sharpe 1964; Lintner 1965a, 1965b; Mossin 1969) and the zero-beta CAPM (Black 1972). The construction of the efficient frontiers for e-commerce portfolios based on the CAPM is conducted for the e-commerce sectors analysed in this research. The following procedures (based on the discussions in Benninga 2000), which are basic to the calculations of the CAPM, are used to derive the efficient frontier and the security market line. Let c be a constant, where R – c denote the following vector:
E(r1) – c
E(r2) – c
R – c = : :
: :
E(rN) – c
Where the variable R represents the column vector of expected returns of N stocks, each would have an expected return E(ri) and is shown in the following notation: E(r1)
E(r2)
R = :
:
E(rN)
Let the vector z solve the system of linear equations R – c = Sz and then this solution produces a portfolio x on the envelope of the feasibility set as follows:
z = S-1(R – c)
x = (x1, …, xn)
10

where: zi x = i n
Σ zj j=1 Intuitively, by picking a constant c to find an efficient portfolio x which is at a tangent to the feasible set, this provides a procedure for finding x and all envelope portfolios are also a result of this procedure. That is, for any x that is an envelope portfolio, there exists a constant c and a vector z such that:
Sz = R – c and: z xi =
Σ zi j=1 Black (1972) proved that any two envelope portfolios are sufficient to construct the whole envelope and given any two envelope portfolios x = {x1, … , xn} and y = {y1, …, yn}, all envelope portfolios are convex combinations of x and y. For any given constant a, the portfolio; ax1 + (1 – a)y1
ax + (1 – a)y = ax2 + (1 – a)y2 : : axn + (1 – a)yn lies on the efficient frontier. If y is any envelope portfolio, then for any other portfolio x, the following relationship exists:
E(rx) = c + βx (E(ry) – c) (6) where: Cov (x, y)
βx = σ2
y
11

Whilst, c is the expected return of a portfolio z whose covariance with y = 0:
c = E(rz);
where: Cov (y, z) = 0. Black’s (1972) zero-beta CAPM proved that if y is on the envelope, then the regression of x on y portfolios gives a linear relationship and the Sharpe-Lintner security market line is replaced by an security market line (SML) where the role of the risk-free asset is represented by a portfolio with a zero beta with respect to the particular envelope y. If the market portfolio M is efficient, the SML holds with E(rz) and can be substituted for c in equation (6) above: E(rx) = E(rz) + βx (E(rM) – E(rz)) where: Cov(x, M) βx = ; Cov(z, M) = 0 σ2
M When there exists a risk-free asset, equation (6) above incorporates the security market line of the classic capital asset pricing model as follows:
E(rx) = rf + βx (E(rM) – rf) where: Cov(x, M) βx =
σM The converse of equation (6) is also true for a portfolio y such that for any portfolio x, the following relation holds: and the portfolio y is an envelope portfolio: E(rx) = c + βx (E(ry) – c) where: Cov(x,y) βx =
σy
12

This above approach for constructing the efficient portfolios and efficient frontier from the e-commerce sector-portfolios is applied. The e-commerce portfolio in this calculation is defined as the aggregate sector returns of all the e-commerce portfolio sectors studied in this research.
5.4 Kuhn-Tucker Conditions In the portfolio analysis, the structure of an optimal portfolio will also be determined through the evaluation of the optimum points using the criteria known as the Kuhn-Tucker conditions. This approach also allows Lagrange multiplier techniques to be used when the constraints are inequalities rather than equalities. The optimal portfolios are those defined as having a minimum variance for a given level of risk (λ). The determination of optimum points, subject to constraints using Lagrange multipliers reveals a portfolio of minimum variance, where the portfolio range is a function of the covariances and asset weightings. The conditions under portfolio selection are different from programming cases with separable concave objective function (or risk aversion function) and linear constraints. The conditions of separability no longer apply and we consider a non-linear programming problem (discussion in Thompson and Thore 1992):
Maximise f(x1, … , xn) subject to Ax ≤ b
x ≥ 0 where: f = a concave function; A = (aij) and i = 1, … , n; and b = (bj) and j = 1, … , n. The Kuhn-Tucker conditions involves the following partial derivatives:
∂f ∂f , … , ∂x1 ∂xn
By defining the row vector of Lagrange multipliers as u = (u1, … , um), the Kuhn-Tucker conditions thus become:
13

u*
1a11 + … + u*mam1 ≥ ∂f*/∂x1
. . .
u*1a1n + … + u*
mamn ≥ ∂f*/∂xn where: u*
1 , … , u*m ≥ 0;
u* = the value at the optimal point; and f* = the value at the optimal point for the concave function. The following conditions also apply from the preceding:
[u*1a11 + … + u*
mam1 – ∂f*/∂x1] x*1 = 0
. . .
[u*1a1n + … + u*
mamn – ∂f*/∂xn] x*n = 0
and are the same as:
A*x* ≤ b, x* ≥ 0 u*(b – Ax*) = 0 The Kuhn-Tucker conditions defined are: n
u*E(R )0 ≥ E(R ) – 2λ Σ σ x* i = 1, … , n (7) i i ij j j=1 n
{u* E(R )0 – E(R ) + 2λ Σ σ x* } x*i = 0 i = 1, … , n (8) i i ij j
j=1 By dividing (7) and (8) by E(Ri)0, the current return of stock i, and rearranging the solved equations the final form of the Kuhn-Tucker conditions pertaining to portfolio selection is derived as in equation (9): n-1
u* + (2λ/E(Ri)0) Σ σ xij*
j ≥ (E(R )/E(R )i i0) (9)
j=1
14

The right hand side of this equation (E(Ri)/E(Ri)0), is the expected rate of return on stock i. The left hand side represents the total of the imputed rate of return on the portfolio incorporating an allowance (discount) for risk. When the risk allowance is excessive causing the left-hand side of the equation (9) to be greater than the right-hand side, then, the investor will not invest in stock i. For the investor to invest in stock i, the relation in equation (9) must hold as an equality.
5.5 Two Risky Assets Portfolio Choice Analysis This section investigates the portfolio choice scenario of two risky assets consisting of e-commerce stocks (represented by the Australian E-commerce Multifactor Model or AEMM, and e-commerce portfolio returns) and market-stocks (S&P/ASX 200 index). In this regard, an efficient frontier is constructed using the estimated AEMM as well as the S&P/ASX 200 returns. To estimate the efficient frontier, the historical e-commerce portfolio return data is used along with the market returns data. By doing this, it is expected that the AEMM portfolio results can be compared to the ones being derived by applying two-asset portfolio choice analysis. As such, the appropriateness of the AEMM as a model of the e-commerce sector in Australia can be determined. A low degree of similarity in the return behaviour between the two groups of data is reflected in the correlation between the AEMM and market returns (only 0.4763). A chart illustrating the efficient frontier with different proportions of the two groups in the portfolio which shape supports the traditional risk-return relationship in finance of Hicks (1946), Markowitz (1959) and Tobin (1958) is presented in Figure 2:
0.95%
0.96%
0.97%
0.98%
0.99%
1.00%
1.01%
1.02%
1.03%
1.04%
1.05%
0.00% 10.00% 20.00% 30.00% 40.00% 50.00% 60.00%
Sigma
Expe
cted
retu
rn
Figure 2. The Efficient Frontier: AEMM/Market Returns
The relationship between expected return and the coefficient of variation (CV), which is the standardised measure of risk per unit of return, calculated as the standard deviation divided by the expected return is depicted in Figure 3. The most efficient portfolio by measurement of CV would consist of no e-commerce stocks. Such a portfolio would represent the market portfolio, with a 3.00 per cent expected return and portfolio risk, σp, of 24.89 per cent. The level of expected return would only increase marginally, from 0.96 per cent to 1.04 per cent, when the σp increases from
15

3.00 per cent (no e-commerce stock portfolio) to 48.28 per cent (100% e-commerce stock portfolio). The risk-return profile of the portfolio choice of AEMM and market returns favours no investment in e-commerce stocks.
0.00
10.00
20.00
30.00
40.00
50.00
0.94% 0.96% 0.98% 1.00% 1.02% 1.04% 1.06%
Coeffcient of Variation
Expe
cted
retu
rn
Figure 3. Efficient Frontier (AEMM/Market): Coefficient of Variation
5.6 Portfolio Choice: E-Commerce Stock Portfolio and S&P/ASX 200 Stocks In this section the historical returns from the study period for the e-commerce stock portfolio and the market are used for building the efficient frontier. The correlation coefficient of these two risky assets is 0.1382 indicating a relative lower level of correlation between the two classes of stock compared before. This implies a lower degree of co-movement between the e-commerce stock portfolio returns to the market returns.
0.00
0.05
0.10
0.15
0.20
0.25
0.00 0.10 0.20 0.30 0.40 0.50
Sigma
Expe
cted
retu
rn
Figure 4. The Efficient Frontier: E-Commerce Stock Portfolio/Market Returns
16

Figure 4 depicts the different investment proportions between the two classes of stock. The risk-return behaviour of the portfolio standard deviation to expected return appears to be directly correlated with a greater proportion of e-commerce stock in the portfolio. That is, a higher risk profile resulting from a greater proportion of e-commerce stock is compensated by higher expected return. Figure 5 below shows the relationship between expected return and the CV. The efficient portfolio measured by the coefficient of variation of the average e-commerce stocks and the average market stock would consist of 90% market stocks and 10% e-commerce stocks yielding an expected monthly return of 2.82% (or 33.84% annualised) with monthly σ of 5.73% and CV of 2.03.
0.00%
5.00%
10.00%
15.00%
20.00%
25.00%
2.00 2.20 2.40 2.60 2.80 3.00 3.20
C o ef f icient o f V ar iat io n
Figure 5. The Efficient Frontier (E-Portfolio/Market): Coefficient of Variation
On the basis of the CV criterion, the risk associated with an exclusive market-stock portfolio decreases with diversification by including 10 per cent e-commerce stocks from 3.14 to 2.03, and represents the efficient portfolio that offers the highest expected return at a given level of risk. After this point (CV = 2.03) any further diversification to include more e-commerce stocks to the portfolio progressively increases the level of CV at an increasing rate (Figure 4). Also from Figure 5, the downward sloping part of the envelope represents portfolios that are not efficient while portfolios on the rising part of the curve offer both a higher expected return and less risk (a lower coefficient of variation). The characteristics highlighted in this section confirm the high volatility nature of the e-commerce stocks under portfolio conditions. The portfolio selection process tested above allows for only 10% of the portfolio to be invested in e-commerce stocks, this percentage being the most efficient portfolio in terms of risk per unit of return.
17

5.7 Efficient E-Commerce Sector Portfolios A selection of n = 10 risky assets is chosen for this analysis, in accordance to the 10 e-commerce sectors. Each of these risky assets is chosen with expected return E(Rs), where s represents the individual sectors. The risk-free rate (Rf), represented by the constant c, is the same risk-free rate used in our CAPM analyses of 5.63 per cent (also being the geometric mean), and the calculation for estimating the efficient frontier according to equation (6). The method for calculating the variance-covariance matrix in this section involves using the excess return matrix and this approach underlies the security market line (SML). The objective of this section is to identify the set of feasible portfolios, consisting of the e-commerce sectors, represented by the area inside and to the right of the curved line in Figure 6 below. A feasibility portfolio is on the envelope of the feasible set with a minimum variance for a given return.
0.099985
0.099990
0.099995
0.100000
0.100005
0.100010
0.100015
0.100020
0.00 0.50 1.00 1.50 2.00 2.50 3.00 3.50 4.00 4.50
Sigma
Exp
ecte
d R
etur
n
Figure 6. E-Commerce Sector Efficient Frontier
The efficient frontier of the e-commerce sector envelope derived from the primary stock returns data for the e-commerce sectors is shown in Figure 6. The envelope represents the convex combination of efficient portfolios x and y, where the set of efficient portfolios start with the portfolio σ = .2549 and E(R) = 0.10000313 with weight on x = 70 per cent and y = 30 percent. In this context, the efficient portfolios consist of the weight on x being less than or equal to 70 per cent (i.e. x ≤ 70% of total portfolio). The portfolios with weights of x greater than 70 per cent (x > 70%), which are still on the envelope of the set of feasible portfolios are considered not efficient due to their lower expected returns. For each portfolio with greater than 70 per cent of x (downward sloping section of the envelope in Figure 6) a superior (efficient) portfolio can be found (with combinations that lie on the upward slope of the envelope) that gives a higher return for the same level of risk. This section reveals that the e-commerce stocks are highly correlated and volatile. The correlation and volatility is also reflected from the efficient frontier in Figure 6, which shows only a narrow differential in expected return (from 0.10000313 to 0.10001181) with a corresponding wider band of risk (σ) of 1.8792 (from 0.2549 to 2.1341). The optimal portfolio with the lowest risk per unit of return, i.e. CV of 2.549 consists of 70 percent of x portfolio and 30% of y portfolio. This study shows that the
18

appropriate selection of e-commerce sectors in a portfolio can substantially reduce risk but has very little impact on expected return. 5.8 Testing the CAPM with the E-Commerce Sector Data The CAPM’s security market line postulates that the mean return of each asset should be linearly related to its beta. In the context of this research, if we are to assume that the historical data on stock return for the e-commerce sectors are representative of future returns, we can postulate that:
E(Rs) = α + Фβs + εs. where: E(Rs) = the mean returns of the e-commerce sectors; α = the constant term; Ф = the coefficent of βs; βs = the betas for the e-commerce sectors; and εs = the error term. We can test this hypothesis by regressing the mean returns on the betas for the e-commerce sectors. The results of this regression that the SML is given by E(Rs) = α + Фβs, where α = 0.3266 and Ф = –0.0775. The R2 of the regression is 90.98 percent. Thus the regression test yields the following SML: E(rs) = 0.3266 – 0.0775βs (10) The high R2 (90.98%) and the t-statistics suggest that there is a relationship between expected return and portfolio β, albeit a negative or inverse relation. Under such conditions, the return on the market is E(rm) = 32.66% – 7.75 = 24.91 per cent (i.e. when β = 1) . However, if we treat the constant in equation (10) as the risk-free rate, it would not realistically reflect the market risk-free rate. The inverse relationship between expected return E(r) and the β coefficient in equation (10) appears to contradict the risk-return relation of portfolio selection to the extent that the constant remains positive. Intuitively, this test of checking the CAPM by plotting the SML does not appear to be appropriate, despite the high statistical evidence (R2) to support the relationship between expected return and portfolio beta. Several factors may contribute and they include non-homogeneity in the assessment of e-commerce returns, variances and co-variances, or the number of e-commerce assets (i.e. risky assets) may not be sufficient to fully test the model. The risky assets tested in this analysis are the e-commerce sectors only and in terms of all risky assets, they represent only a small proportion of all the stocks or risky assets in the market. Empirical tests done on the CAPM have successfully included risky assets such as real estate and bonds and its effectiveness is well documented (Pastor and Stambaugh 2000). From the preceding analysis, it appears that the CAPM is unsuitable for portfolio choice selection in the e-commerce sector. Therefore, this supports the multifactor model (AEMM) developed in this research as a better model
19

for estimating e-commerce stock value, as the estimated independent factors (NAS, CC and FE) imply a wider systematic risk influence on other risky assets in the market. 5.9 Portfolio Optimisation under Kuhn-Tucker Conditions Portfolio optimisation under the Kuhn-Tucker conditions in this study takes into account the constrained optimisation within the context of a three-asset portfolio based on the data in the study period of this research, being (1) e-stocks, (2) S&P/ASX 200 stocks and (3) cash. To perform this operation, the computer program PORTCHOICE using the GAMS software (Brooke et al. 1997) is applied to calculate the optimal portfolio choice. PORTCHOICE is a substantially modified version of the PORTFOLIO program provided in Thompson and Thore (1992). For the portfolio optimisation, monthly return data are used, where the monthly returns of the e-commerce stock are the average returns of the stocks in the e-commerce portfolio on the last business day of each month. The market stock’s monthly returns are the returns of the S&P/ASX 200 market index on the last trading day of the month in the same period. The monthly average total in monetary value of trade in the sample e-commerce stocks of this study, calculated by multiplying the average monthly turnover with the average of the high-low prices for each stock, produced an investment budget of $1.394 billion representing. The mathematical expectations of the stocks returns are therefore following: E-Stock (i = 1 ) is 9.59% and Market Stock (i = 2) is 0.96% Based on the above, the covariance matrix is shown as follows:
Portfolio S&P/ASX 200 Portfolio 0.220093 S&P/ASX 200 0.001946 0.000901
The expected returns are used as forecasts and the holding of cash is denoted by x3. The risk parameter is denoted by λ and when λ is large, there is greater risk aversion. Thus the Lagrangian and the portfolio problem, incorporating the expected stock returns of the two assets and their covariances, to be optimised is presented in equation (11), which is also the numerical specification of the equation (9). Maximise: 19.95x1 + 0.96x2 + x3 - λ(0.22x1
2 + .0009x1x2 + .0019x2x1 + .0009x22) (11)
subject to: 14.66x1 + 7.47x2 + x3 = $1,394,004,000 x1, x2, x3 ≥ 0 This parametric test concludes that it would not be a portfolio choice under all circumstances, mainly because in a portfolio context it does not have significant impact, particularly in terms of the stock’s relatively small expected return (0.96%) in
20

relation to its risk (standard deviation = 3%). When risk aversion is less (i.e. λ is small) there is a tendency to purchase more of the riskier e-commerce stocks. When risk aversion is high (i.e. λ is large), the preference would be to hold more cash rather than the less risky market-stock, as the trade-off between the risk-return of the market-stock would tend to favour holding cash. The riskiness of e-commerce stocks as an investment choice as manifested by the small amount allocated for investment in this highly volatile asset is confirmed through the optimisation test. When risk aversion is at its lowest in the test (i.e. λ = 0.0005), the amount invested in e-commerce stocks is only $31,620 out of the sum of $1.394 billion for investment (or 0.000023%). This suggests that the investor would rather choose to hold cash than to invest substantially in any of the two stocks when the e-commerce stock is too risky and volatile and the market-stock’s return is too low for its risk level to be considered an advantage to holding cash. Conversely, the analysis suggests that the investor has to have relatively low risk aversion to remain invested in e-commerce stock.
6. Implications
The systematic and unsystematic risk profile of e-commerce stocks, as measured by the market index, indicates that unsystematic risk has a more profound influence (82%) than systematic risk (18%) on e-commerce stock returns (Oh 2001). Therefore e-commerce stocks have less of a tendency to move together with the general market variability. This is also illustrated by the higher return variability of the e-commerce stock portfolio (Oh 2001); where monthly standard deviation (σ) is 49.82%, compared to the general market σ of 3.13%. Also, volatility measured against the market, represented by beta, is generally higher for most sectors. This indicates a more volatile market for e-commerce sector than the general market. From the perspective of risk-return relationship, the risk and return trade-off appears not to hold, which is consistent with the high unsystematic risk profile of e-commerce stock. This confirms the general systematic risk level of the e-commerce stocks and that they move predominantly in a volatility universe of their own, and relatively independent of the market (Oh et al. 2002). This infers that e-commerce prices (hence returns) that alter by large amounts reflect the rapid changes in fundamentals of the industry compared to the general market. These changes may represent the opportunity sets for e-commerce firms and industry or more general structural market reform in response to e-commerce related developments (Oh et al. 2002). It is probably difficult at this stage to gauge whether the e-commerce market is excessively volatile relative to the general market, due to the lack of comparative and long-horizon earnings performance data for e-commerce firms, which could provide a yardstick against which to compare volatilities. As the business activity of e-commerce firms becomes more established and stabilised, the level of unsystematic risk is expected to decrease while the riskiness of the stock is expected to reflect more the systematic risk or market risk. This can be explained by the fact that a firm’s earnings become more stable and predictable as its business matures and it carves itself a niche in the market. It is consequently able to
21

set clear objectives and direction for future growth. What then happens is that e-commerce firms become more like the traditional firms in the market that are sensitive and subject to market fundamentals. This characteristic is consistent with the mean reverting behaviour of stock returns, that is, higher than average returns are followed by lower returns in the future (Fama and French 1988a, 1988b; Poterba and Summers 1988).
7. Conclusion
The investigation about the risks analysis of the Australian Intellectual Capital stocks by taking the e-commerce stocks confirms relatively high unsystematic risk of e-commerce firms. This suggests that e-commerce sector return may react more aggressively to idiosyncratic economic factors, including effective demand, market uncertainty, speculative investment, distribution and composition of national income, public policy and openness of domestic market to international finance and trade, than the traditional factors identified in other empirical studies. Therefore, investment evaluation and public policy formulation must take note of this important point in order to frame the right approach to address the situation. The volatility (thus low level of predictability) of e-commerce stocks would make pricing of initial public offers a daunting task for fund-raisers. In addition, equity investment in the e-commerce sector might be construed as speculative given the findings on the volatility and return profile. The existence of idiosyncratic factors influencing e-commerce stock value would also make long-term valuation of e-commerce firms difficult, creating a high degree of uncertainty in the market place of its investment value. Lastly, high risk-aversion towards e-commerce stock as an investment choice in the Intellectual Capital financial market in Australia would pose a challenge to corporate managers in equity fund-raising activity.
8. References
Ahmed, Ehsan, Koppl, R., Rosser, B. and White, M. 1997, ‘Complex Bubble Persistence in Closed-end Funds’, Journal of Economic Behaviour and Organisation, no. 32, pp. 19-37. Allen 2003 Arrow, K. J. 1996, ‘The Economics of Information: An Exposition’, Empirica, vol. 23, pp. 119-128. Arthur, W. B. 1996, ‘Increasing Returns and the New World of Business’, Harvard Business Review, July-August.
22

Benninga, S. 2000, Financial Modelling, The MIT Press, Massachusetts Institute of Technology, Cambridge, Massachusetts. Black, F. 1972, ‘Capital Market Equilibrium with Restricted Borrowing’, Journal of Business, vol. 45, no. 3, pp. 444-454. Bontis, N. 1996, ‘There’s a Price on Your Head: Managing Intellectual Capital Strategically’, Ivey Business Quarterly, Summer. Brooke, A., Kendrick, D., Meeraus, A., Raman, R., 1997. GAMS: A Users Guide, GAMS Home Page, http://www.gams.com. Campbell, J. Y., Lo, A. W. and MacKinlay, A. C. 1997, The Econometrics of Financial Markets, Princeton University Press, Princeton, New Jersey. Cohen, W. and Levin, R. 1989, ‘Empirical Studies of Innovation and Market Structure’, in R. Schmalensee and R. Willig (eds), Handbook of Industrial Organisation, Schmalensee, R. and Willig, R., Vol. II, Elsevier Science BV, Amsterdam. Cuthbertson 1997 De Long, J. B. 1996, ‘Is the Stock Market Too High?’, Slate, 20 December 1996, www.slate.com/gist/96-12-21/gist.asp Desmet, D., Francis T., Hu A., Koller T. M. and Riedel G. A. 2000, ‘Valuing Dot-Coms’, The McKinsey Quarterly, no. 1. Eichberger, J. and Harper, I. R. 1997, Financial Economics, Oxford University Press, New York. Fama, E. F. 1968, ‘Risk, Return and Equilibrium: Some Clarifying Comments’, Journal of Finance, March, pp. 29-40. Fama, E. F. 1970, ‘Efficient Capital Markets: A Review of Theory and Empirical Work’, Journal of Finance, vol. 25, no. 5, May, pp. 383-417. Fama, E. F. and French, K. R. 1988a, ‘Permanent and Temporary Components of Stock Prices’, Journal of Political Economy, vol. 96, pp. 246-273. Fama, E. F. and French, K. R. 1988b, ‘Dividend Yields and Expected Stock Returns’, Journal of Financial Economics, vol. 22, pp. 3-25. Hamilton, J. and Whiteman, C. 1985, ‘The Observable Implications of Self-Fulfilling Expectations’, Journal of Monetary Economics, no. 16, pp. 353-74. Hicks, J. R. 1946, Value and Capital, 2nd edn, Oxford University Press, London. Lintner, J. 1965a, ‘Security Prices, Risk and Maximal Gains from Diversification’, Journal of Finance, vol. 20, pp. 587-615.
23

Lintner, J. 1965b, ‘The Valuation of Risky Assets and the Selection of Risky Investments in Stock Portfolios and Capital Budgets’, Review of Economics and Statistics,” vol. 47, pp.13-37. Markowitz, H. 1952, ‘Portfolio Selection’, Journal of Finance, vol. 7, no 1, pp. 77-91. Markowitz, H. 1959, Portfolio Selection: Efficient Diversification of Investments, John Wiley and Sons New York. Mossin, J. 1969, ‘Security Pricing and Investment Criteria in Competitive Markets’, American Economic Review, December, pp. 749-756. Oh, K. B. 2001, ‘An Empirical Analysis of Financial Issues in the Australian Electronic Commerce Sector’, Doctoral Thesis, Victoria Graduate School of Business, Victoria University, Melbourne. Oh, K. B., Islam, S. M. N. and Bose, S. 2002, ‘The Dynamics of Economic Variables in E-Commerce Equity Valuation: Implications for ASEAN’, 6th Quality, Innovation and Knowledge Conference held in February 2002, at Kuala Lumpur, Malaysia. Pastor, L. and Stambaugh, R. 2000, ‘Comparing Asset Pricing Models: An Investment Perspective’, Journal of Financial Economics, vol. 56, pp. 335-381. Poterba, J. M. and Summers, L. H. 1988, ‘Mean Reversion in Stock Prices: Evidence and Implications’, Journal of Financial Economics, vol. 22, pp. 26-59. Roll, R. 1977, ‘A Critique of the Asset Pricing Theory Tests: Part 1’, Journal of Financial Economics, vol. 4, pp. 129-176. Roll, R. and Ross, S. 1994, ‘On the Cross-Sectional Relation between Expected Returns and Betas,’ Journal of Finance, vol. 49, pp. 101-122. Ross, S. A. 1980, ‘A Test of the Efficiency of a Given Portfolio’, Paper presented to the World Econometric Meetings, Aix-en-Provence. Sharpe, W. F. 1964, ‘Capital Asset Prices: A Theory of Market Equilibrium Under Conditions of Risk’, Journal of Finance, no. 19, pp. 425-42. Sharpe, W. F. 1970, Portfolio Theory and Capital Markets, McGraw-Hill, New York, NY. Sharpe, W. F., Alexander, G. and Bailey, J. 1995, Investments, 5th edn, Prentice-Hall, Englewood Cliffs, NJ. Tapscott, D., Ticoll, D. and Lowy, A. 2000, Digital Capital: Harnessing the Power of Business Web, Harvard Business School Press, Boston.
24

Tegart, G., Johnston, R. and Sheehan, P. 1998, ‘Academy Study-Interim Report: A Preliminary Analysis of the Issues’, in P. Sheehan, and G. Tegart (eds), Working for the Future: Technology and Employment in the Knowledge Economy, Victoria University Press, Melbourne. Thompson, G. L. and Thore, S. 1992, Computational Economics: Economic Modelling with Optimisation Software, The Scientific Press Series, International Thomson Publishing, Inc., New York. Tobin, J. 1958, ‘Liquidity Preference as Behaviour Towards Risk’, Review of Economic Studies, vol. 25, pp. 65-86.
25