Risk management in a mega-project: the Universal EXPO 2015...
19
1 G. Locatelli, M. Mancini “Risk management in a mega-project: the Universal EXPO 2015 Case” International Journal of Project Organisation and Management. 2010, Vol. 2, No.3 pp. 236 - 253. Risk management in a mega-project: the Universal EXPO 2015 Case. Giorgio Locatelli Department of Management, Economics & Industrial Engineering Politecnico di Milano Piazza Leonardo da Vinci, 32 20133 Milano - Italy Tel: +39 02.2399.4056 Fax: +39 02 2399 4083 email: [email protected] Mauro Mancini Department of Management, Economics & Industrial Engineering Politecnico di Milano Piazza Leonardo da Vinci, 32 20133 Milano - Italy Tel: +39 02.2399.4065 Fax: +39 02 2399 4083 email: [email protected]
-
Upload
nguyencong -
Category
Documents
-
view
216 -
download
0
Transcript of Risk management in a mega-project: the Universal EXPO 2015...
1
G. Locatelli, M. Mancini “Risk management in a mega-project: the Universal EXPO 2015 Case” International Journal of Project Organisation and Management. 2010, Vol. 2, No.3 pp. 236 - 253.
Risk management in a mega-project: the Universal EXPO 2015 Case.
Giorgio Locatelli
Department of Management, Economics & Industrial Engineering
Politecnico di Milano
Piazza Leonardo da Vinci, 32
20133 Milano - Italy
Tel: +39 02.2399.4056
Fax: +39 02 2399 4083
email: [email protected]
Mauro Mancini
Department of Management, Economics & Industrial Engineering
Politecnico di Milano
Piazza Leonardo da Vinci, 32
20133 Milano - Italy
Tel: +39 02.2399.4065
Fax: +39 02 2399 4083
email: [email protected]
2
ABSTRACT
The paper analyzes the literature on risk management in mega-projects suggesting possible mitigation
actions to be considered in the stakeholders management. EXPO 2015 represents a perfect project to
understand the strength of a rigorous methodological approach to uncertainty and the need for a mature
consciousness at managerial level on these topics. Analyzing real available data on this project, the
number of visitors appears overestimated, so, adopting the SHAMPU framework, the paper quantifies the
relative impact and provides possible mitigation actions. Practical actions crossing the risk management
phases in mega projects proposed by literature are suggested in the conclusions.
Keywords: mega-projects, EXPO 2015, risk management, optimism bias.
3
1 Mega-projects: literature review
1.1 Introduction to mega-projects
The literature defines “mega-project” a multi major infrastructure project with a value greater than $ 1
billion (Flyvbjerg et al., 2003), usually commissioned by government and implemented by private
enterprises, characterized by uncertainty, complexity and political sensitivity. It involves a wide range of
business partners, industry, politicians (Clegg et al., 2002), and has strong economic and environmental
impact for a long time (Bruzelius et al., 2002). Often a Mega-project can be seen as a set of different
smaller projects with different contents, but coordinated to achieve a goal and a common result. Each of
these projects is also characterized by elements of a mega-project such as complexity, uncertainty,
integration of different skills in the organization, coordination of construction activities etc. (Van
Marrewijk, 2008). Usually the public is the main backer in mega-projects, because public events (e.g.
Olympics Games) have the strongest impact on urban development and economic areas. Moreover this
kind of projects are the most strategic and require a huge financial effort. This usually implies a strong
involvement from public institutions in the project financing phase.
This context generally drives the importance of the critical success factors, even in high engineering
projects, from technical solutions to stakeholders management, both before and during the project
development. Considering mega events like Olympic Games or Universal Expositions this element is
furthermore increased by the mixture of social interests continuously changing in the short and long term
that can completely modify the perception of the performance of the project. This generally allows for a
clear picture of the project only after decades (remember for instance that the Eiffel Tower was built for
the 1889 EXPO in Paris) which imposes a rigorous approach to project uncertainties in order to take
opportunities that could be lost without a precise balance of positive and negative impacts.
The huge amount of studies proposed by international literature generally focused on the analysis of past
events, i.e. on what had gone in the right or in the wrong direction, trying to summarise the lessons
learned for the future. This kind of studies are very important, but, obviously, they do not take into
consideration those projects that never got started due to negative output of risk analysis, and so it is very
difficult to measure lost opportunities. This paper will try to cover this gap suggesting a correct approach
in the determination of the positive and negative impact of stakeholder pressure on a mega project (that
lead to a demand overestimation) enlarging the spectrum of possible mitigation action to be considered in
order to avoid the loss of good opportunities for the companies and communities involved.
Based on the public data from the bid dossier (http://www.milanoexpo-2015.com.) this paper deals with
the following research question: “Has demand been overestimated in the EXPO 2015 case and, if so, what
will its effect be and how is it possible to reduce unsought outcomes?”. Therefore, this work fits in the
stream of “risk of demand in a mega-project”, but with respect to most of the paper of this stream
(reported in the literature section) this is an ‘a priori’ evaluation and not an ‘ex-post’. In fact, we aim to
assess if the estimation of the number of visitors and visits (a visitor can make multiple visits.) is reliable,
before the event and not after. We think that this analysis is extremely valuable, because we are in the
planning phase of this project, therefore it is possible to implement all the corrective actions necessary for
the project success.
4
1.2 Project Risk management in mega events
As Flyvbjerg observes (Flyvbjerg et al., 2002, 2003), the risks characterizing a mega-project can be
clustered in four areas:
1. Risks of cost (construction, maintenance, management);
2. Risks of demand (income and estimated demand);
3. Financial risks and market (lack of funds, financial sustainability, interest rates);
4. Political risks (regulatory, public investment parallel).
The breakdown of risks into areas or sources or typology and so on, as proposed by literature and actually
applied by companies, is very useful to define mitigation actions and, in fact, in this paper we deal
exclusively with the second point. But this can also be misleading because it can lead to difficulty or to an
underestimation in the correlations among factors, that generates uncertainty on the project. The main
consequence is that, especially on mega events, since the bigger amount of analyses generally considers
the negative risk (to protect the organization committee) some opportunities may be lost and cannot be
rightly balanced by the optimistic perception of some stakeholders. On this idea the contribution of
Warrack (Warrack 1985; 1993) must be stressed because, recognising as a critical factor for a mega-
project the strong involvement of public actors in its financing and governance, he poses as a pre-requisite
that a public management should have the decision-making power and ability to guide the design choices
to overcome problems and obtain the financial and social benefits developing a good project culture
involving all the stakeholders. So, no mistake can be allowed on the social and economical effort of the
community that will benefit from the project, and this must be balanced with the contribution of Van
Marrewijk (Van Marrewijk, 2008) who considers the project financing as one of the most important
aspects in any mega-project, because it is difficult to find a consortium of private lenders willing to
assume all the risks associated with the financing of this kind of events.
This context creates the right dominion to develop a unique methodology to cope with the positive and
negative impact of stakeholders in the project that (as EXPO 2015) must be financed by private
companies, public administrations and final consumers.
5
2 Optimistic estimations: literature review
In the literature, several studies indicate that optimism in the estimation of demand and costs in large
projects is a common characteristic, especially in the conceptual phase of the project. In particular:
Pickrell (Pickrell, 1992) analyzes the differences between budget demand and actual demand, using a
sample of eight major projects in rail infrastructure (heavy and light) in the United States. The results of
his work show that in seven out of eight cases the actual demand was lower by 50% than budget, and only
in one case did this difference reach "only" 28%. He argues that this difference is due to inaccurate data or
models.
Some researchers (Skamris et al., 1997; Trujillo et al., 2002) analyze large urban infrastructure to identify
a range of variation of estimates of demand for these projects. Both researches provide similar results: the
demand is overestimated by 25-60% and 20-60%.
Among all the authors Flyvbjerg is probably the most relevant for this topic (see for example Flyvbjerg,
2006; 2007). His studies are based on a larger sample of infrastructure projects including 258 major
projects completed over the past 70 years, in 20 different countries, for a total value of 90 billion dollars.
Flyvbjerg uses this database providing many important results summarized in the following references:
(Flyvbjerg et al., 2003) shows how the availability and reliability of data on large projects affects the
estimation. Projects with reliable data can be managed better than average, achieving better results. The
authors also argue that, usually, the decision to implement the project is made before the formal decision,
consequently the early estimates are the worst.
(Flyvbjerg et al., 2005), tries to quantify the accuracy of the estimation of demand for rail and road
projects. By analyzing a sample of 183 road projects and 25 rail projects, he discovers that the actual
traffic of passengers in a rail project is overestimated by 105.6%. For road projects, however, the actual
traffic of vehicles is 9.5% higher than estimated. The authors note that the inaccuracy of estimation is not
specific to a given country and it is constant over 30 years.
These contributions are strategic for a mega event because their economic impact can be catastrophic for
the companies involved and for those countries that consider a mega event as a way to open their
boundaries to the worldwide community, like the past Olympic Games or the coming World Soccer Cup
in South Africa.
Following this approach in the international literature, two macro-categories of causes have been
identified to explain these remarkable poor results:
inadequacy of the methodologies,
strategic data manipulation.
Inadequacy of the methodologies used
Quinet (Quinet, 1998) identifies three sources of errors: methodological problems in the structure of the
model estimation, problems in the data used in the analysis, uncertainty about the values of the exogenous
variables.
Trujillo (Trujillo et al., 2002) argues that estimation techniques are the main cause of differences between
budget and actual values. However they include in “techniques for estimating” not only the methods of
estimation of future demand, but also the methods used to derive and analyze the trend demand.
Flyvbjerg (Flyvbjerg et al., 2003) shows that it is not the model that accounts for most of the differences,
but the basic assumptions made by analysts before applying the model, and later he points out that
technical explanations are to be excluded because not confirmed by the data (Flyvbjerg et al., 2005). Two
reasons support this argument:
if the inaccuracy depended exclusively on technical causes, a normal distribution of error with an
average close to zero should be expected, however the actual distribution is not normal with an
average error much greater than zero (actual costs are usually over budget)
6
it is reasonable to expect an improvement over time of assessment methods due to more
sophisticated forecasting models and modern informatics tools. However, over time, the
estimations do not improve. Since technical factors do not justify the inaccuracy, authors focus on
the second set of reasons.
Strategic data manipulation
Wachs (Wachs, 1990) interviewing government officials, consultants and planners in charge of different
projects for transportation in the U.S., noted that estimations were biases. Planners, engineers and
economists manipulated forecasts to achieve values, not justified in technical terms, but acceptable for
their superiors to implement the project. Wachs hypothesizes that this abuse is "almost universal" when
forecasting assumes an important role in the political debate.
Trujillo (Trujillo et al., 2002) assessed the role played by different players, both public and private, in
large-scale public transport projects. They found that when a project is not entirely public the estimation
and decision making process is fragmented among different players. In this case, politicians have
incentive to overestimate the demand, to take political advantage when announcing new public projects.
Lovallo and Kahneman (Lovallo and Kahneman, 2003) show that cognitive biases and organizational
pressures push managers to provide optimistic forecasts. They overestimate the benefits of a project and
underestimate the potential hazards.
Flyvberg (Flyvberg et al., 2003; 2005), incorporates the results of previous contributions adding other
reasons:
Opportunism. This reason explains the phenomenon in terms of personal and public interest. In the
first case, the project implementation should provide profits for engineers, construction companies,
etc. If these players are involved in the estimation process they could bias the results in order to
increase the chances of implementing the project. In the second case, the public players underestimate
the costs or overestimate the demand to make the project more attractive for private investors and
acceptable by society.
Optimism bias. The authors indicate that the most common psychological explanation is the presence
of a certain "optimism" which induces promoters to consider each assumption positively. The authors
point out, however, that such optimism is misleading for the promoters themselves, and not an
intentional error.
7
3 Method: the SHAMPU approach in EXPO 2015
Since in this kind of event the risk of demand overestimation is quite common, it is necessary to set up a
rigorous process in order to face this risk. The literature presents many risk models, and in (Haghnevis and
Sajedi, 2006) there is the comparison among the most relevant. The result is that the SHAMPU (Chapman
and Ward, 2003) and PMBOK (PMI, 2004) approaches result the more adequate for this context as
equally stressed in (Seyedhoseini and Hatefi, 2010). Since SHAMPU is particularly appropriate when
stakeholders are a major source of uncertainty in projects (Ward and Chapman, 2008), as in the EXPO
2015 case, the SHAMPU methodology seems to be the best for the EXPO project among whose main
stakeholders are the visitors.
The SHAMPU methodology being an excellent framework for this analysis, we adopted it to deal with the
risk of demand in EXPO 2015; the nine steps of the SHAMPU framework are addressed in the following
paragraphs:
SH 1 Defining the project, see par. 3.1 and par. 3.2.
SH 2 Focusing on the project, done by the EXPO organizer committee.
SH 3 Identifying the issue, see par. 2.
SH 4 Structuring the issue, see par. 3.3.1.
SH 5 Clarifying ownership, see par. 3.3.2.
SH 6 Estimating variability, see par. 4.
SH 7 Evaluating implications, see par. 4.
SH 8 Harnessing the plan (in this case mitigation actions), see par. 4.2.
SH 9 Managing implementations.
In order to apply the SHAMPU approach, the main data derive from the bidding document where the
project is clearly defined, focused upon and different issues are proposed [SH 1, SH 2, SH 3]. To structure
the issue and clarify the ownership, historical data on previous EXPO’s has been merged with the
approach used by the organizer [SH 4, SH 5] to identify a possible range of variability of the interested
factors [SH6] along with their impact on the Project Balance [SH 7] in order to determine the mitigation
plan [SH 8] and its possible management [SH 9]. To simplify comprehension the reference to the
SHAMPU i-step will be indicated [SH i].
3.1 EXPO 2015. The next mega-project in Italy
In this section, after a brief introduction to the SHAMPU implementation in EXPO 2015, the focus will
move to the analysis of the number of visitors and its impact on the Project Balance (PB) computation the
actual assumptions. The last part is related to the “what-if analysis” for the development of the mitigation
plan for that case, and a general discussion of the results for the methodological conclusion of the
analysis.
Brief introduction
On March the 31st 2008 the Bureau of International Expositions (BIE) decided that the “Universal
Exposition 2015” would be held near Milan from May the 1st through October the 31
st 2015.
The theme will be “Feeding the planet, energy for life”, consequently the exhibition will be focused on
the various aspects connected to food and nutrition.
The site for the exposition is located in Rho – Pero in the north-west of Milan next to the “Fiera Milano”
the Milan large-scale exhibition centre. Years ago the site hosted industrial plants, nowadays it is partially
an agricultural area and partially hosts logistic services. The EXPO area (1.38 Km2) is divided into
Pavilions (accounting for 50% of the space), an external area (35%) and a green belt (15%) [SH 1].
8
The overall projects related to EXPO 2015 can be divided into two main categories [SH 2]:
Direct Projects: all the projects (mainly infrastructural) included in the budget defined in the application
phase by the Candidacy Committee. “EXPO 2015 SpA” is in charge of these projects. They are directly
related to the EXPO and financed with the EXPO´s funds. Such funds are necessary to finance the
structures within the exhibition site, the infrastructures for connection to the site and the hosting
structures.
These projects in the application are quoted as "essential" for the event (e.g. Halls, Village EXPO,
Auditorium, etc.). Direct investments amount to 4.12 billion euro, representing one quarter of total
forecasted budget (25.3%).
Indirect Projects: all the projects (mainly infrastructural) related to the EXPO, but not included in the
budget defined in the application phase by the Candidacy Committee. “EXPO 2015 SpA” is not in
charge of these projects, since each one has already its ownership. The implementation of these projects is
necessary beside the EXPO (they are infrastructural projects required for the development of the area). In
some cases the projects are already in the early phases. These projects were already planned and designed
before the candidature of Milan, financed with funds not allocated to the EXPO and not necessarily on the
exhibition area of the site (e.g. Bre.Be.Mi.), but in the north of Italy. These projects (listed as "related" in
the application documents) are useful and functional for the performance and the success of EXPO, but
not strictly necessary (e.g. Pedemontana, subway M4 and M5, road Rho-Monza, etc.). These indirect
investments amount to 12,2 billion, representing 74.7% of the total forecasted budget.
Overall, therefore, the investment is 16.3 billion euro.
3.2 Cash- flow analysis with the current assumptions
The purpose of this section is to focus on the cash flows in order to understand the sustainability of the
project, distinguishing between infrastructural investments and cost-operating revenues, and then deriving
the project balance.
On the basis of the previous paragraph the investments considered are those related to the direct project
only with the distinctions: National Public, Local Public and Private Investments.
All the available data presented in the bid dossier have been analyzed in order to understand the main
criticalities from the economic sustainability point of view and to identify the sources of potential risks for
the project [SH 3]. As can be noted in Table 4, since most of the revenue is generated by “ticket selling”
and the type of cost declared could be difficult to reduce, the analysis moved along the number of
forecasted visitors.
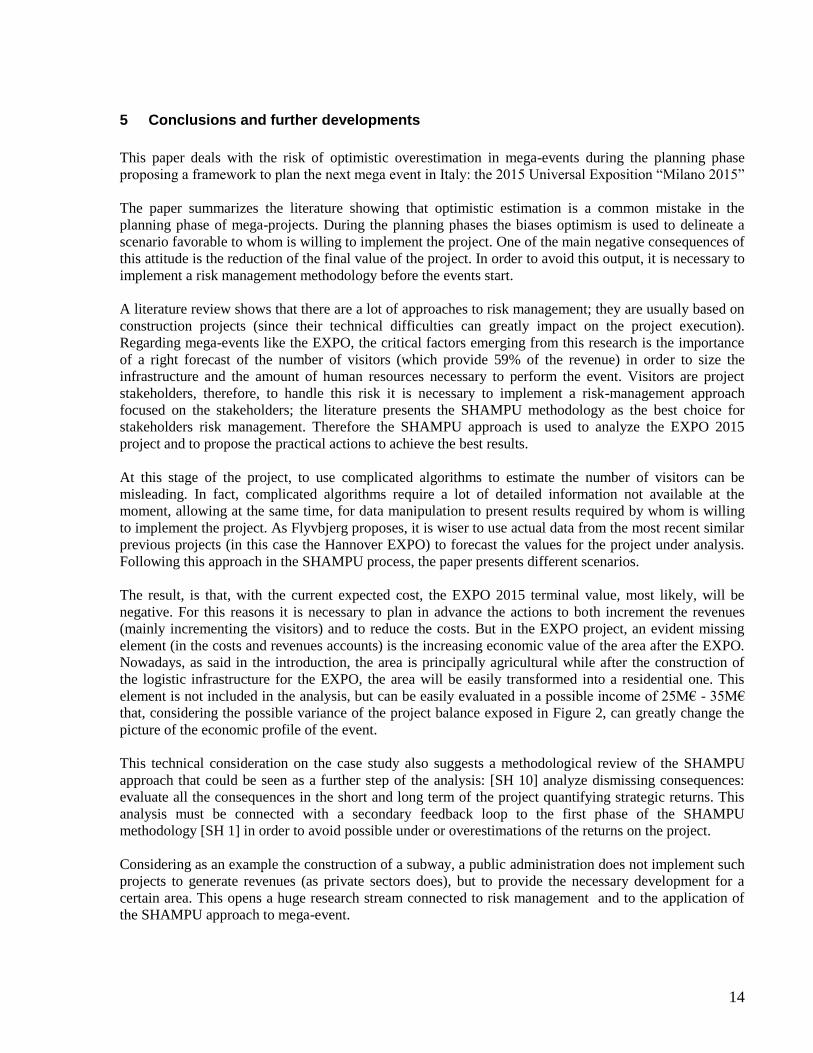
Figure 1 shows the Budget Cost Work Scheduled (BCWS) for the three main players from 2009 to 2015
identifying the window 2012-2014 as the most critical in terms of financial exposure. Until 2015 the
capital account revenue (equal to the expenditure) accounts for the most, since the operational
costs/revenues are negligible. In 2015 the ratio changes because the greater part of operative
costs/revenues occurs during the EXPO. In the period 2009-2014 the costs are slightly higher than the
income, whereas in 2015 it is the opposite. In the years 2009-2014 the cost are greater than the revenues,
however the sum of all the cash flows is equal to zero since in 2015 the revenues are greater than the
costs. A more meaningful evaluation is performed using the Project Balance. With this methodology the
final value is always negative, even with a small discount rate (-16,7 million of Euros with a discount rate
of 3%, -26,3 M€ with a discount rate of 5%, -59,8 M€ with a discount rate of 10%). This is the
consequence of having a negative cash flow for 6 years and a positive cash flow only in the last year.
INSERT FIGURE 1 HERE
9
3.3 The estimation for EXPO 2015
3.3.1 Why the estimation seems optimistic
The weakness of the EXPO 2015 financial plan emerged in the previous financial point risk analysis, is
clarified in Table 4, which shows that 60% of revenues comes from ticket sales. Since ticket sales depends
on the number of visits, it can be considered the key indicator of the success of this event (from now on
we consider a visitor that visits the site n times as n visitors), so a detailed analysis of the previous
EXPO’s with their own specific characteristics have been developed [SH 5].
From London in 1851 to Seattle in 1962 the number of people rose from 6 to 41 million, with the highest
value of 45 million to New York in 1939. In each past EXPO, the way data was used to determine the
forecasted future visitors was different. The main difficulties in this analysis have been the data screening,
not for the availability of the data, but for the continuously changing environmental conditions of the
EXPO on the basis of the localization of the exposition, the particular period of time, the logistic
infrastructure, the cultural progress and involvement of communities, and so on. Too many detailed
considerations can be taken into account in order to consider the previous edition, but in such a situation
of uncertainty the fewer the categories the data is broken down into, the more a systematic picture of the
project becomes useful.
In this case, the number of visitors has been obtained by identifying 3 different geographical areas:
Area 1: bounded by a maximum travelling time of about three hours by car or by train;
Area 2: day trips are short by plane, so the remaining Italian Regions and Europe as a whole are taken into
consideration, except for Russia;
Area 3: the rest of the world.
Each area has been developed with a different model, probably too detailed. In fact, if we look at the later
EXPO editions the number of visitors went decreasing, with actual values often far below the forecasts.
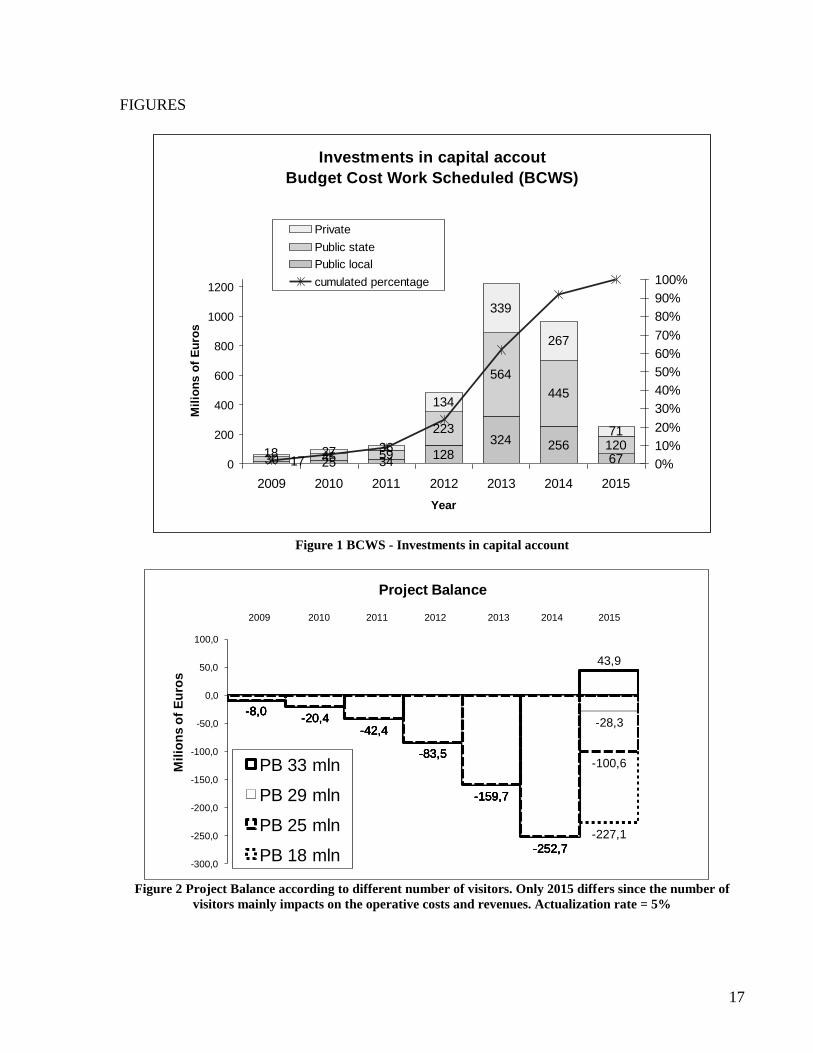
The analysis of the estimated visitors respect to the various EXPOs is synthesized in Table 1.
INSERT TABLE 1 HERE
There is often either a significant overestimation or underestimation of visitors. In particular for European
EXPO there is a significant overestimation, especially in the case of Hanover (-53%) and Lisbon (-33%,
even if this was a specialized and not an universal EXPO). On the opposite “Aichi EXPO 2005” obtained
a great success, with 22 million visitors expected against the 15 forecasted, with an underestimation of the
visitors (+46%).
The number of visitors expected in 2010 for Shanghai, 70 million, seems reasonable; in fact, in Shanghai
the potential domestic visitors are more than 400 million, and Continental (area Eastern Asia), over 1,5
billion. Therefore, considering the Aichi EXPO, it is reasonable to expect a greater number of visitors for
Asian EXPO respect to the European EXPO, even considering a different cultural approach to this type of
event. Data suggest that the significant difference in estimated visitors between the two Asiatic exhibitions
mainly depends on the size of the pool of potential domestic visitors. Domestic visitors in Shanghai are
four and a half times Aichi, while the pool of potential Continental visitors is approximately the same.
On the contrary, for the Milan Expo, the estimate of 29 million visitors seems to be optimistic for three
different reasons:
A: the report submitted to the BIE shows that the estimate of visitors was made by referring to two events:
the Seville EXPO in 1992 and the Winter Olympics in Torino in 2006. Both these references are
difficult to take into consideration since the 23 years elapsed between the Seville EXPO and Milan
EXPO seem too far apart (Mazzeo, 2008). Moreover, the Sevilla’92 Expo is an exception in terms of
visitors, having a record of 41.5 million visitors (this value is significantly different from previous and
following EXPO’s). Regarding Torino, even if the country is the same, the type of exhibition is too
different to compare their respective appeals. Torino in 2006 is more recent and closer to Milan,
however the Winter Olympics is an event with a much shorter duration and a completely different type
10
of attractiveness and potential visitors. Even if in another country, it would be better to consider the
more recent Expo's as Hanover in 2000 (with an actual value of 18 million of visitors respect to the 39
estimated).
B: overestimating is praxis. Many fewer visitors than expected attended the previous European exhibition,
in particular for Hannover but also for Lisbon. According to Montanari (Montanari, 2002) an EXPO is
no longer able to attract the attention of the European public (much consideration must be given to the
different cultural background respect to oriental people). The author gives the example of Hannover
mainly attended by inhabitants of the Land of Lower Saxony and ignored by other Germans. Mazzeo
(Mazzeo, 2008) correctly argues that in the last editions the number of visitors to the EXPOs declined
for two reasons: first, the saturation of the physical limits of capacity for this kind of events and,
second, the use of new communication technologies to connect people with events and products.
Participation was more important in the past since the physical contact was a key factor for the success
of a product; nowadays, media and multimedia tools allow for the knowledge of goods and products
without physical contact.
C: Milan EXPO has a number of potential domestic visitors (which account for the most) fewer than
Hannover. Nevertheless, the number of expected visitors is more than 50% greater than those recorded
in the German edition. This general view of the situation stresses the importance of the domestic
visitors and reinforces the focus on the high risk of overestimation.
3.3.2 Risk ownership clarification (SH 5)
The conclusions of the preceding paragraph support the analysis of the impact of a visitors overestimation
in order to breakdown the corresponding ownership and to structure an adequate mitigation plan to be
coordinated by the multiple stakeholders of the project. As previously said, focusing on the direct
investment the lower visitor numbers obviously impact on costs and on revenues of both the
infrastructural budget (accounting for 80% - 3,2 billion) and operational budget (accounting for 20% - 0,9
billion).
This breakdown reflects the organizational structure of EXPO 2015 SpA based on two different Business
Units (BU’s): one for the infrastructural projects and the other for the operational projects (services). For
this reason the detailed breakdown of these accounts seems to be very useful.
Infrastructural Budget
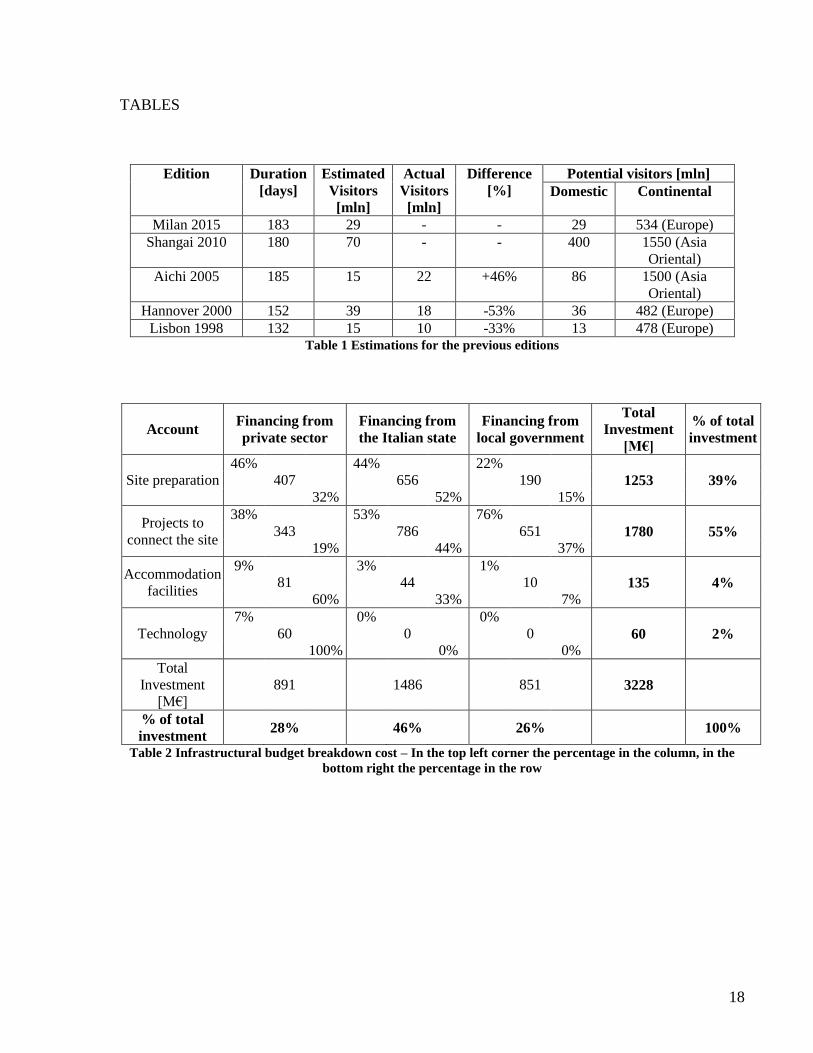
The analysis of the infrastructural budget results in the breakdown reported in Table 2, the in-flow and
out-flow of investment cash is evidenced.
INSERT TABLE 2 HERE
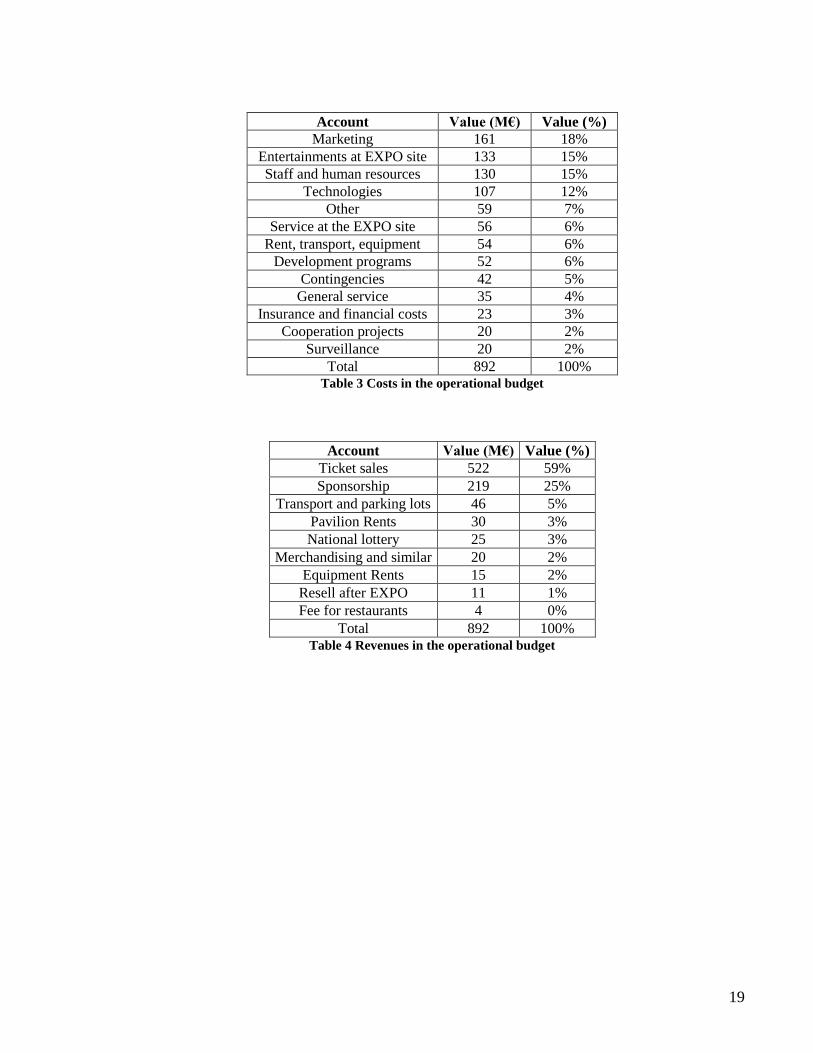
Operational budget
The operational budget includes the sponsorship of the event, promotions, ticket sales, rents etc.
According with the business plan in the bid dossier, the operating costs for the management and
organization are fully covered by operating revenues, therefore costs and revenues are equal to 892
million Euros.
The cost breakdown is summarized in Table 3, while the revenues breakdown is summarized in Table 4.
As regards revenues, it is evident that ticket sales will account for most. If fewer visitors attend the event,
the “EXPO 2015 SpA” Business Unit will have a strong impact on project profitability. Therefore this
Business Unit is the main owner of this risk and is in charge of setting up an appropriate risk management
process. Table 4 reinforces the assumption of the critical forecast for the number of visitors since it covers
60% of the revenues of the direct project. INSERT TABLE 3 and 4 HERE

11
4 Results of the overestimation: how to deal with it
4.1 Effect on the project Balance
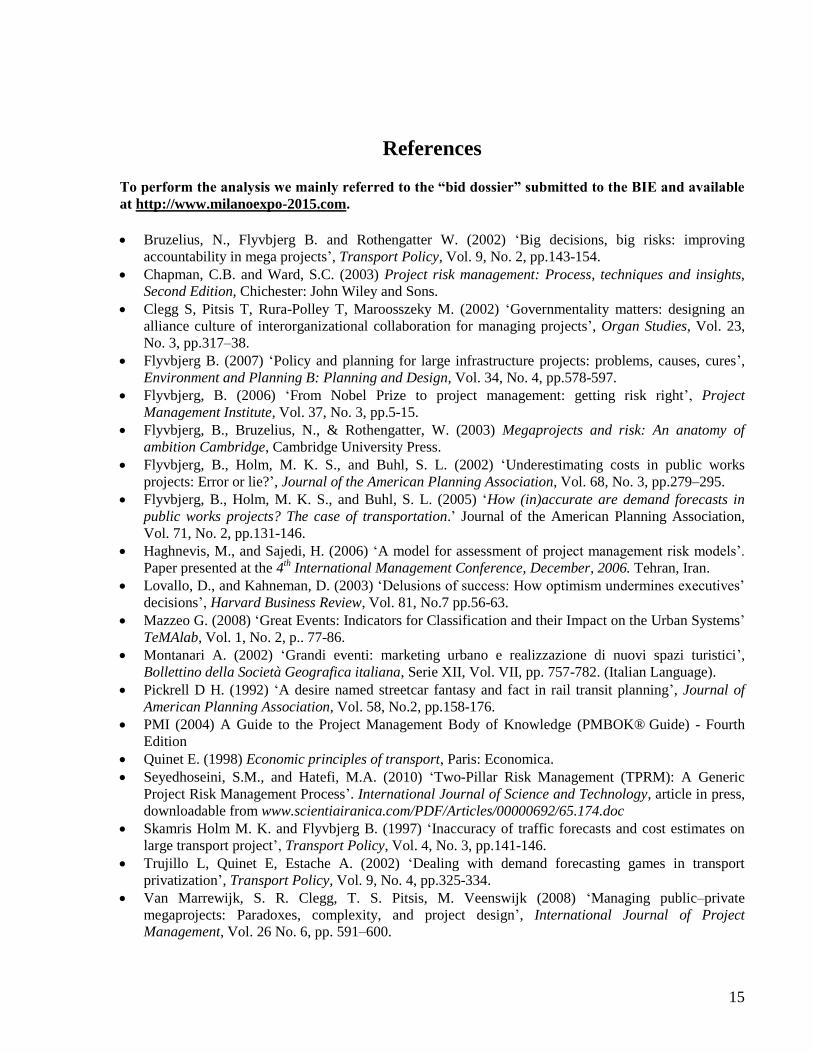
To estimate a reasonable variability (SH 6) a scenario analysis has been developed changing the number
of visitors and re-computing costs and revenues with related impact on Project Balance, identifying the
relation between the causes and the effects of this factor.
Certain values are independent from the number of visitors, (e.g. roads), others are proportional (linearly
or not) to the visitors (e.g. revenues from the tickets).
The following scenarios have been tested:
Very Pessimistic estimate: 18 million visitors (about 40% less than the bid estimate). This is the
number of visitors in Hanover in 2000, the last European EXPO.
Pessimistic estimate: 25 million visitors (about 15% less than the bid estimate). This estimate
considers the number of visitors of Aichi 2005, the last held in Japan attended by 22 million. In
the EXPO 2015 case, which will take place 10 years later, it is possible to assume a slight
increment.
Bid estimate: 29 million. Is the estimation provided in the bid dossier
Optimistic estimate: 33 million visitors (about 15% more than the bid estimate).
INSERT FIGURE 2 HERE
Figure 2 summarizes the ‘what if analysis’ (SH 7), showing the main effect exclusively on ticket sales,
thus in 2015, and that under those conditions the PB in 2015 will be, most likely, negative or close to zero.
Therefore planners have to come back to the project definition and variability estimation phases to tune
some assumptions and to prepare a mitigation plan following the guidelines suggested in the next
paragraphs.
4.2 Possible mitigation actions
Since the estimation of 29 million visitors for EXPO 2015, seems too optimistic, it is necessary to
implement mitigation actions to overcome or minimize the impact of some critical issues related to the
overestimation of the visitors, such as: budget deficit, waste of funds, over sizing of the infrastructures etc.
(SH 8).
It is possible to implement two strategies:
1- Costs reduction
2- Revenues increase
4.2.1 Costs reduction
The main actions to reduce costs are:
Reduce the investments in infrastructure (roads, railways, metro). In the EXPO this action is very hard
to apply to the main indirect projects (e.g. Bre.Be.Mi, TEM, Pedemontana) because they are necessary
even without the EXPO. Moreover, other projects (e.g. Metro 5) are already in the construction phase.
For direct projects (the halls, squares, logistic centres), it is not possible either to implement this action
because these structures are strictly necessary for the event and the decreasing costs start to be significant
only with a reduction of more than 50% of forecasted visitors, so without a real impact on the cost
accounts.
Build smaller secondary facilities. The actual plan is for 17,000 parking spaces, but if visitors are fewer
than expected car parks are over dimensioned. If, during the EXPO, the visitors are more than expected it
is possible to implement corrective actions involving public transport companies to integrate the service. It
should be noted, however, that the parking-lot is built entirely with private funding so that investors will
obviously participate in the future, so a reduction here does not generate savings in public resources.
12
Reduce the number of new hotels. According to Federalberghi (the Italian Hotels Association) the
number of existing hotels is already enough. Part of private investment in hotels may be shifted to cheaper
facilities such as hostels, university residences, etc., notoriously lacking in the area considered (around
Milan) and more easily reusable after 2015.
Reduce the labour cost i.e. the volunteers and staff. The goal is to have the smallest staff necessity.
Since the number of volunteers is related to numbers of visitors it is possible to decrease this number. In
order to avoid lack of staff it is possible to prepare agreements with employment agencies to hire staff
when necessary (as suggested by the “real options” approach). This solution was already adopted in the
case of EXPO 2000 in Hanover (Montanari, 2002). However in Hannover this measure was not planned,
therefore it did not generate significant savings. Another considered case was the last Olympic Games in
Beijing, where the number of volunteers exceeded the forecast, but since the reason was related to cultural
believes, the same algorithm cannot be applied to EXPO 2015.
4.2.2 Revenues increasing
The main way to increase the revenues is to increase the number of visitors and the sponsorships.
Focusing on the most important (increasing the number of visitors) there are three different types of
actions:
A. Advertising campaigns
B. Other Marketing actions
C. Project timing.
A. Advertising campaigns
Campaigns to promote the event can stimulate the participation of different types of visitors. These
promotional activities should be directed to:
Potential local visitors, representing usually 3/4 of total visitors
Companies, in particular those connected in some way to the theme of the exhibition. Through the
EXPO they could identify new business or market share, new products, technologies or find
inspiration for new business ideas.
Humanitarian organizations and institutions (UNICEF, FAO, EFSA, etc..). They could collect and
share information on food projects with economic and social institutions, universities, etc..
It is possible to implement advertising campaigns in many ways, including:
o Television spots with celebrities, as done for Hanover 2000, even if in that case the choice
was not very effective, because implemented too late, during the exhibition. In Milan,
however, by using the lesson learned from Hanover, it is possible to achieve better results.
o Set up an EXPO- Observatory to assess the knowledge of the potential visitors. Having
identified the deficiencies in terms of information flow, it can propose reactive actions.
Federalberghi notes that "visitors are different from tourists”, therefore, to increase the flow of visitors
many tourists should become visitors. Visitors have specific interests mainly related to business and often
make short visits. On the other hand, tourists have more cultural and artistic interests, so even if tourists
are not particularly interested in the EXPO, if properly elicited they can become visitors. EXPO should
become part of the classical “trip to Italy”. Therefore campaigns and promotional agreements with tourism
organizations should incentivize tourists to visit the EXPO.
Some actions could include:
the creation of centres of attraction at the EXPO (museums, tours, etc.) to attract visitors with interests
not purely economic. This could be achieved through agreements with museums, theatres, theme
parks etc.;
13
the creation of a network of events and strategic alliances between Milan and foreign cities
(Montanari, 2002) to incentivize foreign citizen to visit the EXPO. It is wise to use the existing
network and institutional arrangements;
agreements with schools and universities proposing tours at the EXPO;
agreements with tour operators, proposing tours of several days, based on the theme of food (e.g.
visiting firms and the EXPO).
B. Other Marketing actions
It is possible to implement special policies to sell the tickets, for example:
Creating agreements with airlines, railways, subways, to reduce the rates for direct visitors at the
EXPO, or creating combined tickets travel expo + entry;
Linking the purchasing of products from sponsors to the discounts on the EXPO tickets;
Changing from antagonism to symbiosis with other attractions (e.g. museums, festivals, fairs, theatres)
by creating combined tickets to attend various events.
Introducing discounted tickets for college students. The plan presented in Chapter 11 does not provide
for specific tickets for college students, who must pay the full rate. Only in Milan there are seven
universities with 250,000 Italian students and 8000 foreign students which could represent an
important market, especially in the process of Internationalization that most Milan Universities started
few years ago.
It would be hard to reduce the general price of the ticket, as was the case of the Hannover EXPO, when
the price dropped from 24 to 15 DM causing further losses instead of increasing the number of visitors
(Montanari, 2002).
C. Project timing
It is important to ensure that planned projects (highways, metro, etc.) are completed in time. The
completion of infrastructural projects would avoid negative messages from the media, both Italian and
foreign, as already happened in the case of the Jubilee in Rome in 2000.
Regarding the last phase of the SHAMPU approach (manage implications – SH 9) there is no detailed
approach in the official documentation, since a rolling wave approach in risk management is generally
declared during the project execution. But this consideration brings to interesting discussions, both from
the real case study and the methodological point of view, that will be exposed in the next paragraph.
14
5 Conclusions and further developments
This paper deals with the risk of optimistic overestimation in mega-events during the planning phase
proposing a framework to plan the next mega event in Italy: the 2015 Universal Exposition “Milano 2015”
The paper summarizes the literature showing that optimistic estimation is a common mistake in the
planning phase of mega-projects. During the planning phases the biases optimism is used to delineate a
scenario favorable to whom is willing to implement the project. One of the main negative consequences of
this attitude is the reduction of the final value of the project. In order to avoid this output, it is necessary to
implement a risk management methodology before the events start.
A literature review shows that there are a lot of approaches to risk management; they are usually based on
construction projects (since their technical difficulties can greatly impact on the project execution).
Regarding mega-events like the EXPO, the critical factors emerging from this research is the importance
of a right forecast of the number of visitors (which provide 59% of the revenue) in order to size the
infrastructure and the amount of human resources necessary to perform the event. Visitors are project
stakeholders, therefore, to handle this risk it is necessary to implement a risk-management approach
focused on the stakeholders; the literature presents the SHAMPU methodology as the best choice for
stakeholders risk management. Therefore the SHAMPU approach is used to analyze the EXPO 2015
project and to propose the practical actions to achieve the best results.
At this stage of the project, to use complicated algorithms to estimate the number of visitors can be
misleading. In fact, complicated algorithms require a lot of detailed information not available at the
moment, allowing at the same time, for data manipulation to present results required by whom is willing
to implement the project. As Flyvbjerg proposes, it is wiser to use actual data from the most recent similar
previous projects (in this case the Hannover EXPO) to forecast the values for the project under analysis.
Following this approach in the SHAMPU process, the paper presents different scenarios.
The result, is that, with the current expected cost, the EXPO 2015 terminal value, most likely, will be
negative. For this reasons it is necessary to plan in advance the actions to both increment the revenues
(mainly incrementing the visitors) and to reduce the costs. But in the EXPO project, an evident missing
element (in the costs and revenues accounts) is the increasing economic value of the area after the EXPO.
Nowadays, as said in the introduction, the area is principally agricultural while after the construction of
the logistic infrastructure for the EXPO, the area will be easily transformed into a residential one. This
element is not included in the analysis, but can be easily evaluated in a possible income of 25M€ - 35M€
that, considering the possible variance of the project balance exposed in Figure 2, can greatly change the
picture of the economic profile of the event.
This technical consideration on the case study also suggests a methodological review of the SHAMPU
approach that could be seen as a further step of the analysis: [SH 10] analyze dismissing consequences:
evaluate all the consequences in the short and long term of the project quantifying strategic returns. This
analysis must be connected with a secondary feedback loop to the first phase of the SHAMPU
methodology [SH 1] in order to avoid possible under or overestimations of the returns on the project.
Considering as an example the construction of a subway, a public administration does not implement such
projects to generate revenues (as private sectors does), but to provide the necessary development for a
certain area. This opens a huge research stream connected to risk management and to the application of
the SHAMPU approach to mega-event.
15
References To perform the analysis we mainly referred to the “bid dossier” submitted to the BIE and available
at http://www.milanoexpo-2015.com.
Bruzelius, N., Flyvbjerg B. and Rothengatter W. (2002) ‘Big decisions, big risks: improving
accountability in mega projects’, Transport Policy, Vol. 9, No. 2, pp.143-154.
Chapman, C.B. and Ward, S.C. (2003) Project risk management: Process, techniques and insights,
Second Edition, Chichester: John Wiley and Sons.
Clegg S, Pitsis T, Rura-Polley T, Maroosszeky M. (2002) ‘Governmentality matters: designing an
alliance culture of interorganizational collaboration for managing projects’, Organ Studies, Vol. 23,
No. 3, pp.317–38.
Flyvbjerg B. (2007) ‘Policy and planning for large infrastructure projects: problems, causes, cures’,
Environment and Planning B: Planning and Design, Vol. 34, No. 4, pp.578-597.
Flyvbjerg, B. (2006) ‘From Nobel Prize to project management: getting risk right’, Project
Management Institute, Vol. 37, No. 3, pp.5-15.
Flyvbjerg, B., Bruzelius, N., & Rothengatter, W. (2003) Megaprojects and risk: An anatomy of
ambition Cambridge, Cambridge University Press.
Flyvbjerg, B., Holm, M. K. S., and Buhl, S. L. (2002) ‘Underestimating costs in public works
projects: Error or lie?’, Journal of the American Planning Association, Vol. 68, No. 3, pp.279–295.
Flyvbjerg, B., Holm, M. K. S., and Buhl, S. L. (2005) ‘How (in)accurate are demand forecasts in
public works projects? The case of transportation.’ Journal of the American Planning Association,
Vol. 71, No. 2, pp.131-146.
Haghnevis, M., and Sajedi, H. (2006) ‘A model for assessment of project management risk models’.
Paper presented at the 4th International Management Conference, December, 2006. Tehran, Iran.
Lovallo, D., and Kahneman, D. (2003) ‘Delusions of success: How optimism undermines executives’
decisions’, Harvard Business Review, Vol. 81, No.7 pp.56-63.
Mazzeo G. (2008) ‘Great Events: Indicators for Classification and their Impact on the Urban Systems’
TeMAlab, Vol. 1, No. 2, p.. 77-86.
Montanari A. (2002) ‘Grandi eventi: marketing urbano e realizzazione di nuovi spazi turistici’,
Bollettino della Società Geografica italiana, Serie XII, Vol. VII, pp. 757-782. (Italian Language).
Pickrell D H. (1992) ‘A desire named streetcar fantasy and fact in rail transit planning’, Journal of
American Planning Association, Vol. 58, No.2, pp.158-176.
PMI (2004) A Guide to the Project Management Body of Knowledge (PMBOK® Guide) - Fourth
Edition
Quinet E. (1998) Economic principles of transport, Paris: Economica.
Seyedhoseini, S.M., and Hatefi, M.A. (2010) ‘Two-Pillar Risk Management (TPRM): A Generic
Project Risk Management Process’. International Journal of Science and Technology, article in press,
downloadable from www.scientiairanica.com/PDF/Articles/00000692/65.174.doc
Skamris Holm M. K. and Flyvbjerg B. (1997) ‘Inaccuracy of traffic forecasts and cost estimates on
large transport project’, Transport Policy, Vol. 4, No. 3, pp.141-146.
Trujillo L, Quinet E, Estache A. (2002) ‘Dealing with demand forecasting games in transport
privatization’, Transport Policy, Vol. 9, No. 4, pp.325-334.
Van Marrewijk, S. R. Clegg, T. S. Pitsis, M. Veenswijk (2008) ‘Managing public–private
megaprojects: Paradoxes, complexity, and project design’, International Journal of Project
Management, Vol. 26 No. 6, pp. 591–600.

16
Wachs M. (1990) Ethics and advocacy in forecasting for public policy, Business and Professional
Ethics Journal 9 141-157.
Ward, S.; Chapman, C. (2008) ‘Stakeholders and uncertainty management in projects’, Construction
Management and Economics, Vol. 26, No. 6, 2008 , pp. 563-577.
Warrack, A.A. (1985) Resource megaproject analysis and decision making Victoria, BC: Institute for
Research on Public Policy.
Warrack, A.A. (1993) Megaproject decision making: Lesson and Strategies, Western Resources
Program Number 16, University of Alberta Faculty of Business Edmonton, Alberta.
17
FIGURES
Investments in capital accout
Budget Cost Work Scheduled (BCWS)
25 34128
324 2566745 59
223
564
445
12027 36
134
339
267
71
173018
0
200
400
600
800
1000
1200
2009 2010 2011 2012 2013 2014 2015
Year
Mil
ion
s o
f E
uro
s
0%
10%
20%
30%
40%
50%
60%
70%
80%
90%
100%
Private
Public state
Public local
cumulated percentage
Figure 1 BCWS - Investments in capital account
-8,0-20,4
-42,4
-83,5
-159,7
-252,7
43,9
-8,0-20,4
-42,4
-83,5
-159,7
-252,7
-28,3-8,0
-20,4-42,4
-83,5
-159,7
-252,7
-100,6
-8,0-20,4
-42,4
-83,5
-159,7
-252,7
-227,1
-300,0
-250,0
-200,0
-150,0
-100,0
-50,0
0,0
50,0
100,0
Mil
ion
s o
f E
uro
s
Project Balance
PB 33 mln
PB 29 mln
PB 25 mln
PB 18 mln
2009 2010 2011 2012 2013 2014 2015
Figure 2 Project Balance according to different number of visitors. Only 2015 differs since the number of
visitors mainly impacts on the operative costs and revenues. Actualization rate = 5%
18
TABLES
Edition Duration
[days]
Estimated
Visitors
[mln]
Actual
Visitors
[mln]
Difference
[%]
Potential visitors [mln]
Domestic Continental
Milan 2015 183 29 - - 29 534 (Europe)
Shangai 2010 180 70 - - 400 1550 (Asia
Oriental)
Aichi 2005 185 15 22 +46% 86 1500 (Asia
Oriental)
Hannover 2000 152 39 18 -53% 36 482 (Europe)
Lisbon 1998 132 15 10 -33% 13 478 (Europe) Table 1 Estimations for the previous editions
Account Financing from
private sector
Financing from
the Italian state
Financing from
local government
Total
Investment
[M€]
% of total
investment
Site preparation
46%
44%
22%
407
656
190
1253 39%
32%
52%
15%
Projects to
connect the site
38%
53%
76%
343
786
651
1780 55%
19%
44%
37%
Accommodation
facilities
9%
3%
1%
81
44
10
135 4%
60%
33%
7%
Technology
7%
0%
0%
60
0
0
60 2%
100%
0%
0%
Total
Investment
[M€]
891
1486
851
3228
% of total
investment 28%
46%
26%
100%
Table 2 Infrastructural budget breakdown cost – In the top left corner the percentage in the column, in the
bottom right the percentage in the row
19
Account Value (M€) Value (%)
Marketing 161 18%
Entertainments at EXPO site 133 15%
Staff and human resources 130 15%
Technologies 107 12%
Other 59 7%
Service at the EXPO site 56 6%
Rent, transport, equipment 54 6%
Development programs 52 6%
Contingencies 42 5%
General service 35 4%
Insurance and financial costs 23 3%
Cooperation projects 20 2%
Surveillance 20 2%
Total 892 100% Table 3 Costs in the operational budget
Account Value (M€) Value (%)
Ticket sales 522 59%
Sponsorship 219 25%
Transport and parking lots 46 5%
Pavilion Rents 30 3%
National lottery 25 3%
Merchandising and similar 20 2%
Equipment Rents 15 2%
Resell after EXPO 11 1%
Fee for restaurants 4 0%
Total 892 100% Table 4 Revenues in the operational budget