Risk Management Guide - Office of Science
44
AVAILABLE ONLINE AT: INITIATED BY: www.directives.doe.gov Office of Management DOE G 413.3-7 9-16-08 Risk Management Guide [This Guide describes suggested nonmandatory approaches for meeting requirements. Guides are not requirements documents and are not to be construed as requirements in any audit or appraisal for compliance with the parent Policy, Order, Notice, or Manual.] U.S. Department of Energy Washington, D.C. 20585 NOT MEASUREMENT SENSITIVE
Transcript of Risk Management Guide - Office of Science
AVAILABLE ONLINE AT: INITIATED BY: www.directives.doe.gov Office of Management
DOE G 413.3-7 9-16-08
Risk Management Guide
[This Guide describes suggested nonmandatory approaches for meeting requirements. Guides are not requirements documents and are not to be construed as requirements in any audit or appraisal for compliance with the parent Policy, Order, Notice, or Manual.]
U.S. Department of Energy Washington, D.C. 20585
NOT
MEASUREMENTSENSITIVE

DOE G 413.3-7 i 9-16-08
FOREWORD
This Department of Energy Guide is for use by all DOE elements. This Guide intends to provide non-mandatory approaches for implementing the requirements of DOE O 413.3A, Program and Project Management for the Acquisition of Capital Assets, dated 7-28-06. Guides are not requirement documents and should not be construed as requirements. DOE Guides are part of the DOE Directives System and provide suggested ways of implementing Orders, Manuals, and other regulatory documents.


DOE G 413.3-7 iii 9-16-08
TABLE OF CONTENTS
1.0 PURPOSE .................................................................................................................................1 2.0 SCOPE ......................................................................................................................................2 3.0 RISK MANAGEMENT ORGANIZATIONAL STRUCTURE, CONCEPT, AND
RESPONSIBILITIES ...............................................................................................................3 3.1 Risk Management Organizational Structure ................................................................... 3 3.2 Risk Management Organizational Concept .................................................................... 3 3.3 Risk Management Organizational Responsibilities ........................................................ 5
3.3.1 Federal Project Director .............................................................................................. 5 3.3.2 Integrated Project Team .............................................................................................. 5 3.3.3 Contractor Project Manager ........................................................................................ 6 3.3.4 DOE/National Nuclear Security Administration Headquarters .................................. 6
4.0 RISK MANAGEMENT PROCESS WITHIN THE PROJECT LIFE CYCLE .......................7 4.1 Project Phase Integration ................................................................................................ 7 4.2 Risk Planning .................................................................................................................. 8 4.3 Risk Assessment ............................................................................................................. 9
4.3.1 Risk Identification ....................................................................................................... 9 4.3.2 Assignment of the Risk Owner ................................................................................. 12 4.3.3 Assignment of Probability and Consequence ........................................................... 13 4.3.4 Assignment of Risk Trigger Metrics......................................................................... 13 4.3.5 Risk Register ............................................................................................................. 13 4.3.6 Risk Analysis ............................................................................................................ 14
4.3.6.1 Qualitative Risk Analysis ................................................................................. 15 4.3.6.2 Quantitative Risk Analysis ............................................................................... 20 4.3.6.3 Project Learning Analysis ................................................................................. 24 4.3.6.4 Error and Variance Analysis ............................................................................. 24 4.3.6.5 Contingency Adequacy Evaluation ................................................................... 25
4.4 Risk Handling ............................................................................................................... 26 4.4.1 Acceptance ................................................................................................................ 28 4.4.2 Avoidance/Exploit .................................................................................................... 28 4.4.3 Mitigation/Enhance ................................................................................................... 29 4.4.4 Transfer/Share ........................................................................................................... 29
4.5 Residual Risk ................................................................................................................ 30 4.6 Secondary Risk ............................................................................................................. 30 4.7 Risk Monitoring ............................................................................................................ 31
4.7.1 Risk Monitoring Process Considerations .................................................................. 31 4.7.2 Risk Monitoring Methods ......................................................................................... 32
4.7.2.1 Risk Owner Monitoring .................................................................................... 32 4.7.2.2 Self Assessment ................................................................................................ 32 4.7.2.3 Integrated Risk Monitoring ............................................................................... 32
4.8 Risk Reporting .............................................................................................................. 34 4.9 Risk Feedback ............................................................................................................... 36
5.0 RISK DOCUMENTATION AND COMMUNICATION ......................................................38 5.1 Project Execution Plan .................................................................................................. 38
5.1.1 Baseline Management ............................................................................................... 38

iv DOE G 413.3-7 9-16-08
5.1.2 Phase Integration ....................................................................................................... 38 5.1.3 Acquisition Strategy .................................................................................................. 38
5.2 Risk Management Plan ................................................................................................. 39 5.3 Risk Management Communication Plan ...................................................................... 40
6.0 TAILORING OF RISK MANAGEMENT .............................................................................43 7.0 ATTACHMENTS ...................................................................................................................44 Attachment 1: Risk Breakdown Structure—Example One ...........................................................45 Attachment 1: Risk Breakdown Structure—Example Two ...........................................................46 Attachment 2: Risk Status Report ..................................................................................................47 Attachment 3: Risk Responsibility Assignment Matrix ................................................................48 Attachment 4: Probability Scale/Schedule Consequence Criteria .................................................49 Attachment 5: Risk Register ..........................................................................................................50 Attachment 6: Cost/Benefit Analysis .............................................................................................52 Attachment 7: Opportunity Matrix ................................................................................................53 Attachment 8: Risk Identification Checklist ..................................................................................54 Attachment 9: Risk Monitoring Checklist .....................................................................................58 Attachment 10: Risk Management Reserve Report or Contingency Use Report ..........................59 Attachment 11: Glossary................................................................................................................60
List of Appendices
APPENDIX A: REFERENCES .................................................................................................. A-1
Table of Figures
Figure 1. Critical Decision Phases with Continuous and Iterative Risk Management ....................7
Figure 2. Risk Management Process. Linear Representation of the Continuous and Iterative Process .............................................................................................................................8
Figure 3. Qualitative Risk Analysis Matrix for the Federal Project Director ................................17
Figure 4. Qualitative Risk Analysis Matrix for the Contractor Project Manager ..........................18
DOE G 413.3-7 1 9-16-08
1.0 PURPOSE
The purpose of this guide is to describe an effective risk management process that should lead to successful project execution. The continuous and iterative process includes updating project risk documents and the risk management plan and emphasizes implementation communication of the risks and actions taken.
This guidance document provides a framework for identifying and managing key technical, schedule, and cost risks through applying the requirements of DOE O 413.3A. The Order states that risk management is an essential element of every project.
Risk management for this purpose is the handling of risks through specific methods and techniques within the bounds of project management. The operable definition of risk for this guide is a factor, element, constraint, or course of action that introduces an uncertainty of outcome that could impact project objectives. The risks to be handled are comprised of threats and opportunities. Threats are risks with negative consequences, and opportunities are risks with positive benefits.
The risk management process set forth in this guidance demonstrates a continuous and iterative process. This framework meets the requirements of the Order to be forward looking, structured, and informative. Further, the process addresses within the terms of technical risks the technical uncertainties required by the Order. The issue of the establishment of design margins to address the uncertainties or unknowns associated with the design is addressed in greater detail in the Guide handling issues of design and construction; however, the nature of the risk and its uncertainty arising from directed assessments associated with designs are addressed by this Guide as are the necessities of increased technical oversight requirements. Further, this risk management process has been developed to meet the overall monitoring and reporting requirements, and to allow one to continue to monitor those technical uncertainties.
2 DOE G 413.3-7 9-16-08
2.0 SCOPE
This guide may be used by all Department of Energy (DOE) offices and the National Nuclear Security Administration (NNSA), their respective field operations, operations’ contractors, and subcontractors as specified in their respective contracts.
This guide addresses the overall processes for the initiation, planning, executing, monitoring, and close out of the risk management throughout the life cycle of the programs and projects. The concepts and practices described are considered to be beneficial to all types of projects and as such the concepts and practices should be applied to those projects with tailoring based upon the project complexity, the size and duration of the project; the initial overall risk determination of the project; the organizational risk procedures; the available personnel and their skills levels for performing risk management; and, available relevant data and its validation.
The final determination for tailoring the level of risk management rests with the Federal Project Director (FPD) or the Contractor Project Manager (CPM) as described in the project execution plan as signed by the acquisition executive or the contractor project management plan, respectively.
This guidance and advice is intended to meet, but is not limited to, the following objectives:
• Identify the risk management processes.
• Identify the steps necessary to facilitate the implementation of those processes.
• Provide life-cycle risk management guidance.
• Provide risk management documentation guidance.
• Provide risk management monitoring and reporting guidance.
This guide is not intended to replace assessment processes developed for nuclear safety and environmental, safety, health, and quality (ESH&Q). It is also not intended to replace assessment processes developed for safeguards and security. This guidance also recognizes the benefit and necessity of early consideration and integration of safety related project risk into the project risk management process.
DOE G 413.3-7 3 9-16-08
Methodology
3.0 RISK MANAGEMENT ORGANIZATIONAL STRUCTURE, CONCEPT, AND RESPONSIBILITIES
3.1 Risk Management Organizational Structure
The formal organizational breakdown structure for risk management, the same as for the Project Execution Plan or Project Management Plan, is established by the official organizational breakdown structures or organizational charts issued by the program office. Whenever the risk management plan is updated, the organizational breakdown structure, contained therein, should be updated as well, if changes have been made to those structures.
The organizational breakdown structure serves three purposes in risk management. These purposes, as well as illustrations for each purpose, are shown as follows:
• Highlights the structure for the management framework with which risk management and the decision processes will occur.
- Assists with identifying organizational risks.
- Assists with identifying where certain risk management decision ownership and decision processes reside.
• Illustrates the chain of authority and communication for risk management decision processes.
- Reduces time for critical risk communication.
- Allows for documentation of risk communication chain.
• Provides a means to map risks organizationally to determine where organizationally the greatest number of risks resides and/or the risks with the highest qualitative value reside.
- Can provide a format for the development of a Risk Breakdown Structure (see Attachment 1, Risk Breakdown Structure).
- Provides a means of identifying risk owners.
3.2 Risk Management Organizational Concept
Programs and projects are of varied types, often long term, and of differing complexity. The risks may span multiple levels of organizational management, crosscut multiple organizations, and/or crosscut different sites within the complex. For risk management to be effective, it should be an integral part of the organization’s corporate enterprises-governance (e.g., standards, procedures, directives, policies, and other management documentation).
4 DOE G 413.3-7 9-16-08
In order to implement the risk management principles1 and processes successfully, an organizational process perspective should be considered within which the risk management processes could operate. The processes and procedures, along with applicable tools to be used for performing risk management functions should be carefully considered, established, and well defined when implemented. The risk management processes described later in this guide should be carefully tailored to involve and meet the needs of the organization’s internal planning, assessment, project controls, risk monitoring, reporting, and decision-making processes at the different levels of risk management.
A clearly defined integrated risk management framework should consider the structure and interactions of the management organization(s) and management levels. These should be charted or mapped out and institutionalized (process-wise), so that they can be well understood within each organization(s), in order to help:
• Align the organization(s) to accomplish the mission, in concert with the established requirements, policies, strategic plans, roles and responsibilities aligned via clearly defined and well-understood processes and procedures. This alignment should be done in order to meet the goals and objectives of the Department at all levels of the organization(s) supported by risk management-based decision making knowledge.
• Increase the interaction and communication between upper management and functional contributors, and to better understand all types of project risks, such as: political, economic, social, and technological, policy, program, project, financial, resource-based, health and safety, safeguards and security, and operational. Without this interaction, identification of risks and the communication and handling of risks cannot be adequately accomplished, or be well understood.
• Apply a consistent integrated systematic risk management process approach at all levels of risk management to support decision-making and encourage better understanding and application of the risk management process. For example, the same risk can exist in different organizational levels such as the contractor, the site DOE Offices, and Program Headquarters (HQ) Offices. This risk will be shared by all of the organizations but from different perspectives. These risks can crosscut and affect capital, cleanup, information technology, or operating projects, etc.
• Build a cultural environment that fosters risk management related learning, innovation, due diligence, responsible leadership, management participation and involvement, lessons learned, continuous improvement, and successive knowledge transfer.
The risk management framework should be completely integrated into the procedures and processes of the organization. The risk management processes and procedures should be
1 OMB M-07-24, Memorandum for the Heads of Executive Departments and Agencies, “Updated Principles for
Risk Analysis,” September 19, 2007. (Text cited only for the universal risk management principles and not the context they are presented within the memo.)

DOE G 413.3-7 5 9-16-08
supported by management through self-assessments, lessons learned, and a continuous improvement environment.
3.3 Risk Management Organizational Responsibilities
The key roles, roles which have a deterministic impact upon the risk management of the project, and responsibilities are the highest level of project risk authority and responsibility. A complete responsibility assignment matrix for risk management roles and responsibilities should be included in the risk management plan.
3.3.1 Federal Project Director
Throughout the project life cycle, the FPD, in order to manage risks regarding government supplied materials and information as well as federally-owned project risks and those mission related risks that must be managed at the site location, should:
• Apply a continuous, iterative risk management process.
• Document and manage risks.
• Develop, maintain, and provide required risk documentation, and reporting to appropriate project and program management personnel. This includes providing configuration management for this documentation.
• Ensure a tailored approach to risk management.
• Inform the Acquisition Executive and the sponsoring program office of all major risks as soon as they are recognized.
• Formally accept or reject any risks that are proposed to be transferred from the contractor to the federal government (DOE or NNSA).
• Verify acceptance and closure of key program/project risks.
3.3.2 Integrated Project Team
Throughout the project life cycle, the Integrated Project Team (IPT), in support of the FPD, should:
• Apply the continuous risk management process.
• Document and manage the risk management process contained within the risk management plan and the risk management communication plan (see Section 5.3, Risk Management Communication Plan).

6 DOE G 413.3-7 9-16-08
• Provide documentation and management of risks throughout the program/project life cycle via the program/project risk register (see Section 4.3.5, Risk Register, and Attachment 1, Risk Breakdown Structure).
• Develop and provide the program/project risk status report (see Attachment 2, Risk Status Report) to management.
• Concur through consensus as to the key program/project identified risks for the project life cycle.
3.3.3 Contractor Project Manager
The risk management responsibilities of the CPM, unless otherwise directed by the contract terms and conditions as they bound the project life cycle, should be to:
• Apply a continuous, iterative risk management process.
• Document and manage risks.
• Develop, maintain, and provide required risk documentation and reporting and configuration management to appropriate project and program management personnel. This includes providing configuration management for this documentation.
• Ensure a tailored approach to risk management.
• Verify acceptance and closure of key program/project risks.
3.3.4 DOE/National Nuclear Security Administration Headquarters
Headquarters program office personnel should:
• Provide guidance on the risk management process.
• Provide support to site office programs in the evaluation, analysis, assessment, and reporting of risk.
• Provide support to site office programs for training and education in risk management.
• Facilitate information sharing on risk management best practices, trends, and publications.
• Interface with the FPD and IPT for risk.

DOE G 413.3-7 7 9-16-08
4.0 RISK MANAGEMENT PROCESS WITHIN THE PROJECT LIFE CYCLE
4.1 Project Phase Integration
This risk management guide is integrated with DOE O 413.3A, but it also suggests process steps beyond those stated in DOE O 413.3A in some specific instances, such as the Risk Register. The risk management process as integrated with DOE O 413.3A is a continuous, iterative process that is performed throughout the project life cycle from initiation through project closeout.
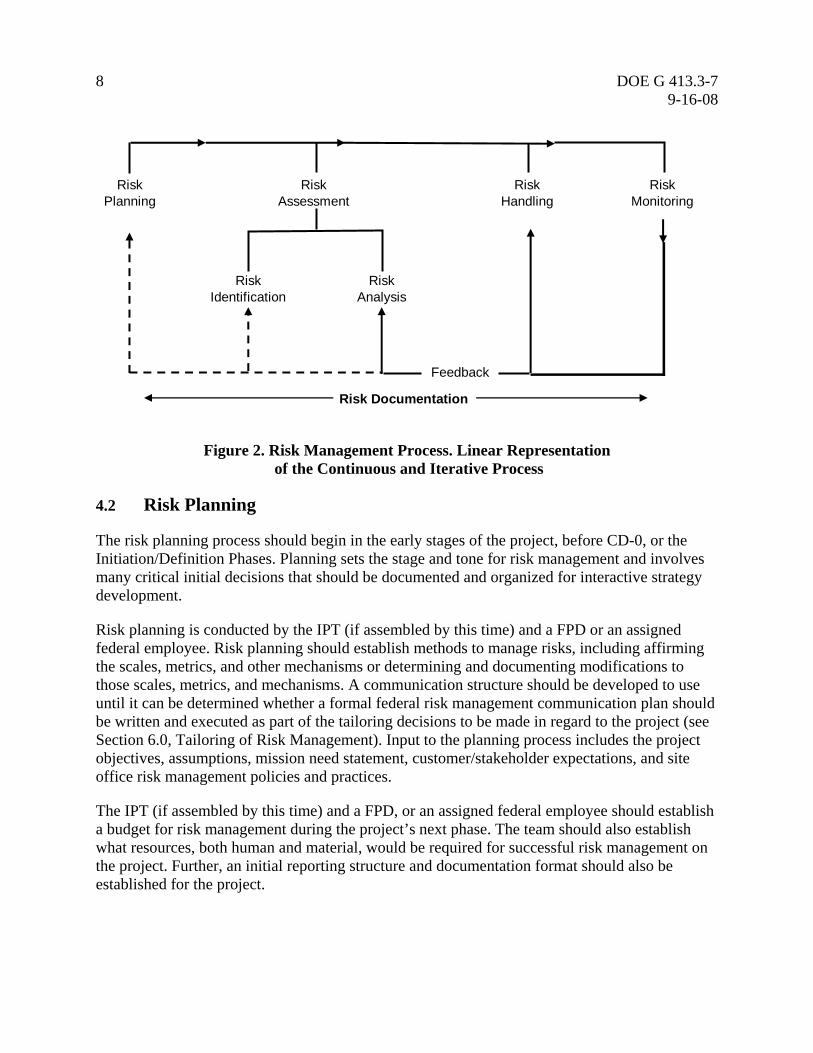
Wherever possible, the project phases in DOE O 413.3A should be aligned with the risk management process to allow an integrated view (Figure 1). Figure 1 provides a view of the steps of the risk management process against the Critical Decision Phases of a project. While this view presents a static view of risk management, it is not meant to infer that the process is static. Instead it is meant to demonstrate when one should initiate for the first time certain process steps.
The risk management plan should be included in or referenced in the preliminary project execution plan during CD-1 (see Section 5.2, Risk Management Plan).
Figure 1. Critical Decision Phases with Continuous and Iterative Risk Management
While the process flow appears linear, the process itself is iterative and not necessarily consecutive. The risk-planning step, for example, is continuous throughout the project life cycle, as is the need for risk communication and documentation. The pattern that is represented by the linear process diagram (Figure 2) demonstrates that certain steps generally precede others; however, as the project proceeds, the review processes do not necessarily progress in the same manner.
Initiation Definition Transition/Closeout
Execution
CD-0Approve Mission
Need
CD-1Approve
Requirements& Alternative
Selectionand Cost Range
CD-2Performance
Baseline
CD-3Approve Start of
Construction/Authorizationto Complete
Implementation
CD-4Approve Start of
Operation orProject/Transition
Completion
CloseoutLessons Learned
Risk Management Documentation
Risk Communications
Risk Planning
Quantitative Analysis Process
8 DOE G 413.3-7 9-16-08
Feedback
RiskPlanning
RiskAssessment
RiskHandling
RiskMonitoring
RiskIdentification
RiskAnalysis
Risk Documentation
Figure 2. Risk Management Process. Linear Representation of the Continuous and Iterative Process
4.2 Risk Planning
The risk planning process should begin in the early stages of the project, before CD-0, or the Initiation/Definition Phases. Planning sets the stage and tone for risk management and involves many critical initial decisions that should be documented and organized for interactive strategy development.
Risk planning is conducted by the IPT (if assembled by this time) and a FPD or an assigned federal employee. Risk planning should establish methods to manage risks, including affirming the scales, metrics, and other mechanisms or determining and documenting modifications to those scales, metrics, and mechanisms. A communication structure should be developed to use until it can be determined whether a formal federal risk management communication plan should be written and executed as part of the tailoring decisions to be made in regard to the project (see Section 6.0, Tailoring of Risk Management). Input to the planning process includes the project objectives, assumptions, mission need statement, customer/stakeholder expectations, and site office risk management policies and practices.
The IPT (if assembled by this time) and a FPD, or an assigned federal employee should establish a budget for risk management during the project’s next phase. The team should also establish what resources, both human and material, would be required for successful risk management on the project. Further, an initial reporting structure and documentation format should also be established for the project.

DOE G 413.3-7 9 9-16-08
Overall objectives for risk planning are:
• Establish the overall risk nature of the project including recognizing the relative importance of the project to the office with the DOE or the NNSA (to include its priority ranking within the organization).
• Establish the overall experience and project knowledge of the IPT.
• Establish the technical background and risk knowledge of the IPT.
• Establish the overall level of project risk.
An initial responsibility assignment matrix with roles and responsibilities for various risk management tasks should be developed (see Attachment 3, Risk Responsibility Assignment Matrix). Through this Responsibility Assignment Matrix, gaps in expertise should be identified and plans to acquire that expertise should be developed.
The result of the risk planning process is the risk management plan (see Section 5.2, Risk Management Plan). This risk management plan is the roadmap that tells the government or contractor team how to proceed in risk management from where the project is conceptually to where the project is predicted to be in the future based upon initial risk management project planning documentation.
4.3 Risk Assessment
Risk assessment includes the overall processes of risk identification and analysis. The risk assessment process provides the IPT the definition of risk for the project by identifying, analyzing, and quantifying potential program and project risks in terms of probability and consequences. Risk analysis is a technical and systematic process that is designed to examine risks, identify assumptions regarding those risks, identify potential causes for those risks, and determine any relationships to other identified risks, as well as stating the overall risk factor in terms of the probability and consequence, if the risk should occur. Risk identification and analysis are performed sequentially with identification being the first step (see Attachment 5, Risk Register).
4.3.1 Risk Identification
As with each step in the risk management process, risk identification should be done continuously throughout the project life cycle. As a project changes—particularly in terms of budget, schedule, or scope—or when a mandatory review or update is required, the risk identification process should be iterated, at least in part. Prior to a major project review, a review of the risk identification process should be done to ensure the process is complete and no portion should be redone.
To begin risk identification, the IPT should attempt to break the project elements into a risk breakdown structure that is the hierarchical structuring of risks. The risk breakdown structure is a structured and organized method to present the project risks and to allow for an understanding of
10 DOE G 413.3-7 9-16-08
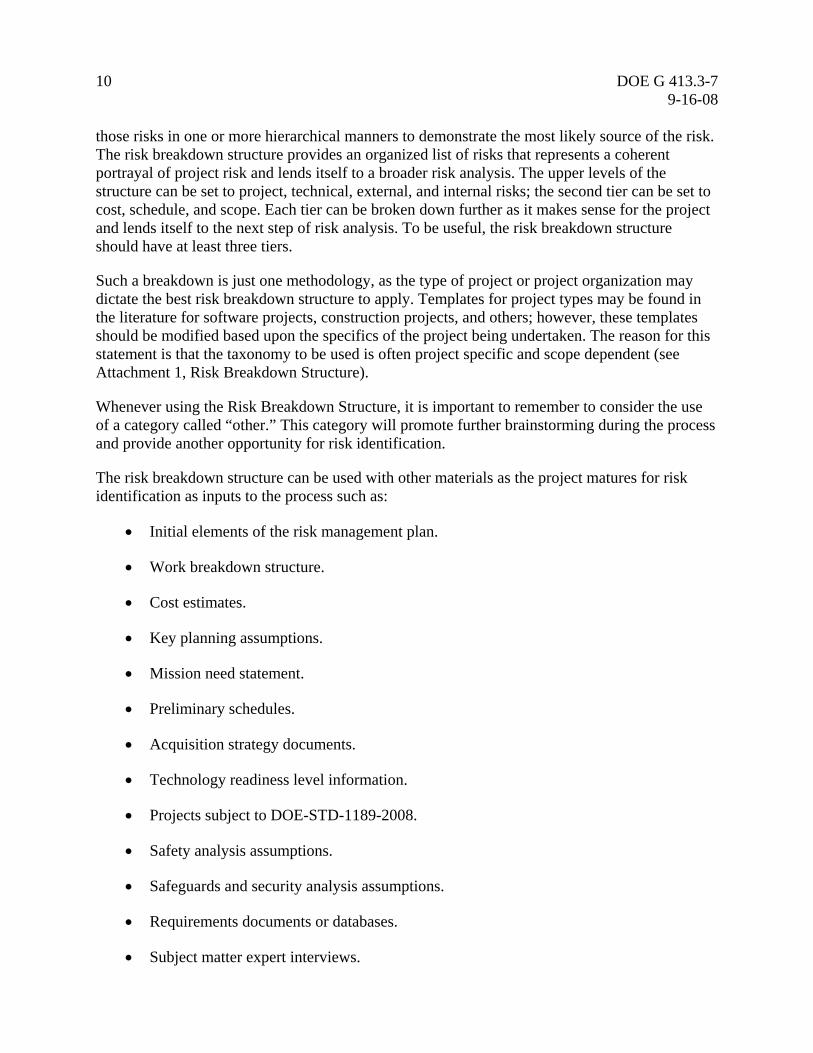
those risks in one or more hierarchical manners to demonstrate the most likely source of the risk. The risk breakdown structure provides an organized list of risks that represents a coherent portrayal of project risk and lends itself to a broader risk analysis. The upper levels of the structure can be set to project, technical, external, and internal risks; the second tier can be set to cost, schedule, and scope. Each tier can be broken down further as it makes sense for the project and lends itself to the next step of risk analysis. To be useful, the risk breakdown structure should have at least three tiers.
Such a breakdown is just one methodology, as the type of project or project organization may dictate the best risk breakdown structure to apply. Templates for project types may be found in the literature for software projects, construction projects, and others; however, these templates should be modified based upon the specifics of the project being undertaken. The reason for this statement is that the taxonomy to be used is often project specific and scope dependent (see Attachment 1, Risk Breakdown Structure).
Whenever using the Risk Breakdown Structure, it is important to remember to consider the use of a category called “other.” This category will promote further brainstorming during the process and provide another opportunity for risk identification.
The risk breakdown structure can be used with other materials as the project matures for risk identification as inputs to the process such as:
• Initial elements of the risk management plan.
• Work breakdown structure.
• Cost estimates.
• Key planning assumptions.
• Mission need statement.
• Preliminary schedules.
• Acquisition strategy documents.
• Technology readiness level information.
• Projects subject to DOE-STD-1189-2008.
• Safety analysis assumptions.
• Safeguards and security analysis assumptions.
• Requirements documents or databases.
• Subject matter expert interviews.

DOE G 413.3-7 11 9-16-08
• Stakeholder input.
• Designs or specifications.
• Historical records.
• Lessons learned.
• Any legislative language pertaining to the project.
• Other similar projects.
• Pertinent published material.
Various techniques that can be used to elicit risks include brainstorming, interviews and diagram techniques. Regardless of the technique, the result should not be limiting and should involve the greatest number of knowledgeable participants that the IPT can accommodate within their constraints. Once the process of initial risk identification has been complete, the IPT should follow up with the self-assessment process noted in Section 4.7.2.2, Self Assessment, using the Risk Identification Checklist in Attachment 8.
As the team identifies risks, it is important that they are aware of biases that may influence the information. Typical biases the facilitator of the risk identification should be aware include the following:
• Status quo—strong bias toward alternatives that perpetuate current direction.
• Confirming evidence bias—information that supports existing points of view are championed while avoiding information that contradicts.
• Anchoring—disproportionate weight is given to the first information provided.
• Sunk cost—tend to make choices in a way that justify past choices, unwillingness to change direction.
When identifying a risk, it should be stated clearly in terms of both the risk event and the consequences to the project/program. The format for the risk identified should generally be cause/risk/effect.
One may choose to record cause, risk, and effect in separate fields to facilitate grouping of risks into categories based on commonality of these attributes.
This format should be employed whether the risk is a threat to the project or an opportunity, which is a risk with a benefit. Documentation should be done in affirmative terms—as if the risk will occur—to enable the IPT to draft a definitive risk handling strategy. The information should be captured in a risk register, a database designed to capture all necessary information about a risk and facilitate tracking and reporting (see Attachment 1, Risk Breakdown Structure).
12 DOE G 413.3-7 9-16-08
Examples of risks captured in the affirmative are:
• Discovery of classified material in landfill delays removal of transuranic material and impacts schedule.
• Delay in signing a cooperative research and development agreement impacts availability of specialized research personnel in statistical analysis of nano-scale stress analysis of carbon-based metals delaying project by one year.
• Seismic site analysis area is expanded due to adjacent construction site seismic reports resulting in new drilling and reporting delaying site preparation by six months.
Risks should be stated as separate items and should not be grouped or bundled. As an example, one should identify each material handling risk for a process separately and not as material handling risks. One should also be aware that an opportunity will also have one or more threats which should be identified as a separate risk item in the register. It is helpful to link the items either by Work Breakdown Structure identification number or by other unique identification methodology that will indicate the linkage. The linkage is important, especially if the risk owner is different as the risk owners may need to coordinate their efforts on the risk handling strategies.
The IPT should capture opportunities before threats. Opportunities are often shared between and among projects. It should be noted that opportunities for one participant could be detrimental to another; therefore, they should be worked cooperatively. Examples of opportunities include:
• Available human resources with flexible scheduling can be shared to the advantage of two or more projects.
• A crane is available at another site at a lower cost than purchasing a new or a used one.
• Results of adjacent construction site seismic reports cause the seismic site analysis area to be expanded, resulting in new drilling and reporting, and delaying site preparation by six months.
In addition to identifying a risk in terms of the causal event and consequence, the pertinent assumptions regarding that risk should be captured in the risk register to aid in future reporting of the risk. These assumptions might include items such as, but not limited to, interfaces among and between sites, projects, agencies, and other entities; dependencies as human resources, equipment, facilities, or other; and historically known items that may impact the project either positively or negatively. The assumptions should be kept current and should be validated through various methods including documentation and subject matter experts.
4.3.2 Assignment of the Risk Owner
Before assigning a qualitative assessment to the dimensions of a risk (probability and consequence), a risk owner should be identified. The risk owner is the team member responsible for dealing with a specified risk, ensuring effective handling responses or strategies are developed and implemented, as well as filing appropriate reports on the risk in a timely fashion.
DOE G 413.3-7 13 9-16-08
The risk owner should also validate the qualitative and quantitative assessments assigned to their risk. Finally, the risk owner should ensure that risk assumptions are captured in the risk register for future reference and assessment of the risk and to assist possible risk transfer in the future.
Any action taken in regard to a risk should be validated with the risk owner before closure on that action can be taken.
4.3.3 Assignment of Probability and Consequence
Risk analysis has two dimensions—probability and consequence. Probability is the likelihood of an event occurring, expressed as a qualitative and/or quantitative metric. Consequence is the outcome of an event. The outcome of an event may include cost and/or schedule impacts expressed as a qualitative and/or quantitative metric. The IPT estimates probability and consequence dimensions (qualitative and quantitative) subjectively, with the risk owner making the final determination. During the qualitative analysis, the probability and consequence scales can be categorical. However, it is often useful to assign quantitative metrics to the qualitative categories to help ensure consistent assignment of probabilities and consequences across a project/program (see Attachment 4, Probability Scale/Schedule Consequence Criteria). This approach works well for probability and consequence.
4.3.4 Assignment of Risk Trigger Metrics
A risk trigger metric is an event, occurrence or sequence of events that indicates that a risk may be about to occur, or the pre-step for the risk indicating that the risk will be initiated. The risk trigger metric is assigned to the risk at the time the risk is identified and entered into the risk register. The trigger metric is then assigned a date that will allow the risk owner to monitor the trigger. The purpose of monitoring the trigger is to allow adequate preparation for the initiation of the risk handling strategy and to verify that there is adequate cost and schedule to implement the risk handling strategy.
4.3.5 Risk Register
The risk register is the document or database that is the information repository for each identified risk. It provides a common, uniform format for the presentation of risk-related information regarding the identified risks. The level of detail may vary depending upon the complexity of the project and the overall risk level presented by the project as determined initially at the initiation phase of the project.
The fields stated here are those that should appear in the risk register, whether the risks presented are a threat or an opportunity. Other fields that are suggested to be considered are contained in Attachment 5, Risk Register, and are suggested to be included as they allow a much better view of the full field of options available to the FPD and CPM:
• Project title and code (denotes how the project is captured in the tracking system used by the site office and/or contractor).
• FPD and CPM.
14 DOE G 413.3-7 9-16-08
• Unique risk identifier (determined by the individual site).
• Risk statement.
• Risk category (project, technical, internal, external, and any sub-category that may be deemed unique to the project such as safety or environment).
• Risk owner.
• Risk assumptions.
• Probability of risk occurrence and basis.
• Consequence of risk occurrence and basis.
• Trigger event.
• Handling strategy (type and step-wise approach with metrics, who has the action, planned dates, and actual completion dates).
• Success metric for overall handling strategy.
• Residual risks.
• Secondary risks.
• Status (open/closed) and basis.
The risk register may also include back-up strategies for primary risks, risk handling strategies for residual and secondary risks, the dates of upcoming or previous risk reviews, and a comment section for historical documentation, lessons learned, and subject matter experts’ input.
4.3.6 Risk Analysis
Risk analysis from a project management perspective should begin with the identification of the overall risk level of the project during the Initiation Phase. This analysis supports the preparation of the mission need statement and the tailoring strategy during CD-0.
The review of various approaches to the mission, goals, and objectives of the project should involve a comparative analysis of alternatives and overall risk identification, as well as the analysis for those alternatives. As a general rule, the simplest analysis that should be performed at CD-0 is a cost and benefit review, a type of qualitative review. The qualitative approach involves listing presumed overall costs over presumed costs for projected benefits. The result would be an overall assessment of the risk on the project (see Attachment 6, Cost/Benefit Analysis, for an alternative quantitative approach that can be used when enough information is available).
DOE G 413.3-7 15 9-16-08
After CD-1 approval, two forms of risk analysis may be performed: Qualitative and quantitative. These analyses serve as the foundation for continuing dialog about future risk realizations and the need for the application of the contingency and management reserve, which are subjects, addressed in other DOE G 413.3-series guides that handle cost and contingency calculations.
4.3.6.1 Qualitative Risk Analysis
The purpose of qualitative risk analysis is to provide a comprehensive understanding of known risks for prioritization on the project. Qualitative risk assessment calls for several risk characteristics to be estimated:
• Risk probability.
• Risk consequence.
• Trigger metrics or conditions.
The FPD or CPM may decide to include other qualitative characteristics such as affected project elements, influences on the risk, and assumptions about the trigger conditions. These items should be captured in the risk register or risk register database.
If only a qualitative analysis is to be done, various cost and schedule factors may be used to provide for contingency and management reserve calculations. (Note: terminology may vary depending upon the Program Office to which the program or project is assigned.)
Qualitative analysis, or assessment as it is sometimes referred, is the attempt to adequately characterize risk in words so as to enable the development of an appropriate risk handling strategy. Additionally, qualitative analysis assigns a risk rating to each risk, which allows for a risk grouping process to occur. This grouping of risks permits the FPD and the CPM to discern patterns of risk on the project. The patterns are indicative of the areas of risk exposure on the project. The qualitative analysis is also the foundation for initiating the quantitative risk analysis, if required.
Qualitative risk analysis should also be performed on residual risks and secondary risks, but only after the handling strategy has been determined for the primary risk. Again, the risk owner should accept the risk ranking.
4.3.6.1.1 Qualitative Matrices Analysis
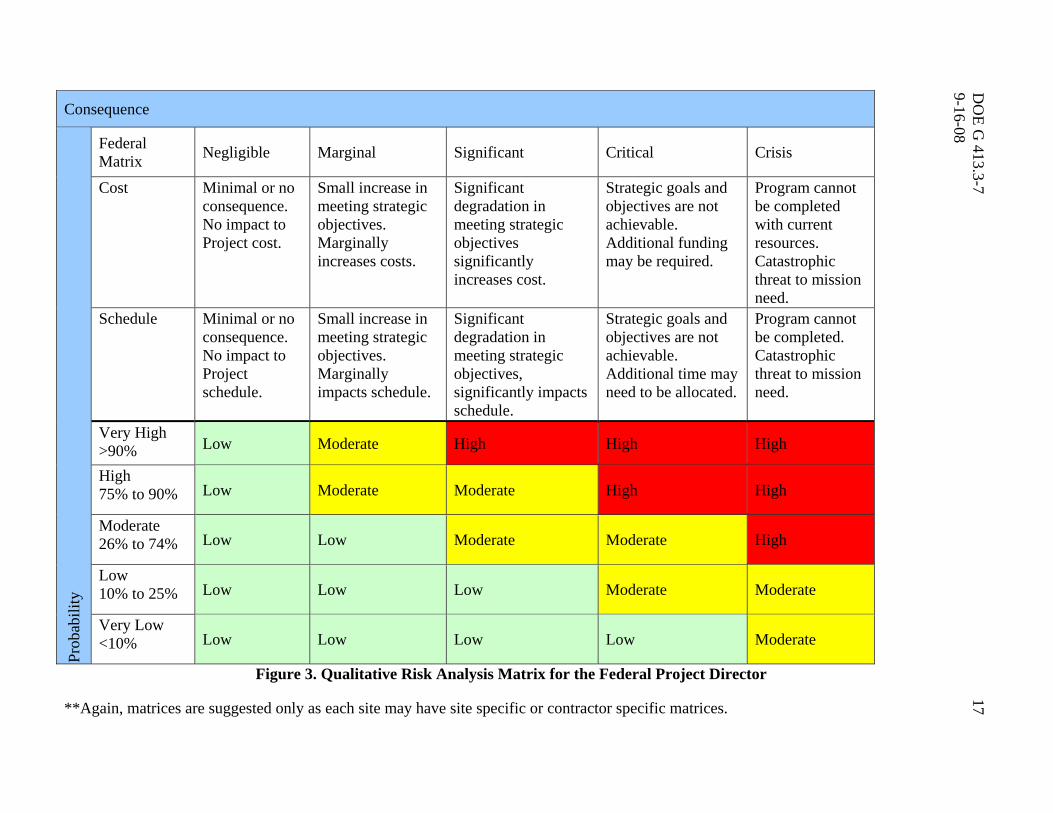
One of the tools used to assign risk ratings is a qualitative risk analysis matrix, also referred to as a probability impact diagram or matrix (see Figure 3, Qualitative Risk Analysis Matrix for the FPD, and Figure 4, Qualitative Risk Analysis Matrix for the Contractor Project Manager, for examples). Risk ratings are also often referred to as risk impact scores.
The matrix combines the probability and consequence of a risk to identify a risk rating for each individual risk. Each of these risk ratings represents a judgment as to the relative risk to the project and categorizes at a minimum, each risk as low, moderate or high. Based on these risk ratings, key risks, risk handling strategies, and risk communication strategies can be identified.

16 DOE G 413.3-7 9-16-08
Risk consequences for the FPD and the (CPM) in most cases are different because the FPD is driven more from strategic mission objectives than contract performance objectives. Mission objectives are more strategically oriented than corporate or monetary incentive based. Therefore, two risk matrices are recommended.
DO
E G 413.3-7
17 9-16-08
Consequence
Prob
abili
ty
Federal Matrix Negligible Marginal Significant Critical Crisis
Cost Minimal or no consequence. No impact to Project cost.
Small increase in meeting strategic objectives. Marginally increases costs.
Significant degradation in meeting strategic objectives significantly increases cost.
Strategic goals and objectives are not achievable. Additional funding may be required.
Program cannot be completed with current resources. Catastrophic threat to mission need.
Schedule Minimal or no consequence. No impact to Project schedule.
Small increase in meeting strategic objectives. Marginally impacts schedule.
Significant degradation in meeting strategic objectives, significantly impacts schedule.
Strategic goals and objectives are not achievable. Additional time may need to be allocated.
Program cannot be completed. Catastrophic threat to mission need.
Very High >90% Low Moderate High High High
High 75% to 90% Low Moderate Moderate High High
Moderate 26% to 74% Low Low Moderate Moderate High
Low 10% to 25% Low Low Low Moderate Moderate
Very Low <10% Low Low Low Low Moderate
Figure 3. Qualitative Risk Analysis Matrix for the Federal Project Director
**Again, matrices are suggested only as each site may have site specific or contractor specific matrices.

18 D
OE G
413.3-7
9-16-08 Consequence
Prob
abili
ty
Contractor Matrix Negligible Marginal Significant Critical Crisis
Cost Minimal or no consequence. No impact to Project cost.
Small increase in meeting objectives. Marginally increases costs.
Significant degradation in meeting objectives significantly increases cost; fee is at risk.
Goals and objectives are not achievable. Additional funding may be required; loss of fee and/or fines and penalties imposed.
Project stopped. Funding withdrawal; withdrawal of scope, or severe contractor cost performance issues.
Schedule Minimal or no consequence. No impact to Project schedule.
Small increase in meeting objectives. Marginally impacts schedule.
Significant degradation in meeting objectives, significantly impacts schedule.
Goals and objectives are not achievable. Additional time may need to be allocated. Missed incentivized and/or regulatory milestones.
Project stopped. Withdrawal of scope, or severe contractor schedule performance issues.
Very High >90% Low Moderate High High High
High 75% to 90%
Low Moderate Moderate High High
Moderate 26% to 74%
Low Low Moderate Moderate High
Low 10% to 25%
Low Low Low Moderate Moderate
Very Low <10% Low Low Low Low Moderate
Figure 4. Qualitative Risk Analysis Matrix for the Contractor Project Manager

DOE G 413.3-7 19 9-16-08
As with a threat, an opportunity should also be assessed using a risk assessment framework (see Attachment 7 for an example of an opportunity matrix). The matrix may be modified to provide one for the CPM by reviewing the consequences specifically in terms of the impacts to the contract terms in regard to the project. The matrix is an option for sites that do not have site specific or contractor specific matrix or matrices.
A project’s tolerance limit for overall risk rating is referred to as the risk threshold. The risk owner should accept this rating or the process should be reiterated to validate the probability and consequence ratings to obtain acceptance by the risk owner. This same rating process can be used for opportunities by changing the terms to positive for the consequences in the matrices.
Determining the average risk rating can determine the overall project risk rating. Risk ratings are assigned via a matrix to the risk, threat or opportunity, based upon the risk classification. Typical risk classifications are low, moderate, or high. Another option would be to use numerical values for ratings. The numerical value can be tailored to the project or standardized for a program.
If a quantitative analysis is going to be performed, the qualitative analysis can be used to guide the quantitative analysis. The lowest rated risks generally do not have a determinative impact upon the project cost or schedule. Risks that have a determinative impact upon project cost or schedule will generally rate towards the higher end of the qualitative scale. However, for many projects, there may be a weak correlation between a risk’s determinative impact and the qualitative risk rating.
Care should be taken when comparing project risk scores of different projects as the project risk scores are a result of a subjective process and are prepared by different project teams.
Qualitative risk analysis should also be performed on residual risks and secondary risks, but only after the handling strategy has been determined for the primary risk. Again, the risk owner should accept the risk rating.
As the information is gathered and finalized, the data should be analyzed for bias and perception errors. While the data will not be systematically used for a quantitative analysis, it should still be analyzed and perceptions scrutinized.
Following the completion of the qualitative analysis, one should do a review of Section 4.3.6.3, Project Learning Analysis.
4.3.6.1.2 Other Qualitative Techniques
One qualitative technique that may be used is to do a search on the risk register for common causes of risks. If the risks are written in the format of cause/risk/effect with a field for each, the search can be made simple. If not, a search on common terms can be done. By looking for risks with common causes, one can attempt to find opportunities within the handling responses or strategies as well as commonalities in monitoring triggers, risk owners, or other shared items. Further, it may be that changes can be made to the scope to avoid the risks that were not apparent when viewing the risks individually.
20 DOE G 413.3-7 9-16-08
Another qualitative technique for analyzing risks is to use a network diagram. Using a network diagram to show what tasks bear the high and moderate risks and where they exist in regard to the critical path can be a powerful tool in analyzing how much contingency should be set aside for the risk to ensure that the critical path is not impacted or the risk to the critical path is within a manageable range for the FPD or CPM. The diagram is used to determine the impact to successor tasks, especially those that either impact the critical path directly or will have an impact upon a critical input to the critical path.
The risk breakdown structure methodology provides the option of demonstrating patterns of risk placement or risk groupings. For instance, rather than specifying the risk, the risk is captured as a mark on the grid and grouped together, then cut across with another matrix technique such as the work breakdown structure or the cost breakdown structure. (See reference – Hillson, D. A. (2007), “Understanding risk exposure using multiple hierarchies,” published as part of 2007 PMI Global Congress EMEA Proceedings – Budapest).
The risk is mapped to the work breakdown structure element that would be impacted if it occurred. The pattern that emerges allows one to either use the assigned expected value score or to count the number of risks associated with the element. This method allows attention to be focused on specific areas of risks.
Again, a review of Section 4.3.6.3, Project Learning Analysis, should be done.
4.3.6.2 Quantitative Risk Analysis
Quantitative risk analysis should be used to estimate the impact of risks on project cost and schedule. Quantitative risk analysis is a numerical or more objective analysis of the probability and consequence of individual risks that also addresses the extent of the overall project risk through the use of a model. The purpose of the quantitative risk analysis is to provide budget and completion date estimates of the effect of the risks on the project using statistical modeling techniques such as Monte Carlo, Quasi-Monte Carlo, sensitivity simulations, and other stochastic methodologies, depending upon the project data. Random sampling from input ranges of time and cost are used to estimate the impacts on the project’s critical chain. The simulation produces a range of possible project outcomes.
Quantitative risk analysis can provide a view of which risks or groups of risks should receive more focused attention. It allows a numerical evaluation of risk on the project at a point in time. The simulations can also assist in projecting the future cost and schedule of the project, if no other actions are taken, as well as allow for projections to be run based on options the project could implement, and thus allows the FPD and/or CPM to engage in discussions about additional handling strategies that could be implemented. Quantitative analysis also provides a method for the FPD and/or CPM to determine the level of cost contingency, management reserve, schedule contingency, and schedule reserve, when combined with cost uncertainty calculations, that is required to complete the project within the level of confidence required by the DOE or NNSA program office.
In general, quantitative analysis is an attempt to determine how much combined risk the project contains and where and when that risk exists to enable the project team to focus the project

DOE G 413.3-7 21 9-16-08
resources appropriately. Quantitative risk analysis has in the past been reserved for multi-year, large, and/or complex projects or projects where the program or executive management desires a more informed decision as to the amount of risk that exists on the project. Some DOE offices allow for tailoring with respect to quantitative risk analysis. The reason for this type of tailoring is that quantitative analysis allows for the use of different scenarios and alternatives to the base case. However, for overall low-risk projects as determined by the qualitative analysis, the FPD or CPM may determine through the tailoring process and with the approval of their DOE office, that quantitative analysis is not warranted.
Quantitative analysis, when done, can be restricted to only those risks that are ranked higher than low as the overall risk ranking from the qualitative analysis process. When this is done, the magnitude of the underestimation should be addressed. The FPD or CPM may exclude low risks in the analysis at his/her discretion based upon their project analysis. The critical path for the project and the approved budget serve as the primary basis for the risk model and for the project analysis.
It is important to model both risk threats and opportunities. It is suggested that the two types of risk are modeled separately to allow for separate analysis given the different project impacts that the two forms may have.
4.3.6.2.1 Quantifying Probabilities and Impacts for Quantitative Risk Analysis
A complete and well-executed qualitative analysis is essential to a quantitative analysis. It will serve as the base for developing the data for input into the simulation model.
For each risk, a percent is assigned to the probability (how likely it is the risk will occur), a dollar value distribution is assigned to the cost impact, and a schedule duration impact is assigned to the affected activity in the schedule. Depending upon the software program being used, the percent may need to be within a specified range. For some projects, especially large projects, the use of the expected value, a probability weighted average of all possible outcomes, is a tool which can be used to determine which risks should receive more attention or more resources for implementing the risk handling strategies. In general the concept is implemented as:
EV = P x CI,
where, EV = Expected Value
P = Probability
CI = Cost Impact
Inputs for the calculation include, but not limited to:
• Risk management plan.
• Historical records (especially where similar risks were handled).
22 DOE G 413.3-7 9-16-08
- Actual costs.
- Time impact.
• Subject matter experts.
- Delphi techniques.
- Interviewing staff, crafts, retirees, and others familiar with similar work efforts at the site or other sites.
• Technical records such as safety analysis documents including the risk and opportunity assessment, quality assessments, safeguards and security analyses, and environmental assessments.
As information is gathered and finalized, it should be reviewed for bias and perception errors. These findings should be captured in the analysis that accompanies the Monte Carlo simulations.
Another item that should be considered in this analysis is a review of any constraints that may impact the cost and schedule ranges assigned to the risks. While some of the constraints may be hard to measure, they should still be captured, for significant risks, in the text of the analysis so the FPD and the CPM can take them into consideration as they make decisions regarding the future handling of the risks and any contingency requests or management reserve applications.
The inputs into a Monte Carlo simulation process are continuous probability distributions. The most common methodology is to use a three-pronged approach from the input enumerated. The input is the optimistic view, the most likely view, and the pessimistic view of the range of the cost and schedule for the probability and impact to the cost and schedule values. However, if no central tendency exists for a distribution, a two-point estimate should be used.
For schedule impact evaluation, the logic-linked project schedule will be utilized as input to allow the random sampling process to be tied to the critical path analysis. The project schedule should contain sufficient logic linkage between the activities to clearly identify critical path and near-critical path activities. The Monte Carlo simulation process uses a random sampling process to develop a modified duration for each risk-related task or activity and determines the project length based on the re-analyzed critical path, repeating the simulation to convergence. A similar process can be executed for cost using the project cost estimate or a detailed cost loaded schedule. Both threats and opportunities should be analyzed.
While the use of the Monte Carlo simulation is one of the standards of the DOE/NNSA, it does not mean that other forms of quantitative analysis are discouraged. Other forms of quantitative analysis may be used in conjunction with Monte Carlo simulation. Suggested other forms of quantitative analysis that may be considered are: decision trees, influence diagrams, system dynamics models, and neural networks. The project should be able to clearly explain why the particular technique was chosen and explain why it is preferred and appropriate.
DOE G 413.3-7 23 9-16-08
4.3.6.2.2 Additional Points of Analysis That Should be Included
The purpose of providing the additional analysis with the Monte Carlo simulation data is two-fold. First, Monte Carlo simulation graphs require supporting analysis to provide the necessary information to enable an increased understanding of a project’s risk exposure. Second, it provides decision-makers with a basis to engage the project team in discussions relevant to project risks.
4.3.6.2.2.1 Planning Assumption Validation Analysis
Analyses accompanying Monte Carlo simulation data, including graphs, should include the validation of assumptions that serve as the basis for planning the budget and schedule of the project from which risks arose. Since assumptions have a basis in fact, but are not facts themselves, they should be validated to make sure they are still operable before the project invests in the cost of a Monte Carlo simulation process and to ensure that parameters that will be entered into that process are as accurate as possible.
4.3.6.2.2.2 Cost and Schedule Quantification Range Assumption Data Gathering Process and Validation Analysis
As the costs and schedule ranges are captured for each risk for input into the Monte Carlo simulation runs, the assumptions that formed the basis for those ranges should be captured. The risks that are input may include low risks as determined by the FPD or CPM. The reasons for capturing those assumptions are to form an historic database for future projects, an historic database for the current project, a reference to substantiate how the projected federal contingency or the contractor management reserve/contingency was derived, and as a basis to determine the possible range of error that may exist in the data upon which the Monte Carlo data is based.
As with the discussion of the planning assumptions, the cost and schedule should be validated. The validation process consists of validating the assumptions that formed the basis for planning the budget and the schedule as well as inputs that went into the formation of both. The discussion of the process used and the results should be included in the analysis of the Monte Carlo data. Any changes to the baseline assumptions should be highlighted in the text.
4.3.6.2.2.3 Alternative Run Analyses
The FPD or the CPM may choose to execute further Monte Carlo simulations beyond the overall schedule and cost runs. These may include targeted runs pertaining to specific risks or key risks and their affects on various planned activities or the overall project. Further groupings of risks may be chosen and the affects simulated against the schedule and cost of the project.
In choosing to make these runs, it is important to identify the correlation factors (interdependencies and relationships between risks), especially when those have become more apparent when the runs are done after the project has been in the execution phase

24 DOE G 413.3-7 9-16-08
for several months or years. The constraints of how various risks or similar risks will impact a project will demonstrate characteristics that can be identified and captured as assumptions. While risks are independently identified in most cases, they operate within the confines of the project and have interdependencies, relationships, both positive and negative, as well as dependencies to other projects within the same program area. In other words, there are defined relationships that should be explored. These relationships can give rise to other latent risks or risks that have remained undiscovered to date until these systematic relationships are reviewed.
4.3.6.3 Project Learning Analysis
A section of the Monte Carlo simulation written analysis should focus on the incorporation of project learning, or, in other words, lessons learned. If the project is new, this section may be the transference of learning from other projects. If the analysis is an update of the Monte Carlo simulation analysis, it should include learning from prior periods. This analysis should include insight into how risks have thus far presented themselves, how accurate the assumptions and estimations have been, how those assumptions may or may not impact the simulation results, and any other observations that the team finds are relevant to the projections.
In the quantitative analysis, one should discuss whether bias and perception errors could have influenced the data. Such errors in regard to the incorporation of information from lessons learned can arise from both an overly optimistic or pessimistic view of project status. This view can result in a misunderstanding of the applicability of the lesson to the project in question, caused by the bias of the project team to the lesson presented or by a variety of sensitivities to the data. The need to have a review of the data and a questioning of whether any bias or misperception could have occurred should occur in the written analysis that accompanies the data. This analysis is often best provided by independent subject matter experts.
In regard to the impact on the simulation results, the analysis should focus on the calculation of the contingency values. The usefulness of this analysis is in the follow-on risk discussions that occur during the monthly reviews of risks wherein the impacts of risks are reviewed along with the various assumptions as lessons learned are applied. By bringing the learning together with the analysis, the FPD and CPM are potentially better prepared for how risks will react on the project or how handling strategies will potentially mitigate the identified risks.
This process of applying lessons learned is also recommended for projects, which perform only qualitative analysis.
4.3.6.4 Error and Variance Analysis
Depending upon the size of the project and data bank being entered for any given simulation, it may be necessary to subjectively estimate extreme values to bound the magnitude of possible outcomes. If this case situation arises, it could introduce random errors into the simulation, which could potentially impact the results. If this occurs, it should be disclosed and any error or bias should be discussed, as well as any methodology—triangle distribution, for example—used to reduce such an impact.

DOE G 413.3-7 25 9-16-08
Risk attitude, the position that can be stated or unstated that the organization holds towards risk, is one factor that can influence how risk is handled and how values are assigned, and should be included in the analysis. For example, it influences how one views the ranges of the values and whether future values are considered and how, when considered, they are bounded. This line of reasoning should be discussed in the analysis.
Given that most values are best-case estimates, some error is expected, and the introduction of some range of error should be discussed. Even though the values generated by the Monte Carlo simulation may be carried to several decimal points, it is important to remember that these numerical values are indicators not absolute values.
One suitable methodology for analysis purposes is variance analysis. Generally, variance analysis is a tool that is used once the project has been under way for a period of time and has some data from which the project manager and subject matter experts can use for determining the expected values that are used to calculate the variance analysis.
Quantitative and qualitative analyses serve as the foundation for continuing dialog about future risk realizations and the need for the application of the contingency and management reserve. The written analysis that is derived from the quantitative and qualitative analyses should address how policy has impacted the outcome of the data; the evaluation of the reliability, software relevant issues, other variances which may have been introduced, how a pattern has been applied, what it is and what choices were made to remain consistent in the application thereof and the impact. The benefits of this approach, relative to other potential approaches, should be addressed.
4.3.6.5 Contingency Adequacy Evaluation
Numerous tools exist to analyze the adequacy of the contingency valuation that has resulted from the qualitative and/or quantitative analysis of the risks. Various tables that have been compiled by industry are available in texts and journals and are updated on a regular basis. These tables provide percent ranges of the base that a contingency should represent to be considered adequate. Further, the contingency value should be commensurate with the maturity and type of the project, project size, and risks, including technical and technology uncertainties.
If a quantitative risk analysis will not be conducted, estimates for cost contingency and schedule contingency should be provided. As a general rule, the IPT will use various inputs to determine those values. Those inputs may be, but are not limited to:
• Historical records.
- Actual costs.
- Time impact.
• Subject matter experts.
- Delphi techniques.
26 DOE G 413.3-7 9-16-08
- Interviewing staff, crafts, retirees, and others familiar with similar work efforts at the site or other sites.
• Technical records such as safety analysis documents including the risk and opportunity assessment, quality assessments, and environmental assessments.
As the information is gathered and finalized, the data should be analyzed for bias and perception errors. While the data will not be systematically used for a quantitative analysis, it should still be analyzed and perceptions scrutinized.
Note: The project’s initial estimated total cost and schedule contingency should exceed the amount estimated to account for the known risks because not all risks can be identified at the onset.
4.4 Risk Handling
Risk handling includes the application of specific, pre-determined approaches to identified risks. The approach includes identifying the risk’s owner or responsible party. While the risk handling strategic approaches are generally applied to high and moderate risks, they may be applied to low risks at the discretion of the FPD or CPM.
The risk handling strategies should be compatible with the appropriate DOE or NNSA office’s risk management policy and the appropriate risk management plan.
Risk handling is iterative, following risk analysis, because it involves identifying the cost and schedule associated with implementing the risk handling strategy. Since many parameters of the project change over time that impact the risk handling strategies (e.g., scope of the project, available resources, internal and external environments, technical advancements, et al.), the process is iterative to account for these and other impacts upon this portion of the process. One or more of these items can change a step in a risk handling strategy or the complete strategy which can change the cost and/or the schedule or implementation of the risk handling strategy. The foundation base assumptions of the risk may in fact have changed over time and will need to be revisited as well during this iterative step.
Risk handling covers a number of risk strategies, including risk acceptance, avoidance, mitigation, and transfer. When weighing these approaches, the IPT should take into account the following:
• The options’ feasibility in terms of the project’s objectives, and baseline funding and schedule.
• The expected effectiveness of the risk handling strategy based upon the tools used by the IPT.
• The results of a cost/benefit analysis.
• The impact on other technical portions of the project.

DOE G 413.3-7 27 9-16-08
• Any other analysis the FPD or CPM deem relevant to the decision process.
Risk handling strategies should consider the probability and consequence of the risk and, if deemed necessary by the risk owner, should allow for a back-up risk handling strategy that is documented in the risk register. If back-up risk handling strategies are documented in the risk register, they should be documented at the same level of detail as the primary risk handling strategy. Documentation at the same level as the primary strategy will ease implementation if the primary risk handling strategy is deemed unsuitable or inadequate. Further, the cost and necessary schedule for the back-up risk handling strategy should be calculated and noted in the risk register.
The cost for the risk handling strategy for the primary risk should be included in the baseline or held as contingency. There may be occasions when a primary risk is not added to the baseline until a change control action, such as when it is predicted during a monthly project review or a review of lessons learned.
Risk handling strategies should be continually reviewed for their affordability, achievability, effectiveness, and resource availability as required by the risk management plan.
If questions arise about a risk or its handling strategy’s potential impacts on the technical goals and objectives of the project, a more comprehensive analysis should be conducted.
An example of a risk handling strategy:
• Establish weekly requirements and interface meetings for design teams (set date).
• Establish a separate design review for the interfaces for where technology interfaces occur (set date).
• Establish a separate design review for any rework that must occur for technology interfaces (set date).
• Establish separate contractor and DOE walk-down of facility once technologies are on-site to determine visual interfaces concur with designs (set date).
• Establish walk-down of facility with technical staff to ensure quality, design, safety, and other necessary staff concur with all interface design features as physically installed (set date).
• As with all handling strategies a trigger metric should be established that measures when the handling strategy should be considered for initiation by the risk owner and the appropriate project owner whether it is the FPD or the CPM.
• Trigger Metric—RFP for two separate design contracts that must be connected in the facility (set date).
28 DOE G 413.3-7 9-16-08
4.4.1 Acceptance
Acceptance as a risk handling strategy should be a deliberate decision by the FPD or CPM and documented to the risk register and accepted by the IPT and signatories to the risk management plan. Acceptance of the risk does not mean that the risk is ignored. The risk should be included in the cost and schedule contingency impact analysis.
An example of a risk that might be accepted is the fact that there will be fewer bidders on a design-build request-for-proposal than might be desired, but that there will still be some competition.
Before a risk can qualify for acceptance an analysis should be conducted to show inter-relationships. The specific method of analysis can include the following:
• Pictorial modeling.
• Fish-bone diagramming.
• String diagramming.
• “What if” analysis systems modeling.
• Time-specific sequencing simulation modeling.
4.4.2 Avoidance/Exploit
Avoidance, as a risk handling strategy, is done by planning the project activities in such a way as to eliminate the potential threat. Avoidance should be considered the most desirable risk handling strategy. However, avoidance should be analyzed for its cost/benefit to the project within the current funded boundaries of the project. The cost/benefit analysis should also take into consideration the impact on the overall project and the impact on the available funding for handling the other identified risks. The FPD or CPM should document the decision processes used to determine whether or not to pursue the avoidance risk handling strategy for risks on the project. This will be evaluated by the IPT and the signatories to the risk management plan.
Avoidance strategies often involve a change in requirements, specifications, or practices to eliminate the risk. Avoidance can also be the rejection of an approach to doing a piece of scope, as the risk involved in the approach cannot be reduced to an acceptable level. In general, to exercise this approach, another approach that meets the cost/benefit approach should be available. An example would be to use a known material for construction, rather than an untested material that shows promise under the conditions that would be present, if the costs of the materials are within the range that is acceptable to the project and if the unknowns presented by the untested material present cost risks that outweigh the benefits.
The term exploit is used for positive benefit risks. To exploit an opportunity is to attempt to ensure that it occurs. As in the avoidance of the negative consequence risk, the thrust of the handling strategy is to ensure that uncertainty is removed and the opportunity definitely happens.

DOE G 413.3-7 29 9-16-08
For example, to remove the uncertainty of whether or not human resources will be available for an action at a certain time, one may extend the contract and have the resources available and working on other efforts at the site. Thus, it is ensured that the resources will be available for the project.
4.4.3 Mitigation/Enhance
Mitigation is a risk handling strategy that is taken to reduce the likelihood of occurrence and/or impact of an identified negative risk or threat, or to increase the likelihood of occurrence and/or benefit of an identified positive risk or opportunity. The goal of a mitigation risk handling strategy is to reduce the risk to an acceptable level.
In regard to the introduction of technologies or technologies needing further development, the technology development plan should be linked directly with the risk handling strategy for risks associated with technology development or availability. Deployment or implementation of a technology may introduce risk that requires specific risk handling strategies.
The risk’s mitigation strategy should be developed as a step-wise plan that can be included in the project baseline. The mitigation plan should be analyzed to ensure that it is feasible and that resources are available.
The term enhance is used for positive benefit risks. To enhance an opportunity is to increase the likelihood that it will occur. The necessity of identifying the trigger event is highlighted by attempting to enhance the opportunity by reinforcing the conditions identified in the trigger event.
4.4.4 Transfer/Share
The risk handling strategy of transferring risk operates differently within the DOE or NNSA than within private industry. In private industry, transferring risk often involves the purchase of insurance or bonds as the transference of the risk. The risk is passed to the insurance company that accepted the risk for a fee. Within the DOE or NNSA, the actual risk is transferred between the FPD and the CPM via the contract or from one project to another, or to a program office. Risk transference indicates a transfer of ownership, and therefore written acceptance of the risk should be obtained before transfer is complete. The oversight from the IPT and the risk owner should be assigned to monitor the status of the transferred risk.
When risk has been transferred, the transfer of the risk should be reviewed to ensure it did not create other risks. Therefore, as was done for the acceptance strategy, an analysis review should be conducted to fully understand inter-relationships. The transferred risk should also be monitored by the IPT to ensure that it does not impact the project mission and objectives.
The term “share” is associated with risks that present positive consequences. To share a risk is to allocate the ownership of the risk with one or more other parties. For instance, a risk could be shared between the FPD and the contractor, between and among various projects, or a combination thereof. In general, the risk benefits should extend to the parties that shared the risk.
30 DOE G 413.3-7 9-16-08
4.5 Residual Risk
Residual risk is the risk that is determined to remain after the risk handling strategy (accept, avoid, mitigate, or transfer) has been performed. A residual risk may end up being the same risk as the original risk if the risk handling strategy does not reduce or mitigate the risk or the risk is one that recurs. A residual risk may be some portion of the original risk that remains after the risk handling strategy is implemented. The fact that residual risk remains does not mean that the risk handling was not effective only that it did not completely avoid a risk remaining. It is up to the FPD or the CPM, depending upon who owns the risk, as to whether the residual risk will be moved to a primary risk position. This remaining or residual risk should be qualitatively analyzed. Through this process a decision should be made as to when the risk planning process should stop. Those residual risks for which no risk strategies are planned are accepted and should be clearly communicated to the team and management.
Once it has been determined that the residual risk will remain after the implementation of the primary risk’s risk handling strategy, the primary risk should be closed. The residual risk should be moved to a primary position on the risk register. Once moved to the primary risk position, the risk handling strategy for the risk should be reviewed and updated, if necessary. If a back-up strategy was also logged into the risk register at the time the residual risk was captured, it should be reviewed for applicability also and determined if it is the better risk handling strategy or if the two risk strategies should be merged, blended, or completely redrafted. Following this review, the residual risk is handled as a primary risk on the risk register with an appropriate owner assigned. All steps that were conducted with primary risks in regard to the baseline will need to be accomplished with the new primary risk, if necessary, in regard to the baseline. In other words, a review of the baseline should be done for change in cost and schedule contingency to be made at the discretion of the FPD and/or CPM in consultation with the IPT.
4.6 Secondary Risk
Secondary risk is the risk that arises as a direct result of implementing a risk handling strategy. This risk is in contrast to a residual risk in that it is not remaining after the implementation of a risk handling strategy. A secondary risk may exist at the same time one is implementing a risk handling strategy as it arises directly from the implementation of that strategy. A secondary risk may often be able to be predicted. If it can be predicted, the secondary risk should also appear on the risk register. It should be assessed, although it may not be considered a primary risk until the trigger metric has been realized or the FPD or the CPM determines that it should be moved to the primary risk position. Again, if the secondary risk becomes a primary risk the FPD and/or CPM should do the analysis of the baseline.
An example of a secondary risk: Federal risk of having to negotiate a staged well for Area 300 B. Secondary risk: During negotiations, the State determines that not only do they want a staged well for Area 300 B, but they want four more staged wells in the surrounding Area of 300 C-D. The risk of negotiating the need for a staged well opens up the communication on wells and may cause a secondary risk that the team feels is possible that more wells may be requested and they estimate that number to be four.

DOE G 413.3-7 31 9-16-08
4.7 Risk Monitoring
Risk monitoring involves the systematic, continuous tracking and evaluating of the effectiveness and appropriateness of the risk handling strategy, techniques, and actions established within the risk management plan. Monitoring is performed for individual risks per the risk metrics and overall project risk status. The risk monitoring process should provide both qualitative and quantitative information to decision-makers regarding the progress of the risks and risk handling actions being tracked and evaluated.
Risk monitoring may also provide information that can assist in identifying new risks or changes in the assumptions for risks captured previously on the risk register. These results should be used to initiate another risk identification process.
4.7.1 Risk Monitoring Process Considerations
The Risk Monitoring process should be tailored to the program and/or project, and be described in the risk management plan. The risk monitoring process should be more than a risk tracking documentation process and should include the following items:
• Ensure that the risk owner is current and performing his or her role and responsibilities.
• Ensure that risk identification is current with the parameters of the project and initiates the rest of the risk management continuous and iterative process within the project culture and organization.
• Ensure that risks, including accepted and low risks, have not changed since first identified.
• Ensure that avoidance strategies are implemented according to schedule, and that metric indicators are showing that the risk is not presenting itself.
• Ensure that risk handling strategies are being implemented and executed to meet or exceed metrics for success.
• Review any back-up plans for applicability and determine if any others need to be put into place based upon performance of the current handling strategies.
• Review the cost and schedule contingency calculations for the current handling strategies that are being implemented and those that will be implemented in the near future based upon recent performance for projected accuracy.
• Review any necessary risk management communication that may be necessary for any current or near-term risks for executive management, customers, stakeholders, or others and review such communication against the risk management communication plan.
• Ensure the recognition of the benefits and necessity of early consideration and integration of safety and security-related project risk into the project risk management process.

32 DOE G 413.3-7 9-16-08
• Ensure that the risk register and other risk-related forms are up-to-date.
• Conduct integrated metrics management and reporting (see Attachment 6, Cost/Benefit Analysis).
4.7.2 Risk Monitoring Methods
The following are not the only methods available and do not exclude the use of other methods acceptable to the Program Office.
4.7.2.1 Risk Owner Monitoring
The risk owner has a significant role in risk monitoring. As part of the risk monitoring process, the risk owner should update information in the risk register through an agreed upon process with the IPT and as stated in the risk management plan. The information that should be updated by the risk owner may require that the risk owner inform the IPT or risk management plan signatories.
Any changes that a risk owner makes to the risk register should be brought to the attention of the IPT charged with monitoring project metrics to ensure that changes in the conditions of one risk do not impact another risk or create another potential risk.
It may be necessary to conduct an analysis study depending upon the extent of the impact of the change to the risk register. The FPD or the CPM, in consultation with the IPT, should make this determination.
4.7.2.2 Self Assessment
At various junctures during the project, a FPD or a CPM may wish to assess the risk management processes that have been implemented. In such a case, the respective manager may wish to use a review document designed for the particular project or a generic checklist (see Attachment 8, Risk Identification Checklist, and Attachment 9, Risk Monitoring Checklist).
4.7.2.3 Integrated Risk Monitoring
Integrated risk monitoring occurs when risk management metric monitoring is integrated with other standard project metrics such as earned value or safety metrics. The determination as to the root cause of any negative or positive impact upon a metric should include a determination as to whether it involved a risk including whether it involved the positive benefit risk known as an opportunity. The output of the reporting process can be the input to the risk management process for further risk identification, analysis of consequence and impact ratings, and the analysis of the handling strategy as planned or as being implemented.
4.7.2.3.1 Earned Value
Earned value is used to evaluate a program or project’s cost and schedule performance. In order to integrate risk management more fully with the earned value management system, one might identify a number of risk evaluation metrics into the system. By scheduling the performance of

DOE G 413.3-7 33 9-16-08
key milestones in the risk strategies for various risks, the FPD or CPM can measure some aspects of the performance of those risk strategies.
If a problem is noted, a corrective action could be implemented for the risk response by using the same metric tools of cost performance index and schedule performance index. The detailed evaluation that would be done by the risk owner along with the FPD and/or CPM would serve as the basis for the corrective action.
Finally, any lessons learned should be gathered before completion of the analysis to be shared with the team and related projects.
4.7.2.3.2 Safety Metrics
Safety metrics are used to measure the effectiveness of the safety program, and various administrative, personnel protection, and engineering methodologies being used to achieve worker and public safety. Various metrics are used in the program offices. Among those metrics are the measures of the occurrence of certain events including electrical safety events, industrial events, radiological events, and near miss events, etc. For the purposes of risk management, the performance assessment that is done in regard to safety should involve a review of events to determine whether or not the event involved a risk, an event that could have been predicted and thus could have been avoided.
If such a risk is determined to have been part of the safety event, the FPD, CPM, or both should conduct a lessons learned in accordance with the applicable safety order. All related projects should undergo a review for an exact risk or similar risk and the application of the lessons learned.
If the project is subject to DOE-STD-1189-2008, the key risks should be tracked and reported per the requirements of the standard and in relationship to the maturity of the project and technical studies that are ongoing.
Nothing in this section eliminates the risk assessment metrics for safety that may exist in other safety management orders or guides.
4.7.2.3.3 Quality Metrics
Quality metrics are used to measure quality assurance and quality control processes. Project activities and processes should have a set of metrics. If a metric is not met, an analysis of this shortcoming should be done to determine the reason. If the reason for the non-achievement of the metric is a realized risk, an analysis of the risk should be initiated to determine whether the risk was identified, and, if not, why it was not identified. Additionally, a reflective analysis process may be needed to determine if the risk was hidden or latent due to other risks or perhaps other project factors. Lessons learned should be gathered and applied to the project and other similar projects.
If the risk was identified, the analysis should determine if the risk operated as predicted per the assumptions, surrounding the risk, or if the handling strategy or response was inadequate, or if

34 DOE G 413.3-7 9-16-08
the residual risk was greater than anticipated, or if the accepted risk was greater than what was anticipated. Again, a full analysis should be done and shared with the project participants and other similar projects. If the risk only allowed for partial achievement of the metric, then the handling strategy should be reviewed, especially if the risk is one that could recur or is one that is found on other projects.
Nothing in this section eliminates the risk assessment metrics for qualitative assurance that may exist in other quality management regulations, directives, and orders.
4.7.2.3.4 Safeguards and Security Metrics
Safeguards and security metrics are used to measure the implementation of the safeguards and security requirements for a given project. These compliance and performance assessment metrics as defined in DOE G 413.3-3, Safeguards and Security for Program and Project Management, dated 11-15-07, should be established and integrated early in the project planning. Using these metrics on a monthly basis to highlight either the avoidance of an identified risk or the mitigation of a risk in this area of project integration will form a basis for continuous and iterative risk feedback. Further, if a risk in the area of safeguards and security is realized that was not previously captured on the risk register, it should be reviewed and analyzed. This reflective analysis process may be needed to determine if the risk was hidden or latent due to other risks or perhaps other project factors. Lessons learned should be gathered and applied to the project and other similar projects.
Nothing in this section eliminates the risk assessment metrics for safeguards and security that may exist in other safeguards and securities orders or guides.
4.8 Risk Reporting
Although reporting can be either formal or informal, this guide will focus on formal risk reporting, but acknowledges that informal risk reporting occurs in the field through casual conversations and interactions. While there are thresholds for reporting requirements stated in this guide, each project might vary based upon tailoring and risk communication requirements that will be stated in the risk management plan and the risk management communication plan. The use of database technology and its filtering techniques to manage risk register information on a monthly basis will allow the FPD or CPM to filter the risk register list on a monthly basis. Filtering is a technique that makes the number of risks to be reported in any given time period those that the FPD or CPM determines should be the focus of that reporting period. For further information, the user should refer to the specific software package being used.
It should be noted that specific reporting per risk should be provided by the risk owner to the FPD or the CPM.
A risk report should be filed monthly with the FPD and the IPT and integrated with the project’s other metric reporting. Monthly risk reporting has four primary objectives:
• Early identification of emerging risks and/or risks that are being realized.


![Environment, Science and Risk Comm - IAMCR Science...Book of Abstracts: [WG] Environment, Science and Ri[WG] Environment, Science and Risk Communication[WG] Environment, Science and](https://static.fdocuments.in/doc/165x107/5f4f1547aae59d08f13f1807/environment-science-and-risk-comm-iamcr-science-book-of-abstracts-wg-environment.jpg)