RISK DASHBOARD - EIOPA...2019 Q3 =82) Note: Left scale shows the distribution of exposures...
20
EIOPA REGULAR USE EIOPA-BoS/20-274 18 May 2020 RISK DASHBOARD April 2020 1 Risks Level Trend 1. Macro risks Very High 2. Credit risks High 3. Market risks Very high 4. Liquidity and funding risks High 5. Profitability and solvency High 6. Interlinkages and imbalances Medium 7. Insurance (underwriting) risks High 8. Market perceptions Medium Note: Despite the fact that some indicators used in this Risk Dashboard do not capture the latest market development in the context of Covid-19 outbreak, the expected deterioration of the relevant indicators reflecting all available information in a forward looking perspective has been considered in the assigned risk levels. This addresses the current situation of high uncertainty in the insurance market. Key observations: - Risk exposures for the European insurance sector increased as the outbreak of Covid-19 strongly affected the lives of all European citizens with disruptions in all financial sectors and economic activities. Market developments point to a “double-hit” scenario negatively affecting insurers on both asset and liability side as tested in previous stress test exercises. - Macro and market risks indicators deteriorated in March 2020, moving from high to very high level. Overall, GDP forecasts have been revised significantly downwards across countries for 2020. For the first quarter of 2020, EU estimates point to the sharpest decrease of GDP and employment in the last two decades. Inflation forecasts are pointing to downward revisions for the next four quarters. Monetary policy support has been activated by all major central banks. Financial markets have been characterized by sell-off across asset classes, increased volatilities for bond and equity markets, increasing risk premia and flight to quality investment behavior. 1 Reference date for company data is Q4-2019 for quarterly indicators and 2019-YE for annual indicators. The cut-off date for most market indicators is end of March 2020.
Transcript of RISK DASHBOARD - EIOPA...2019 Q3 =82) Note: Left scale shows the distribution of exposures...

EIOPA REGULAR USE EIOPA-BoS/20-274
18 May 2020
RISK DASHBOARD
April 20201
Risks Level Trend
1. Macro risks Very High
2. Credit risks High
3. Market risks Very high
4. Liquidity and funding risks High
5. Profitability and solvency High
6. Interlinkages and imbalances Medium
7. Insurance (underwriting) risks High
8. Market perceptions Medium
Note: Despite the fact that some indicators used in this Risk Dashboard do not capture the latest market
development in the context of Covid-19 outbreak, the expected deterioration of the relevant indicators
reflecting all available information in a forward looking perspective has been considered in the assigned
risk levels. This addresses the current situation of high uncertainty in the insurance market.
Key observations: - Risk exposures for the European insurance sector increased as the outbreak of
Covid-19 strongly affected the lives of all European citizens with disruptions in
all financial sectors and economic activities. Market developments point to a “double-hit” scenario negatively affecting insurers on both asset and liability side as tested in previous stress test exercises.
- Macro and market risks indicators deteriorated in March 2020, moving from high to very high level. Overall, GDP forecasts have been revised significantly
downwards across countries for 2020. For the first quarter of 2020, EU estimates point to the sharpest decrease of GDP and employment in the last two decades. Inflation forecasts are pointing to downward revisions for the
next four quarters. Monetary policy support has been activated by all major central banks. Financial markets have been characterized by sell-off across asset classes, increased volatilities for bond and equity markets, increasing risk
premia and flight to quality investment behavior.
1 Reference date for company data is Q4-2019 for quarterly indicators and 2019-YE for annual indicators. The cut-off date for most market indicators is end of March 2020.

2
- Credit risk has increased across all asset classes, in particular CDS of government bonds, financial and non-financial corporate bonds have
increased sharply. - Liquidity and funding risks raised to high level, as some indicators are expected
to worsen via the latest market developments and the strong hit on economic
activities, which is reducing incomes and could result in decreasing premiums and lowering new business. Moreover, the potential increase in claims and illiquid level of certain assets could put additional strains on the disposable
liquidity of insurers in the medium to long-term horizon. - Profitability and solvency risks increased to high level. A deterioration of
indicators is estimated as a consequence of the recent negative market
developments in the context of Covid-19 outbreak. Furthermore, a decrease in excess of assets over liabilities is expected, driven by drops in asset values and increase in liabilities. On the other hand, an improvement of the SCR ratios for
groups and life undertakings across the whole distribution was observed in Q4-2019.
- Interlinkages and imbalances risks remain stable with an observed fall in the
upper quartile of the derivative holdings distribution, potentially due to a market value reduction.
- Insurance risks raised to high level. The negative market developments may
have negative effects via income reduction (due to the impact of drop in economic activity on new as well as existing business) and potential increase
in claims for specific business lines. - Market perceptions of the insurance sector has deteriorated as well. The EU
insurance sector underperformed the market, both life and non-life businesses
lines, and the median price-to-earnings ratio of insurance groups in the sample decreased since the last assessment. Insurers’ CDS spreads increased, while insurers’ external ratings and rating outlooks do not show sign of deterioration
as of end March 2020.
3
Macro risks2
Level: very high
Trend: increase
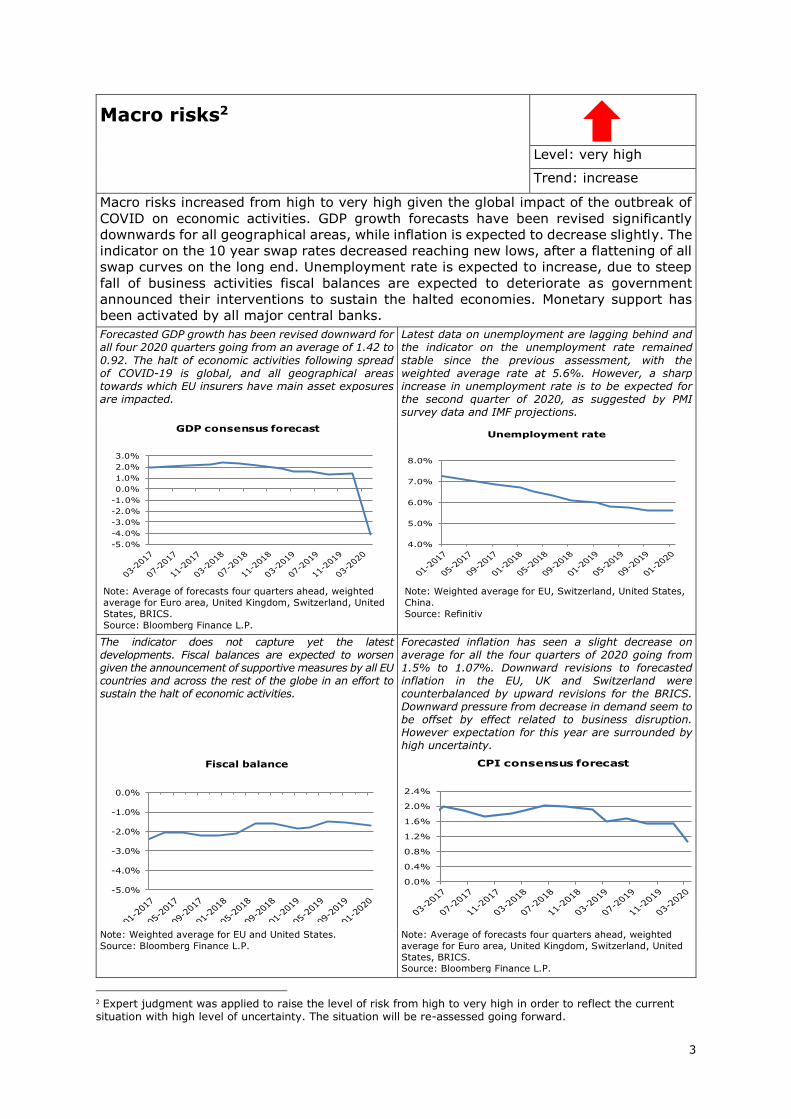
Macro risks increased from high to very high given the global impact of the outbreak of
COVID on economic activities. GDP growth forecasts have been revised significantly
downwards for all geographical areas, while inflation is expected to decrease slightly. The
indicator on the 10 year swap rates decreased reaching new lows, after a flattening of all
swap curves on the long end. Unemployment rate is expected to increase, due to steep
fall of business activities fiscal balances are expected to deteriorate as government
announced their interventions to sustain the halted economies. Monetary support has
been activated by all major central banks.
Forecasted GDP growth has been revised downward for all four 2020 quarters going from an average of 1.42 to
0.92. The halt of economic activities following spread of COVID-19 is global, and all geographical areas towards which EU insurers have main asset exposures are impacted.
Latest data on unemployment are lagging behind and the indicator on the unemployment rate remained
stable since the previous assessment, with the weighted average rate at 5.6%. However, a sharp increase in unemployment rate is to be expected for the second quarter of 2020, as suggested by PMI survey data and IMF projections.
Note: Average of forecasts four quarters ahead, weighted
average for Euro area, United Kingdom, Switzerland, United
States, BRICS.
Source: Bloomberg Finance L.P.
Note: Weighted average for EU, Switzerland, United States,
China.
Source: Refinitiv
The indicator does not capture yet the latest developments. Fiscal balances are expected to worsen given the announcement of supportive measures by all EU countries and across the rest of the globe in an effort to sustain the halt of economic activities.
Forecasted inflation has seen a slight decrease on average for all the four quarters of 2020 going from 1.5% to 1.07%. Downward revisions to forecasted inflation in the EU, UK and Switzerland were counterbalanced by upward revisions for the BRICS. Downward pressure from decrease in demand seem to be offset by effect related to business disruption. However expectation for this year are surrounded by high uncertainty.
Note: Weighted average for EU and United States.
Source: Bloomberg Finance L.P.
Note: Average of forecasts four quarters ahead, weighted
average for Euro area, United Kingdom, Switzerland, United
States, BRICS. Source: Bloomberg Finance L.P.
2 Expert judgment was applied to raise the level of risk from high to very high in order to reflect the current situation with high level of uncertainty. The situation will be re-assessed going forward.
-5.0%
-4.0%
-3.0%
-2.0%
-1.0%
0.0%
1.0%
2.0%
3.0%
GDP consensus forecast
4.0%
5.0%
6.0%
7.0%
8.0%
Unemployment rate
-5.0%
-4.0%
-3.0%
-2.0%
-1.0%
0.0%
Fiscal balance
0.0%
0.4%
0.8%
1.2%
1.6%
2.0%
2.4%
CPI consensus forecast
4
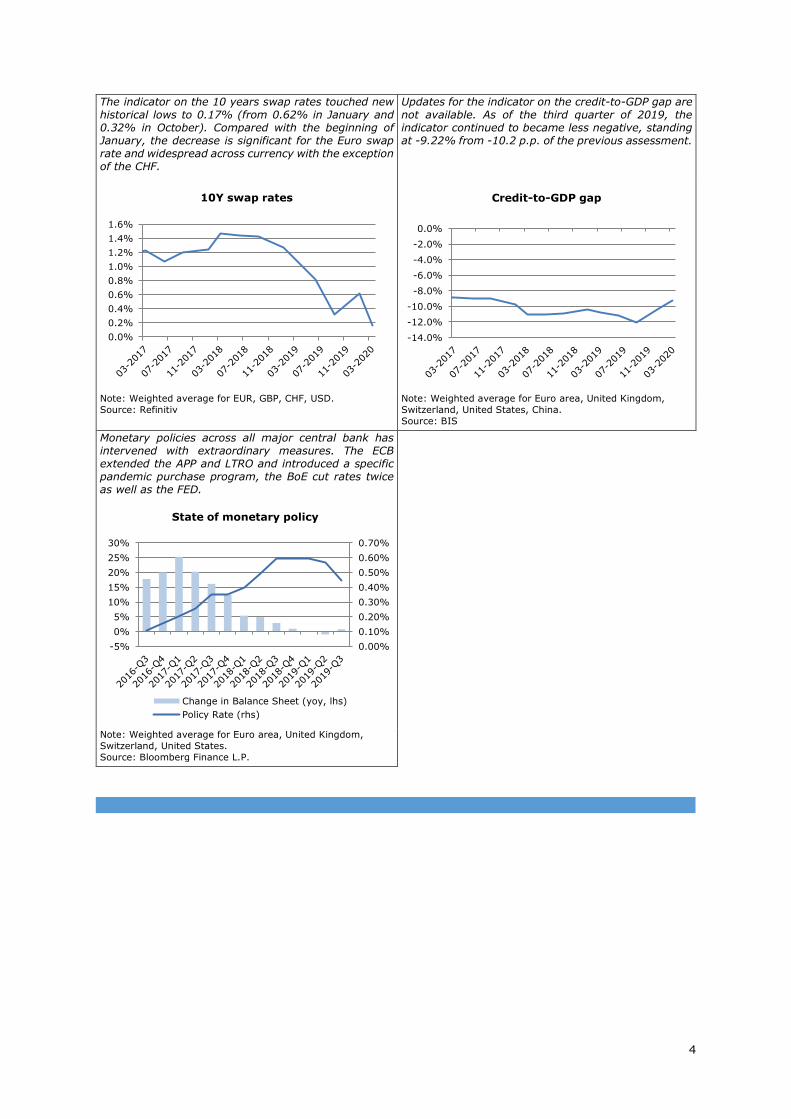
The indicator on the 10 years swap rates touched new historical lows to 0.17% (from 0.62% in January and 0.32% in October). Compared with the beginning of January, the decrease is significant for the Euro swap rate and widespread across currency with the exception of the CHF.
Updates for the indicator on the credit-to-GDP gap are not available. As of the third quarter of 2019, the indicator continued to became less negative, standing at -9.22% from -10.2 p.p. of the previous assessment.
Note: Weighted average for EUR, GBP, CHF, USD.
Source: Refinitiv
Note: Weighted average for Euro area, United Kingdom,
Switzerland, United States, China.
Source: BIS
Monetary policies across all major central bank has intervened with extraordinary measures. The ECB extended the APP and LTRO and introduced a specific pandemic purchase program, the BoE cut rates twice as well as the FED.
Note: Weighted average for Euro area, United Kingdom,
Switzerland, United States.
Source: Bloomberg Finance L.P.
0.0%
0.2%
0.4%
0.6%
0.8%
1.0%
1.2%
1.4%
1.6%
10Y swap rates
-14.0%
-12.0%
-10.0%
-8.0%
-6.0%
-4.0%
-2.0%
0.0%
Credit-to-GDP gap
0.00%
0.10%
0.20%
0.30%
0.40%
0.50%
0.60%
0.70%
-5%
0%
5%
10%
15%
20%
25%
30%
State of monetary policy
Change in Balance Sheet (yoy, lhs)
Policy Rate (rhs)
5
Credit risk3
Level: high
Trend: increase
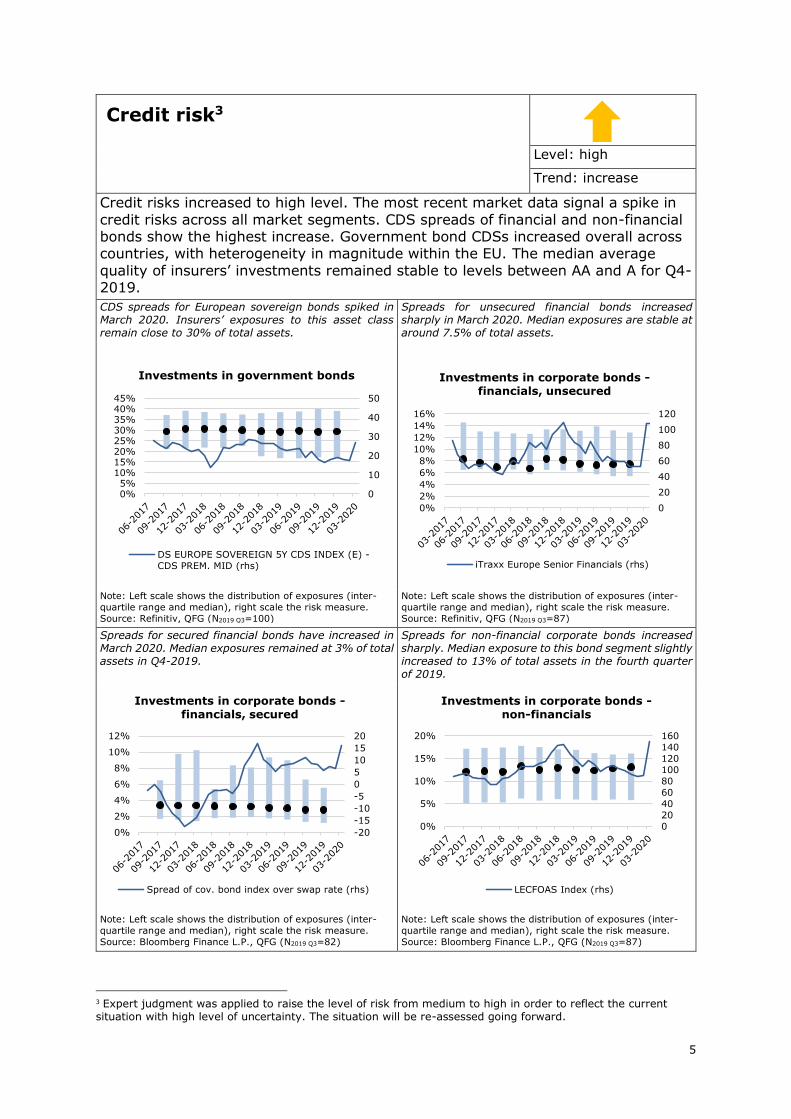
Credit risks increased to high level. The most recent market data signal a spike in
credit risks across all market segments. CDS spreads of financial and non-financial bonds show the highest increase. Government bond CDSs increased overall across countries, with heterogeneity in magnitude within the EU. The median average
quality of insurers’ investments remained stable to levels between AA and A for Q4-2019.
CDS spreads for European sovereign bonds spiked in March 2020. Insurers’ exposures to this asset class remain close to 30% of total assets.
Spreads for unsecured financial bonds increased sharply in March 2020. Median exposures are stable at around 7.5% of total assets.
Note: Left scale shows the distribution of exposures (inter-
quartile range and median), right scale the risk measure.
Source: Refinitiv, QFG (N2019 Q3=100)
Note: Left scale shows the distribution of exposures (inter-
quartile range and median), right scale the risk measure.
Source: Refinitiv, QFG (N2019 Q3=87)
Spreads for secured financial bonds have increased in March 2020. Median exposures remained at 3% of total assets in Q4-2019.
Spreads for non-financial corporate bonds increased sharply. Median exposure to this bond segment slightly increased to 13% of total assets in the fourth quarter of 2019.
Note: Left scale shows the distribution of exposures (inter-
quartile range and median), right scale the risk measure.
Source: Bloomberg Finance L.P., QFG (N2019 Q3=82)
Note: Left scale shows the distribution of exposures (inter-
quartile range and median), right scale the risk measure.
Source: Bloomberg Finance L.P., QFG (N2019 Q3=87)
3 Expert judgment was applied to raise the level of risk from medium to high in order to reflect the current situation with high level of uncertainty. The situation will be re-assessed going forward.
0
10
20
30
40
50
0%5%
10%15%20%25%30%35%40%45%
Investments in government bonds
DS EUROPE SOVEREIGN 5Y CDS INDEX (E) -
CDS PREM. MID (rhs)
0
20
40
60
80
100
120
0%
2%
4%
6%
8%
10%
12%
14%
16%
Investments in corporate bonds -financials, unsecured
iTraxx Europe Senior Financials (rhs)
-20
-15
-10
-5
0
5
10
15
20
0%
2%
4%
6%
8%
10%
12%
Investments in corporate bonds -financials, secured
Spread of cov. bond index over swap rate (rhs)
0
20
40
60
80
100
120
140
160
0%
5%
10%
15%
20%
Investments in corporate bonds -
non-financials
LECFOAS Index (rhs)

6
Median exposures to loans and mortgages is at 0.6% of total assets. A deterioration of household debt-to-income ratio is shown for the third and fourth quarter of 2019. The leverage ratio (not shown) remained broadly stable.
The median average credit quality step remained stable (at 1.82 in Q4-2019), corresponding to an S&P rating between AA and A.
Note: Left scale shows the distribution of exposures (inter-quartile range and median), right scale the risk measure
(weighted average of EA and UK).
Source: QFG (N2019 Q3=100), ECB
Note: Distribution of indicator (interquartile range, median). Source: QFG (N2019 Q3=93)
The distribution of the share of below investment grade assets (with a credit quality step higher than 3) in insurers’ portfolios has slightly moved downwards, with the median ratio at 1.1% in Q4 (1.2% in Q3).
The correlation between the debt-service ratio of non-financial corporations and corporate bond spreads was close to zero in Q2-2019, reducing concerns of potential risk mispricing. The debt service
ratio increased for all the countries considered.
Note: Distribution of indicator (interquartile range, median).
Includes both internal and external credit ratings. Time
series revised - denominator now excludes assets for which no rating shall be reported.
Source: QFG (N2019 Q3=99)
Note: Correlation between the debt-service ratio of non-
financial corporates and the spread of non-financial
corporate bonds based on a 12-quarter rolling window. Source: BIS, Bloomberg Finance L.P.
0.0
0.5
1.0
1.5
2.0
2.5
Average rating of investments
(credit quality step)
0.00%
0.50%
1.00%
1.50%
2.00%
2.50%
3.00%
Share of below investment grade assets (credit quality step > 3) -0.8
-0.6
-0.4
-0.2
0.025
30
35
40
45
Fundamental credit risk
Debt-service ratio NFCs (lhs)
Correlation DSR - corp bond spreads (rhs)
7
Market risks
Level: very high
Trend: increase
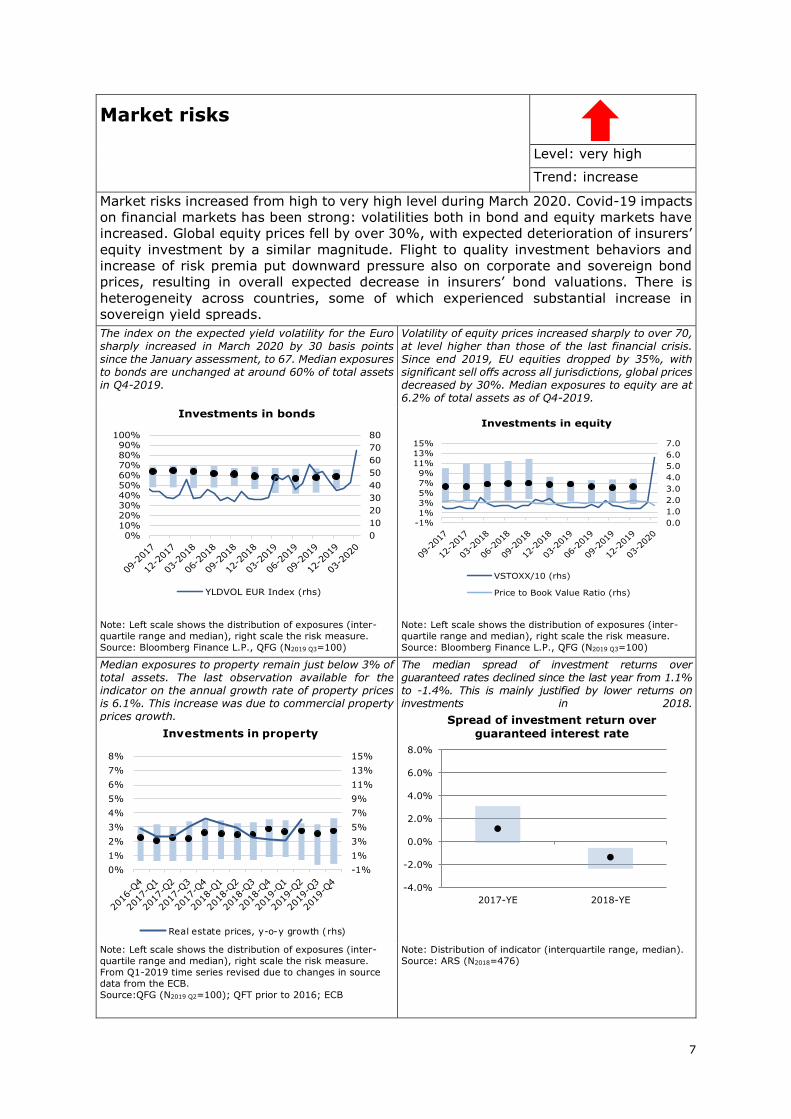
Market risks increased from high to very high level during March 2020. Covid-19 impacts
on financial markets has been strong: volatilities both in bond and equity markets have
increased. Global equity prices fell by over 30%, with expected deterioration of insurers’
equity investment by a similar magnitude. Flight to quality investment behaviors and
increase of risk premia put downward pressure also on corporate and sovereign bond
prices, resulting in overall expected decrease in insurers’ bond valuations. There is
heterogeneity across countries, some of which experienced substantial increase in
sovereign yield spreads.
The index on the expected yield volatility for the Euro sharply increased in March 2020 by 30 basis points since the January assessment, to 67. Median exposures to bonds are unchanged at around 60% of total assets in Q4-2019.
Volatility of equity prices increased sharply to over 70, at level higher than those of the last financial crisis. Since end 2019, EU equities dropped by 35%, with significant sell offs across all jurisdictions, global prices decreased by 30%. Median exposures to equity are at 6.2% of total assets as of Q4-2019.
Note: Left scale shows the distribution of exposures (inter-
quartile range and median), right scale the risk measure.
Source: Bloomberg Finance L.P., QFG (N2019 Q3=100)
Note: Left scale shows the distribution of exposures (inter-
quartile range and median), right scale the risk measure.
Source: Bloomberg Finance L.P., QFG (N2019 Q3=100)
Median exposures to property remain just below 3% of total assets. The last observation available for the indicator on the annual growth rate of property prices is 6.1%. This increase was due to commercial property prices growth.
The median spread of investment returns over guaranteed rates declined since the last year from 1.1% to -1.4%. This is mainly justified by lower returns on investments in 2018.
Note: Left scale shows the distribution of exposures (inter-
quartile range and median), right scale the risk measure.
From Q1-2019 time series revised due to changes in source
data from the ECB.
Source:QFG (N2019 Q2=100); QFT prior to 2016; ECB
Note: Distribution of indicator (interquartile range, median).
Source: ARS (N2018=476)
0
10
20
30
40
50
60
70
80
0%10%20%30%40%50%60%70%80%90%
100%
Investments in bonds
YLDVOL EUR Index (rhs)
0.0
1.0
2.0
3.0
4.0
5.0
6.0
7.0
-1%
1%
3%
5%
7%
9%
11%
13%
15%
Investments in equity
VSTOXX/10 (rhs)
Price to Book Value Ratio (rhs)
-1%
1%
3%
5%
7%
9%
11%
13%
15%
0%
1%
2%
3%
4%
5%
6%
7%
8%
Investments in property
Real estate prices, y-o-y growth (rhs)
-4.0%
-2.0%
0.0%
2.0%
4.0%
6.0%
8.0%
2017-YE 2018-YE
Spread of investment return over guaranteed interest rate

8
The median for the indicator on the concentration of assets slightly decreased, standing at 38.6% in Q4-2019 (-0.4 p.p. in the previous quarter).
The distribution of the duration mismatch indicator remained quite stable from 2017 to 2018, with the median mismatch standing at around -5 years. Duration mismatch is based on the modified duration of the fixed income assets and of the liabilities. Duration of the liabilities does not take into account optionalities such as future profit participation. This indicator was included for the first time in the July 2019 Risk Dashboard and is based on year end 2016-2018 data.
Note: Herfindal Hirshman index computed on six balance
sheet asset classes (government bonds, corporate bonds,
equities, properties, cash and cash equivalents and loans
and mortgages). Distribution of indicator (interquartile
range, median).
Source: QFG (N2019 Q3=102)
Note: Distribution of indicator (interquartile range, median).
Source: Assets QFG (N2018 Q4=92); Liabilities AFG (N2018=92)
25%
30%
35%
40%
45%
50%
Concentration of assets
-7.0
-6.0
-5.0
-4.0
-3.0
-2.0
-1.0
0.0
2016-YE 2017-YE 2018-YE
Duration mismatch (years)
9
4 Expert judgment was applied to raise the level of risk from medium to high in order to reflect the current situation with high level of uncertainty. The situation will be re-assessed going forward.
Liquidity and funding risks4
Level: high
Trend: increase
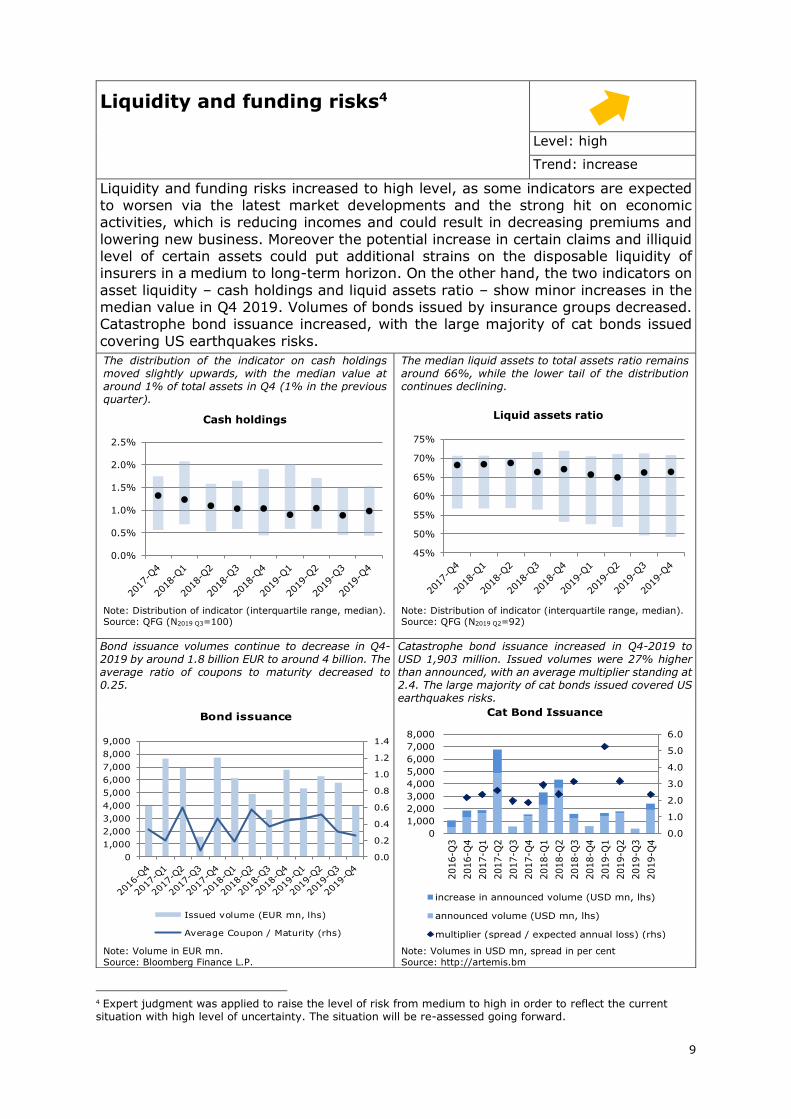
Liquidity and funding risks increased to high level, as some indicators are expected to worsen via the latest market developments and the strong hit on economic activities, which is reducing incomes and could result in decreasing premiums and
lowering new business. Moreover the potential increase in certain claims and illiquid level of certain assets could put additional strains on the disposable liquidity of insurers in a medium to long-term horizon. On the other hand, the two indicators on
asset liquidity – cash holdings and liquid assets ratio – show minor increases in the median value in Q4 2019. Volumes of bonds issued by insurance groups decreased. Catastrophe bond issuance increased, with the large majority of cat bonds issued
covering US earthquakes risks.
The distribution of the indicator on cash holdings moved slightly upwards, with the median value at around 1% of total assets in Q4 (1% in the previous quarter).
The median liquid assets to total assets ratio remains around 66%, while the lower tail of the distribution continues declining.
Note: Distribution of indicator (interquartile range, median). Source: QFG (N2019 Q3=100)
Note: Distribution of indicator (interquartile range, median). Source: QFG (N2019 Q2=92)
Bond issuance volumes continue to decrease in Q4-2019 by around 1.8 billion EUR to around 4 billion. The average ratio of coupons to maturity decreased to 0.25.
Catastrophe bond issuance increased in Q4-2019 to USD 1,903 million. Issued volumes were 27% higher than announced, with an average multiplier standing at 2.4. The large majority of cat bonds issued covered US earthquakes risks.
Note: Volume in EUR mn. Source: Bloomberg Finance L.P.
Note: Volumes in USD mn, spread in per cent Source: http://artemis.bm
0.0%
0.5%
1.0%
1.5%
2.0%
2.5%
Cash holdings
45%
50%
55%
60%
65%
70%
75%
Liquid assets ratio
0.0
0.2
0.4
0.6
0.8
1.0
1.2
1.4
0
1,000
2,000
3,000
4,000
5,000
6,000
7,000
8,000
9,000
Bond issuance
Issued volume (EUR mn, lhs)
Average Coupon / Maturity (rhs)
0.0
1.0
2.0
3.0
4.0
5.0
6.0
0
1,000
2,000
3,000
4,000
5,000
6,000
7,000
8,000
2016-Q
3
2016-Q
4
2017-Q
1
2017-Q
2
2017-Q
3
2017-Q
4
2018-Q
1
2018-Q
2
2018-Q
3
2018-Q
4
2019-Q
1
2019-Q
2
2019-Q
3
2019-Q
4
Cat Bond Issuance
increase in announced volume (USD mn, lhs)
announced volume (USD mn, lhs)
multiplier (spread / expected annual loss) (rhs)

10
Lapse rates in life business has increased across the whole distribution in Q4-2019. Median lapse rates shifted upwards to 3% (+0.4 p.p.). While not yet captured in the actual figures, lapse rate is expected to deteriorate further due to the global impact of the outbreak of COVID-19.
Note: Distribution of indicator (interquartile range, median).
Source: QFG (N2018 Q4=88)
0.0%
1.0%
2.0%
3.0%
4.0%
5.0%
6.0%
Lapse rate (life)
11
Profitability and solvency5
Level: high
Trend: increase
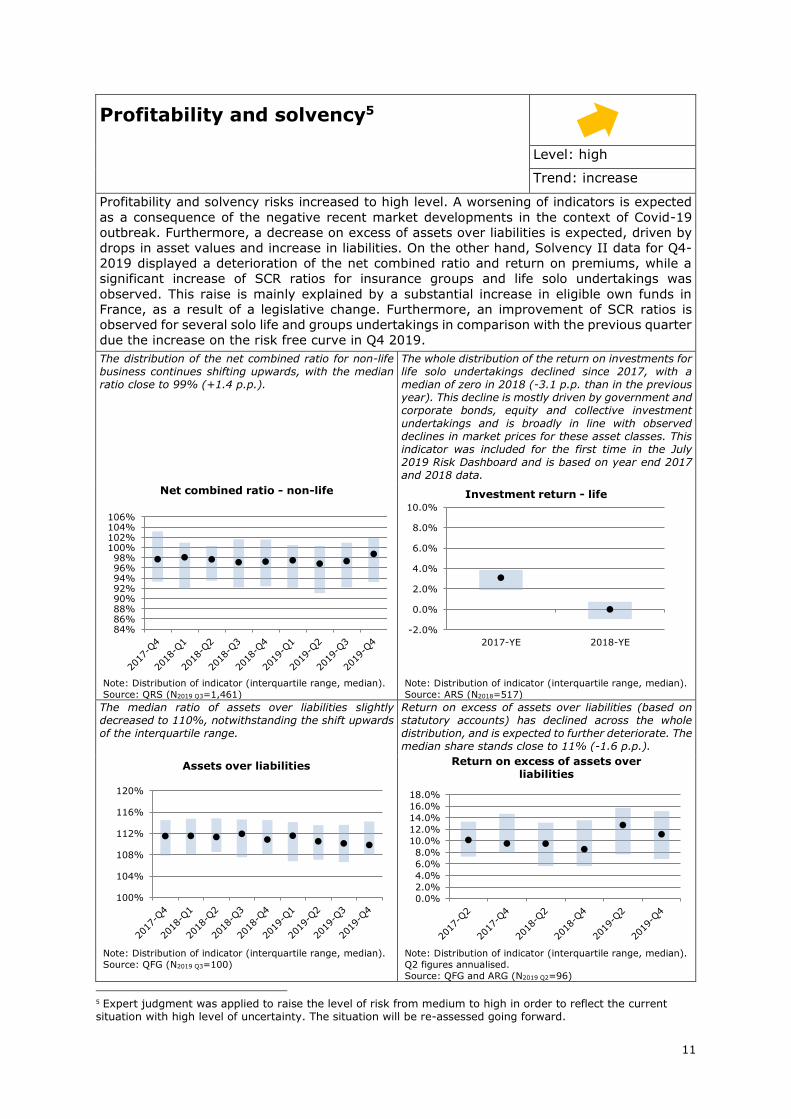
Profitability and solvency risks increased to high level. A worsening of indicators is expected
as a consequence of the negative recent market developments in the context of Covid-19
outbreak. Furthermore, a decrease on excess of assets over liabilities is expected, driven by
drops in asset values and increase in liabilities. On the other hand, Solvency II data for Q4-
2019 displayed a deterioration of the net combined ratio and return on premiums, while a
significant increase of SCR ratios for insurance groups and life solo undertakings was
observed. This raise is mainly explained by a substantial increase in eligible own funds in
France, as a result of a legislative change. Furthermore, an improvement of SCR ratios is
observed for several solo life and groups undertakings in comparison with the previous quarter
due the increase on the risk free curve in Q4 2019.
The distribution of the net combined ratio for non-life business continues shifting upwards, with the median ratio close to 99% (+1.4 p.p.).
The whole distribution of the return on investments for life solo undertakings declined since 2017, with a median of zero in 2018 (-3.1 p.p. than in the previous year). This decline is mostly driven by government and corporate bonds, equity and collective investment
undertakings and is broadly in line with observed declines in market prices for these asset classes. This indicator was included for the first time in the July 2019 Risk Dashboard and is based on year end 2017 and 2018 data.
Note: Distribution of indicator (interquartile range, median).
Source: QRS (N2019 Q3=1,461)
Note: Distribution of indicator (interquartile range, median).
Source: ARS (N2018=517)
The median ratio of assets over liabilities slightly decreased to 110%, notwithstanding the shift upwards of the interquartile range.
Return on excess of assets over liabilities (based on statutory accounts) has declined across the whole distribution, and is expected to further deteriorate. The median share stands close to 11% (-1.6 p.p.).
Note: Distribution of indicator (interquartile range, median).
Source: QFG (N2019 Q3=100)
Note: Distribution of indicator (interquartile range, median).
Q2 figures annualised.
Source: QFG and ARG (N2019 Q2=96)
5 Expert judgment was applied to raise the level of risk from medium to high in order to reflect the current situation with high level of uncertainty. The situation will be re-assessed going forward.
84%86%88%90%92%94%96%98%
100%102%104%106%
Net combined ratio - non-life
-2.0%
0.0%
2.0%
4.0%
6.0%
8.0%
10.0%
2017-YE 2018-YE
Investment return - life
100%
104%
108%
112%
116%
120%
Assets over liabilities
0.0%
2.0%
4.0%
6.0%
8.0%
10.0%
12.0%
14.0%
16.0%
18.0%
Return on excess of assets over liabilities

12
The median return on assets (based on statutory accounts) remained overall stable in comparison with the previous quarter standing close to 0.6%.
The median return to premiums deteriorated in Q4-2019 when compared to Q2-2019, by roughly 1 p.p. to 4.1%, along with the lower tail of the distribution.
Note: Distribution of indicator (interquartile range, median).
Q2 figures annualised.
Source: QFG and ARG (N2019 Q2=91)
Note: Distribution of indicator (interquartile range, median).
Source: “Total” QFG (N2019 Q2=98)
The whole distribution of SCR ratios for groups moved upwards, with its median value close to 212% (+25
p.p.). This development is mainly driven by the significant increase in eligible own funds in France, due
to the implementation of a law adopted on December 2019, that allows integrating part of the reserves for profit sharing in the eligible own funds, as surplus funds. The significant weight of French companies in the distribution triggers the increase. Moreover, a raise on the risk free curve in Q4 2019 occasioned an improvement of SCR ratios in comparison with the previous quarter for several life solo undertakings.
The median exposure to the SCR ratio for non-life solo undertakings slightly deteriorated, standing at 200% in Q4.
Note: Distribution of indicator (interquartile range, median).
Source: “Total” QFG (N2019 Q3=100)
Note: Distribution of indicator (interquartile range, median).
Source: QRS (N2019 Q3=1,255)
0.0%0.1%0.2%0.3%0.4%0.5%0.6%0.7%0.8%0.9%1.0%
Return on assets
0.0%
1.0%
2.0%
3.0%
4.0%
5.0%
6.0%
7.0%
Return to premiums
100%
120%
140%
160%
180%
200%
220%
240%
SCR ratio - groups
100%
150%
200%
250%
300%
350%
SCR ratio - non-life

13
The distribution of SCR ratios for life solo undertakings shifted upwards, with the median increasing from 160% to 192% and the upper quartile from 219 to 278%. Similarly to the groups SCR ratio, the increase is mainly driven by the legislative change adopted by France and the high weight of French companies in the distribution. Furthermore, an improvement of SCR ratios compared to the previous quarter was observed for several groups undertakings due to the increase on the risk free curve in Q4 2019.
The median SCR ratio of life solo companies excluding the impact of transitional measures is at 163.7% in 2018 (+4 p.p. than in 2017). The indicator remains above 100% for most life insurers in the sample.
Note: Distribution of indicator (interquartile range, median).
Source: QRS (N2019 Q3=470)
Note: Distribution of indicator (interquartile range, median).
Source: ARS (N2018=285)
Tier 1 capital in total own funds slightly shifted upwards across the whole distribution, with a median share close to 87%.
Expected profit in future premiums as a percentage of total eligible own funds to meet the SCR increased across the whole distribution, with the median at 3.3% (+1.5 p.p. than in Q3).
Note: Distribution of indicator (interquartile range, median). Source: QFG (N2019 Q3=101)
Note: Distribution of indicator (interquartile range, median). Source: QRS (N2019 Q3=2,077)
100%120%140%160%180%200%220%240%260%280%300%
SCR ratio - life
100%
150%
200%
250%
300%
350%
Solvency ratio - life (without transitionals)
70%
75%
80%
85%
90%
95%
100%
Tier 1 own fundsto total own funds
0%
2%
4%
6%
8%
10%
12%
14%
16%
Expected Profit in Future Premiums

14
Interlinkages & imbalances
Level: medium
Trend: constant
Interlinkages and imbalances risks remain at medium level in Q4-2019. A drop in the
upper quartile of the derivative holdings distribution is observed in comparison with the previous quarter, potentially driven by a market value reduction. Moreover, investments in banks were also reduced. Other indicators in this risk category
remained broadly stable since the last assessment.
The median exposure to investments in banks as a share of total assets slightly decreased in Q4, with the median ratio standing at 11.5%.
The median of investment exposures to other insurers remained broadly stable at 1.3%, with a slight deterioration of the upper quartile in Q4.
Note: Distribution of indicator (interquartile range, median).
Banks comprise all activities identified with NACE code
K.64.1.9.
Source: QFG (N2019 Q3=98)
Note: Distribution of indicator (interquartile range, median).
Insurances comprise all activities identified with NACE code
K65, excluding K65.3.
Source: QFG (N2019 Q3=96)
The median exposure to investments in other financial institutions has slighly decreased, standing at 19% in Q4 (-0.9 p.p. than in Q3).
The distribution of domestic sovereign debt shifted downwards in Q4, with a median share close to 11% (-1.3 p.p. than in Q3).
Note: Distribution of indicator (interquartile range, median).
Other financial institutions comprise all activities identified
with NACE codes K66, K65.3 and K64 excluding K64.1.9.
Source: QFG (N2019 Q2=98)
Note: Distribution of indicator (interquartile range, median).
Source: QRS (N2019 Q3=1,304)
0%
5%
10%
15%
20%
25%
Investments in banks
0%
1%
2%
3%
4%
5%
Investments in insurances
0%
5%
10%
15%
20%
25%
30%
35%
40%
Investments in other financial institutions
0%
5%
10%
15%
20%
25%
30%
Investment in domestic sovereign debt

15
The median share of premiums ceded to reinsurers remained stable compared to the previous quarter, standing at 5.7%.
The median exposure to derivatives continues at 0.5% of total assets. However the upper quartile decreased by 1.7 p.p. to 1.4% of total assets. In the same quarter, reported Solvency II values for interest rate swaps has decreased, potentially driven by a market value reduction. Nevertheless the notional amount of interest rate swaps continued increasing in Q4 2019. This could be linked to duration hedging strategies by insurers amid the low interest rate environment.
Note: Distribution of indicator (interquartile range, median).
Source: QFG (N2019 Q3=96)
Note: Distribution of indicator (interquartile range, median).
Source: QFG (N2019 Q3=100)
The indicator on insurers “non-insurance” liabilities remains almost unchanged compared to the previous quarter, with a median standing at 4.4%.
Note: Distribution of indicator (interquartile range, median).
Source: QFG (N2019 Q3=100)
0%
2%
4%
6%
8%
10%
12%
14%
Reinsurance part of premium
0.0%
0.5%
1.0%
1.5%
2.0%
2.5%
3.0%
3.5%
Derivative holdings
0.0%
1.0%
2.0%
3.0%
4.0%
5.0%
6.0%
7.0%
8.0%
9.0%
10.0%
Insurers "non-insurance" liabilities
16
Insurance (underwriting) risks6
Level: high
Trend: increase
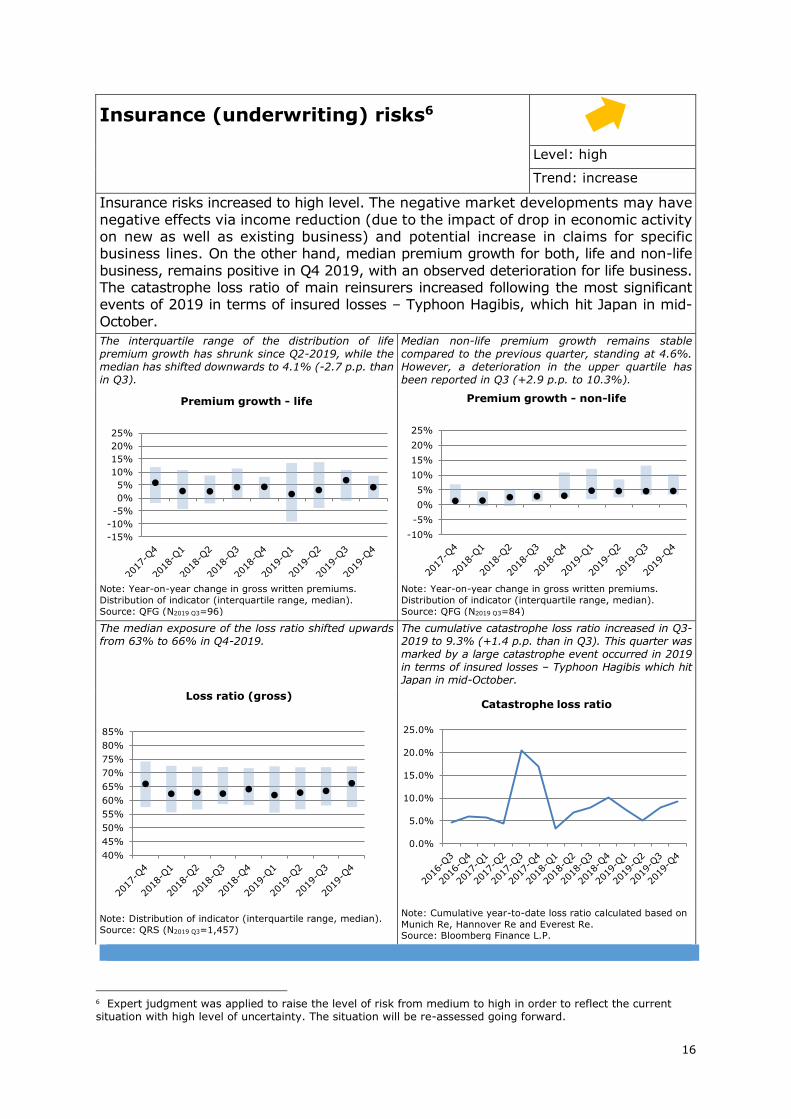
Insurance risks increased to high level. The negative market developments may have
negative effects via income reduction (due to the impact of drop in economic activity on new as well as existing business) and potential increase in claims for specific business lines. On the other hand, median premium growth for both, life and non-life
business, remains positive in Q4 2019, with an observed deterioration for life business. The catastrophe loss ratio of main reinsurers increased following the most significant events of 2019 in terms of insured losses – Typhoon Hagibis, which hit Japan in mid-
October.
The interquartile range of the distribution of life premium growth has shrunk since Q2-2019, while the median has shifted downwards to 4.1% (-2.7 p.p. than in Q3).
Median non-life premium growth remains stable compared to the previous quarter, standing at 4.6%. However, a deterioration in the upper quartile has been reported in Q3 (+2.9 p.p. to 10.3%).
Note: Year-on-year change in gross written premiums.
Distribution of indicator (interquartile range, median).
Source: QFG (N2019 Q3=96)
Note: Year-on-year change in gross written premiums.
Distribution of indicator (interquartile range, median).
Source: QFG (N2019 Q3=84)
The median exposure of the loss ratio shifted upwards from 63% to 66% in Q4-2019.
The cumulative catastrophe loss ratio increased in Q3-2019 to 9.3% (+1.4 p.p. than in Q3). This quarter was marked by a large catastrophe event occurred in 2019 in terms of insured losses – Typhoon Hagibis which hit Japan in mid-October.
Note: Distribution of indicator (interquartile range, median).
Source: QRS (N2019 Q3=1,457)
Note: Cumulative year-to-date loss ratio calculated based on
Munich Re, Hannover Re and Everest Re. Source: Bloomberg Finance L.P.
6 Expert judgment was applied to raise the level of risk from medium to high in order to reflect the current situation with high level of uncertainty. The situation will be re-assessed going forward.
-15%
-10%
-5%
0%
5%
10%
15%
20%
25%
Premium growth - life
-10%
-5%
0%
5%
10%
15%
20%
25%
Premium growth - non-life
40%
45%
50%
55%
60%
65%
70%
75%
80%
85%
Loss ratio (gross)
0.0%
5.0%
10.0%
15.0%
20.0%
25.0%
Catastrophe loss ratio
17
Market perceptions
Level: medium
Trend: increase
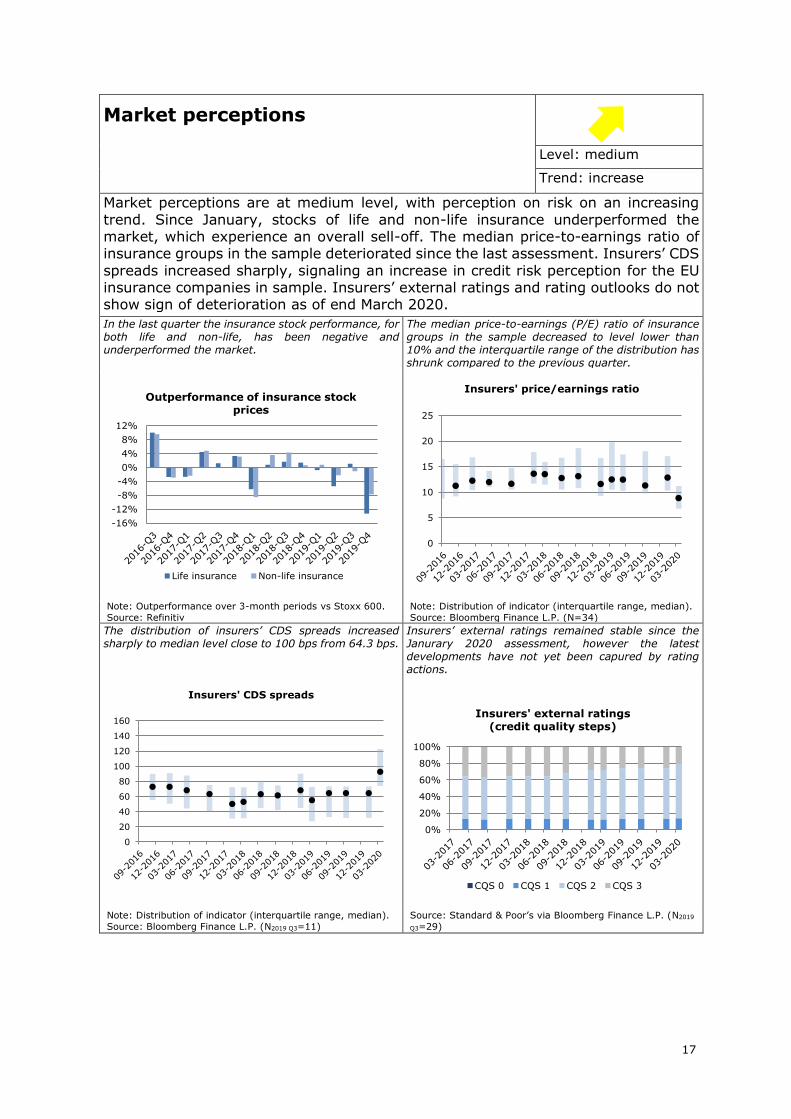
Market perceptions are at medium level, with perception on risk on an increasing
trend. Since January, stocks of life and non-life insurance underperformed the market, which experience an overall sell-off. The median price-to-earnings ratio of insurance groups in the sample deteriorated since the last assessment. Insurers’ CDS
spreads increased sharply, signaling an increase in credit risk perception for the EU insurance companies in sample. Insurers’ external ratings and rating outlooks do not show sign of deterioration as of end March 2020.
In the last quarter the insurance stock performance, for both life and non-life, has been negative and underperformed the market.
The median price-to-earnings (P/E) ratio of insurance groups in the sample decreased to level lower than 10% and the interquartile range of the distribution has shrunk compared to the previous quarter.
Note: Outperformance over 3-month periods vs Stoxx 600.
Source: Refinitiv
Note: Distribution of indicator (interquartile range, median).
Source: Bloomberg Finance L.P. (N=34)
The distribution of insurers’ CDS spreads increased sharply to median level close to 100 bps from 64.3 bps.
Insurers’ external ratings remained stable since the Janurary 2020 assessment, however the latest developments have not yet been capured by rating actions.
Note: Distribution of indicator (interquartile range, median).
Source: Bloomberg Finance L.P. (N2019 Q3=11)
Source: Standard & Poor’s via Bloomberg Finance L.P. (N2019
Q3=29)
-16%
-12%
-8%
-4%
0%
4%
8%
12%
Outperformance of insurance stock prices
Life insurance Non-life insurance
0
5
10
15
20
25
Insurers' price/earnings ratio
0
20
40
60
80
100
120
140
160
Insurers' CDS spreads
0%
20%
40%
60%
80%
100%
Insurers' external ratings (credit quality steps)
CQS 0 CQS 1 CQS 2 CQS 3
18
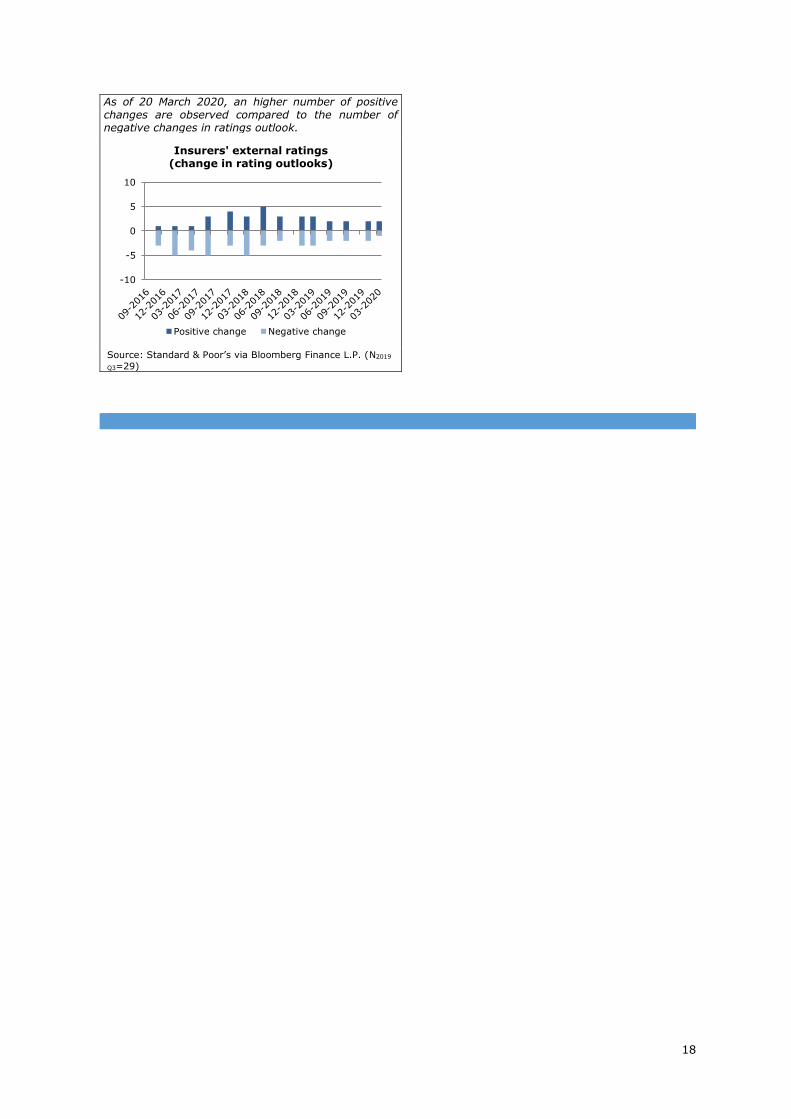
As of 20 March 2020, an higher number of positive changes are observed compared to the number of negative changes in ratings outlook.
Source: Standard & Poor’s via Bloomberg Finance L.P. (N2019
Q3=29)
-10
-5
0
5
10
Insurers' external ratings(change in rating outlooks)
Positive change Negative change
19
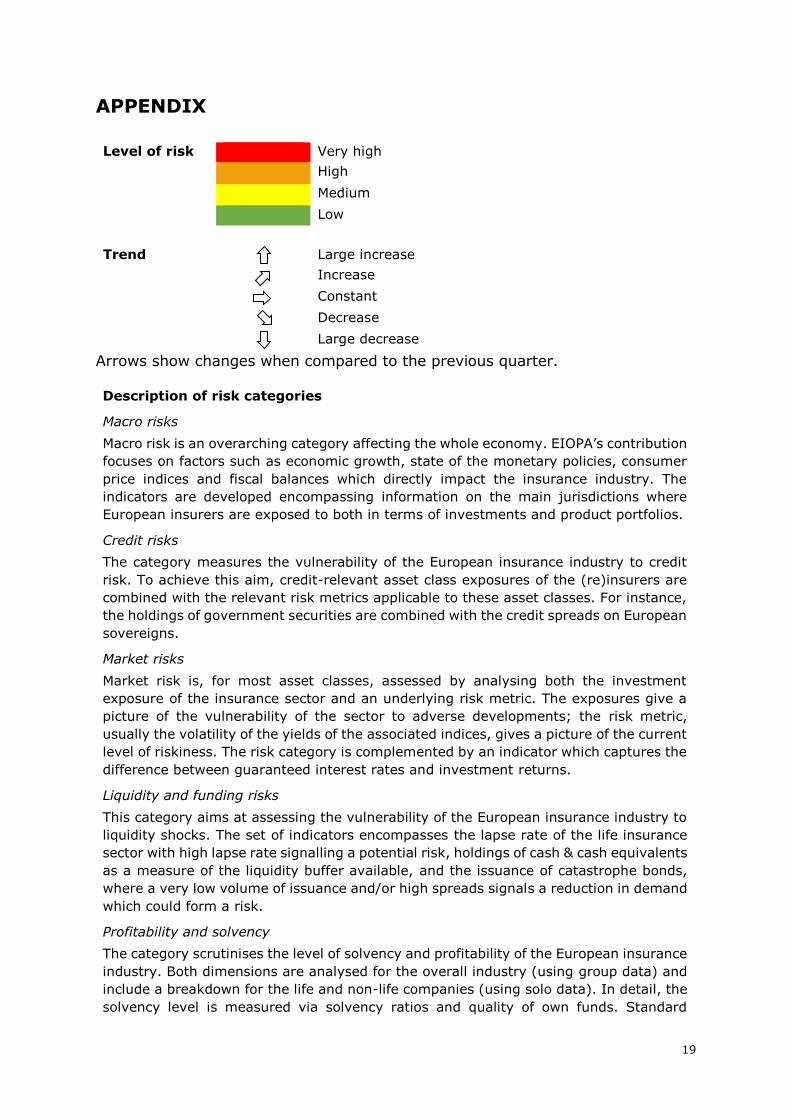
APPENDIX
Level of risk Very high
High
Medium
Low
Trend Large increase
Increase
Constant
Decrease
Large decrease
Arrows show changes when compared to the previous quarter.
Description of risk categories
Macro risks
Macro risk is an overarching category affecting the whole economy. EIOPA’s contribution
focuses on factors such as economic growth, state of the monetary policies, consumer
price indices and fiscal balances which directly impact the insurance industry. The
indicators are developed encompassing information on the main jurisdictions where
European insurers are exposed to both in terms of investments and product portfolios.
Credit risks
The category measures the vulnerability of the European insurance industry to credit
risk. To achieve this aim, credit-relevant asset class exposures of the (re)insurers are
combined with the relevant risk metrics applicable to these asset classes. For instance,
the holdings of government securities are combined with the credit spreads on European
sovereigns.
Market risks
Market risk is, for most asset classes, assessed by analysing both the investment
exposure of the insurance sector and an underlying risk metric. The exposures give a
picture of the vulnerability of the sector to adverse developments; the risk metric,
usually the volatility of the yields of the associated indices, gives a picture of the current
level of riskiness. The risk category is complemented by an indicator which captures the
difference between guaranteed interest rates and investment returns.
Liquidity and funding risks
This category aims at assessing the vulnerability of the European insurance industry to
liquidity shocks. The set of indicators encompasses the lapse rate of the life insurance
sector with high lapse rate signalling a potential risk, holdings of cash & cash equivalents
as a measure of the liquidity buffer available, and the issuance of catastrophe bonds,
where a very low volume of issuance and/or high spreads signals a reduction in demand
which could form a risk.
Profitability and solvency
The category scrutinises the level of solvency and profitability of the European insurance
industry. Both dimensions are analysed for the overall industry (using group data) and
include a breakdown for the life and non-life companies (using solo data). In detail, the
solvency level is measured via solvency ratios and quality of own funds. Standard
20
profitability measures for the whole industry are complemented by indicators such as
the combined ratio and the return on investments specifically applied to the non-life and
life industry respectively.
Interlinkages and imbalances
Under this section various kinds of interlinkages are assessed, both within the insurance
sector, namely between primary insurers and reinsurers, between the insurance sector
and the banking sector, as well as interlinkages created via derivative holdings.
Exposure towards domestic sovereign debt is included as well.
Insurance (underwriting) risks
As indicators for insurance risks gross written premiums of both life and non-life
business are an important input. Both significant expansion and contraction are taken
as indicators of risks in the sector; the former due to concerns over sustainability and
the latter as an indicator of widespread contraction of insurance markets. Information
on claims and insurance losses due to natural catastrophes also contribute to this risk
category.
Market perception
This category encompasses the financial markets’ perception of the healthiness and
profitability of the European insurance sector. For this purpose, relative stock market
performances of European insurance indices against the total market are assessed, as
well as fundamental valuations of insurance stocks (price/earnings ratio), CDS spreads
and external ratings/rating outlooks.
Abbreviations
AFG Annual Financial Stability Reporting for Groups
ARS Annual Prudential Reporting for Solo Entities
QFG Quarterly Financial Stability Reporting for Groups
QRS Quarterly Prudential Reporting for Solo Entities
QFT Quarterly Fast Track Reporting (pre-Solvency II, for around 32 large
insurance groups on a best effort basis)
Notes
- Sample size for the different indicators may vary according to availability and
consistency of the reported information.
- Vertical dashed lines where displayed in the graphs that signal the structural
change in the series driven by the transition from Solvency I to Solvency II
reporting.
EIOPA Risk Dashboard April 2020 © European Insurance and Occupational Pensions Authority (EIOPA), Frankfurt, 2020. All rights reserved. This report provides an interim risk-update, updating previous Risk Dashboards. Legal basis of this report is Regulation (EU) No 1094/2010 of the European Parliament and of the Council of 24 November 2010 establishing a European Supervisory Authority (European Insurance and Occupational Pensions Authority), and in particular Article 32 (Assessment of market developments) thereof. The charts and analyses found in this report are occasionally based on third party material. EIOPA is not responsible for the accuracy or completeness of such data. Third party material is protected by intellectual property rights such as copyright, tradename or similar rights, and may be subject to other terms and conditions. Therefore, reproduction and further distribution of such material is subject to the permission of that third party.