Risk Compensation and the management of road safety 22 February 2005 Institute of Transport and...
34
Risk Compensation and the management of road safety 22 February 2005 Institute of Transport and logistics University of Sydney [email protected]
-
date post
19-Dec-2015 -
Category
Documents
-
view
215 -
download
0
Transcript of Risk Compensation and the management of road safety 22 February 2005 Institute of Transport and...

Risk Compensationand the management of road safety
22 February 2005Institute of Transport and logistics
University of Sydney

Managing risk: it’s not rocket science
it’s more complicated

Three kinds of Risk
Perceivedthroughscience
Perceiveddirectly
Virtualrisk
Perceivedthroughscience
Perceiveddirectly
Virtualrisk
Perceivedthroughscience
Perceiveddirectly
Virtualrisk
e.g. climbing a tree, riding a bike, driving, car
e.g. cholera: needa microscope tosee it and a scientific training tounderstand
Scientists don’t know or cannotagree: e.g. BSE/vCJD, global
warming, low-level radiation, pesticide residues, HRT, mobile phones,passive smoking,stock market ….

A successful risk manager
Risk management is
• a balancing act
• instinctive
• intuitive
• modified by culture

Perception of risks
Accidents
Propensity totake risks
Balancingbehaviour
Rewards
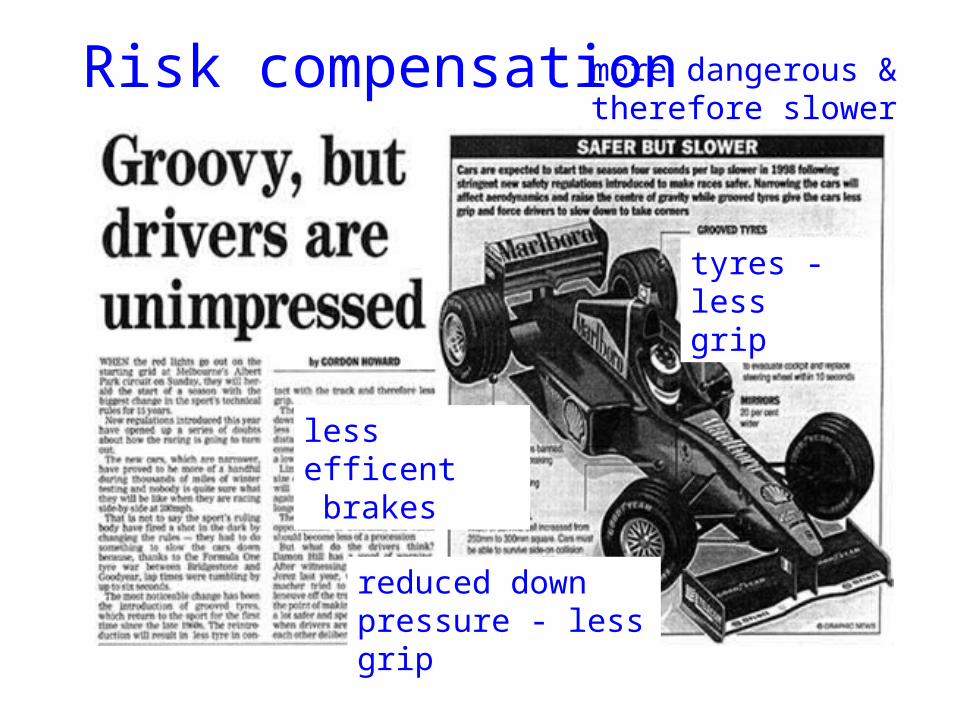
less efficent brakes
tyres - lessgrip
reduced downpressure - less grip
more dangerous & therefore slower
Risk compensation


Perception of risks
Accidents
Propensity totake risks
Balancingbehaviour
Rewards
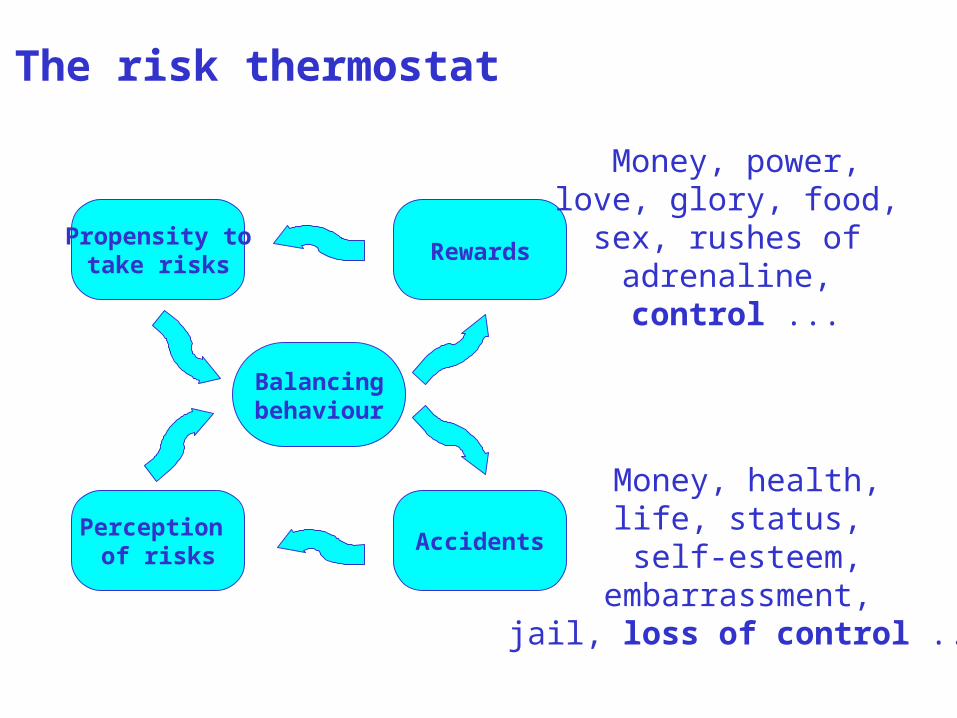
The risk thermostat
Money, power,love, glory, food,
sex, rushes of adrenaline, control ...
Money, health,life, status, self-esteem,
embarrassment, jail, loss of control ...
Risk perceived through science
• “a Richter scale for risk would involve taking a series of common situations of varying risk to which people can relate” (DTI)
• “a simple measure of risk to that people can use as a basis for decision making” (RSS)

Table 1. Risk of an individual dying (D) in any one year or developing an adverseresponse (A)Term used Risk estimate ExampleHigh Greater than 1:100 A. Transmission to susceptible household contacts
of measles and chickenpoxA. Transmission of HIV from Mother to child
(Europe)A. Gastro-intestinal effects of antibiotics
1:1 - 1:2
1:61:10- 1:20
Moderate Between 1:100-1:1000 D. Smoking 10 cigarettes per dayD. All natural causes, age 40 years
1:2001:850
Low Between 1:1000- 1:10000 D. All kinds of violence and poisoningD. Influenza
1:33001:5000
D. Accident on road 1:8000Very low Between 1:10000- 1:100000 D. Leukaemia
D. Playing soccerD. Accident at homeD. Accident at workD. Homicide
1:120001:25000!:260001:430001:100000
Minimal Between 1:100000- 1:1000000 D. Accident on railwayA. Vaccination-associated polio
1:5000001:1000000
Negligible Less than 1:10000000 D. Hit by lightningD. Release of radiation by nuclear power station
1:100000001:10000000
Source: On the State of the Public Health: the Annual Report of the Chief Medical Officer of theDepartment of Health for the Year 1995, London, HMSO, 1996, p. 13.
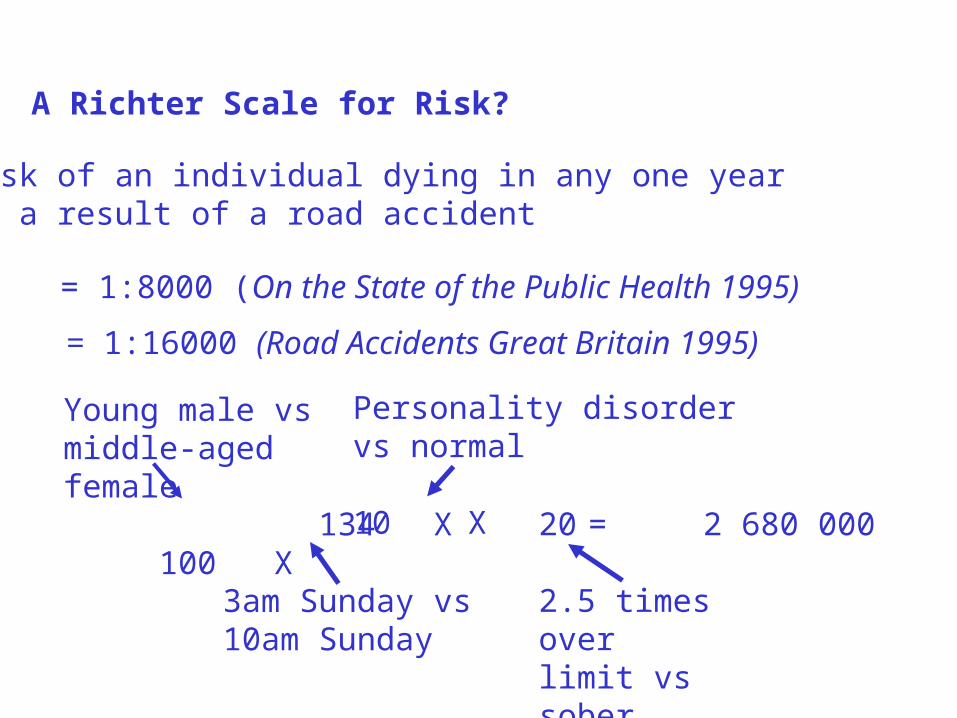
A Richter Scale for Risk?
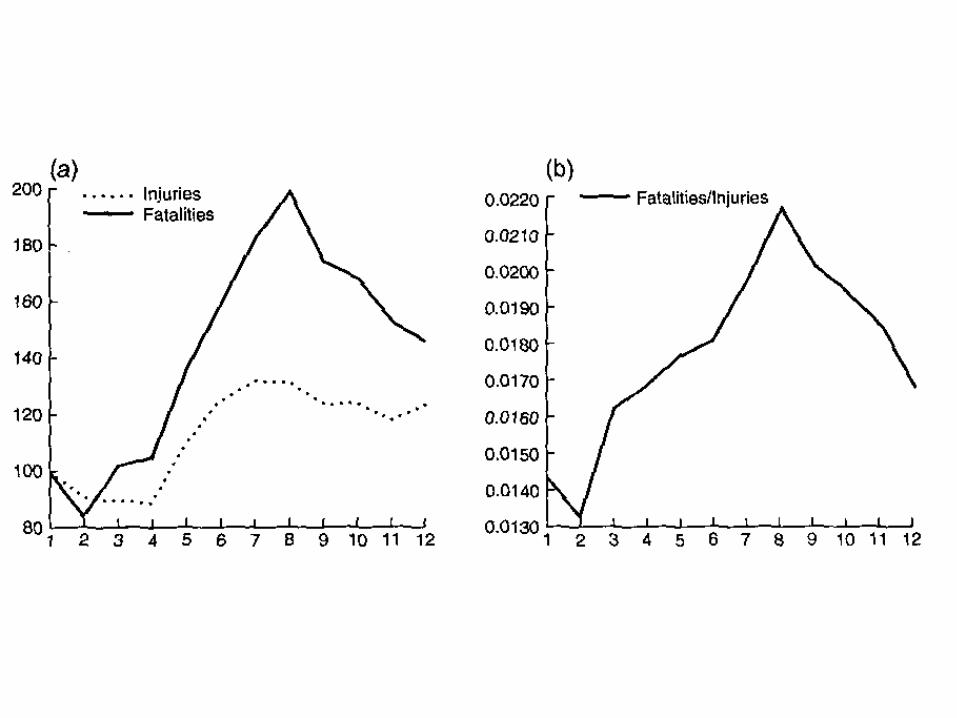
Risk of an individual dying in any one year as a result of a road accident
= 1:8000 (On the State of the Public Health 1995)
= 1:16000 (Road Accidents Great Britain 1995)
Young male vsmiddle-aged female
100 X 134 X
3am Sunday vs10am Sunday
Personality disorder vs normal
10 X 20
2.5 times over limit vs sober
= 2 680 000

• I exaggerate
the four variables are not independent;there are more disturbed drunken young men on the road at 3am Sunday
• or do I?
the four numbers in the equation are all averages.
Further variables must be invoked to account for their variances,
is the carbig X new X equipped with ABS brakes X insured ...?
is the roadslippery X well-lit X straight ... ?
is the driver sleepy X angry X on drugs X short-sighted ...?
is the ... .... ?
Perception of risks
Accidents
Propensity totake risks
Balancingbehaviour
Rewards
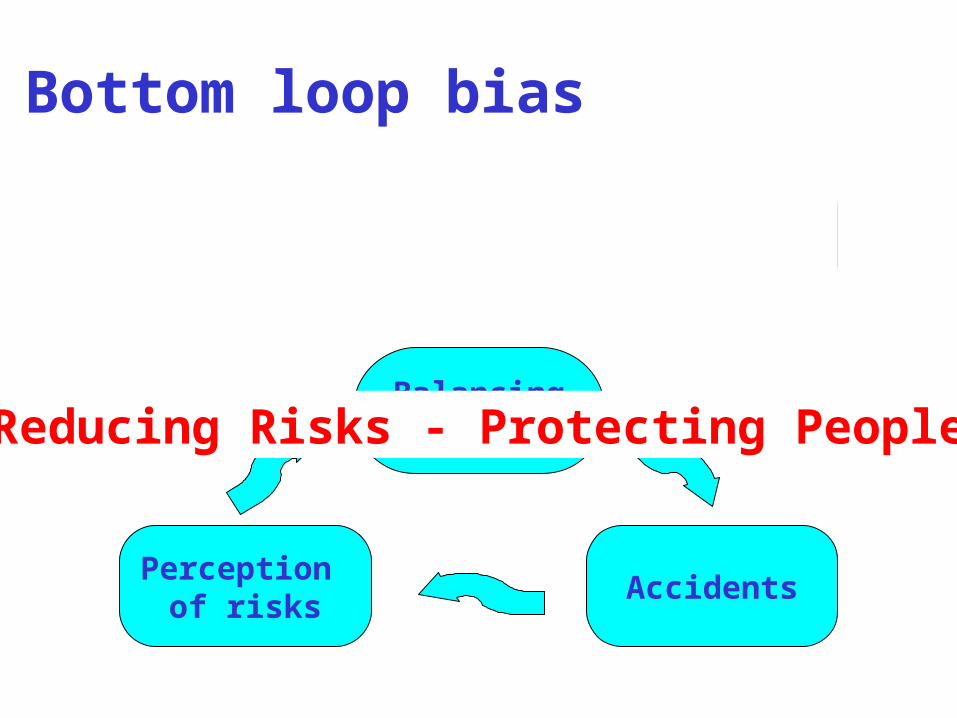
Bottom loop bias
Reducing Risks - Protecting People

Perception of risks
Accidents
Propensity totake risks
Balancingbehaviour
Rewards
Perceptual Filters
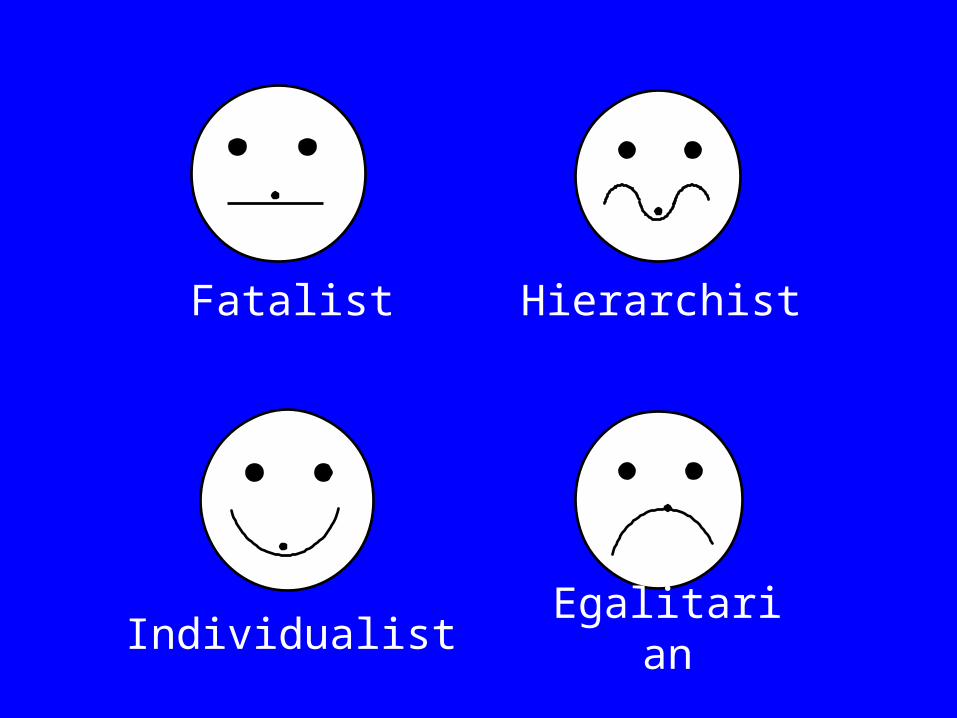
Individualist
Fatalist Hierarchist
Egalitarian
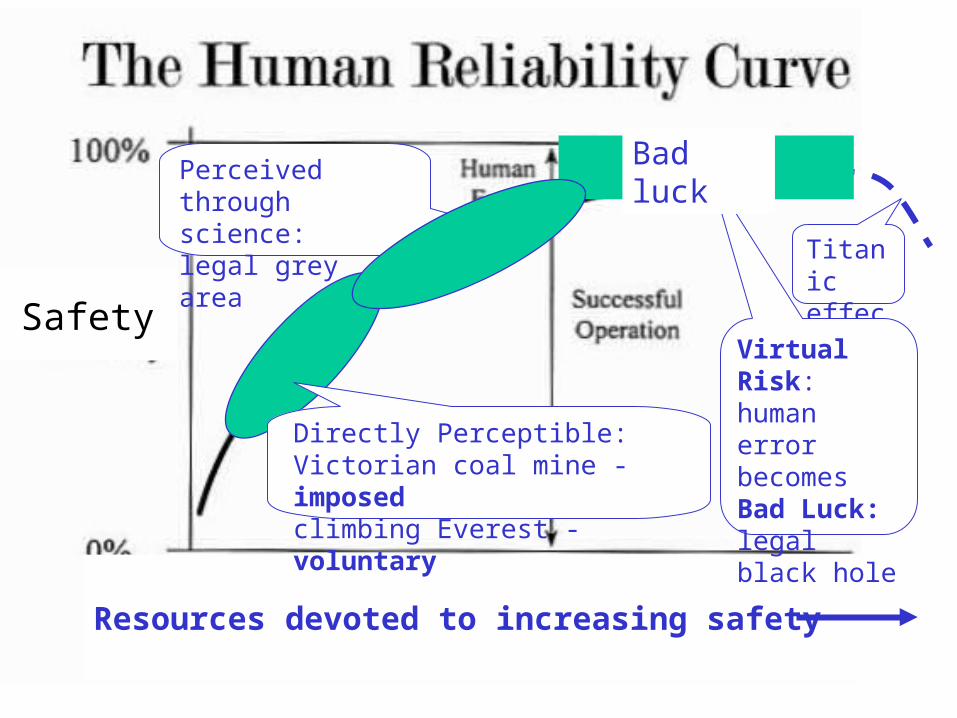
Safety
Resources devoted to increasing safety
Directly Perceptible:Victorian coal mine - imposedclimbing Everest - voluntary
Titanic effect
Virtual Risk: human error becomesBad Luck:legal black hole
Bad luck
Perceived through science:legal grey area

www.acm.ab.ca/safety/images/ fault-tree.gif

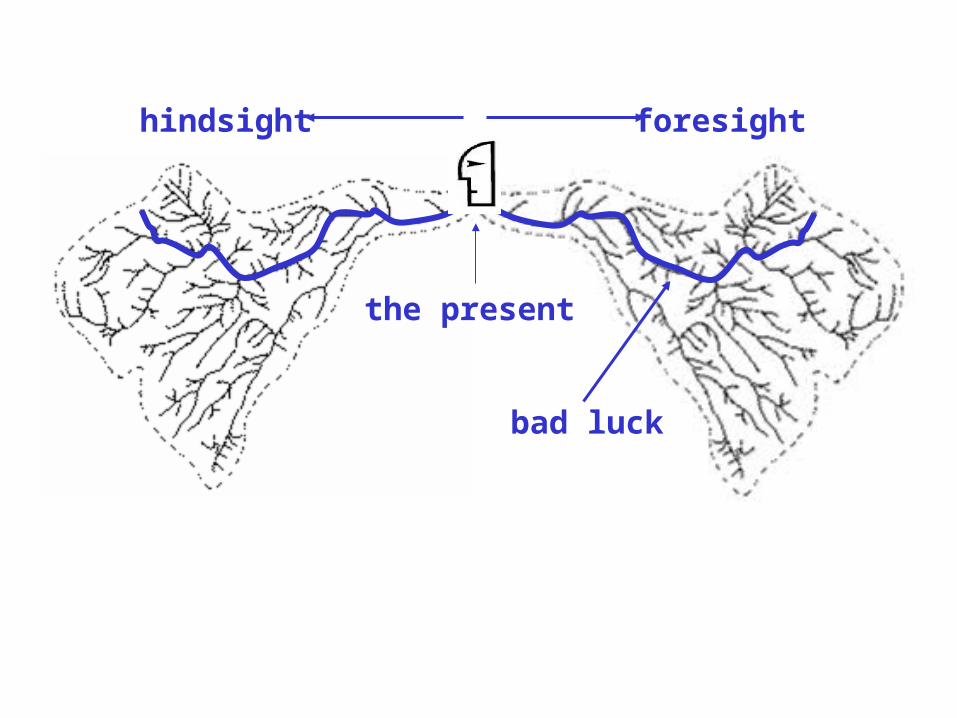
bad luck
foresight
the present
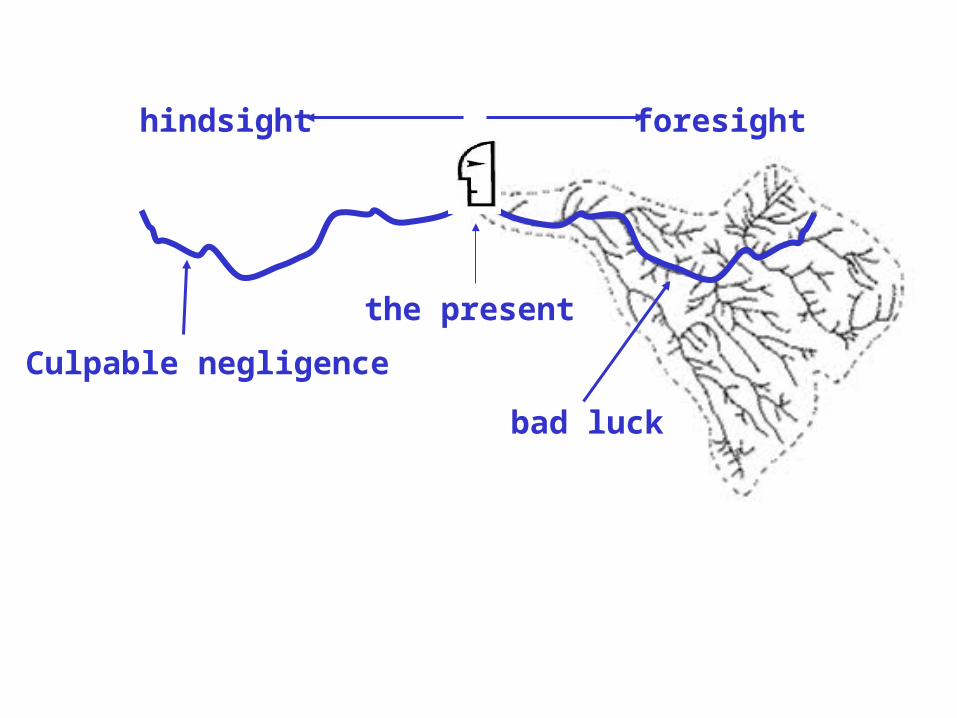
bad luck
foresight
the present
hindsight
hindsight foresight
the present
Culpable negligence
bad luck

Whom do you trust?
per cent
Egalitatians
Fatalists
Individualist
Hierarchist

More anonymous, less convivial

Less child friendly

More dangerous

Perception of risks
Accidents
Propensity totake risks
Balancingbehaviour
Rewards
Perception of risks
Accidents
Propensity totake risks
Balancingbehaviour
Rewards
The lorry driver and the cyclist

Perception of risks
Accidents
Propensity totake risks
Balancingbehaviour
Rewards
Perception of risks
Accidents
Propensity totake risks
Balancingbehaviour
Rewards
Perception of risks
Accidents
Propensity totake risks
Balancingbehaviour
Rewards
Lawyer on contingency fee
Insurer
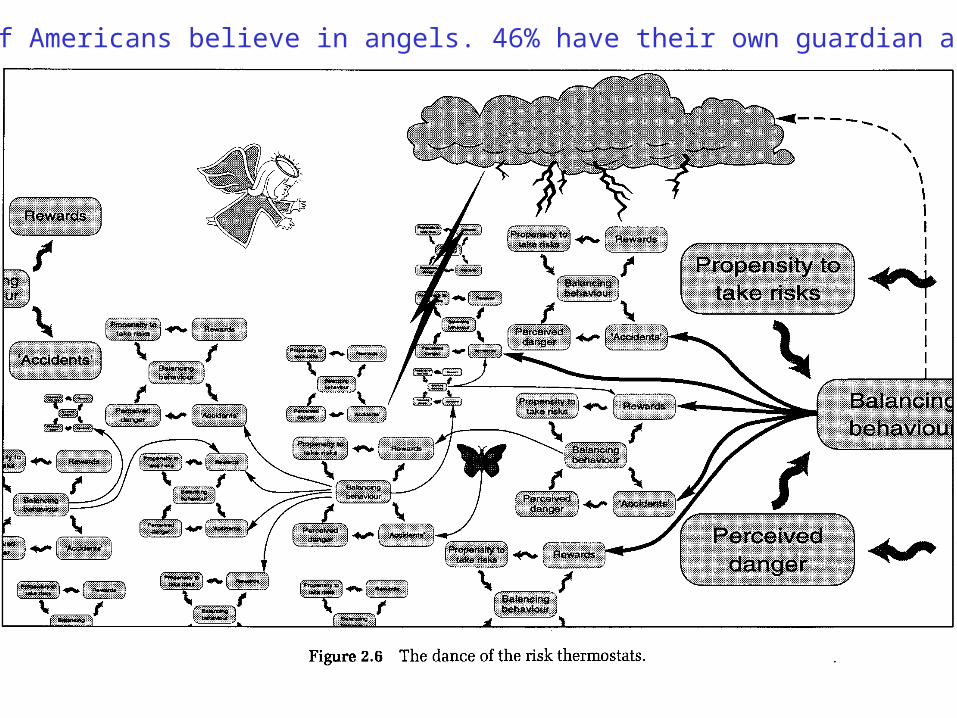
69% of Americans believe in angels. 46% have their own guardian angel.

New Scientist22 January 2005

![k.friston@ucl.ac.uk arXiv:1705.08265v1 [q-bio.NC] 18 May 2017Karl Friston Wellcome Trust Centre for Neuroimaging University College London k.friston@ucl.ac.uk Abstract Theoretical](https://static.fdocuments.in/doc/165x107/5ea37e64bca8250b21594868/kfristonuclacuk-arxiv170508265v1-q-bionc-18-may-2017-karl-friston-wellcome.jpg)