Risk-BudgetingAllocation versus Port · PDF filePortfolio optimization Risk-budgeting...
54
Portfolio optimization Risk-budgeting techniques Some illustrations Portfolio Optimization versus Risk-Budgeting Allocation 1 Thierry Roncalli ? ? Lyxor Asset Management, France & Évry University, France WG RISK ESSEC, January 18, 2012 1 The opinions expressed in this presentation are those of the author and are not meant to represent the opinions or official positions of Lyxor Asset Management. Thierry Roncalli Portfolio Optimization vs Risk-Budgeting Allocation 1 / 54
-
Upload
truongtuyen -
Category
Documents
-
view
216 -
download
3
Transcript of Risk-BudgetingAllocation versus Port · PDF filePortfolio optimization Risk-budgeting...

Portfolio optimizationRisk-budgeting techniques
Some illustrations
Portfolio Optimizationversus
Risk-Budgeting Allocation1
Thierry Roncalli?
?Lyxor Asset Management, France & Évry University, France
WG RISK ESSEC, January 18, 2012
1The opinions expressed in this presentation are those of the author and are notmeant to represent the opinions or official positions of Lyxor Asset Management.
Thierry Roncalli Portfolio Optimization vs Risk-Budgeting Allocation 1 / 54

Portfolio optimizationRisk-budgeting techniques
Some illustrations
Outline
1 Portfolio optimizationSome ModelsRobustness of the Markowitz frameworkWeights constraints and Portfolio Theory
2 Risk-budgeting techniquesRisk-budgeting principlesThe ERC portfolio
3 Some illustrationsRisk-based indexationRisk parity fundsBond portfolios management
Thierry Roncalli Portfolio Optimization vs Risk-Budgeting Allocation 2 / 54

Portfolio optimizationRisk-budgeting techniques
Some illustrations
Some ModelsRobustness of the Markowitz frameworkWeights constraints and Portfolio Theory
Some models
Most Popular Models in Asset Allocation
Mean-variance portfolio selection (Markowitz, 1952)(minimum-variance strategy, tangency portfolio, strategic assetallocation, market-cap indexation, etc.)
Dynamic optimization (Merton, 1971)(constant-mix strategy, liability-driven investment, lifecycle funds,target date funds, etc.)
Tactical asset allocation (Black-Litterman, 1992)(equilibrium portfolios, flexible views, market timing, etc.)
⇒ These 3 models are based on optimization techniques.
Thierry Roncalli Portfolio Optimization vs Risk-Budgeting Allocation 3 / 54
Portfolio optimizationRisk-budgeting techniques
Some illustrations
Some ModelsRobustness of the Markowitz frameworkWeights constraints and Portfolio Theory
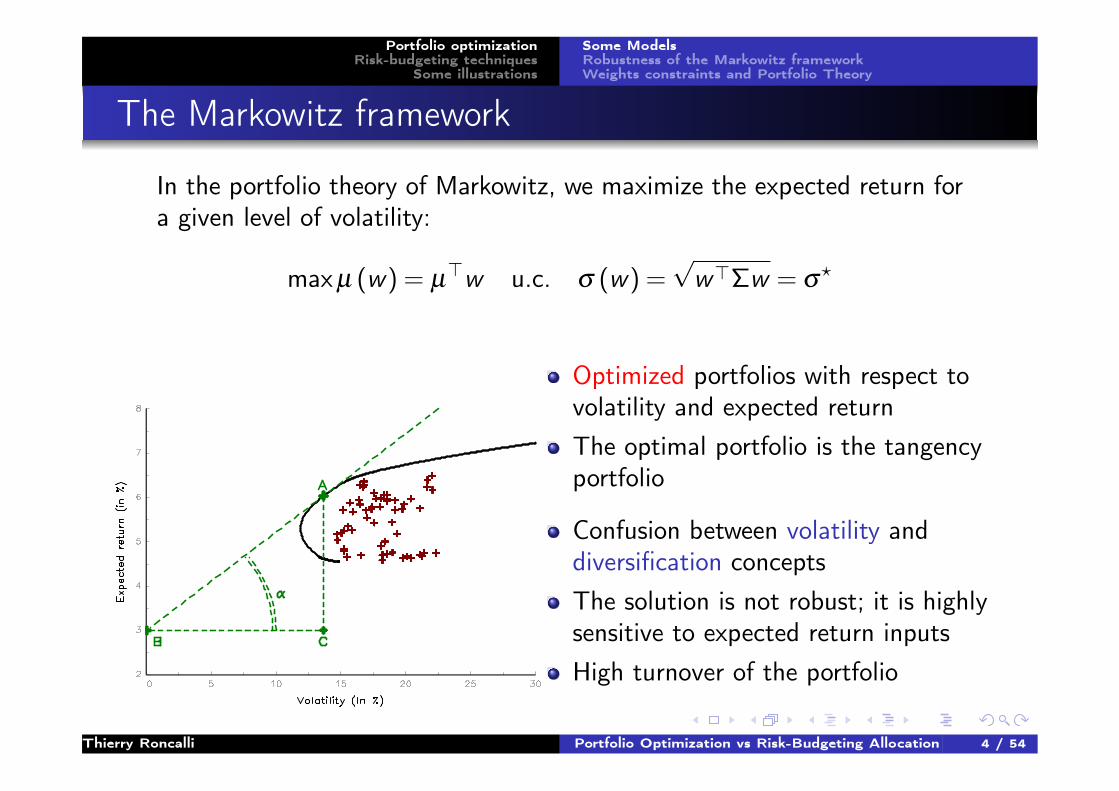
The Markowitz framework
In the portfolio theory of Markowitz, we maximize the expected return fora given level of volatility:
maxµ (w) = µ>w u.c. σ (w) =
√w>Σw = σ
?
Optimized portfolios with respect tovolatility and expected returnThe optimal portfolio is the tangencyportfolio
Confusion between volatility anddiversification conceptsThe solution is not robust; it is highlysensitive to expected return inputsHigh turnover of the portfolio
Thierry Roncalli Portfolio Optimization vs Risk-Budgeting Allocation 4 / 54
Portfolio optimizationRisk-budgeting techniques
Some illustrations
Some ModelsRobustness of the Markowitz frameworkWeights constraints and Portfolio Theory
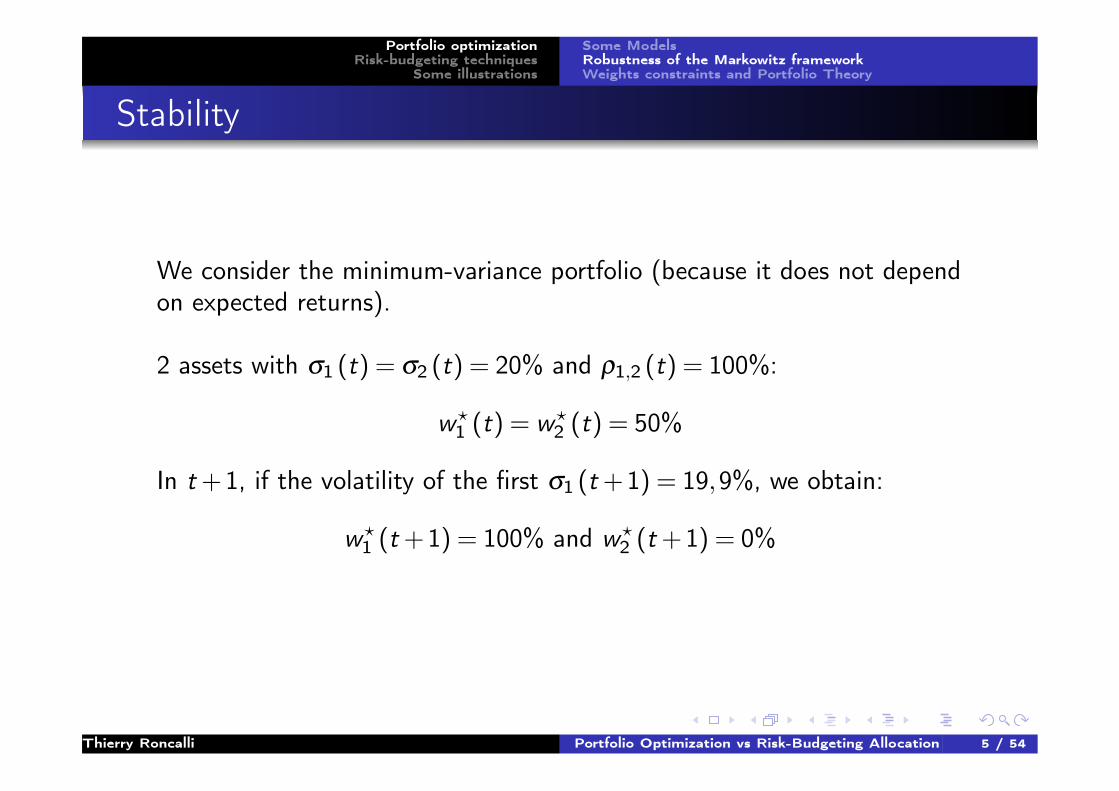
Stability
We consider the minimum-variance portfolio (because it does not dependon expected returns).
2 assets with σ1 (t) = σ2 (t) = 20% and ρ1,2 (t) = 100%:
w?1 (t) = w?
2 (t) = 50%
In t +1, if the volatility of the first σ1 (t +1) = 19,9%, we obtain:
w?1 (t +1) = 100% and w?
2 (t +1) = 0%
Thierry Roncalli Portfolio Optimization vs Risk-Budgeting Allocation 5 / 54
Portfolio optimizationRisk-budgeting techniques
Some illustrations
Some ModelsRobustness of the Markowitz frameworkWeights constraints and Portfolio Theory
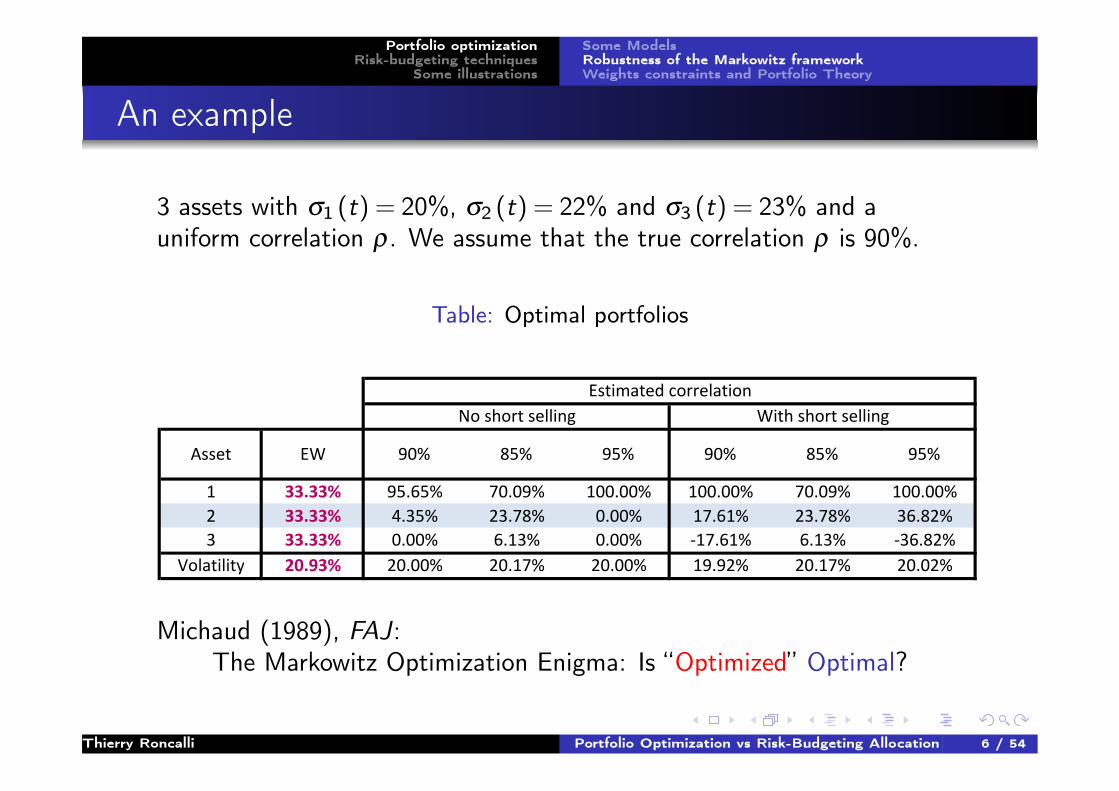
An example
3 assets with σ1 (t) = 20%, σ2 (t) = 22% and σ3 (t) = 23% and auniform correlation ρ. We assume that the true correlation ρ is 90%.
Table: Optimal portfolios
1 33.33% 95.65% 70.09% 100.00% 100.00% 70.09% 100.00%
2 33.33% 4.35% 23.78% 0.00% 17.61% 23.78% 36.82%
3 33.33% 0.00% 6.13% 0.00% -17.61% 6.13% -36.82%
Volatility 20.93% 20.00% 20.17% 20.00% 19.92% 20.17% 20.02%
Estimated correlation
With short selling
90% 85% 95%85% 95%Asset EW 90%
No short selling
Michaud (1989), FAJ:The Markowitz Optimization Enigma: Is “Optimized” Optimal?
Thierry Roncalli Portfolio Optimization vs Risk-Budgeting Allocation 6 / 54

Portfolio optimizationRisk-budgeting techniques
Some illustrations
Some ModelsRobustness of the Markowitz frameworkWeights constraints and Portfolio Theory
On the importance of the information matrix
Let µ and Σ be the vector of expected returns and the covariance matrix.Optimal solutions are of the following form:
w?∝ Σ−1µ
In the case of the minimum-variance portfolio, the form is:
w?∝ Σ−11
The important quantity is I = Σ−1, which is called the informationmatrix.
Thierry Roncalli Portfolio Optimization vs Risk-Budgeting Allocation 7 / 54

Portfolio optimizationRisk-budgeting techniques
Some illustrations
Some ModelsRobustness of the Markowitz frameworkWeights constraints and Portfolio Theory
Which factors are important?
Eigendecomposition of the information matrix
The eigendecomposition of I = Σ−1 is the same as the one of Σ, butwith reverse order of eigenvectors and inverse eigenvalues:
Vi (I ) = Vn−i (Σ)
λi (I ) =1
λn−i (Σ)
Table: Example with the previous covariance matrix (with correlation 90%)
Asset / Factor 1 2 3 1 2 3
1 52.88% -13.02% 83.87% 83.87% -13.02% 52.88%
2 58.56% -65.93% -47.16% -47.16% -65.93% 58.56%
3 61.44% 74.05% -27.25% -27.25% 74.05% 61.44%
Eigenvalues 0.1319 0.0051 0.0043 233.4190 197.1199 7.5790
% cumulated 93.4% 97.0% 100.0% 53.3% 98.3% 100.0%
Covariance matrix Information matrix
Thierry Roncalli Portfolio Optimization vs Risk-Budgeting Allocation 8 / 54
Portfolio optimizationRisk-budgeting techniques
Some illustrations
Some ModelsRobustness of the Markowitz frameworkWeights constraints and Portfolio Theory
Solutions
Because the optimal solution depends principally on the last factors of thecovariance matrix, we have to introduce some regularization techniques:
regularization of the objective function by using resamplingtechniquesregularization of the covariance matrix:
Factor analysisShrinkage methodsRandom matrix theoryetc.
regularization of the program specification by introducing someconstraints
Thierry Roncalli Portfolio Optimization vs Risk-Budgeting Allocation 9 / 54

Portfolio optimizationRisk-budgeting techniques
Some illustrations
Some ModelsRobustness of the Markowitz frameworkWeights constraints and Portfolio Theory
Main result
We consider a universe of n assets. We denote by µ the vector of theirexpected returns and by Σ the corresponding covariance matrix. Wespecify the optimization problem as follows:
min12w>Σw
u.c.
1>w = 1µ>w ≥ µ?
w ∈ Rn⋂C
where w is the vector of weights in the portfolio and C is the set ofweights constraints. We define:
the unconstrained portfolio w? or w? (µ,Σ):
C = Rn
the constrained portfolio w̃ :
C(w−,w+
)={w ∈ Rn : w−i ≤ wi ≤ w+
i
}Thierry Roncalli Portfolio Optimization vs Risk-Budgeting Allocation 10 / 54
Portfolio optimizationRisk-budgeting techniques
Some illustrations
Some ModelsRobustness of the Markowitz frameworkWeights constraints and Portfolio Theory
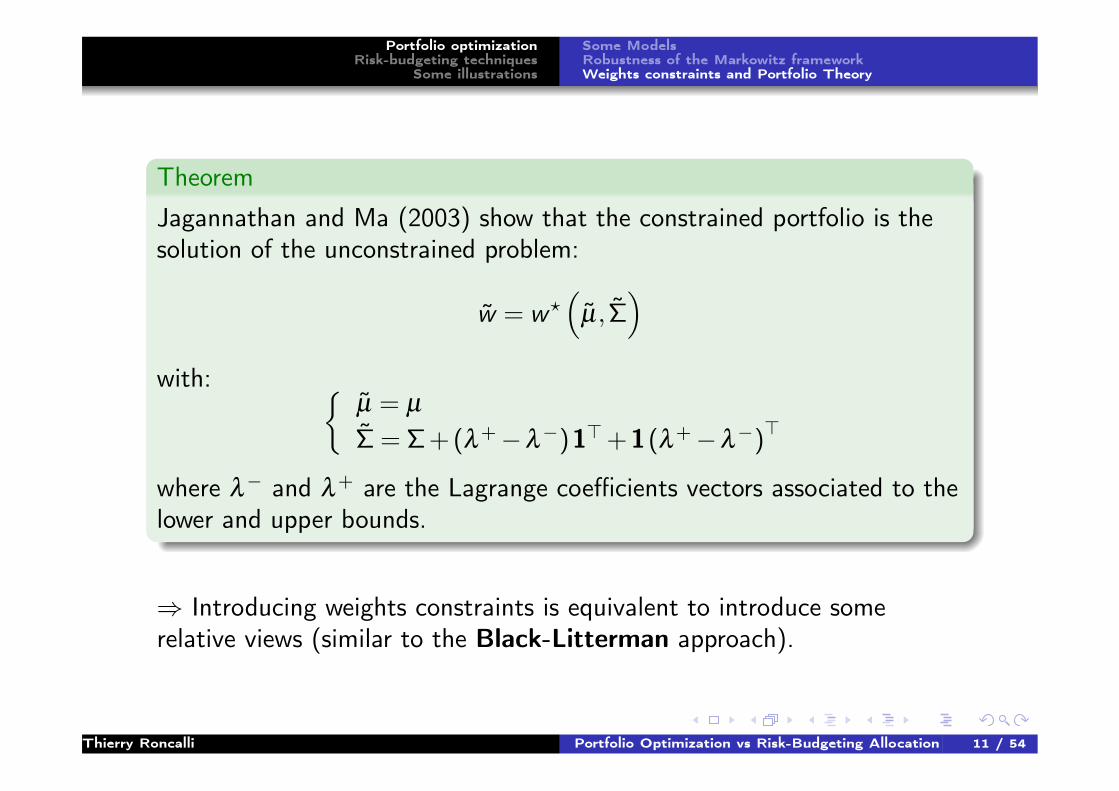
Theorem
Jagannathan and Ma (2003) show that the constrained portfolio is thesolution of the unconstrained problem:
w̃ = w?(
µ̃, Σ̃)
with: {µ̃ = µ
Σ̃ = Σ + (λ+−λ−)1>+1(λ+−λ−)>
where λ− and λ+ are the Lagrange coefficients vectors associated to thelower and upper bounds.
⇒ Introducing weights constraints is equivalent to introduce somerelative views (similar to the Black-Litterman approach).
Thierry Roncalli Portfolio Optimization vs Risk-Budgeting Allocation 11 / 54
Portfolio optimizationRisk-budgeting techniques
Some illustrations
Some ModelsRobustness of the Markowitz frameworkWeights constraints and Portfolio Theory
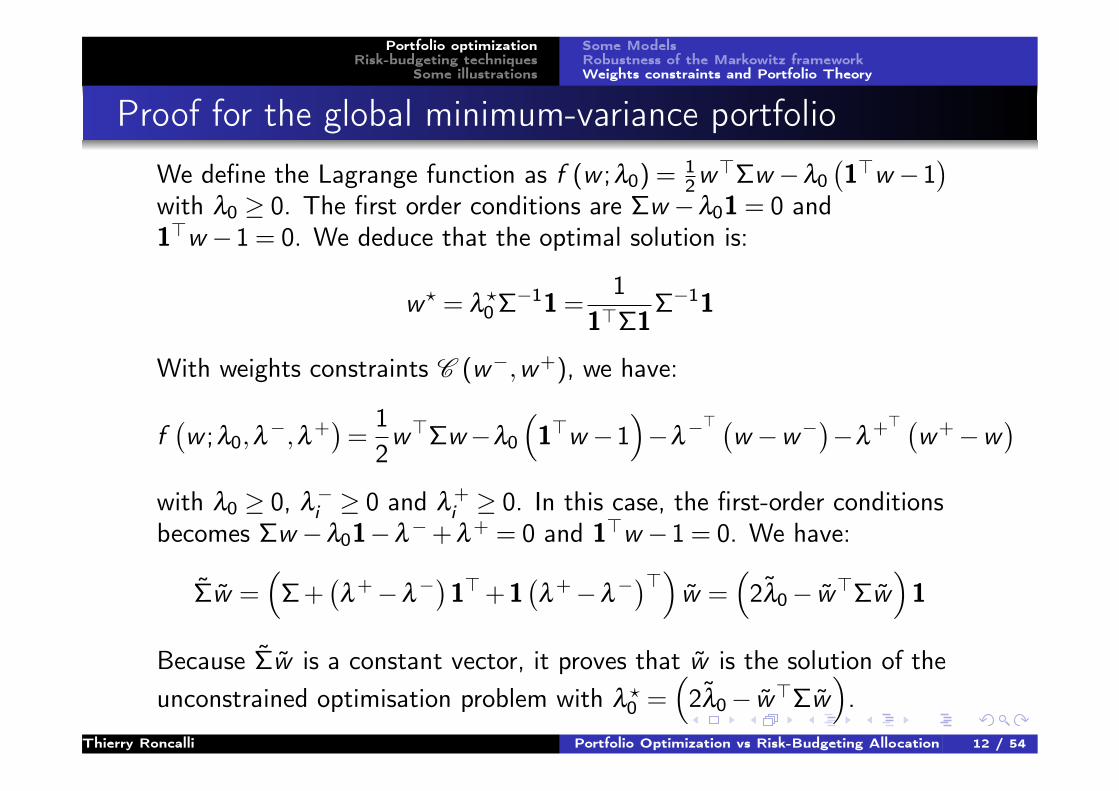
Proof for the global minimum-variance portfolio
We define the Lagrange function as f (w ;λ0) = 12w>Σw −λ0
(1>w −1
)with λ0 ≥ 0. The first order conditions are Σw −λ01 = 0 and1>w −1 = 0. We deduce that the optimal solution is:
w? = λ?0Σ−11 =
11>Σ1
Σ−11
With weights constraints C (w−,w+), we have:
f(w ;λ0,λ
−,λ+)
=12w>Σw−λ0
(1>w −1
)−λ
−> (w −w−)−λ
+> (w+−w)
with λ0 ≥ 0, λ−i ≥ 0 and λ
+i ≥ 0. In this case, the first-order conditions
becomes Σw −λ01−λ−+ λ+ = 0 and 1>w −1 = 0. We have:
Σ̃w̃ =(
Σ +(λ+−λ
−)1>+1(λ+−λ
−)>) w̃ =(2λ̃0− w̃>Σw̃
)1
Because Σ̃w̃ is a constant vector, it proves that w̃ is the solution of theunconstrained optimisation problem with λ ?
0 =(2λ̃0− w̃>Σw̃
).
Thierry Roncalli Portfolio Optimization vs Risk-Budgeting Allocation 12 / 54
Portfolio optimizationRisk-budgeting techniques
Some illustrations
Some ModelsRobustness of the Markowitz frameworkWeights constraints and Portfolio Theory
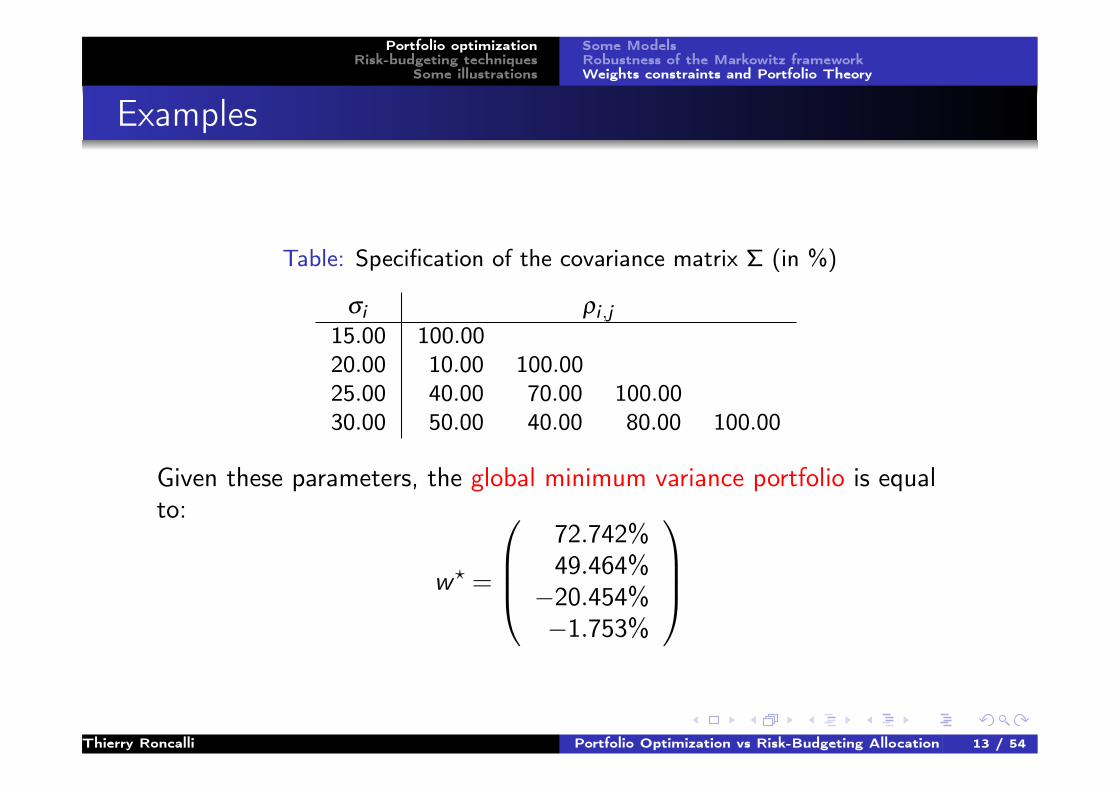
Examples
Table: Specification of the covariance matrix Σ (in %)
σi ρi ,j15.00 100.0020.00 10.00 100.0025.00 40.00 70.00 100.0030.00 50.00 40.00 80.00 100.00
Given these parameters, the global minimum variance portfolio is equalto:
w? =
72.742%49.464%−20.454%−1.753%
Thierry Roncalli Portfolio Optimization vs Risk-Budgeting Allocation 13 / 54
Portfolio optimizationRisk-budgeting techniques
Some illustrations
Some ModelsRobustness of the Markowitz frameworkWeights constraints and Portfolio Theory
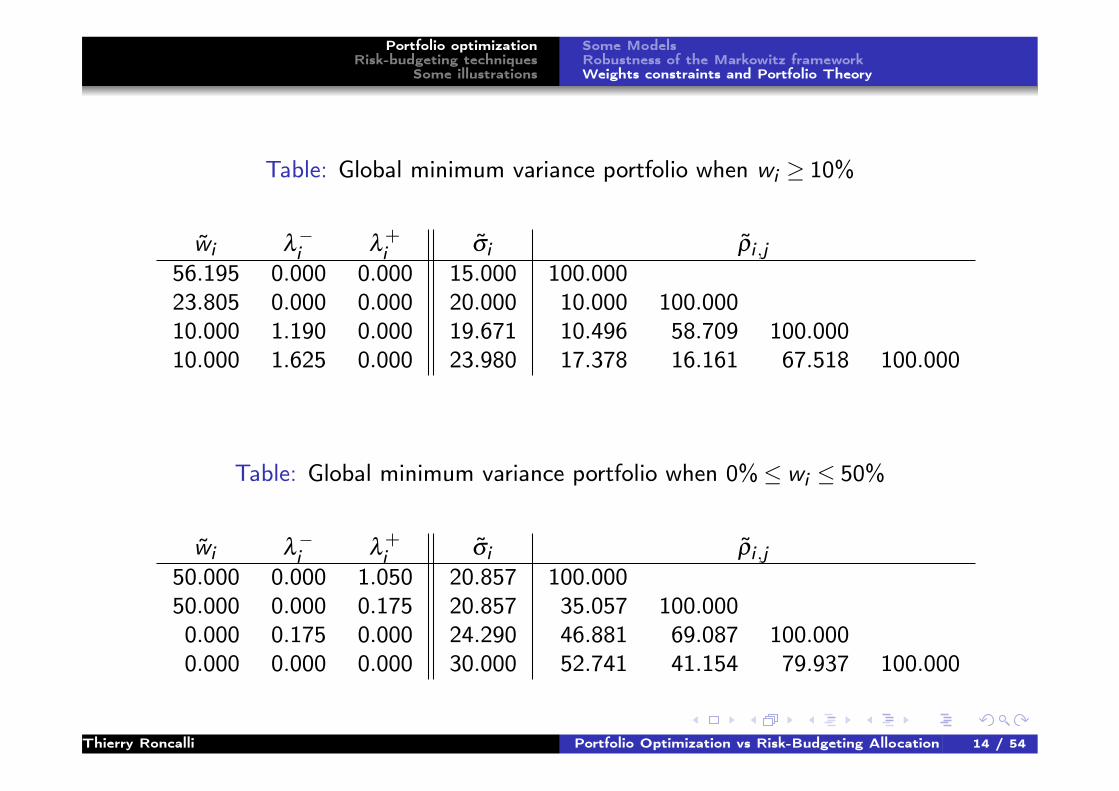
Table: Global minimum variance portfolio when wi ≥ 10%
w̃i λ−i λ
+i σ̃i ρ̃i ,j
56.195 0.000 0.000 15.000 100.00023.805 0.000 0.000 20.000 10.000 100.00010.000 1.190 0.000 19.671 10.496 58.709 100.00010.000 1.625 0.000 23.980 17.378 16.161 67.518 100.000
Table: Global minimum variance portfolio when 0%≤ wi ≤ 50%
w̃i λ−i λ
+i σ̃i ρ̃i ,j
50.000 0.000 1.050 20.857 100.00050.000 0.000 0.175 20.857 35.057 100.0000.000 0.175 0.000 24.290 46.881 69.087 100.0000.000 0.000 0.000 30.000 52.741 41.154 79.937 100.000
Thierry Roncalli Portfolio Optimization vs Risk-Budgeting Allocation 14 / 54
Portfolio optimizationRisk-budgeting techniques
Some illustrations
Some ModelsRobustness of the Markowitz frameworkWeights constraints and Portfolio Theory
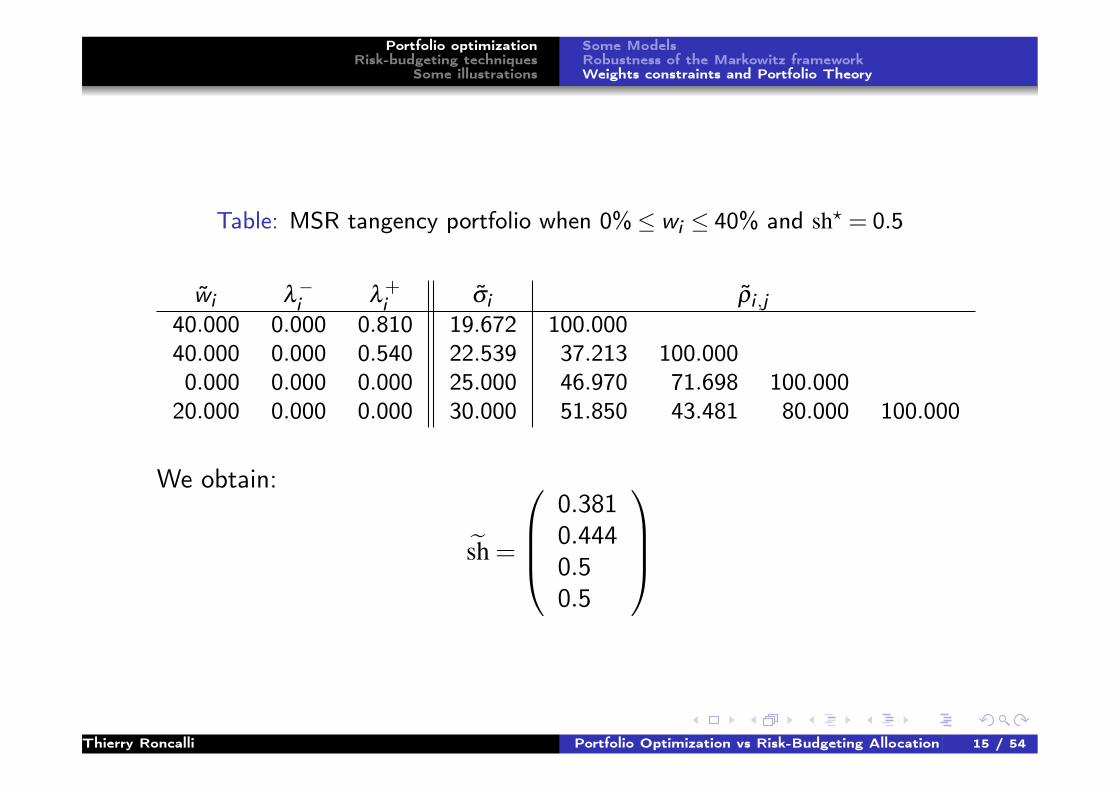
Table: MSR tangency portfolio when 0%≤ wi ≤ 40% and sh? = 0.5
w̃i λ−i λ
+i σ̃i ρ̃i ,j
40.000 0.000 0.810 19.672 100.00040.000 0.000 0.540 22.539 37.213 100.0000.000 0.000 0.000 25.000 46.970 71.698 100.000
20.000 0.000 0.000 30.000 51.850 43.481 80.000 100.000
We obtain:
s̃h =
0.3810.4440.50.5
Thierry Roncalli Portfolio Optimization vs Risk-Budgeting Allocation 15 / 54

Portfolio optimizationRisk-budgeting techniques
Some illustrationsRisk-budgeting principlesThe ERC portfolio
Euler decomposition of risk measures
Let R (w1, . . . ,wn) be a coherent convex risk measure. We have:
R (w1, . . . ,wn) =n
∑i=1
wi ·∂ R (w1, . . . ,wn)
∂ wi︸ ︷︷ ︸RCi
RCi is the risk contribution of the i th asset: it is the product of its weightby its marginal risk.
Let us consider a set of given risk budgets {RB1, . . . ,RBn}, therisk-budgeted portfolio is defined by:
RC1 (w1, . . . ,wn) = RB1...
RCi (w1, . . . ,wn) = RBi...
RCn (w1, . . . ,wn) = RBn
Thierry Roncalli Portfolio Optimization vs Risk-Budgeting Allocation 16 / 54
Portfolio optimizationRisk-budgeting techniques
Some illustrationsRisk-budgeting principlesThe ERC portfolio
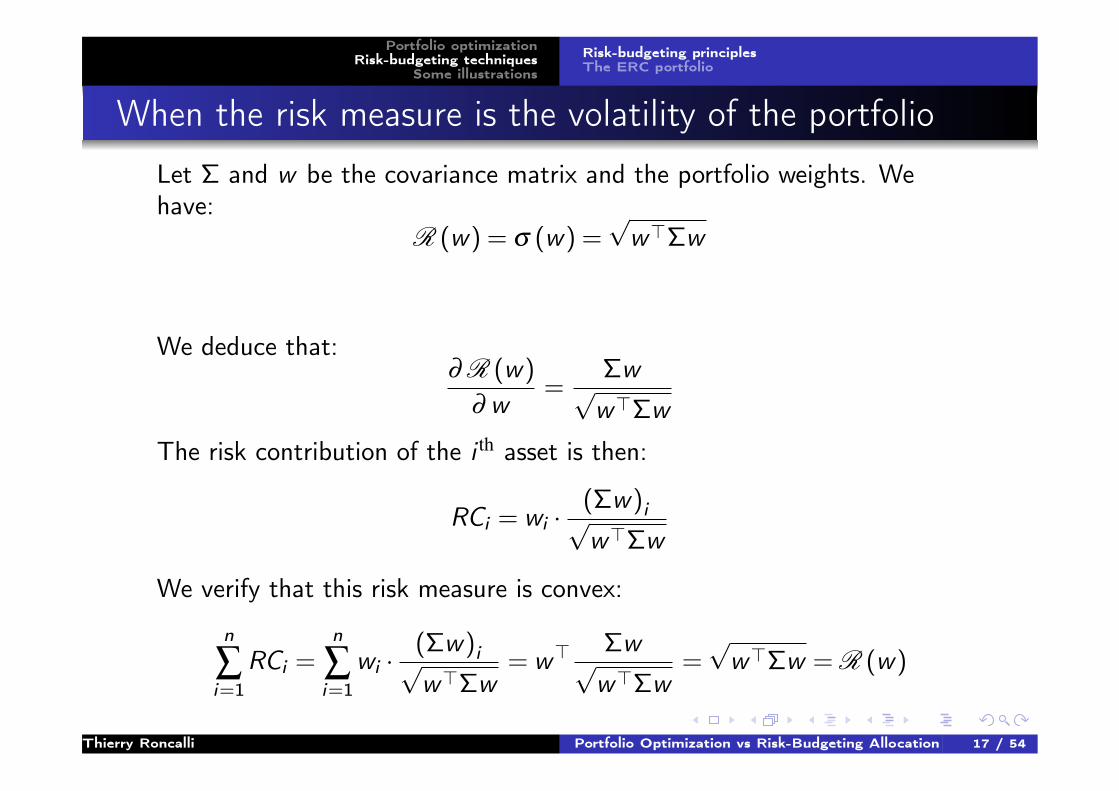
When the risk measure is the volatility of the portfolio
Let Σ and w be the covariance matrix and the portfolio weights. Wehave:
R (w) = σ (w) =√
w>Σw
We deduce that:∂ R (w)
∂ w=
Σw√w>Σw
The risk contribution of the i th asset is then:
RCi = wi ·(Σw)i√w>Σw
We verify that this risk measure is convex:
n
∑i=1
RCi =n
∑i=1
wi ·(Σw)i√w>Σw
= w>Σw√w>Σw
=√
w>Σw = R (w)
Thierry Roncalli Portfolio Optimization vs Risk-Budgeting Allocation 17 / 54

Portfolio optimizationRisk-budgeting techniques
Some illustrationsRisk-budgeting principlesThe ERC portfolio
Illustration3 assetsVolatilities are respectively 20%,30% and 15%
Correlations are set to 60%between the 1st asset and the 2nd
asset and 10% between the firsttwo assets and the 3rd asset
The marginal risk for the first asset is:
limε→0
σ (w1 + ε,w2,w3)−σ (w1,w2,w3)
(w1 + ε)−w1
If ε = 1%, we have:
∂ R (x)
∂ w1' 16.72%−16.54%
1%= 18.01%
Absolute Relative
1 50.00% 17.99% 9.00% 54.40%
2 25.00% 25.17% 6.29% 38.06%
2 25.00% 4.99% 1.25% 7.54%
Volatility 16.54%
Absolute Relative
1 41.62% 16.84% 7.01% 50.00%
2 15.79% 22.19% 3.51% 25.00%
2 42.58% 8.23% 3.51% 25.00%
Volatility 14.02%
Absolute Relative
1 30.41% 15.15% 4.61% 33.33%
2 20.28% 22.73% 4.61% 33.33%
2 49.31% 9.35% 4.61% 33.33%
Volatility 13.82%
ERC approach
Asset WeightMarginal
Risk
Risk Contribution
Asset WeightMarginal
Risk
Risk Contribution
Traditional approach
Asset WeightMarginal
Risk
Risk Contribution
Risk budgeting approach
Thierry Roncalli Portfolio Optimization vs Risk-Budgeting Allocation 18 / 54
Portfolio optimizationRisk-budgeting techniques
Some illustrationsRisk-budgeting principlesThe ERC portfolio
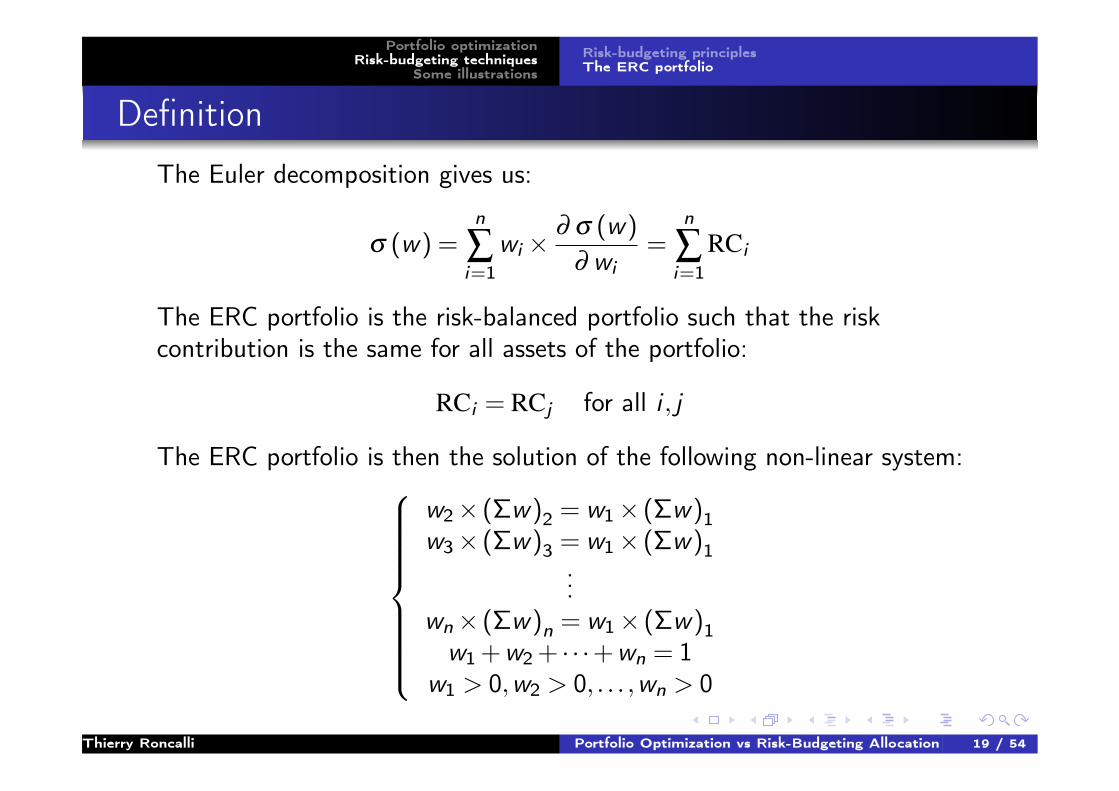
Definition
The Euler decomposition gives us:
σ (w) =n
∑i=1
wi ×∂ σ (w)
∂ wi=
n
∑i=1
RCi
The ERC portfolio is the risk-balanced portfolio such that the riskcontribution is the same for all assets of the portfolio:
RCi = RCj for all i , j
The ERC portfolio is then the solution of the following non-linear system:
w2× (Σw)2 = w1× (Σw)1w3× (Σw)3 = w1× (Σw)1
...wn× (Σw)n = w1× (Σw)1
w1 +w2 + · · ·+wn = 1w1 > 0,w2 > 0, . . . ,wn > 0
Thierry Roncalli Portfolio Optimization vs Risk-Budgeting Allocation 19 / 54
Portfolio optimizationRisk-budgeting techniques
Some illustrationsRisk-budgeting principlesThe ERC portfolio
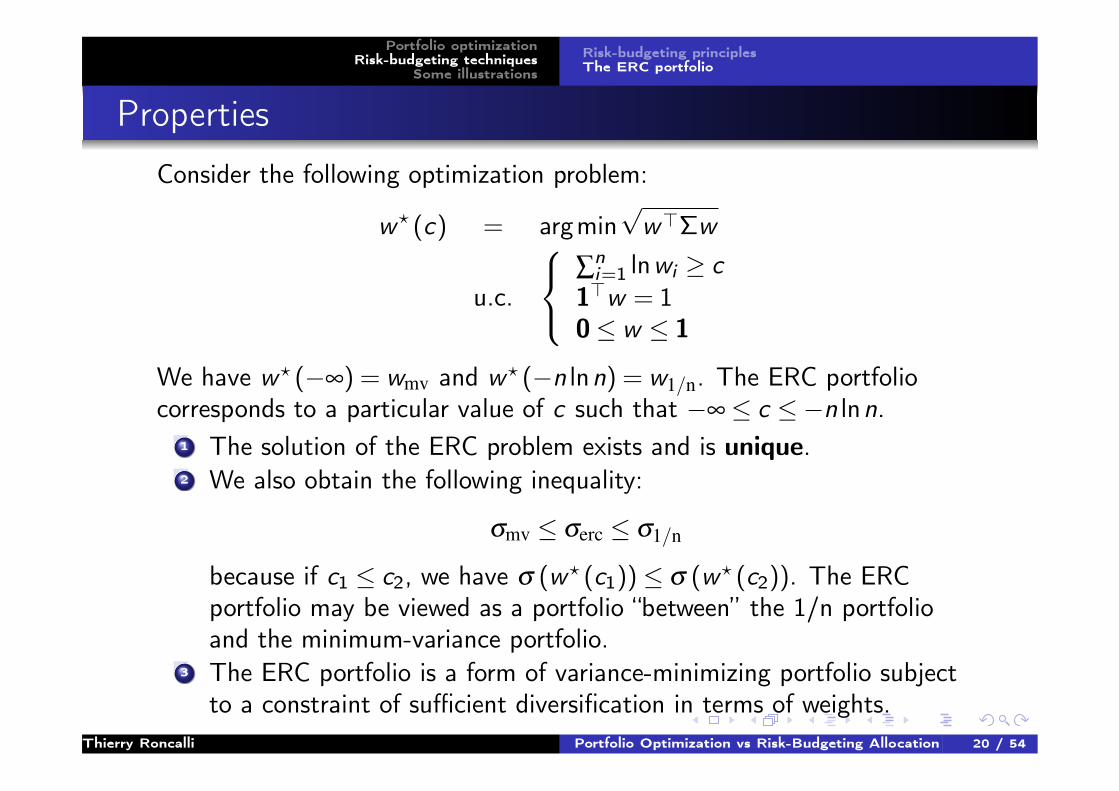
Properties
Consider the following optimization problem:
w? (c) = argmin√
w>Σw
u.c.
∑ni=1 lnwi ≥ c
1>w = 10≤ w ≤ 1
We have w? (−∞) = wmv and w? (−n lnn) = w1/n. The ERC portfoliocorresponds to a particular value of c such that −∞≤ c ≤−n lnn.
1 The solution of the ERC problem exists and is unique.2 We also obtain the following inequality:
σmv ≤ σerc ≤ σ1/n
because if c1 ≤ c2, we have σ (w? (c1))≤ σ (w? (c2)). The ERCportfolio may be viewed as a portfolio “between” the 1/n portfolioand the minimum-variance portfolio.
3 The ERC portfolio is a form of variance-minimizing portfolio subjectto a constraint of sufficient diversification in terms of weights.
Thierry Roncalli Portfolio Optimization vs Risk-Budgeting Allocation 20 / 54
Portfolio optimizationRisk-budgeting techniques
Some illustrationsRisk-budgeting principlesThe ERC portfolio
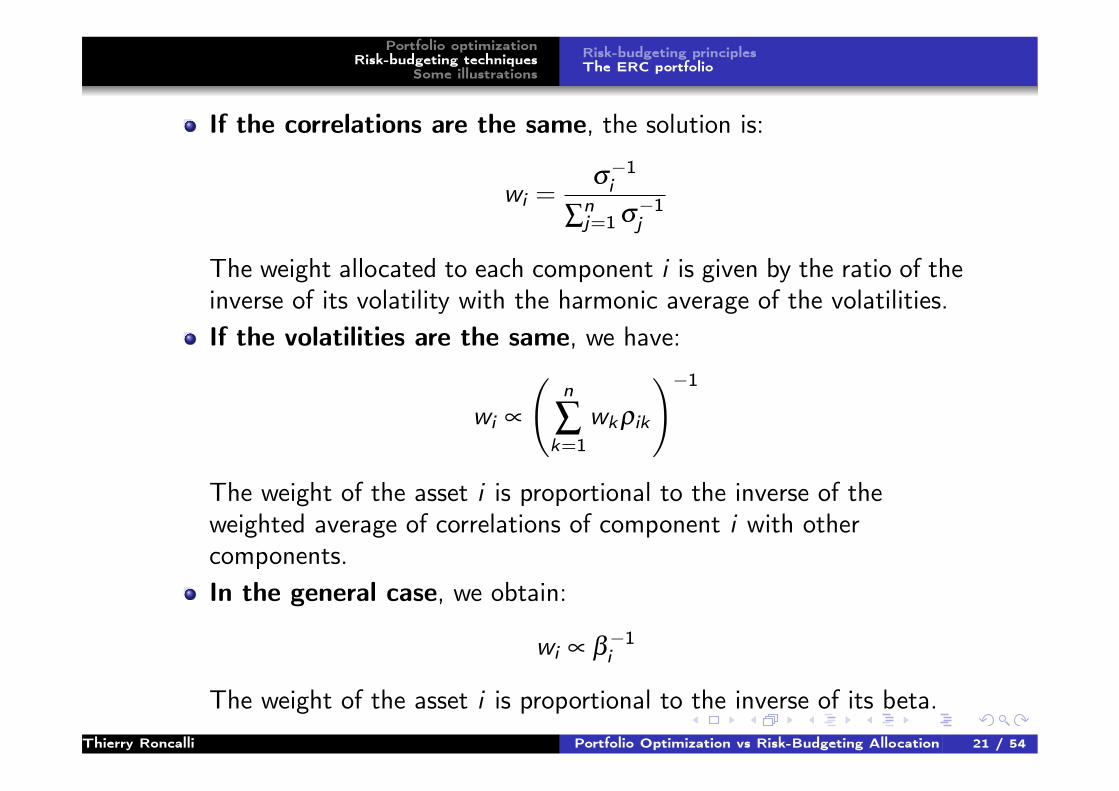
If the correlations are the same, the solution is:
wi =σ−1i
∑nj=1 σ
−1j
The weight allocated to each component i is given by the ratio of theinverse of its volatility with the harmonic average of the volatilities.If the volatilities are the same, we have:
wi ∝
(n
∑k=1
wkρik
)−1The weight of the asset i is proportional to the inverse of theweighted average of correlations of component i with othercomponents.In the general case, we obtain:
wi ∝ β−1i
The weight of the asset i is proportional to the inverse of its beta.Thierry Roncalli Portfolio Optimization vs Risk-Budgeting Allocation 21 / 54

Portfolio optimizationRisk-budgeting techniques
Some illustrationsRisk-budgeting principlesThe ERC portfolio
The ERC portfolio is the tangency portfolio if all the assets have thesame Sharpe ratio and if the correlation is uniform (one-factormodel).Let us consider the minimum variance portfolio with a constantcorrelation matrix Cn (ρ). The solution is:
wi =−((n−1)ρ +1)σ
−2i + ρ ∑
nj=1 (σiσj)
−1
∑nk=1
(−((n−1)ρ +1)σ
−2k + ρ ∑
nj=1 (σkσj)
−1)
The lower bound of Cn (ρ) is achieved for ρ =−(n−1)−1 and wehave:
wi =∑
nj=1 (σiσj)
−1
∑nk=1 ∑
nj=1 (σkσj)
−1 =σ−1i
∑nk=1 σ
−1k→ erc
The ERC portfolio minimizes the Gini and Herfindal indexes appliedto the risk measure.
Thierry Roncalli Portfolio Optimization vs Risk-Budgeting Allocation 22 / 54
Portfolio optimizationRisk-budgeting techniques
Some illustrations
Risk-based indexationRisk parity fundsBond portfolios management
Pros and cons of market-cap indexation
Pros of market-cap indexation
A convenient and recognized approach to participate to broadequity markets.Management simplicity: low turnover & transaction costs.
Cons of market-cap indexationTrend-following strategy: momentum bias leads to bubble risk exposure as weight ofbest performers ever increases.⇒ Mid 2007, financial stocks represent 40% of the Eurostoxx 50 index.
Growth biais as high valuation multiples stocks weight more than low-multiple stockswith equivalent realised earnings.⇒ Mid 2000, the 8 stocks of the technology/telecom sectors represent 35% of theEurostoxx 50 index.⇒ 21/2 years later after the dot.com bubble, these two sectors represent 12%.
Concentrated portfolios.⇒ The top 100 market caps of the S&P 500 account for around 70%.
Lack of risk diversification and high drawdown risk: no portfolio construction rules leadsto concentration issues (e.g. sectors, stocks).
Thierry Roncalli Portfolio Optimization vs Risk-Budgeting Allocation 23 / 54

Portfolio optimizationRisk-budgeting techniques
Some illustrations
Risk-based indexationRisk parity fundsBond portfolios management
Alternative-weighted indexation
Alternative-weighted indexation aims at building passive indexes wherethe weights are not based on market capitalization.
Two sets of responses:1 Fundamental indexation ⇒ promising alpha
1 Dividend yield indexation2 RAFI indexation
2 Risk-based indexation ⇒ promising diversification1 Equally weighted (1/n)2 Minimum-variance portfolio3 ERC portfolio4 MDP/MSR portfolio
Thierry Roncalli Portfolio Optimization vs Risk-Budgeting Allocation 24 / 54
Portfolio optimizationRisk-budgeting techniques
Some illustrations
Risk-based indexationRisk parity fundsBond portfolios management
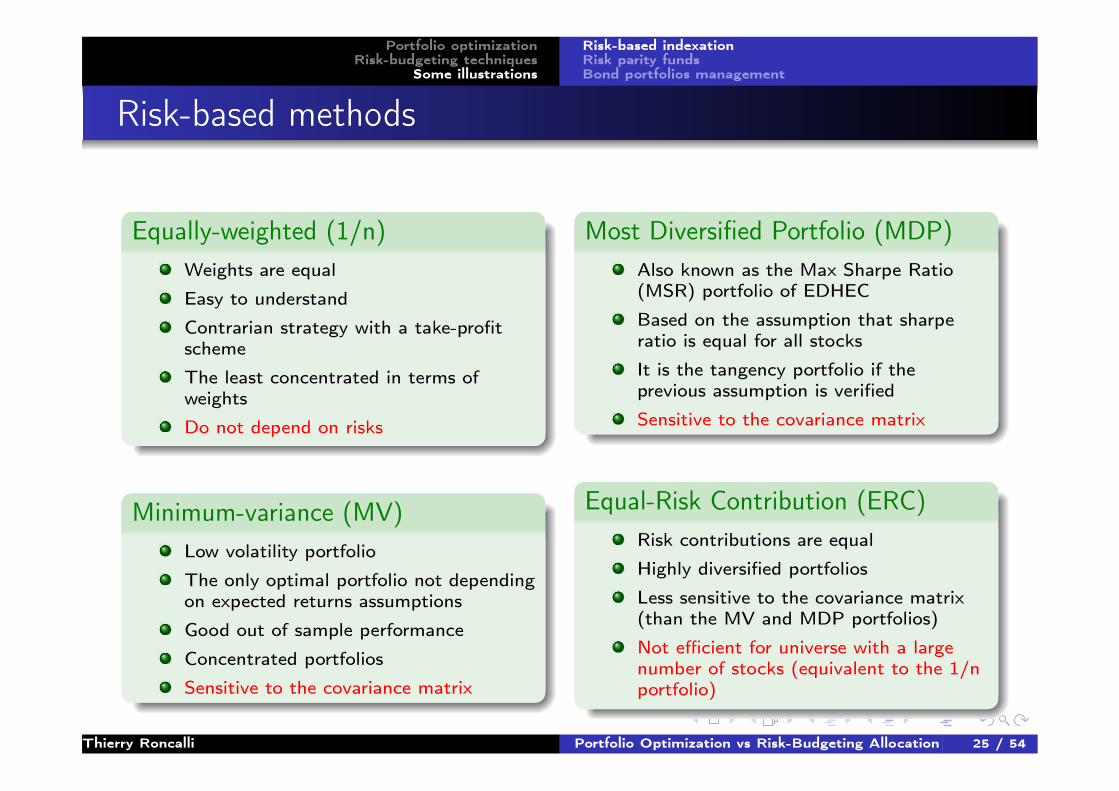
Risk-based methods
Equally-weighted (1/n)Weights are equal
Easy to understand
Contrarian strategy with a take-profitscheme
The least concentrated in terms ofweights
Do not depend on risks
Minimum-variance (MV)Low volatility portfolio
The only optimal portfolio not dependingon expected returns assumptions
Good out of sample performance
Concentrated portfolios
Sensitive to the covariance matrix
Most Diversified Portfolio (MDP)Also known as the Max Sharpe Ratio(MSR) portfolio of EDHEC
Based on the assumption that sharperatio is equal for all stocks
It is the tangency portfolio if theprevious assumption is verified
Sensitive to the covariance matrix
Equal-Risk Contribution (ERC)Risk contributions are equal
Highly diversified portfolios
Less sensitive to the covariance matrix(than the MV and MDP portfolios)
Not efficient for universe with a largenumber of stocks (equivalent to the 1/nportfolio)
Thierry Roncalli Portfolio Optimization vs Risk-Budgeting Allocation 25 / 54

Portfolio optimizationRisk-budgeting techniques
Some illustrations
Risk-based indexationRisk parity fundsBond portfolios management
Comparison of the 4 Methods
In terms of bets��
� ∃i : wi = 0 (MV - MDP)
∀i : wi 6= 0 (1/n - ERC)
In terms of risk factors�
�
�
�
wi = wj (1/n)∂ σ(w)
∂ wi= ∂ σ(w)
∂ wj(MV)
wi × ∂ σ(w)∂ wi
= wj × ∂ σ(w)∂ wj
(ERC)1σi× ∂ σ(w)
∂ wi= 1
σj× ∂ σ(w)
∂ wj(MDP)
Thierry Roncalli Portfolio Optimization vs Risk-Budgeting Allocation 26 / 54
Portfolio optimizationRisk-budgeting techniques
Some illustrations
Risk-based indexationRisk parity fundsBond portfolios management
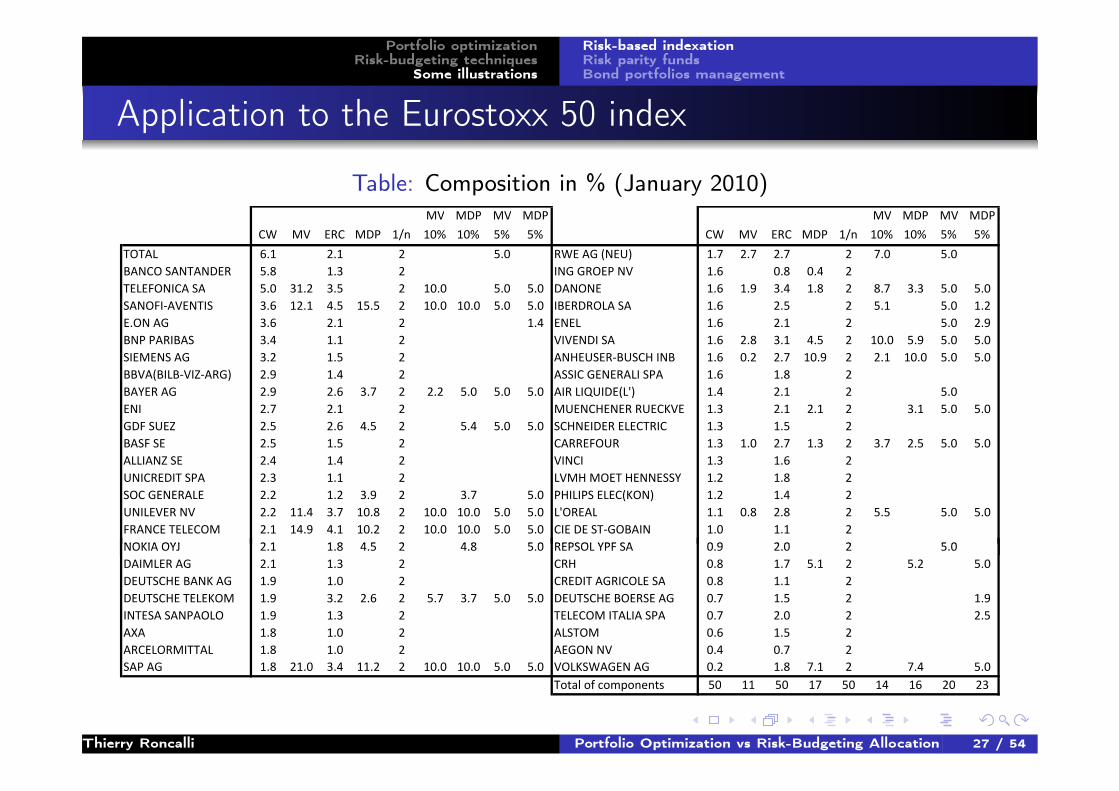
Application to the Eurostoxx 50 index
Table: Composition in % (January 2010)MV MDP MV MDP MV MDP MV MDP
CW MV ERC MDP 1/n 10% 10% 5% 5% CW MV ERC MDP 1/n 10% 10% 5% 5%
TOTAL 6.1 2.1 2 5.0 RWE AG (NEU) 1.7 2.7 2.7 2 7.0 5.0
BANCO SANTANDER 5.8 1.3 2 ING GROEP NV 1.6 0.8 0.4 2
TELEFONICA SA 5.0 31.2 3.5 2 10.0 5.0 5.0 DANONE 1.6 1.9 3.4 1.8 2 8.7 3.3 5.0 5.0
SANOFI-AVENTIS 3.6 12.1 4.5 15.5 2 10.0 10.0 5.0 5.0 IBERDROLA SA 1.6 2.5 2 5.1 5.0 1.2
E.ON AG 3.6 2.1 2 1.4 ENEL 1.6 2.1 2 5.0 2.9
BNP PARIBAS 3.4 1.1 2 VIVENDI SA 1.6 2.8 3.1 4.5 2 10.0 5.9 5.0 5.0
SIEMENS AG 3.2 1.5 2 ANHEUSER-BUSCH INB 1.6 0.2 2.7 10.9 2 2.1 10.0 5.0 5.0
BBVA(BILB-VIZ-ARG) 2.9 1.4 2 ASSIC GENERALI SPA 1.6 1.8 2
BAYER AG 2.9 2.6 3.7 2 2.2 5.0 5.0 5.0 AIR LIQUIDE(L') 1.4 2.1 2 5.0
ENI 2.7 2.1 2 MUENCHENER RUECKVE 1.3 2.1 2.1 2 3.1 5.0 5.0
GDF SUEZ 2.5 2.6 4.5 2 5.4 5.0 5.0 SCHNEIDER ELECTRIC 1.3 1.5 2
BASF SE 2.5 1.5 2 CARREFOUR 1.3 1.0 2.7 1.3 2 3.7 2.5 5.0 5.0
ALLIANZ SE 2.4 1.4 2 VINCI 1.3 1.6 2
UNICREDIT SPA 2.3 1.1 2 LVMH MOET HENNESSY 1.2 1.8 2
SOC GENERALE 2.2 1.2 3.9 2 3.7 5.0 PHILIPS ELEC(KON) 1.2 1.4 2
UNILEVER NV 2.2 11.4 3.7 10.8 2 10.0 10.0 5.0 5.0 L'OREAL 1.1 0.8 2.8 2 5.5 5.0 5.0
FRANCE TELECOM 2.1 14.9 4.1 10.2 2 10.0 10.0 5.0 5.0 CIE DE ST-GOBAIN 1.0 1.1 2
NOKIA OYJ 2.1 1.8 4.5 2 4.8 5.0 REPSOL YPF SA 0.9 2.0 2 5.0NOKIA OYJ 2.1 1.8 4.5 2 4.8 5.0 REPSOL YPF SA 0.9 2.0 2 5.0
DAIMLER AG 2.1 1.3 2 CRH 0.8 1.7 5.1 2 5.2 5.0
DEUTSCHE BANK AG 1.9 1.0 2 CREDIT AGRICOLE SA 0.8 1.1 2
DEUTSCHE TELEKOM 1.9 3.2 2.6 2 5.7 3.7 5.0 5.0 DEUTSCHE BOERSE AG 0.7 1.5 2 1.9
INTESA SANPAOLO 1.9 1.3 2 TELECOM ITALIA SPA 0.7 2.0 2 2.5
AXA 1.8 1.0 2 ALSTOM 0.6 1.5 2
ARCELORMITTAL 1.8 1.0 2 AEGON NV 0.4 0.7 2
SAP AG 1.8 21.0 3.4 11.2 2 10.0 10.0 5.0 5.0 VOLKSWAGEN AG 0.2 1.8 7.1 2 7.4 5.0
Total of components 50 11 50 17 50 14 16 20 23
Thierry Roncalli Portfolio Optimization vs Risk-Budgeting Allocation 27 / 54

Portfolio optimizationRisk-budgeting techniques
Some illustrations
Risk-based indexationRisk parity fundsBond portfolios management
Application to the Eurostoxx 50 index
Figure: Performance of the ERC Eurozone Index (Ticker: SGIXERCE Index)
600
700
800
900
1000
ERC Index Euro Stoxx 50 NR
Cumulated Return 583.8% 264.9%
Annualized Return 10.7% 7.1%
Volatility 21.2% 22.9%
Sharpe Ratio 0.34 0.16
Tracking Error 6.0% NA
Information Ratio 0.60 NA
Beta 0.89 1.00
Max DrawDown -55.1% -64.6%
100
200
300
400
500
Jan-93 Jan-95 Jan-97 Jan-99 Jan-01 Jan-03 Jan-05 Jan-07 Jan-09 Jan-11
ERC Eurozone Index Euro Stoxx 50 NR
Thierry Roncalli Portfolio Optimization vs Risk-Budgeting Allocation 28 / 54
Portfolio optimizationRisk-budgeting techniques
Some illustrations
Risk-based indexationRisk parity fundsBond portfolios management
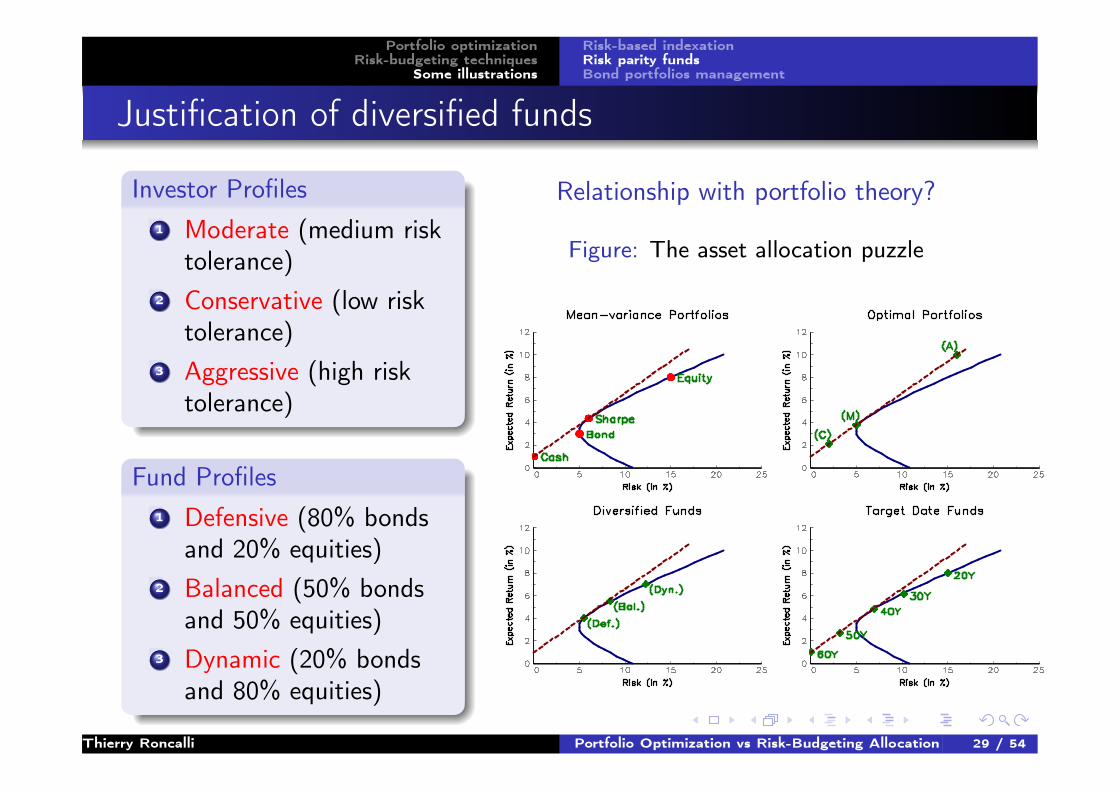
Justification of diversified funds
Investor Profiles1 Moderate (medium risk
tolerance)2 Conservative (low risk
tolerance)3 Aggressive (high risk
tolerance)
Fund Profiles1 Defensive (80% bonds
and 20% equities)2 Balanced (50% bonds
and 50% equities)3 Dynamic (20% bonds
and 80% equities)
Relationship with portfolio theory?
Figure: The asset allocation puzzle
Thierry Roncalli Portfolio Optimization vs Risk-Budgeting Allocation 29 / 54
Portfolio optimizationRisk-budgeting techniques
Some illustrations
Risk-based indexationRisk parity fundsBond portfolios management
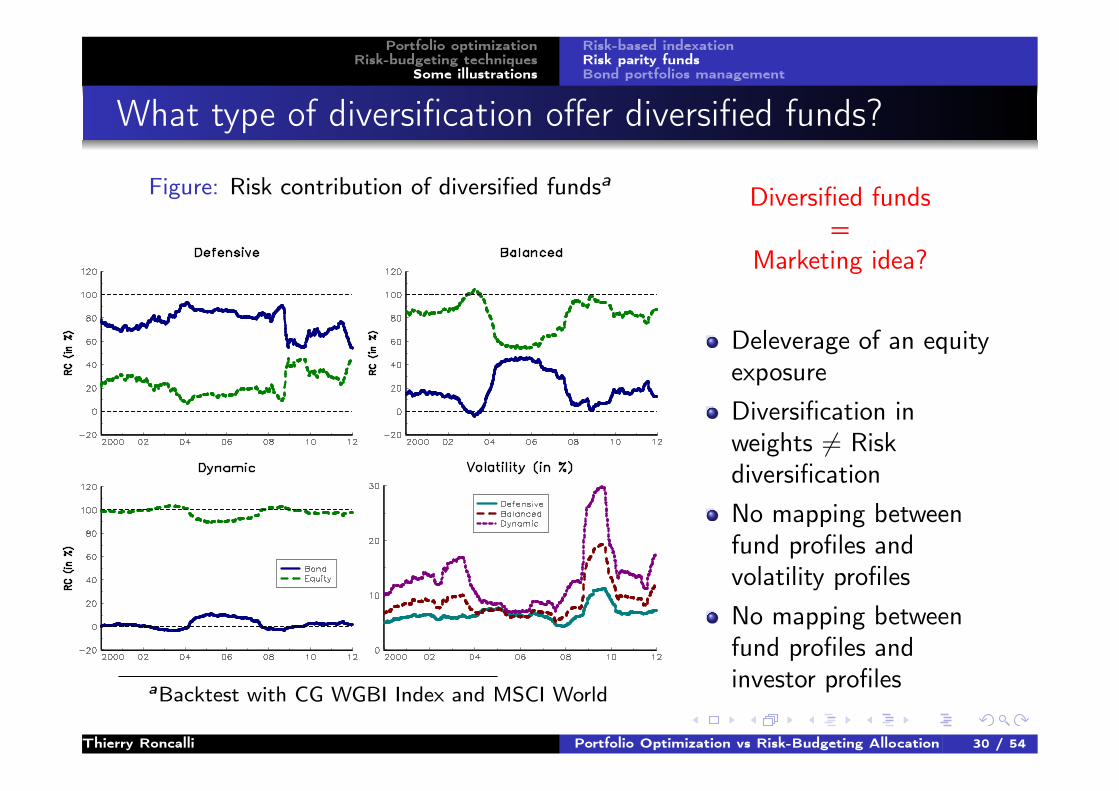
What type of diversification offer diversified funds?
Figure: Risk contribution of diversified fundsa
aBacktest with CG WGBI Index and MSCI World
Diversified funds=
Marketing idea?
Deleverage of an equityexposureDiversification inweights 6= RiskdiversificationNo mapping betweenfund profiles andvolatility profilesNo mapping betweenfund profiles andinvestor profiles
Thierry Roncalli Portfolio Optimization vs Risk-Budgeting Allocation 30 / 54
Portfolio optimizationRisk-budgeting techniques
Some illustrations
Risk-based indexationRisk parity fundsBond portfolios management
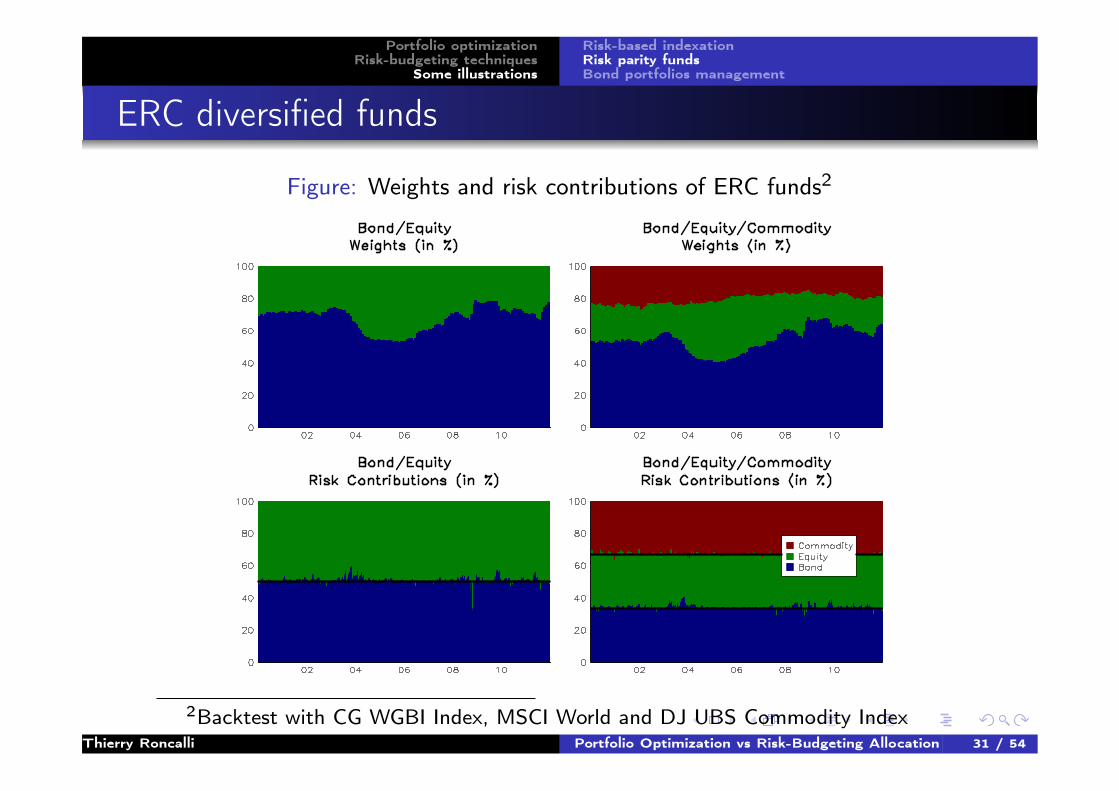
ERC diversified funds
Figure: Weights and risk contributions of ERC funds2
2Backtest with CG WGBI Index, MSCI World and DJ UBS Commodity IndexThierry Roncalli Portfolio Optimization vs Risk-Budgeting Allocation 31 / 54
Portfolio optimizationRisk-budgeting techniques
Some illustrations
Risk-based indexationRisk parity fundsBond portfolios management
Risk parity funds
DefinitionA risk parity fund is an ERC startegy on multi-assets classes.
Some examples
AQR Capital ManagementBridgewaterInvescoLyxor Asset ManagementPanAgora Asset ManagementWegelin Asset Management
Thierry Roncalli Portfolio Optimization vs Risk-Budgeting Allocation 32 / 54
Portfolio optimizationRisk-budgeting techniques
Some illustrations
Risk-based indexationRisk parity fundsBond portfolios management
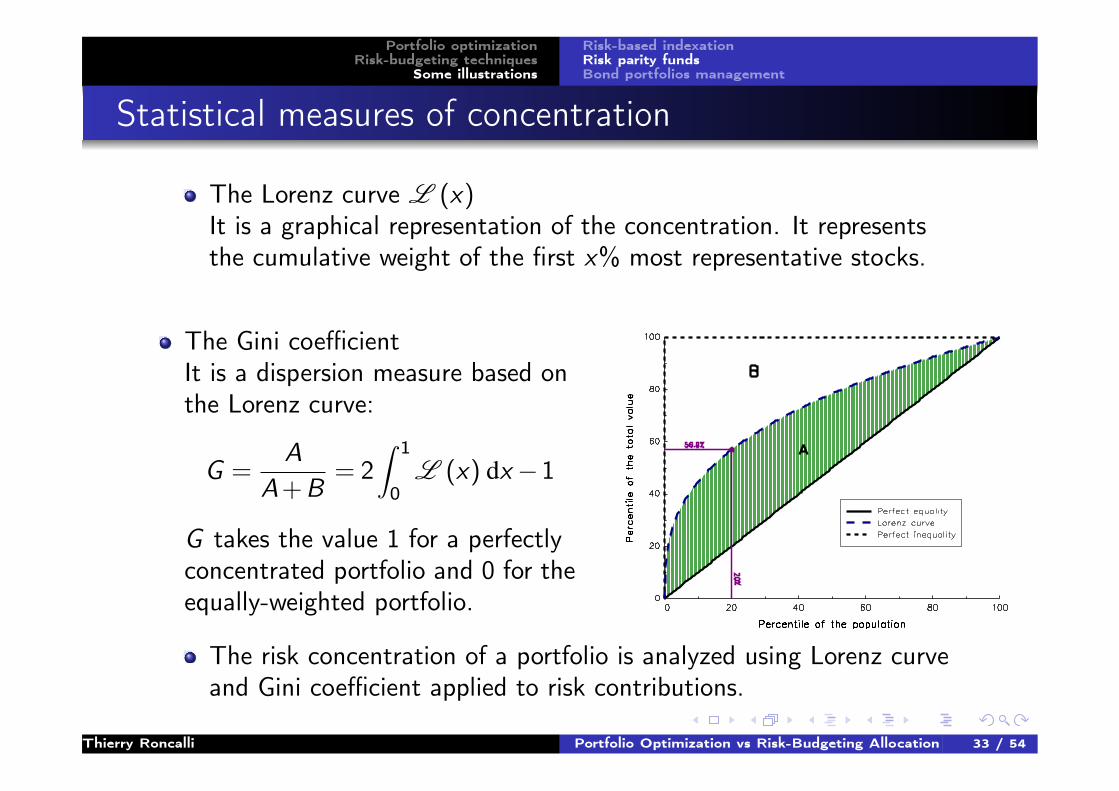
Statistical measures of concentration
The Lorenz curve L (x)It is a graphical representation of the concentration. It representsthe cumulative weight of the first x% most representative stocks.
The Gini coefficientIt is a dispersion measure based onthe Lorenz curve:
G =A
A+B= 2
∫ 1
0L (x) dx−1
G takes the value 1 for a perfectlyconcentrated portfolio and 0 for theequally-weighted portfolio.
The risk concentration of a portfolio is analyzed using Lorenz curveand Gini coefficient applied to risk contributions.
Thierry Roncalli Portfolio Optimization vs Risk-Budgeting Allocation 33 / 54
Portfolio optimizationRisk-budgeting techniques
Some illustrations
Risk-based indexationRisk parity fundsBond portfolios management
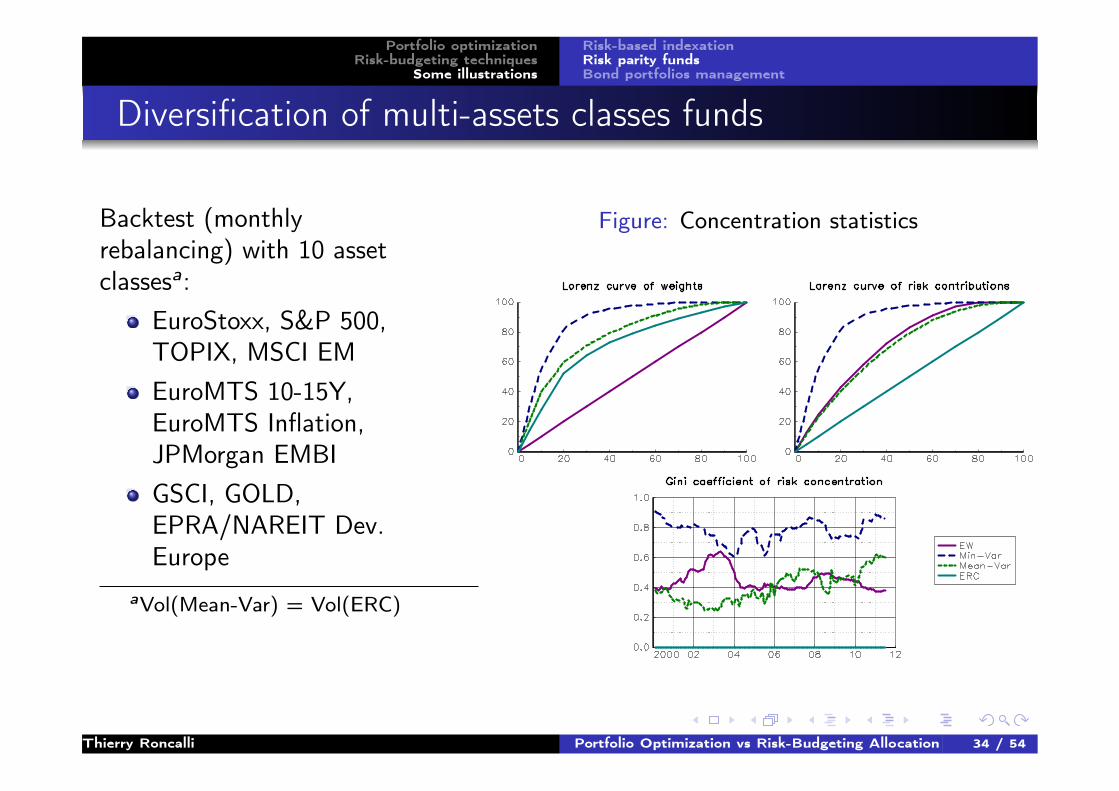
Diversification of multi-assets classes funds
Backtest (monthlyrebalancing) with 10 assetclassesa:
EuroStoxx, S&P 500,TOPIX, MSCI EMEuroMTS 10-15Y,EuroMTS Inflation,JPMorgan EMBIGSCI, GOLD,EPRA/NAREIT Dev.Europe
aVol(Mean-Var) = Vol(ERC)
Figure: Concentration statistics
Thierry Roncalli Portfolio Optimization vs Risk-Budgeting Allocation 34 / 54
Portfolio optimizationRisk-budgeting techniques
Some illustrations
Risk-based indexationRisk parity fundsBond portfolios management
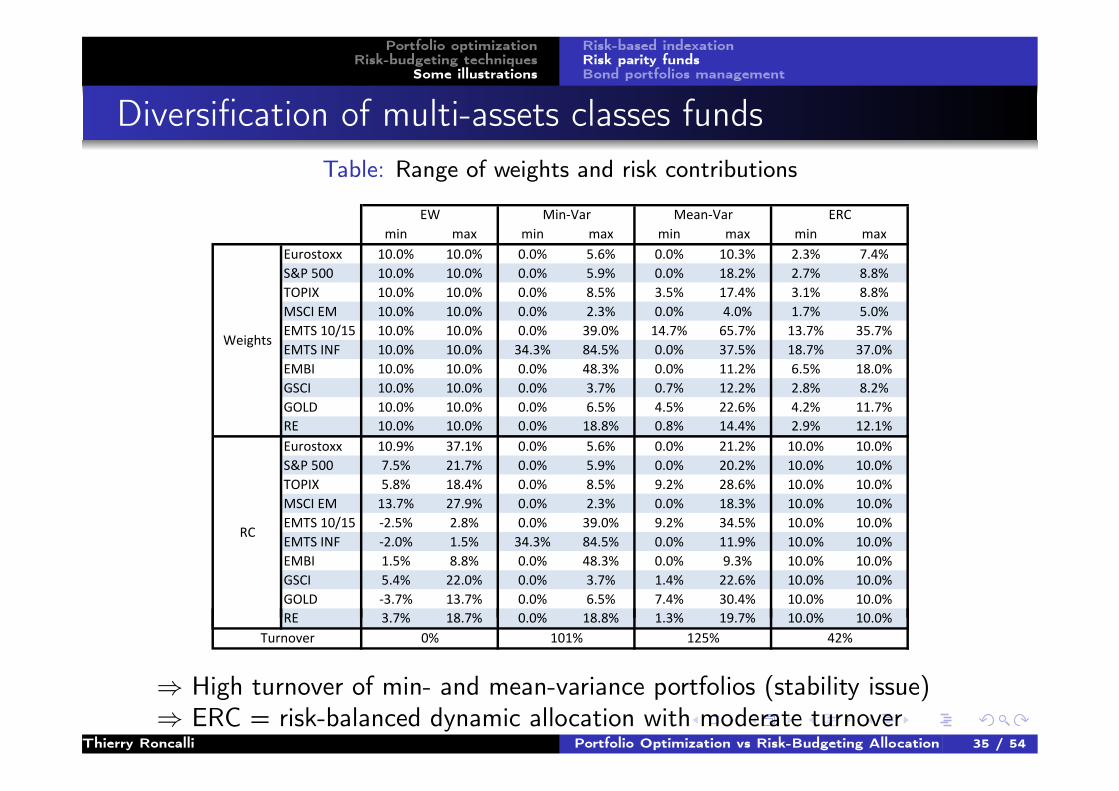
Diversification of multi-assets classes fundsTable: Range of weights and risk contributions
min max min max min max min max
Eurostoxx 10.0% 10.0% 0.0% 5.6% 0.0% 10.3% 2.3% 7.4%
S&P 500 10.0% 10.0% 0.0% 5.9% 0.0% 18.2% 2.7% 8.8%
TOPIX 10.0% 10.0% 0.0% 8.5% 3.5% 17.4% 3.1% 8.8%
MSCI EM 10.0% 10.0% 0.0% 2.3% 0.0% 4.0% 1.7% 5.0%
EMTS 10/15 10.0% 10.0% 0.0% 39.0% 14.7% 65.7% 13.7% 35.7%
EMTS INF 10.0% 10.0% 34.3% 84.5% 0.0% 37.5% 18.7% 37.0%
EMBI 10.0% 10.0% 0.0% 48.3% 0.0% 11.2% 6.5% 18.0%
GSCI 10.0% 10.0% 0.0% 3.7% 0.7% 12.2% 2.8% 8.2%
GOLD 10.0% 10.0% 0.0% 6.5% 4.5% 22.6% 4.2% 11.7%
RE 10.0% 10.0% 0.0% 18.8% 0.8% 14.4% 2.9% 12.1%
Eurostoxx 10.9% 37.1% 0.0% 5.6% 0.0% 21.2% 10.0% 10.0%
S&P 500 7.5% 21.7% 0.0% 5.9% 0.0% 20.2% 10.0% 10.0%
TOPIX 5.8% 18.4% 0.0% 8.5% 9.2% 28.6% 10.0% 10.0%
MSCI EM 13.7% 27.9% 0.0% 2.3% 0.0% 18.3% 10.0% 10.0%
EMTS 10/15 -2.5% 2.8% 0.0% 39.0% 9.2% 34.5% 10.0% 10.0%
EMTS INF -2.0% 1.5% 34.3% 84.5% 0.0% 11.9% 10.0% 10.0%
EMBI 1.5% 8.8% 0.0% 48.3% 0.0% 9.3% 10.0% 10.0%
GSCI 5.4% 22.0% 0.0% 3.7% 1.4% 22.6% 10.0% 10.0%
GOLD -3.7% 13.7% 0.0% 6.5% 7.4% 30.4% 10.0% 10.0%
RE 3.7% 18.7% 0.0% 18.8% 1.3% 19.7% 10.0% 10.0%
Weights
RC
EW Min-Var Mean-Var ERC
RE 3.7% 18.7% 0.0% 18.8% 1.3% 19.7% 10.0% 10.0%
Turnover 0% 101% 125% 42%
⇒ High turnover of min- and mean-variance portfolios (stability issue)⇒ ERC = risk-balanced dynamic allocation with moderate turnover
Thierry Roncalli Portfolio Optimization vs Risk-Budgeting Allocation 35 / 54
Portfolio optimizationRisk-budgeting techniques
Some illustrations
Risk-based indexationRisk parity fundsBond portfolios management
Bond portfolios management
1 Cap-weighted indexation for equities ⇒ debt-weighted indexation forbonds
2 Fund management driven by the search of yield
⇒ Time to rethink bond indexes? (Toloui, 2010)
Thierry Roncalli Portfolio Optimization vs Risk-Budgeting Allocation 36 / 54
Portfolio optimizationRisk-budgeting techniques
Some illustrations
Risk-based indexationRisk parity fundsBond portfolios management
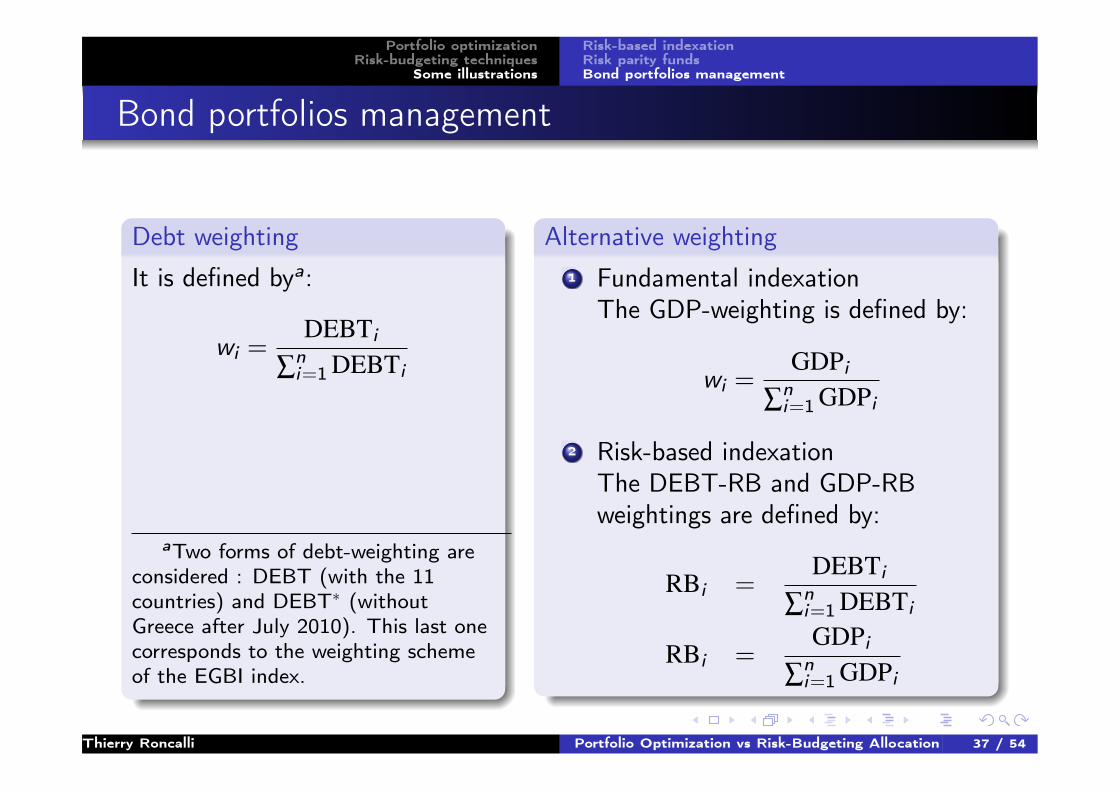
Bond portfolios management
Debt weighting
It is defined bya:
wi =DEBTi
∑ni=1 DEBTi
aTwo forms of debt-weighting areconsidered : DEBT (with the 11countries) and DEBT∗ (withoutGreece after July 2010). This last onecorresponds to the weighting schemeof the EGBI index.
Alternative weighting1 Fundamental indexation
The GDP-weighting is defined by:
wi =GDPi
∑ni=1 GDPi
2 Risk-based indexationThe DEBT-RB and GDP-RBweightings are defined by:
RBi =DEBTi
∑ni=1 DEBTi
RBi =GDPi
∑ni=1 GDPi
Thierry Roncalli Portfolio Optimization vs Risk-Budgeting Allocation 37 / 54

Portfolio optimizationRisk-budgeting techniques
Some illustrations
Risk-based indexationRisk parity fundsBond portfolios management
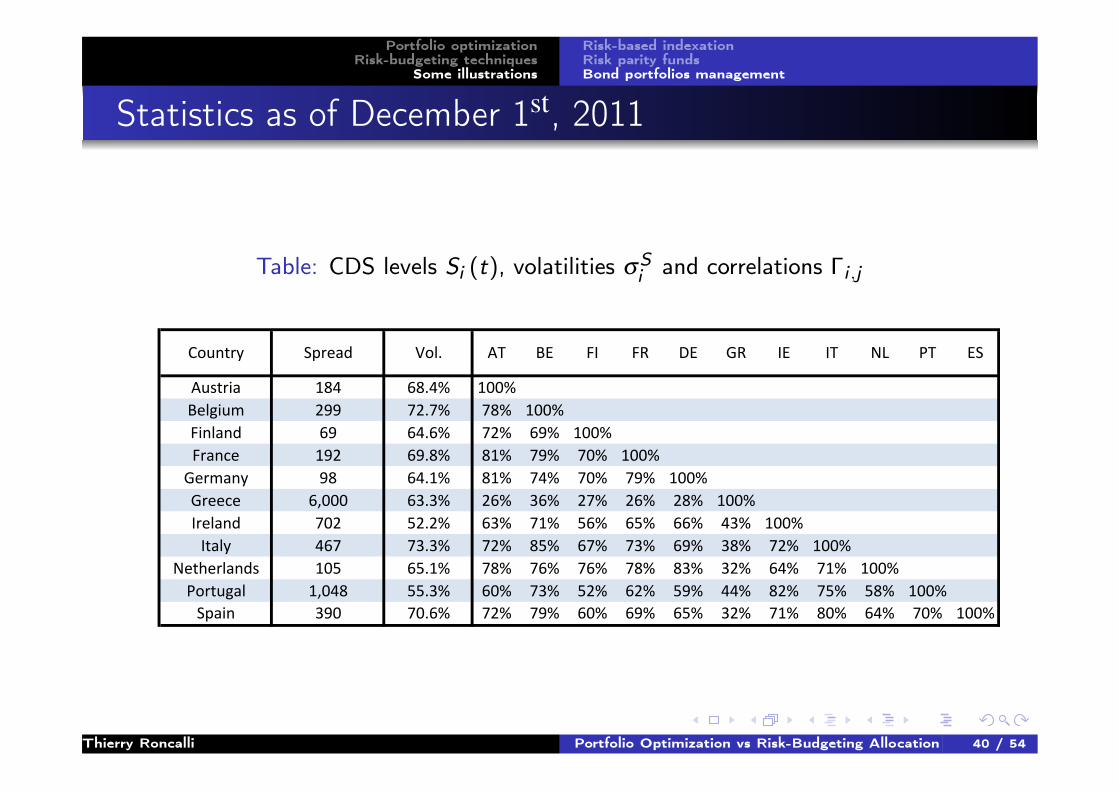
Choosing the right measure of credit risk
Volatility of price returns 6= a good measure of credit riskCorrelation of price returns 6= a good measure of contagionA better measure is the yield spread, but it is difficult to computebecause it is difficult to define the reference (risk-free) rate.
⇒ One of the best measure is the CDS spread (it does not depend onthe currency, the yield curve or the duration).
The CDS model
Let Si (t) be the spread of the i th issuer. We have:
dSi (t) = σSi ·Si (t) ·dWi (t)
Moreover, we assume that the correlation between the brownian motionsWi (t) and Wj (t) is Γi ,j .
Thierry Roncalli Portfolio Optimization vs Risk-Budgeting Allocation 38 / 54

Portfolio optimizationRisk-budgeting techniques
Some illustrations
Risk-based indexationRisk parity fundsBond portfolios management
Computing the credit risk measure of a bond portfolio
Let w = (w1, . . . ,wn) be the weights of bonds in the portfolio. The riskmeasure is:
R (x) =√
w>Σw =√
∑ni=1∑
nj=1wiwjΣi ,j
with Σi ,j = Γi ,j ·σBi ·σB
j and σBi = Di ·σS
i ·Si (t), where Di is theduration of the bond i , σS
i is the CDS volatility of the correspondingissuer, Si (t) is the CDS level and Γi ,j is the correlation between the CDSrelative variations of issuers corresponding to the bonds i and j .
R (w) is the volatility of the CDS basket which would perfectly hedge thecredit risk of the bond portfolio.
R (w) depends on 3 “CDS” parameters Si (t), σSi and Γi ,j and two
“portfolio” parameters wi and Di .
Thierry Roncalli Portfolio Optimization vs Risk-Budgeting Allocation 39 / 54
Portfolio optimizationRisk-budgeting techniques
Some illustrations
Risk-based indexationRisk parity fundsBond portfolios management
Statistics as of December 1st, 2011
Table: CDS levels Si (t), volatilities σSi and correlations Γi ,j
Austria 184 68.4% 100%
Belgium 299 72.7% 78% 100%
Finland 69 64.6% 72% 69% 100%
France 192 69.8% 81% 79% 70% 100%
Germany 98 64.1% 81% 74% 70% 79% 100%
Greece 6,000 63.3% 26% 36% 27% 26% 28% 100%
Ireland 702 52.2% 63% 71% 56% 65% 66% 43% 100%
Italy 467 73.3% 72% 85% 67% 73% 69% 38% 72% 100%
Netherlands 105 65.1% 78% 76% 76% 78% 83% 32% 64% 71% 100%
Portugal 1,048 55.3% 60% 73% 52% 62% 59% 44% 82% 75% 58% 100%
Spain 390 70.6% 72% 79% 60% 69% 65% 32% 71% 80% 64% 70% 100%
Vol.Country Spread AT BE FI FR DE ESGR IE IT NL PT
Thierry Roncalli Portfolio Optimization vs Risk-Budgeting Allocation 40 / 54

Portfolio optimizationRisk-budgeting techniques
Some illustrations
Risk-based indexationRisk parity fundsBond portfolios management
Defining the risk contribution
Our credit risk measure R (w) =√
w>Σw is a convex risk measure. Itmeans that:
R (w1, . . . ,wn) =n
∑i=1
wi ·∂ R (w1, . . . ,wm)
∂ wi
=n
∑i=1
RCi
We can then decompose the risk measure exactly by n individual sourcesof risk.
The risk contribution RCi is an increasing function of the parameters Di ,Si (t) and σS
i .
Thierry Roncalli Portfolio Optimization vs Risk-Budgeting Allocation 41 / 54

Portfolio optimizationRisk-budgeting techniques
Some illustrations
Risk-based indexationRisk parity fundsBond portfolios management
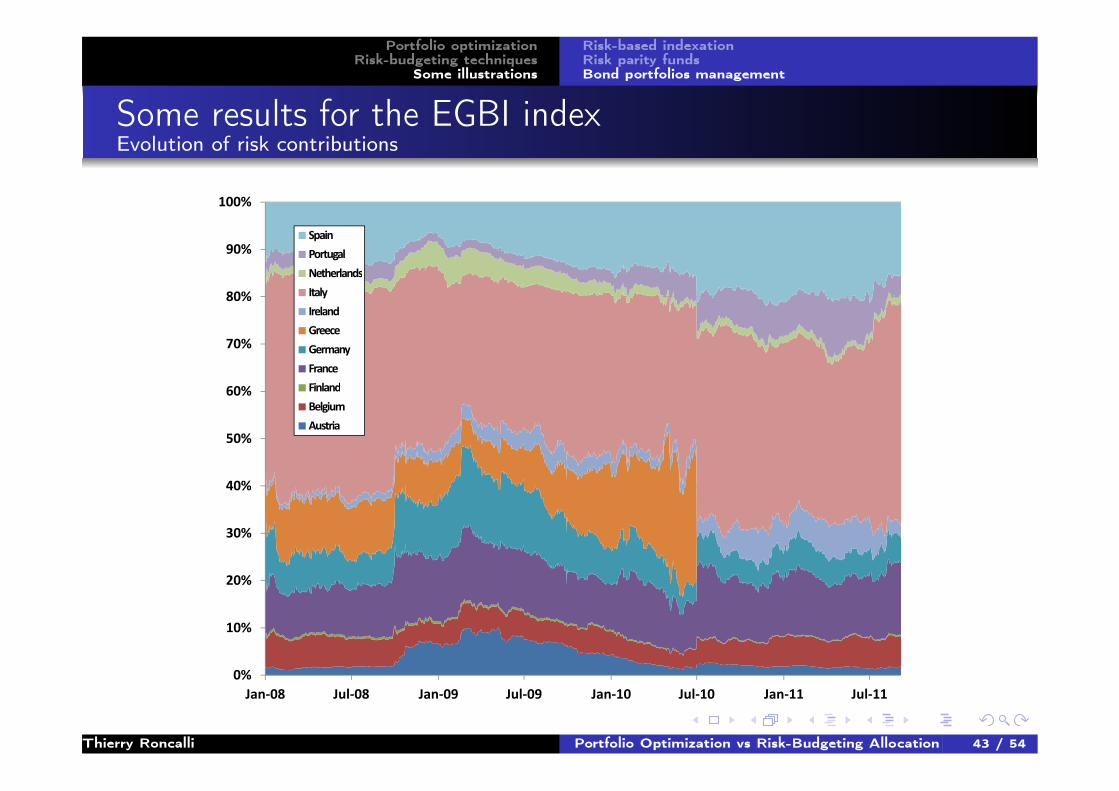
Some results for the EGBI index
Figure: EGBI weights and risk contributions
Weights RC Weights RC Weights RC Weights RC Weights RC
Austria 4.1% 1.7% 3.6% 7.7% 4.1% 2.3% 4.3% 1.5% 4.3% 1.8%
Belgium 6.2% 6.1% 6.5% 5.1% 6.3% 5.7% 6.4% 6.5% 6.4% 6.7%
Finland 1.2% 0.4% 1.3% 0.5% 1.3% 0.2% 1.6% 0.2% 1.6% 0.3%
France 20.5% 9.8% 20.4% 13.2% 22.2% 15.1% 23.1% 13.3% 23.1% 15.5%
Germany 24.4% 6.1% 22.3% 13.0% 22.9% 6.0% 22.1% 5.3% 22.1% 5.5%
Greece 4.9% 11.4% 5.4% 8.5% 0.0% 0.0% 0.0% 0.0% 0.0% 0.0%
Ireland 1.0% 1.3% 1.5% 4.3% 2.1% 3.3% 1.4% 5.4% 1.4% 2.7%
Italy 22.1% 45.2% 22.4% 29.5% 23.4% 38.7% 23.1% 38.5% 23.1% 46.3%
Netherlands 5.3% 1.7% 5.3% 4.1% 6.1% 1.6% 6.2% 1.2% 6.2% 1.5%
Portugal 2.4% 3.9% 2.3% 2.3% 2.1% 6.3% 1.6% 6.6% 1.6% 4.4%
Spain 7.8% 12.4% 9.1% 11.8% 9.6% 20.9% 10.3% 21.3% 10.3% 15.5%
Sovereign
Risk0.70%
September-11
2.59% 6.12% 4.02% 8.12%
CountryJuly-11July-10July-09July-08
Thierry Roncalli Portfolio Optimization vs Risk-Budgeting Allocation 42 / 54
Portfolio optimizationRisk-budgeting techniques
Some illustrations
Risk-based indexationRisk parity fundsBond portfolios management
Some results for the EGBI indexEvolution of risk contributions
40%
50%
60%
70%
80%
90%
100%
Spain
Portugal
Netherlands
Italy
Ireland
Greece
Germany
France
Finland
Belgium
Austria
0%
10%
20%
30%
40%
Jan-08 Jul-08 Jan-09 Jul-09 Jan-10 Jul-10 Jan-11 Jul-11
Thierry Roncalli Portfolio Optimization vs Risk-Budgeting Allocation 43 / 54

Portfolio optimizationRisk-budgeting techniques
Some illustrations
Risk-based indexationRisk parity fundsBond portfolios management
GDP indexation
Figure: Weights and risk contributions of the GDP indexation
GDP RC GDP RC GDP RC GDP RC GDP RC
Austria 3.1% 1.4% 3.1% 7.0% 3.1% 1.7% 3.2% 1.0% 3.2% 1.3%
Belgium 3.8% 4.0% 3.8% 3.2% 3.9% 3.3% 4.0% 3.5% 4.0% 4.0%
Finland 2.0% 0.8% 1.9% 0.7% 2.0% 0.3% 2.1% 0.3% 2.1% 0.3%
France 21.2% 11.2% 21.5% 14.9% 21.4% 13.4% 21.5% 10.6% 21.5% 13.8%
Germany 27.4% 7.6% 27.2% 17.0% 27.7% 6.7% 27.9% 5.8% 27.9% 6.7%
Greece 2.6% 6.2% 2.7% 4.4% 2.6% 15.7% 2.4% 19.8% 2.4% 13.8%
Ireland 2.0% 3.0% 1.9% 5.6% 1.8% 2.6% 1.7% 5.9% 1.7% 3.3%
Italy 17.4% 37.5% 17.3% 23.5% 17.2% 25.8% 17.0% 23.9% 17.0% 32.6%
Netherlands 6.5% 2.5% 6.5% 5.3% 6.5% 1.6% 6.6% 1.2% 6.6% 1.6%
Portugal 1.9% 3.3% 1.9% 2.0% 1.9% 5.3% 1.9% 6.7% 1.9% 5.1%
Spain 12.0% 22.6% 12.0% 16.5% 11.8% 23.7% 11.8% 21.4% 11.8% 17.5%
Sovereign
Risk
September-11
0.64% 2.47% 6.59% 4.56% 8.26%
CountryJuly-08 July-09 July-10 July-11
⇒ Debt and GDP indexations produces similar sovereign credit riskmeasures.
Thierry Roncalli Portfolio Optimization vs Risk-Budgeting Allocation 44 / 54

Portfolio optimizationRisk-budgeting techniques
Some illustrations
Risk-based indexationRisk parity fundsBond portfolios management
GDP indexationEvolution of risk contributions
40%
50%
60%
70%
80%
90%
100%
Spain
Portugal
Netherlands
Italy
Ireland
Greece
Germany
France
Finland
Belgium
Austria
0%
10%
20%
30%
40%
Jan-08 Jul-08 Jan-09 Jul-09 Jan-10 Jul-10 Jan-11 Jul-11
Thierry Roncalli Portfolio Optimization vs Risk-Budgeting Allocation 45 / 54
Portfolio optimizationRisk-budgeting techniques
Some illustrations
Risk-based indexationRisk parity fundsBond portfolios management
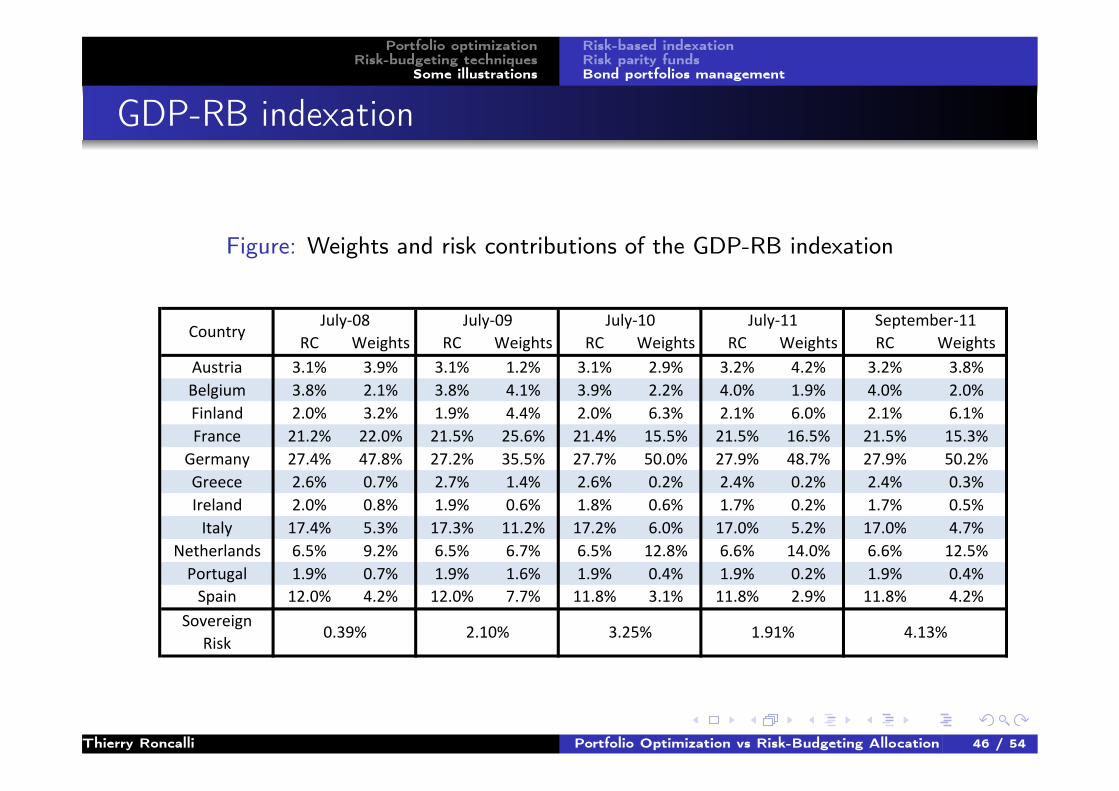
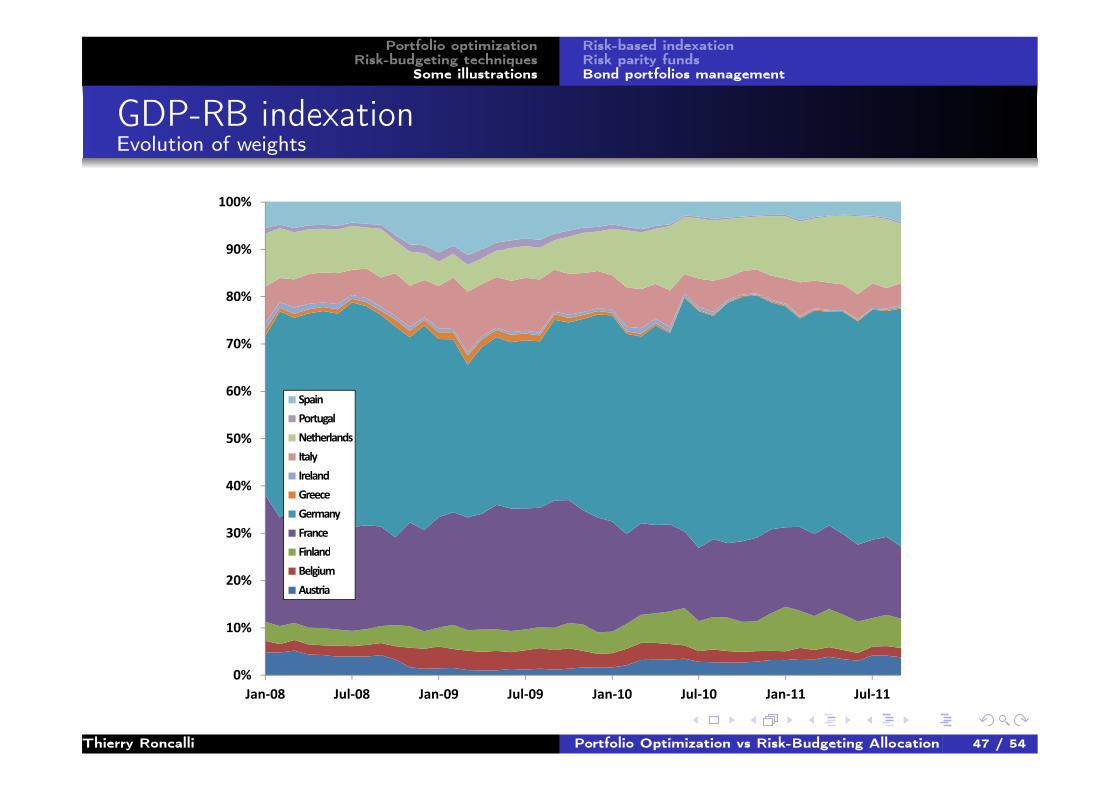
GDP-RB indexation
Figure: Weights and risk contributions of the GDP-RB indexation
RC Weights RC Weights RC Weights RC Weights RC Weights
Austria 3.1% 3.9% 3.1% 1.2% 3.1% 2.9% 3.2% 4.2% 3.2% 3.8%
Belgium 3.8% 2.1% 3.8% 4.1% 3.9% 2.2% 4.0% 1.9% 4.0% 2.0%
Finland 2.0% 3.2% 1.9% 4.4% 2.0% 6.3% 2.1% 6.0% 2.1% 6.1%
France 21.2% 22.0% 21.5% 25.6% 21.4% 15.5% 21.5% 16.5% 21.5% 15.3%
Germany 27.4% 47.8% 27.2% 35.5% 27.7% 50.0% 27.9% 48.7% 27.9% 50.2%
Greece 2.6% 0.7% 2.7% 1.4% 2.6% 0.2% 2.4% 0.2% 2.4% 0.3%
Ireland 2.0% 0.8% 1.9% 0.6% 1.8% 0.6% 1.7% 0.2% 1.7% 0.5%
Italy 17.4% 5.3% 17.3% 11.2% 17.2% 6.0% 17.0% 5.2% 17.0% 4.7%
Netherlands 6.5% 9.2% 6.5% 6.7% 6.5% 12.8% 6.6% 14.0% 6.6% 12.5%
Portugal 1.9% 0.7% 1.9% 1.6% 1.9% 0.4% 1.9% 0.2% 1.9% 0.4%
Spain 12.0% 4.2% 12.0% 7.7% 11.8% 3.1% 11.8% 2.9% 11.8% 4.2%
Sovereign
Risk
September-11
0.39% 2.10% 3.25% 1.91% 4.13%
CountryJuly-08 July-09 July-10 July-11
Thierry Roncalli Portfolio Optimization vs Risk-Budgeting Allocation 46 / 54
Portfolio optimizationRisk-budgeting techniques
Some illustrations
Risk-based indexationRisk parity fundsBond portfolios management
GDP-RB indexationEvolution of weights
40%
50%
60%
70%
80%
90%
100%
Spain
Portugal
Netherlands
Italy
Ireland
0%
10%
20%
30%
40%
Jan-08 Jul-08 Jan-09 Jul-09 Jan-10 Jul-10 Jan-11 Jul-11
Greece
Germany
France
Finland
Belgium
Austria
Thierry Roncalli Portfolio Optimization vs Risk-Budgeting Allocation 47 / 54

Portfolio optimizationRisk-budgeting techniques
Some illustrations
Risk-based indexationRisk parity fundsBond portfolios management
Comparison of the indexing schemesEvolution of the risk measure
Thierry Roncalli Portfolio Optimization vs Risk-Budgeting Allocation 48 / 54
Portfolio optimizationRisk-budgeting techniques
Some illustrations
Risk-based indexationRisk parity fundsBond portfolios management
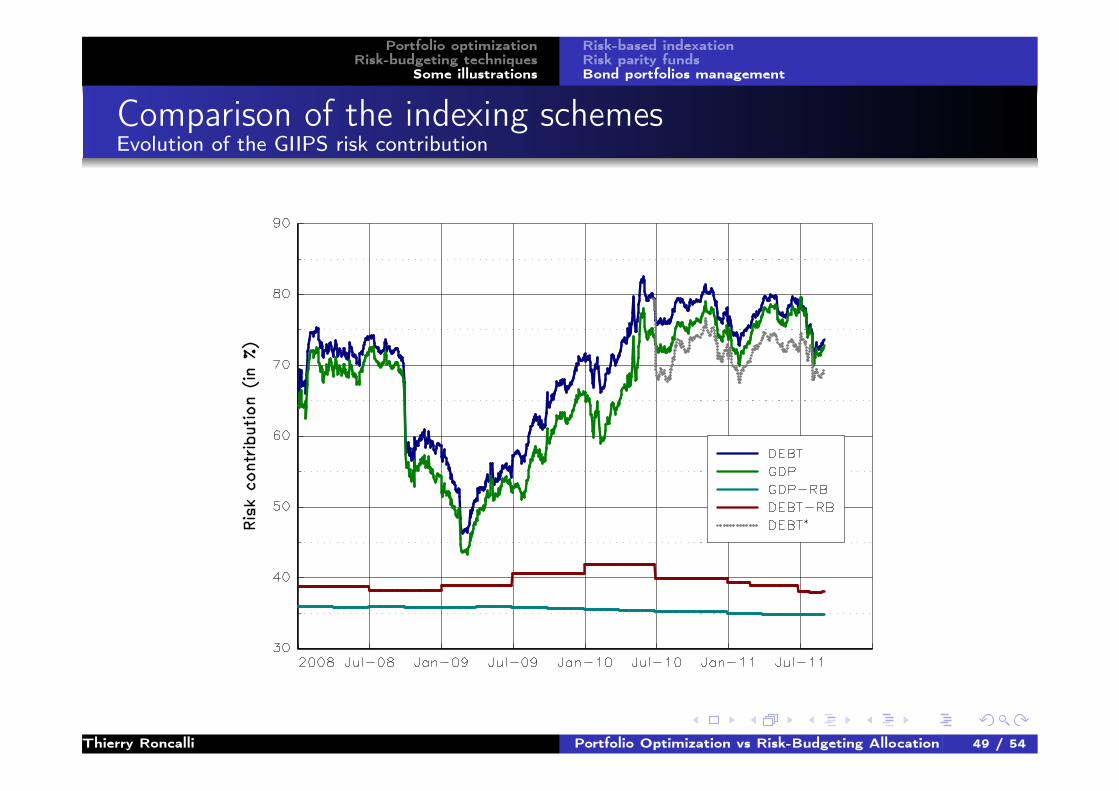
Comparison of the indexing schemesEvolution of the GIIPS risk contribution
Thierry Roncalli Portfolio Optimization vs Risk-Budgeting Allocation 49 / 54

Portfolio optimizationRisk-budgeting techniques
Some illustrations
Risk-based indexationRisk parity fundsBond portfolios management
Comparison of the indexing schemesSimulation of the performance
Thierry Roncalli Portfolio Optimization vs Risk-Budgeting Allocation 50 / 54
Portfolio optimizationRisk-budgeting techniques
Some illustrations
Risk-based indexationRisk parity fundsBond portfolios management
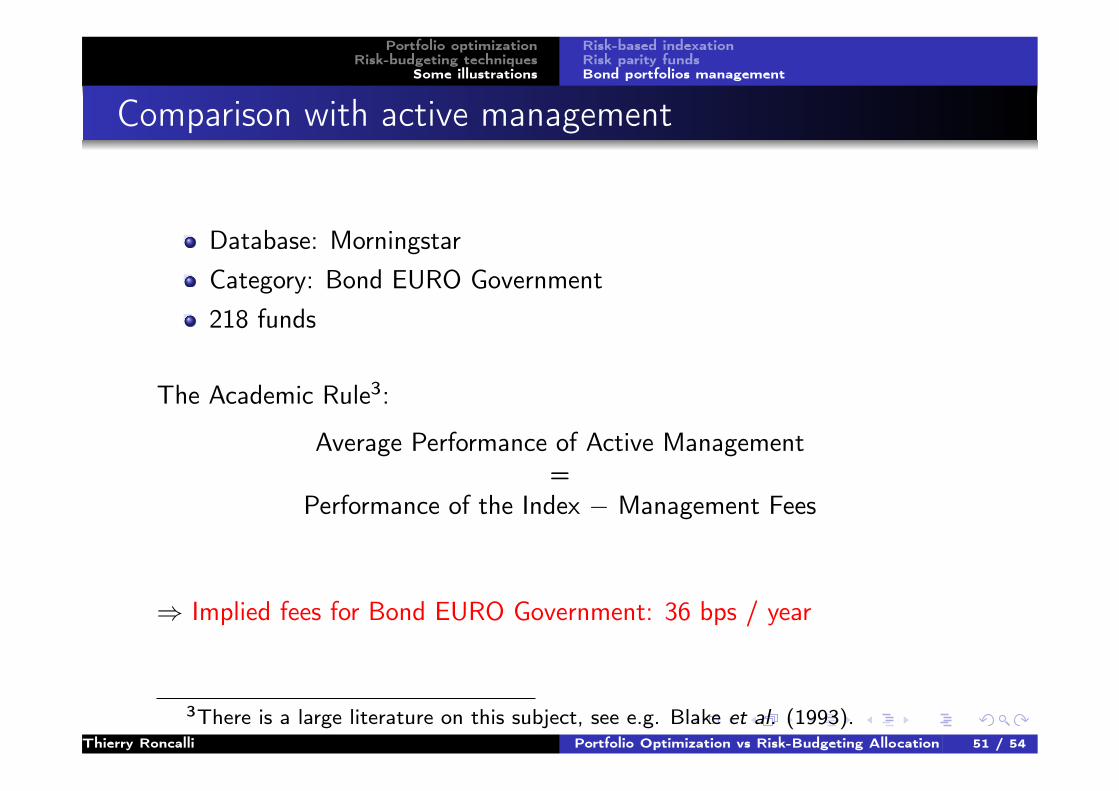
Comparison with active management
Database: MorningstarCategory: Bond EURO Government218 funds
The Academic Rule3:
Average Performance of Active Management=
Performance of the Index − Management Fees
⇒ Implied fees for Bond EURO Government: 36 bps / year
3There is a large literature on this subject, see e.g. Blake et al. (1993).Thierry Roncalli Portfolio Optimization vs Risk-Budgeting Allocation 51 / 54
Portfolio optimizationRisk-budgeting techniques
Some illustrations
Risk-based indexationRisk parity fundsBond portfolios management
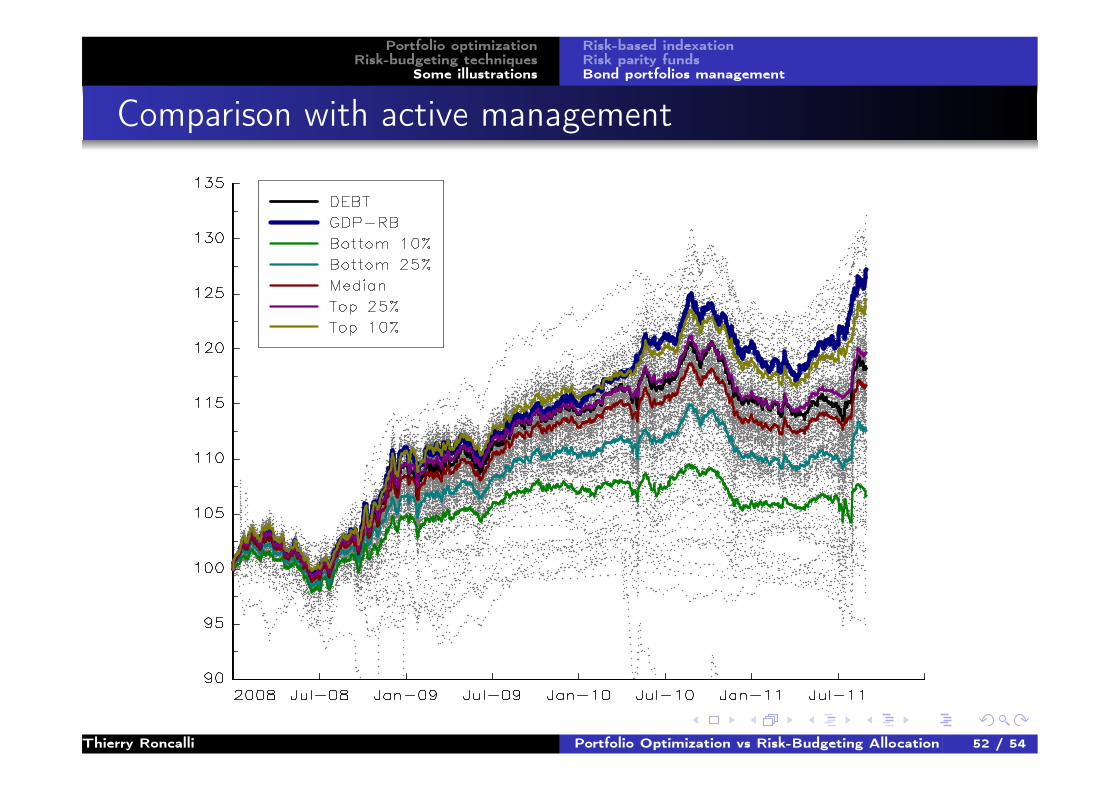
Comparison with active management
Thierry Roncalli Portfolio Optimization vs Risk-Budgeting Allocation 52 / 54
Portfolio optimizationRisk-budgeting techniques
Some illustrations
Risk-based indexationRisk parity fundsBond portfolios management
Conclusion
Portfolio optimization leads to concentrated portfolios in terms ofweights and risk
The use of weights constraints to diversify is equivalent to adiscretionary shrinkage method
Risk-budgeting techniques is a better approach to diversify portfolios
Strong focus on ERC portfolios last years from the assetmanagement industry (equity indexes, risk parity funds, commodityfunds, multi-strategy funds)
Thierry Roncalli Portfolio Optimization vs Risk-Budgeting Allocation 53 / 54

Portfolio optimizationRisk-budgeting techniques
Some illustrations
Risk-based indexationRisk parity fundsBond portfolios management
For Further Reading I
B. Bruder, P. Hereil, T. Roncalli.Managing Sovereign Credit Risk in Bond Portfolios.SSRN, ssrn.com/abstract=1957050, October 2011.
B. Bruder, P. Hereil, T. Roncalli.Managing Sovereign Credit Risk.Journal of Indexes Europe, 1(4), November 2011.
S. Maillard, T. Roncalli, J. Teiletche.The Properties of Equally Weighted Risk Contribution Portfolios.Journal of Portfolio Management, 36(4), Summer 2010.
T. Roncalli.Understanding the Impact of Weights Constraints in PortfolioTheory.SSRN, ssrn.com/abstract=1761625, January 2011.
Thierry Roncalli Portfolio Optimization vs Risk-Budgeting Allocation 54 / 54