Risk-Based Methodologies for Evaluating Petroleum...
100
Risk-Based Methodologies for Evaluating Petroleum Hydrocarbon Impacts at Oil and Natural Gas E&P Sites Regulatory and Scientific Affairs Department API PUBLICATION NUMBER 4709 FEBRUARY 2001
Transcript of Risk-Based Methodologies for Evaluating Petroleum...

Risk-Based Methodologies for Evaluating Petroleum Hydrocarbon Impacts at Oil and NaturalGas E&P Sites
Regulatory and Scientific Affairs Department
API PUBLICATION NUMBER 4709FEBRUARY 2001


Risk-Based Methodologies for Evaluating Petroleum Hydrocarbon Impacts at Oil and NaturalGas E&P Sites
Regulatory and Scientific Affairs Department
API PUBLICATION NUMBER 4709FEBRUARY 2001
PREPARED UNDER CONTRACT BY:David V. NaklesThermoRetec Consulting Corporation


FOREWORD
API publications necessarily address problems of a general nature. With respect to partic-ular circumstances, local, state and federal laws and regulations should be reviewed.
API is not undertaking to meet the duties of employers, manufacturers, or suppliers towarn and properly train and equip their employees, and others exposed, concerning healthand safety risks and precautions, nor undertaking their obligations under local, state, or fed-eral laws.
Nothing contained in any API publication is to be construed as granting any right, byimplication or otherwise, for the manufacture, sale, or use of any method, apparatus, or prod-uct covered by letters patent. Neither should anything contained in the publication be con-strued as insuring anyone against liability for infringement of letters patent.
All rights reserved. No part of this work may be reproduced, stored in a retrieval system, or transmitted by any means, electronic, mechanical, photocopying, recording, or otherwise,
without prior written permission from the publisher. Contact the Publisher, API Publishing Services, 1220 L Street, N.W., Washington, D.C. 20005.
Copyright © 2001 American Petroleum Institute
iii


ACKNOWLEDGMENTS
API STAFF CONTACTHarley Hopkins, Regulatory and Scientific Affairs Department
The API Production Waste Issue Group (PWIG) is acknowledged for providing funding for this manual.
API would like to thank the companies that participated in the Petroleum Environmental Research Forum (PERF) Project 97-08 for their permission to publish this manual:
Arthur D. LittleChevron Research and Technology Company
Equilon Enterprises LLCExxon Mobil Corporation
Texaco IncorporatedUnocal Corporation
The following individuals are acknowledged for the contributions of theirorganizations to PERF 97-08:
John Harju, Gas Technology InstituteNancy Comstock, U.S. Department of Energy
API acknowledges the following individuals for their contributions this manual:
George Deeley, Equilon Enterprises LLCSkip Dees, Texaco Incorporated
George DeVaull, Equilon Enterprises LLCBill Freeman (formerly with Shell Oil Company)
Wayne Hamilton, Shell Oil CompanyJill Kerr, ExxonMobil Corporation
Paul Lundegard, Unocal CorporationRenae Magaw, Chevron Research and Technology Company
Sara McMillen, (Chairperson – PERF 97-08), Chevron Research and Technology Co.Evan Sedlock, (Chairperson – PWIG), Chevron Research and Technology Co.
v


i
TABLE OF CONTENTS
Executive Summary.................................................................................................... vii
Part I: Introduction....................................................................................................... 1Purpose of Manual ........................................................................................................ 1Content and Organization of Manual ............................................................................ 1
Part II: Risk-Based Decision Making .......................................................................... 2What Is It? ..................................................................................................................... 2Why Use It?................................................................................................................... 2
Traditional Approaches Not Based on Risk............................................................ 2Traditional Approaches May Misallocate Resources.............................................. 3Risk-Based Approaches Permit Cost-Benefit Analyses.......................................... 3
Should It Be Used At All Sites?.................................................................................... 3What Are Tiered Risk-Based Decision-Making Frameworks? .................................... 4When Is It Appropriate To Use a Tiered Approach? .................................................... 5What Is the Role of Generic Site Cleanup Criteria in the Risk-BasedDecision-Making Process?............................................................................................ 6Tier 1 versus Tier 2 or Tier 3? ...................................................................................... 6
Part III: Characteristics of Crude Oils, Refined Petroleum Products,Condensates, and E&P Wastes ................................................................................... 8
Chemical Characteristics............................................................................................... 8What Are the Chemical Characteristics of Crude Oil and Its RefinedProducts? ................................................................................................................. 8
Crude Oil ........................................................................................................... 8Refined Products ............................................................................................. 10
What Are the Chemical Characteristics of Condensates?..................................... 12What Are the Chemical Characteristics of E&P Wastes?..................................... 12
Characterization Studies.................................................................................. 13Characterization Results.................................................................................. 14
Physical Characteristics............................................................................................... 15What Are the Physical Properties of Hydrocarbons that Influence theirMovement in the Environment?............................................................................ 15What Are the Nature of These Physical Properties for Crude Oil,Refined Products, Condensates, and E&P Wastes? .............................................. 17
Crude Oil ......................................................................................................... 17Refined Products ............................................................................................. 17

ii
Condensates..................................................................................................... 17E&P Wastes..................................................................................................... 18
Toxicological CharacteristicsWhat Human Health Toxicity Data Are Available? ............................................. 18
Cancer Health Effects...................................................................................... 19Non-Cancer Health Effects ............................................................................. 19
What Ecological Toxicity Data Are Available?.................................................... 20Summary of Key Differences in the Characteristics of Crude Oil, RefinedPetroleum Products, Condensates, and E&P Wastes .................................................. 20
What Is the Evidence of Differences in Bulk Hydrocarbon Composi-tion?....................................................................................................................... 20
Carbon-Number Range ................................................................................... 20Chemical Classes of Hydrocarbons................................................................. 20API Gravity ..................................................................................................... 22
What Is the Evidence of Differences in Specific Chemical Composi-tion?....................................................................................................................... 22
Benzene ........................................................................................................... 22PAHs ............................................................................................................... 23Metals .............................................................................................................. 23Blending Agents and Additives....................................................................... 24
What Is the Evidence of Differences in Mobility and Toxicity? .......................... 24Mobility........................................................................................................... 24Toxicity ........................................................................................................... 24
Part IV: Calculation of Risk and Risk-Based Screening Levels ..............................26What Are the Key Components of the Four Elements of the Risk Evalua-tion Process?................................................................................................................ 26
Hazard Identification............................................................................................. 26Exposure Assessment............................................................................................ 26Toxicity (Dose-Response) Assessment................................................................. 27Risk Characterization ............................................................................................ 27
What Calculations Are Used To Determine Risks to Human Health? ....................... 28Exposure Assessment: Calculation of Contaminant Intake ................................. 28Derivation of Toxicological Dose-Response Factors............................................ 28Calculation of Risk................................................................................................ 29
What Are Risk-Based Screening Levels (RBSLs) and How Are TheyDerived? ...................................................................................................................... 29Are RBSLs Identical for All Routes of Exposure? ..................................................... 31What Are the Default Assumptions That Are Used in the RBSL Equationsand from Where Did They Originate?......................................................................... 31

iii
Part V: Application of Risk-Based Methodologies to E&P Sites ............................ 33TPHCWG Risk-Based Methodology.......................................................................... 33
What Is the Traditional Approach for Managing Hydrocarbon-Impacted Soils at E&P Sites?................................................................................ 33What Is Total Petroleum Hydrocarbon or TPH?................................................... 34What Methods Are Used to Measure Bulk TPH in Soil and Ground-water? .................................................................................................................... 34
Analytical Methods ......................................................................................... 34Shortcomings................................................................................................... 35
What Does Industry Guidance Tell Us About TPH Closure Criteria? ................. 36What Are Some of the Typical TPH Closure Criteria that Have BeenUsed Internationally? ............................................................................................ 36What Other Criteria Besides TPH Have Been Used for the Closure ofE&P Sites? ............................................................................................................ 37What Is the Role of Bulk TPH Measurements in E&P Site Manage-ment? ..................................................................................................................... 38What Is the General Risk Assessment Approach of the TPHCWG andHow Does It Address the Shortcomings of Bulk TPH Measurements? ............... 38
Cancer Risk ..................................................................................................... 39Non-Cancer Risk ............................................................................................. 39
What Basis did the TPHCWG Use To Define the Different Hydro-carbon Fractions of TPH? ..................................................................................... 39How Was the Toxicity of Each Hydrocarbon Fraction Assigned? ....................... 41What Analytical Methodology Is Used by the TPHCWG To Quantifythese Hydrocarbon Fractions?............................................................................... 41Why Was It Necessary To Modify the TPHCWG AnalyticalMethodology To Deal with Crude Oil at E&P Sites? ........................................... 42How Was the TPHCWG Analytical Methodology Modified To Dealwith Crude Oils at E&P Sites? .............................................................................. 42What Portion of the Total Hydrocarbon in Crude Oil Can BeCategorized Using the Modified TPHCWG (PERF) Analytical Metho-dology? .................................................................................................................. 44How Do the Quantity of Hydrocarbons in Each Fraction Vary AmongDifferent Crude Oil Products? .............................................................................. 45How Were the Fate and Transport Properties and ToxicologicalCharacteristics of the C35-44 and C44+ Carbon Number FractionsDetermined? .......................................................................................................... 46
C35-44 Carbon Number Fraction....................................................................... 46C44+ Carbon Number Fraction......................................................................... 46
What Are Relevant Exposure Pathways for an E&P Site? ................................... 47How Are the TPH Fractionation Data Used To Calculate an RBSL forthe Whole Crude Oil?............................................................................................ 48What Exposure Scenarios and Pathways Are Important for Crude Oiland What Are the TPH RBSLs for these Situations?............................................ 49

iv
What Exposure Pathways and TPH Fractions Typically Dictate TPHRBSLs for Crude Oil at an E&P Site? .................................................................. 50How Do the TPH RBSLs for Crude Oil Compare to TPH RBSLs forRefined Petroleum Products, Condensates or Associated Wastes? ...................... 51
Refined Petroleum Products............................................................................ 51Gas Condensates ............................................................................................. 52Associated Wastes........................................................................................... 52
When Is It Necessary To Use the Risk-Based Assessment of TPHRather than Conventional TPH Measurements or Assessments? ......................... 53How Important Are the Risks Associated with Metals, PolycyclicAromatic Hydrocarbons, and Benzene in the Crude Oil?..................................... 54
Metals .............................................................................................................. 54Polycyclic Aromatic Hydrocarbons ................................................................ 55Benzene ........................................................................................................... 55
RBCA Tools for the E&P Industry ............................................................................. 57Other Considerations for Overseas Applications ........................................................ 58
Has the TPHCWG Methodology Been Accepted by OverseasRegulators?............................................................................................................ 58What Special Factors Should Be Considered When Preparing ToApply the TPHCWG Methodology to an International E&P Site? ...................... 58
Part VI: References ....................................................................................................60Appendix A — E&P Wastes: Regulatory StatusAppendix B — Equations for Calculation of Risk-Based Screening Levels for SoilAppendix C — Consideration of Hydrocarbon-Saturated Soil Conditions During
Calculation of RBSLs

v
LIST OF TABLES
1 Fate and Transport Characteristics of TPH Fractions (Based on EquivalentCarbon Number).......................................................................................................... 41
2 Representative Toxicity of Carbon-Number Fractions ............................................... 423 TPH RBSLs for Selected Refined Products of Crude Oil (mg/kg)............................. 514 TPH RBSLs for Selected Gas Condensates (mg/kg) .................................................. 525 Non-Residential TPH RBSLs for Crude Oil and Their Associated Wastes
(mg/kg) ........................................................................................................................ 536 Summary of Metals Concentrations (mg/kg Oil) in 26 Crude Oils ............................ 547 PAH Concentrations (mg/kg Oil) in 60 Crude Oils .................................................... 56

vi
LIST OF FIGURES
1 Chemical Classification of Petroleum Hydrocarbons ................................................... 92 Main Groups of Chemical Compounds in Crude Oil.................................................... 93 Gas Chromatograms for Two Crude Oils ................................................................... 104 Boiling Point and Carbon Number Ranges for Six Common Crude Oil
Products....................................................................................................................... 115 Gas Chromatograms of Gas Condensates ................................................................... 126 Gas Chromatographic Fingerprints of Gasoline and Diesel Fuel ............................... 217 Comparison of Crude Oil Composition of PERF Study Samples to
Worldwide (636 crude oils) Sample Set ..................................................................... 228 Carbon Number Ranges Addressed by TPH Analytical Methods .............................. 359 Determining TPH Composition: Separation of Chemical Groups into
Carbon Number Fractions ........................................................................................... 4010 Yield of Vacuum Residuum in 800 Crude Oils Produced in the United
States ........................................................................................................................... 4311 Aliphatic and Aromatic Carbon Number Fractions for the Assessment of
Risk Associated with Crude Oil TPH ........................................................................ 4412 Categorization of Crude Oil Hydrocarbon into Carbon Number Fractions ................ 4613 Comparison of the Distribution of Carbon Number Fractions in Crude Oil
and Selected Products.................................................................................................. 4514 Conceptual Model for Generic E&P Site.................................................................... 4715 Non-Residential TPH RBSLs for Surface Soil: Crude Oil in Soils from
Around the World........................................................................................................ 50

vii
EXECUTIVE SUMMARY
This manual presents a risk-based approach for the management ofhydrocarbon-impacted soil at E&P sites that emphasizes the protectionof human health. This risk-based approach was derived from the workof the Total Petroleum Hydrocarbon Criteria Working Group (TPH-CWG) as later modified by the Petroleum Environmental ResearchForum (PERF) as part of PERF Project 97-08. It generates a risk-basedscreening level, or RBSL, for crude oil in soil that can be used as partof a Tier 1 risk evaluation. This RBSL is expressed in terms of TPH(total petroleum hydrocarbon) in soil and represents the soil TPHconcentration that is protective of human health. RBSLs are calculatedusing exposure equations that are recognized by the U.S. Environ-mental Protection Agency as providing conservative estimates (i.e.,lower than necessary for the protection of human health) of acceptablehydrocarbon concentrations in soil. The manual also presents resultsfrom the application of this risk-based approach to a typical E&P site.These results confirm that the TPH concentration of 10,000 mg/kg insoil that is often proposed as a regulatory criterion for E&P sites isprotective of human health.
TPH RBSLS FOR COMPLEX MIXTURES OF PETROLEUMHYDROCARBONS
Tier 1 TPH RBSLs were determined for seventy crude oils based uponthe potential occurrence of non-cancer health effects and typical expo-sure pathways that exist at E&P sites. Since residential exposure scen-arios were not considered relevant to most E&P sites, the primary focuswas on commercial and non-residential uses of the sites. With regardsto these uses, the exposure pathways of most concern were directcontact with hydrocarbon-impacted soil (i.e., soil ingestion, inhalationof soil particles, and dermal contact).
The TPH RBSLs that were calculated for direct contact with soil thatwas impacted by this wide variety of crude oils ranged from 42,000mg/kg (4.2% by weight) to 85,000 mg/kg (8.5% by weight) TPH.These values are significantly greater than the TPH concentration of10,000 mg/kg that is often proposed as the regulatory criterion for E&Psites. The TPH RBSLs for selected E&P wastes were also determinedfor the same exposure scenario. These values were very similar tothose for the crude oil, ranging from 52,000 mg/kg (5.2% by weight) to100,000 mg/kg (10% by weight). These results suggest that the TPHRBSLs for crude oil should provide a reasonable criterion for managingwastes that are present in soils at E&P sites.

viii
IMPACTS OF METALS, PAHS, AND BENZENE ON TPHRBSLS
The concentrations of both metals and PAHs in crude oil are notsufficiently high to require TPH RBSLs below those that were deter-mined based upon non-cancer health effects. For example, the lowest(i.e., most restrictive) non-residential TPH RBSL for crude oil, basedupon the concentrations of the seven carcinogenic PAHs that wereidentified in over 70 crude oils, was 170,000 mg/kg. This calculationwas based upon the target risk level for cancer of 1 in 100,000 that isrecommended by ASTM and used by many states. This target level isalso the midpoint of the acceptable risk range set by the U.S. EPA forevaluating contaminated sites under Superfund. These results suggestthat the routine analysis of carcinogenic PAHs and metals in soil atE&P sites is not necessary to ensure protection of human health.
The understanding of the impact of benzene on the management ofE&P sites is continuing to evolve. Using the risk evaluation methodspresented in this document, it has been determined that TPH RBSLs forcomplex hydrocarbon mixtures (e.g., crude oils or gas condensates)will be based on direct contact with soil as the limiting exposure path-way as long as the benzene concentration in the parent mixture is lessthan 300 mg/kg. Approximately one-third of the 69 crude oils thatwere tested as part of the PERF study (97-08) contained less than 300mg/kg of benzene; all 14 of the gas condensates contained benzene atconcentrations above 300 mg/kg. At benzene concentrations above thisthreshold, a simple, conservative Tier 1 analysis indicates that benzenecontrols the risk at the site, where the limiting exposure pathway is notdirect contact with soil but leaching of the benzene from soil to ground-water. As such, the Tier 1 TPH RBSLs that are derived for ground-water protection purposes at an E&P site can be below 10,000 mg/kgwhen these concentrations of benzene are present. Alternatively,meeting separate benzene RBSLs may be appropriate in some cases.
It is important to note that the concentrations of benzene in hydro-carbon-impacted soil at E&P sites can be significantly less that its con-centration in fresh crude oil. This is due largely to the naturalprocesses of weathering, like volatilization. Also, following releasefrom the soil in either the vadose or saturated zones, benzene canbiodegrade, thereby reducing the potential exposure to any humanreceptors. Both of these processes have the net effect of increasing theacceptable TPH RBSL for crude oil in soil. The specific impact ofthese processes on the RBSL, however, requires an analysis of the site-specific conditions at a site.

ix
USE OF CONVENTIONAL TPH ANALYSES FOR SITEMANAGEMENT
Based on the work that has been conducted to date on crude oils, it hasbeen demonstrated that 10,000 mg/kg of TPH in soil at E&P sites isprotective of human health effects. In fact, this concentration isextremely conservative as it is a factor of four below the lowest TPHRBSL that was calculated for non-residential sites. This observation,combined with the fact that the crude oils that were examined wererepresentative of crude oils from around the world, suggests thatmeasurements of bulk TPH using conventional analytical methods canbe used to assess compliance at most, if not all, E&P sites.
In some circumstances, it may be necessary to confirm the con-centration of benzene in the hydrocarbon mixture at an E&P site sincethis is the one constituent that has the potential to decrease the accep-table TPH RBSLs at an E&P site. However, the effect of benzene onTPH RBSLs at any given E&P site will depend heavily upon the site-specific conditions. For example, at a site where a crude oil that is richin benzene (i.e., >300 mg benzene per kilogram of oil) was recentlyspilled and the groundwater table is near the ground surface, it may beprudent to analyze soil samples for the presence of benzene. On theother hand, if the only evidence of hydrocarbon contamination at anE&P site is weathered crude oil from historical spills, the analysis ofbenzene in the soil is probably not necessary. Similarly, analyses ofbenzene are probably not required if the fresh crude oil contains lowconcentrations of benzene or if the potential for biodegradation of thebenzene in the subsurface environment is significant.


1
PART IINTRODUCTION
PURPOSE OF MANUAL
The day-to-day operations at oil and gas exploration and production(E&P) facilities may include regulated onsite disposal of oily wastes orthe unintended release of petroleum hydrocarbons to site soils. Themanagement of these hydrocarbon-impacted media has been the focusof a significant amount of recent research by several organizationsincluding the American Petroleum Institute (API), the Total PetroleumHydrocarbon Criteria Working Group (TPHCWG), the PetroleumEnvironmental Research Forum (PERF), GRI, and individual oil andgas companies.
The purpose of this manual is to describe how recent advances in risk-based decision making can be used for assessing waste managementpractices and establishing cleanup levels at E&P facilities based onmeasurements of bulk total petroleum hydrocarbon (TPH). Specifically,key concepts and study results are presented on the human health riskassessment of the bulk TPH and specific components of concernincluding benzene, polycyclic aromatic hydrocarbons (PAHs) andmetals in crude oil-derived E&P wastes. These new applications canyield hydrocarbon concentrations that are less restrictive than thecurrent regulatory criteria while still being protective of human health.Ecological risks associated with TPH and other chemicals of concernare not addressed in this document.
CONTENT AND ORGANIZATION OF MANUAL
This manual has been written in a question and answer format.Common technical and regulatory questions have been identified andgrouped into the following categories:
� Risk-based decision making
� Characteristics of crude oils, condensates, and E&P wastesin contrast to those of refined products
� Calculation of risk and risk-based screening levels
� Application of risk-based methodologies to E&P sites inthe United States and overseas
In addition to each of these major sections, there are appendices thatdiscuss the regulatory status of E&P wastes (Appendix A); present theequations for the calculation of risk-based screening levels (AppendixB); and discuss the effect of hydrocarbon-saturated soil conditions onrisk-based screening levels (Appendix C). Lastly, a list of references, aglossary, and a list of abbreviations can be found at the end of the docu-ment.
Several organizations are addres-sing the risk-based managementof hydrocarbon-impacted media:
� American Petroleum Institute(API)
� Total Petroleum HydrocarbonCriteria Working Group(TPHCWG)
� Petroleum EnvironmentalResearch Forum (PERF) and
� GRI (formerly the GasResearch Institute, currently,GTI)
Purpose of Document:Describe recent advances inrisk-based decision-making andtheir use in establishing clean-up concentrations for E&P sitesbased on measurements of bulktotal petroleum hydrocarbon(TPH).
TPH: Total petroleum hydrocar-bons, or TPH, is a measure of thetotal concentration of hydro-carbons in a water or soil sample.Since the amount of hydrocarbonextracted from a sample dependsupon the method that is used,TPH concentrations will vary withthe analytical method that isselected.

2
PART IIRISK-BASED DECISION MAKING
WHAT IS IT?
Risk-based decision-making is the process of making environmentalmanagement decisions based upon an assessment of the potential risksthat chemicals at a site may pose to human health and the environment.The Environmental Protection Agency of the United States (U.S. EPA)has developed a general framework for health risk-based decision mak-ing and has established general guidelines for determining whatconstitutes acceptable risk. These guidelines can be used to determinewhen some type of action is required at a site.
The general framework for risk-based decision making was originallydeveloped by the U.S. EPA, largely in response to the requirements ofthe Comprehensive Environmental Response and Contingency LiabilityAct of 1980 (CERCLA). A major goal of this framework is to makecertain that management decisions for environmentally impacted sitesprovide an adequate level of protection for human health and theenvironment. As part of this framework, a health risk evaluationprocess was developed and the overall risk characterization is used toguide site management decisions.
The risk evaluation process, as originally set out by USEPA, involvesfour elements:
� Hazard identification
� Exposure assessment
� Toxicity (or dose-response) assessment
� Risk characterization
It is complete, comprehensive, and can be used to evaluate health risksat all types of contaminated sites. Although the process was developedfor use at sites impacted by hazardous materials, in reality it is equallyapplicable to all types of sites, including oil and gas industry E&P sites.
WHY USE IT?
TRADITIONAL APPROACHES NOT BASED ON RISK
Historically, regulatory programs in the United States have establishedenvironmental management goals (i.e., clean-up levels) for chemicalsof potential concern at specific sites based on:
Chapter Overview:� Explains process of risk-
based decision-making
� Introduces concept of a tiereddecision-making framework
� Contrasts risk-basedapproaches to use of genericsite clean-up goals
� Discusses situations thatwarrant use of tiered, risk-based analysis of sites
CERCLA:Also known as Superfund
An assessment of risk requiresknowledge of:
� The hazard
� The people who may comeinto contact with the hazard
� The routes by which expo-sure to the hazard can occur
Risk ∝∝∝∝ Hazard * Exposure * People
ExposureHazard Exposure
People
Risk

3
� Background (or naturally occurring) chemical concentrations(i.e., those typically found in unaffected areas)
� Analytical detection limits
� Concentrations that may be attainable if the most aggressivetechnologies were used for site remediation.
However, since none of these goals is directly tied to the actual risksposed by the chemicals of concern, there is no way to determinewhether or not these goals actually protect human health and theenvironment.
TRADITIONAL APPROACHES MAY MISALLOCATE RESOURCES
There is no way to determine the cost/benefit associated with achievingthe management goals listed above, since the benefit of the actioncannot be determined. Without any knowledge of the benefit resultingfrom a given action, there is no way to prioritize actions to focus themon those problems where the greatest potential for risk reduction exists.This could conceivably result in a portion of the public being left atrisk, and in the misallocation of both the technical and financialresources of this country. This represents a problem because there is alimit to the resources that the United States has available to solve theenvironmental problems in the oil and gas, or any other, industry.
RISK-BASED APPROACHES PERMIT COST-BENEFIT ANALYSES
In contrast, risk-based approaches to site management clearly describethe potential health benefits that might result from a particularenvironmental management decision. Consequently, the actions that aretaken at a site can be evaluated and prioritized based on the actualreduction in risk that would be achieved and technical and financialresources can be allocated appropriately.
SHOULD IT BE USED AT ALL SITES?
Like all technical methodologies and protocols, risk-based decision-making is not necessarily applicable to every situation at every E&Psite. For example, there may be instances where a risk-based assess-ment concludes that TPH concentrations at a specific site do not pose ahealth risk. However, these same concentrations may produce unsight-ly conditions that may influence site management decisions.
It is also important to think carefully about the assumptions that aremade when using risk-based decision-making for site management.Since it is not uncommon to have limited data available to conduct arisk-based evaluation of a site, there is generally a need to make some
RCRA Exemption and Risk-Based Management: The risk-based decision-making processprovides an operator with ameans to choose the proper man-agement and disposal options forwastes. However, an E&P opera-tor may be found liable for clean-up actions under RCRA Sections7002 and 7003 for releases ofwastes that pose an imminent andsubstantial endangerment tohuman health and the environ-ment. For more information aboutthe regulatory status of E&Pwastes, see Appendix A.

4
basic assumptions in the analysis. Examples of assumptions include thetoxicity of the materials in question or the duration and extent of poten-tial exposures. In every analysis, it is important that the sensitivity ofthe risk-based decisions to the assumptions used be understood todetermine how robust the analysis is and the circumstances that mightjustify the use of different assumptions. The greatest criticism of risk-based site management is that it can be manipulated to produce anyresult that is desired by the user. The primary defense to this criticismis to make certain that the analysis is completely transparent, to fullyjustify the assumptions that are made, and to examine the sensitivity ofthe outcome to the more critical of these assumptions.
WHAT ARE TIERED RISK-BASED DECISION-MAKINGFRAMEWORKS?
One drawback of the risk-based decision-making process, as originallydeveloped by U.S. EPA, is that it can require a substantial investmentof technical and financial resources, as well as time. Also, the datarequired to complete the risk evaluation are often not readily available.For these reasons, tiered strategies tailored for specific types of siteshave recently been developed by regulatory agencies and by indepen-dent organizations to permit its cost-effective use. One example of thistype of effort is that developed by the American Society for Testingand Materials (ASTM).
The first significant risk-based decision-making development byASTM was the Standard Guide for Risk-Based Corrective ActionApplied at Petroleum Release Sites, ASTM #1739-95. The develop-ment of this guide was driven by the need to cost-effectively and expe-ditiously manage underground storage tank sites. The guide wasfinalized in 1995 and it has since been recognized by the U.S. EPA andused by many state regulators to revise UST (Underground StorageTank) programs. ASTM completed a second guide in April 2000 withthe development of the Standard Guide for Risk-Based CorrectiveAction (E2081-00). This effort expanded the previous standard byfacilitating the use of risk-based corrective action in Federal and stateregulatory programs including voluntary clean-up programs, brown-fields redevelopment, Superfund, and RCRA corrective action.
In addition to these national efforts by ASTM, several state environ-mental regulatory agencies have also initiated unified risk-basedcorrective action programs that include voluntary, Superfund, andRCRA corrective action programs. Examples of these programs are theMassachusetts Contingency Plan, the Tiered Assessment CorrectiveAction Objectives of Illinois, Louisiana Department of EnvironmentalQuality Risk Evaluation/Corrective Action Program, and the RiskReduction Program of Texas.
Tiered risk-based frameworks ledby ASTM:
� Petroleum release sites(1995)
� Chemical release sites(2000)
Several states now have unifiedrisk-based corrective action pro-grams.
Tiered Approach:
� Tier 1 — Generic ScreeningLevels: Compare chemicalconcentrations at site togeneric, pre-determinedclean-up goals.
� Tier 2/3 — Site-SpecificTarget Levels: Require moresophisticated site-specificdata and analysis to yieldless conservative clean-upgoals. Increased assess-ment costs may be balancedby reduction in remediationcosts.
All tiers are equally protective ofhuman health and the environ-ment.

5
Tiered approaches generally start with an initial screening stage, Tier 1,that uses a basic set of site assessment data and involves a comparisonof the concentrations of chemicals in the different environmental mediato predetermined risk-based screening levels. These Tier 1 risk-basedscreening levels are predetermined for different exposure pathways anddifferent land uses. A site conceptual model is then used to determinethe exposure pathways that may be present at a site for a given landuse. If site concentrations are below the risk-based screening levels foreach exposure pathway, the conclusion is drawn that chemicals ofpotential concern do not pose a significant risk to human health or theenvironment and that no remedial action is necessary. If siteconcentrations exceed Tier 1 levels, the site manager generally has theoption of remediating the site to Tier 1 levels or alternatively,progressing to a more data and labor intensive Tier 2 or even Tier 3analysis.
Tier 2 and Tier 3 analyses generally require increasingly sophisticatedlevels of data collection and analysis, which in turn result in increasedcosts. The trade-off for these increased costs will generally lie in lowerremediation and overall project costs, because the clean-up goalsdefined by a Tier 2 or 3 analysis are likely to be higher than Tier 1levels, and thus less costly to achieve. The clean-up goals of the Tier 2and 3 analyses are generally higher than the Tier 1 analysis because thegeneric assumptions used in the Tier 1 levels are replaced with morerelevant site-specific assumptions or data. They are not higher becausethey are less protective of human health or the environment. In fact, allthree tiers of risk analysis provide an equal level of health protection.
Upon completion of each tier, the site manager reviews the results andrecommendations, and decides if the cost of conducting the additionalsite-specific analyses is warranted. Using the tiered approach, an E&Psite manager has the flexibility to forego the detailed risk characteriza-tion effort of a site-specific Tier 2 or 3 analysis and proceed directly tosite actions that generally involve meeting conservatively low, genericsite clean-up goals. In some cases, this approach may be the more cost-effective and more prudent management decision.
WHEN IS IT APPROPRIATE TO USE A TIERED APPROACH?
The decision to use the tiered risk-based strategies for site managementis usually dictated by the nature of the site contamination and thecomplexity of the site conditions; however, it may also be dictated bythe governing regulatory body.
6
At most E&P sites, it is likely that a tiered risk-based strategy will bethe approach of choice. This is because E&P sites generally involve aknown and very limited number of chemicals of potential concern (e.g.,crude oil, gas condensates, selected additives), and they have relativelysmall operational footprints. Consequently, the lower tiers of riskanalysis will often provide the most cost-effective site managementapproach.
WHAT IS THE ROLE OF GENERIC SITE CLEANUP CRITERIA INTHE RISK-BASED DECISION-MAKING PROCESS?
Both generic and site-specific criteria have a potential role in themanagement of E&P sites. Generic site clean-up criteria, many ofwhich are not explicitly risk-based, can be used as Tier 1 screeninglevel criteria. E&P site managers can use these criteria for sitemanagement if the desire or need to generate a site-specific risk-basedcriteria is not present. For example, if a site in its current condition wasalready below the generic site clean-up criteria, there would be no needto incur the expense or spend the time to determine what the site-specific risk-based criteria would be. Similarly, for a given site, if thevolume of impacted soil (or other environmental media) that exceedsthe generic criteria is small, it may be more cost-effective to take thenecessary remedial action to meet the generic criteria than to determineif the remedial action is really necessary by generating site-specificcriteria. However, it should be recognized that those generic criteriathat are not risk-based may or may not be protective of human healthand the environment. One of the goals of the recent PERF researchinitiatives (i.e., PERF Project 97-08) was to derive a generic risk-basedscreening criteria against which existing, non risk-based criteria that arecurrently used for E&P site management could be compared.
TIER 1 VERSUS TIER 2 OR TIER 3?
The development of tiered approaches for the risk-based analysis ofsites was based on the premise that there are situations whereconducting a detailed risk analysis may require more effort and timethan immediate implementation of site remedial actions. For thisreason, after every tier of risk analysis, the site manager must perform acost/benefit evaluation to determine if it makes sense to proceed to thenext level of risk analysis. Only if a clear benefit exists would thedecision to move forward be made. For example, because the Tier 1assessment is often based upon conservatively low, generic site clean-up goals, the extent of a site remedial action may be larger (and moreexpensive) than might be required if a more detailed site-specific Tier 2analysis were conducted. However, additional time and expense willbe incurred to complete the Tier 2 analysis. At this point, the site
Tiered risk-based strategies areappropriate for E&P sites sincethese sites:
� Involve known and verylimited number of chemicals
� Have relatively small opera-tional footprints
Examples of generic site clean-upcriteria for TPH in soils at E&Psites in North America (mg/kg)
� Colorado:
� 1,000 (sensitive site)
� 10,000 (non-sensitive site)
� Louisiana: 10,000
� New Mexico: 100; 1,000; or5,000
� Texas: 10,000
� Wyoming: 1,000 to 10,000
� Alberta (Canada): 1,000
Cost-benefit analysis will deter-mine if the more detailed Tier 2 orTier 3 analysis is warranted.Timing is also likely to be an im-portant factor.

7
manager must evaluate the potential reduction in site remedial coststhat may be realized by conducting the Tier 2 analysis and compare thatreduction to the additional cost of conducting the risk analysis. If thepotential savings outweigh the potential cost, it would be in themanager’s best interest to move forward with the analysis. In somecases, it is not the cost that drives the decision but the schedule. If thetime required to conduct the next tier of risk analysis is not acceptableto regulatory agencies or the public, then the decision to proceed withsite remediation is essentially made for the site manager.

8
PART IIICHARACTERISTICS OF CRUDE OILS,REFINED PETROLEUM PRODUCTS,CONDENSATES, AND E&P WASTES
An understanding of the chemical, physical, and toxicological charac-teristics of crude oils, refined petroleum products, condensates, andE&P wastes is required for the effective application of risk-baseddecision-making. However, most of the available analyses of thesematerials will not support a rigorous assessment of risk. Several recentstudies have improved this situation by providing the necessary data tosupport risk analyses [TPHCWG, 1999; Kerr, et al., 1999a; Kerr, et al.,1999b; Magaw, et al., 1999a; Magaw, et al., 1999b; McMillen, et al.,1999a; McMillen, et al., 1999b]. A summary of these chemical,physical, and toxicological data is presented here.
CHEMICAL CHARACTERISTICS
WHAT ARE THE CHEMICAL CHARACTERISTICS OF CRUDE OIL AND ITSREFINED PRODUCTS?In the broadest sense, petroleum hydrocarbons can be divided into twoclasses of chemicals, saturates and unsaturates. The saturates, alsoreferred to as alkanes or paraffins-, are comprised of three main sub-classes based on the structure of their molecules: either straight chains,branched chains, or cyclic. Straight-chain compounds are known asnormal alkanes (or n-alkanes). The branched chain compounds aredesignated isoalkanes and the cyclic compounds, cycloalkanes. [Petro-leum geologists typically refer to alkanes as paraffins and cycloalkanesas cycloparaffins or naphthenes]. Within the unsaturates, there are twomain subclasses, aromatics and olefins. This classification of petro-leum hydrocarbons is summarized in Figure 1. The compounds encom-passed by the classification, aliphatic hydrocarbons, include all of thenon-aromatic compounds shown at the bottom of Figure 1 (i.e., n-alkanes, isoalkanes, cycloalkanes or naphthenes, and olefins). Aro-matic hydrocarbons are comprised of one or more unsaturated cyclicstructures, or rings. Benzene contains one such ring, while polycyclicaromatic hydrocarbons contain two or more rings (e.g., phenanthrenehas three unsaturated rings).
Crude Oil
Figure 2 describes the major classes of petroleum hydrocarbons that arepresent in crude oil. The primary saturated and unsaturated hydro-carbons consist of n-alkanes, isoalkanes, cycloalkanes, and the mono-,
Chapter Overview:
� Presents chemical, physicaland toxicological character-istics
� Compares and contrastscharacteristics of differentmaterials
n-Alkane:
Isoalkane:
Cycloalkane:
Unsaturates:
Olefins:
Aromatics:
C
H|
|H
C
H|
|H
C
H|
|H
C
H|
|H
C
H|
|H
C
H|
|H
C
H|
|H|C|HH H
HH
C
H|
|H
C
H|
|H
C
H|
|H
C
H|
|H
C
H|
|H
C
H|
|H
C
H|
|H
HH
CC
CC C
H H
H
H
H
H
HH
H H
CH
HC
H
H=
Saturates:(alkanes or paraffins)
C
H|C
CH
H
H
H
|C
||C
C|H
DoubleCarbonBond

9
di-, and tri-aromatics; there are no olefins in crude oil. In addition tothese saturated and unsaturated hydrocarbons, there are also two non-hydrocarbon fractions (i.e., fractions that contain compounds inaddition to carbon and hydrogen such as nitrogen, sulfur, and oxygen).These non-hydrocarbon fractions are the asphaltenes and resins.
Crude oil is composedalmost entirely (i.e., 93% to>99%) of hydrogen andcarbon, in the ratio ofapproximately 2:1. Theseelements form the hydro-carbon compounds that arethe backbone of crude oil.Minor elements such assulfur, nitrogen, and oxygenconstitute less than 1 per-cent, to as much as 7 per-cent, of some crude oils.These elements are found inthe non-hydrocarbon com-pounds known as asphal-tenes and resins.
FIGURE 1. CHEMICAL CLASSIFICATION OF PETROLEUM HYDROCARBONS
PetroleumHydrocarbons
Saturates (alsoknown as paraffins
or alkanes)Unsaturates
n-alkanes(straightchain)
isoalkanes(branched
chain)
cycloalkanesor naphthenes
(cyclic)Aromatics Olefins
FIGURE 2. MAIN GROUPS OF CHEMICAL COMPOUNDS IN CRUDE OIL
Non-HydrocarbonsHydrocarbons
Crude Oil
Light DistillateFraction withBoiling Point
>210oC
Hydrocarbonsand Resins
SaturatedHydrocarbons
UnsaturatedHydrocarbons
aromatichydrocarbons (e.g.,
mono, di-, & tri-)resins asphal-
tenesisoalkanes cyclo-alkanesn-alkanes
DistillationDistillation
N-Hexane AdditionDissolution Precipitation
Chromatographic or Column Separation

10
The composition of 636 crude oils from around the world have beencompared by Tissot and Welte [1978]. An examination of these datareveals that the proportions of saturates, aromatics, resins, and asphal-tenes can vary dramatically, with the majority of normal crude oilslying within a composition envelope that is bounded in the followingmanner:
� 40 to 80% saturates� 15 to 40% aromatics� 0 to 20% resins and asphaltenes
Within these classes of hydrocarbons are compounds that haveanywhere from 1 to more than 45 carbons in their chemical structure.The percentages of these compounds that are present vary among thedifferent crude oils. An illustration of the differences in compositionfor two crude oils can be seen in Figure 3. Gas chromatograms give anindication of the carbon number range and hydrocarbon type (saturatesversus aromatics) for the total petroleum hydrocarbons within acomplex mixture. In this figure, the Widuri crude from Sumatra isdominated by normal alkanes or paraffins that produce a "picket fence"type pattern in the chromatograph which is typical of waxy crude oils.On the other hand, the SJV crude oil from California is dominated by a"hump" or unresolved complex mixture of hydrocarbons that aredifficult for a gas chromatograph to separate. This “hump” isindicative of the prior biodegradation of hydrocarbons that occurred inthe oil reservoir and is a common characteristic for many heavy crudeoils.
Additional composition data for PAHs and heavy metals in crude oilare also presented in other recent references. Specifically, the concen-tration of the 16 priority pollutant PAHs and 18 heavy metals has beenreported for a number of crude oils [Magaw, et al., 1999a; Magaw, etal., 1999b; Kerr, et al., 1999a; Kerr, et al., 1999b]. The analysis ofPAHs in 60 crude oils revealed that the mean concentrations of sevencarcinogenic PAHs were quite low for six of the seven compounds,ranging from 0.06 (indeno(1,2,3-cd)pyrene) to 5.5 (benz(a)anthracene)mg/kg oil. The mean concentration for chrysene was 28.5 mg/kg oil.Naphthalene accounted for as much as 85% of the total PAHs detected.For the metals analyses of 26 crude oils, the mean concentrationsdetected were less than 1.5 mg/kg of oil for all metals except nickel,vanadium, and zinc. The mean concentrations of these three metalswere 20, 63, and 3 mg/kg of oil, respectively.
Refined Products
Since crude oil is comprised primarily of highly complex mixtures ofhydrocarbons, it follows that the products refined from crude oil arealso complex hydrocarbon mixtures. Indeed, they are even moreenriched in hydrocarbons than crude oil since the refining processes
FIGURE 3. GAS CHROMATOGRAMSFOR TWO CRUDE OILS
Composition of normal crude oilis bounded as follows:
� 40 to 80% saturates
� 15 to 40% aromatics
� 0 to 20% resins andasphaltenes
Carbon-Number Range:
Hydrocarbon mixtures are oftendefined in terms of the range ofthe number of carbons that arepresent in the individual com-pounds that make up the mix-ture. For example, gasoline iscomprised of hydrocarbons thathave anywhere from four to tencarbons in their chemical struc-ture. As such, the carbon-num-ber range for gasoline is C5-C10.

11
Range of concentrations forcarcinogenic PAHs and metalsin crude oils (mean concentra-tions, mg/kg):
� Carcinogenic PAHs: 0.06for indeno(1,2,3-cd)pyreneto 28.5 chrysene
� Metals: <1.5 except fornickel (20), vanadium (63),and zinc (3)
used for their production either destroys nearly all of the non-hydro-carbons (i.e., asphaltenes and resins) or concentrates them in otherproducts. Since it is extremely difficult to identify all the componentsof crude oils and its refined products, these materials are oftencharacterized in terms of boiling range and approximate carbon numberranges as previously discussed. To illustrate this point, Figure 4 showsboiling points and carbon number ranges for six common crude oilproducts [ASTM, 1989]. Note that the carbon number ranges for therefined products are much narrower than that of the crude oil itself.Note also that the boiling points of the products increase as their carbonnumber range increases.
Blending agents and additives are also added to refined products. Thenature and quantity of these materials that are added vary substantiallyon a regional basis throughout the United States.
Blending agents and additivesare also added to refinedproducts. Examples of theseinclude:� Anti-knock agents (methyl-
tert-butylether)� Anti-oxidants
(aminophenols)� Metal activators (amino
propane)� Lead scavengers (ethylene
dibromide)� Anti-rust agents (sulfo-
nates)� Anti-icing agents (alcohols)� Detergents (amides)� Ignition improvers (nitrates)� Combustion catalysts (MnO,
MgO)� Cold flow improvers (poly-
olefins)The addition of these materialsand the amounts used vary sub-stantially on a seasonal orregional basis throughout theUnited States.
FIGURE 4. BOILING POINT AND CARBON NUMBER RANGES FOR SIX COMMON CRUDEOIL PRODUCTS
Temperatures in °C
540
495
450
405
360
315
225
180
135
90
45
0
Gasoline (C5-C10)30-200 °C
Naphtha (C8-C12)100-200 °C
Kerosene and Jet Fuels (C11-C13150-250 °C
Diesel and Fuel Oils (C13-C17)160-400 °C
Heavy Fuel Oils (C19-C25)315-540 °C
Lubricating Oils (C20-C45)425-540 °C
Temperatures in °C
540
495
450
405
360
315
225
180
135
90
45
0
540
495
450
405
360
315
225
180
135
90
45
0
540
495
450
405
360
315
225
180
135
90
45
0
Gasoline (C5-C10)30-200 °C
Naphtha (C8-C12)100-200 °C
Kerosene and Jet Fuels (C11-C13150-250 °C
Diesel and Fuel Oils (C13-C17)160-400 °C
Heavy Fuel Oils (C19-C25)315-540 °C
Lubricating Oils (C20-C45)425-540 °C

12
WHAT ARE THE CHEMICAL CHARACTERISTICS OF CONDENSATES?Gas condensates are extracted with natural gas in a liquid form. Theyhave a narrower carbon number range than crude oil, typicallyextending from <C6 to C30.
Gas chromatograms of the saturated and aromatic hydrocarbon frac-tions of two condensates are shown in Figure 5. These fingerprintsillustrate the large degree of variability that can exist for these hydro-carbon mixtures. In particular, it is clear that Condensate A encom-passes a much broader range of hydrocarbons than does Condensate B.Also, the ratio of the saturated hydrocarbons to the aromatichydrocarbons is quite different for these two condensates, increasingfrom 3.2 for condensate B to 5.8 for Condensate A.
The chemical composition of fourteen gas condensates was determinedby the Petroleum Environmental Research Forum and GRI [Hawthorne,et al., 1998; Rixey, 1999]. From these studies, the following generali-zations regarding the detailed chemical composition of the condensatescan be made:
� Major chemical components are the straight-chained andbranched saturated and unsaturated hydrocarbons.
� Benzene concentrations ranged from approximately 0.15 to3.6% by weight.
� Only three of the seven carcinogenic PAHs were detected incondensates (benzo(b)fluoranthene, chrysene, and benzo(a)-anthracene). The highest mean concentration was that ofchrysene, 1.8 mg/kg oil. The concentrations of the 16priority pollutant PAHs ranged from 200 to 6,000 mg/kg oil,with more than 95 percent of the total being naphthalene.
From a somewhat broader perspective, the carbon number ranges thatwere represented by the condensates varied from a minimum range ofC5 to C9 to a maximum range of C6 to C30.
WHAT ARE THE CHEMICAL CHARACTERISTICS OF E&P WASTES?There are a variety of wastes that are generated during each step of theoil and gas exploration and production process. An extensive listing ofthese wastes is provided in a publication by the American PetroleumInstitute, Environmental Guidance Document: Waste Management inExploration and Production Operations [American Petroleum Institute,1997]. These listings are tabulated based upon the specific phase ofexploration and production operations which include: (1) exploration,(2) drilling, (3) well completion and workover, (4) field production, and(5) gas plant (including gas gathering) operations. A summary of theprimary wastes that are identified with each operation is provided inAppendix A.
Typical Characteristics ofCondensates:
� Typical carbon numberranges: (1) Minimum: C5 toC9 and (2) Maximum: C6 toC30
� Benzene concentrationsranging from 0.15 to 3.6%
� Only three of seven car-cinogenic PAHs (benzo(b)-fluoranthene, chrysene, andbenzo(c)anthracene) weredetected in condensateswith chrysene having thehighest mean concentrationof 1.8 mg/kg oil.
� Total priority pollutant PAHconcentrations: 200 to6000 mg/kg (mostlynaphthalene)
FIGURE 5. GAS CHROMATOGRAMS OFGAS CONDENSATES
Condensate B
Aromatic
Saturate
Aromatic
Condensate A
Saturate
* *
* * *
*
*
*
* Internal Standard

13
The wastes that are uniquely associated with exploration and produc-tion operations are currently exempt from regulation under theResource Conservation and Recovery Act (RCRA) as “hazardouswastes.” Produced water and drilling muds are the two wastes that areproduced in the largest volumes. RCRA-exempt “associated wastes”include hydrocarbon-containing wastes such as soil impacted withcrude oil, tank bottoms, and workover fluids. Other potentiallysignificant associated wastes include the gas processing fluids that areused to dehydrate and remove sulfur from the gas (i.e., glycols andamines) as well as used exploration additives such as biocides, fracfluids, and drilling fluids. [See Appendix A for a discussion of theRCRA E&P regulatory determination and definition of "associatedwastes"].
Characterization Studies
Both API and GRI have conducted studies to characterize several of theassociated wastes of oil and gas exploration and production. The APIstudy [American Petroleum Institute, 1996] focused primarily on thecharacterization of the associated wastes from wellhead oil productionoperations. Complementing this effort, the GRI study [Gas ResearchInstitute, 1993] emphasized the characterization of wastes from naturalgas production associated with mainline compression/transmission,underground storage, and gas processing and conditioning. A commonset of four samples from a single gas processing and conditioningfacility were characterized in both studies.
The API study analyzed a total of twelve different associated wastesfrom oil and exploration and production sites. These wastes included:
� Tank bottoms
� Crude oil impacted soil
� Workover fluids (flowback from spent stimulation fluids)
� Produced sand� Dehydration and sweetening materials (i.e., glycol waste,
dehydration condensate water, spent molecular sieve, spentiron sponge, and used amine solutions)
� Pit and sump samples
� Rig wash waters
� Pipeline pigging materials
All but five of the wastes were characterized for volatile organic com-pounds (EPA Appendix IX of 40 CFR, Part 264: This Appendix of theCode of Federal Register presents a list of chemicals for groundwatermonitoring at RCRA hazardous waste facilities. This list has also been
Appendix A provides a discus-sion of RCRA exemption forE&P wastes and definition of"associated wastes."
API and GRI conducted studiesto characterize "associatedwastes" from wellhead produc-tion operations:
� API analyzed 12 wastes;GRI, 20 wastes. Fivecommon waste types wereanalyzed by both organiza-tions.
� Wastes were characterizedfor:
(1) VOCs
(2) Semi-volatile organiccompounds
(3) Trace metals
Hydrocarbons Detected inE&P Wastes:
� VOCs: benzene, carbondisulfide, ethylbenzene,toluene, and xylene
� Semi-volatile Organic Com-pounds: phenol, naphtha-lene, methyl-naphthalene,methylphenol, chrysene,and phenanthrene

14
used in many other regulations including those associated with the landdisposal of hazardous waste), semi-volatile organic compounds, andtrace metals; the other five wastes (i.e., dehydration condensate water,spent molecular sieve, used amine solutions, rig wash waters, andpipeline pigging materials) were only characterized for volatile organiccompounds.
GRI characterized a total of 20 different waste streams. Only five ofthese wastes overlapped with those that were characterized by API.These common wastes included spent molecular sieve, dehydrationcondensate water, pipeline pigging materials, tank bottoms, and glycolwastes. GRI analyzed their waste streams for volatile organic com-pounds, semi-volatile organic compounds, and trace metals.
Characterization Results
While the waste samples of the API and GRI studies were analyzed fora broad range of contaminants, very few of them were present abovethe analytical detection limits. More specifically, the findings of thestudies can be summarized as follows:
� Volatile Organic Compounds: Only five of the Appendix IXcompounds were detected by API in a total of 120 samplesof the twelve waste categories. These compounds werebenzene, carbon disulfide, ethylbenzene, toluene, andxylene. The GRI results mirrored these results as benzene,toluene, and xylene were the primary volatile organicchemicals that were detected. [Acetone and methylenechloride were also detected but their presence was attributedto cross contamination in the laboratory].
� Semi-Volatile Organic Compounds: API examined a total of31 samples of eight waste categories for these compounds.The only chemicals that were detected were 1-methylnaphthalene, chrysene, and phenanthrene. Phenol, naphtha-lene, methyl phenols, and methyl naphthalenes were theonly semi-volatile compounds that were detected by GRI.
� Metals: API detected a total of sixteen metals in 33 samplesof eight waste categories. Of these detections, only two(i.e., arsenic and lead) exceeded the risk-based criteria thatwere previously established by API for soil/waste mixtures.The metals that were detected by GRI included arsenic,boron, barium, calcium, cobalt, chromium, copper, potas-sium, iron, mercury, magnesium, manganese, nickel, lead,and zinc.
The above results are consistent with what would be expected given theinherent nature of crude oil and natural gas, where they are found, andthe type of natural gas processing that is done. For example, it is well
Presence of hydrocarbons andtrace metals in E&P wastesdepend upon:
� Nature of crude oil and un-processed natural gas
� Location of oil or gas
� Type of natural gas proces-sing
� Extent of biodegradation
However, elevated concentra-tions of metals can also be attri-buted to other sources (e.g.,pipe dope).

15
known that volatile organic compounds are present in crude oil andunprocessed natural gas. Consequently, it is not surprising to find asubset of these compounds in exploration and production wastes.However, the specific concentrations of these chemicals that will bepresent depend on the characteristics of the crude oil and unprocessednatural gas that is extracted as well as the characteristics of the wastes.Similarly, it is known that crude oil and unprocessed natural gascontain trace amounts of the semi-volatile compounds and that thesecompounds might be detected in the associated wastes.
Lastly, since crude oil and unprocessed natural gas are produced fromgeological formations within the earth, it is expected that the metalsthat are contained within the earth's minerals would be present in bothof them in varying concentrations. It is also expected that the associa-ted wastes would contain detectable concentrations of these samemetals, depending upon the characteristics of the geologic formationand the drilling and producing practices that were used. However, inmany instances, it is the presence of other metal sources such as pipedope that leads to elevated concentrations in the associated wastes.[The API study cautioned that the characterization database was smallrelative to the diversity of the associated wastes. In addition, many ofthe samples were obtained with the intent of capturing the highestconcentration of the constituents of possible environmental concern.]
PHYSICAL CHARACTERISTICS
WHAT ARE THE PHYSICAL PROPERTIES OF HYDROCARBONS THATINFLUENCE THEIR MOVEMENT IN THE ENVIRONMENT?The movement of a hydrocarbon mixture in the environment representsan important aspect of a risk assessment. It is this movement that canresult in the exposure of a human or ecological receptor to thechemical. The key physical characteristics of hydrocarbons that effecttheir movement in the environment include:
� Solubility in Water: This property is arguably the mostimportant factor that determines the transport of hydrocar-bons in groundwater or surface water.
� Volatility: The volatility of a hydrocarbon will dictate itsmovement with air or other gases.
� Density: The density of a hydrocarbon is expressed as itsAPI gravity which is a measure of its specificgravity. The API gravity is inversely pro-portional to the specific gravity of the compoundat 60˚F (15˚C) and is expressed as an integer,typically ranging from around 9 to 50. It has
units of degrees. As a point of reference, fresh water has anAPI gravity of 10˚.
Key physical parameters forhydrocarbons in environment:
� Solubility in water
� Volatility
� Density
� Viscosity
� Pour point
5.131F60@GravitySpecific
5.141GravityAPI −°
=

16
� Viscosity: This parameter is a measure of the internal resis-tance of a fluid to flow. Highly viscous material, likemolasses, does not flow easily under the forces of gravitywhile water, a low viscosity material, flows readily. Theviscosity of a fluid tends to decrease with an increase intemperature.
� Pour Point: The pour point is the temperature below whichan oil will not flow in a definite manner. The pour point formost oils arises from the precipitation of wax such that apasty, plastic mass of interlocking crystals is formed. Wax-free oils have pour points that are dependent upon viscosityonly and will tend to thicken to glassy materials as thetemperature is reduced and the viscosity increases. Somewaxy crude oils may be solid at temperatures as high as90ºF (32ºC).
If, and when, a hydrocarbon liquid will move in the environmentdepends upon the interaction of a number of these parameters. Releaseof a hydrocarbon liquid, such as crude oil or condensates, to the near-surface unsaturated soil can result in downward gravity-drivenmigration of the liquid towards the water table. This downwardmovement will be influenced by the density, viscosity, and pour pointof the hydrocarbon. For example, a crude oil with a high pour pointmight be too viscous to move downward in a cooler climate eventhough its density would suggest that such movement was possible. Ifthe hydrocarbon liquids are volatile, they may also release individualhydrocarbon compounds into the vapor space that exists within thepores of the soil. If the release of is of sufficient magnitude,hydrocarbon liquid may reach the capillary fringe above the watertable, mound and spread horizontally. The extent of spreading iscontrolled primarily by the hydrocarbon saturation and relativepermeability in the subsurface media.
It is clear from this discussion that the movement of a hydrocarbonliquid through either saturated or unsaturated soil is not a foregoneconclusion. While the properties of some hydrocarbons may result intheir downward movement towards and dissolution into the water table,the properties of others may prohibit movement of any type. A moredetailed discussion of when hydrocarbon liquids become mobile in theunsaturated and saturated soil is presented elsewhere for the interestedreader [American Petroleum Institute, 2000a].
Viscosity and pour point ofcrude oil suggest that many arenot fluid enough to move rapid-ly, if at all, in the environment.

17
WHAT ARE THE NATURE OF THESE PHYSICAL PROPERTIES FORCRUDE OIL, REFINED PRODUCTS, CONDENSATES, AND E&PWASTES?
Crude Oil
Crude oil is less dense than water with a specific gravity ranging from0.85 to 0.98 (as compared to 1.0 for water). However, because of thelarge differences in composition among the various crude oils, theprecise density of the crudes can vary substantially. Typical APIgravities for crude oil range from 10 to 45.
Crude oil also tends to be a viscous liquid at surface temperatures andpressures. Saybolt viscosities (i.e., time, in seconds, for a 60 millilitersample to flow through a calibrated orifice at 38˚C [100˚F]) for fourcrude oils from California and Prudhoe Bay range from 47 to >6000seconds. Likewise, the pour points for crude oils are typically highwith some that hover around typical seasonal fall and spring tempera-tures in the United States. The viscosity and pour point are importantbecause they imply that many crude oils are not fluid enough to rapidlypercolate through soil.
Crude oil is sparingly soluble in water, with solubility increasing withAPI gravity. For example, a crude oil with an API gravity of 11˚ had atotal solubility in water of 3.5 mg/L at 25˚C (77˚F) whereas an oil withan API gravity of 28˚ had a solubility of 65 mg/L [Western StatesPetroleum Association, 1993]. However, total solubility is dependenton temperature and the composition of the crude oil.
Refined Products
Many of the refined products of crude oil also have a density of lessthan 1.0 and API gravities ranging from 15˚ for No. 6 Fuel Oil to 62˚for gasoline. The solubilities of these products in water tend to increasewith an increase in API gravity, yielding the following solubility trendsfor the refined products: gasoline > kerosene > No. 2 diesel fuel > No.2 fuel oil > No. 6 fuel oil. The viscosity of the refined products alsotracks with boiling point and molecular weight, increasing as theseparameters increase. The least viscous product is gasoline while themost viscous product is lubricating oil. The pour points of the refinedproducts will depend heavily on the composition of the crude oil (e.g.,fraction of wax) although, in general, pour point will increase withviscosity. If anything, an elevated wax concentration in the crude oilwould only serve to increase the pour point of the refined products withhigher boiling points.
Condensates
Extensive physical property data are not currently available for conden-sates. However, in broad terms, these hydrocarbon mixtures generallyexhibit an API gravity of greater than 45˚. This suggests that they are
Solubility ranking of refinedproducts (most to least soluble):
� Gasoline
� Kerosene
� No. 2 diesel fuel
� No. 2 fuel oil
� No. 6 fuel oil
Extensive physical property datafor condensates is not available.

18
not extremely viscous at normal ambient temperatures and that they arerelatively volatile and soluble in water. At the same time, compositiondata from GRI [Hawthorne, et al., 1998] for four condensates revealedthat high molecular weight alkanes can be present. The presence ofthese alkanes would have a tendency to increase both density (i.e.,decrease API gravity) and viscosity and decrease both solubility andvolatility of the hydrocarbon mixture.
E&P Wastes
The nature of the E&P wastes does not lend itself to an examination ofthe pure physical properties such as have been described for crude oil,refined products, or condensates. Rather, the majority of the wastesconsist of complex soil and liquid matrices that contain hydrocarbonsthat originated in the crude oil or natural gas. What is of interest, then,is the tendency for these hydrocarbons to be released from these com-plex matrices and to enter the environment through the groundwater orsoil gases. The physical properties of importance are the followingcharacteristics of the individual chemicals: (1) sorption/desorptioncharacteristics, (2) solubility, (3) volatility, and (4) soil saturation.Also of importance is the nature of the waste matrix as specific solidsmay bind the chemicals more tightly than others. The presentation ofthese data for all of the hydrocarbons in crude oil or natural gas isbeyond the scope of this manual. However, this information can befound elsewhere in the literature [Western States Petroleum Associa-tion, 1993].
TOXICOLOGICAL CHARACTERISTICS
All chemicals, including those present in crude oil, refined products,condensates, and E&P wastes, have the inherent potential to impacthuman health and the environment. However, the presence of a riskdepends upon the ability of a human or ecological receptor to come intocontact with the chemical and to receive a dose that is sufficiently largeto produce an adverse health effect.
WHAT HUMAN HEALTH TOXICITY DATA ARE AVAILABLE?Limited toxicity data are available from laboratory studies using crudeoil and animals. The refined products for which similar data areavailable are gasoline, jet fuel, and mineral oil [TPHCWG, 1997b].Essentially no readily available toxicity data of any type exist for eitherthe condensates or the E&P wastes; however, toxicity data are availablefor several of the individual compounds that are present in thesewastes.
Given these available data, toxicity assessments of these materials usetoxicity data from a combination of indicator compounds and/orsurrogate hydrocarbon fractions. The indicator compounds are
Limited human toxicity data areavailable for crude oils, refinedproducts, condensates and E&Pwastes. This lack of informationhas required the use of toxicitydata for indicator compoundsand/or surrogate hydrocarbonfractions.

19
individual compounds within a mixture that are selected to representthe entire mixture whereas surrogate hydrocarbon fractions are groupsof hydrocarbons that are selected for this purpose. These groups ofhydrocarbons are often defined in terms of a specific carbon-numberranges. Indicator compounds are most often used to evaluatecarcinogenic health effects; surrogate hydrocarbon fractions are used toaddress non-cancer health effects.
Cancer Health Effects
Potential carcinogens including benzene, selected polycyclic aromatichydrocarbons (PAHs), and selected heavy metals are the most commonindicator compounds that are used to evaluate the carcinogenic healtheffects associated with crude oil, refined products, condensates, andE&P wastes. Benzene and seven of the sixteen priority pollutant PAHs[i.e., benzo(a)anthracene, chrysene, dibenzo(a,h)anthracene, benzo(a)pyrene, benzo(b)fluoranthene, benzo(k)fluoranthene, and indeno(1,2,3-cd)pyrene] are used because they are known or suspected carcinogens[ASTM, 1998]. A review of the risk associated with PAHs and heavymetals in crude oil revealed that these chemicals are not likely to pose acarcinogenic health risk at sites that are impacted with crude oil[Magaw et al., 1999a; Magaw, et al., 1999b; Kerr, et. al., 1999a; Kerr,et. al., 1999b]. On the other hand, benzene can be present in crude oilat concentrations that have the potential to impact human healthalthough site-specific considerations have a large impact on whether ornot such a risk truly exists at a given site [Rixey, et. al., 1999].
Non-Cancer Health Effects
To evaluate the non-cancer effects of petroleum mixtures, a surrogateapproach is used. This approach segregates the petroleum mixture intocarbon-number fractions and assigns a toxicity to the fraction based ona single compound or hydrocarbon mixture for which toxicity dataexist. The single compound surrogates are selected based upon theirpresence in the petroleum fraction and the availability of toxicity data.An extensive review of the toxicity data for petroleum hydrocarbonswas completed by the TPHCWG and is summarized elsewhere[TPHCWG, 1997b]. This review examined toxicity data for bothindividual compounds as well as mixtures of petroleum hydrocarbons.On the basis of this review, toxicity characteristics were assigned to anumber of different aliphatic and aromatic carbon number fractions.Using these data and a breakdown of the hydrocarbon composition bythe carbon-number ranges, the toxicity of any hydrocarbon mixture(e.g., crude oil, refined products, condensates, and E&P wastes) can beestimated [TPHCWG, 1999].
WHAT ECOLOGICAL TOXICITY DATA ARE AVAILABLE?The ecological risk framework is not as well developed as that forhuman health. For this reason, a review of ecological risk assessment
An indepth review of non-cancerhuman health effects of petroleumhydrocarbons has been conduc-ted and summarized by theTPHCWG [TPHCWG, 1977b].
Development of the ecologicalrisk framework has lagged be-hind that of human health. Areview of the ecological toxicitydata for petroleum hydrocar-bons was beyond the scope ofthis document.
Section 307(A) of the CleanWater Act identifies 126 individualpriority toxic compounds that areknown as the EPA “Priority Pollu-tants”. Sixteen of these com-pounds are PAHs, seven of whichhave been identified as known orsuspected carcinogens.
20
procedures and ecological toxicity data are considered beyond thescope of this document.
SUMMARY OF KEY DIFFERENCES IN THE CHARACTERISTICSOF CRUDE OIL, REFINED PETROLEUM PRODUCTS,
CONDENSATES, AND E&P WASTES
In summary, there are some very important differences in the charac-teristics of crude oil, refined petroleum products, condensates, and E&Pwastes. These differences can have a significant effect on the risk thatis associated with their presence at a site.
WHAT IS THE EVIDENCE OF DIFFERENCES IN BULK HYDROCARBONCOMPOSITION?
Carbon-Number Range
From a broad perspective, crude oil encompasses a wide spectrum ofhydrocarbons compared to its refined products and most of thecondensates. As mentioned, a typical carbon-number range for gaso-line is only C5 to C10; diesel, C12 to C28; and condensate, <C6 to C30.Evidence of these differences can be seen by comparing the gaschromatograms of crude oil (Figure 3), gas condensates (Figure 5), andthe refined products of gasoline and diesel fuel (Figure 6). Thesechromatograms reveal the narrower hydrocarbon distributions that aretypical of the refined products and the condensates.
Chemical Classes of Hydrocarbons
The gas chromatograms also provide evidence of the differences inhydrocarbon composition that can exist even within a single type ofhydrocarbon mixture. The PERF Project 97-08 made a special effort tocapture the differences among crude oils by collecting seventy samplesof crude oils from all over the world. An indication of howrepresentative these samples were of the general composition of aworldwide set of 636 crude oils is shown in Figure 7 [Tissot B. P. andD. H. Welte, 1978]. The individual data points shown represent thecomposition of the crude oil samples of the PERF project (51 separatecrude oils and crude oil extracts from 6 soil samples). Every one ofthese data points fall within the 95% frequency distribution envelopethat was delineated using the worldwide set of crude oil samples. Thecomposition data points from the PERF project also uniformly covernearly the entire area within the frequency distribution envelope shownin Figure 7.
Refined products and conden-sates have narrower hydro-carbon distributions than crudeoils.
The composition of the crudeoils in the PERF Project, 97-08,were representative of crudeoils from around the world.

21
FIGURE 6 GAS CHROMATOGRAPHIC FINGERPRINTS OF GASOLINE AND DIESEL FUEL
Gasoline
C1 – C10
Diesel
C9
C11
C13
C14 C15
C17
C19
C22

22
API Gravity
Lastly, API gravity, which is quite different between crude oil, refinedproducts, and condensates, is another indicator of the differences in thegross chemical composition of these hydrocarbon liquids. The APIgravity for crude oil ranges from <10º to as high as 45º. On the otherhand, the API gravity for condensates is typically greater than 45º. TheAPI gravity of the refined products varies with the specific product,dropping as low as 15º for No. 6 Fuel Oil and as high as 62º forgasoline.
WHAT IS THE EVIDENCE OF DIFFERENCES IN SPECIFIC CHEMICALCOMPOSITION?On a more chemical-specific basis, concentration differences were alsoobserved for chemicals of concern such as benzene, PAHs (total andcarcinogenic), and metals.
Benzene
Condensates and selected refined petroleum products such as gasolinetypically have higher benzene concentrations than crude oils. Based onthe studies referenced in this document, the range (minimum to maxi-mum) and mean concentration of benzene in these hydrocarbon liquidswere as follows:
API gravity for crude oils rangesfrom <10º to as high as 50º.
FIGURE 7 COMPARISON OF CRUDE OIL COMPOSITION OF PERF STUDY SAMPLES TO WORLDWIDE (636CRUDE OILS) SAMPLE SET
Mean concentrations of ben-zene vary from 1,300 mg/kg incrude oil, to 10,000 mg/kg incondensates to 19,000 mg/kg ingasoline.
50%50%
100%Saturates 50%
100%Resin + Asphaltenes
Aromatics 100%
� PERF 97-08 Study Samples(51 crude oils and crude oilextracts from 6 soils)95% Frequency
Distribution EnvelopeWorld Oils

23
� Crude oil (68 samples) — Range: Non-detect to 6,000 mg/kgoil (0.6% by weight); Mean of 1,300 mg/kg oil (0.13% byweight).
� Gasoline (124 samples) — Range: 16,000 mg/kg (1.6% byweight) to 23,000 mg/kg (2.3% by weight); Mean: 19,000mg/kg (1.9% by weight)
� Condensates (14 samples) — Range: 1,500 mg/kg (0.15% byweight) to 36,000 mg/kg (3.6% by weight); Mean: 10,000mg/kg (1% by weight).
In general, benzene concentrations in the E&P wastes were detected inthe low parts per million.
PAHs
PAHs can also be present in hydrocarbon liquids, although typically atlow concentrations. The data presented in this document identified aconcentration of total PAHs in sixty crude oil samples ranging fromtraces to 5,000 mg/kg (0.5% by weight). The total PAHs weredominated by the following individual PAHs which were identified in>95% of the samples (mean concentrations in mg/kg oil shown inparentheses — see Table 7 for more detail):
� Naphthalene (422.9)� Phenanthrene (176.7)� Fluorene (73.6)� Chrysene (28.5)� Pyrene (15.5)� Benzo(b)fluoranthene (3.9)� Benzo(k)fluoranthene (0.46)
With regards to seven carcinogenic PAHs, the observed mean concen-trations in the crude oil were less than 30 mg/kg, ranging from 0.06mg/kg of indeno(1,2,3-cd)pyrene to 28.5 mg/kg of chrysene.
The carcinogenic PAH composition of condensates is different fromthat of crude oil. Only three of the seven carcinogenic PAHs weredetected in condensates (benzo[b]fluoranthene, chrysene, and benzo[a]-anthracene), with the highest mean concentration being that of chryseneat 1.8 mg/kg oil. An evaluation of cancer risk due to these seven PAHsat non-residential sites indicate that more than 170,000 ppm (17%)TPH would need to be present in soil for an unacceptable risk to occur.
The concentrations of the 16 priority pollutant PAHs ranged from 200to 6,000 mg/kg oil, with more than 95 percent of the total beingnaphthalene. Naphthalene was also detected in the E&P wastes, atmuch lower concentrations, along with methylnaphthalene, chrysene,and phenanthrene.
Range of total PAH concen-trations identified in crude oilextended from trace amounts to5,000 mg/kg oil. Naphthalenewas the predominant PAH.Concentrations of carcinogenicPAHs are not significant from ahuman health point of view.

24
Metals
The concentrations of metals in the crude oil samples of PERF were notsignificant from a risk perspective. Of the 18 heavy metals that wereanalyzed, all but nickel (20 mg/kg), vanadium (63 mg/kg) and zinc (3mg/kg) were present at concentrations of less than 1.5 mg/kg.
Metals were also detected at trace levels in 33 samples of eightcategories of E&P wastes. Of these detections, only two (arsenic andlead) exceeded risk-based criteria that were previously established byAPI. No metal concentration data were provided in that report [API,1996] for any refined products or condensates.
Blending Agents and Additives
One unique aspect of the refined products is that some of them alsocontain traces of blending agents and additives. These materialsinclude chemicals such as alcohols, aminophenols, ethers, and sulfo-nates.
WHAT IS THE EVIDENCE OF DIFFERENCES IN MOBILITY ANDTOXICITY?The mobility and toxicity of crude oils, refined products, condensates,and E&P wastes are also quite different.
Mobility
The mobility of hydrocarbon liquids in the environment depend upontheir density (API gravity), viscosity (resistance to flow) and pour pointas well as the properties and characteristics of the geologic strata (e.g.,clays, silts, or sands). Hydrocarbon liquids with high API gravities,low viscosity, and low pour points (e.g., gasoline, condensates, andsome crude oils) have the potential to be very mobile in a sandy soil butwould move very little in a tight clay. Conversely, a liquid with lowAPI gravity, high viscosity, and a high pour point (e.g., mineral oil orsome crude oils) would not be very mobile regardless of the nature ofthe geologic material.
The solubility and volatility of hydrocarbons impact their mobility ingroundwater and soil vapor, respectively. These properties track veryclosely with carbon-number (or molecular weight). Generally, as thecarbon-number of the hydrocarbon increases, its solubility in water andvolatility decrease. As such, given the wide variability in the carbonnumbers of the hydrocarbons among crude oils and between crude oilsand refined products and condensates, it is expected that crude oilswould demonstrate a wide range of solubilities and volatilities. Evid-ence of this was provided earlier for crude oil when solubilities in water
Mobility of hydrocarbons in theenvironment depends upon thedensity, viscosity and pour pointof the hydrocarbon as well asthe characteristics of the geo-logic strata.
Concentrations of metals incrude oil are not significant froma human health or ecologicalrisk perspective.
Solubility and volatility of hydro-carbons are strongly correlatedto carbon-number range (i.e.,molecular weight).

25
ranging from 3.5 to 65 mg/L were documented for two oils with verydifferent API gravities.
Toxicity
There is a similar degree of variability in the toxicity of liquidhydrocarbons due directly to their variable composition and physicalcharacteristics. For example, hydrocarbon mixtures with elevatedconcentrations of benzene or the aromatic carbon-number fraction fromC8 to C16 have a greater potential to cause human health effects than dohydrocarbon mixtures containing elevated concentrations of the highmolecular weight aliphatic carbon-number fraction, C16 to >C25.However, the physical environment can reduce the toxicity of a hydro-carbon by removing the hydrocarbon mixture of concern from theenvironment through processes such as sorption or biodegradation. It isthe action of processes such as these that can eliminate hydrocarbonssuch as benzene from groundwater before it comes into contact with ahuman or ecological receptor.
Benzene and the C8 to C16aromatic carbon-number frac-tion have the greatest potentialto cause human health effects;the high molecular weight,aliphatic carbon-number fractionof C16 to C25 is not toxic.

26
PART IVCALCULATION OF RISK AND RISK-
BASED SCREENING LEVELS
WHAT ARE THE KEY COMPONENTS OF THEFOUR ELEMENTS OF THE RISK EVALUATION PROCESS?
The technical elements of the risk evaluation process were describedpreviously and include hazard identification, exposure assessment,toxicity assessment, and risk characterization. Simply stated, a quantita-tive risk evaluation involves identifying the chemicals of potentialconcern at a site, simulating their release and movement in the environ-ment, estimating their uptake by humans, and predicting the potentialhealth effects of the exposure.
HAZARD IDENTIFICATION
Hazard identification is accomplished by collecting and reviewing siteassessment data and identifying the chemicals of potential concern andthe environmental media (e.g., soil, groundwater, air) in which they canbe found. It answers the question “What are the potential hazards at thesite?”
EXPOSURE ASSESSMENT
The exposure assessment answers the question “Who is exposed to howmuch of the chemicals of potential concern?” The exposure assessmentis a three-step process: (1) the site setting, which depicts the relativelocations of the hazards and potential receptors, is characterized, (2)complete exposure pathways are identified, and (3) the magnitude ofthe potential exposure is estimated.
Characterizing the site setting identifies who might be exposed to thechemicals of potential concern. A key question in identifying whothese receptors might be is the current and reasonably expected futureland use for the site. Historically, regulatory agencies have required sitemanagers to consider all potential future land uses, including residentialuse, in risk analyses. This is not a reasonable assumption for mostE&P sites; more realistic future land uses include ranch land, agri-cultural land, or park land. More recently, regulatory agencies havefocused more clearly on protecting current land uses and have permit-ted more flexibility in the selection of appropriate future land use scen-arios. This has resulted in more flexibility in developing site clean-upcriteria.
Chapter Overview:
� Describes four technicalelements of the riskevaluation process
� Presents basic equationsused to calculate:
• contaminant intake
• carcinogenic and non-carcinogenic risk
� Describes risk-basedscreening levels andpresents equations fortheir derivation
� Describes default assump-tions for use in RBSL/riskequations
Exposure pathways are routesby which chemicals at a site cancome into contact with potentialreceptors.
Realistic future land uses forE&P sites include:
� Ranch land
� Agricultural land
� Park land

27
Once it has been determined who might be exposed to chemicals ofpotential concern, the next step is to determine how they might beexposed. This is a process in which potentially complete exposurepathways are identified. In identifying these complete exposure path-ways, the sources of the chemicals at the site are determined and theways in which they may move around in the environment and be trans-ported to places at which receptors might realistically be exposed areconsidered. For example, if a crude oil is spilled on soil at a site, aworker in the area may be exposed by direct skin contact with theimpacted soil. Alternatively, some of the components of the crude oilmay vaporize into air and be inhaled by the worker or they may migratethrough the soil into the groundwater and then be transported to adrinking water well at some distance from the site and subsequentlyingested. The exposure assessment is important because it introducessite-specific factors into the characterization of the site risk.
The final step of the exposure assessment is to quantify the potentialexposure to identified receptors. Standardized intake equations areused in this part of the analysis to answer the final question “To howmuch of the chemicals of potential concern is a receptor likely to beexposed?”
TOXICITY (DOSE-RESPONSE) ASSESSMENT
The toxicity assessment answers the question “What dose levels of thechemicals of potential concern may produce adverse health effects inpeople or other receptors?” In the toxicity assessment, chemicals areusually evaluated separately for their abilities to cause cancer and otheradverse health effects. All chemicals can cause adverse health effectsof some sort at some dose level, but only some chemicals have thepotential to cause cancer. Most available toxicological data for bothcarcinogenic and non-carcinogenic chemicals have been generated inthe laboratory using pure chemicals that have been added to the food orwater of rats or mice. One of the major challenges is in extrapolatingthese results to situations in which mixtures of chemicals, such as crudeoil, may be of concern. A second challenge is in extrapolating thelaboratory results obtained in rodents treated with pure chemicals tosituations in which people are exposed to chemicals in soil. In bothcases, uncertainty factors are included to make certain that chemicaltoxicity is not underestimated.
RISK CHARACTERIZATION
The final step of the risk evaluation combines the results of theExposure Assessment with the Toxicity Assessment to estimate thepotential risks posed by the site. The result is a conservative riskestimate that is likely to overestimate the true risks posed by the site.In reality, the true risk is most likely to be much lower than theestimated risk, and may be as low as zero in some cases.
Exposure assessment is anextremely important element ofthe risk evaluation because itintroduces site-specific factorsinto the characterization of thesite risk.
All chemicals have the inherentability to cause adverse healtheffects of some sort, at somedose level; but only somechemicals have the ability tocause cancer.
Key challenges associated withusing toxicity data:
(1) Extrapolating pure chemicaltest results to complexmixtures of chemicals
(2) Extrapolating pure chemicaltest results to situationswhere the chemicals arepresent in soil
(3) Extrapolating test results inanimals to humans

28
WHAT CALCULATIONS ARE USED TO DETERMINERISKS TO HUMAN HEALTH?
The calculations used to estimate risk are all based on those originallyderived by U.S. EPA. The calculations and the default assumptionsthat are commonly used in them are specifically designed to provide aresult that is protective of human health.
EXPOSURE ASSESSMENT: CALCULATION OF CONTAMINANT INTAKE
The quantitative exposure estimation determines the amount of chemi-cal that is taken in by a receptor for a given exposure route. Thepotential exposure pathways considered included direct contact withcontaminated soils (i.e., inhalation, ingestion, and dermal contact),consumption of groundwater affected by contaminant leaching fromsite soils, and inhalation of volatiles in outdoor air. In all cases, thecalculation of the chemical intake requires knowledge of:
� The concentration of the chemical in the impacted media, i.e.,soil (mg/kg), air (micrograms/m3), or water (mg/L)
� The amount of the impacted media that is taken in by thereceptor (i.e., liters of air or water or kilograms of soil)
The amount of the impacted medium that is taken in is determined byidentifying an exposure event, specifying the quantity of the mediumthat is taken in per event, and specifying the frequency and duration ofthe event. The intake is then converted to a dose level by dividing it bythe body weight of the receptor and averaging over an appropriate timeperiod. This yields an average daily dose or average lifetime daily doseexpressed in mg/kg per day. The averaging time period depends uponthe health effect that is being addressed. For example, the averagingtime for carcinogenic effects is a lifetime of 70 years. On the otherhand, for non-cancer effects, the averaging time is equal to the durationof the exposure (e.g., 25 years for an adult worker).
DERIVATION OF TOXICOLOGICAL DOSE-RESPONSE FACTORS
In estimating risk, the exposure estimate is combined with a toxicologi-cal dose-response factor. The dose-response factor depends upon thechemical, the route of exposure, and the health effect that is of concern(i.e., carcinogenic or non-carcinogenic). They are generally derived byU.S. EPA, or other regulatory agencies, and are made available to thepublic for use by risk assessors. The data on which these factors arebased is usually generated in laboratory studies using animals. Thedose-response factors derived from these data include reference doses(RfDs) or inhalation reference concentrations (RfCs) for evaluating
where:I = Chemical intake [mg/kg
BW-day]C = Chemical concentration
[e.g., mg/kg-soil or mg/L-water]
CR = Contact rate or the amountof impacted mediumcontacted per event [e.g.,liters/day, mg/day]
EF = Exposure frequency[days/year]
ED = Exposure duration [years]BW = Body weight of the
receptor [kg]AT = Averaging time of the
exposure [days]
I = C ∗∗∗∗ CRBW
∗∗∗∗EF ∗∗∗∗ ED
AT
Determination of chemical intake foran exposure pathway:
29
non-carcinogenic effects and cancer slope factors for evaluatingcarcinogenic effects as described below:
� Reference doses (RfDs — mg/kg-day): Estimate of dailyexposure that is likely to be without an appreciable risk ofadverse effects during a lifetime of exposure;
� Reference concentrations (RfCs — mg/m3): Estimate of acontinuous inhalation exposure to the human populationthat is likely to be without an appreciable adverse effectduring a lifetime of exposure; and
� Oral cancer slope factor [CSF — (mg/m3)-1]: Slope of therelationship between the oral dose administered in the studyand the carcinogenic response.
CALCULATION OF RISK
The risk calculations for non-cancer effects are expressed in terms of aunitless hazard quotient that is calculated using the following equation:
The threshold level of acceptability that has been established by theU.S. EPA is the value of 1.0, although some states have establisheddifferent target values. Hazard quotients greater than 1.0 typicallyrequire further analysis or some sort of site action.
The risk calculation for carcinogenic effects is based on a somewhatsimilar equation:
Risk = Average Lifetime Daily Dose (mg/kg-day) x Slope Factor (mg/kg-day)-1
This risk calculation also yields a unitless value. The acceptableindividual excess lifetime cancer risk range established by the U.S.EPA is 10-4 to 10-6. Many state regulatory agencies have establishedacceptable risk targets within this range.
WHAT ARE RISK-BASED SCREENING LEVELS (RBSLS)AND HOW ARE THEY DERIVED?
Risk-Based Screening Levels (RBSLs) are chemical-specific concen-trations in environmental media that are considered protective ofhuman health. They can be derived from the risk equations byspecifying an acceptable target risk level and rearranging the equationsto determine the chemical concentration in the environmental mediumof concern that achieves this risk level.
)daykg/mg(DoseferenceRe)daykg/mg(DoseDailyAverageQuotientHazard
−−−−−−−−====
Hazard Index, or HI, is the sumof hazard quotients for the indi-vidual chemicals of concern at asite. The acceptable limit for HIcan also be 1 although Texasrecently established 10 as thethreshold value [TNRCC, 2000].

30
The tiered risk-based decision-making approach developed by ASTMrelies more on the use of RBSLs for decision making, rather than on anexplicit calculation of site risk, as generally used in the classicalapproach by U.S. EPA. Provided below is an equation, based on thoseused by ASTM, to calculate an RBSL for non-cancer effects for theexposure pathways of soil ingestion and dermal contact with soil (i.e.,RBSLss):
[ ] ( )RBSLssg
kg soilµ =
× × ×
× ×× × + × ×
THQ BW AT
EF EDIR RAF SA M RAF
RfD
ndaysyear
kgmg soil o d
o
365106
This equation estimates the maximum concentration of a contaminantin soil that is protective of human health for the exposure pathways thatinvolves both soil ingestion and direct contact with soil. Similar RBSLequations for other exposure pathways (i.e., inhalation of volatiles andparticulates, ingestion of groundwater, and inhalation of vapor) areprovided in Appendix B.
A couple of items regarding these RBSL equations and their usewarrant additional comment. First, the derivation of RBSLs forcomplex mixtures such as crude oil requires additional manipulationsof these equations which will be addressed later in this manual for non-cancer health effects.
Second, there are several factors in the risk equations that address theavailability of soil-bound contaminants to the human receptor. Theseare the dermal relative absorption factor, or RAFd, the oral relativeabsorption factor, RAFo, and the ambient air partition factors for bothparticulates (VFp) and vapors (VFss). These factors are includedbecause the soil tends to bind many of the contaminants and preventthem from coming into contact with the receptor and causing animpact. This matrix effect is caused by the soil, is recognized by theU.S. EPA, and is currently the subject of a great deal of research byuniversities, industrial consortia, and the U.S. EPA.
The third, and last, point addresses cross media considerations that arerelevant to the vapor and groundwater pathways. For both of theseexposure pathways, the acceptable contaminant concentrations in theair and groundwater can be used to back-calculate a contaminant con-centration in soil that will be protective of these other media. In otherwords, a contaminant concentration in soil can be determined that willnot result in an exceedance of the acceptable contaminant concen-trations in air or groundwater. To complete these back-calculations, avolatilization factor (VF, [mg/m3]/ [mg/kg]) and leaching factor (LF,
Definition of parameters forRBSL calculation based ondermal contact with soil:
THQ = Target hazardquotient forindividualconstituents[unitless]
BW = Body weight [kg]
ATn = Averaging time fornon-carcinogens[years]
EF = Exposure frequency[days/year]
ED = Exposure duration[years]
IRsoil = Soil ingestion rate[mg/day]
RfDo = Oral chronicreference dose[mg/kg-day]
RAFd = Dermal relativeabsorption factor[unitless]
RAFo = Oral relativeabsorption factor[unitless]
SA = Skin surface area[cm2/day]
M = Soil to skinadherence factor[mg/cm2]

31
[mg/L]/[mg/kg]) are required. The former predicts the amount ofcontaminant that will partition between the soil and the vapor, while thelatter predicts the partitioning from the soil to the aqueous phase[TPHCWG, 1997a].
ARE RBSLS IDENTICAL FORALL ROUTES OF EXPOSURE?
The RBSLs will not be the same for all routes of exposure. This isbecause the dose of a contaminant that a receptor receives dependsupon the route of exposure and the concentration of the contaminant inthe different environmental media. For this reason, it is possible to haveseveral RBSLs for a contaminant at a given site (i.e., one RBSL foreach exposure pathway). The lowest of these RBSLs for the completeexposure pathways at the site is then used for the overall risk-baseddecisions. Considering the nature and composition of crude oils (i.e.,low in volatile or water soluble components that could partition into airor water), it is generally the RBSLs for direct contact withhydrocarbon-impacted surface soils that drive the management of E&Psites. The receptors of concern are most often onsite workers or othernon-residential receptors depending upon the current and reasonablyanticipated future use of the site.
WHAT ARE THE DEFAULT ASSUMPTIONS THAT ARE USED INTHE RBSL EQUATIONS AND FROM WHERE DID THEY
ORIGINATE?
There are a large number of parameters for which values must beavailable before RBSLs for contaminants in soil can be calculated.Some of these parameters were discussed in the previous paragraph andinclude:
� The dermal relative absorption factor (RAFd)
� The oral relative absorption factor (RAFo)� The ambient air partition factors for both particulates (VFp)
and vapors (VFss)
� The volatilization factor (Vf, [mg/m3]/[mg/kg])
� The leaching factor (LF, [mg/L]/[mg/kg])
Other required parameters include body weight, exposure frequency,exposure duration, soil and water ingestion rates, air inhalation rates,averaging times for carcinogens and non-carcinogens, skin surfacearea, and soil-to-skin adherence factor.
Cross media considerations forRBSLs:
� Soil RBSLs to protectgroundwater:
LFRBSL
RBSL gwatersoil =
� Soil RBSLs to protectvapor:
VFRBSLRBSL air
soil =
RBSLs for direct contact withsoils in a non-residential settingis often the driver for manage-ment decisions at E&P sites.
Selected Risk AssessmentDefault Values of theU.S. EPA
Parameter ValueBody Weight
Adult 70 kgChild 15 kg
Inhalation RateAdult 20m3/dChild 10 m3/d
Water Ingestion RateAdult 2 L/dChild 1 L/d
Soil Ingestion RateAdult 100 mg/dChild 200 mg/d
Exposure FrequencyResidentialSetting
350 d/yr
OccupationalSetting
250 d/yr
Exposure DurationAdult 30 yrsChild 6 yrsOccupational 25 yrs
Note:Child = Ages 1 through 6

32
The U.S. EPA has developed default values for each of these para-meters that can be used if no other site- or chemical-specific data areavailable. Many state regulatory agencies have also made recommen-dations for their programs. Where appropriate, default values areavailable for several potential human receptors including workers, andadult and child residents.

33
PART VAPPLICATION OF RISK-BASED
METHODOLOGIES TO E&P SITES
The Total Petroleum Hydrocarbon Criteria Working Group (TPH-CWG) convened in 1993 to address the disparity among TPH clean-uprequirements being used by states at sites that were impacted withhydrocarbon materials such as gasoline, jet fuels, and lubricating oils.The group, which had over 50 active participants, was led by a steeringcommittee that consisted of representatives from industry, government,and academia. Their goal was to develop scientifically defensibleinformation for establishing TPH clean-up levels in soils that areprotective of human health at petroleum-impacted sites. The finalapproach that evolved from the TPHCWG mirrors the existing tieredrisk-based framework of ASTM but expands it by providing a metho-dology that can address complex mixtures of hydrocarbons rather thanjust single compounds [TPHCWG, 1999]. Since the TPHCWGmethodology has become more well known, it has been applied severaltimes to hydrocarbon-contaminated sites in the railroad industry, thegas transmission industry, and oil and gas E&P facilities [Nakles, et al.,1996; Remediation Technologies, Inc., 1998; McMillen, et al., 1999b].
The Petroleum Environmental Research Forum (PERF), under a projecttitled Scientifically Sound Risk-Based Management of E&P Sites(PERF Project 97-08), made modifications to the TPHCWGmethodology [McMillen, et al., 1999a; McMillen, et al., 1999b].Specifically, PERF enhanced the TPHCWG methodology to addressthe unique characteristics of crude oils. The ultimate objective of thePERF project was to use the advanced, risk-based scientific methods toestablish Tier 1 soil clean-up levels for the wide variety of crude oiltypes that may be encountered at E&P sites. Once established,compliance with these Tier 1 levels could then be assessed usingconventional analyses of TPH.
TPHCWG RISK-BASED METHODOLOGY
WHAT IS THE TRADITIONAL APPROACH FOR MANAGINGHYDROCARBON-IMPACTED SOILS AT E&P SITES?Traditionally, hydrocarbon-impacted soils at E&P sites have beenmanaged based on their total petroleum hydrocarbon (TPH) content.Oil and gas industry guidance on TPH clean-up concentrations at E&Psites was not based upon risk to human health; rather, it was based onthe protection of plants and water resources [API, 1993; Currier and
Total Petroleum HydrocarbonCriteria Working Group led theway in the development of risk-based Assessments of TPH.
Petroleum Environmental Re-search Forum expanded theefforts of the TPHCWG fromrefined products to includecrude oil.
Traditional approaches formanaging E&P sites werebased upon protection of plantand water resources.
Chapter Overview:
� Discussion of risk-basedanalysis of TPH
� Shortcomings of traditionalTPH measurements
� Definition of fractions formanaging TPH
• Analysis
• Mobility/Toxicity
� Application to crude oil, re-fined products, conden-sates and E&P wastes

34
Peoples, 1954; Udo, et al., 1975; Baker, 1970; deOng, et al., 1927;Plice, 1948; Chaineau, et al., 1997; and Saterbak, et al., 1999]. Thiswork illustrated that >10,000 mg/kg TPH from crude oil did notadversely impact the growth of most plants nor pose a risk of leachingto groundwater. Some states adopted a TPH clean-up level of 10,000mg/kg (1% by weight) based on these results. However, other statesused TPH standards as low as 100 mg/kg in soil that are similar tothose developed for gasoline leaks at underground storage tank sites forthe protection of groundwater. This standard might be applied to anE&P site even though a heavy crude oil, with no potential to leach togroundwater, may have been the only onsite petroleum hydrocarbon.The current research initiatives seek to establish a more consistenttechnical approach for the management of petroleum hydrocarbons thatemphasizes the protection of human health and determines if a TPHconcentration of 10,000 mg/kg is indeed protective at E&P sites.
WHAT IS TOTAL PETROLEUM HYDROCARBON OR TPH?TPH is defined by the analytical method that is used to measure it.Conventional TPH measurement techniques quantify only thosehydrocarbons that are extracted by the particular method. To the extentthat the hydrocarbon extraction efficiency is not identical for eachmethod, the same sample analyzed by different TPH methods willproduce different TPH concentrations.
Conventional bulk measurements of TPH in a sample are sufficient forscreening the acceptability of site concentrations, based upon a compar-ison with existing TPH regulations. However, these bulk measure-ments are not sufficient to support a human health risk assessment. Toillustrate this point, high bulk TPH concentrations can be measured initems that clearly do not pose a risk to human health. For example,TPH concentrations have been measured in many items that can befound throughout nature including grass (14,000 mg/kg of TPH), pineneedles (16,000 mg/kg of TPH), and oak leaves (18,000 mg/kg). It hasalso been measured in household petroleum jelly at concentrations of749,000 mg/kg. Although these TPH concentrations are substantiallygreater than many existing TPH standards, none of these materials areconsidered a risk to human health.
WHAT METHODS ARE USED TO MEASURE BULK TPH IN SOIL ANDGROUNDWATER ?
Analytical Methods
Some of the more common methods for the analysis of TPH include:(1) Method 418.1 or Modified 418.1, (2) Method 413.1 for oil andgrease, (3) Modified 8015M for Diesel-Range Organics (DRO) and (4)Modified 8015M for Gasoline-Range Organics (GRO) [TPHCWG,1998a]. Method 418.1 consists of solvent extraction followed bytreatment in a silica gel column and infrared spectroscopy; the modified
TPH is defined by the analyticalmethod that is used to measureit.
TPH measurements of severalnatural materials yield signifi-cant TPH concentrations:
Grass — 14,000 mg/kg
Dried Oak Leaves18,000 mg/kg
Pine Needles — 16,000 mg/kg
Petroleum Jelly749,000 mg/kg

35
Method 8015 for DRO and GRO are solvent extractions followed bygas chromatography. If it is suspected that the sample is predominatelya gasoline (i.e., volatile) fraction, purge and trap sample introduction tothe gas chromatograph is often used in the determination of GRO.Method 413.1 is a gravimetric method that consists of solventextraction, evaporation of the solvent, and a weight measurement.
In addition to these "standard" methods, it should be recognized thatthere are many permutations of these analyses that have beendeveloped and applied by the individual states. These permutationsevolved because, historically, no one universal method for themeasurement of petroleum hydrocarbons was available for use. Manyof these methods are modified versions of the gas chromatographicmethods and are referred to as "modified 8015". In many instances, theregulatory body does not have these methods available in written form.
Shortcomings
Figure 8 shows the overlap between the carbon number ranges ofdifferent hydrocarbon products as well as the overlap in the corres-ponding TPH analytical methods. For example, this figure demon-strates that a TPH method designed for gasoline range organics (i.e., C6to C12) may report some of the hydrocarbons present in diesel fuel (i.e.,C10 to C28). The same is also true for TPH analytical tests for dieselrange organics which will identify some of the hydrocarbons present ingasoline-contaminated soils. Lastly, TPH Method 418.1 covers thecomplete range from gasoline through lube oil, motor oil, and grease(i.e., C8 to C40). However, crude oil contains hydrocarbons with carbonnumbers that range from C3 to C45+ and is not fully addressed even withthe use of all three TPH methods.
FIGURE 8. CARBON NUMBER RANGES ADDRESSED BY TPH ANALYTICAL METHODS
TPH Methods: Approximate Carbon Ranges
Purgeable/Volatile/Gasoline Range, Modified 8015, Purge and Trap, GC
Diesel Range, Modified 8015, Extraction, GC
418.1, Modified 418.1: Extraction, IR
C2 C4 C6 C8 C10C12C14C16C18C20C22C24C26C28C30
GasolineDiesel Fuel/Middle Distillates
Lube/Motor Oil, Grease

36
WHAT DOES INDUSTRY GUIDANCE TELL USABOUT TPH CLOSURE CRITERIA?API has provided guidance for waste management at exploration andproduction sites [API, 1997]. As part of this guidance, it has delineatedacceptable concentrations of hydrocarbons in soil for the wastemanagement practices of landspreading, roadspreading, and burial/-landfill. Specifically, the following guidance is provided for TPHand/or oil and grease:
� Landspreading: A concentration of 10,000 mg/kg (or 1% byweight) or less of oil and grease is recommended based on theprotection of plants, water, and soil microbes. If the TPH or oiland grease have low concentrations of water-soluble organiccompounds, TPH concentrations above the 1% limit may alsobe acceptable.
� Burial/Landfill: API recommends that this practice, without theuse of a protective liner, be limited to solids or semi-solids thatcontain low-hydrocarbon content inert materials (e.g., freshwater drilling muds or spent iron sponge). No free oil should beburied or placed in a landfill and the oil and grease contentshould be limited to no more than 10,000 mg/kg (or 1% byweight).
The guidance for roadspreading does not provide any specificconcentration limits for hydrocarbons. Rather, it specifies that thepractice should be limited to exempt wastes (see Appendix A) such astank bottoms or emulsions that have a flash point less than 60ºC(140ºF), i.e., are not ignitable.
WHAT ARE SOME OF THE TYPICAL TPH CLOSURE CRITERIA THATHAVE BEEN USED INTERNATIONALLY?In addition to the state regulations that were presented in Part II, TPHclosure criteria have also been established for soils in Canada as well asother international locations. The TPH regulations in Canada rangefrom less than 100 to 5,000 mg/kg [Canadian Council of Ministers,2000a; Canadian Council of Ministers, 2000b].
Many developing countries such as Venezuela and Indonesia have noregulations for TPH in soil. However, both of these countries do speci-fy the use of the Toxicity Characteristic Leaching Procedure (TCLP) ofRCRA for an assessment of the hazardous classification of E&Pwastes. Those countries that do have TPH regulations have typicallyestablished them by borrowing from the regulations of North Americaand Europe. In most cases, they have selected the lowest TPHstandard, regardless of its applicability, in an effort to ensure that theyare being protective. The end result is that some soil standards in thesecountries are based on oil and grease regulations that were established
Examples of TPH regulations inCanada (mg/kg):
Alberta
1,000 mg/kg — Oil and greasemethod not specified
British Columbia
(1) 1,000 TEH/100 light HC forClass 1 [TEH = Method8015 up to C30; Light HC =<C10]
(2) 2,000 TEH/200 Light HC forClass 2
(3) 5,000 Oil and grease forClass 3 [special wastesonly]
Class 3 is permitted landfill;Class 2 is commercial orindustrial; Class 1 is allothers
Examples of soil TPH regula-tions in other countries:
� Papua New Guinea — 20mg/kg
� Nigeria — 50 mg/kg
� Netherlands (Dutch) — 50mg/kg (mineral oil andgrease)

37
in the United States for water, i.e 20 mg/L. Other TPH soil standards,such as the proposed 50 mg/kg limit in Nigeria, were taken from thesoil regulations of the Dutch.
WHAT OTHER CRITERIA BESIDES TPHHAVE BEEN USED FOR THE CLOSURE OF E&P SITES?API also has recommended acceptable criteria for the salt and metalscontent of exploration and production wastes and/or mixtures of thesewastes with soil for the waste management practices of landspreading,road spreading, and burial/landfill [API, 1997]. These criteria are asfollows:
� Landspreading: API guidance specifies an electrical conduc-tivity of less than 4 mmhos/cm, an exchangeable sodiumpercentage of less than 15, and a sodium adsorption ratio of lessthan 12. pH limits of between six and nine are also specifiedalong with limits for the following metals in mg/kg:
� Arsenic (41)� Barium (180,000)� Boron (2 mg/L — Procedures specified by the Louisiana
Department of Natural Resources: Laboratory Proceduresfor Analysis of Oilfield Waste, Statewide Order No. 29-B,1989)
� Cadmium (26)� Chromium (1,500)� Copper (750)� Lead (300)� Mercury (17)� Molybdenum (37 — Non-risk interim ceiling established by
U.S. EPA on February 25, 1994 [59 Federal Register 9050])� Nickel (210)� Selenium (100 — Site-specific conditions that affect the
availability of selenium should be considered if elevatedconcentrations are present in the waste)
� Zinc (1,400)
� Roadspreading: No specific concentration limits are establishedfor either salt or metals; however, it is recommended that themetals content should be consistent with that of approved roadoils or mixes.
� Burial/Landfill: The recommended criteria for salt in buried orlandfilled wastes is an electrical conductivity of less than 4mmhos/cm. The API guidance also suggests that the metalcontent of the wastes should be considered although no specificlimits are provided for individual metals.

38
Should the waste or soil/waste mixture be unacceptable for burial orlandfill in an unlined unit, another option is to install a liner or tomodify the properties of the waste or soil/waste mixture throughstabilization or encapsulation.
WHAT IS THE ROLE OF BULK TPH MEASUREMENTS IN E&P SITEMANAGEMENT?The hazard evaluation that is conducted as part of the risk evaluation ofa site requires some level of understanding of the chemical compositionof the hydrocarbons that are present in the soil and groundwater. Thetraditional TPH measurement techniques are not adequate to supportthis hazard evaluation because they provide no specific informationabout the hydrocarbons that are detected. In fact, as previouslydiscussed, TPH concentrations can actually represent different fractionsof the crude oil, depending upon which methods of TPH analysis areused. In addition, it has been shown that significant TPH concentra-tions have been measured in many natural materials in the environmentthat pose no risk to human health (e.g., grass, oak leaves, and pineneedles).
However, traditional measurements of bulk TPH can be used to managea site after Tier 1 RBSLs (Risk-based Screening Levels) have beenestablished using more advanced risk-based methodologies. These Tier1 RBSLs do not need to be generated on a site-specific basis to reflectthe characteristics of the crude oil that is present. PERF Project 97-08developed a set of risk-based, Tier 1 RBSLs for the TPH of crude oilthat could be used to screen the acceptability of all E&P sites. Toaccomplish this, PERF has conducted extensive hydrocarbon analysesof approximately 70 crude oils from around the world. Thisinformation has been combined with exposure assessments that arerepresentative of realistic land uses for E&P sites (i.e., non-residentialland uses) to yield conservatively low TPH RBSLs for E&P sites.Since these RBSLs are representative of the TPH and exposurepathways of a wide variety of E&P sites, it is proposed that compliancewith these RBSLs can now be assessed using conventional TPHanalytical techniques. This approach is completely consistent with thatwhich was recently proposed by the Texas Natural Resource andConservation Commission [TNRCC] in their draft guidance for thedevelopment of protective concentration levels of hydrocarbonmixtures [TNRCC, 2000].
WHAT IS THE GENERAL RISK ASSESSMENT APPROACH OF THETPHCWG AND HOW DOES IT ADDRESS THE SHORTCOMINGS OFBULK TPH MEASUREMENTS?The general approach of the TPHCWG consists of an assessment ofrisk associated with both cancer and non-cancer health effects.
An understanding of chemicalcomposition of hydrocarbons isrequired for risk-based manage-ment of TPH.
Conventional measurements ofTPH can be used to manage asite after mixture-specific, Tier 1RBSLs have been determinedusing advanced risk-basedmethodologies.

39
Cancer Risk
The risk of cancer health effects is examined first by using indicatorcompounds, such as benzene and the seven carcinogenic polycyclicaromatic hydrocarbons (i.e., benz(a)anthracene, chrysene, dibenz(a,h)-anthracene, benzo(a)pyrene, benzo(b)fluoranthene, benzo(k)fluor-anthene, and indeno(1,2,3-cd)pyrene), and standard methods of riskassessment. A discussion of cancer health effects as they relate tocrude oils will be presented later in this document.
Non-Cancer Risk
If the risk of cancer health effects is deemed acceptable, the next step inthe approach of the TPHCWG is to examine the potential risk of non-cancer health effects. It is in this area that major innovations in the riskassessment methodology have been made. These innovations focusedon the development of a better understanding of the composition of therefined products of petroleum, in general, as well as the TPH of thesematerials. PERF expanded upon these efforts of the TPHCWG byspecifically addressing crude oils and condensates.
The complexity of petroleum hydrocarbons represented the majorchallenge to the TPHCWG. Since it is impossible to analyze complexpetroleum hydrocarbon mixtures for all of their constituents and sinceno one compound could possibly act as a surrogate for these mixtures,the TPHCWG chose to use a fraction approach for assessing theircomposition. The first step in this fraction approach was to separate thehydrocarbons into two groups based on chemical structure (i.e.,aliphatic hydrocarbons and aromatic hydrocarbons). Once segregatedinto these groups, the aliphatic hydrocarbons were separated into sixcarbon number fractions and the aromatic hydrocarbons into seven
carbon number fractions (Figure 9). Each of the 13fractions was then treated as if it were a separate com-pound in the environment.
WHAT BASIS DID THE TPHCWG USE TO DEFINE THEDIFFERENT HYDROCARBON FRACTIONS OF TPH?
The carbon number fractions were identified by selecting groups ofhydrocarbons that have similar fate and transport properties, such assolubility and vapor pressure. This was done because of the importantrole that fate and transport play in determining the exposure of areceptor to a site contaminant. For example, it is the more solublepetroleum compounds that are most likely to migrate to groundwaterand represent a risk to humans via the consumption of drinking water.By choosing fate and transport criteria for the definition of the frac-tions, the TPHCWG ensured that the risk assessment would properlycapture the fraction of the hydrocarbon mixture that would be present atthe point of exposure for the variety of exposure pathway-receptorcombinations that might be present at a site.
Initial separation of hydro-carbons based on chemicalstructure:
� Aromatic Hydrocarbons
Toluene (C7H8 or C7)
H|C
H — C
C|C|H
H — C
C — H
C — H
H — — H
� Aliphatic Hydrocarbons
Octane (C8H18)
H — C — C — C — C — C — C — C — C — H
H|
|H
H|
|H
H|
|H
H|
|H
H|
|H
H|
|H
H|
|H
H|
|H

40
Aliphatic and aromatic hydrocarbons were considered separatelybecause their solubility and other fate and transport characteristics areso dramatically different (Table 1). Within each of these groups, themajor differences in fate and transport properties were related to thecarbon-numbers of the compounds. As shown in Table 1, theproperties of the compounds (i.e., solubility, vapor pressure) and theirmodeled environmental behavior (i.e., coefficient for partitioning toorganic carbon (Koc), from soil to water (PFsoil/water) and from soil tovapor (PFsoil/vapor)) change by an order-of-magnitude between thedifferent carbon-number fractions. It should be noted that carbonnumbers presented in Table 1 represent "equivalent carbon numbers" orECs. The EC is related to the boiling point of a compound normalizedto the boiling point of a normal alkane or its retention on a boiling pointgas chromatographic (GC) column. Thus, for compounds where only aboiling point is known, the EC can be readily calculated. For example,the normal alkane, hexane, contains six carbons and has a boiling pointof 69°C. Its EC is six. The aromatic hydrocarbon, benzene, alsocontains six carbons, and has a boiling point of 80°C. Based on itsboiling point and its retention in a boiling point GC column, the EC ofbenzene is 6.5 [TPHCWG, 1997a].
Aromatics Aliphatics
>C6-C7>C7-C8>C8-C10>C10-C12>C12-C16>C16-C21>C21-C35
H|C
H — C
C|C|H
H — C
C — H
C — H
H — — H
H — C — C — C — C — C — C — C — C — H
H|
H|
H|
|H
|H
|H
H|
|H
H|
|H
H|
|H
H|
|H
H|
|H
>C5-C6>C6-C8
>C8-C10>C10-C12>C12-C16>C16-C35
FIGURE 9. DETERMINING TPH COMPOSITION: SEPARATION OF CHEMICAL GROUPS INTO CARBON-NUMBERFRACTIONS

41
HOW WAS THE TOXICITY OF EACH HYDROCARBON FRACTIONASSIGNED?Toxicity criteria were developed for each fraction by conducting athorough literature review of all the data available on pure hydrocarboncompounds, refined petroleum products, and specific hydrocarbon frac-tions. It is important to note that this toxicity literature is the sameliterature that was available to the U.S. EPA during their developmentof toxicity criteria [U.S. EPA, 1997; U.S. EPA, 2000]. The toxicitycriteria are expressed as oral reference doses (RfD) in mg/kg/day or asreference concentrations (RfC) in mg/m3 for inhalation exposure.These reference doses and the material that was tested to generate themare summarized in Table 2. In some cases, identical toxicity valueswere assigned to different fractions. This was due either to thesimilarity of toxicity findings across fractions or the limitations in thetoxicity literature which forced the application of data from onefraction to another. As previously noted, reference doses are estimatesof daily exposures to the human population, including sensitivesubgroups, that are unlikely to pose a significant risk during a lifetimeof exposure.
WHAT ANALYTICAL METHODOLOGY IS USED BY THE TPHCWG TOQUANTIFY THESE HYDROCARBON FRACTIONS?The TPHCWG developed an analytical technique that is based on SW-846 EPA methods for separating hydrocarbons into fractions using gaschromatography techniques. First, the petroleum hydrocarbon orpentane extract of a soil is separated into aliphatic and aromaticfractions. This chemical separation is accomplished using an aluminacolumn (SW 846 - EPA Method 3611) or a silica gel column (SW 846— EPA Method 3630). The aliphatic and aromatic fractions are
TABLE 1. FATE AND TRANSPORT CHARACTERISTICS OF TPH FRACTIONS (BASED ON EQUIVALENT CARBON NUMBER)
Solubility(mg/L)
VaporPressure
(atm)Log Koc
(c/c)PF*
(soil/water)PF*
(soil/vapor)
Aliphatic FractionsC5-6 3.6E+01 3.5E-01 2.9 1E+01 3E-01> C6-8 5.4E+00 6.3E-02 3.6 4E+01 9E-01> C8-10 4.3E-01 6.3E-03 4.5 3E+02 6E+00>C10-12 3.4E-02 6.3E-04 5.4 3E+03 5E+01> C12-16 7.6E-04 4.8E-05 6.7 7E+04 1E+03> C16-35 1.3E-06 7.6E-06 9.0 1E+07 1E+05Aromatic FractionsC6-7 1.8E+03 1.3E-01 1.9 9E-01 4E+00> C7-8 5.2E+02 3.8E-02 2.4 2E+00 9E+00> C8-10 6.5E+01 6.3E-03 3.2 2E+01 5E+01>C10-12 2.5E+01 6.3E-04 3.4 2E+01 2E+02> C12-16 5.8E+00 4.8E-05 3.7 5E+01 2E+02> C16-21 5.1E-01 7.6E-06 4.2 1E+02 4E+04> C21-35 6.6E-03 4.4E-09 5.1 1E+03 3E+07
Notes:*Partition factors from soil to water and soil to vapor.
Toxicity literature used was thesame literature available to theU.S. EPA during their develop-ment of toxicity criteria.
Reference Doses: Estimates ofdaily exposures (oral or inhala-tion) to human population thatare unlikely to pose significantrisk during a lifetime of expo-sure.

42
analyzed separately by gas chromatography and quantified by summingthe signals within a series of specific carbon ranges. The gas chromato-graph is equipped with a boiling point (i.e., non-polar capillary) column[TPHCWG, 1998a].
WHY WAS IT NECESSARY TO MODIFY THE TPHCWG ANALYTICALMETHODOLOGY TO DEAL WITH CRUDE OIL AT E&P SITES?The original version of the TPHCWG analytical methodology did notinclude hydrocarbons greater than carbon number 35 (C35) (See Figure9). This is appropriate for most refined petroleum products such asgasoline and diesel. However, the concentration of hydrocarbons withcarbon numbers greater than 35 (i.e., C35+) can be as high as 50% to60% in some crude oils with low API gravities. Therefore, to conduct atrue risk-based analysis of sites where crude oil was present, it wasnecessary to be able to detect hydrocarbons with carbon numbersgreater than C35. This was done by modifying the gas chromatographictechnique to quantify hydrocarbons up to C44. Then the fraction >C44can be determined by distillation or it can be estimated. The hydro-carbon fraction with carbon numbers greater than C44 (i.e., C44+) issometimes called the vacuum residuum, since it contains the com-pounds remaining after the vacuum distillation of crude oil.
HOW WAS THE TPHCWG ANALYTICAL METHODOLOGY MODIFIED TODEAL WITH CRUDE OILS AT E&P SITES?The TPHCWG methodology was modified by PERF to deal with theunique characteristics of crude oils. First, the gas chromatography wasenhanced to permit the fractionation and detection of hydrocarbonswith carbon numbers as high as C44.
TABLE 2. REPRESENTATIVE TOXICITY OF CARBON-NUMBER FRACTIONS
Carbon-Number Fraction Reference DoseAliphatic Aromatic Oral RfD
(mg/kg/day)Inhalation RfC
(mg/m3)>C5-C6>C6-C8
5.0 (commercial hexane, n-hexane)
18.4 (commercial hexane)
>C8-C10>c10-C12>C12-C16
0.1 (JP-8 and other petroleumstreams)
1.0 (JP-8 and other petroleumstreams)
>C16-C35 2.0 (white mineral oils) Not applicable due to highmolecular weight
>C6-C8 0.2 (toluene) 0.4 (toluene)>C8-C10>c10-C12>C12-C16
0.04 (multiple aromaticcompounds)
0.2 (aromatic mixture)
>C16-C21>C21-C35
0.03 (pyrene) Not applicable due to highmolecular weight

43
Next, PERF developed three approaches to determine the mass ofhydrocarbon with carbon numbers greater than C44. The most favoredapproach is to use a distillation analysis of the crude oil. If thisinformation is not available, the next choice is to use a correlation thathad been developed for crude oils between the yield of vacuumresiduum and API gravity (Figure 10). This correlation was construc-ted using data from 800 crude oils in the United States [Coleman, et al.,1978]. It can be seen from Figure 10 that the yield (expressed involume percent) of the vacuum residuum can vary greatly among crudeoils. For example, the yield ranges from near 70% for a crude oil withan API gravity of 10˚ to 5% or less for crude oils with API gravities of40˚ to 60˚. The last option to determine the C44+ fraction is to assign allof the oil, other than the mass of the aliphatic and aromatic carbonnumber fractions determined by gas chromatography to this heavyfraction.
Figure 11 presents the aliphatic and aromatic carbon number fractionsthat form the basis for conducting a risk-based assessment of the TPHthat is associated with crude oils. The major changes that were made tothe original carbon number fractions of the TPHCWG shown in Figure9 are as follows:
(1) The >C21 to C35 aromatic carbon number fraction wasreplaced by a >C21 to C44 carbon number fraction.
(2) The >C16 to C35 aliphatic carbon number fraction wasreplaced by a >C16 to C44 carbon number fraction.
(3) A C44+ carbon number fraction was added that included bothaliphatic and aromatic hydrocarbons since it was notphysically possible to separate hydrocarbons of this size into
FIGURE 10. YIELD OF VACUUM RESIDUUM IN 800 CRUDE OILS PRODUCED IN THE UNITED STATES.
Methods for determining massof C44+ hydrocarbons (listed inorder of preference):
� Use distillation analysisdata
� Use correction betweenyield of vacuum residuumand API gravity
� Use mass of oil injectedinto GC less mass of GC-able fraction
Volume percent of vacuumresiduum can vary greatlyamong crude oils:
� ~70%: Crude oil with APIgravity of 10˚
� <5%: Crude oil with APIgravity of 40˚ to 60˚

44
separate fractions and the toxicity data were only availablefor the vacuum residuum fraction as a whole. Most of theresins and asphaltenes reside in the C44+ carbon numberfraction.
WHAT PORTION OF THE TOTAL HYDROCARBON IN CRUDE OIL CANBE CATEGORIZED USING THE MODIFIED TPHCWG (PERF)ANALYTICAL METHODOLOGY?Using the modified analytical method of the TPHCWG, it is nowpossible to categorize greater than 85% of the hydrocarbon in crude oilcompounds into the fractions shown in Figure 11. Figure 12 presentsdata for fifteen different crude oils to illustrate this point. From thisfigure, it can be seen that approximately 45 to 80 percent of thehydrocarbons in crude oil can be detected using a gas chromatograph(i.e., carbon numbers from C6 to C44). The portion of the crude oil thatcannot be detected without the application of different techniques isrepresented by the hydrocarbons with a carbon number less than C6 orgreater than C44. The data in Figure 12 suggest that the former canaccount for anywhere from 0 to 20% of the crude oil while the latter,from 5% to 45%. Per the previous discussion, the percentage of the
Aromatics Aliphatics
>C6-C7>C7-C8>C8-C10>C10-C12>C12-C16>C16-C21>C21-C44
H|C
H — C
C|C|H
H — C
C — H
C — H
H — — H
H — C — C — C — C — C — C — C — C — H
H|
H|
H|
|H
|H
|H
H|
|H
H|
|H
H|
|H
H|
|H
H|
|H
>C5-C6>C6-C8
>C8-C10>C10-C12>C12-C16>C16-C44
FIGURE 11. ALIPHATIC AND AROMATIC CARBON NUMBER FRACTIONS FOR THE ASSESSMENT OF RISKASSOCIATED WITH CRUDE OIL TPH (highlighted fractions different than fractions of TPHCWG)
Distribution of hydrocarbons in15 crude oils:
� 0 to 20%: <C6
� 45 to 80%: C6-C44
� 5 to 45%: >C44

45
C44+ fraction for each of the 15 crude oils in Figure 12 was determinedusing distillation. At the same time, greater than 95% of diesel oil canbe detected by gas chromatography, alone, further reinforcing thedifferences in hydrocarbon composition between crude oil and diesel.
HOW DO THE QUANTITY OF HYDROCARBONS IN EACH FRACTIONVARY AMONG DIFFERENT CRUDE OIL PRODUCTS?Figure 13 provides a comparison of the distribution of the carbonnumber fractions for the single analyses of four different mixtures ofhydrocarbons (i.e., crude oil, gasoline, mineral oil, and petroleumjelly). Not surprisingly, the gasoline is dominated by the lower carbonnumber fractions of the aliphatic and aromatic hydrocarbons (>C6 toC10 aromatics and >C5 to C6 aliphatics). On the other extreme is themineral oil and petroleum jelly which consist almost exclusively of thealiphatic fraction, >C16 to C44. Lastly, as expected, the hydrocarbonfractions in a crude oil cover the full range of carbon numbers for boththe aliphatic and aromatic fractions as well as a portion of which has acarbon number greater than C44.
HOW WERE THE FATE AND TRANSPORT PROPERTIES ANDTOXICOLOGICAL CHARACTERISTICS OF THE C35-44 AND C44+ CARBONNUMBER FRACTIONS DETERMINED?Fate and transport as well as toxicity characteristics for the C35-44 andC44+ carbon number fractions were determined in a manner similar towhat was done for the original 13 fractions.
Major hydrocarbon fractions inthree refined products:
Gasoline
� >C6-C10 aromatics
� >C5-C6 aliphatics
Mineral Oil/Vaseline
� >C16-C44 aliphatics
1 2 3 4 5 6 7 8 9 10 11 12 13 14 150 10 20 30 40 50 60 70 80 90
100 % GC - <C6 >C4
Different Crude Oils Diese1 2 3 4 5 6 7 8 9 10 12 13 14 1512 13 150
10 20 30 40 50 60 70 80 90
100
0 10 20 30 40 50 60 70 80 90
100
Mas
s B
alan
ce
C6 to C44
DieseDiesel
Figure 12. Categorization of Crude Oil Hydrocarbon into Carbon Number Fractions

46
C35-44 Carbon Number Fraction
There were no transport and toxicity data available for the carbonnumber fraction, C35-44. To address this data gap, this hydrocarbonfraction was assigned the characteristics of the next closest aliphatic(>C16 to C35) or aromatic (>C21 to C35) carbon number fractions (SeeTables 1 and 2). This is a very conservative assignment since the C35-44fraction has a higher molecular weight that either of these twofractions. The actual molecular weight will make the C35-44 fractionless mobile in the environment than would be predicted by giving it thetransport properties of the lower carbon number fractions. Similarly,the C35-44 fraction will also be less available to cause human healtheffects following dermal contact or oral ingestion as compared to thelower carbon number fractions.
C44+ Carbon Number Fraction
As previously mentioned, the C44+ carbon number fraction issometimes called the vacuum residuum since it contains the compoundsremaining after the vacuum distillation of the crude oil. The vacuumresiduum fraction of a crude oil is comprised of very large molecules(those boiling above 600°C [1,112°F]) that are not well characterizedas to their compositional make up; however, it is known to contain amixture of aliphatics, aromatics, metals, and asphaltenes. This fractionis also enriched in heteroatoms (nitrogen, sulfur and oxygen containingcompounds) [Altgeit, et al., 1994]. Because of the complex nature,limited mobility, and the small amount of published toxicity data onthis fraction, a decision was made to evaluate it as a single fraction,rather than trying to separate it into aliphatic and aromatic groups.
Transport and toxicity data forC35-44 fraction:
� Aliphatics: Assigned prop-erties of >C16-C35 aliphaticsfraction
� Aromatics: Assigned prop-erties of >C21-C35 aromaticfraction
FIGURE 13. COMPARISON OF THE DISTRIBUTION OF CARBON NUMBER FRACTIONS INCRUDE OIL AND SELECTED PRODUCTS
0100,000200,000300,000400,000500,000600,000700,000800,000900,000
Con
cent
ratio
n (m
g/kg
)
TPH FractionsAliphaticsAromatics
GasolineMineral OilPetroleum JellyCrude Oil
>C6-
C7
>C7-
C8
>C8-
C10
>C10
-C12
>C12
-C16
>C16
-C21
>C21
-C44 >C
5-C
6
>C6-
C8
>C8-
C10
>C12
-C16
>C16
-C44
>C44
0100,000200,000300,000400,000500,000600,000700,000800,000900,000
0100,000200,000300,000400,000500,000600,000700,000800,000900,000
Con
cent
ratio
n (m
g/kg
)
TPH FractionsAliphaticsAromatics
TPH FractionsAliphaticsAromatics
GasolineMineral OilPetroleum JellyCrude Oil
>C6-
C7
>C7-
C8
>C8-
C10
>C10
-C12
>C12
-C16
>C16
-C21
>C21
-C44
>C6-
C7
>C7-
C8
>C8-
C10
>C10
-C12
>C12
-C16
>C16
-C21
>C21
-C44 >C
5-C
6
>C6-
C8
>C8-
C10
>C12
-C16
>C16
-C44
>C5-
C6
>C6-
C8
>C8-
C10
>C12
-C16
>C16
-C44
>C44

47
Toxicity and fate and transport values were then selected based on thissingle fraction.
Toxicity. Only two 28-day dermal toxicity studies on vacuum residuumhave been published [American Petroleum Institute, 1983]. There areno oral toxicity data available on this heavy fraction of crude oil. Sincethe U.S. Environmental Protection Agency has not traditionallyaccepted oral reference doses (RfDs) based on dermal data, the toxicityvalues for the C44+ fraction were set at an oral RfD of 0.03 mg/kg/day(the toxicity of pyrene), which is considered a very conservative value.[The conservatism of this assignment is again due to the significantdifference in the physical and chemical properties of the pyrene ascompared to the heavy molecular weight C44+ carbon number fraction].The dermal RfD was set at 0.8 mg/kg/day based on the results of thepublished dermal toxicity data. No reference concentration for inhala-tion was defined due to the extremely low volatility of this material.
Fate and Transport. The fate and transport characteristics of the C44+fraction were determined as they were for the other carbon numberfractions (Table 1). Values were assigned for solubility, carbon-watersorption coefficient, the Henry's Law constant, and a soil to waterleaching factor.
WHAT ARE RELEVANT EXPOSURE PATHWAYS FOR AN E&P SITE?To identify the pathways of most concern to an E&P site, it is useful todevelop a conceptual model of the site. This conceptual model identi-fies the nature and location of the impacted media, the receptors thatare present, and the possible pathways for the exposure of thesereceptors to occur. Figure 14 presents a very simplified illustration of aconceptual model for a generic E&P site. This generic model depictshydrocarbon-impacted soil and groundwater as the media of concern at
the site. The potential receptors are the onsite worker and nearbyresidents that are located adjacent to the facility. The potential path-
Toxicity and transport data forC44+ fraction:
� Toxicity: Identical to pyrene
� Transport:
(1) Solubility: 0.0001 mg/L
(2) Carbon-water sorptioncoefficient (Koc):500,000 cm3/g
(3) Henry's Law Constant:4(10-8)
(4) Leaching factor (soil towater):
1.65(10-5)[(mg/L)/(mg/kg)]
The primary exposure pathwayof concern at most E&P sitesinvolves direct contact and inci-dental ingestion of impactedsurface soils by onsite workers.
Groundwater
Impactedshallow soil
Drinkingwaterwell
HazardHazard
PeoplePeople
ExposureExposure
FIGURE 14. CONCEPTUAL MODEL FOR GENERIC E&P SITE
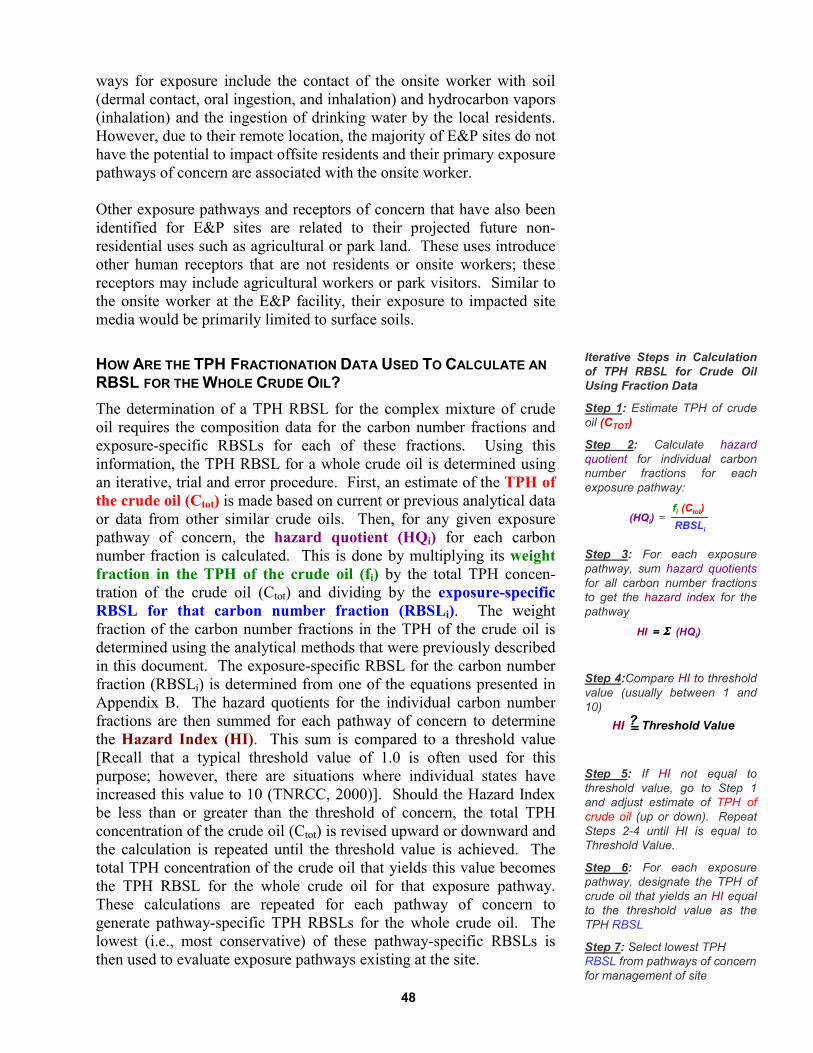
48
ways for exposure include the contact of the onsite worker with soil(dermal contact, oral ingestion, and inhalation) and hydrocarbon vapors(inhalation) and the ingestion of drinking water by the local residents.However, due to their remote location, the majority of E&P sites do nothave the potential to impact offsite residents and their primary exposurepathways of concern are associated with the onsite worker.
Other exposure pathways and receptors of concern that have also beenidentified for E&P sites are related to their projected future non-residential uses such as agricultural or park land. These uses introduceother human receptors that are not residents or onsite workers; thesereceptors may include agricultural workers or park visitors. Similar tothe onsite worker at the E&P facility, their exposure to impacted sitemedia would be primarily limited to surface soils.
HOW ARE THE TPH FRACTIONATION DATA USED TO CALCULATE ANRBSL FOR THE WHOLE CRUDE OIL?The determination of a TPH RBSL for the complex mixture of crudeoil requires the composition data for the carbon number fractions andexposure-specific RBSLs for each of these fractions. Using thisinformation, the TPH RBSL for a whole crude oil is determined usingan iterative, trial and error procedure. First, an estimate of the TPH ofthe crude oil (Ctot) is made based on current or previous analytical dataor data from other similar crude oils. Then, for any given exposurepathway of concern, the hazard quotient (HQi) for each carbonnumber fraction is calculated. This is done by multiplying its weightfraction in the TPH of the crude oil (fi) by the total TPH concen-tration of the crude oil (Ctot) and dividing by the exposure-specificRBSL for that carbon number fraction (RBSLi). The weightfraction of the carbon number fractions in the TPH of the crude oil isdetermined using the analytical methods that were previously describedin this document. The exposure-specific RBSL for the carbon numberfraction (RBSLi) is determined from one of the equations presented inAppendix B. The hazard quotients for the individual carbon numberfractions are then summed for each pathway of concern to determinethe Hazard Index (HI). This sum is compared to a threshold value[Recall that a typical threshold value of 1.0 is often used for thispurpose; however, there are situations where individual states haveincreased this value to 10 (TNRCC, 2000)]. Should the Hazard Indexbe less than or greater than the threshold of concern, the total TPHconcentration of the crude oil (Ctot) is revised upward or downward andthe calculation is repeated until the threshold value is achieved. Thetotal TPH concentration of the crude oil that yields this value becomesthe TPH RBSL for the whole crude oil for that exposure pathway.These calculations are repeated for each pathway of concern togenerate pathway-specific TPH RBSLs for the whole crude oil. Thelowest (i.e., most conservative) of these pathway-specific RBSLs isthen used to evaluate exposure pathways existing at the site.
Iterative Steps in Calculationof TPH RBSL for Crude OilUsing Fraction Data
Step 1: Estimate TPH of crudeoil (CTOT)
Step 2: Calculate hazardquotient for individual carbonnumber fractions for eachexposure pathway:
Step 3: For each exposurepathway, sum hazard quotientsfor all carbon number fractionsto get the hazard index for thepathway
Step 4:Compare HI to thresholdvalue (usually between 1 and10)
Step 5: If HI not equal tothreshold value, go to Step 1and adjust estimate of TPH ofcrude oil (up or down). RepeatSteps 2-4 until HI is equal toThreshold Value.
Step 6: For each exposurepathway, designate the TPH ofcrude oil that yields an HI equalto the threshold value as theTPH RBSL
Step 7: Select lowest TPHRBSL from pathways of concernfor management of site
(Ctot)RBSLi
fi(HQi) =
(HQi)HI ΣΣΣΣ====
Threshold ValueHI ?====
49
There are additional factors that must be considered when conductingthe above calculations. For example, the summation of all of the massfractions of the carbon number fractions must equal unity. Also, theconcentration of any carbon number fraction in soil cannot result inhydrocarbon concentrations in pore water and soil vapor abovesaturation levels. The details regarding phase saturation have beenreported elsewhere [TPHCWG, 1999] and are summarized briefly inAppendix C of this document. This detailed information should beconsulted before any application of this methodology to a site isattempted.
Lastly, it should be understood that there are some key assumptions re-garding the potential interactive toxicological effects of the individualfractions of a hydrocarbon mixture that are implicit in the calculation ofthe TPH RBSL for the whole crude oil. Specifically, the methodologyof the TPHCWG assumes that each carbon-number fraction will affectthe same target organ and that the toxic effects are additive. Thisassumption is considered appropriate for a screening level assessmentsince different hydrocarbon fractions often affect different targetorgans, rendering additivity of toxicological effects highly conserva-tive.
WHAT EXPOSURE SCENARIOS AND PATHWAYS ARE IMPORTANT FORCRUDE OIL AND WHAT ARE THE TPH RBSLS FOR THESESITUATIONS?As previously noted, both the current and future land uses will play arole in establishing the exposure scenarios that are important at an E&Psite. The TPH RBSLs for crude oil that are determined for the site willbe different for these different exposure scenarios because of variousassumptions that are made about the receptors and their frequency ofcontact with the site hydrocarbons. In general, residential exposurescenarios are not considered relevant to most E&P sites and the primaryfocus of site management is on commercial or other non-residentialapplications. However, in those instances where residential land use isof concern due to the past history of the site development, the conductof a site-specific risk assessment to address this scenario may bewarranted and should be considered.
With regards to non-residential land use, it has been determined that theonly exposure pathway for TPH that poses a significant risk of non-cancer human health effects is direct contact with hydrocarbon-impac-ted soil (i.e., soil ingestion, inhalation of soil particulate, and dermalcontact) [McMillen, et al., 199b]. Leaching to groundwater andvolatilization to outdoor air can be important pathways for crude oil atnon-residential sites but only under certain circumstances [Rixey, et.al., 1999]. This is because most crude oils have low concentrations ofthe low molecular weight aromatic hydrocarbons as compared to
Only exposure pathway for TPHthat poses a significant risk ofnon-cancer health effects atE&P sites is direct contact withhydrocarbon-impacted soil.

50
refined products such as gasoline. It is these fractions that are capableof causing a significant risk (i.e., hazard index above threshold values)for the leaching and volatilization exposure pathways; the other carbonnumber fractions are either not soluble or volatile enough to result in anexposure of concern.
WHAT EXPOSURE PATHWAYS AND TPH FRACTIONS TYPICALLYDICTATE TPH RBSLS FOR CRUDE OIL AT AN E&P SITE?For nearly all E&P sites, direct contact with surface soil is the primarypathway of concern. This is due to the presence of the high molecularweight, aromatic carbon number fractions in the TPH of the crude oil.From a TPH perspective, the groundwater pathway is not usually aconcern since the crude oil is not very soluble in water. In fact, inmany instances, the crude oil can be present in soil at residual satura-tion and not pose a risk via the groundwater pathway.
An illustration of the effect of TPH composition on nonresidential TPHRBSLs for crude oil in surface soils is presented in Figure 15
[McMillen, et al., 1999b]. As shown in this figure, all of the TPHRBSLs were equal to or greater than 42,000 mg/kg or 4.2% TPH. Thehighest TPH RBSLs of 84,000 (8.4%) and 85,000 (8.5%) wereobtained for three very waxy crude oils that contained elevatedconcentrations of high molecular weight aliphatic hydrocarbons.[These hydrocarbons are the least toxic of the carbon number fractions- See Table 2]. The TPH RBSLs in Figure 15 are presented versus theirAPI gravity simply as a way of illustrating the diversity of the crudeoils that were examined. As presented, it is evident that there does notappear to be a strong correlation between the TPH RBSL and the APIgravity of the crude oil.
High molecular weight aromaticand aliphatic carbon numberfractions drive TPH RBSLs fordirect contact with soil.
Elevated content of high molec-ular weight aliphatic hydro-carbons present in waxy crudeoils yield highest TPH RBSL forsoil at E&P model site (i.e.,85,000 mg/kg)
FIGURE 15. NON-RESIDENTIAL TPH RBSLS FOR SURFACE SOIL: CRUDE OIL IN SOILS FROMAROUND THE WORLD
0 5 10 15 20 25 30 35 40 45 50API Gravity
0
10,000
20,000
30,000
40,000
50,000
60,000
70,000
80,000
90,000
TPH
Non
-Res
iden
tial
Surf
ace
Soil
RB
SL, m
g/kg
soi
l
Current Guidance for Clean-Up at E&P Sites in Some States
0 5 10 15 20 25 30 35 40 45 50API Gravity
0 5 10 15 20 25 30 35 40 45 50API Gravity
0
10,000
20,000
30,000
40,000
50,000
60,000
70,000
80,000
90,000
TPH
Non
-Res
iden
tial
Surf
ace
Soil
RB
SL, m
g/kg
soi
l
0
10,000
20,000
30,000
40,000
50,000
60,000
70,000
80,000
90,000
0
10,000
20,000
30,000
40,000
50,000
60,000
70,000
80,000
90,000
TPH
Non
-Res
iden
tial
Surf
ace
Soil
RB
SL, m
g/kg
soi
l
Current Guidance for Clean-Up at E&P Sites in Some States

51
HOW DO THE TPH RBSLS FOR CRUDE OIL COMPARE TO TPHRBSLS FOR REFINED PETROLEUM PRODUCTS, CONDENSATES ORASSOCIATED WASTES?
Refined Petroleum Products
The TPH RBSLs calculated for some products refined from crude oil(gasoline, diesel, mineral oil, baby oil, and petroleum jelly) under anon-residential exposure scenario are shown in Table 3. In thisexample, the limiting exposure pathway (i.e., the exposure pathwaywith the lowest TPH RBSL) for gasoline is leaching to groundwater,and the non-residential TPH RBSL for this pathway is 1,800 mg/kgsoil. For all the other products, the limiting exposure pathway is directcontact with surface soil. The non-residential TPH RBSLs for thispathway range from 53,000 (or 5.3%) for diesel oil to 1,000,000 mg/kg(or 100%) for petroleum jelly. The elevated TPH RBSLs for bothmineral oil and petroleum jelly confirm the appropriateness of theassumptions used for the exposure pathways and for the toxicity andtransport/fate parameters of the TPH fractions, since both of thesematerials are known to be safe for human contact and/or ingestion.petroleum jelly and mineral oil contain only high molecular weightaliphatic compounds and no aromatic hydrocarbons (the more toxic andwater soluble hydrocarbons), thus it is reasonable for them to have highTPH RBSLs.
In contrast, gasoline, consists primarily of hydrocarbons ranging fromC5 to C10 and contains aromatic hydrocarbons including benzene (2.7weight percent for this particular sample). As such, it has the lowestTPH RBSL. [The average benzene content of 124 gasoline sampleswas determined to be 1.9% with a minimum of 1.6% and a maximumof 2.3% (TPHCWG, 1998b)]. Diesel, which contains approximately 30percent aromatics and very low levels of benzene, has an intermediateTPH RBSL of 53,000 mg/kg, again limited by direct soil contact andnot by the groundwater leaching pathway.
TABLE 3. TPH RBSLS FOR SELECTED REFINED PRODUCTS OF CRUDE OIL (MG/KG)
Non-Residential Scenario
Leaching toGW
Vaporizationto Outdoor
AirSurface
SoilsGasoline* 1,800 NL NLDiesel* NL NL 53,000Baby Oil NL NL 610,000Mineral Oil NL NL 890,000Petroleum Jelly NL NL 1,000,000
Notes:NL: Not limiting exposure pathway.*These RBSLs were derived based upon single samples of these hydrocarbonmixtures. The RBSLs will likely vary (either up or down) for other gasolines ordiesels depending upon their composition.
Benzene concentrations weredetermined for over 124samples of gasoline:
� Concentration range was1.6 to 2.3%
� Average concentration was1.9%

52
Gas Condensates
TPH RBSLs were also calculated under a non-residential exposurescenario for fourteen gas condensates taken from across the continentalUnited States. These TPH RBSLs are summarized in Table 4. It canbe seen from these data that the limiting exposure pathway for the gascondensates is direct contact with surface soil, which was also thelimiting pathway for all of the crude oils and all of the refined crude oilproducts except gasoline. The values for the TPH RBSLs of the gascondensates ranged from 53,000 to 190,000 mg/kg with the majority ofthem (i.e., 12 of 14) falling between 50,000 and 72,000 mg/kg. Thesevalues are consistent with those calculated for diesel oil (Table 3) andall of the crude oils that were examined (Figure 15).
Associated Wastes
Wastes from two different production sites plus soil samples from threesites were evaluated using the TPH risk assessment methodology. Thenon-residential TPH RBSLs that were generated are presented inTable 5 along with those of the crude oils that were produced at the fivesites. Before reviewing the information that is presented in Table 4, itis important to note that the limiting exposure pathway was directcontact with surface soils for all of the materials that were examined.
The data show that the TPH RBSLs for the E&P wastes (tank bottoms,oiled road material, oily soils, cyclone separator sludge, and slop oil)have similar to or higher TPH RBSLs than their parent crude oils. Thissuggests that the TPH RBSLs for crude oil should provide a conserva-tive criterion for managing wastes that are present in soils at E&P sites.
Non-residential TPH RBSLs forgas condensates are verysimilar to those for all of thecrude oils and for diesel oil (i.e.,50,000 to 100,000 mg/kg).
Non-Residential Scenario
CondensateLeaching to
GroundwaterVaporization to
Outdoor Air Surface Soils1 NL NL 61,0002 NL NL 63,0003 NL NL 63,0004 NL NL 69,0005 NL NL 71,0006 NL NL 58,0007 NL NL 68,0008 NL NL 64,0009 NL NL 53,000
10 NL NL 55,00011 NL NL 96,00012 NL NL 100,00013 NL NL 190,00014 NL NL 65,000
Notes:NL: Not limiting pathway
TABLE 4. TPH RBSLS FOR SELECTED GAS CONDENSATES (MG/KG)
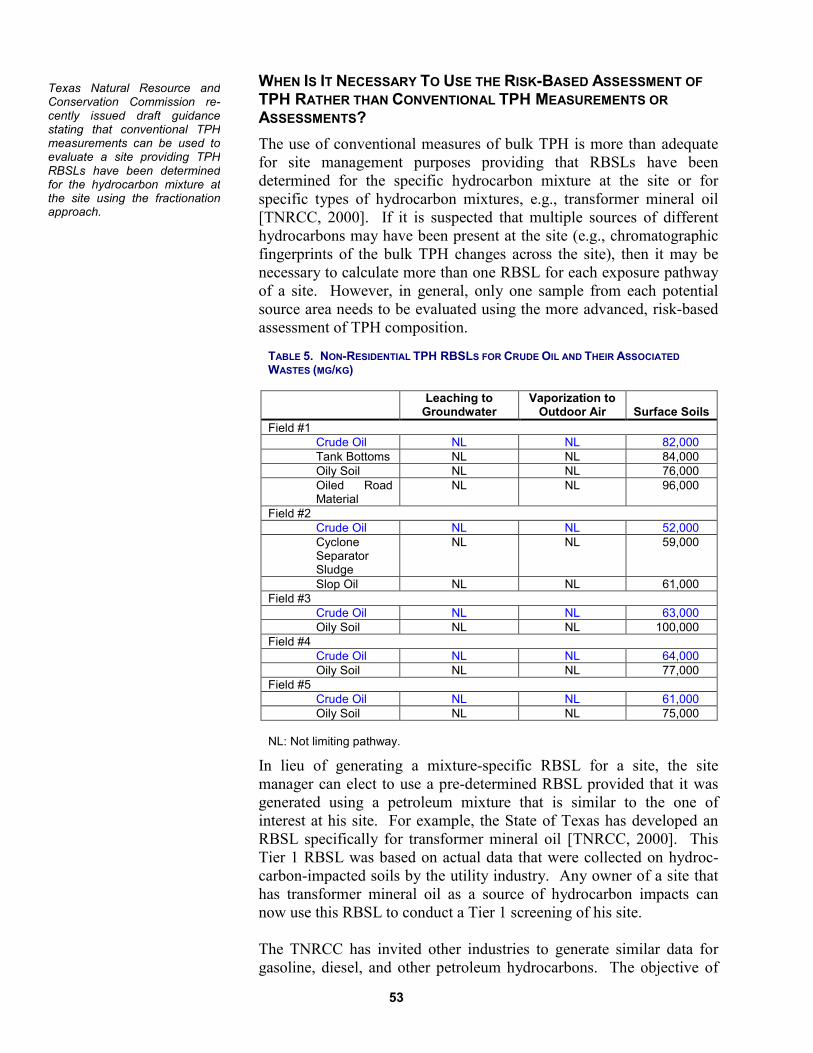
53
WHEN IS IT NECESSARY TO USE THE RISK-BASED ASSESSMENT OFTPH RATHER THAN CONVENTIONAL TPH MEASUREMENTS ORASSESSMENTS?The use of conventional measures of bulk TPH is more than adequatefor site management purposes providing that RBSLs have beendetermined for the specific hydrocarbon mixture at the site or forspecific types of hydrocarbon mixtures, e.g., transformer mineral oil[TNRCC, 2000]. If it is suspected that multiple sources of differenthydrocarbons may have been present at the site (e.g., chromatographicfingerprints of the bulk TPH changes across the site), then it may benecessary to calculate more than one RBSL for each exposure pathwayof a site. However, in general, only one sample from each potentialsource area needs to be evaluated using the more advanced, risk-basedassessment of TPH composition.
In lieu of generating a mixture-specific RBSL for a site, the sitemanager can elect to use a pre-determined RBSL provided that it wasgenerated using a petroleum mixture that is similar to the one ofinterest at his site. For example, the State of Texas has developed anRBSL specifically for transformer mineral oil [TNRCC, 2000]. ThisTier 1 RBSL was based on actual data that were collected on hydroc-carbon-impacted soils by the utility industry. Any owner of a site thathas transformer mineral oil as a source of hydrocarbon impacts cannow use this RBSL to conduct a Tier 1 screening of his site.
The TNRCC has invited other industries to generate similar data forgasoline, diesel, and other petroleum hydrocarbons. The objective of
Texas Natural Resource andConservation Commission re-cently issued draft guidancestating that conventional TPHmeasurements can be used toevaluate a site providing TPHRBSLs have been determinedfor the hydrocarbon mixture atthe site using the fractionationapproach.
TABLE 5. NON-RESIDENTIAL TPH RBSLS FOR CRUDE OIL AND THEIR ASSOCIATEDWASTES (MG/KG)
Leaching toGroundwater
Vaporization toOutdoor Air Surface Soils
Field #1Crude Oil NL NL 82,000Tank Bottoms NL NL 84,000Oily Soil NL NL 76,000Oiled RoadMaterial
NL NL 96,000
Field #2Crude Oil NL NL 52,000CycloneSeparatorSludge
NL NL 59,000
Slop Oil NL NL 61,000Field #3
Crude Oil NL NL 63,000Oily Soil NL NL 100,000
Field #4Crude Oil NL NL 64,000Oily Soil NL NL 77,000
Field #5Crude Oil NL NL 61,000Oily Soil NL NL 75,000
NL: Not limiting pathway.

54
these efforts is to develop Tier 1 RBSLs for these materials that couldbe used by a site manager to rapidly evaluate site conditions. Thiswould be done by comparing conventional measurements of TPH withthe RBSLs in the table. Due to the importance of weathering on theenvironmental behavior, and hence risk, of petroleum hydrocarbons,the TNRCC has stated a preference for Tier 1 RBSLs to be based onrepresentative compositions of weathered hydrocarbons that are presentin the soil. (More about the importance of weathering on thedetermination of TPH RBSLs is presented as part of the benzenediscussion in the next section.) Clearly, the data that have beengenerated as part of PERF 97-08 could be used to calculate Tier 1RBSLs for crude oil. This information could then be used to conductTier 1 risk assessments at E&P sites using conventional measurementsof TPH.
HOW IMPORTANT ARE THE RISKS ASSOCIATED WITH METALS,POLYCYCLIC AROMATIC HYDROCARBONS, AND BENZENE IN THECRUDE OIL ?The risk-based methodology for TPH that is presented in this documentaddresses the non-cancer health effects for humans. The cancer riskassociated with certain PAHs, benzene and metals are addressedseperately. The document does not address ecological risks of anytype. Ecological risks associated with E&P sites are currently beingaddressed by API, GRI, and PERF through new research initiatives. Assuch, this area of risk is not addressed in this document.
Metals
A recent risk evaluation of the presence of metals in crude oils indi-cated that they are unlikely to be a major risk management considera-
Ecological risks are currently thetopic of a new research initiativeof PERF, GRI, and API.
Assessment of 26 crude oilsindicate that metal concentra-tions in crude oil will not drivethe risk at E&P sites at TPHconcentrations of 10,000 mg/kg.
TABLE 6. SUMMARY OF METALS CONCENTRATIONS (MG/KG OIL) IN 26 CRUDE OILS
Ag As Ba Be Cd Co Cr Cu HgMean 0.15 0.06 0.052 ND 0.010 0.27 0.270 0.081 0.06Minimum 0.05 ND ND ND 0.003 ND ND 0.012 NDMaximum 0.30 0.57 0.368 ND 0.026 1.3 1.43 0.241 1.56Detection Freq.(# per 26 Oils)
26 7 19 0 26 16 25 26 1
MethodDetection Level
0.010 0.080 0.001 0.005 0.002 0.010 0.005 0.010 0.010
Mo Ni Pb Sb Se Sn Tl V ZnMean 0.77 19.69 0.032 0.011 0.16 1.37 0.000 62.75 2.92Minimum 0.30 0.05 0.005 ND ND 0.04 ND 0.13 NDMaximum 4.0 93.0 0.149 0.055 0.52 9.66 0.004 370.0 10.9Detection Freq.(# per 26 Oils)
26 26 26 21 24 26 3 26 23
MethodDetection Level
0.020 0.020 0.001 0.001 0.02 0.010 0.002 0.020 0.080
ND = Not Detected
PERF 97-08 data base for crudeoil provides a basis to establisha table of Tier 1 RBSLs for themanagement of E&P sites.

55
tion at crude oil spill sites [Magaw. et al., 1999a; Magaw, et, al.,1999b]. The evaluation involved a total of 26 crude oils that wereanalyzed and found to contain very low levels of metals (Table 6).Evaluation of the human health risk associated with soil containingthese crude oils showed that the potential risk due to the presence of themetals was not significant at total crude oil concentrations in soil above10,000 mg/kg, measured as total petroleum hydrocarbons (TPH). Theamount of metals in 10,000 mg/kg TPH would also be protective of soilinvertebrates, plants, and soil microbial communities as defined bypublished ecological soil screening levels.
Polycyclic Aromatic Hydrocarbons
Similar to the analysis of metals in crude oil, an analysis of 70 crudeoils revealed the presence of very low concentrations of prioritypollutant PAHs including the seven carcinogenic PAHs (Table 7)[Kerr, et al., 1999a; Kerr. et al., 1999b]. A screening of the humanhealth risk associated with the presence of the carcinogenic PAHs incrude oil-contaminated soil showed the risk was not significant at TPHconcentrations up to 170,000 mg/kg at non-residential sites. Evenwhen the more restrictive exposure and toxicity parameters of the Stateof California were used, the acceptable levels for crude oil in soil basedon the potential human health effects of PAHs were determined to bewell above 10,000 mg/kg. This indicates that the low levels of PAHsin crude oils are not likely to be a major risk management considerationat crude oil spill sites and that TPH RBSLs of 10,000 mg/kg will beprotective of human health with a considerable safety factor. In caseswhere groundwater protection may be of concern, the potential fornaphthalene to leach to groundwater may need to be evaluatedseparately. Overall, these results suggest that there is no compellingevidence to conduct routine PAH analyses at E&P sites.
Benzene
An understanding of the impact of benzene in terms of cancer risk onthe management of residual hydrocarbons at E&P sites is continuing toevolve. Current work to examine this issue is building upon previousefforts that were focused on the management of underground storagetanks (UST). Since the UST programs usually dealt with refinedpetroleum products such as gasoline, the majority of the recent workhas been to delineate the key differences that exist when crude oil is thepetroleum hydrocarbon of concern.
Presence of Benzene at E&P Sites. Benzene concentrations weremeasured in a total of 69 crude oils and 14 natural gas condensates[Rixey, 1999]. Its concentration in the crude oil ranged from non-detect (<1.4 mg/kg oil) to 5,900 mg/kg oil, with a mean concentrationof 1,340 mg/kg oil. In contrast, the maximum concentration in thenatural gas condensates was 35,600 mg/kg of condensate (3.56%) witha mean concentration of 10,300 mg/kg.
Low concentrations of PAHs incrude oil are unlikely to be amajor risk at E&P sites. Theseresults suggest that there is nocompelling evidence to routinelyconduct PAH analyses at thesesites.
Average benzene concentrationin 69 crude oil samples was1,340 mg/kg oil; in condensates,10,300 mg/kg.
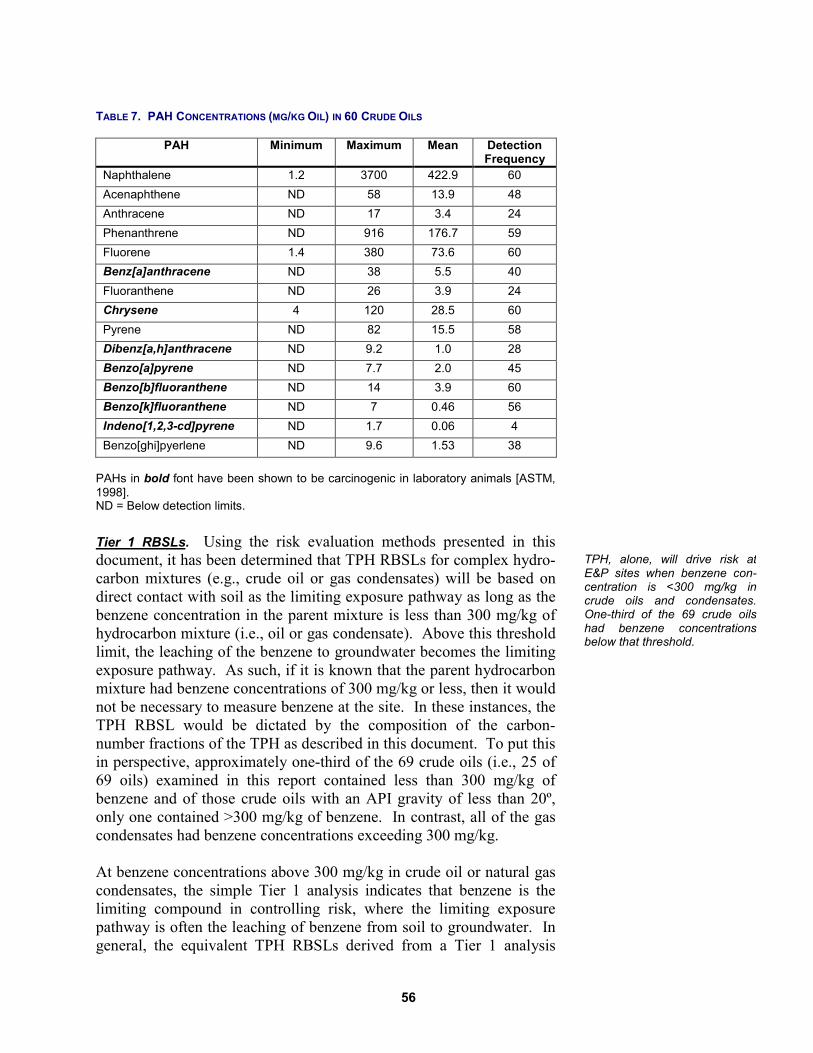
56
Tier 1 RBSLs. Using the risk evaluation methods presented in thisdocument, it has been determined that TPH RBSLs for complex hydro-carbon mixtures (e.g., crude oil or gas condensates) will be based ondirect contact with soil as the limiting exposure pathway as long as thebenzene concentration in the parent mixture is less than 300 mg/kg ofhydrocarbon mixture (i.e., oil or gas condensate). Above this thresholdlimit, the leaching of the benzene to groundwater becomes the limitingexposure pathway. As such, if it is known that the parent hydrocarbonmixture had benzene concentrations of 300 mg/kg or less, then it wouldnot be necessary to measure benzene at the site. In these instances, theTPH RBSL would be dictated by the composition of the carbon-number fractions of the TPH as described in this document. To put thisin perspective, approximately one-third of the 69 crude oils (i.e., 25 of69 oils) examined in this report contained less than 300 mg/kg ofbenzene and of those crude oils with an API gravity of less than 20º,only one contained >300 mg/kg of benzene. In contrast, all of the gascondensates had benzene concentrations exceeding 300 mg/kg.
At benzene concentrations above 300 mg/kg in crude oil or natural gascondensates, the simple Tier 1 analysis indicates that benzene is thelimiting compound in controlling risk, where the limiting exposurepathway is often the leaching of benzene from soil to groundwater. Ingeneral, the equivalent TPH RBSLs derived from a Tier 1 analysis
TPH, alone, will drive risk atE&P sites when benzene con-centration is <300 mg/kg incrude oils and condensates.One-third of the 69 crude oilshad benzene concentrationsbelow that threshold.
TABLE 7. PAH CONCENTRATIONS (MG/KG OIL) IN 60 CRUDE OILS
PAH Minimum Maximum Mean DetectionFrequency
Naphthalene 1.2 3700 422.9 60Acenaphthene ND 58 13.9 48Anthracene ND 17 3.4 24Phenanthrene ND 916 176.7 59Fluorene 1.4 380 73.6 60Benz[a]anthracene ND 38 5.5 40Fluoranthene ND 26 3.9 24Chrysene 4 120 28.5 60Pyrene ND 82 15.5 58Dibenz[a,h]anthracene ND 9.2 1.0 28Benzo[a]pyrene ND 7.7 2.0 45Benzo[b]fluoranthene ND 14 3.9 60Benzo[k]fluoranthene ND 7 0.46 56Indeno[1,2,3-cd]pyrene ND 1.7 0.06 4Benzo[ghi]pyerlene ND 9.6 1.53 38
PAHs in bold font have been shown to be carcinogenic in laboratory animals [ASTM,1998].ND = Below detection limits.

57
decrease to below 10,000 mg/kg of soil when these concentrations ofbenzene are present.
Other Considerations: Weathering and Natural Attenuation. Benzeneconcentrations in hydrocarbon-impacted soil at E&P sites can besignificantly less than the concentrations in the fresh crude oil. This isdue largely to the weathering that occurs following the initial contact ofthe crude oil with the soil. This weathering process can have a signifi-cant impact on the determination of the RBSLs. As a point of reference,the difference in the benzene concentration between the fresh crude oiland the TPH in the soil for these two examples was 2,800 mg/kg of oilversus 1.2 mg/kg of TPH and 1,200 mg/kg of oil versus 310 mg/kg ofTPH, respectively [Rixey, et al., 1999].
Natural attenuation is the dilution and degradation of the benzene inwater or vapor migrating from a source area (such as the zone of an oilspill or release in soil) through the adjacent soil and groundwater.Natural attenuation includes biodegradation. Benzene is naturallyconsumed in this process by soil microbes and disappears from theenvironment. Natural attenuation of BTEX has been extensivelystudied in groundwater and summarized [API, 1998]. Most benzenegroundwater plumes in consolidated sediments are attenuated to levelsbelow concern within several hundred feet of a source zone due tonatural attenuation.
In addition to natural attenuation in groundwater, benzene can also sig-nificantly degrade and attenuate as it is transported through the vadosezone [API, 1996]. This further increases the conservatism presumed inthe above simple Tier 1 analysis. While the understanding of naturalattenuation processes in unsaturated soils is still progressing, recentestimates of benzene natural attenuation for gasoline releases in soil[API, 2000b] suggest the process is very significant. Impact togroundwater from a release would be negligible unless the gasolineitself migrated to the water table or if limited biodegradation occurred(due to a lack of oxygen) in the vadose zone.
RBCA TOOLS FOR THE E&P INDUSTRY
There are a number of commercially available software tools forestimating risk-based screening levels for complex mixtures of hydro-carbons and single indicator chemicals, such as benzene, when theyrepresent the primary risk issue at a site. Typically these models areused for Tier 2 and 3 analysis. Two such models are the API DSS[API, 1999] or BP Risk [Spence, L. R. and T. Walden, 1997].
It is imperative that the user fully understands the underlying metho-dology and assumptions of the software tools. Some key questions thatshould be asked are:
Weathering and natural attenua-tion processes can further re-duce the risk associated withbenzene at an E&P site, therebyresulting in an increase in TPHRBSLs in those instances wherebenzene is present in concen-trations >300 mg/kg.

58
� Is the output in the form of a single TPH RBSL for the wholecrude oil? (Some software tools may only provide a TPHRBSL for each carbon-number fraction.)
� Are the carbon-number fractions specified consistent with thoseaccepted by the state regulatory agency and supported byacceptable analytical protocols?
� How is the heavy fraction (i.e., hydrocarbons with a carbon-number great than C44) handled?
The important point is to recognize that the existing tools do a numberof calculations and numerical manipulations that can affect the finaloutput. Often it is difficult to verify if they are being done correctly.Furthermore, the user must understand what exposure or toxicity para-meters are hardwired into the software and compare those with anyrequired state-specific parameters.
OTHER CONSIDERATIONS FOR OVERSEAS APPLICATIONS
HAS THE TPHCWG METHODOLOGY BEEN ACCEPTED BY OVERSEASREGULATORS?The international community looks to North America and Europe formany of their environmental regulations. This is evident from thereview of existing regulations that was presented previously in thismanual. As such, it is expected that the risk-based approach that hasbeen developed by PERF will have applications outside the borders ofthe United States.
More specifically, the risk-based approach for managing complexhydrocarbons, as developed by the TPHCWG and later modified byPERF, has been presented to international regulators from Nigeria. Inresponse to this presentation, the environmental regulators of Nigeriahave agreed to consider the use of the methodology for managingonshore facilities in lieu of their proposed TPH standard of 50 mg/kgfor soil.
WHAT SPECIAL FACTORS SHOULD BE CONSIDERED WHENPREPARING TO APPLY THE TPHCWG METHODOLOGY TO ANINTERNATIONAL E&P SITE?The TPH risk-based methodology is valid for application to inter-national E&P sites; however, some of the data and assumptions mayrequire some modifications. For example, it is unlikely that the defaultrisk assumptions that are used in the United States will be directlyapplicable to situations in developing countries. Soil and water

59
ingestion rates, to name two parameters, will no doubt be different inagriculturally based countries with no public water supplies. As such,the E&P manager will need to gain a thorough understanding of theregulatory environment and needs of the indigenous populations toassist him or her in the development of a site conceptual model that isrepresentative of the region in which he or she is operating. Thepotential future land uses at an international site will also be driven bythe needs of the local population as well as the national culture.Defining the land uses so that they are acceptable to all local stake-holders must also be carefully done.
Data and default assumptionsused in risk-based assessmentsof TPH should be carefullyreviewed prior to their inter-national application.

60
PART VIREFERENCES
Altgeit, K. H. and M. M. Boduszynski, 1994. "Composition andAnalysis of Heavy Petroleum Fractions", Marcel Dekker.
API, 1983. "28-Day Dermal Toxicity Study in the Rabbit: VacuumResiduum (Samples 81-13 and 81-14)", API Medical ResearchPublication 30.
API, 1993. Evaluation of Limiting Constituents Suggested for LandDisposal of Exploration and Production Wastes, API PublicationNo. 4527, Health and Environmental Sciences Department,American Petroleum Institute, Washington, DC, August 1.
API, 1996. "Characterization of Exploration and Production AssociatedWaste", API Publication Number DR53, Health and EnvironmentalSciences Department, American Petroleum Institute, Washington,D.C., November.
API, 1997. "Environmental Guidance Document: Waste Managementin Exploration and Production Operations", Publication No. APIE5, 2nd Edition, Exploration and Production Department, AmericanPetroleum Institute, Washington, D.C., February.
API, 1998. “Characteristics of Dissolved Petroleum HydrocarbonPlumes,” C. J. Newell and J. A. Conner, Soil and Groundwater Re-search Bulletin No. 8, American Petroleum Institute, Washington,DC, December.
API, 1999. Decision Support System for Exposure and Risk Assess-ment (DSS) [Version 2], American Petroleum Institute,Washington, DC.
API, 2000a. “Non-Aqueous Phase Liquid (NAPL) Mobility Limits inSoil,” G. E. DeVaull and E. J. Brost, Soil and Groundwater Re-search Bulletin No. 9, American Petroleum Institute, Washington,DC, April.
API, 2000b. “Simulation of Transport of Methyl Tert-Butyl Ether(MTBE) to Groundwater from Small Volume Releases of Gasolinein the Vadose Zone, Soil and Groundwater Research Bulletin No.10, American Petroleum Institute, Washington, DC.
ASTM, 1989. Manual on Hydrocarbon Analysis, 4th Ed., AmericanSociety for Testing and Materials, West Conshohocken, PA.

61
ASTM, 1998. Standard Provisional Guide for Risk-Based CorrectiveAction, [Designation: PS 104-98], American Society for Testingand Materials, West Conshohocken, PA.
Baker, J. M., 1970. “The Effects of Oils on Plants,” Environ.Pollution, 1:27-44.
Bruce, L. G. and G. W. Schmidt, 1994. “Hydrocarbon Fingerprintingfor Application in Forensic Geology: A Review With CaseStudies,” AAPG Bulletin , 78(11):1692-1710.
Canadian Council of Ministers, 2000a. Canada-Wide Standards forPetroleum Hydrocarbons (PHC) in Soil, June 6.
Canadian Council of Ministers, 2000b. Canada-Wide Standards forPetroleum Hydrocarbons (PHC) in Soil — Technical Supplement,June.
Chaineau, C. H., J. L. Morel, and J. Oudot, 1997. “Phytotoxicity andPlant Uptake of Fuel Oil Hydrocarbons,” J. Environ. Qual.,26:1478-1483.
Coleman, H. J., E. M., Shelton, D. T. Nichols, and C. J. Thompson,1978. “Analysis of 800 Crude Oils from United States Oilfields,”Department of Energy Report No. BETC/RI-78/14, November.
Colorado Bureau of Land Management, 1997. Colorado BLM Policyfor the On-Site Remediation of RCRA Exempt, HydrocarbonBased, Oil and Gas Exploration & Production Waste and TerrestrialSpills of Crude Oil, June.
Colorado Oil and Gas Commission, 1995. Rules 907 and 908, ColoradoOil and Gas Commission, Denver, Colorado.
Colorado Oil and Gas Commission, 1997. Revisions to the 900 SeriesRule, Colorado Oil and Gas Commission, Denver, Colorado.
Currier, H. B. and S. A. Peoples, 1954. “Phytotoxicity of Hydro-carbons,” Hilgardia, 23:155-173, November.
deOng, E. R., H. Knight, and J. C. Chamberlin, 1927. “A PreliminaryStudy of Petroleum Oil as an Insecticide for Citrus Trees,”Hilgardia, 2:353-384.
Gas Research Institute, 1993. "Sampling and Analysis of WastesGenerated from Natural Gas Industry Operations", Publication No.GRI-93/0208, Gas Research Institute, Chicago, IL, May.

62
Hamilton, W. A., H. J. Sewell, and G. Deeley, 1999. “Technical Basisfor Current Soil Management Levels of Total Petroleum Hydro-carbons,” Proceedings of the International Petroleum Environ-mental Conference, Houston, TX, November 16-18.
Harju, J. A., D. V. Nakles, G. DeVaull, and H. Hopkins, 1999."Application of Risk-Based Approaches for the Management ofE&P Sites", SPE Paper No. 52723, presented at the 1999 SPE/EPAExploration and Production Environmental Conference, Austin,Texas, February 28 - March 3.
Hawthorne, S. B. and D. J. Miller, 1998. “Hydrocarbon Characteri-zation of Gas Condensates and Impacted Soils,” Proceedings of theInternational Petroleum Environmental Conference, Albuquerque,NM, October 20-23.
Kerr, J. M., M. M. Hamed, H. R. Melton, R. I. Magaw, S. J. McMillen,and G. Naughton, 1999a. “Risk-Based Soil Screening Levels forCrude Oil: The Role of Polyaromatic Hydrocarbons", Paperpresented at the International Petroleum Environmental Conference,Houston, Texas, November 16-18.
Kerr, J. M., H. R. Melton, S. J. McMillen, R. I. Magaw, and G.Naughton, 1999b. "Polyaromatic Hydrocarbon Content in CrudeOils Around the World", SPE Paper 52724, presented at the 1999SPE/EPA Exploration and Production Environmental Conference,Austin, Texas , February 28 - March 3.
Louisiana Department of Environmental Quality, 1998. ProposedLouisiana Department of Environmental Quality Risk Evaluation/Corrective Action Program, April 20.
Magaw, R. I., S. J. McMillen, W. R. Gala, J. H. Trefry, and R. P.Trocine, 1999a. "Risk Evaluation of Metals in Crude Oils", Paperpresented at the International Petroleum Environmental Conference,Houston, Texas, November 16-18.
Magaw, R. I., S. J. McMillen, W. R. Gala, J. H. Trefry, R. P. Trocine,1999b. "A Risk Evaluation of Metals in Crude Oils", SPE PaperNo. 52725, presented at the 1999 SPE/EPA Exploration andProduction Environmental Conference, Austin, Texas, February 28- March 3.
McMillen, S. J., R. I. Magaw, J. M. Kerr, and D. A. Edwards, 1999a."A Risk-Based Screening Method for Evaluating Total PetroleumHydrocarbons at Upstream Sites," SPE Paper No. 52722, presentedat the 1999 SPE/EPA Exploration and Production EnvironmentalConference, Austin, Texas, February 28 - March 3.

63
McMillen, S. J., R. I. Magaw, J. M. Kerr, J. M., R. E. Sweeney, D. V.Nakles, and S. C. Geiger, 1999b. “A New Risk-Based Approach toEstablish Cleanup Levels for Total Petroleum Hydrocarbons,”Paper presented at the International Petroleum EnvironmentalConference, Houston, Texas, November 16-18.
Michigan Department of Environmental Quality, 1997. Supervisor’sLetter No. 1997-1, “Total Petroleum Hydrocarbon (TPH) andAesthetic Cleanup Criteria for Soil at Oil and Gas Facilities”, May.
Nakles, D. V., J. W. Lynch, D. A. Edwards, J. G. Tell, T. L. Potter, andR. P. Andes, 1996. "Risk-Based Determination of Soil Clean-upGoals for Diesel-Contaminated Sites in the Railroad Industry",Association of American Railroads, Washington, D.C., September.
New Mexico Oil Conservation Division, 1993. “Guidelines forRemediation of Leaks, Spills, and Releases”, August.
Plice, M. J., 1948. “Some Effects of Crude Petroleum on SoilFertility,” Soil Science Society Proceedings 1948, 13:413-416.
Remediation Technologies, Inc., 1998. "Development of Risk-BasedClean-up Goals for Hydrocarbon-Contaminated Soils", prepared forColumbia Gas Transmission Company and the Gas ResearchInstitute, April 2.
Rixey, W. G., S. J. McMillen, R. I. Magaw, and G. Naughton, 1999."An Evaluation of Benzene Risk at E&P Sites", Paper presented atthe International Petroleum Environmental Conference, Houston,Texas, November 16-18.
Saterbak, A., R. J. Toy, D. C. L. Wong, B. J. McMain, M. P. Williams,P. B. Dorn, L. P. Brzuzy, E. Y. Chai, and J. P. Salanitro, 1999.“Ecotoxicological and Analytical Assessment of Hydrocarbon-Contaminated Soils and Application to Ecological Risk Assess-ment,” Environmental Toxicology and Chemistry, 18:1591-1607.
Spence, L. R. and T. Walden, 1997. RISC (Risk Integrated Softwarefor Clean-Ups) User’s Manual Risk Assessment Software for Soiland Groundwater Applications, BP Oil, September.
Tissot, B. P. and D. H. Welte, 1978. Petroleum Formation and Occur-rence, Springer-Verlag, Berlin, Germany.
TNRCC, 2000. Draft Guidance for Development of PCLs for TotalPetroleum Hydrocarbon Mixtures Under TRRP (Section350.76(g)), Texas Natural Resources and Conservation Commis-sion, Austin, Texas, March 23.

64
TPHCWG, 1997a. "Selection of Representative TPH Fractions Basedon Fate and Transport Considerations", Total Petroleum Hydro-carbon Criteria Working Group Series, Volume 3, AmherstScientific Publishers, Amherst, Massachusetts, July.
TPHCWG, 1997b. "Development of Fraction Specific ReferenceDoses (RfDs) and Reference Concentrations (RfCs) for TotalPetroleum Hydrocarbons", Total Petroleum Hydrocarbon CriteriaWorking Group Series, Volume 4, Amherst Scientific Publishers,Amherst, Massachusetts.
TPHCWG, 1998a. "Analysis of Petroleum Hydrocarbons inEnvironmental Media", Total Petroleum Hydrocarbon CriteriaWorking Group Series, Volume 1, Amherst Scientific Publishers,Amherst, Massachusetts, March.
TPHCWG, 1998b. "Composition of Petroleum Mixtures", TotalPetroleum Hydrocarbon Criteria Working Group Series, Volume 2,Amherst Scientific Publishers, Amherst, Massachusetts, May.
TPHCWG, 1999. “Human Health Risk-based Evaluation of PetroleumRelease Sites: Implementing the Working Group Approach,” TotalPetroleum Hydrocarbon Criteria Working Group Series, Volume 5,Amherst Scientific Publishers, Amherst, Massachusetts, June.
Udo, E. J. and A. A. A. Fayemi, 1975. “The Effect of Oil Pollution ofSoil on Germination, Growth, and Nutrient Uptake of Corn,” J.Environ. Qual., 4:537-540.
U.S. EPA, 1987. "Report to Congress: Management of Wastes fromExploration, Development, and Production of Crude Oil, NaturalGas, and Geothermal Energy", NTIS Publication No. PB88-146212, U.S. Environmental Protection Agency, Washington, D.C.,December.
U.S. EPA, 1993. “Clarification of the Regulatory Determination forWaste from the Exploration and Production of Crude Oil, NaturalGas, and Geothermal Energy,” Federal Register, Volume 58, pgs.15284-15287, March 22.
U.S. EPA, 1995. "Crude Oil and Natural Gas Exploration andProduction Wastes: Exemption from RCRA Subtitle C Regulation",Office of Solid Waste and Emergency Response (5305), U. S.Environmental Protection Agency, Washington, D.C.
U.S. EPA, 1997. Health Effects Assessment Summary Tables(HEAST): Annual Update, U.S. Environmental Protection Agency,National Center for Environmental Assessment, Cincinnati, OH.

65
U.S. EPA, 2000. Integrated Risk Information System (IRIS), OnlineDatabase at www.epa.gov/ncea/iris.htm, U.S. EnvironmentalProtection Agency, National Center for Environmental Assessment,Cincinnati, OH.
Western States Petroleum Association, 1993. Chemical and PhysicalCharacteristics of Crude Oil, Gasoline, and Diesel Fuel: AComparative Study, Western States Petroleum Association, Glen-dale, California, September 17.


A-1
APPENDIX AE&P WASTES:
REGULATORY STATUS
In 1978, EPA proposed hazardous waste management standards thatincluded reduced requirements for several large volume wastes. Subse-quently, in 1980, Congress exempted these wastes from the ResourceConservation and Recovery Act (RCRA) Subtitle C hazardous wasteregulations pending a study and regulatory determinations by EPA. In1988, EPA issued a regulatory determination stating that the control ofE&P wastes under RCRA Subtitle C regulations was not warranted.This RCRA Subtitle C exemption, however, does not preclude thesewastes from control under other Federal regulations (e.g., the RCRASubtitle D Guidelines, the Clean Air Act, the Clean Water Act, the SafeDrinking Water Act, and the Oil Pollution Act of 1990), or under Statehazardous or non-hazardous regulations. In addition, releases of E&Pwastes may be subject to EPA enforcement under Section 7003 andState or citizen suit enforcement under RCRA Section 7002 where therelease may present an imminent hazard to human health and theenvironment.
SUMMARY OF E&P WASTES
E&P wastes are generated by the primary field operations at an oil orgas exploration and production site. Primary field operations includeexploration, development, and the primary, secondary, and tertiary pro-duction of oil or gas. More specifically, at an exploration and produc-tion site, primary field operations include activities occurring before thepoint where the oil and natural gas are transferred from an individualfield facility or a centrally located facility:
➤ In the case of oil production, to a trucking company or pipe-line for transport to a refinery or refiner
➤ In the case of natural gas production, to a pipeline for trans-portation to natural gas processing, treatment, or market
Examples of primary field operations include:
➤ Seismic surveying to detect potential oil and gas reservoirs
➤ Drilling and working over wells
➤ Lifting oil, gas, and water production from the reservoir to thesurface with flowing, pumped, or gas-lifted wells
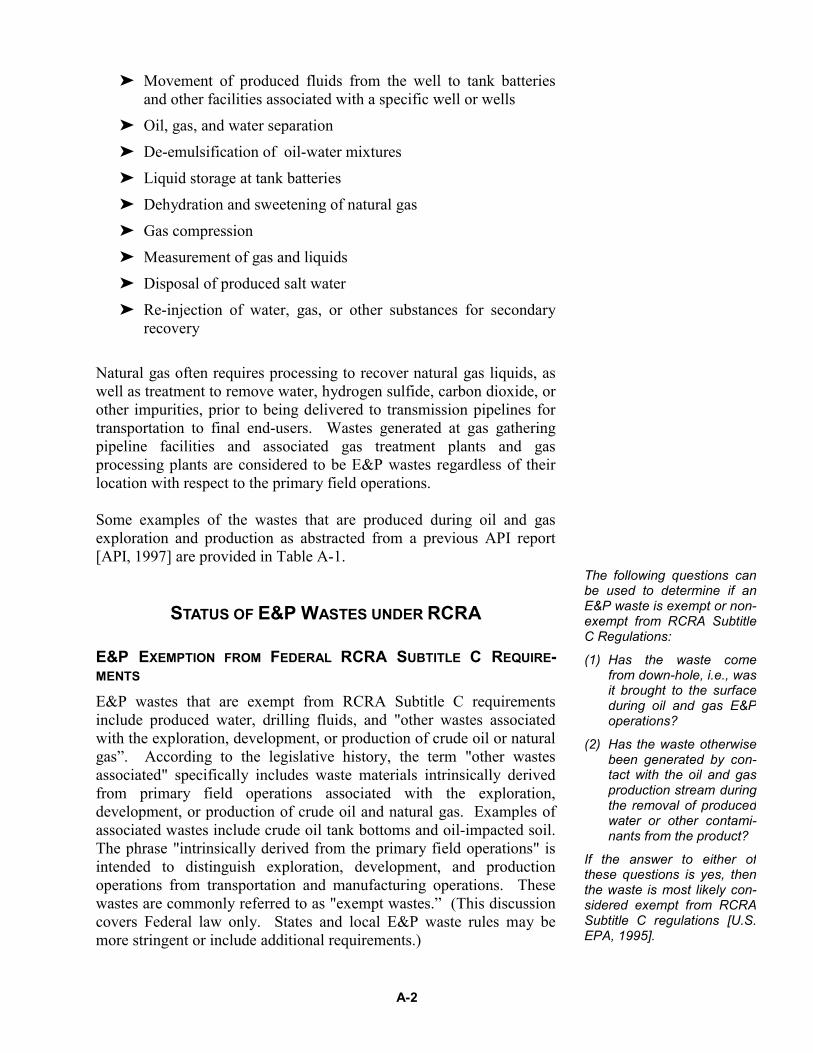
A-2
➤ Movement of produced fluids from the well to tank batteriesand other facilities associated with a specific well or wells
➤ Oil, gas, and water separation
➤ De-emulsification of oil-water mixtures
➤ Liquid storage at tank batteries
➤ Dehydration and sweetening of natural gas
➤ Gas compression
➤ Measurement of gas and liquids
➤ Disposal of produced salt water
➤ Re-injection of water, gas, or other substances for secondaryrecovery
Natural gas often requires processing to recover natural gas liquids, aswell as treatment to remove water, hydrogen sulfide, carbon dioxide, orother impurities, prior to being delivered to transmission pipelines fortransportation to final end-users. Wastes generated at gas gatheringpipeline facilities and associated gas treatment plants and gasprocessing plants are considered to be E&P wastes regardless of theirlocation with respect to the primary field operations.
Some examples of the wastes that are produced during oil and gasexploration and production as abstracted from a previous API report[API, 1997] are provided in Table A-1.
STATUS OF E&P WASTES UNDER RCRA
E&P EXEMPTION FROM FEDERAL RCRA SUBTITLE C REQUIRE-MENTS
E&P wastes that are exempt from RCRA Subtitle C requirementsinclude produced water, drilling fluids, and "other wastes associatedwith the exploration, development, or production of crude oil or naturalgas”. According to the legislative history, the term "other wastesassociated" specifically includes waste materials intrinsically derivedfrom primary field operations associated with the exploration,development, or production of crude oil and natural gas. Examples ofassociated wastes include crude oil tank bottoms and oil-impacted soil.The phrase "intrinsically derived from the primary field operations" isintended to distinguish exploration, development, and productionoperations from transportation and manufacturing operations. Thesewastes are commonly referred to as "exempt wastes.” (This discussioncovers Federal law only. States and local E&P waste rules may bemore stringent or include additional requirements.)
The following questions canbe used to determine if anE&P waste is exempt or non-exempt from RCRA SubtitleC Regulations:
(1) Has the waste comefrom down-hole, i.e., wasit brought to the surfaceduring oil and gas E&Poperations?
(2) Has the waste otherwisebeen generated by con-tact with the oil and gasproduction stream duringthe removal of producedwater or other contami-nants from the product?
If the answer to either ofthese questions is yes, thenthe waste is most likely con-sidered exempt from RCRASubtitle C regulations [U.S.EPA, 1995].

A-3
TABLE A-1. SUMMARY OF WASTES FROM OIL AND GAS EXPLORATION
Gas
Pla
nt O
pera
tions
�Bo
iler B
low
dow
n�
Cat
alys
t�
Proc
ess
Equi
pmen
tC
lean
ing
Was
tes
�C
oolin
g To
wer
Blo
wdo
wn
�W
aste
Cru
de O
il/C
onde
nsat
e�
Filte
rs�
Hyd
raul
ic F
luid
�M
etal
lic L
iqui
d M
ercu
ry�
Mer
cury
Sol
ids
�N
atur
ally
Occ
urrin
gR
adio
activ
e M
ater
ial
�Pi
ggin
g W
aste
s�
Pipe
line/
Equi
pmen
tH
ydra
tes
and
Scal
e�
Pit S
ludg
es�
Prod
uced
San
d�
Prod
uced
Wat
er�
Hyd
roge
n Su
lfide
Scru
bber
Liq
uid
�C
onta
min
ated
Soi
l�
Solv
ents
�H
ydro
carb
on S
pill
clea
n-up
Was
te�
Sulfu
r Dio
xide
Liq
uor
�Sw
eete
ning
/Deh
ydra
tion
Liqu
ids
and
Solid
s
Fiel
d Pr
oduc
tion
�Bo
iler B
low
dow
n�
Cat
alys
t�
Proc
ess
Equi
pmen
tC
lean
ing
Was
tes
�C
ompl
etio
n W
orko
ver a
ndW
ell T
reat
men
t Flu
ids
�C
oolin
g To
wer
Blo
wdo
wn
�W
aste
Cru
deO
il/C
onde
nsat
e�
Filte
rs�
Hyd
raul
ic F
luid
�M
etal
lic L
iqui
d M
ercu
ry�
Mer
cury
Sol
ids
�N
atur
ally
Occ
urrin
gR
adio
activ
e M
ater
ial
�Pi
t Slu
dges
�Pr
oduc
ed S
and
�Pr
oduc
ed W
ater
�H
2S S
crub
ber L
iqui
d�
Con
tam
inat
ed S
oil
�So
lven
ts�
Sulfu
r Dio
xide
Liq
uor
�Sw
eete
ning
/Deh
ydra
tion
Solid
s an
d Li
quid
s�
Tank
Bot
tom
s�
Pack
ing
Flui
ds�
Para
ffin
�Pi
ggin
g W
aste
s�
Pipe
line/
Equi
pmen
tH
ydra
tes
�R
ig W
ashd
own
Wat
er�
Hyd
roca
rbon
Spi
ll C
lean
-up
Was
tes
Wel
l Com
plet
ion
and
Wor
kove
r
�C
emen
t Ret
urn
�C
ompl
etio
n W
orko
ver a
ndW
ell T
reat
men
t Flu
ids
�Pi
t Slu
dges
�Pr
oduc
ed S
and
�Pr
oduc
ed W
ater
�W
aste
Cru
deO
il/C
onde
nsat
e�
Filte
rs�
Dril
l Cut
tings
�D
rillin
g Fl
uids
�H
ydra
ulic
Flu
id�
Nat
ural
ly O
ccur
ring
Rad
ioac
tive
Mat
eria
l�
Pack
ing
Flui
ds�
Para
ffin
�C
onta
min
ated
Soi
l�
Solv
ents
�H
ydro
carb
on S
pill
Cle
anup
Was
te�
Rig
Was
hdow
n W
ater
Dril
ling
�C
emen
t Ret
urns
�C
ompl
etio
n W
orko
ver a
ndW
ell T
reat
men
t Flu
ids
�D
rill C
uttin
gs�
Dril
ling
Flui
ds�
Filte
rs�
Hyd
raul
ic F
luid
�Pr
oduc
ed S
and
�Pr
oduc
ed W
ater
�C
onta
min
ated
Soi
l�
Solv
ents
�H
ydro
carb
on S
pill
Cle
anup
Was
te�
Rig
Was
hdow
n W
ater
Expl
orat
ion
�Fi
lters
�H
ydra
ulic
Flu
id�
Mud
/Cut
tings
from
Sho
tH
oles
�C
onta
min
ated
Soi
l�
Solv
ents
(Pet
role
umN
apht
ha)
�R
ig W
ashd
own
Wat
er

A-4
In 1987, the U.S. EPA provided a report to Congress that contained alist of E&P wastes that were determined to be either exempt ornonexempt wastes [U.S. EPA, 1987]. This list, which was later clari-fied [U.S. EPA, 1993], is provided in Table A-2. EPA stated that thelist of wastes in Table A-2 represent examples of exempt and non-exempt wastes and should not be considered comprehensive. They alsonoted that the list applied only to those wastes generated by E&Poperations; similar wastes generated by activities other than E&Poperations are not covered by the exemption. Of particular relevance tothe risk-based management of E&P sites is the listing of hydrocarbon-bearing soil as an exempt waste.
REGULATION OF MIXTURES OF EXEMPT AND NON-EXEMPT WASTES
The mixing of exempt and non-exempt wastes is not precluded by theregulations but should be done with care. If the non-exempt waste is alisted or characteristic hazardous waste, the resulting mixture mightbecome a non-exempt waste and require management under RCRASubtitle C regulations. In addition, mixing a characteristic hazardouswaste with a non-hazardous or exempt waste for the purpose ofrendering the hazardous waste non-hazardous or less hazardous mightbe considered a treatment process subject to applicable RCRA SubtitleC hazardous waste regulation and permitting requirements. On theother hand, mixing a non-hazardous, non-exempt waste with an exemptwaste would not be subject to Subtitle C regulations (i.e., the mixturewould be exempt). This is discussed in more detail below.
Determining the regulatory status of a mixture of an exempt and non-exempt waste requires an understanding of the nature of the wastesprior to mixing and, in some cases, might require chemical analysis ofthe mixture. The EPA has established a logic flowchart to assist inmaking these determinations. Although conducting a formal, detailedassessment of wastes handled should be completed to ensure properhandling, the statements below can be used as a general guideline:
➤ A mixture of an exempt waste with another exempt wasteremains exempt.
➤ A mixture of a non-hazardous waste (exempt or non-exempt) with an exempt waste results in a mixture that isalso exempt.
➤ If, after mixing a non-exempt characteristic hazardous wastewith an exempt waste, the resulting mixture exhibits any ofthe same hazardous characteristics as the hazardous waste(i.e., ignitability, corrosivity, reactivity, or toxicity), themixture is a non-exempt hazardous waste.
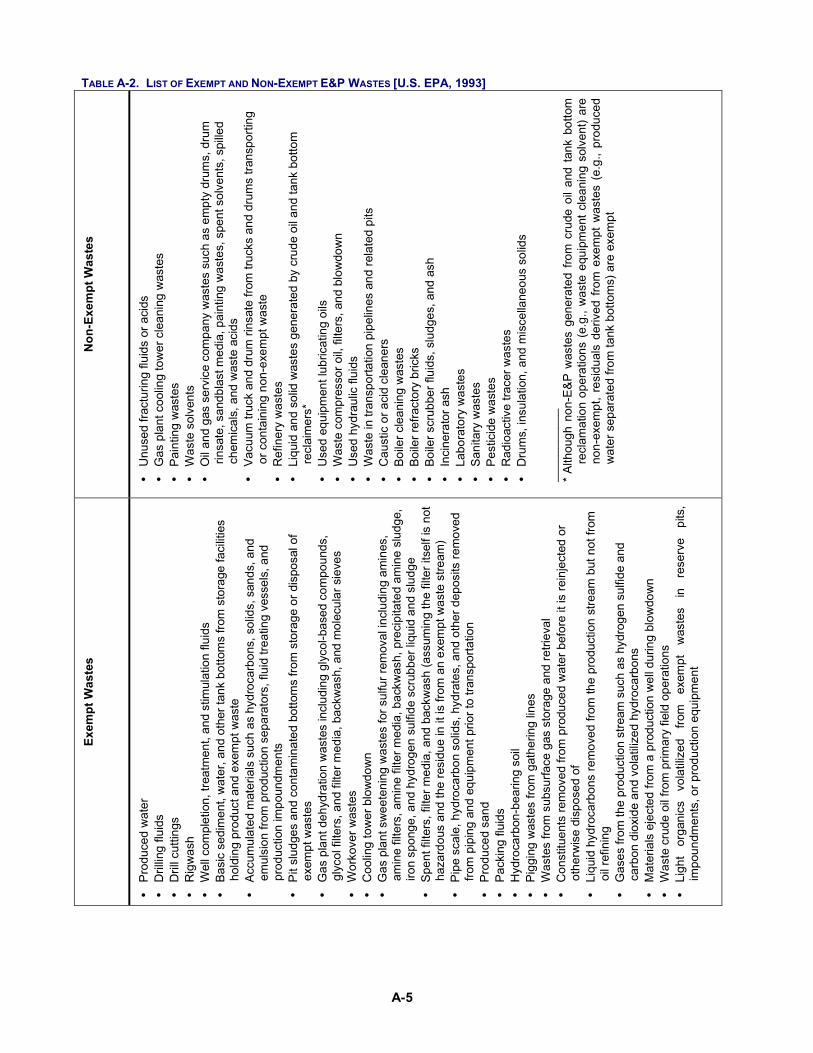
A-5
TABLE A-2. LIST OF EXEMPT AND NON-EXEMPT E&P WASTES [U.S. EPA, 1993]N
on-E
xem
pt W
aste
s
�U
nuse
d fra
ctur
ing
fluid
s or
aci
ds�
Gas
pla
nt c
oolin
g to
wer
cle
anin
g w
aste
s�
Pain
ting
was
tes
�W
aste
sol
vent
s�
Oil
and
gas
serv
ice
com
pany
was
tes
such
as
empt
y dr
ums,
dru
mrin
sate
, san
dbla
st m
edia
, pai
ntin
g w
aste
s, s
pent
sol
vent
s, s
pille
dch
emic
als,
and
was
te a
cids
�Va
cuum
truc
k an
d dr
um ri
nsat
e fro
m tr
ucks
and
dru
ms
trans
porti
ngor
con
tain
ing
non-
exem
pt w
aste
�R
efin
ery
was
tes
�Li
quid
and
sol
id w
aste
s ge
nera
ted
by c
rude
oil
and
tank
bot
tom
recl
aim
ers*
�U
sed
equi
pmen
t lub
ricat
ing
oils
�W
aste
com
pres
sor o
il, fi
lters
, and
blo
wdo
wn
�U
sed
hydr
aulic
flui
ds�
Was
te in
tran
spor
tatio
n pi
pelin
es a
nd re
late
d pi
ts�
Cau
stic
or a
cid
clea
ners
�Bo
iler c
lean
ing
was
tes
�Bo
iler r
efra
ctor
y br
icks
�Bo
iler s
crub
ber f
luid
s, s
ludg
es, a
nd a
sh�
Inci
nera
tor a
sh�
Labo
rato
ry w
aste
s�
Sani
tary
was
tes
�Pe
stic
ide
was
tes
�R
adio
activ
e tra
cer w
aste
s�
Dru
ms,
insu
latio
n, a
nd m
isce
llane
ous
solid
s
____
____
___
*Al
thou
gh n
on-E
&P w
aste
s ge
nera
ted
from
cru
de o
il an
d ta
nk b
otto
mre
clam
atio
n op
erat
ions
(e.g
., w
aste
equ
ipm
ent c
lean
ing
solv
ent)
are
non-
exem
pt,
resi
dual
s de
rived
fro
m e
xem
pt w
aste
s (e
.g.,
prod
uced
wat
er s
epar
ated
from
tank
bot
tom
s) a
re e
xem
pt
Exem
pt W
aste
s
�Pr
oduc
ed w
ater
�D
rillin
g flu
ids
�D
rill c
uttin
gs�
Rig
was
h�
Wel
l com
plet
ion,
trea
tmen
t, an
d st
imul
atio
n flu
ids
�Ba
sic
sedi
men
t, w
ater
, and
oth
er ta
nk b
otto
ms
from
sto
rage
faci
litie
sho
ldin
g pr
oduc
t and
exe
mpt
was
te�
Accu
mul
ated
mat
eria
ls s
uch
as h
ydro
carb
ons,
sol
ids,
san
ds, a
ndem
ulsi
on fr
om p
rodu
ctio
n se
para
tors
, flu
id tr
eatin
g ve
ssel
s, a
ndpr
oduc
tion
impo
undm
ents
�Pi
t slu
dges
and
con
tam
inat
ed b
otto
ms
from
sto
rage
or d
ispo
sal o
fex
empt
was
tes
�G
as p
lant
deh
ydra
tion
was
tes
incl
udin
g gl
ycol
-bas
ed c
ompo
unds
,gl
ycol
filte
rs, a
nd fi
lter m
edia
, bac
kwas
h, a
nd m
olec
ular
sie
ves
�W
orko
ver w
aste
s�
Coo
ling
tow
er b
low
dow
n�
Gas
pla
nt s
wee
teni
ng w
aste
s fo
r sul
fur r
emov
al in
clud
ing
amin
es,
amin
e fil
ters
, am
ine
filte
r med
ia, b
ackw
ash,
pre
cipi
tate
d am
ine
slud
ge,
iron
spon
ge, a
nd h
ydro
gen
sulfi
de s
crub
ber l
iqui
d an
d sl
udge
�Sp
ent f
ilter
s, fi
lter m
edia
, and
bac
kwas
h (a
ssum
ing
the
filte
r its
elf i
s no
tha
zard
ous
and
the
resi
due
in it
is fr
om a
n ex
empt
was
te s
tream
)�
Pipe
sca
le, h
ydro
carb
on s
olid
s, h
ydra
tes,
and
oth
er d
epos
its re
mov
edfro
m p
ipin
g an
d eq
uipm
ent p
rior t
o tra
nspo
rtatio
n�
Prod
uced
san
d�
Pack
ing
fluid
s�
Hyd
roca
rbon
-bea
ring
soil
�Pi
ggin
g w
aste
s fro
m g
athe
ring
lines
�W
aste
s fro
m s
ubsu
rface
gas
sto
rage
and
retri
eval
�C
onst
ituen
ts re
mov
ed fr
om p
rodu
ced
wat
er b
efor
e it
is re
inje
cted
or
othe
rwis
e di
spos
ed o
f�
Liqu
id h
ydro
carb
ons
rem
oved
from
the
prod
uctio
n st
ream
but
not
from
oil r
efin
ing
�G
ases
from
the
prod
uctio
n st
ream
suc
h as
hyd
roge
n su
lfide
and
carb
on d
ioxi
de a
nd v
olat
ilized
hyd
roca
rbon
s�
Mat
eria
ls e
ject
ed fr
om a
pro
duct
ion
wel
l dur
ing
blow
dow
n�
Was
te c
rude
oil
from
prim
ary
field
ope
ratio
ns�
Ligh
t or
gani
cs
vola
tiliz
ed
from
ex
empt
w
aste
s in
re
serv
e pi
ts,
impo
undm
ents
, or p
rodu
ctio
n eq
uipm
ent

A-6
➤ If, after mixing a non-exempt characteristic hazardous wastewith an exempt waste, the resulting mixture does not exhibitany of the same characteristics as the hazardous waste, themixture is exempt. Even if the mixture exhibits some othercharacteristics of a hazardous waste, it is still exempt.
➤ Generally, if a listed hazardous waste (i.e., a waste listed ashazardous in the Code of Federal Regulations under SubpartD of 40 CFR Part 261) is mixed with an exempt waste,regardless of the proportions, the mixture is a non-exempthazardous waste.
Due to the complexity of the waste characteristics and the environ-mental regulations, it should be understood that these guidelines onlyprovide a broad overview of possible waste management strategies.Before a final strategy is implemented for a given site, the site managershould consult the governing regulatory agency and/or anenvironmental expert in this area.
B-1
APPENDIX BEQUATIONS FOR CALCULATION OFRISK-BASED SCREENING LEVELS
FOR SOIL†
� Direct Ingestion and Dermal Contact with Surface Soil
� Inhalation of Volatiles and Particulates from Surface Soil
� Leaching to Groundwater
� Volatilization to Outdoor Air
† Many of the EPA default values used for the parameters in these equations are listedon page 31 of this document. Those that are not provided are either chemical- or site-specific.
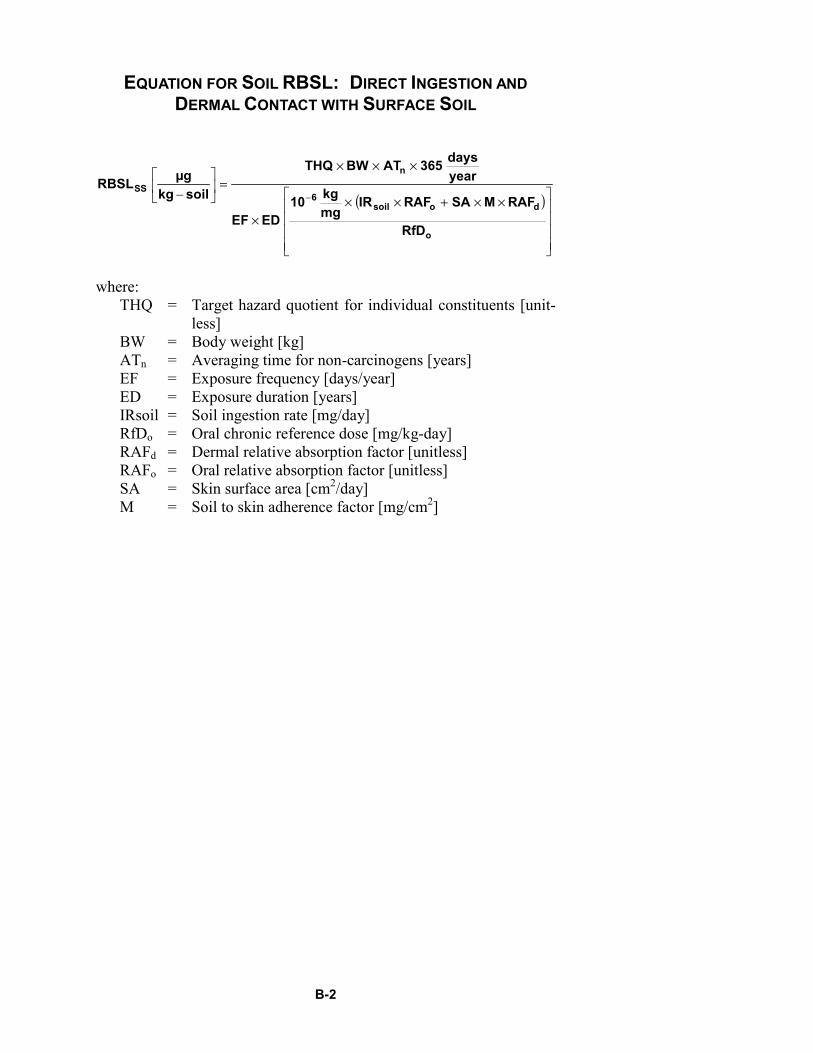
B-2
EQUATION FOR SOIL RBSL: DIRECT INGESTION ANDDERMAL CONTACT WITH SURFACE SOIL
( )
����
�
�
����
�
� ××+×××
×××=�
�
���
�
− −
o
dosoil6
n
SS
RfD
RAFMSARAFIRmgkg10
EDEF
yeardays365ATBWTHQ
soilkgµgRBSL
where:THQ = Target hazard quotient for individual constituents [unit-
less]BW = Body weight [kg]ATn = Averaging time for non-carcinogens [years]EF = Exposure frequency [days/year]ED = Exposure duration [years]IRsoil = Soil ingestion rate [mg/day]RfDo = Oral chronic reference dose [mg/kg-day]RAFd = Dermal relative absorption factor [unitless]RAFo = Oral relative absorption factor [unitless]SA = Skin surface area [cm2/day]M = Soil to skin adherence factor [mg/cm2]

B-3
EQUATION FOR SOIL RBSL: INHALATION OF VOLATILESAND PARTICULATES FROM SURFACE SOIL
( )( )
����
�
�
����
�
� +×××
×××=�
�
���
�
− −
i
pSSair6
n
SS
RfD
VFVFIRmgkg10
EDEF
yeardays365ATBWTHQ
soilkgµgRBSL
where:THQ = Target hazard quotient for individual constituents [unit-
less]BW = Body weight [kg]ATn = Averaging time for non-carcinogens [years]EF = Exposure frequency [days/year]ED = Exposure duration [years]IRair = Air inhalation rate [m3/day]RfDi = Inhalation chronic reference dose [mg/kg-day]VFp = Surficial soils to ambient air partition factor [particu-
lates]VFss = Surficial soils to ambient air partition factor [vapors]

B-4
EQUATION FOR SOIL RBSL:LEACHING TO GROUNDWATER
Groundwater RBSL
EDEFIRyeardays365ATBWRfDTHQ
OHLmgRBSL
w
no
2gw ××
××××=�
�
���
�
−
where:THQ = Target hazard quotient for individual constituents [unit-
less]RfDo = Oral chronic reference dose [mg/kg-day]BW = Body weight [kg]ATn = Averaging time for non-carcinogens [years]IRw = Daily water ingestion rate [L/day]EF = Exposure frequency [days/year]ED = Exposure duration [years]
Soil RBSL Based on Groundwater RBSL
[ ] [ ]SW
2gwS LF
OHmg/LRBSLsoilmg/kgRBSL
−=−
[ ] ���
����
�+++
=
IWδU
1Hθρkθ
ρLFgwgw
asssws
ssw
where:LFsw= leaching factor [mg/L-H2O/mg/kg-soil]Ugw = groundwater Darcy velocity [cm/y]∗gw = groundwater mixing zone thickness [cm]I = infiltration rate of water through soil [cm/y]W = width of source area parallel to groundwater flow direction [cm]∆s = soil bulk density [g/cm3]H = Henry’s Law constant [cm3/cm3]1as = volumetric air content in vadose-zone soils [cm3/cm3]1ws = volumetric water content in vadose-zone soils [cm3/cm3]Ks = soil-water sorption coefficient [(g/g-soil)/(g/cm3-H2O)]
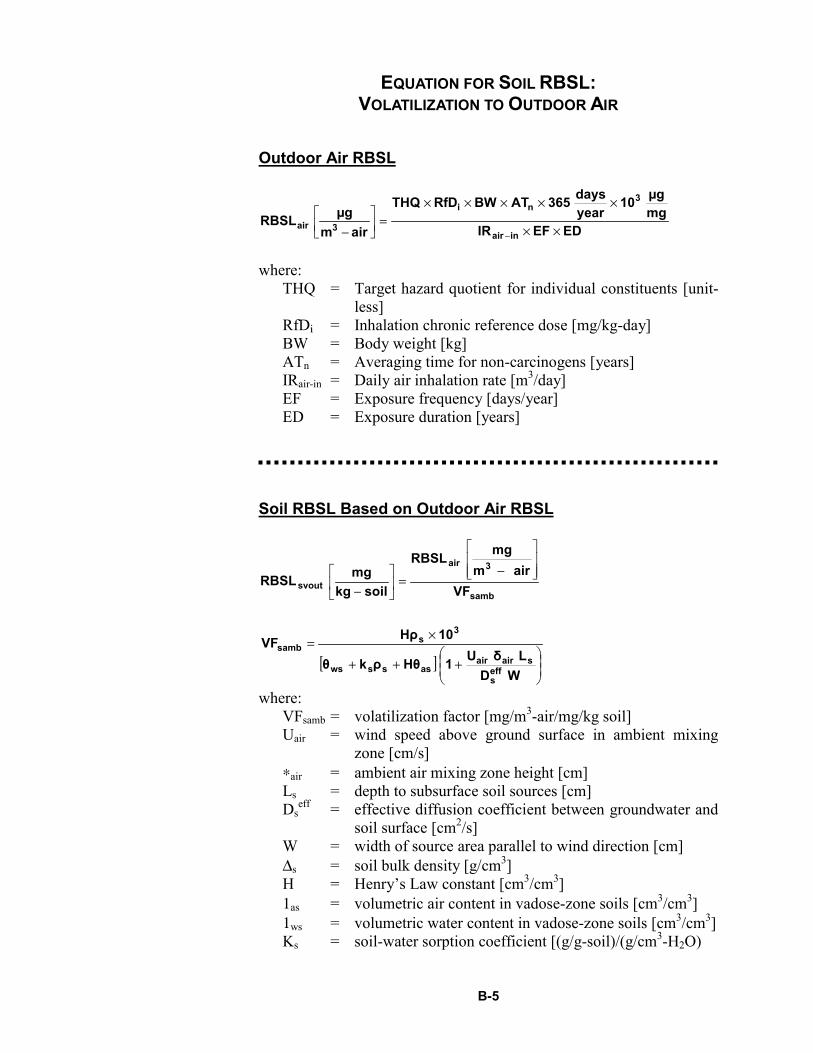
B-5
EQUATION FOR SOIL RBSL:VOLATILIZATION TO OUTDOOR AIR
Outdoor Air RBSL
EDEFIRmgµg10
yeardays365ATBWRfDTHQ
airmµgRBSL
inair
3ni
3air ××
×××××=�
�
���
�
− −
where:THQ = Target hazard quotient for individual constituents [unit-
less]RfDii = Inhalation chronic reference dose [mg/kg-day]BW = Body weight [kg]ATn = Averaging time for non-carcinogens [years]IRair-in = Daily air inhalation rate [m3/day]EF = Exposure frequency [days/year]ED = Exposure duration [years]
Soil RBSL Based on Outdoor Air RBSL
samb
3air
svout VFairm
mgRBSL
soilkgmgRBSL �
��
�
���
�
−=�
�
���
�
−
[ ]��
�
�
��
�
�+++
×=
WDLδU1Hθρkθ
10HρVF
effs
sairairasssws
3s
samb
where:VFsamb = volatilization factor [mg/m3-air/mg/kg soil]Uair = wind speed above ground surface in ambient mixing
zone [cm/s]∗air = ambient air mixing zone height [cm]Ls = depth to subsurface soil sources [cm]Ds
eff = effective diffusion coefficient between groundwater andsoil surface [cm2/s]
W = width of source area parallel to wind direction [cm]∆s = soil bulk density [g/cm3]H = Henry’s Law constant [cm3/cm3]1as = volumetric air content in vadose-zone soils [cm3/cm3]1ws = volumetric water content in vadose-zone soils [cm3/cm3]Ks = soil-water sorption coefficient [(g/g-soil)/(g/cm3-H2O)


C-1
APPENDIX CCONSIDERATION OF HYDROCARBON-
SATURATED SOIL CONDITIONSDURING CALCULATION OF RBSLS
As part of the RBSL calculations, the concentrations of the individualcarbon number fractions are compared to saturated soil concentrationsor CSAT. CSAT is the soil concentration at which the soil pore water andpore vapor become saturated with the hydrocarbon fraction. It is back-calculated using partition coefficients and the maximum water solu-bility and vapor phase concentrations for each hydrocarbon fraction asshown below [TPHCWG, 1997a]:
where:S = pure component solubility (g/cm3-H2O]ρs = soil bulk density [g/cm3]H = Henry's Law constant [cm3/cm3]Θas = volumetric air content in vadose-zone soils [cm3/cm3]Θws= volumetric water content in vadose-zone soils [cm3/cm3]Ks = soil-water sorption coefficient [(g/g-soil)/(g/cm3-H2O)]
(This equation for CSAT is identical to that used in the screening leveltransport models of the ASTM Procedure E-1739-95. The parameters,ρs, Θas, and Θws, are soil- and site-specific; Ks can be determined fromthe organic carbon partition coefficient, Koc. Methods to estimate Kocas well as S and H have been published by the TPHCWG [TPHCWG,1997a].) Since CSAT represents the worst case situation for contaminantleaching and volatilization, the smaller of the CSAT concentration andthe calculated concentration of the hydrocarbon fraction (i.e., Fi*CTOT)is used in the calculation. Concentrations greater than CSAT would notresult in an increase in the contaminant concentrations in the pore wateror pore vapor and, hence, would not increase the risk associated withthe presence of the TPH. However, these concentrations wouldincrease the calculated hazard index for the total TPH which wouldresult in the calculation of a lower soil clean-up goal for TPH withoutachieving any additional reduction in risk.
For more details on soil saturation conditions and their impact on riskmanagement decisions associated with TPH, the reader should consultTPHCWG, 1997a.
soilgg]KH[SC sswsas
sSAT −
ρ+Θ+Θρ
=


02/01

Additional copies are available through Global EngineeringDocuments at (800) 854-7179 or (303) 397-7956
Information about API Publications, Programs and Services isavailable on the World Wide Web at: http://www.api.org
Product No.
I
47090