Risk-Based Forecasting and Planning and Management ... · We thank EY (Ittner) and Wharton for...
63
We thank EY (Ittner) and Wharton for research support and Yeayeun Park and Mengxue Shi for research assistance. We also thank Aon for providing access to the survey data used in this study. The comments of Russ Lundholm, Ted Christensen, Isabel Wang, and an anonymous reviewer, and seminar participants at the Harvard Information, Markets, and Organizations Conference, London Business School, Michigan State University, UCLA Spring Accounting Conference, University of North Carolina Chapel Hill, and the Yale Summer Accounting Research Conference are greatly appreciated. Risk-Based Forecasting and Planning and Management Earnings Forecasts Christopher D. Ittner The Wharton School University of Pennsylvania Jeremy Michels The Wharton School University of Pennsylvania September 2016
Transcript of Risk-Based Forecasting and Planning and Management ... · We thank EY (Ittner) and Wharton for...
We thank EY (Ittner) and Wharton for research support and Yeayeun Park and Mengxue Shi for research assistance. We also thank Aon for providing access to the survey data used in this study. The comments of Russ Lundholm, Ted Christensen, Isabel Wang, and an anonymous reviewer, and seminar participants at the Harvard Information, Markets, and Organizations Conference, London Business School, Michigan State University, UCLA Spring Accounting Conference, University of North Carolina Chapel Hill, and the Yale Summer Accounting Research Conference are greatly appreciated.
Risk-Based Forecasting and Planning and Management Earnings Forecasts
Christopher D. Ittner The Wharton School
University of Pennsylvania
Jeremy Michels The Wharton School
University of Pennsylvania
September 2016

Risk-Based Forecasting and Planning and Management Earnings Forecasts
ABSTRACT: This study examines the association between a firm’s internal information
environment and the accuracy of its externally-disclosed management earnings forecasts.
Internally, firms use forecasts to plan for uncertain futures. The risk management literature
argues that integrating risk-related information into forecasts and plans can improve a firm’s
ability to forecast future financial outcomes. We investigate whether this internal information
manifests itself in the accuracy of external earnings guidance. Using detailed survey data and
publicly-disclosed management earnings forecast from a sample of publicly-traded U.S.
companies, we find more sophisticated risk-based forecasting and planning processes associated
with more accurate management earnings forecasts. These associations hold across a variety of
different planning horizons (ranging from annual budgeting to long-term strategic planning),
providing empirical support for the theoretical link between internal information quality and the
quality of external disclosures.
Keywords: Management earnings guidance; budgeting; planning; forecasting; risk management
1
1. Introduction
This study provides evidence on the associations between specific attributes of a firm’s
internal forecasting and planning processes and the accuracy of the firm’s externally-disclosed
earnings forecasts. Theory predicts a link between the quality of information used for managerial
decision-making and external reporting quality (Hemmer and Labro 2008). This theoretical
prediction has led a number of recent studies to use the accuracy of management earnings
guidance as a proxy for the quality of a firm’s internal information (Gallemore and Labro 2014;
Goodman et al. 2014; Heitzman and Huang 2014). However, the inability to observe a firm’s
internal information environment has limited researchers’ ability to directly examine the link
between internal information quality and external disclosure. Instead, studies have relied on
proxies such as the rectification of internal control weaknesses or the adoption of enterprise
information systems to capture firms’ internal information environments (Dorantes et al. 2013;
Feng et al. 2009). Although these studies provide initial evidence supporting the link between the
quality of internal information and external earnings guidance, they provide little insight into
how improved information quality manifests itself in more accurate earnings forecasts, or which
specific internal practices are associated with greater forecast accuracy.
We begin to address these limitations using detailed survey data on the incorporation of
risk considerations into the forecasting and planning processes of a sample of publicly-traded
U.S. firms.1 We then associate these practices with the accuracy of the firms’ subsequent
publicly-disclosed earnings forecasts. Recent studies indicate that managers believe that earnings
forecasting has become increasingly difficult due to greater uncertainty in operating
1 The survey covers the major elements of the Committee of Sponsoring Organizations of the Treadway Commission’s enterprise risk management (COSO 2004) and internal control (COSO 2013) frameworks, which the SEC is advocating as “best practice” in risk and control assessment, especially over financial reporting (Stout 2014).
2
environments, and perceive one of their biggest forecasting challenges to be effectively
integrating risk information into their forecasting and planning processes (Aberdeen 2012; AFP
2012, 2014; Deloitte 2012; KPMG 2007; PricewaterhouseCoopers 2011). This challenge has led
both academics and practitioners to call for firms to adopt more sophisticated approaches for
incorporating risk-related information into forecasts and plans (e.g., Alviniussen and
Jankensgard 2009; Deloitte 2012; Ai et al. 2013; Morlidge et al. 2013).
Proponents of this integrated “risk-based forecasting and planning” (RBFP) approach
contend that more consistent and sophisticated identification, quantification, and modeling of all
types of risks and their interdependencies, and the incorporation of this information into financial
and strategic forecasts and plans, can improve a firm’s earnings forecasting ability by allowing
the entity to better identify and measure the likelihood and impact of each risk event, to improve
the consistency of key finance and risk assumptions and forecasting inputs, and to establish more
realistic estimates and attainable goals that better align financial and strategic actions (Aberdeen
2012; Deloitte 2012; KPMG 2007).
Despite these potential forecasting advantages, the link between more sophisticated
RBFP and the accuracy of management earnings guidance is not straightforward. Some critics
question the value of RBFP. Difficulties in defining a firm’s risk appetite and tolerances,
limitations in risk-based forecasting models, and the inability to anticipate infrequent or extreme
events are all claimed to limit the effectiveness of quantitatively-oriented RBFP practices (Taleb
2007; Danielsson 2008; Power 2009). Psychological studies also suggest that RBFP can hinder
effective forecasting and planning if these practices provide managers with a false sense of
security or cause overconfidence in tenuous forecasts (Kahneman and Lovallo 1993; Durand
2003). Finally, the managerial decision-facilitating role of internal information systems may

3
have little influence on the quality of financial accounting disclosures that are focused on
valuation and control. In particular, externally-disclosed management earnings guidance may not
reflect managers’ true earnings expectations, with numerous studies identifying various factors
that can motivate managers to bias their externally-disclosed earnings forecasts (e.g., Lang and
Lundholm 2000; Newman and Sansing 1993; Noe, 1999; Rogers and Stocken 2005). Given these
differing potential outcomes, our analyses represent joint tests of the effectiveness of RBFP and
the linkage between internal and external information quality.
Using publicly-disclosed annual management earnings forecasts made by 85 firms that
completed a risk management benchmarking survey between 2011 and 2014, we examine the
relations between more sophisticated RBFP practices and management earnings forecast errors
and widths. RBFP potentially improves forecast accuracy both by improving forecasting ability
and by leading to operational changes that reduce volatility and uncertainty. To isolate the effects
of improved forecasting and planning ability, our tests include several controls for the volatility
and uncertainty in the firm’s operations. These controls allow us to examine whether RBFP
improves forecasting ability not simply by reducing the volatility of a firm’s operations, but by
improving the forecasting process itself, providing managers with better information regarding
upcoming earnings.
We find more sophisticated overall RBFP practices associated with smaller management
forecast errors in the survey completion and subsequent years. We further examine the relations
between individual RBFP practices and the magnitude of forecast errors. The forecasting and
planning process consists of two stages: (1) information acquisition and processing, and (2) the
integration of this information into forecasts and plans (Hogarth and Makridakis 1981). Our
examination of the information acquisition and processing practices prescribed by RBFP

4
proponents finds more consistent and sophisticated incorporation of quantitative information into
risk assessments is significantly associated with smaller forecast errors, especially when used in
conjunction with more sophisticated identification and use of information on risk drivers
(sources of risks) and risk interdependencies. In addition, firms that produce forecast probability
distributions using stochastic models and other methods have smaller errors than those producing
only single- or multi-point forecasts for internal purposes. With respect to RBFP outputs, we find
that the length of the planning horizon makes little difference, with greater incorporation of risk
considerations into short-term annual budgets, medium-term capital investment and project
decisions, and long-term strategic plans all associated with smaller forecast errors. Additional
analyses provide evidence that these associations are not driven by the self-selection of firms into
our sample or to correlated omitted variables.
We also find more sophisticated RBFP practices significantly associated with smaller
earnings forecast widths across most of our sample. The exception is firms using forecast
probability distributions and/or stochastic models in forecasting. These results suggests that firms
that attempt to model a large range of potential risk-related earnings outcomes are more likely to
take into account the probability that some of the more extreme outcomes may materialize when
making longer-term plans. Finally, we observe significant negative relations between the
sophistication of RBFP practices and sales forecast errors in the subsample of firms that publicly
disclose sales forecasts, but relatively little association between RBFP practices and publicly-
disclosed capital expenditure forecast errors.
Our study makes several contributions to the accounting literature. First, our access to
information on firms’ internal forecasting and planning practices, as well as our ability to link
these data to publicly-disclosed management earnings forecasts, allows us to provide some of the

5
first direct evidence on the relation between specific internal information system attributes and
external disclosures. In doing so, we support Hemmer and Labro’s (2008) theoretical prediction
that internal information quality is related to the quality of externally reported information, and
help justify prior research’s assumption that the accuracy of management earnings guidance is a
reflection of internal information quality (Gallemore and Labro 2014; Goodman et al. 2014;
Heitzman and Huang 2014).
Second, we extend the management earnings forecast literature. Hirst, Koonce, and
Venkataraman’s (2008) survey of this literature finds that research on the antecedent factors
influencing the accuracy or other characteristics of management earnings forecasts is lacking.
Our examination of one such factor – the quality of a firm’s internal information environment, as
measured by how effectively the firm incorporates risk-related information into its forecasting
and planning processes – begins to open this black box.
Third, our study informs the forecasting, budgeting, and planning literatures. A 2015
AICPA survey of its Certified Global Management Accountant members found business
planning, budgeting, and forecasting to be the topic that respondents said they are most in need
of additional guidance and tools, followed by strategic planning. These topics rank ahead of
traditional accounting research topics such as financial accounting and reporting, financial
statement analysis, and cost management. Our study provides evidence on the value of one set of
tools and practices available for improving forecasting and planning.
Finally, our study provides evidence on a specific mechanism linking integrated,
enterprise-wide risk management practices to firm performance and value. While a growing
literature examines the performance effects of enterprise risk management (ERM) (e.g., Gordon
et al. 2009; McShane et al. 2011; Hoyt and Liebenberg 2011; Baxter et al. 2013), the majority of

6
these studies examine the associations between aggregate measures of overall enterprise risk
management adoption or use and aggregate measures of firm risk or value, shedding little light
on the effects of different risk-focused planning and control practices on enterprise decision-
making. Our examination of individual risk-based forecasting and planning practices, together
with our investigation of a specific managerial outcome, begins to unravel the observed
associations between enterprise risk management adoption and firm value.
2. RBFP and Management Earnings Forecasts
Management earnings forecasts are a key disclosure mechanism for voluntarily
communicating a firm’s financial prospects to market participants (Hirst et al. 2008). Theory
predicts a link between the quality of information used for managerial decision-making and
external financial disclosures (Hemmer and Labro 2008), suggesting that the quality of
information that firms use to forecast earnings and develop financial plans should be associated
with the accuracy of their externally-disclosed earnings forecasts. We test this prediction by
examining the relation between the sophistication with which a firm incorporates risk
considerations into its forecasting and planning processes and the accuracy of its external
earnings guidance.
The ISO 31000 risk management standard defines risk as an uncertainty that, if it occurs,
will have an effect on objectives (International Standards Organization 2009). This uncertainty
can take a variety of forms, including financial, operational, strategic, compliance, and other
risks such as natural disasters. Most firms make some attempt to consider risk in forecasting and
planning (AFP 2014). However, these efforts are often undertaken on an informal, qualitative

7
basis, with little interaction between financial planning, strategic planning, and risk management
(Deloitte 2013).2
The goal of RBFP is to effectively incorporate risk considerations into forecasting and
planning activities. RBFP practices combine holistic approaches to managing risks such as
enterprise risk management (e.g., COSO 2004; Nocco and Stulz 2006) with advances in risk
analysis and modeling (e.g., Mun 2010). Key elements of RBFP include employing more
sophisticated quantitative methods to evaluate and monitor key risks, risk drivers, and risk
interdependencies; assessing the extent to which these risks fit within the firm’s risk appetite,
risk tolerances, and risk capacity3; and formally incorporating these analyses into the firm’s
financial and strategic planning processes.
RBFP proponents claim that these practices can improve forecasting ability through two
mechanisms. First, greater integration of risk considerations into forecasting and planning
practices can provide information that allows the firm to take actions that reduce the volatility
and uncertainty of its operations, which prior studies have found to be negatively associated with
management earnings guidance accuracy (Ajinkya et al. 2005; Dichev and Tang 2009; Feng et
al. 2009; Yang 2012). Rather than treating the risks of each significant decision or business unit
independently, RBFP methods can increase understanding of the firm’s overall risks and the
interdependencies of these risks across the firm’s portfolio of activities. This knowledge allows
2 AFP (2014) find that only 23 percent of financial planning and analysis groups employ risk analysis on a regular basis, and just 21 percent of these groups have a high degree of collaboration with risk management. A survey by Marsh and RIMS (2014) adds that only 20 percent of firms believe that risk management has a significant impact on the setting of business strategy.
3 Risk appetite represents the amount of risk exposure the firm is willing to accept to achieve its objectives, risk tolerance is the acceptable variation in outcomes related to each risk, and risk capacity is the maximum level of risk the firm can assume given its financial and nonfinancial resources.
8
the firm to consider how each decision or unit contributes to the firm’s overall risk profile and to
understand where interdependent risks can multiply or cancel each other out. By using this
knowledge to coordinate risk-taking and risk responses across the enterprise, firms can minimize
unwanted volatility through more informed and integrated risk avoidance, mitigation, sharing,
and contingency planning efforts. Consistent with this prediction, studies by Ellul and Yerramilli
(2013), Ittner and Keusch (2016), and others find negative associations between the
sophistication of enterprise risk management practices and stock price volatility.
A second potential mechanism linking RBFP and earnings forecast accuracy, and the
focus of our study, relates to improvements in the forecasting process itself. The RBFP literature
contends that these practices improve both the information gathering and processing stage of the
forecasting process and the achievability of the resulting plans. The data gathering stage of the
RBFP process begins with the identification of risks, risk drivers, and risk interdependencies,
followed by quantitative risk assessments (Mun 2010; Curtis and Carey 2012). The risk
assessment brings quantitative inputs and methods to the evaluation of risks and risk
interdependencies relative to the firm’s risk appetite and tolerances.
Although many firms produce single or multi-point forecasts based on these risk
assessments, proponents of RPFP call for the use of stochastic or probabilistic models and
distributions that better capture the uncertainty in outcomes when measuring the likelihood and
impact of each potential risk event on financial performance. Key measures such as cash-flow-at-
risk and earnings-at-risk can then be generated by “shocking” financial forecasts against major
risk drivers to create a probability distribution for each period (Deloitte 2013).
Consistent application of comprehensive, quantitatively-oriented risk assessments and
probabilistic models is said to improve understanding of current and emerging risks by providing

9
best and worst case performance scenarios and identifying risks that fall outside of established
tolerances. Enhanced quality and consistency of key finance and risk assumptions and
forecasting inputs, greater alignment of risk-return profiles across the firm, improved
quantitative understanding and analysis of the risk drivers that contribute most to earnings
exposure, and enhanced analytical capabilities can improve a firm’s ability to assess and
incorporate uncertainty in forecasts and plans (Aberdeen 2012; Deloitte 2012; KPMG 2007).4
Behavioral research adds that more sophisticated RBFP data processing practices can also reduce
many common forecasting biases. For example, experiments find that the use of scenario
analysis, a common RBFP tool, reduces overconfidence, confirmation, and framing biases, and
leads to higher quality decisions than more general strategic planning techniques such as
strengths, weaknesses, opportunities, and threats (SWOT) analysis (Schoemaker 1993; Bradfield
2008; Meissner and Wulf 2013).
These potential forecasting benefits lead us to predict that, controlling for the level of
firm volatility and uncertainty, more consistent and sophisticated RBFP risk driver analyses and
quantitative assessment practices and the development of stochastic or probabilistic forecasting
models are positively associated with earnings forecast accuracy.
Even if more sophisticated risk assessments and quantitative analyses and modeling
allow firms to better identify what risks to monitor, to establish more realistic estimates and
attainable goals, and to facilitate the development of contingency plans for meeting the firm’s
earnings targets under a range of scenarios (Aberdeen 2012; Deloitte 2012; KPMG 2007), the
4 These claims are consistent with studies finding that forecasts that are based at least partially on quantitative methods are more accurate than those based purely on qualitative judgment (Lawrence et al. 2006). Similarly, Cassar and Gerakos (2013) find that the accuracy of hedge fund managers’ performance forecasts during the financial crisis were positively associated with their use of value-at-risk modeling and stress testing.

10
link between RBFP and annual earnings forecast accuracy may still depend upon the planning
horizon covered by the forecast (Toneguzzo 2010). Financial and strategic plans can range from
short-term annual budgets that closely match the time frame of the external earnings forecast, to
mid-term capital expenditure and project plans, to long-term strategic analyses. Incorporating the
results from quantitative risk assessements into the budgeting process can improve earnings
forecasting by supporting resource allocations that are consistent with the desired risk-return
profile and within the firm’s financial capacity to bear the desired risks (Cassar and Gibson
2008; Alviniussen and Jankensgard 2009). Integrating risk assessments into capital investment
decisions can ensure that interactions between risks that are shared across multiple business
units, projects, and time periods are considered, and promotes improved coordination of capital
requirements, cash flow potentials, and risk exposures (Froot and Stein 1998; Ai et al. 2012).
Considering risk assessment results in the strategic planning process further supports forecasting
ability by allowing firms to evaluate whether one strategic initiative introduces risks that conflict
with the goals of another, and to assess whether the combined risks of the various strategic
choices fall within the firm’s risk appetite and tolerances (Beasley and Frigo, 2010).
Differences in the time horizons of these various plans may influence their earnings
forecasting benefits (Toneguzzo 2010). In the short-term, many risks are operational or financial
in nature, and firms are more likely to have the required knowledge to effectively assess and
model the expected impact of these risks on earnings. As the planning horizon gets longer,
strategic risks become more important and unanticipated or unknowable risks become more
likely, which may make accurate earnings forecasts more difficult. Conversely, greater
incorporation of risk consdierations into longer-term strategic planning may allow firms to better
understand and integrate the risks across their various stratgeic choices, thereby allowing them to

11
minimize or compensate for unexpected earnings shortfalls to a greater extent than might be
possible if risks are only considered in shorter-term and narrower budgeting and capital
expenditure decisions. Curtis et al. (2014), for example, find that strategic decisions may be more
predictive of future finanical outcomes than shorter-term capital expenditure decisions.
While the preceding arguments link more sophisticated RBFP practices to improved
forecasting performance, this link has been questioned by critics of formal, quantitative risk
management processes. Taleb (2007) and Makridakas and Taleb (2009), for example, are highly
critical of quantitative risk models and forecasts. They argue that accurate risk forecasting is not
possible for many reasons, including the use of statistical models that underestimate uncertainty
because they assume that events are independent, forecast errors are tractable, and variances in
forecasting errors are finite, known, or constant; the presence of new, infrequent, or unforeseen
events that make prediction based on historical data of limited value; the lack of information on
the underlying distributions of these new or infrequent events; and the tendency to overlook
important non-quantifiable or hard to obtain information on many types of risks. Behavioral
studies have also found that more sophisticated forecasting and planning practices can lead to
significant cognitive biases. More sophisticated quantitative risk analyses may give the
perception of false accuracy. Similarly, forecasts that anchor predictions on plans and scenarios
can create an “illusion of control” over uncertain future events, leading to positive forecast biases
and larger forecast errors (Kahneman and Lovallo 1993, Durand 2003). Experiments indicate
that the identification of more potential risks during the planning process can also lead to greater
over-optimism in forecasts (Jorgensen 2010). Power (2009) highlights three additional flaws in
the adoption of formal, integrated risk management processes such as RBFP. First, the very
notion of a singular risk appetite that underlies the top-down RBFP approach is problematic

12
because organizations are comprised of a variety of risk appetites that change over time. Second,
many integrated risk management processes are predicated on notions of internal control,
compliance, and auditability, which conflict with need to confront the ambiguity and flexibility
required to effectively manage risks and their outcomes. Third, the expansive reach of new,
integrated risk management processes requires a high level of identification and understanding of
interconnectedness and risk interdependencies that has proved elusive.
It may also be the case that internal management accounting practices such as RBFP
practices may be useful internal decision-making tools, but the managerial decision-facilitating
role of internal information systems may play little part in the choice of financial accounting
disclosures that focus on valuation and control. For example, studies indicate that managers may
have incentives to bias their external earnings forecasts in order to deter potential industry
entrants (Newman and Sansing 1993), facilitate security issuance (Lang and Lundholm 2000),
improve trading profitability (Noe 1999), or reduce expected legal costs (Rogers and Stocken
2005). As a result, the external disclosure may not reflect management’s actual earnings
expectations. Thus, failing to find an association between RBFP and external forecast accuracy
in our tests could be attributed either to the ineffectiveness of these practices or to the lack of a
link between a firm’s internal information quality and external forecasts.
3. Sample and Data
3.1 Sample Selection
Our sample is drawn from respondents to Aon’s Risk Maturity Index (RMI) survey.5
Aon, a leading provider of insurance brokerage, risk management, and human resource services,
5 Neither author has received any compensation or funding from Aon.

13
designed the RMI as a self-assessment tool for organizations to evaluate and benchmark their
enterprise risk management capabilities. The survey was developed in collaboration with
academics and industry risk experts, and covers the major elements of the Committee of
Sponsoring Organizations of the Treadway Commission’s enterprise risk management
framework (COSO 2004).6 The survey instrument was extensively pre-tested with a group of risk
management executives to ensure that the questions and response anchors were understandable
and the questions could be accurately answered.
The RMI survey is aimed at high-level risk management and C-suite executives who are
actively involved in their firms’ risk management activities. Participation is solicited through
industry and professional conferences and contacts with Aon clients.7 To ensure data integrity,
potential participants must contact Aon to confirm that they have the requisite knowledge of the
firm’s risk management practices to accurately complete the survey. If the participant is
qualified, they receive an invitation e-mail containing a unique password that allows access to
the on-line survey and serves as a firm identifier. The survey does not need to be completed in a
single session, allowing participants to gather additional information when needed to answer a
question. All participants are informed that their responses will be used for Aon and academic
research purposes.
The RMI survey was launched in 2011. Our analyses focus on 85 publicly-traded U.S.
respondents that completed the survey between 2011 and 2014 and have the required IBES,
6 The Committee of Sponsoring Organizations of the Treadway Commission (COSO) is an initiative supported by the Institute of Management Accountants, the American Accounting Association, the American Institute of Certified Public Accountants, the Institute of Internal Auditors, and Financial Executives International. COSO’s enterprise risk management model is a widely-adopted framework that defines the essential components of an ERM process. 7 Due to the ad hoc nature of the solicitation process, we cannot determine a response rate.

14
Compustat, CRSP, and Thomson-Reuters Institutional Holdings data for our sample period.
Firms enter the sample in the fiscal year they complete the survey. Management earnings
forecasts are then examined from that year through 2014. Each firm completes the survey only
once, so our analyses assume that the sophistication of a firm’s RBFP practices relative to those
of other firms in the sample remains fairly persistent in the years following the survey’s
completion.
Table 1 describes the sample’s industry composition. Compared to the population of
firms on Compustat, our sample has substantially greater proportions of manufacturing, utilities,
and wholesale/retail firms, and relatively fewer business equipment and financial firms.
Panel A of Table 2 provides the survey respondents’ job titles: 71.77 percent are risk
management executives (Risk Manager/Director of ERM or Chief Risk Officer), 14.12 percent
are finance executives (Chief Financial Officer or Treasurer/Vice President of Finance), 3.53
percent are Internal Audit heads, and 2.35 percent are General Counsels/Corporate Secretaries,
with the remaining 8.24 percent holding a variety of other positions. Two-thirds of the
respondents are Aon clients, with approximately five percent receiving ERM consulting advice
from Aon. Most of these clients use Aon for insurance brokerage or human resource
management services. For confidentiality reasons, Aon did not provide us with information on
which respondents are clients.
3.2 Variable Definitions
Aon provided the RMI survey respondents’ identities to us on a confidential basis. This
allows us to combine survey responses and publicly-available data in our tests. In the following
sections, we first describe how we construct our risk-based forecasting and planning variables
15
from the survey responses. We then outline our management forecast accuracy and related
control variables.
3.2.1 Risk-Based Forecasting and Planning Variables
We use 25 questions from the survey to measure six individual components of risk-based
forecasting and planning. The first three components capture the extent to which firms identify
and assess risks and the extent to which quantitative methods are used to carry out these
activities. The remaining three components relate to how firms use risk information in budgeting,
capital expenditure and project decisions, and strategy development. Appendix A provides the
questions used to construct the RBFP variables, together with their response frequencies.
We base the variable Risk Drivers on five questions assessing the consistency with which
the firm identifies risk drivers and risk interdependencies, and the extent to which risk
management activities are linked to specific risk drivers. The majority of firms (58 percent)
consistently identify and document risk drivers for key risks. However, firms are less likely to
consistently identify common drivers between key risks (38 percent), map specific risk drivers to
risk management activities (35 percent), or analyze risk drivers to identify common risks (35
percent). Even fewer firms (13 percent) formally leverage common risk driver information to
identify correlations and require this information to be considered in risk assessment processes.
While Risk Drivers focuses on the identification of risks and their interdependencies,
Quant. Assess. focuses on how firms measure risks. We base Quant. Assess. on seven questions
evaluating the extent to which firms use quantitative methods in their assessment of risk
thresholds, risk exposures, and risk management effectiveness. Qualitative assessments based on
managerial perceptions dominate risk assessments and evaluations. For example, 73 percent of
16
the respondents have developed their risk assessment criteria to align with management’s risk
tolerance perceptions rather than with quantified risk appetite and risk tolerance statements, and
7 percent have not developed any risk assessment criteria at all. Similarly, the criteria for
evaluating the effectiveness of the management of key risks is primarily qualitative (e.g.,
“adequate”, “weak”) in 58 percent of the firms, with no evaluation criteria in 19 percent of firms.
Only 29 percent of respondents have consistently established quantitative thresholds and
tolerances for key risks. Some firms formally incorporate ranges or distributions into their
internal forecast using historical data or other quantitative methods (51 percent), but many only
do so informally, relying on management judgment (39 percent).
Distribs. is an indicator variable that equals one in the 29 percent of firms that use
probabilistic distributions and/or stochastic modeling techniques in developing forecasts, and
zero in the remaining firms. Whereas Quant. Assess. focuses on whether firms measure risks
using quantitative and/or qualitative methods, Distribs. captures the form of the resulting
forecast. In our sample, only 40 percent of firms that stated that they formally incorporate
historical data or other quantitative methods when developing internal forecasts also stated that
they use forecast distributions and/or stochastic forecasting models, with the rest using these
quantitative methods to develop single- or multi-point forecasts. Moreover, the single Distribs.
question does not load on the same factor as the seven Quant. Assess. questions in our sample,
indicating that Quant. Assess. and Distribs. represent both conceptually and statistically distinct
constructs.
The next three variables measure the incorporation of risk considerations into plans
spanning different time horizons. The variable Budgeting encompasses three questions assessing
how firms incorporate risk into budgeting decisions. Responses to these questions indicate that
17
many firms do not consistently consider risk assessments or risk differences when budgeting.
More than a third of the respondents rarely or never explicitly reference risk assessments or
analysis plans in their budgeting processes (40 percent), or evaluate risk management
expenditures for effectiveness (such as cost savings vs. exposure reduction) when budgeting and
allocating resources (38 percent). Only 31 percent of the firms explicitly set different risk-based
return expectations for different business units and incorporate the different expectations in
budget and resource allocation decisions.
Capital Invest. is based on responses to five questions on the use of risk-related practices
in project and capital investment decisions. The majority of firms make some attempt to identify
risks for significant project or investment decisions, either as part of a general SWOT (strengths,
weaknesses, opportunities, and threats) analysis (44 percent) or through a dedicated risk
identification and assessment methodology separate from SWOT (47 percent). When identifying
risks, firms typically focus on both existing and emerging risks (58 percent of respondents).
Firms compare these identified risks to quantified risk appetites and tolerances less frequently,
with only 29 percent doing so consistently. Just 33 percent of firms consistently and formally
compare a new investment against the organization’s overall risk profile. Despite textbook
prescriptions for managers to risk-adjust discount rates when making capital investment
decisions, only 34 percent of respondents formally use quantitative analyses of project risk to
adjust hurdle rates for significant capital investment decisions. The remaining firms do so never
or rarely (22 percent), or informally based on management judgment or previous experience (44
percent).
We assess the integration of risk considerations into the strategic planning process using
the variable Strategy, which is based on four questions related to how the firm incorporates risk

18
appetite and risk assessments into the development and communication of strategic plans.
Although 69 percent of the firms highlight how their risk management strategy aligns with their
overall strategy when communicating strategic direction, this is frequently based on informal
references to the concepts of risk appetite and tolerances (53 percent) rather than formal
references to defined risk appetite and tolerances (16 percent). Only 20 percent formally apply
risk appetite and/or tolerance concepts to strategy development, and just 32 percent formally
incorporate key risk information from the risk management process into the strategic planning
process. Over a quarter of the respondents (26 percent) do not conduct risk identification during
the strategic planning process, and when they do only 38 percent use the risk identification
exercise to develop an emerging risk profile.
The responses to each question underlying our RBFP variables are provided on fully-
anchored three point scales, with larger scores reflecting more consistent or sophisticated
application of the risk-based forecasting and planning practices prescribed in the enterprise risk
management literature. We assess the uni-dimensionality of our multi-item Risk Drivers, Quant.
Assess., Budgeting, Capital Invest., and Strategy constructs using principal components analysis.
All of the questions associated with a given RBFP variable load on a single factor, with all factor
loadings exceed 0.42. The composite reliability of the multi-item constructs, as measured using
Cronbach’s alpha, ranges from 0.79 for Budgeting to 0.88 for Risk Drivers, supporting the
statistical reliability of our RBFP constructs. Given these results, we compute values for the five
multi-item RBFP constructs based on the average standardized values for the individual
questions included in each construct.
The individual RBFP variables represent components of an overall RBFP process.
Consequently, it may be the case that the adoption of a more sophisticated overall RBFP process
19
has a greater effect on forecast accuracy than the adoption of individual RBFP practices. We
therefore generate the variable Overall RBFP as the average of the standardized scores for the
six individual RBFP variables, providing a broad measure of the entire risk-based forecasting
and planning process.
Panel B of Table 2 provides summary statistics for Overall RBFP, as well as its six
subcomponents. Although we calculate the construct scores at the firm level, panel B provides
summary statistics at the firm-year level, which is the level of analysis used in our tests. Panel C
of Table 2 reports correlations between Overall RBFP and the six individual constructs.
Correlations among the individual constructs range from 0.16 to 0.70, indicating that greater
sophistication in the use of one set of RBFP practices does not necessarily imply equal
sophistication in another. Distribs. has the lowest correlations with Overall RBFP (r = 0.52) and
the other individual RBFP practices (0.16 to 0.34), consistent with the use of probabilistic
distributions and/or stochastic models being a very distinct risk management and forecasting
practice.
3.2.2 Management Earnings Guidance
The primary outcome of interest in our tests is management’s external earnings forecast
accuracy. We evaluate forecast accuracy using publicly-released management earnings guidance,
as provided by IBES, which gathers the forecasts from public disclosures such as press releases
and conference calls. We use management’s annual earnings forecasts rather than quarterly
forecasts because the longer forecast horizon is more likely to match the horizons over which the
firm uses risk information for annual budgeting, project and capital investment decisions, and
strategic planning. We gather annual forecasts issued within one year of the firm’s fiscal year
end. We take the earliest forecast made in this window, again to achieve a longer forecast

20
horizon over which the benefits of forward-looking information from the risk forecasting and
planning process are more likely to manifest themselves.
We construct two variable to evaluate attributes of management forecasts. Mgmt Error
equals the absolute value of actual earnings per share less management’s forecast, as a
percentage of share price three days prior to the forecast. If the manager forecasts a range of
earnings values, we use the midpoint of this range. Forecast width (Width) equals the upper
bound of the forecast range minus the lower bound, as a percentage of price. Point forecasts are
assigned a Width of zero.
3.2.3 Control Variables
We employ a variety of variables to control for factors that prior studies have found to be
associated with a firm’s forecast accuracy or risk management practices. Several variables
capture firm-level attributes. Size is defined as the natural logarithm of the market value of equity
at the beginning of the year. Prior research finds that larger firms have higher quality disclosure
practices (Lang and Lundholm 1993), make more accurate management forecasts (Yang 2012),
and have more sophisticated enterprise risk management processes (Gatzert and Martin 2015).
MTB is beginning of year market value of equity divided by beginning of year book value of
equity, and is a commonly used proxy for growth opportunities. R&D is research and
development costs divided by beginning of year assets. Firms with more growth opportunities
and higher levels of research and development are likely to face greater uncertainty, making
forecasting more difficult (Cheng et al. 2013). Ownership is the percentage of the firm held by
institutional owners. Firms with high institutional ownership have been found to forecast more
accurately (Ajinkya et al. 2005) and to have more sophisticated ERM processes. Segments is the
natural logarithm of the total number of operating segments in the firm. Although firms with
21
more segments may be able to reduce risk by being better diversified, more complex operations
may complicate forecasting and increase the benefits from risk management activities. Age is the
number of years the firm has been listed in CRSP. Older firms are expected to be more stable
and display less variability.
Two variables control for industry attributes. HHI is the Herfindahl-Hirschman Index,
where industries are defined by four-digit SIC code. Firms in more concentrated industries may
face more opaque information environments (Ali et al. 2014), making forecasting more difficult.
Lit. Risk is an indicator variable for firms in SIC industries 2833-3836, 3570-3577, 3600-3674,
5200-5961, or 7370-7374 (Cheng et al. 2013). Firms subject to greater litigation risk may issue
more pessimistic forecasts (Rogers and Stocken 2005).
Finally, Following is the natural logarithm of the number of analysts providing an
earnings estimate for the firm in the current year, which has been found to be associated with
management earnings guidance (Ajinkya et al. 2005). Horizon, in turn, is the natural logarithm
of the number of days between the management guidance date and the earnings announcement
date. The further from the earnings announcement date, the harder it should be to predict
earnings.
To isolate RBFP’s effect on management’s forecasting ability through improvements in
internal information quality, we include four variables to control for the possibility that more
sophisticated RBFP practices enable more accurate forecasting not because they provide
management with better forecasting information, but because they lead to actions that lessen the
variability and uncertainty in a firm’s operations. Return Vol. is the standard deviation of daily
stock returns over the previous year. Volatility reflects uncertainty about the firm’s operations
that likely makes forecasting more difficult. Analyst Uncert. is the standard deviation of analyst
22
forecasts made for the year, using the last forecast by each analyst prior to the management
forecast. This variable is meant to capture uncertainty among investors regarding upcoming
earnings (Barron et al. 1998). Analyst Error is the absolute value of actual earnings per share less
the median analyst forecast at the time of the management forecast, scaled by price. Analyst
Error captures the ability of parties outside the firm to predict upcoming earnings. This variable
is an important control as it measures the difficulty of forecasting earnings based on all publicly-
available information. To the extent that any real actions taken in response to internal RBFP
information are observable to the market, the remaining variation in Mgmt Error (after
controlling for Analyst Error) should be related to management’s ability to better forecast
earnings as a result of their internal forward-looking information. Finally, using survey
responses, we control for whether or not the firm changed its strategic direction in the prior two
years as a result of new information or understanding concerning a major risk. Any improvement
in forecast accuracy relating to a change in strategic direction is likely to reflect changes in
operations due to improved risk-related information rather than being purely due to changes in
forecasting ability. The variable Strategy Change equals one if the respondent answered that they
changed strategic direction, and zero otherwise.
3.3 Descriptive Statistics
Descriptive statistics are presented in Table 3. The first three columns provide descriptive
statistics for the firms in our sample. We include all firm-years after the firm completes the
survey and for which an earnings forecast was made, for a total of 211 observations. The next
three columns give descriptive statistics for the set of Compustat firms with data available to
compute all of the measures used in our analyses. We include these comparative statistics to
assess the representativeness of our sample. A t-test of differences in means between our sample

23
and the Compustat sample reveals many significant differences. In particular, Mgmt Error is
lower in our sample than in the Compustat sample. This raises the concern that the firms in our
sample take the survey because they enjoy firm-specific benefits from risk management
practices.
Alternatively, the difference in Mgmt Error may be due to differences in observable
characteristics that have been found to be associated with earnings forecast accuracy. For
example, our sample is larger, older, has higher analyst following, lower return volatility, and
lower analyst’s uncertainty and forecast error, all of which are likely to be associated with
management forecast accuracy. We therefore create a propensity matched sample from
Compustat using the variables Size, MTB, R&D, HHI, Ownership, Lit. Risk, Segments, Age,
Following, Return Vol., Analyst Uncert., and Analyst Error. As seen in the last columns of Table
3, our sample and the matched sample of Compustat firms are similar on all of our variables (p >
0.10). In particular, Mgmt Error is not significantly different between our sample and the
matched Compustat sample, indicating that our firms are not systemically better forecasters than
similar firms that are not in our sample. We revisit potential selection issues after presenting our
primary results.
Pearson correlations between the variables used in our tests are provided in Table 4.
Overall RBFP has a significantly negative correlation with Mgmt Error. As expected, Mgmt
Error is also highly correlated with Analyst Error (0.90), reflecting the fact that both of these
variables capture the difficulty of forecasting earnings. Correlations between Overall RBFP and
both Return Vol. and Analyst Error are negative and significant, consistent with claims that more
sophisticated RBFP practices provide information that allows firms to take actions that reduce
volatility and uncertainty in the entities’ operations. The significant positive correlation between

24
Overall RBFP and Strategy Change also suggests that firms with more sophisticated RBFP are
more likely to make strategic changes based on the improved risk-related information generated
by the RBFP process. By including these variables as controls, any observed relation between
RBFP practices and forecast accuracy is more likely to reflect variations in forecasting ability
rather than differences in variability and uncertainty brought about by RBFP-driven changes in
operations.
4. Results
4.1 Forecast Errors and Risk-Based Forecasting and Planning
We predict a negative association between our risk-based forecasting and planning
measures and the magnitude of management forecast errors (Mgmt Error). Table 5 presents
results from our tests of this prediction. We include year fixed effects in the models and cluster
standard errors by firm. In the first column, we regress Mgmt Error on the broad risk-based
forecasting and planning measure Overall RBFP. Each successive column replaces Overall
RBFP with one of its underlying components: Risk Drivers, Quant. Assess, Distribs., Budgeting,
Capital Invest., or Strategy.
The results show that RBFP is consistently associated with lower management forecast
error. The coefficients on Overall RBFP and all six of the components are negative, with only
Risk Drivers marginally insignificant (p = 0.104, two-tailed). The estimated coefficient on
Overall RBFP corresponds to a one standard deviation increase in this variable reducing Mgmt
Error by 16.1 percent from its mean value.
The significant negative coefficient on Quant. Assess. suggests that more consistent and
sophisticated use of quantitative risk measurement practices can improve forecasting ability,

25
contradicting recent criticisms of quantitatively-oriented risk management processes. The
estimated coefficient on Quant. Assess. implies that a one standard deviation increase in this
variable is associated with a 12.9 percent reduction in Mgmt Error from its mean value.
Similarly, the highly significant negative association between Distribs. and Mgmt Error indicates
that firms that develop forecasts based on probability distributions and/or stochastic modeling
have management earnings forecast errors that are 0.204 percentage points lower than firms that
do not use these methods. This is relative to a mean Mgmt Error of 0.761 percent. Although Risk
Drivers is marginally insignificant in Table 5, when this variable is interacted with Quant.
Assess. (not reported in the table), the interaction term is negative and statistically significant (t =
−2.67), indicating that forecast errors are lower when firms employ quantitative risk
measurement techniques together with more consistent and sophisticated risk driver analyses.8
The significant negative coefficients on Budgeting, Capital Invest., and Strategy suggest
that incorporating risk-related information into planning processes improves earnings forecasting
performance across a variety of planning horizons. The estimated coefficients on Budgeting,
Capital Invest., and Strategy suggest that one standard deviation changes in these variables’
8 We also estimated models with interactions between each pair the three information gathering and processing variables and the three planning variables. The only other significant relation is a positive interaction between Distribs. and Budgeting. In this model, the coefficient on the Budgeting main effect is -0.139 (p = 0.02, two-tailed) and the coefficient on the interaction term is 0.139 (p = 0.08, two-tailed), indicating that greater incorporation of risk considerations when budgeting is associated with smaller earnings forecast errors unless distributions are used in forecasting, in which case Budgeting has no significant effect. We also find that Distribs. has a significantly negative main effect on forecast errors regardless of the other RBFP practice included in the model, suggesting that the use of probability distributions and/or stochastic models when forecasting can improve forecasting ability, independent of the other RBFP practices adopted by the firm.
26
scores are associated with Mgmt Error values that are 14.6 percent, 7.5 percent, and 14.5 percent
lower than the average Mgmt Error, respectively.9
4.1.1 Changes in Forecast Errors and Risk-Based Forecasting and Planning
One limitation of our data is that we only observe each firm’s response to the survey at a
single point in time. Consequently, we are unable to include firm fixed-effects or examine
whether changes in RBFP are associated with changes in forecast accuracy. However, by relying
on surveys indicating that relatively few firms began implementing enterprise risk management
processes prior to the financial crisis of 2007-2008 (Aon 2010, McKinsey 2014), we can provide
some evidence consistent with the significant negative relation between our RBFP variables and
forecast errors being due to increases in firms’ use of more sophisticated risk-based forecasting
and planning processes.
The earliest respondents in our sample completed the survey and entered the sample in
2011, so all of the survey responses capture post-crisis practices. We make the assumption that
all of our samples’ RBFP practices were less developed prior to the financial crisis. If this
assumption holds and firms with more sophisticated RBFP only adopted these more advanced
practices after the crisis period, we should observe a significant association between forecast
accuracy and our RBFP variables after the crisis period, but not before. In addition, those firms
9 One question is whether our inclusion of Analyst Uncertain. and Analyst Error, which are highly correlated with Mgmt Error, is over-controlling for the influence of RBFP or is driving our results. Estimating the Mgmt Error model using only the other control variables produces an adjusted R-squared of 0.19. When we introduce the RBFP variables to this is base model, the models’ adjusted R-squareds range from 0.20 to 0.21 and the coefficients on all of the RBFP variables are negative and significant, with the exception of Strategy which is negative but insignificant. This evidence suggests that the inclusion of Analyst Uncertain. and Analyst Error as control variables is not driving our overall results.
27
with the highest RBFP scores should also be the firms that experienced the greatest improvement
in forecast accuracy from the pre-crisis period to the post-crisis period.
Following this logic, we repeat the analysis in Table 5, but expand the sample period to
include fiscal years 2005-2007. We also add the indicator variable Post, which takes the value of
one for all years after a firm completed the survey (2011 at the earliest) and zero for the years
2005-2007, and interact this variable with the RBFP components. Panel A of Table 6 presents
the results from this analysis. No RBFP component is significantly associated with Mgmt Error
prior to the crisis period, consistent with limited adoption of the risk-based forecasting and
planning processes in this earlier period. In contrast, the interactions of Post with Overall RBFP,
Quant. Assess., Budgeting, and Strategy are significantly negative, consistent with the adoption
of these practices increasing the accuracy of management’s earnings forecasts.
Panel B of Table 6 extends this analysis to examine the time series trend in forecast errors
following the survey response date. In these tests, we add the variable Trend and the interaction
between this variable and the RBFP components. Trend equals zero in the pre-crisis years and
one in the survey response year, and increases in value by one for each subsequent year the firm
is in the sample. If firms with more sophisticated RBFP practices continue to improve their
forecasting abilities in the years following their survey responses to a greater extent than firms
with less sophisticated practices, then the interaction between Trend and RBFP should be
negative and significant (that is, subsequent forecast errors become even smaller in the firms
with higher RBFP scores). However, if firms with lower RBFP scores make greater subsequent
improvements in their RBFP practices than firms with already high RBFP scores, we should
observe the differences in forecast errors between the firms diminishing over time.
28
Consistent with firms with more sophisticated RBFP practices continuing to improve
their forecasting ability to a greater extent than the less sophisticated respondents, we find a
highly significant (p < 0.01, two-tailed) coefficient on the interaction between Trend and Overall
RBFP. We also find significant negative coefficients on the interactions between Trend and all of
the individual components except for Distribs.. Thus, even if the firms with lower RBFP scores
improved the sophistication of their practices in the years following completion of the survey,
they did not improve their forecasting ability to the same extent as the firms with more
sophisticated RBFP practices to begin with.10
4.1.2 Potential Impact of Confounding Variables
Although we include controls in our tests for many factors that are likely to influence
both the choice of RBFP techniques and earnings forecast errors, the possibility remains that
some unmeasured, omitted factors drive our results. To offer evidence on the likelihood of this
issue, we calculate the impact threshold for a confounding variable (ITCV) as proposed in Frank
(2000) and recommended by Larcker and Rusticus (2010). The ITCV captures how strongly an
omitted variable would have to be correlated with the dependent and independent variables of a
regression, conditional on the included controls, to cause the coefficient on the independent
variable to no longer be statistically significant.
In Table 7, we reproduce the main result from Table 5 showing a significantly negative
association between Mgmt Error and Overall RBFP. From this regression, we calculate the
ITCV of −0.214. This value indicates that if the partial correlation of an omitted variable with
10 The results in Panel B of Table 6 are not driven by pre-existing forecasting improvement trends in the 2005-2007 time period. When we estimate the models using only these years and code Trend as one in 2005, two in 2006, and three in 2007, the coefficients on Trend, the RBFP components, and their interactions are all statistically insignificant.
29
Mgmt Error multiplied by the omitted variable’s partial correlation with Overall RBFP is less
than −0.214, the coefficient on Overall RBFP would no longer be statistically significant if that
omitted variable was included in the regression.
To assess how likely it is that such a variable exists, we examine the partial correlations
of the included control variables. In the last column of Table 7, we calculate the impact of each
control variable. The variable’s impact is the product of its partial correlations with Mgmt Error
and Overall RBFP. All of the control variables’ impacts are substantially below the ITCV,
indicating that an omitted variable would have to have stronger correlations with Mgmt Error
and Overall RBFP, conditional on the included controls, than any of our included controls to
overturn the significance of the coefficient on Overall RBFP.
4.1.3 Self-Selection Concerns
Another factor potentially limiting the interpretation of our findings is firms self-selecting
into our sample, both by choosing to complete the survey and by choosing to provide an earnings
forecast.
Our survey responses are gathered from firms that opt-in to take the Aon survey. If these
firms are systematically different from the general population, our results may not generalize
outside of our sample. The concern is that only firms that are likely to benefit from more
sophisticated risk forecasting and planning methods take the survey. However, if this concern is
true, then all of the firms in our sample should have relatively advanced RBFP practices. The
data show, however, that there is wide variation in the practices within our sample (see Appendix
A and the discussion of survey responses in section 3). Moreover, when we compared Mgmt
Error from our sample to a matched sample of firms in Table 3, we found no significant

30
differences in mean forecast errors. If our sample consists of firms that receive greater
forecasting benefits from RBFP than otherwise similar firms, we would expect our sample to
have more sophisticated RBFP and higher forecast accuracy when compared to a matched
sample. However, if these two sets of firms are not systematically different, we would expect the
sample and matched firms to have similar levels of RBFP on average, and similar forecast
accuracy as well. While we cannot observe RBFP for these other firms, we can observe their
forecast accuracy, which is not significantly different on average.
Addressing the issue of firms selecting into our sample with a selection model is not
practical, as there is unlikely to be an instrument that is strongly associated with firm-specific
benefits of RBFP (and thus the decision to participate in the survey), but is not related to forecast
accuracy. For example, firms in more volatile or uncertain environments may benefit more from
RBFP, but these same factors are also important determinants of forecasting accuracy (moreover,
we attempt to control for this uncertainty with the variables Return Vol., Analyst Uncert., and
Analyst Error). To the extent that our set of controls is incomplete, the earlier tests in Table 7
suggest that the impact of the omitted variable would need to be quite large to overturn the
paper’s results.
A different potential selection problem is firms choosing to provide earnings forecasts.
We hypothesize that more sophisticated RBFP practices enable better forecasts, but firms may
choose to forecast only if they expect their forecasts to be sufficiently accurate. This would
suggest that firms with higher RBFP scores choose to forecast, as they expect to have accurate
forecasts. However, firms with less sophisticated RBFP practices will only forecast if other
factors enable relatively accurate forecasts. We attempt to control for these other factors with our
set of controls.

31
To more formally investigate the possibility that only firms with more sophisticated
RBFP issue earnings guidance, we examine the robustness of our findings using a Heckman self-
selection model. We conduct this test using all 175 publicly-traded U.S. firms that completed the
RMI survey between 2011 and 2014 and have the data required for our analyses. This larger
sample includes both the 85 responding firms that provided management earnings guidance
during this period (the primary sample for our tests) and 90 responding firms that did not provide
earnings guidance. By pooling these observations, we can examine whether the decision to
disclose is associated with the responding firms’ RBFP scores, and incorporate the probability of
disclosure into our forecast accuracy model.
Once again, a firm enters the sample in the year it completes the survey and remains in
the sample through 2014. We retain all 486 firm-years in this sampling period and code the
dependent variable in the first stage probit model one if earnings guidance is provided in a given
year, and zero otherwise. Independent variables are the same as those used in our other forecast
accuracy tests. In the second stage, we employ the 211 firm-years with earnings forecasts that
were used in the earlier tests. The variable Following serves as the excluded instrument. Prior
research (e.g., Ajinkya et al. 2005) indicates that the provision of guidance is positively
associated with analyst following, but one can argue that analyst following itself is unlikely to
directly improve management forecast accuracy. A similar argument can be made for
Ownership. Consequently, we follow Feng et al. (2009) and exclude Following, as well as
Ownership, in the second stage models, and add the inverse Mills ratio from the first stage.
When we estimate the first stage model shown in Table 8, we find no significant
association between Overall RBFP and a respondent’s decision to issue earnings guidance.
Moreover, in the second stage forecast accuracy model, the inverse Mills ratio is insignificantly
32
different from zero while the coefficient on Overall RBFP remains significantly negative. These
tests suggest that our forecast error results are not driven by firms with more sophisticated RBFP
practices choosing to disclose annual earnings guidance to the market.
4.2 RBFP and Earnings Forecast Width
We examine the associations between RBFP practices and earnings forecast width in
Table 9. If more sophisticated RBFP practices give firms a greater understanding of the risks
they face and the potential implications of these risks for earnings, and efforts are taken to ensure
that the accepted risks fall within the organization’s risk appetite and tolerances, firms may
generate forecasts within smaller ranges. On the other hand, greater understanding of a wide
variety of potential risks may lead firms to generate wider earnings forecasts that take into
account the probability that some of the more extreme risks may materialize. This may be
especially true when firms generate probabilistic earnings distributions that take into account a
broader range of scenarios than single- or multi-point forecasting methods (Deloitte 2012).
Given the potential impact of probabilistic modeling and distributions on the amount of
uncertainty contained in the earnings forecasts, we include Distribs. and its interaction with one
of the other RBFP components as additional independent variables in each Width model. This
specification allows us to examine whether the relations between the other RBFP components
and Width differ depending upon whether or not the firm uses distributions and/or stochastic
modeling techniques in the forecasting process.
The Width results are provided in Table 9. The coefficients on the RBFP main effects in
these tests reflect the association between the component and Width in firms that do not use
distributions in the forecasting process. We exclude the Overall RBFP measure from these
33
analyses because Distribs. is a component of this aggregate variable. Instead, we examine RBFP
w/o Distribs., which is the average of the other RBFP components, excluding Distribs. The main
effects on RBFP w/o Distribs., Quant. Assess., Budgeting, Capital Invest, and Strategy are all
negative and statistically significant, with the coefficient on Risk Drivers negative but
insignificant (p = 0.127, two-tailed). These results are consistent with managers forecasting
within a narrower range when they integrate risk considerations into the forecasting process, but
do not use more advanced modeling techniques when developing their forecasts. The coefficient
on RBFP w/o Distribs. indicates that a one standard deviation increase in this variable is
associated with a decrease of 0.099 in Width, or 23.3 percent of its mean value. The estimated
effects of the other significant RBFP components on Width are similar in magnitude. In
particular, the similar estimated effects of Budgeting, Capital Invest, and Strategy on Width
indicate that incorporating risk into the planning process reduces the width of forecasts,
regardless of the planning horizon.
In contrast, the coefficients on the interaction terms are positive and significant in the
RBFP w/o Distribs,, Capital Invest., and Strategy models, and positive but marginally
insignificant in the Risk Drivers model (p = 0.106, two-tailed). This evidence suggests that
formally integrating greater uncertainty into the forecasting process using these modeling
approaches may produce forecasts with wider ranges, relative to firms who do not use these
forecasting techniques, reflecting the consideration of a broader set of potential outcomes.
Similar to the forecast accuracy tests in Table 6, we also examine how the association
between RBFP and Width changed from the 2005-2007 period to the years following the
survey’s completion. We find no association between RBFP practices and Width during the
2005-2007 period, regardless of whether the firms use distributions in the forecasting process or
34
not. However, during the post-implementation period, we find a significant negative association
between Overall RBFP w/o Distribs. and Width in firms not using distributions, but continue to
find no significant association between Overall RBFP w/o Distribs. and Width in firms using
distributions.11
4.3 Alternative Explanations
Two alternative explanations for the significant associations between more sophisticated
RBFP practices and management forecast accuracy observed in our tests is that we are simply
picking up firms with better managers, or that firms with better internal information
environments are better able to manage earnings in order to meet their earnings forecasts. We
conduct two sets of additional untabulated tests to examine these alternative explanations. First,
following Feng et al. (2009), we include CEO tenure as an additional control for managerial
ability. We also include an indicator for whether or not the CEO changed between the pre-crisis
period (2005-2007) and the post-crisis survey response period, which could explain the observed
improvement in forecast accuracy between these periods in firms with more sophisticated RBFP
practices. Neither variable is significantly associated with Mgmt Error or Width, and our other
results have very similar magnitudes and significance levels as those reported in the tables.
11 To offer evidence on how large an omitted variable’s association with Width and RBFP w/o Distribs. would have to be to overturn the estimated negative association between these two variables, we again calculated the impact threshold for a confounding variable (ITCV). The ITCV for Width and RBFP w/o Distribs. is −0.119, indicating that an omitted variable would need a partial correlation with both these variables of 0.345 in magnitude (with one of the correlations negative) to overturn this result. Our included controls suggest associations of this magnitude are unlikely, as the impact of all of the control variables are far below this threshold. We also find that the results are robust to estimating a Heckman selection model. The coefficient on the main effect of RBFP w/o Distribs. remains negative and significant, the coefficient on the interaction between this variable and Distribs. remains positive and significant, and the estimated inverse mills ratio is insignificant.
35
Second, we examine whether the RBFP scores are significantly associated with the
magnitude of discretionary accruals from a modified Jones model (Dechow et al. 1995) and with
write-offs, both of which could be used to manage earnings in order to meet earnings targets. We
find no significant association between discretionary accruals (either signed or unsigned) and any
of our RBFP variables. We also find no significant association between RBFP practices and the
probability that a firm took a goodwill writeoff in the years it was included in the sample, but we
do find that firms with higher Overall RBFP, Risk Drivers, Quant. Assess., Capital Invest., and
Strategy are significantly more likely to have taken a non-goodwill writeoff. However, when we
include goodwill and non-goodwill writeoffs (both as a percent of prior year assets) as additional
control variables, we find no significant association between these variables and Mgmt Error or
Width, with our other results remaining unchanged.
4.4 RBFP and Non-Earnings Forecasts
The primary focus of our analysis is management earnings forecasts, which other
researchers have used as a proxy for internal information quality. However, some firms disclose
other financial forecasts that may also be influenced by internal information quality and risk-
based forecasting and planning practices. We therefore extend the analyses to examine the
relations between RBFP and two of the other forecasts included in the IBES database: sales and
capital expenditures.
Table 10 provides results from these analyses. The dependent variables are Sales Error,
defined as the absolute value of actual sales less management's forecast as a percentage of actual
sales, and CapEx Error, defined as the absolute value of actual capital expenditures less
management's forecast as a percentage of actual capital expenditures. As shown in Panel A,
Overall RBFP is negatively associated with Sales Error, with the estimated coefficient implying
36
that a one standard deviation increase in Overall RBFP is associated with a Sales Error that is
14.7 percent lower than its mean value. Quant. Assess. and Distribs. are also associated with
smaller sales forecast errors. The coefficient on Quant. Assess indicates that a one standard
deviation increase in this variable is associated with a decrease in Sales Error of 7.2 percent
from its mean, while the coefficient on Distribs. implies that firms using distributions or
stochastic modeling are associated with a 33.4 percent decrease in Sales Error, relative to its
mean. Across the different planning horizons, only Budgeting is significantly associated with
Sales Error, with a one standard deviation increase in this variable associated with a Sales Error
that is 10.6 percent lower than its mean.
The capital expenditure forecast results in panel B are weaker. CapEx Error has a mean of
19.25 percent, which is larger than the mean sales forecast error, and the adjusted R-squared
statistics in the capital expenditures models are substantially lower than in the sales forecast
models. Of the RBFP variables, only the longest-term planning component, Strategy, exhibits a
significant association with CapEx Error. The coefficient of −4.859 suggests that a one standard
deviation increase in this variable is associated with a decrease in CapEx Error of 20.4 percent
from its mean value. Surprisingly, we find no association between greater incorporation of risk
consideration in capital investment and project decisions (Capital Invest.) and the magnitude of
capital expenditure forecast errors.
3 Conclusions
Risk-based forecasting and planning practices are aimed at helping firms navigate an
increasingly volatile operating environment by helping integrate risk information into forecasting
and planning. Using survey data, we examine whether these emerging internal management

37
practices are associated with management’s public earnings forecasts. We find that more
sophisticated overall RBFP is associated with more accurate management earnings forecasts. 12
When examining individual RBFP practices, we find that using more sophisticated quantitative
methods in risk analysis is related to lower earnings forecast errors. The use of probability
distributions for internal forecasting is associated with smaller forecast errors but larger forecast
widths, suggesting that firms using distributions take a larger set of risks into account when
forecasting. Incorporating risk considerations into short-horizon activities such as budgeting or
long-horizon activities such as strategic planning is also associated with better forecasting
performance, suggesting that the benefits from more sophisticated RBFP do not decline as the
planning horizon increases.
Our study is subject to several limitations. As with all survey research, our study suffers
from potential response biases. However, the fact that the majority of respondents indicated that
they do not employ sophisticated RBFP practices minimizes concerns that respondents presented
their firms’ RBFP practices in an overly favorable or desirable light. Our use of publicly-
available outcome variables also helps mitigate concerns that our results are driven by response
biases. Another limitation of our survey data is that we do not have time series data on RBFP
practices. We assume that the sophistication of a firm’s risk-based forecasting and planning
practices, relative to other firms in the sample, remained reasonably stable over our sample
12 Given the observed association between more sophisticated RBFP practices and higher earnings forecast quality, we examined whether the use of these more sophisticated practices is also associated with greater disclosure of risk management practices. We searched the firms’ 10K and proxy statements for the number of times the following phrases were mentioned: risk_management, COSO, president_of_risk or risk_management or enterprise_risk_management, chief_risk_officer, risk_committee, strategic_risk_management, consolidated_risk_management, holistic_risk_management, or integrated_risk_management. We find no association between this word count and the firm’s RBFP scores. One explanation for this result (in addition to the crudeness of this disclosure measure) is that risk disclosures are not credible and may simply reflect cheap talk. See Dobler (2008) for a discussion.
38
period. To offer some evidence that changes in risk-based forecasting and planning practices are
associated with changes in forecasting performance, we assume that adoption of these practices
was limited before the financial crisis, an assumption supported by prior survey evidence. We
find evidence consistent with firms with more sophisticated post-crisis risk-based forecasting and
planning practices also experiencing an increase in forecast accuracy following the crisis.
Finally, we acknowledge that firms self-select into our sample, both by choosing to complete the
survey and by providing an earnings forecast. However, our analyses indicate that selection on
unobservables would have to be large to overturn our results. In addition, our sample firms do
not demonstrate superior forecasting performance compared to a matched sample, suggesting
that our sample firms are not systematically different. Finally, we find no evidence that
responding firms with higher RBFP scores were more likely to provide management earnings
guidance, with our results robust to using a selection model that incorporates this information.
Notwithstanding these limitations, our study makes a number of contributions. First, we
extend studies on the relation between internal information quality and firms’ communications
with external stakeholders. Prior research has been hindered by the unobservability of internal
firm practices. In contrast, our access to detailed data on firms’ risk-based forecasting and
planning practices allows us to provide stronger tests of theoretical predictions that the quality of
external disclosures reflects internal information quality. Second, we begin to integrate the
disparate literatures on financial planning, strategic planning, and risk management, thereby
providing evidence on the benefits from more unified forecasting and planning approaches.
Finally, we extend the enterprise risk management literature by moving beyond the examination
of aggregate ERM sophistication and providing evidence on the mechanisms through which a
specific risk management practice influences firm outcomes.

39
APPENDIX A
Survey Questions and Response Frequencies for Risk-Based Forecasting and Planning Constructs
Indicators for Risk Drivers
Risk drivers (i.e., causes of risk) are identified/documented: rarely or never (7%), inconsistently or on an ad-hoc basis for selected risks (35%), consistently for key risks (58%)
Risk drivers (i.e., causes of risk) are analyzed to identify common drivers between risks: rarely or never (14%), inconsistently or on an ad-hoc basis for selected risks (48%), consistently for key risks (38%)
Risk management activities are analyzed and mapped to specific risk drivers: rarely or never (19%), inconsistently or on an ad-hoc basis for selected risks (44%), consistently for key risks (38%)
Risk drivers (i.e., causes of risk) are analyzed in depth and support the identification of emerging risks through understanding of common risk drivers: rarely or never (25%), inconsistently or on an ad-hoc basis for selected risks (40%), consistently for key risks (35%)
The organization leverages common risk driver information to identify correlation/relationships between risks: N/A, analysis of correlation is not conducted (39%), informally in management discussions and perceptions of risk (48%), formally, and has documented the need for its consideration in risk assessment processes (13%)
Indicators for Quant. Assess.
Risk assessment scales at the organizational level are: not used in risk management exercises (7%), primarily qualitative criteria (i.e., High, Medium, Low) (51%), developed with both qualitative and quantitative criteria (42%)
Risk assessment criteria are developed to align with: N/A, risk assessment criteria are not developed (7%), management perceptions of risk tolerance (73%), a quantitative risk appetite and statements of risk tolerance (20%)
Is risk assessment analysis supplemented with additional quantitative evaluations of exposure? no (18%), yes, where perceived necessary (55%), yes, for risks that meet specific criteria/thresholds (27%)
Criteria for evaluation of risk management activity effectiveness for key risks are: not yet developed (19%), primarily qualitative (e.g., “adequate”, “weak”) (58%), quantitative, measuring change in risk exposure (24%)
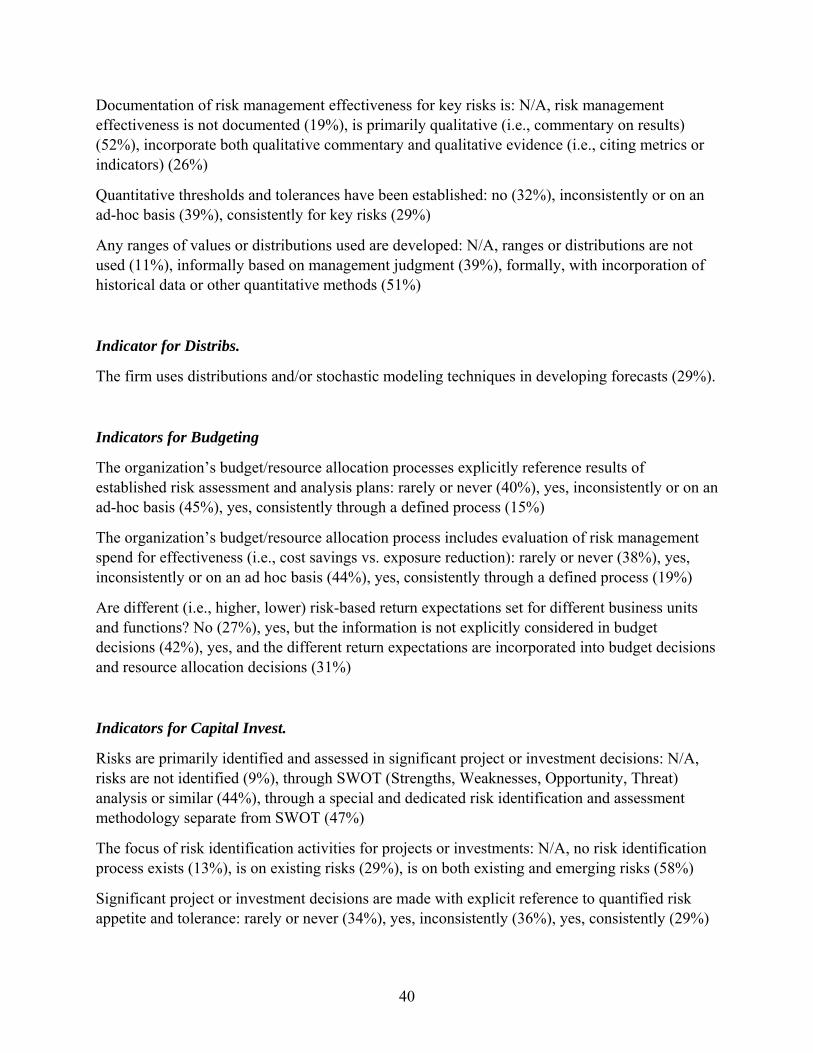
40
Documentation of risk management effectiveness for key risks is: N/A, risk management effectiveness is not documented (19%), is primarily qualitative (i.e., commentary on results) (52%), incorporate both qualitative commentary and qualitative evidence (i.e., citing metrics or indicators) (26%)
Quantitative thresholds and tolerances have been established: no (32%), inconsistently or on an ad-hoc basis (39%), consistently for key risks (29%)
Any ranges of values or distributions used are developed: N/A, ranges or distributions are not used (11%), informally based on management judgment (39%), formally, with incorporation of historical data or other quantitative methods (51%)
Indicator for Distribs.
The firm uses distributions and/or stochastic modeling techniques in developing forecasts (29%).
Indicators for Budgeting
The organization’s budget/resource allocation processes explicitly reference results of established risk assessment and analysis plans: rarely or never (40%), yes, inconsistently or on an ad-hoc basis (45%), yes, consistently through a defined process (15%)
The organization’s budget/resource allocation process includes evaluation of risk management spend for effectiveness (i.e., cost savings vs. exposure reduction): rarely or never (38%), yes, inconsistently or on an ad hoc basis (44%), yes, consistently through a defined process (19%)
Are different (i.e., higher, lower) risk-based return expectations set for different business units and functions? No (27%), yes, but the information is not explicitly considered in budget decisions (42%), yes, and the different return expectations are incorporated into budget decisions and resource allocation decisions (31%)
Indicators for Capital Invest.
Risks are primarily identified and assessed in significant project or investment decisions: N/A, risks are not identified (9%), through SWOT (Strengths, Weaknesses, Opportunity, Threat) analysis or similar (44%), through a special and dedicated risk identification and assessment methodology separate from SWOT (47%)
The focus of risk identification activities for projects or investments: N/A, no risk identification process exists (13%), is on existing risks (29%), is on both existing and emerging risks (58%)
Significant project or investment decisions are made with explicit reference to quantified risk appetite and tolerance: rarely or never (34%), yes, inconsistently (36%), yes, consistently (29%)

41
In making significant capital investment decisions, the project risk profile is evaluated against/compared to the organization’s overall risk profile: rarely or never (13%), yes, inconsistently or informally (54%), yes, consistently as part of a defined process (33%)
Management uses project risk information to adjust the hurdle rates for significant capital investment decisions: rarely or never (22%), informally, or based on management judgment or previous experience (44%), formally, using quantitative analysis of project risk (34%)
Indicators for Strategy
The Board and executive management highlight the alignment of risk management strategy with overall strategy when communicating strategic direction: no, communications do not highlight alignment (31%), yes, and include informal references to concepts of risk appetite and tolerance (53%), yes, and include formal references to concepts of risk appetite and tolerance (16%)
Executive management applies concepts of risk appetite and/or tolerance to strategy development: rarely or never (29%), yes, on an ad hoc basis (51%), yes, through a formal process (20%)
How does information from the risk management process inform the strategic planning process? N/A, key risk information is not included (12%), key risk information is informally incorporated (56%), key risk information is formally incorporated and integrated (32%)
Risk identification exercises during the strategic planning process are used to develop an emerging risk profile: N/A, risk identification is not conducted during strategic planning (26%), no (36%), yes (38%)
42
REFERENCES
Aberdeen. (2012). Financial planning, budgeting, and forecasting: Leveraging risk-adjusted strategies to enable accuracy. Boston, MA: Aberdeen Group.
Ai, J., P. Brockett, W. Cooper, & L. Golden. (2012). Enterprise risk management through strategic allocation of capital. Journal of Risk and Insurance 79 (1): 29-55.
——–, P. Brockett, & T. Wang. (2013). Optimal enterprise risk management and decision making with shared and dependent risks. Unpublished paper, Available at SSRN: http://ssrn.com/abstract=2352485.
Ajinkya, B. B., S. Bhojraj, & P. Sengupta. (2005). The association between outside directors, institutional investors and the properties of management earnings forecasts. Journal of Accounting Research 43: 343–376.
Ali, A., S. Klasa, & E. Yeung. (2014). Industry concentration and corporate disclosure policy. Journal of Accounting and Economics 58: 240-264.
Alviniussen, A., & H. Jankensgard. (2009). Enterprise risk budgeting - Bringing risk management into the financial planning process. Journal of Applied Finance 18: 178-192.
Aon. (2010). Global enterprise risk management survey. Chicago, IL: Aon Corporation.
AFP. (2012). 2012 AFP risk survey. Bethesda, MD: Assocation for Financial Professionals.
AFP. (2014). AFP risk survey. Bethesda, MD: Assocation for Financial Professionals.
Barron, O. E., O. Kim, S. C. Lim, & D. E. Stevens. (1998). Using analysts forecasts to measure properties of analysts information environment. The Accounting Review 73: 421–433.
Baxter, R., J. C. Bedard, R. Hoitash, & A. Yezegel. (2013). Enterprise risk management program quality: Determinants, value relevance, and the financial crisis. Contemporary Accounting Research 30: 1264–1295.
Beasley, M., & M. Frigo. (2010). ERM and its role in strategic planning and strategy execution. In Enterprise Risk Management, edited by J. Fraser & B. Simkins, 31-50. Hoboken, NJ: John Wiley & Sons.
Bradfield, R. (2008). Cognitive barriers in the scenario development process. Advances in the Development of Human Resources 10: 198-215.
Cassar, G., & J. Gerakos. (2013). Does risk management work? Chicago Booth Research Paper No. 13-13. Available at SSRN: http//ssrn.com/abstract = 1722250.

43
Cassar, G., & B. Gibson. (2008). Budgets, internal reports and manager forecast accuracy. Contemporary Accounting Research 25: 707-737.
Cheng, Q., T. Luo, & H. Yue. (2013). Managerial incentives and management forecast precision. The Accounting Review 88: 1575-1602.
Curtis, A., R. Lundholm, & S. McVay. (2014). Forecasting sales: A model and some evidence from the retail industry. Contemporary Accounting Research 31: 581-608.
Curtis, P., & M. Carey. (2012). Risk assessment in practice. New York: Committee of Sponsoring Organizations of the Treadway Commission.
COSO. (2004). Enterprise risk management – Integrated framework. New York: Committee of Sponsoring Organizations of the Treadway Commission.
COSO. (2013). Internal Control – Integrated framework. New York: Committee of Sponsoring Organizations of the Treadway Commission.
Dechow, P., R. Sloan, & A. Sweeney. (1995). Detecting Earnings Management. The Accounting Review 70: 193–225.
Deloitte. (2012). Risk-adjusted forecasting and planning: Navigating the “new normal” of increased volatility. London: Deloitte LLP.
——–. (2013). Risk-adjusted forecasting: More certainty for planning. CFO Journal. Available at http://deloitte.wsj.com/cfo/2013/10/03/risk-adjusted-forecasting-more-certainty-for-planning/.
Dichev, I., & V. Tang. (2009). Earnings volatility and earnings predictability. Journal of Accounting and Economics 47: 160-181.
Dobler, M. (2008). Incentives for risk reporting – a discretionary disclosure and cheap talk approach. International Journal of Accounting 43: 184-206.
Dorantes, C.-A., C. Li, G. F. Peters, & V. J. Richardson. (2013). The effect of enterprise systems implementation on the firm information environment. Contemporary Accounting Research 30: 1427–1461.
Durand, R. (2003). Predicting a firm's forecasting ability: The roles of organizational illusion of control and organizational attention. Strategic Management Journal 24: 821-838.
Ellul, A. & Yerramilli, V. (2013). Stronger risk controls, lower risk: evidence from U.S. bank holding companies. Journal of Finance LXVIII: 1757-1803.
Feng, M., C. Li, & S. Mcvay. (2009). Internal control and management guidance. Journal of Accounting and Economics 48: 190–209.
44
Frank, K.A. (2000). Impact of a confounding variable on a regression coefficient. Sociological Methods & Research 29: 147-194.
Froot, K. & J. Stein. (1998). Risk management, capital budgeting, and capital structure policy for financial institutions: An integrated approach. Journal of Financial Economics 47: 55-82.
Gallemore, J., & E. Labro. (2015). The importance of the internal information environment for tax avoidance. Journal of Accounting and Economics 60: 149-167.
Gatzert, N. & Martin, M. (2015). Determinants and value of enterprise risk management: empirical evidence from the literature. Risk Management and Insurance Review, 18: 29-53.
Goodman, T., M. Neamtiu, N. Shroff, & H. White. (2014). Management forecast quality and capital investment decisions. The Accounting Review 89: 331-365.
Gordon, L., M. Loeb, & C. Tseng. (2009). Enterprise risk management and firm performance: A contingency perspective. Journal of Accounting and Public Policy 28: 301-327.
Heitzman, S., & M. Huang. (2014). Internal information and investment sensitivities to market value and cash flow. Unpublished paper. University of Southern California and University of Rochestrer. Available at SSRN: http://ssrn.com/abstract=2504632.
Hemmer, T. & E. Labro. (2008). On the optimal relation between the properties of managerial and financial reporting systems. Journal of Accounting Research 46: 1209-1240.
Hirst, D.E., L. Koonce, & S. Venkataraman. (2008). Management earnings forecasts: A review and framework. Accounting Horizons 22: 315-338.
Hogarth, R., & S. Makridakis. (1981). Forecasting and planning: An evaluation. Management Science 27: 115-138.
Hoyt, R., & A. Liebenberg. (2011). The value of enterprise risk management. Journal of Risk and Insurance 78: 795–822.
International Standards Organization. (2009). Risk management—principles and guidelines. ISO 31000:2009. Geneva: International Standards Organization.
Ittner, C., and T. Keusch. (2016). Incorporating Risk Considerations into Planning and Control Systems: The Influence of Risk Management Value Creation Objectives. In P. Linsley and M. Woods (eds.), The Routledge Companion to Accounting and Risk, London: Routledge: forthcoming.
Jorgensen, M. (2010). Identification of more risks can lead to increased over-optimism of and over-confidence in software development effort estimates. Information and Software Technology 52: 506-516.

45
Kahneman, D., & D. Lovallo. (1993). Timid choices and bold forecasts: A cognitive perspective on risk taking. Management Science 39: 17-31.
KPMG. (2007). Forecasting with confidence: Insights from leading finance functions. London: KPMG.
Lang, M., & R. Lundholm. (1993). Cross-sectional determinants of analyst ratings of corporate disclosures. Journal of Accounting Research 31: 246–271.
———, & ———. (2000). Voluntary disclosure and equity offerings: Reducing information asymmetry or hyping the stock? Contemporary Accounting Research 17: 623–662
Larcker, D.F. & T.O. Rusticus (2010). On the use of instrumental variables in accounting research. Journal of Accounting and Economics 49: 186-205.
Lawrence, M., P. Goodwin, M. O'Connor, & D. Onkal. (2006). Judgmental forecasting: A review of progress over the last 25 years. International Journal of Forecasting 22: 493-518.
Makridakis, S. & N. Taleb. (2009). Decision making and planning under low levels of predictability. International Journal of Forecasting 25: 716-733.
Marsh & RIMS. (2014). Excellence in risk management survey XI. New York: Marsh and Risk and Insurance Management Society.
McKinsey. (2014). Enterprise-risk-management practices: Where’s the evidence? McKinsey Working Papers on Risk, Number 53
Mcshane, M. K., A. Nair, & E. Rustambekov. (2011). Does enterprise risk management increase firm value? Journal of Accounting, Auditing & Finance 26: 641–658.
Meissner, P. & T. Wulf. (2013). Cognitive benefits of scenario planning: Its impact on biases and decision quality. Technological Forecasting & Social Change 80: 801-814.
Morlidge, S, S. Partners, & S. Player. (2013). Mastering risk with business forecasting. Somers, NY: IBM Corporation.
Mun, J. (2010). Modeling risk: Applying monte carlo simulation, strategic real options, stochastic forecasting, and portfolio optimization. Hoboken, NJ: John Wiley & Sons.
Newman, P., & R. Sansing. (1993). Disclosure policies with multiple users. Journal of Accounting Research 31: 92–112.
Nocco, B. W., & R. M. Stulz. (2006). Enterprise risk management: Theory and practice. Journal of Applied Corporate Finance 18: 8–20.
46
Noe, C. (1999). Voluntary disclosure and insider transactions. Journal of Accounting and Economics 27: 305–326.
Power, M. (2009). The risk management of nothing. Accounting, Organizations, and Society 34: 849-855.
PriceWaterhouseCoopers. (2011). Financial planning: Realizing the value of budgeting and forecasting. Boston, MA: CFO Publishing LLC.
Rogers, J. L., & P. C. Stocken. (2005). Credibility of management forecasts. The Accounting Review 80: 1233–1260.
Schoemaker, P. (1993). Multiple scenario development: Its conceptual and behavioral foundation. Strategic Management Journal 14: 193-213.
Stout. K. (2014). Remarks before the 2014 AICPA conference on current SEC and PCAOB developments. https://www.sec.gov/News/Speech/Detail/Speech/1370543613733.
Taleb, N. (2007). The black swan: The impact of the highly improbable. New York: Random House.
Toneguzzo, T. (2010). How to allocate resources based on risk. In J. Fraser and B. Simkins (eds.), Enterprise Risk Management. Hoboken, NJ: John Wiley & Sons: 189-217.
Yang, H. (2012). Capital market consequences of managers' voluntary disclosure styles. Journal of Accounting and Economics 53: 167–184.

47
TABLE 1 Industry Composition by Firm
Percentage of Sample
Sample Compustat
Consumer Non-Durables 9.48 7.12Consumer Durables 0.47 2.91Manufacturing 19.91 11.33Energy 1.42 0.96Chemicals 3.79 3.45Business Equipment 13.27 21.74Telecommunications 0.00 1.12Utilities 10.90 7.22Wholesale/Retail 16.11 13.73Healthcare 8.06 11.97Financial 3.79 6.96Other 12.80 11.49
Total 100.00 100.00

48
TABLE 2 Survey Firm Descriptives
Panel A: Job Title of Survey Respondents Count Percent Cum. Risk Manager/Dir. of ERM 55 64.71 64.71 Chief Financial Officer 7 8.24 72.94 Chief Risk Officer 6 7.06 80.00 Other 6 7.06 87.06 Treasurer/VP Finance 5 5.88 92.94 Internal Audit Head 3 3.53 96.47 General Counsel/Corp. Secretary 2 2.35 98.82 Chief Operating Officer 1 1.18 100.00 Total 85 100.00 Panel B: Risk-Based Forecasting and Planning Components Mean Median Std.Dev. Overall RBFP 0.019 -0.008 0.623 Risk Drivers -0.041 -0.244 0.866 Quant. Assess. 0.035 -0.007 0.697 Distribs. 0.313 0.000 0.465 Budgeting 0.053 0.214 0.841 Capital Invest. 0.042 -0.014 0.750 Strategy 0.066 -0.001 0.809 Panel C: Risk-Based Forecasting and Planning Correlations
Overall RBFP Risk Drivers Quant. Assess. Distribs. Budgeting Capital Invest.
Overall RBFP 1.00 Risk Drivers 0.82 1.00 Quant. Assess. 0.80 0.65 1.00 Distribs. 0.52 0.22 0.31 1.00 Budgeting 0.85 0.67 0.62 0.34 1.00 Capital Invest. 0.79 0.62 0.53 0.16 0.67 1.00 Strategy 0.80 0.61 0.60 0.18 0.61 0.70 All correlations are significant at p<0.05 All risk-based forecasting and planning variables are constructed from survey responses. Appendix A gives the underlying survey questions. Overall RBFP captures the sophistication of the overall risk-based forecasting and planning process. Risk Drivers captures the consistency with which the firm identifies risk drivers and their interdependencies and links risk management activities to these drivers. Quant Assess. captures the extent to which risk assessment criteria and thresholds are quantified and quantitative data are used in evaluating risk exposures. Distribs. is an indicator variable taking a value of one if the firm uses distributions and/or stochastic modeling techniques in developing forecasts. Budgeting measures the incorporation of risk considerations in budgeting decisions. Capital Invest. measures the incorporation of risk-related practices in project and capital investment decisions. Strategy measures the incorporation of risk appetite, tolerances, and assessments in the development and communication of strategic plans and directions. Panels B and C are based on 211 firm-year observations.
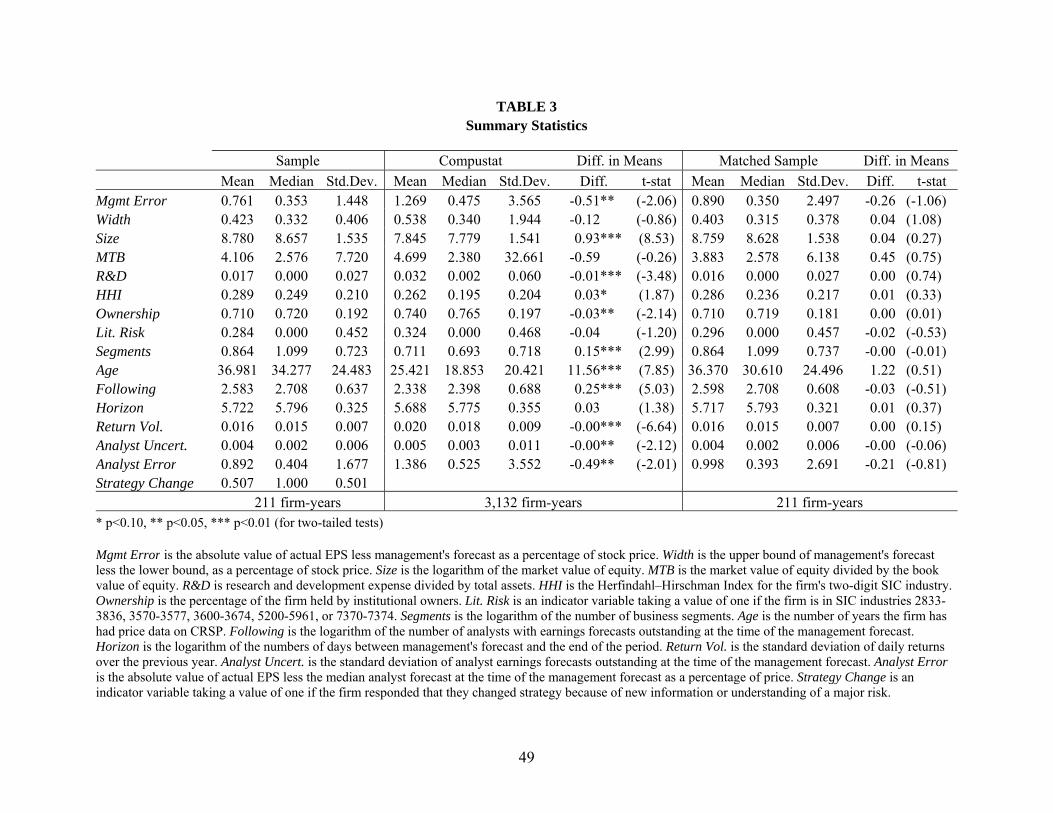
49
TABLE 3 Summary Statistics
Sample Compustat Diff. in Means Matched Sample Diff. in Means
Mean Median Std.Dev. Mean Median Std.Dev. Diff. t-stat Mean Median Std.Dev. Diff. t-stat Mgmt Error 0.761 0.353 1.448 1.269 0.475 3.565 -0.51** (-2.06) 0.890 0.350 2.497 -0.26 (-1.06) Width 0.423 0.332 0.406 0.538 0.340 1.944 -0.12 (-0.86) 0.403 0.315 0.378 0.04 (1.08) Size 8.780 8.657 1.535 7.845 7.779 1.541 0.93*** (8.53) 8.759 8.628 1.538 0.04 (0.27) MTB 4.106 2.576 7.720 4.699 2.380 32.661 -0.59 (-0.26) 3.883 2.578 6.138 0.45 (0.75) R&D 0.017 0.000 0.027 0.032 0.002 0.060 -0.01*** (-3.48) 0.016 0.000 0.027 0.00 (0.74) HHI 0.289 0.249 0.210 0.262 0.195 0.204 0.03* (1.87) 0.286 0.236 0.217 0.01 (0.33) Ownership 0.710 0.720 0.192 0.740 0.765 0.197 -0.03** (-2.14) 0.710 0.719 0.181 0.00 (0.01) Lit. Risk 0.284 0.000 0.452 0.324 0.000 0.468 -0.04 (-1.20) 0.296 0.000 0.457 -0.02 (-0.53) Segments 0.864 1.099 0.723 0.711 0.693 0.718 0.15*** (2.99) 0.864 1.099 0.737 -0.00 (-0.01) Age 36.981 34.277 24.483 25.421 18.853 20.421 11.56*** (7.85) 36.370 30.610 24.496 1.22 (0.51) Following 2.583 2.708 0.637 2.338 2.398 0.688 0.25*** (5.03) 2.598 2.708 0.608 -0.03 (-0.51) Horizon 5.722 5.796 0.325 5.688 5.775 0.355 0.03 (1.38) 5.717 5.793 0.321 0.01 (0.37) Return Vol. 0.016 0.015 0.007 0.020 0.018 0.009 -0.00*** (-6.64) 0.016 0.015 0.007 0.00 (0.15) Analyst Uncert. 0.004 0.002 0.006 0.005 0.003 0.011 -0.00** (-2.12) 0.004 0.002 0.006 -0.00 (-0.06) Analyst Error 0.892 0.404 1.677 1.386 0.525 3.552 -0.49** (-2.01) 0.998 0.393 2.691 -0.21 (-0.81) Strategy Change 0.507 1.000 0.501 211 firm-years 3,132 firm-years 211 firm-years * p<0.10, ** p<0.05, *** p<0.01 (for two-tailed tests) Mgmt Error is the absolute value of actual EPS less management's forecast as a percentage of stock price. Width is the upper bound of management's forecast less the lower bound, as a percentage of stock price. Size is the logarithm of the market value of equity. MTB is the market value of equity divided by the book value of equity. R&D is research and development expense divided by total assets. HHI is the Herfindahl–Hirschman Index for the firm's two-digit SIC industry. Ownership is the percentage of the firm held by institutional owners. Lit. Risk is an indicator variable taking a value of one if the firm is in SIC industries 2833-3836, 3570-3577, 3600-3674, 5200-5961, or 7370-7374. Segments is the logarithm of the number of business segments. Age is the number of years the firm has had price data on CRSP. Following is the logarithm of the number of analysts with earnings forecasts outstanding at the time of the management forecast. Horizon is the logarithm of the numbers of days between management's forecast and the end of the period. Return Vol. is the standard deviation of daily returns over the previous year. Analyst Uncert. is the standard deviation of analyst earnings forecasts outstanding at the time of the management forecast. Analyst Error is the absolute value of actual EPS less the median analyst forecast at the time of the management forecast as a percentage of price. Strategy Change is an indicator variable taking a value of one if the firm responded that they changed strategy because of new information or understanding of a major risk.
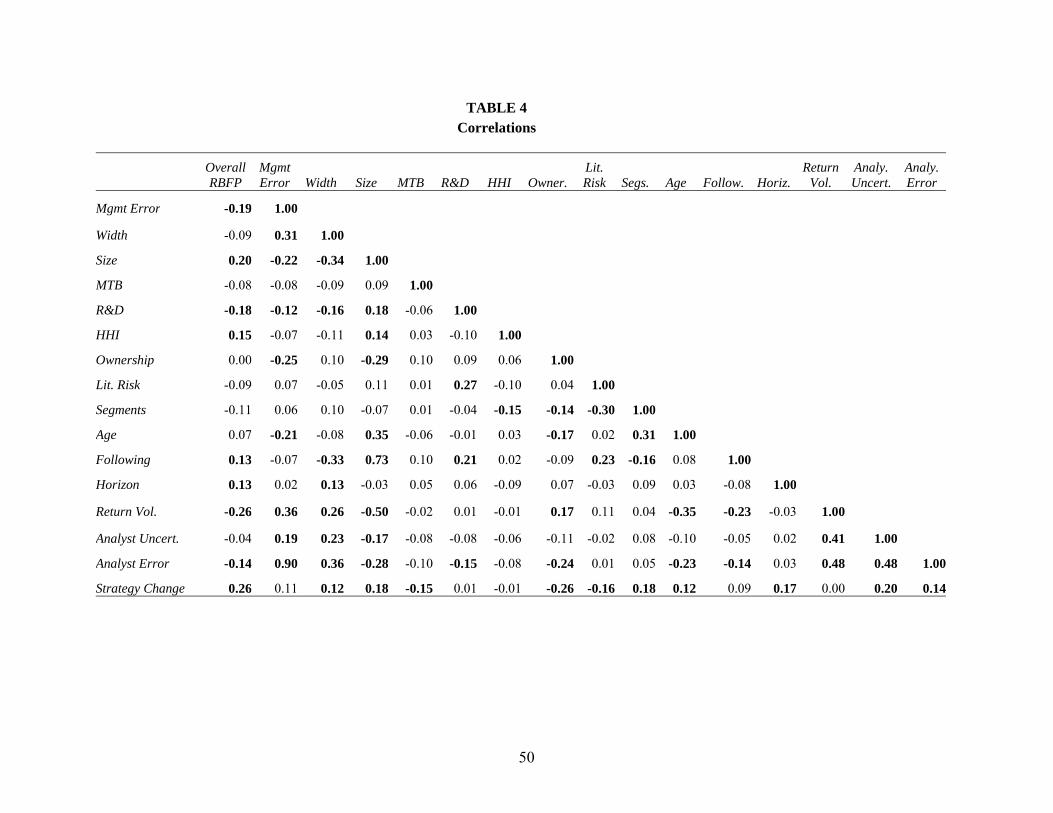
50
TABLE 4 Correlations
Overall RBFP
Mgmt Error Width Size MTB R&D HHI Owner.
Lit. Risk Segs. Age Follow. Horiz.
Return Vol.
Analy. Uncert.
Analy. Error
Mgmt Error -0.19 1.00
Width -0.09 0.31 1.00
Size 0.20 -0.22 -0.34 1.00
MTB -0.08 -0.08 -0.09 0.09 1.00
R&D -0.18 -0.12 -0.16 0.18 -0.06 1.00
HHI 0.15 -0.07 -0.11 0.14 0.03 -0.10 1.00
Ownership 0.00 -0.25 0.10 -0.29 0.10 0.09 0.06 1.00
Lit. Risk -0.09 0.07 -0.05 0.11 0.01 0.27 -0.10 0.04 1.00
Segments -0.11 0.06 0.10 -0.07 0.01 -0.04 -0.15 -0.14 -0.30 1.00
Age 0.07 -0.21 -0.08 0.35 -0.06 -0.01 0.03 -0.17 0.02 0.31 1.00
Following 0.13 -0.07 -0.33 0.73 0.10 0.21 0.02 -0.09 0.23 -0.16 0.08 1.00
Horizon 0.13 0.02 0.13 -0.03 0.05 0.06 -0.09 0.07 -0.03 0.09 0.03 -0.08 1.00
Return Vol. -0.26 0.36 0.26 -0.50 -0.02 0.01 -0.01 0.17 0.11 0.04 -0.35 -0.23 -0.03 1.00
Analyst Uncert. -0.04 0.19 0.23 -0.17 -0.08 -0.08 -0.06 -0.11 -0.02 0.08 -0.10 -0.05 0.02 0.41 1.00
Analyst Error -0.14 0.90 0.36 -0.28 -0.10 -0.15 -0.08 -0.24 0.01 0.05 -0.23 -0.14 0.03 0.48 0.48 1.00
Strategy Change 0.26 0.11 0.12 0.18 -0.15 0.01 -0.01 -0.26 -0.16 0.18 0.12 0.09 0.17 0.00 0.20 0.14

51
p<.10 in bold. Overall RBFP captures the sophistication of the overall risk-based forecasting and planning process. Appendix A gives the underlying survey questions. Mgmt Error is the absolute value of actual EPS less management's forecast as a percentage of stock price. Size is the logarithm of the market value of equity. MTB is the market value of equity divided by the book value of equity. R&D is research and development expense divided by total assets. HHI is the Herfindahl–Hirschman Index for the firm's two-digit SIC industry. Ownership is the percentage of the firm held by institutional owners. Lit. Risk is an indicator variable taking a value of one if the firm is in SIC industries 2833-3836, 3570-3577, 3600-3674, 5200-5961, or 7370-7374. Segments is the logarithm of the number of business segments. Age is the number of years the firm has had price data on CRSP. Following is the logarithm of the number of analysts with earnings forecasts outstanding at the time of the management forecast. Horizon is the logarithm of the numbers of days between management's forecast and the end of the period. Return Vol. is the standard deviation of daily returns over the previous year. Analyst Uncert. is the standard deviation of analyst earnings forecasts outstanding at the time of the management forecast. Analyst Error is the absolute value of actual EPS less the median analyst forecast at the time of the management forecast as a percentage of price. Strategy Change is an indicator variable taking a value of one if the firm responded that they changed strategy because of new information or understanding of a major risk.
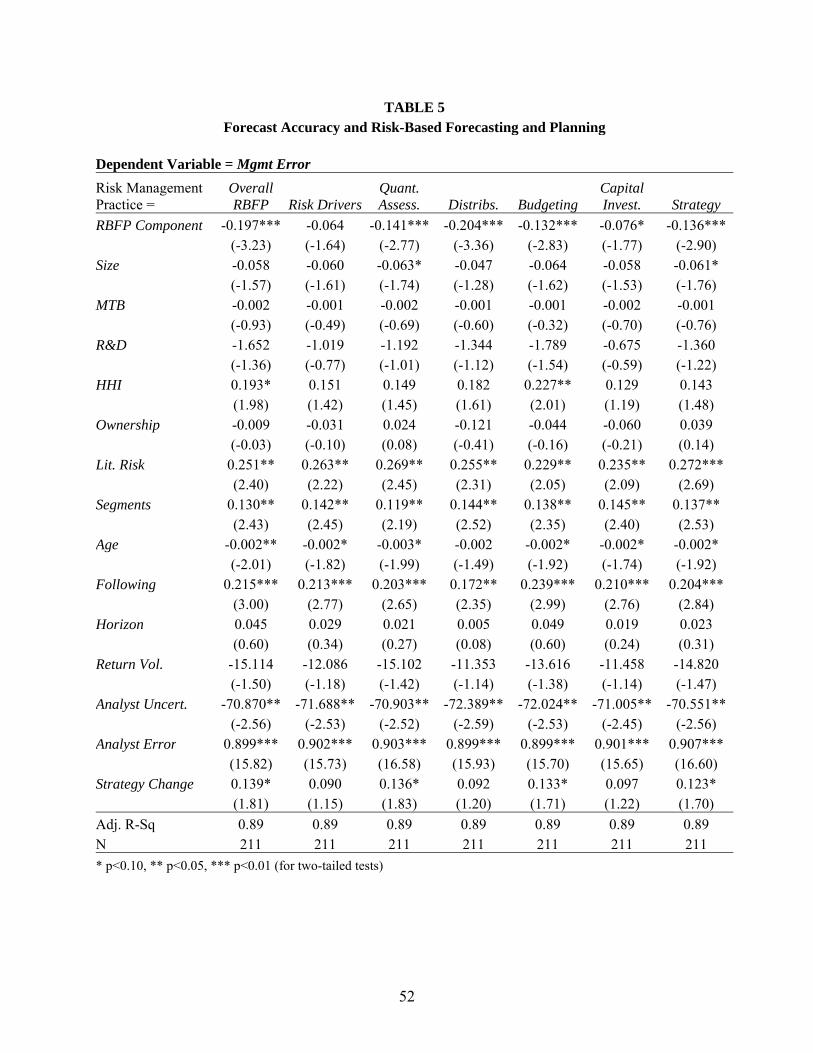
52
TABLE 5 Forecast Accuracy and Risk-Based Forecasting and Planning
Dependent Variable = Mgmt Error
Risk Management Practice =
Overall RBFP Risk Drivers
Quant. Assess. Distribs. Budgeting
Capital Invest. Strategy
RBFP Component -0.197*** -0.064 -0.141*** -0.204*** -0.132*** -0.076* -0.136*** (-3.23) (-1.64) (-2.77) (-3.36) (-2.83) (-1.77) (-2.90) Size -0.058 -0.060 -0.063* -0.047 -0.064 -0.058 -0.061* (-1.57) (-1.61) (-1.74) (-1.28) (-1.62) (-1.53) (-1.76) MTB -0.002 -0.001 -0.002 -0.001 -0.001 -0.002 -0.001 (-0.93) (-0.49) (-0.69) (-0.60) (-0.32) (-0.70) (-0.76) R&D -1.652 -1.019 -1.192 -1.344 -1.789 -0.675 -1.360 (-1.36) (-0.77) (-1.01) (-1.12) (-1.54) (-0.59) (-1.22) HHI 0.193* 0.151 0.149 0.182 0.227** 0.129 0.143 (1.98) (1.42) (1.45) (1.61) (2.01) (1.19) (1.48) Ownership -0.009 -0.031 0.024 -0.121 -0.044 -0.060 0.039 (-0.03) (-0.10) (0.08) (-0.41) (-0.16) (-0.21) (0.14) Lit. Risk 0.251** 0.263** 0.269** 0.255** 0.229** 0.235** 0.272*** (2.40) (2.22) (2.45) (2.31) (2.05) (2.09) (2.69) Segments 0.130** 0.142** 0.119** 0.144** 0.138** 0.145** 0.137** (2.43) (2.45) (2.19) (2.52) (2.35) (2.40) (2.53) Age -0.002** -0.002* -0.003* -0.002 -0.002* -0.002* -0.002* (-2.01) (-1.82) (-1.99) (-1.49) (-1.92) (-1.74) (-1.92) Following 0.215*** 0.213*** 0.203*** 0.172** 0.239*** 0.210*** 0.204*** (3.00) (2.77) (2.65) (2.35) (2.99) (2.76) (2.84) Horizon 0.045 0.029 0.021 0.005 0.049 0.019 0.023 (0.60) (0.34) (0.27) (0.08) (0.60) (0.24) (0.31) Return Vol. -15.114 -12.086 -15.102 -11.353 -13.616 -11.458 -14.820 (-1.50) (-1.18) (-1.42) (-1.14) (-1.38) (-1.14) (-1.47) Analyst Uncert. -70.870** -71.688** -70.903** -72.389** -72.024** -71.005** -70.551** (-2.56) (-2.53) (-2.52) (-2.59) (-2.53) (-2.45) (-2.56) Analyst Error 0.899*** 0.902*** 0.903*** 0.899*** 0.899*** 0.901*** 0.907*** (15.82) (15.73) (16.58) (15.93) (15.70) (15.65) (16.60) Strategy Change 0.139* 0.090 0.136* 0.092 0.133* 0.097 0.123* (1.81) (1.15) (1.83) (1.20) (1.71) (1.22) (1.70)
Adj. R-Sq 0.89 0.89 0.89 0.89 0.89 0.89 0.89 N 211 211 211 211 211 211 211
* p<0.10, ** p<0.05, *** p<0.01 (for two-tailed tests)

53
The dependent variable in all models is Mgmt Error, the absolute value of actual EPS less management's forecast as a percentage of stock price. All risk-based forecasting and planning variables are constructed from survey responses. Appendix A gives the underlying survey questions. Overall RBFP captures the sophistication of the overall risk-based forecasting and planning process. Risk Drivers captures the consistency with which the firm identifies risk drivers and their interdependencies and links risk management activities to these drivers. Quant Assess. captures the extent to which risk assessment criteria and thresholds are quantified and quantitative data are used in evaluating risk exposures. Distribs. is an indicator variable taking a value of one if the firm uses distributions and/or stochastic modeling techniques in developing forecasts. Budgeting measures the incorporation of risk considerations in budgeting decisions.Capital Invest. measures the incorporation of risk-related practices in project and capital investment decisions. Strategy measures the incorporation of risk appetite, tolerances, and assessments in the development and communication of strategic plans and directions. The control variables are defined as follows: Size is the logarithm of the market value of equity. MTB is the market value of equity divided by the book value of equity. R&D is research and development expense divided by total assets. HHI is the Herfindahl–Hirschman Index for the firm's two-digit SIC industry. Ownership is the percentage of the firm held by institutional owners. Lit. Risk is an indicator variable taking a value of one if the firm is in SIC industries 2833-3836, 3570-3577, 3600-3674, 5200-5961, or 7370-7374. Segments is the logarithm of the number of business segments. Age is the number of years a firm has had price data on CRSP. Following is the logarithm of the number of analysts with earnings forecasts outstanding at the time of the management forecast. Horizon is the logarithm of the numbers of days between management's forecast and the end of the period. Return Vol. is the standard deviation of daily returns over the previous year. Analyst Uncert. is the standard deviation of analyst earnings forecasts outstanding at the time of the management forecast. Analyst Error is the absolute value of actual EPS less the median analyst forecast at the time of the management forecast as a percentage of price. Strategy Change is an indicator variable taking a value of one if the firm responded that they changed strategy because of new information or understanding of a major risk. T-stats (in parentheses) are based on standard errors clustered at the firm-level. Year fixed effects are included.

54
TABLE 6 Changes in Forecast Accuracy and Risk-Based Forecasting and Planning
PANEL A: Indicator for post-implementation period Dependent Variable = Mgmt Error
Risk Management Practice =
Overall RBFP
Risk Drivers
Quant. Assess. Distribs. Budgeting
Capital Invest. Strategy
Post 0.019 0.018 0.031 0.050 0.027 0.027 0.029 (0.34) (0.29) (0.53) (0.71) (0.47) (0.46) (0.50) RBFP Component 0.019 0.039 0.046 -0.053 -0.005 0.027 0.007 (0.34) (0.94) (0.92) (-0.93) (-0.10) (0.60) (0.17) Post*RBFP Comp. -0.179** -0.083 -0.163** -0.129 -0.095* -0.091 -0.134** (-2.20) (-1.36) (-2.21) (-1.45) (-1.78) (-1.48) (-2.35) Controls Yes Yes Yes Yes Yes Yes Yes
Adj. R-Sq 0.92 0.92 0.92 0.92 0.92 0.92 0.92 N 411 411 411 411 411 411 411
PANEL B: Time trend post-implementation Dependent Variable = Mgmt Error
Risk Management Practice =
Overall RBFP
Risk Drivers
Quant. Assess. Distribs. Budgeting
Capital Invest. Strategy
Trend -0.003 -0.007 -0.004 0.007 -0.012 -0.001 0.018 (-0.10) (-0.24) (-0.14) (0.22) (-0.42) (-0.04) (0.56) RBFP Component 0.006 0.042 0.014 -0.079 -0.000 0.035 -0.007 (0.11) (1.04) (0.32) (-1.48) (-0.01) (0.86) (-0.18) Trend*RBFP Comp. -0.075*** -0.041** -0.049** -0.037 -0.052** -0.052** -0.054** (-2.71) (-2.02) (-2.09) (-1.23) (-2.42) (-2.31) (-2.59) Controls Yes Yes Yes Yes Yes Yes Yes
Adj. R-Sq 0.92 0.92 0.92 0.92 0.92 0.92 0.92 N 411 411 411 411 411 411 411
* p<0.10, ** p<0.05, *** p<0.01 (for two-tailed tests)
55
The dependent variable in all models is Mgmt Error, the absolute value of actual EPS less management's forecast as a percentage of stock price. Post is an indicator variable taking a value of one for fiscal years after the firm completed the survey and zero for fiscal years 2005-2007. Trend is an variable taking a value of one in the first fiscal year after the firm completed the survey and increments by one each year. Trend takes a value of zero for fiscal years 2005-2007. All risk-based forecasting and planning variables are constructed from survey responses. Appendix A gives the underlying survey questions. Overall RBFP captures the sophistication of the overall risk-based forecasting and planning process. Risk Drivers captures the consistency with which the firm identifies risk drivers and their interdependencies and links risk management activities to these drivers. Quant Assess. captures the extent to which risk assessment criteria and thresholds are quantified and quantitative data are used in evaluating risk exposures. Distribs. is an indicator variable taking a value of one if the firm uses distributions and/or stochastic modeling techniques in developing forecasts. Budgeting measures the incorporation of risk considerations in budgeting decisions. Capital Invest. measures the incorporation of risk-related practices in project and capital investment decisions. Strategy measures the incorporation of risk appetite, tolerances, and assessments in the development and communication of strategic plans and directions. Controls indicates the presence of the following control variables: Size, MTB, R&D, HHI, Ownership, Lit. Risk, Segments, Age, Following, Horizon, Return Vol., Analyst Uncert., Analyst Error, and Strategy Change. T-stats (in parentheses) are based on standard errors clustered at the firm-level. Year fixed effects are included.

56
TABLE 7 Potential Impact of Confounding Variables
Dep Var. = Mgmt Error Coeff t-Stat ITCV
Partial correlation with Mgmt Error
Partial correlation with RBFP Impact
Overall RBFP -0.197*** (-3.23) -0.214 Size -0.058 (-1.57) -0.092 0.003 0.000 MTB -0.002 (-0.93) -0.010 -0.093 0.001 R&D -1.652 (-1.36) -0.034 -0.217 0.007 HHI 0.193* (1.98) 0.053 0.120 0.006 Ownership -0.009 (-0.03) -0.022 0.085 -0.002Lit. Risk 0.251** (2.40) 0.203 -0.011 -0.002Segments 0.130** (2.43) 0.189 -0.107 -0.020Age -0.002** (-2.01) -0.092 -0.031 0.003 Following 0.215*** (3.00) 0.159 0.065 0.010 Horizon 0.045 (0.60) 0.002 0.123 0.000 Return Vol. -15.114 (-1.50) -0.093 -0.187 0.017 Analyst Uncert. -70.870** (-2.56) -0.614 0.057 -0.035Analyst Error 0.899*** (15.82) 0.923 -0.064 -0.059Strategy Change 0.139* (1.81) 0.071 0.256 0.018
Adj. R-Sq 0.89 N 211
* p<0.10, ** p<0.05, *** p<0.01 (for two-tailed tests)
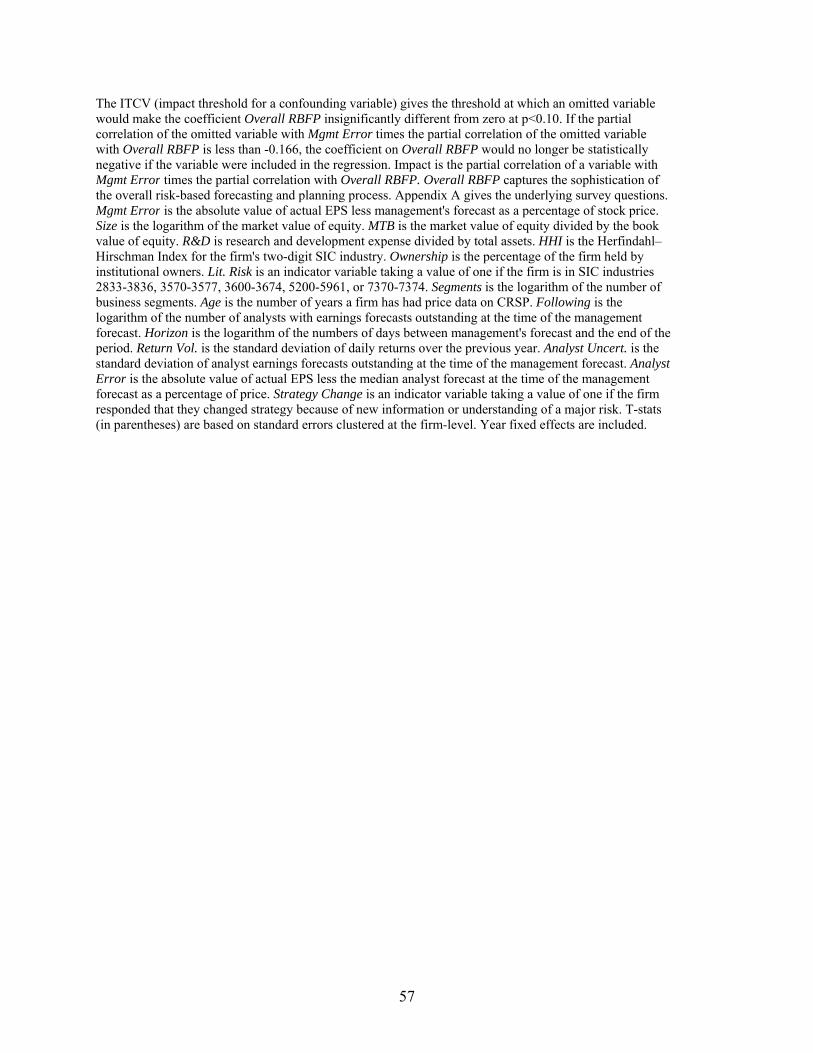
57
The ITCV (impact threshold for a confounding variable) gives the threshold at which an omitted variable would make the coefficient Overall RBFP insignificantly different from zero at p<0.10. If the partial correlation of the omitted variable with Mgmt Error times the partial correlation of the omitted variable with Overall RBFP is less than -0.166, the coefficient on Overall RBFP would no longer be statistically negative if the variable were included in the regression. Impact is the partial correlation of a variable with Mgmt Error times the partial correlation with Overall RBFP. Overall RBFP captures the sophistication of the overall risk-based forecasting and planning process. Appendix A gives the underlying survey questions. Mgmt Error is the absolute value of actual EPS less management's forecast as a percentage of stock price. Size is the logarithm of the market value of equity. MTB is the market value of equity divided by the book value of equity. R&D is research and development expense divided by total assets. HHI is the Herfindahl–Hirschman Index for the firm's two-digit SIC industry. Ownership is the percentage of the firm held by institutional owners. Lit. Risk is an indicator variable taking a value of one if the firm is in SIC industries 2833-3836, 3570-3577, 3600-3674, 5200-5961, or 7370-7374. Segments is the logarithm of the number of business segments. Age is the number of years a firm has had price data on CRSP. Following is the logarithm of the number of analysts with earnings forecasts outstanding at the time of the management forecast. Horizon is the logarithm of the numbers of days between management's forecast and the end of the period. Return Vol. is the standard deviation of daily returns over the previous year. Analyst Uncert. is the standard deviation of analyst earnings forecasts outstanding at the time of the management forecast. Analyst Error is the absolute value of actual EPS less the median analyst forecast at the time of the management forecast as a percentage of price. Strategy Change is an indicator variable taking a value of one if the firm responded that they changed strategy because of new information or understanding of a major risk. T-stats (in parentheses) are based on standard errors clustered at the firm-level. Year fixed effects are included.
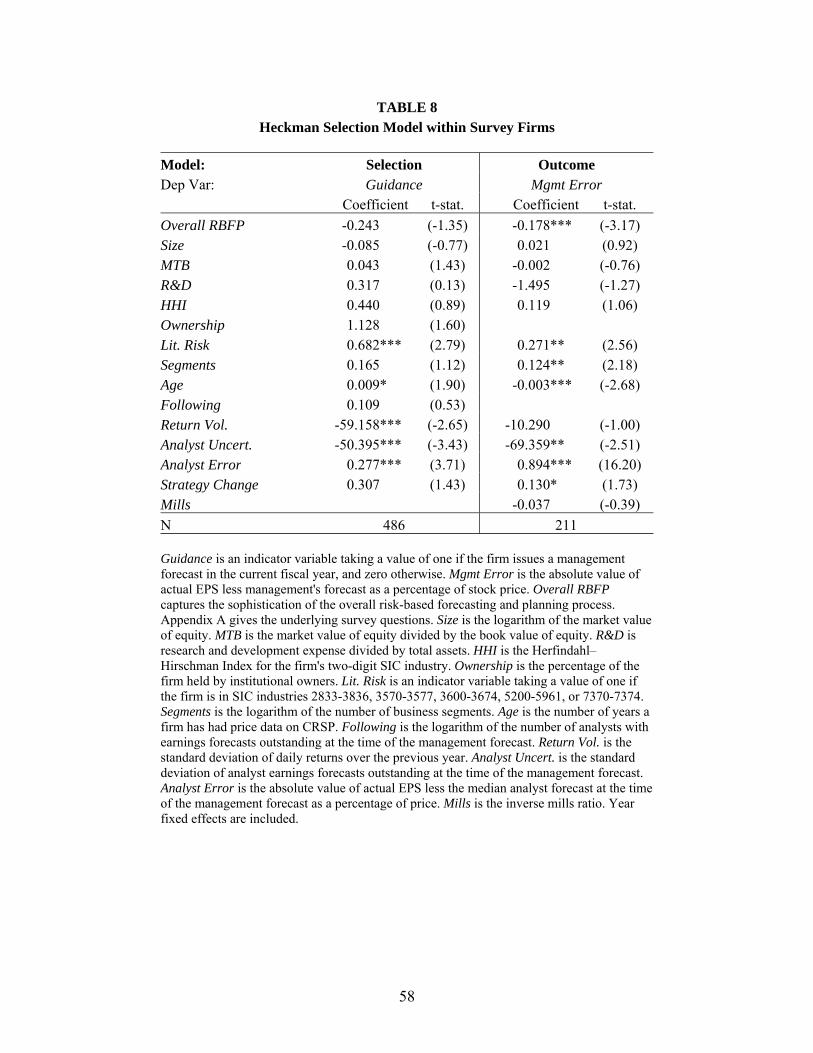
58
TABLE 8 Heckman Selection Model within Survey Firms
Model: Selection Outcome Dep Var: Guidance Mgmt Error Coefficient t-stat. Coefficient t-stat.
Overall RBFP -0.243 (-1.35) -0.178*** (-3.17) Size -0.085 (-0.77) 0.021 (0.92) MTB 0.043 (1.43) -0.002 (-0.76) R&D 0.317 (0.13) -1.495 (-1.27) HHI 0.440 (0.89) 0.119 (1.06) Ownership 1.128 (1.60) Lit. Risk 0.682*** (2.79) 0.271** (2.56) Segments 0.165 (1.12) 0.124** (2.18) Age 0.009* (1.90) -0.003*** (-2.68) Following 0.109 (0.53) Return Vol. -59.158*** (-2.65) -10.290 (-1.00) Analyst Uncert. -50.395*** (-3.43) -69.359** (-2.51) Analyst Error 0.277*** (3.71) 0.894*** (16.20) Strategy Change 0.307 (1.43) 0.130* (1.73) Mills -0.037 (-0.39)
N 486 211 Guidance is an indicator variable taking a value of one if the firm issues a management forecast in the current fiscal year, and zero otherwise. Mgmt Error is the absolute value of actual EPS less management's forecast as a percentage of stock price. Overall RBFP captures the sophistication of the overall risk-based forecasting and planning process. Appendix A gives the underlying survey questions. Size is the logarithm of the market value of equity. MTB is the market value of equity divided by the book value of equity. R&D is research and development expense divided by total assets. HHI is the Herfindahl–Hirschman Index for the firm's two-digit SIC industry. Ownership is the percentage of the firm held by institutional owners. Lit. Risk is an indicator variable taking a value of one if the firm is in SIC industries 2833-3836, 3570-3577, 3600-3674, 5200-5961, or 7370-7374. Segments is the logarithm of the number of business segments. Age is the number of years a firm has had price data on CRSP. Following is the logarithm of the number of analysts with earnings forecasts outstanding at the time of the management forecast. Return Vol. is the standard deviation of daily returns over the previous year. Analyst Uncert. is the standard deviation of analyst earnings forecasts outstanding at the time of the management forecast. Analyst Error is the absolute value of actual EPS less the median analyst forecast at the time of the management forecast as a percentage of price. Mills is the inverse mills ratio. Year fixed effects are included.

59
TABLE 9 Forecast Width and Risk-Based Forecasting and Planning
Dependent Variable = Width
Risk Management Practice =
RBFP w/o Distribs. Risk Drivers
Quant. Assess. Budgeting
Capital Invest. Strategy
Distribs. 0.016 0.030 0.030 0.082 0.002 0.004 (0.18) (0.35) (0.36) (0.72) (0.03) (0.05) RBFP Component -0.148** -0.062 -0.127* -0.108** -0.111** -0.094* (-2.49) (-1.54) (-1.93) (-2.40) (-2.56) (-1.69) Distribs.*RBFP Comp. 0.227** 0.130 0.165 0.012 0.249** 0.208** (2.20) (1.35) (1.62) (0.13) (2.57) (2.03) Size 0.003 0.005 -0.004 0.001 0.007 0.013 (0.08) (0.14) (-0.10) (0.03) (0.18) (0.33) MTB -0.004 -0.003 -0.003 -0.002 -0.004 -0.004 (-0.98) (-0.76) (-0.78) (-0.52) (-1.03) (-0.97) R&D -1.908* -1.670 -1.504 -2.165** -1.303 -2.010* (-1.82) (-1.65) (-1.41) (-1.99) (-1.27) (-1.79) HHI -0.156 -0.161 -0.123 -0.101 -0.176 -0.229 (-0.96) (-0.97) (-0.76) (-0.61) (-1.09) (-1.43) Ownership 0.574* 0.517* 0.546* 0.517* 0.512* 0.603* (1.82) (1.67) (1.73) (1.72) (1.68) (1.91) Lit. Risk 0.028 0.046 0.036 0.027 0.020 0.017 (0.34) (0.54) (0.41) (0.32) (0.25) (0.18) Segments 0.036 0.029 0.013 0.014 0.050 0.043 (0.60) (0.49) (0.21) (0.20) (0.84) (0.74) Age 0.000 0.000 0.000 -0.000 0.001 0.000 (0.20) (0.19) (0.24) (-0.05) (0.35) (0.12) Following -0.128 -0.147* -0.149* -0.133 -0.138 -0.148* (-1.64) (-1.93) (-1.96) (-1.55) (-1.65) (-1.92) Horizon 0.094 0.084 0.090 0.111* 0.076 0.079 (1.55) (1.29) (1.51) (1.77) (1.38) (1.36) Return Vol. -1.466 0.638 -2.532 -1.203 -0.207 0.302 (-0.14) (0.06) (-0.26) (-0.11) (-0.02) (0.03) Analyst Uncert. 1.592 1.161 2.080 2.343 2.185 0.429 (0.18) (0.14) (0.24) (0.26) (0.25) (0.05) Analyst Error 0.078** 0.076** 0.080*** 0.075** 0.075** 0.082*** (2.61) (2.49) (2.67) (2.54) (2.59) (2.67) Strategy Change 0.130* 0.098 0.124* 0.147* 0.129* 0.122 (1.73) (1.35) (1.68) (1.92) (1.72) (1.59)
Adj. R-Sq 0.24 0.23 0.23 0.24 0.25 0.24 N 211 211 211 211 211 211
* p<0.10, ** p<0.05, *** p<0.01 (for two-tailed tests)

60
The dependent variable in all models is Width, the upper bound of management's forecast less the lower bound, as a percentage of stock price. All risk-based forecasting and planning variables are constructed from survey responses. Appendix A gives the underlying survey questions. Distribs. is an indicator variable taking a value of one if the firm uses distributions and/or stochastic modeling techniques in developing forecasts. Risk Drivers captures the consistency with which the firm identifies risk drivers and their interdependencies and links risk management activities to these drivers. Quant Assess. captures the extent to which risk assessment criteria and thresholds are quantified and quantitative data are used in evaluating risk exposures. Budgeting measures the incorporation of risk considerations in budgeting decisions. Capital Invest. measures the incorporation of risk-related practices in project and capital investment decisions. Strategy measures the incorporation of risk appetite, tolerances, and assessments in the development and communication of strategic plans and directions. The control variables are defined as follows: Size is the logarithm of the market value of equity. MTB is the market value of equity divided by the book value of equity. R&D is research and development expense divided by total assets. HHI is the Herfindahl–Hirschman Index for the firm's two-digit SIC industry. Ownership is the percentage of the firm held by institutional owners. Lit. Risk is an indicator variable taking a value of one if the firm is in SIC industries 2833-3836, 3570-3577, 3600-3674, 5200-5961, or 7370-7374. Segments is the logarithm of the number of business segments. Age is the number of years a firm has had price data on CRSP. Following is the logarithm of the number of analysts with earnings forecasts outstanding at the time of the management forecast. Horizon is the logarithm of the numbers of days between management's forecast and the end of the period. Return Vol. is the standard deviation of daily returns over the previous year. Analyst Uncert.is the standard deviation of analyst earnings forecasts outstanding at the time of the management forecast. Analyst Error is the absolute value of actual EPS less the median analyst forecast at the time of the management forecast as a percentage of price. Strategy Change is an indicator variable taking value of one if the firm responded that they changed strategy because of new information or understanding of a major risk. T-stats (in parentheses) are based on standard errors clustered at the firm-level. Year fixed effects are included.
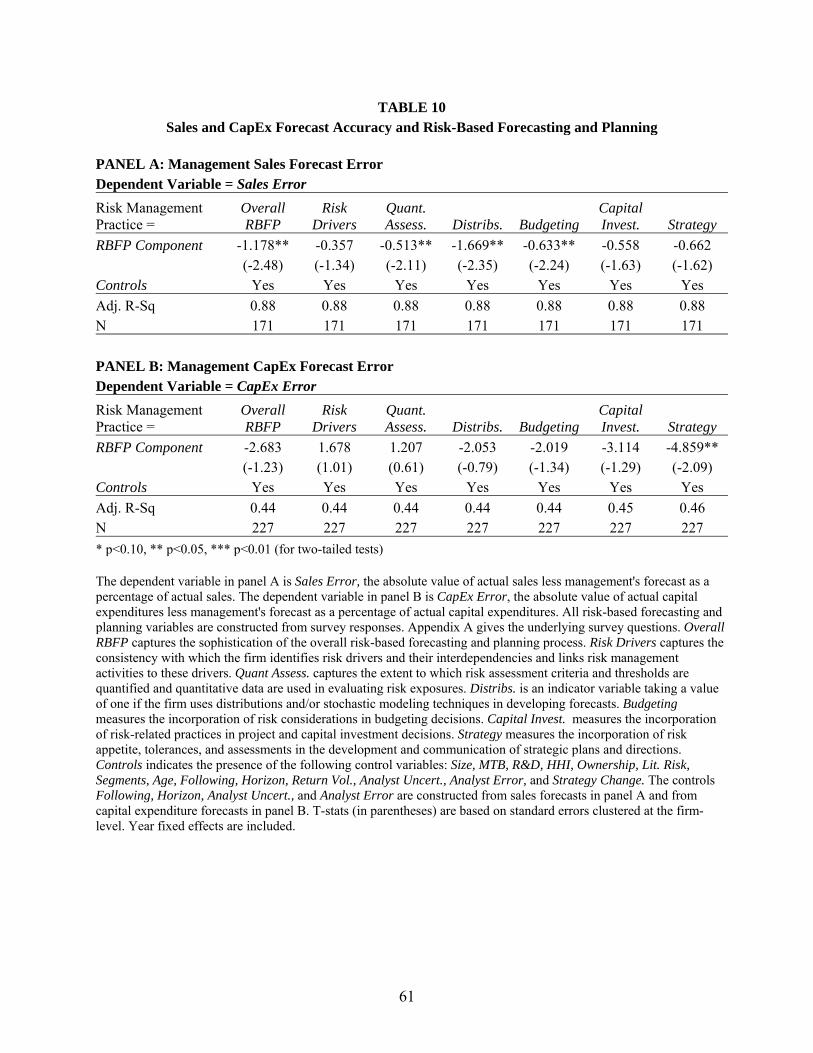
61
TABLE 10 Sales and CapEx Forecast Accuracy and Risk-Based Forecasting and Planning
PANEL A: Management Sales Forecast Error Dependent Variable = Sales Error
Risk Management Practice =
Overall RBFP
Risk Drivers
Quant. Assess. Distribs. Budgeting
Capital Invest. Strategy
RBFP Component -1.178** -0.357 -0.513** -1.669** -0.633** -0.558 -0.662 (-2.48) (-1.34) (-2.11) (-2.35) (-2.24) (-1.63) (-1.62) Controls Yes Yes Yes Yes Yes Yes Yes
Adj. R-Sq 0.88 0.88 0.88 0.88 0.88 0.88 0.88 N 171 171 171 171 171 171 171
PANEL B: Management CapEx Forecast Error Dependent Variable = CapEx Error
Risk Management Practice =
Overall RBFP
Risk Drivers
Quant. Assess. Distribs. Budgeting
Capital Invest. Strategy
RBFP Component -2.683 1.678 1.207 -2.053 -2.019 -3.114 -4.859** (-1.23) (1.01) (0.61) (-0.79) (-1.34) (-1.29) (-2.09) Controls Yes Yes Yes Yes Yes Yes Yes
Adj. R-Sq 0.44 0.44 0.44 0.44 0.44 0.45 0.46 N 227 227 227 227 227 227 227
* p<0.10, ** p<0.05, *** p<0.01 (for two-tailed tests) The dependent variable in panel A is Sales Error, the absolute value of actual sales less management's forecast as a percentage of actual sales. The dependent variable in panel B is CapEx Error, the absolute value of actual capital expenditures less management's forecast as a percentage of actual capital expenditures. All risk-based forecasting and planning variables are constructed from survey responses. Appendix A gives the underlying survey questions. Overall RBFP captures the sophistication of the overall risk-based forecasting and planning process. Risk Drivers captures the consistency with which the firm identifies risk drivers and their interdependencies and links risk management activities to these drivers. Quant Assess. captures the extent to which risk assessment criteria and thresholds are quantified and quantitative data are used in evaluating risk exposures. Distribs. is an indicator variable taking a value of one if the firm uses distributions and/or stochastic modeling techniques in developing forecasts. Budgeting measures the incorporation of risk considerations in budgeting decisions. Capital Invest. measures the incorporation of risk-related practices in project and capital investment decisions. Strategy measures the incorporation of risk appetite, tolerances, and assessments in the development and communication of strategic plans and directions. Controls indicates the presence of the following control variables: Size, MTB, R&D, HHI, Ownership, Lit. Risk, Segments, Age, Following, Horizon, Return Vol., Analyst Uncert., Analyst Error, and Strategy Change. The controls Following, Horizon, Analyst Uncert., and Analyst Error are constructed from sales forecasts in panel A and from capital expenditure forecasts in panel B. T-stats (in parentheses) are based on standard errors clustered at the firm-level. Year fixed effects are included.