Risk Assessment Ke 00 Sacr
202
SJVDP Reports Library ^^-^-^ ^ Rm W-2212 ID No. -^J"^ a/^O/^ ^^t^^^ RISK '' KESTERSON PROGRAM U.S. Bureau of Reclamation Mid-Pacific Region NOVEMBER 1986
-
Upload
william-butler -
Category
Documents
-
view
221 -
download
0
Transcript of Risk Assessment Ke 00 Sacr

8/4/2019 Risk Assessment Ke 00 Sacr
http://slidepdf.com/reader/full/risk-assessment-ke-00-sacr 1/202
SJVDP Reports Library ^^-^-^ ^Rm W-2212 ID No. -^J"^
a/^O/^
^^t^^^ RISK ASSESSMENT ''
KESTERSONPROGRAM
U.S. Bureau of Reclamation
Mid-Pacific Region
NOVEMBER 1986

8/4/2019 Risk Assessment Ke 00 Sacr
http://slidepdf.com/reader/full/risk-assessment-ke-00-sacr 2/202

8/4/2019 Risk Assessment Ke 00 Sacr
http://slidepdf.com/reader/full/risk-assessment-ke-00-sacr 3/202
Oa
Ko,%K
^^̂/,^
RISK ASSESSMENT
KESTERSON PROGRAM
Submitted to
U.S. Bureau of Reclamation, Mid-Pacific Region
Prepared By
CH2M HILL3840 Rosin Court, Suite 110
Sacramento, California 95834
Jones & Stokes Associates1725 23rd Street
Sacramento, California 95816
November 1986
M19551.S0
SAT72/41

8/4/2019 Risk Assessment Ke 00 Sacr
http://slidepdf.com/reader/full/risk-assessment-ke-00-sacr 4/202

8/4/2019 Risk Assessment Ke 00 Sacr
http://slidepdf.com/reader/full/risk-assessment-ke-00-sacr 5/202
CONTENTS
Page
SummaryS-1
Approach 1-1
Introduction 1-1
Contamination Evaluation 1-1
Exposure Assessment 1-1
Toxicity Assessment 1-2
Risk Characterization 1-3
Contamination Evaluation 2-1
Introduction 2-1
Past Water Contaminant Concentrations 2-1
Present Soil and Water Supply Concen-
trations 2-9
Biota 2-9
Identification of Constituents for
Risk Characterization 2-18
Exposure Assessment 3-1
Introduction 3-1
Cleanup Alternatives 3-1
Selenium Biogeochemistry 3-2
Exposure Pathways 3-3
Exposed Populations 3-4
Estimates of Trophic Relationships 3-10
Adaptation for Risk Assessment 3-10
Toxicology of Selenium 4-1
Introduction 4-1
Environmental Sources 4-1
Birds 4-1
Mammals 4-5
Fish 4-6
Risk Characterization 5-1
Introduction 5-1
Kesterson Monte Carlo Model 5-1
Discussion 5-2
References 6-1
Appendix A. Kesterson Reservoir WildlifeSpecies List
SAT72/85

8/4/2019 Risk Assessment Ke 00 Sacr
http://slidepdf.com/reader/full/risk-assessment-ke-00-sacr 6/202

8/4/2019 Risk Assessment Ke 00 Sacr
http://slidepdf.com/reader/full/risk-assessment-ke-00-sacr 7/202
TABLESPage
S-1 Percent of Diet Selenium Predictions that are
Below Estimated Harmful Levels for Each KeySpecies and for Each Cleanup Alternative S-7
2-1 Water Quality Guidelines and Criteria forSWRCB Drain Water Constituents of Concern 2-2
2-2 San Luis Drain Constituents of Concern at
Check 2 2-3
2-3 Kesterson Reservoir Constituents of Concern atSurface Water Sites 2-4
2-4 Kesterson Reservoir Groundwater Summary forConstituents of Concern 2-7
2-5 Summary of Soil Concentrations of Constituentsof Concern 2-10
2-6 Quality of Groundwater to be Applied to
Kesterson Reservoir under FRP 2-112-7 Selenium Concentrations in Composite Samples
of Invertebrates, May 1983 2-132-8 Summary of Frequencies of Mortality and
Deformities in Embryos and Chicks of AquaticBirds Nesting at Kesterson Reservoir, 1983-85 2-15
2-9 Selenium Concentrations in Livers and WholeBodies of Abundant Small Mammal Species fromKesterson Reservoir and Volta Wildlife Area(Preliminary Data) 2-17
2-10 Summary of Contaminant Levels in KestersonReservoir Media 2-19
3-1 Kesterson Bird Populations and Mortalities 3-8
3-2 Summary of Data Used to Derive Transfer Factors 3-213-3 Transfer and Diet Factors for Simplified
Selenium Transfer Diagram for Mallard,American Coot, Tricolored Blackbird, and
Black-Necked Stilt 3-22
3-4 Transfer and Diet Factors for SimplifiedSelenium Transfer Diagram for Eared Grebeand Mosquitofish 3-23
3-5 Transfer and Diet Factors for SimplifiedSelenium Transfer Diagram for San Joaquin
Valley Kit Fox 3-24
4-1 Summary of Dose-Response Reported for AvianSpecies 4-2
5-1 Percent of Diet Selenium Predictions that arebelow Harmful Levels for Each Key Speciesand for Each Cleanup Alternative 5-
SAT72/85

8/4/2019 Risk Assessment Ke 00 Sacr
http://slidepdf.com/reader/full/risk-assessment-ke-00-sacr 8/202

8/4/2019 Risk Assessment Ke 00 Sacr
http://slidepdf.com/reader/full/risk-assessment-ke-00-sacr 9/202
FIGURESPa£e
S-1 Probability Distribution of Predictions ofSelenium Concentration in Receptor SpeciesDiet for the Flexible Response Plan 5-3
S-2 Probability Distribution of Predictions of
Selenium Concentration in Receptor SpeciesDiet for the Flexible Response Plan—Onsite-1 5-4
S-3 Probability Distribution of Predictions ofSelenium Concentration in Receptor SpeciesDiet for the Flexible Response Plan—Onsite-2 5-5
3-1 Kesterson Reservoir Selenium Transfer DiagramAdult Female Mallard 3-11
3-2 Kesterson Reservoir Selenium Transfer DiagramAdult Coot 3-12
3-3 Kesterson Reservoir Selenium Transfer DiagramTricolored Blackbird (through Fledgling) 3-13
3-4 Kesterson Reservoir Selenium Transfer DiagramBlack-Necked Stilt 3-14
3-5 Kesterson Reservoir Selenium Transfer DiagramMosquitofish and Eared Grebe 3-15
3-6 Kesterson Reservoir Selenium Transfer DiagramKit Fox 3-16
3-7 Simplified Selenium Transfer Diagram with Keyto Transfer and Diet Factors 3-17
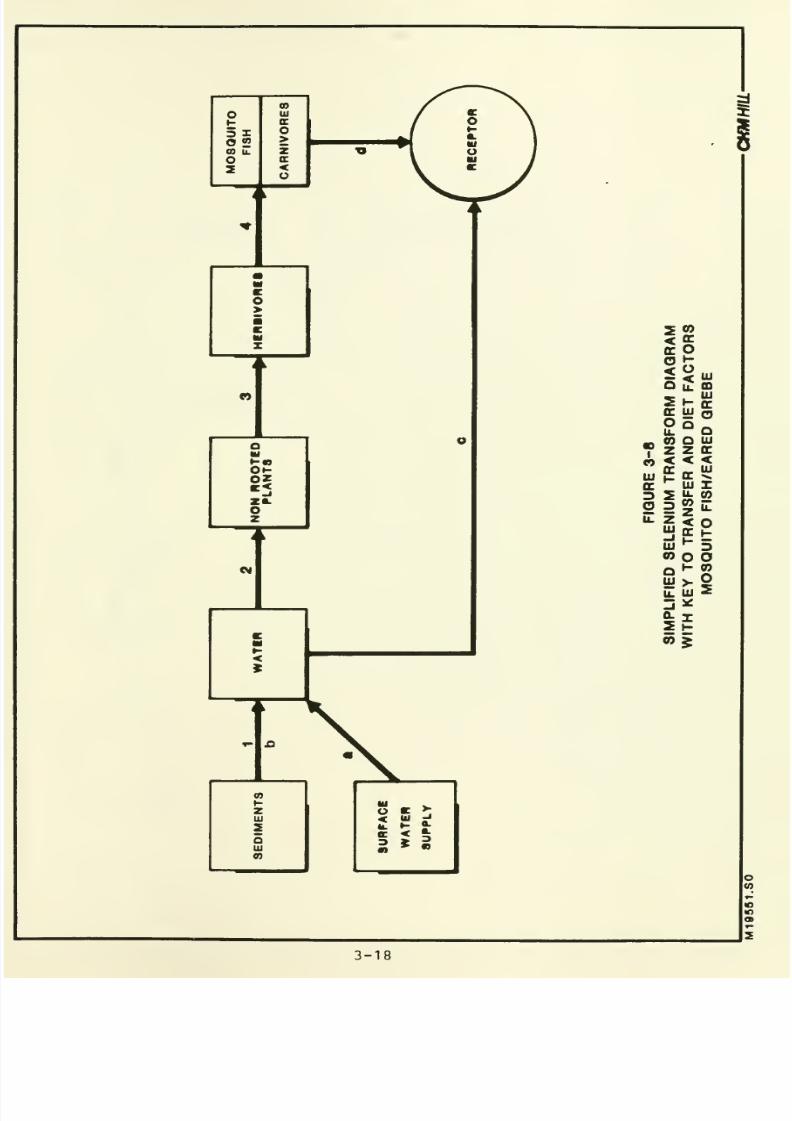
3-8 Simplified Selenium Transfer Diagram with Keyto Transfer and Diet Factors—Mosquitofish/Eared Grebe 3-18
3-9 Simplified Selenium Transfer Diagram with Key
to Transfer and Diet Factors—Kit Fox 3-19
5-1 Probability Distribution of Predictions ofSelenium Concentration in Receptor SpeciesDiet for the Flexible Response Plan 5-3
5-2 Probability Distribution of Predictions ofSelenium Concentration in Receptor SpeciesDiet for the Flexible Response Plan—Onsite-1 5-4
5-3 Probability Distribution of Predictions ofSelenium Concentration in Receptor SpeciesDiet for the Flexible Response Plan—Onsite-2 5-5
5-4 Probability Distribution of Predictions of
Selenium Concentration in Receptor SpeciesDiet for the Flexible Response Plan—AmericanCoot 5-6
5-5 Probability Distribution of Predictions ofSelenium Concentration in Receptor SpeciesDiet for the Flexible Response Plan—Mallard 507
5-6 Probability Distribution of Predictions ofSelenium Concentration in Receptor SpeciesDiet for the Flexible Response PlanBlack-Necked Stilt 5-8
SAT72/85

8/4/2019 Risk Assessment Ke 00 Sacr
http://slidepdf.com/reader/full/risk-assessment-ke-00-sacr 10/202

8/4/2019 Risk Assessment Ke 00 Sacr
http://slidepdf.com/reader/full/risk-assessment-ke-00-sacr 11/202
FIGURES (Cont'd)Page
5-7 Probability Distribution of Predictions ofSelenium Concentration in Receptor SpeciesDiet for the Flexible Response PlanTricolored Blackbird 5-9
5-8 Probability Distribution of Predictions ofSelenium Concentration in Receptor SpeciesDiet for the Flexible Response PlanMosquitofish 5-10
5-9 Probability Distribution of Predictions ofSelenium Concentration in Receptor SpeciesDiet for the Flexible Response Plan—EaredGrebe 5-11
5-10 Probability Distribution of Predictions ofSelenium Concentration in Receptor SpeciesDiet for the Flexible Response PlanSan Joaquin Valley Kit Fox 5-12
5-11 Probability of Selenium Concentration inReceptor Diet Being Less than 3 mg/kg vs.Residual Soil Selenium Concentration 5-16
5-12 Cost vs. Diet Selenixim Concentration forAlternative Cleanup Plans 5-18
5-13 Costs of Alternative Cleanup Plans vs.
Soil and Diet Selenium 5-19
SAT72/85

8/4/2019 Risk Assessment Ke 00 Sacr
http://slidepdf.com/reader/full/risk-assessment-ke-00-sacr 12/202

8/4/2019 Risk Assessment Ke 00 Sacr
http://slidepdf.com/reader/full/risk-assessment-ke-00-sacr 13/202
SUMMARY
This risk assessment of Kesterson Reservoir (KR) cleanupalternatives consists of four elements:
o Contamination evaluation and determination of con-
taminants of concern
o Analysis of exposure pathways, identification of
key species, and estimates of contaminant transferbetween pathway components
o Review of toxicological properties of contaminantsof concern for key species
o Risk characterization, including the range of mag-nitude of expected exposure and the likelihood of
such exposure occurring for each cleanup alterna-tive
Review of information related to past and present contamina-tion at KR indicates that selenium is a major contaminant of
concern because, in the past, it has exceeded water qualityguidelines and criteria, has accumulated in KR soils, has
migrated into the groundwater in some locations, and has
been linked experimentally and observationally to wildlifeeffects
.
Other identified constituents of possible concern which have
exceeded water quality guidelines and criteria include boron,
chromium, molybdenum, mercury, salts, and zinc. Chromium,mercury, molybdenum, and zinc are not of concern because
these constituents neither appear in KR soils above back- v| ^
ground concentrations, nor exceed guidelines and criteria ^C)
for KR groundwater supplies. TDS is not of concern because"
no evidence exists that TDS concentrations in groundwater \V
supplies will cause adverse wildlife effects in KR. Boron
is not of concern because no existing evidence has linked
boron to observed KR wildlife effects; such evidence does
exist for selenium.
Three cleanup alternatives were analyzed in detail: the
Flexible Response Plan (FRP) , the Onsite Disposal Plan-1(excavating about 450,000 cubic yards), and the Onsite Dis-
posal Plan-2 (excavating about 1,000,000 cubic yards).
Potential exposure pathways, resulting from implementationof these alternatives, to residual contamination at KRinclude food chain or ingestion, direct contact and absorp-tion, and air migration and inhalation. Populations poten-tially exposed to contamination via these pathways include
human populations (foragers, adjacent residents, workers and
SAT74/38 S-1
^ij

8/4/2019 Risk Assessment Ke 00 Sacr
http://slidepdf.com/reader/full/risk-assessment-ke-00-sacr 14/202
8/4/2019 Risk Assessment Ke 00 Sacr
http://slidepdf.com/reader/full/risk-assessment-ke-00-sacr 15/202
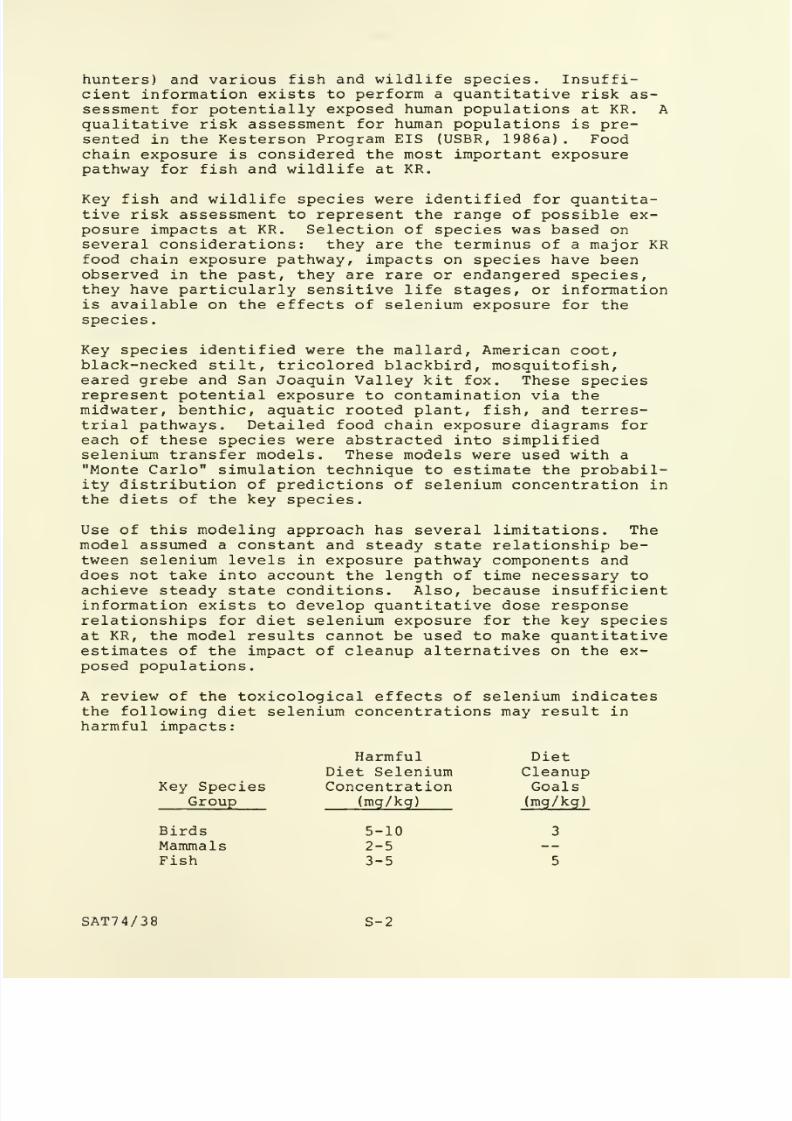
hunters) and various fish and wildlife species. Insuffi-cient information exists to perform a quantitative risk as-sessment for potentially exposed human populations at KR. Aqualitative risk assessment for human populations is pre-sented in the Kesterson Program EIS (USER, 1986a) . Foodchain exposure is considered the most important exposurepathway for fish and wildlife at KR.
Key fish and wildlife species were identified for quantita-tive risk assessment to represent the range of possible ex-posure impacts at KR. Selection of species was based onseveral considerations: they are the terminus of a major KRfood chain exposure pathway, impacts on species have beenobserved in the past, they are rare or endangered species,they have particularly sensitive life stages, or informationis available on the effects of selenium exposure for thespecies
.
Key species identified were the mallard, American coot,
black-necked stilt, tricolored blackbird, mosquitofish,eared grebe and San Joaquin Valley kit fox. These speciesrepresent potential exposure to contamination via themidwater, benthic, aquatic rooted plant, fish, and terres-trial pathways. Detailed food chain exposure diagrams foreach of these species were abstracted into simplifiedselenium transfer models. These models were used with a
"Monte Carlo" simulation technique to estimate the probabil-ity distribution of predictions of selenium concentration inthe diets of the key species.
Use of this modeling approach has several limitations. The
model assumed a constant and steady state relationship be-tween selenium levels in exposure pathway components anddoes not take into account the length of time necessary to
achieve steady state conditions. Also, because insufficientinformation exists to develop quantitative dose responserelationships for diet selenium exposure for the key species
at KR, the model results cannot be used to make quantitativeestimates of the impact of cleanup alternatives on the ex-
posed populations.
A review of the toxicological effects of selenium indicatesthe following diet selenium concentrations may result in
harmful impacts:
Harmful DietDiet Selenium Cleanup
Key Species Concentration GoalsGroup (mg/kg) (mg/kg)
Birds 5-10 3
Mammals 2-5 —Fish 3-5 5
SAT74/38 S-2

8/4/2019 Risk Assessment Ke 00 Sacr
http://slidepdf.com/reader/full/risk-assessment-ke-00-sacr 16/202

8/4/2019 Risk Assessment Ke 00 Sacr
http://slidepdf.com/reader/full/risk-assessment-ke-00-sacr 17/202
These harmful effect ranges are different than cleanup goalsbecause they represent the range of selenium concentrationswhere harmful effects have been observed rather than moreconservative cleanup goals.
The harmful effect levels and cleanup goals are compared tothe model predictions of diet selenium levels to evaluate
the potential for success of the alternative cleanup plans.Figures S-1 through S-3 and Table S-1 show the results.
The risk characterization does not indicate that any of theplans will clearly fail. For avian species, the results forthe FRP show that 40 to 65 percent of the diet selenium pre-dictions show levels below the harmful effect range. TheOnsite Disposal Plan-1 shows a greater frequency of belowharmful effect predictions, 65 to 90 percent. The OnsiteDisposal Plan-2 results in the highest frequency of belowharmful effect predictions, 85 to 95 percent.
The risk characterization results show that each of theplans may present some risks to wildlife. Based on themethods and assumptions used for the risk characterization,predicted risks are greatest for the FRP, less for Onsite 1,and least for Onsite 2.
Termination of drainwater flow and implementation of the FRPmay reduce avian diet selenium concentrations to 8 mg/kg(below the top of the harmful effects range) at a relativelylow first-year cost ($2.5 million); 50 percent of the dietselenium predictions indicate this result. Increased expen-ditures ($20 million in first-year costs) for the Onsite
Disposal Plan-1 may reduce avian diet selenium concentrationsto 4 mg/kg (below the bottom of the harmful effects range)
,
as indicated by 50 percent of the predictions. Greater ex-penditures ($40 million in first-year costs) for the OnsiteDisposal Plan-2 may reduce avian diet selenium concentrationsto 2.5 mg/kg (below the cleanup goal of 3 mg/kg) as indi-cated by 50 percent of the predictions. To achieve a
greater probability (90 to 95 percent) that the cleanupgoal of 3 mg/kg will be achieved, further excavation of KRwould be necessary, at a cost of up to $144 million.
SAT74/38 S-3

8/4/2019 Risk Assessment Ke 00 Sacr
http://slidepdf.com/reader/full/risk-assessment-ke-00-sacr 18/202

8/4/2019 Risk Assessment Ke 00 Sacr
http://slidepdf.com/reader/full/risk-assessment-ke-00-sacr 19/202
<-J
Q.
LU
CO
OQ.
CO
LU
DC
LU_l
CO
XLU
o

8/4/2019 Risk Assessment Ke 00 Sacr
http://slidepdf.com/reader/full/risk-assessment-ke-00-sacr 20/202

8/4/2019 Risk Assessment Ke 00 Sacr
http://slidepdf.com/reader/full/risk-assessment-ke-00-sacr 21/202

8/4/2019 Risk Assessment Ke 00 Sacr
http://slidepdf.com/reader/full/risk-assessment-ke-00-sacr 22/202

8/4/2019 Risk Assessment Ke 00 Sacr
http://slidepdf.com/reader/full/risk-assessment-ke-00-sacr 23/202

8/4/2019 Risk Assessment Ke 00 Sacr
http://slidepdf.com/reader/full/risk-assessment-ke-00-sacr 24/202

8/4/2019 Risk Assessment Ke 00 Sacr
http://slidepdf.com/reader/full/risk-assessment-ke-00-sacr 25/202

8/4/2019 Risk Assessment Ke 00 Sacr
http://slidepdf.com/reader/full/risk-assessment-ke-00-sacr 26/202
8/4/2019 Risk Assessment Ke 00 Sacr
http://slidepdf.com/reader/full/risk-assessment-ke-00-sacr 27/202
Chapter 1
APPROACH
INTRODUCTION
The overall objective of this risk assessment is to provide,to the extent feasible with existing information, a quantita-tive analysis of the magnitude and uncertainty of estimatesof potential adverse impacts on fish, wildlife, and humanpopulations that may result from implementation of KestersonReservoir (KR) cleanup alternatives.
The risk assessment contains the following components:
o Contamination evaluation and determination of con-taminants of concern
oAnalysis of exposure pathways, identification ofkey species, and estimates of transfer factorsbetween pathway components
o Review of toxicological properties of contaminantsof concern for key species
o Risk characterization, including the range of mag-nitude of expected exposure and the likelihood ofsuch exposure occurring for each disposal alterna-tive
CONTAMINATION EVALUATION
The purpose of the contamination evaluation is to determinepotential constituents of concern and the extent of theirdistribution at KR. Previous contamination evaluations forKR are reviewed and summarized. This evaluation includes areview of existing literature for evidence of the effects ofcontaminants at KR.
EXPOSURE ASSESSMENT
The objectives of this component are to identify the majorcontamination exposure pathways at KR; the key fish, wild-life, and human populations which are receptors of contami-nation from these pathways; the size of the exposed popu-lations; and to estimate transfer factors and their uncer-tainties, which describe contamination transport betweenexposure pathway components.
SAT72/25 1-1

8/4/2019 Risk Assessment Ke 00 Sacr
http://slidepdf.com/reader/full/risk-assessment-ke-00-sacr 28/202

8/4/2019 Risk Assessment Ke 00 Sacr
http://slidepdf.com/reader/full/risk-assessment-ke-00-sacr 29/202
TOXICITY ASSESSMENT
The objectives of the toxicity assessment are to determinethe nature and extent of effects associated with exposure tocontamination. It is a two-step process consisting oftoxicological evaluation and dose-response assessment.
The toxicological evaluation is a qualitative analysis ofscientific data to determine the nature and severity of ac-tual or potential environmental risk associated with expo-sure to contamination. It results in a toxicity profilewhich presents a review of the literature on the types ofadverse effects manifested, the doses employed, and theroutes of exposure.
The dose-response assessment is an attempt to make a quanti-tative estimate of impact from exposure to a toxic chemical.It defines the relationship between the dose of a chemicaland the expected incidence of the adverse effect.
RISK CHARACTERIZATION
Risk characterization is the process of estimating the po-tential adverse environmental effect, using the results ofthe toxicity assessment, under the various conditions ofexposure defined in the exposure assessment.
Uncertainty related to the variability of bioaccumulationrelationships and diet distribution are evaluated using a
Monte Carlo simulation procedure.
This procedure allows:
o Estimation of the expected range of exposure levelsgiven the variability of environmental conditionsand the uncertainty of transfer and diet factors
o Evaluation of the conceptual exposure pathway modelregarding error due to poor estimates of inputparameters, as well as the sensitivity of the modelto particular parameters
The Monte Carlo simulation procedure provides estimates ofthe range of predictions of contaminant exposure for each ofthe key species and cleanup alternatives.
SAT72/25 1-2

8/4/2019 Risk Assessment Ke 00 Sacr
http://slidepdf.com/reader/full/risk-assessment-ke-00-sacr 30/202

8/4/2019 Risk Assessment Ke 00 Sacr
http://slidepdf.com/reader/full/risk-assessment-ke-00-sacr 31/202
Chapter 2
CONTAMINATION EVALUATION
INTRODUCTION
The source of contamination at KR is subsurface drainwaterfrom irrigated agricultural lands that was delivered to KRvia the San Luis Drain (SLD) . Delivery of drainwater ceasedin June 1986. Contamination which remains at KR is thatportion of contaminants delivered via drainwater that hasaccumulated in soils and biota. It is also possible thatcontaminants that have seeped into the shallow groundwaterbeneath KR could be reapplied to the surface of KR as partof water supply for the Flexible Response Plan (FRP) cleanupalternative (see Chapter 3)
.
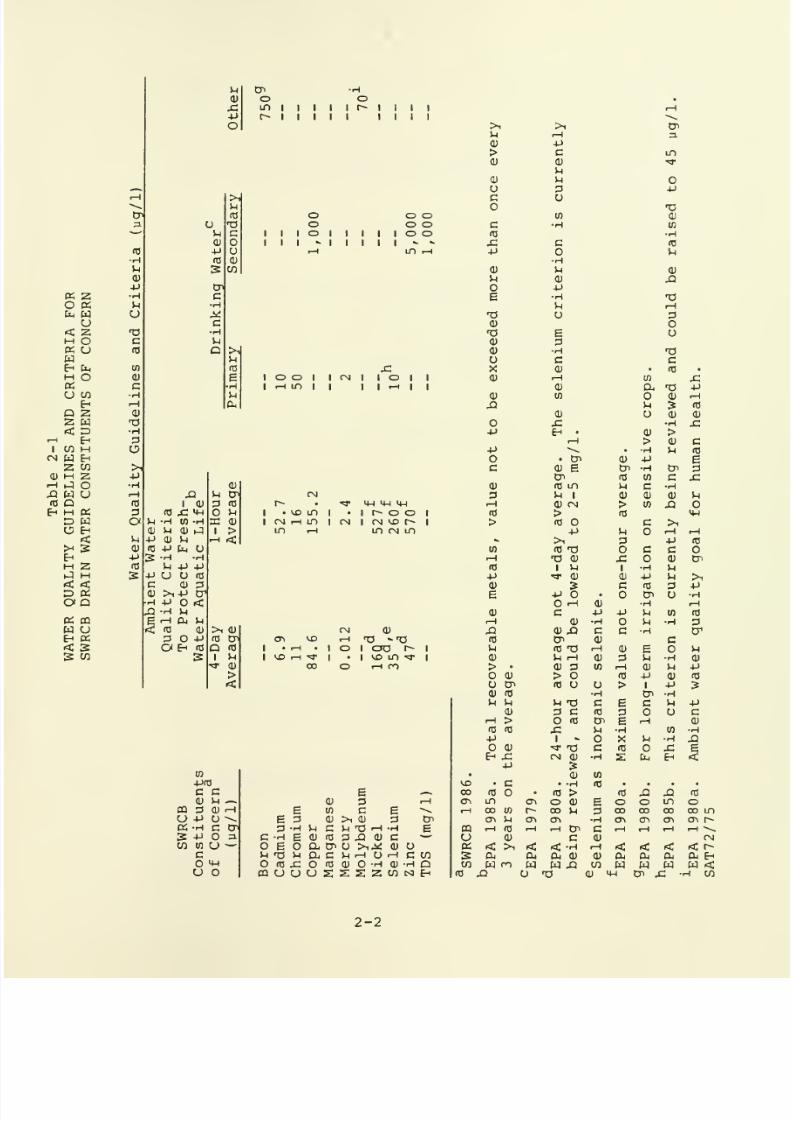
The California State Water Resources Control Board (SWRCB)
has identified constituents of concern in agricultural drain-
water (SWRCB 1986) . These constituents are shown in Table 2-1and are used as a basis for further evaluation of KR contam-inants. The levels of these contaminants in SLD drainwater,KR surface water, KR groundwater, KR soils, and biota areevaluated to determine if there is any evidence for residual
contamination that has accumulated in KR soils, biota, or
groundwater that may result in future harmful effects to
potentially exposed populations.
PAST WATER CONTAMINANT CONCENTRATIONS
Table 2-1 summarizes water quality guidelines and criteriaestablished for the SWRCB constituents of concern (USBR 1986a)
Table 2-2 is a summary of SLD drainwater quality during 1984
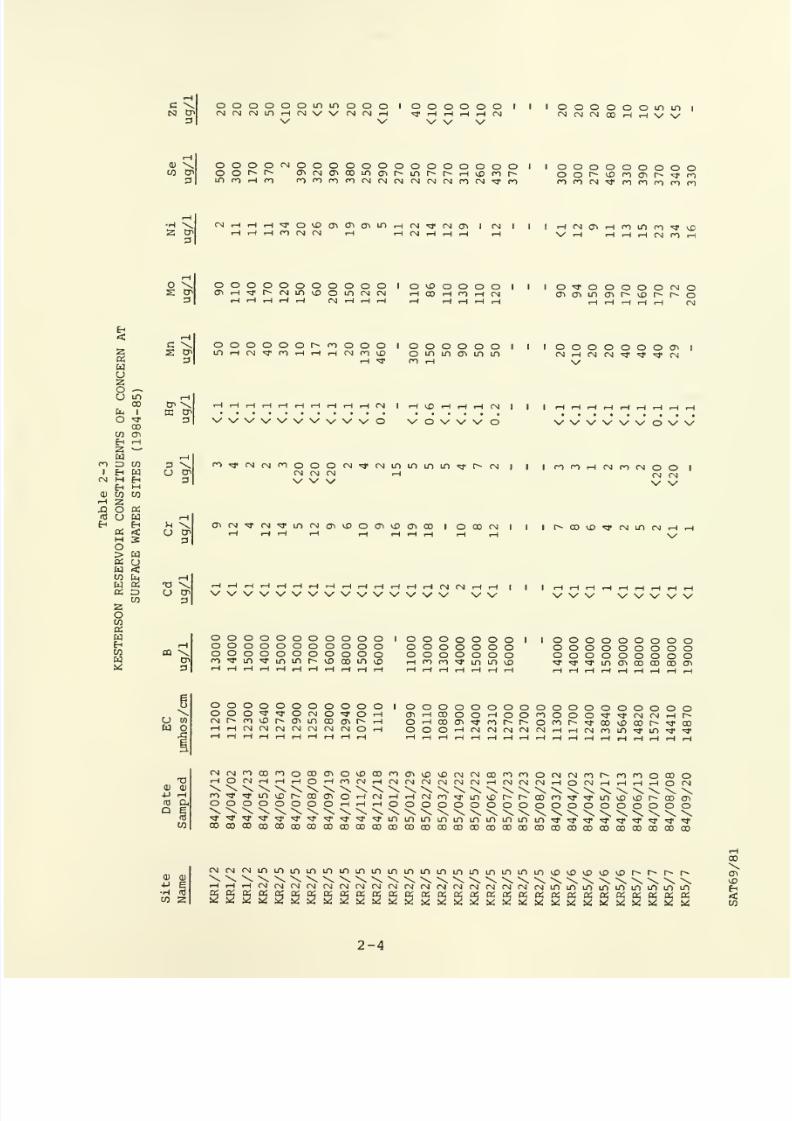
and 1985 (USBR 1985). Table 2-3 summarizes KR surface waterquality during 1984 and 1985 (USBR 1985) . Table 2-4 shows
KR shallow groundwater quality during 1984 and 1985 (USBR
1986a). The following drainwater constituents have exceededwater quality guidelines and criteria in historic SLD drain-water and KR surface water, and therefore warrant furtheranalysis: boron, chromium, molybdenum, mercury, TDS, sele-nium, and zinc.
BORON
Boron was present in agricultural drainwater delivered to KR
at concentrations ranging from 13,000 to 17,000 yg/l whileboron concentrations in the surface water at KR have been in
range of 11,000 to 65,000 yg/l. These data show that boronlevels increased in some areas probably due to evaporationin KR surface water.
SAT72/35 2-1

8/4/2019 Risk Assessment Ke 00 Sacr
http://slidepdf.com/reader/full/risk-assessment-ke-00-sacr 32/202
8/4/2019 Risk Assessment Ke 00 Sacr
http://slidepdf.com/reader/full/risk-assessment-ke-00-sacr 33/202

8/4/2019 Risk Assessment Ke 00 Sacr
http://slidepdf.com/reader/full/risk-assessment-ke-00-sacr 34/202

8/4/2019 Risk Assessment Ke 00 Sacr
http://slidepdf.com/reader/full/risk-assessment-ke-00-sacr 35/202
o o o o o o o
ooooooooooooiDCNoo'^ini^r^-irirofNOOO
(Ti O O O I
0!Tv(nr-oO'HO'-i'H'^corMronocorMrH <N rNnVin tHCMrHrHr-l (N
O O CO O O 'd'
1-1 O (Ti •^ r\i r^
C00^OOOO'*OOOO(MvOrOMi-ii-tcrir-)<NrMrH

8/4/2019 Risk Assessment Ke 00 Sacr
http://slidepdf.com/reader/full/risk-assessment-ke-00-sacr 36/202
8/4/2019 Risk Assessment Ke 00 Sacr
http://slidepdf.com/reader/full/risk-assessment-ke-00-sacr 37/202
c \3
o o o o o o'* rH rH i-H rH (N
(U

8/4/2019 Risk Assessment Ke 00 Sacr
http://slidepdf.com/reader/full/risk-assessment-ke-00-sacr 38/202

8/4/2019 Risk Assessment Ke 00 Sacr
http://slidepdf.com/reader/full/risk-assessment-ke-00-sacr 39/202
ooooo ioooinrHr~ looooo lor^in loooooooHCNrHrHrN noorovcN r^ogt-irMtN oj \y nin'3'r\iromm
OOOOOOOOOOOOCO'^OOr~-fNronoo^^OOOOOOroo-i(nLnror~orNrHOor~rH(NrM(nCT\kDcornin'3't^i^Ln'S'^i^'*cr>ro ix)
.H(N<-lrHrnnrO(NCN r-l rH.-l i-irsl rHrH rHiHiH
I ooooo I OOOOOO I OOOOOO I OOO I oooooooHOOOr~00 r--OrHrHtN'<* iDrOM'S'n lX)(N(Tl T-l CO ^ CO \s> en ^iHMrHi-tM iHrHCNCNrHin ^^rH rH rHCNi-l (NrHiH,H.-(,H,H
OOOOO I ooooi^cTi I OOOOO I ooco I ooooooo(NLnrMnm en r^ ^ r^ iri ^n rMroninLD >;r";r(N "^ a\ m (\ ^ a^ oo
I infMrHiHrHI rHrHrHiHMiH I rHnrHtHCN I .-IrHiH I rHiHiHmiHi-irM
VON/OO vvov-oo vov-vo \/v/v vvoos/\/o
^I'lnr^cNtN I M't^rnooovDninrHnromfooorHnrHCNtNiricNtH^^ S/ S/ '^ ^
V V •>• VV^\/V\/VV\/\/^^\/'^^\/V^V \/ ^ \/ V V
o o o oo o o oo o o on ^ n r~-
OOOOOOOOO00 CO CO
oooo I ooooo I OOo o o oOOOO oooooOOOOO
ooooooooooooooooooooor- in o <Ti rH iX) r^CN n CN iH r\J (N 'S-
rMOOOOOOOOOOOI OOOOO
ixi fNi (M r^ n in(Tv ro (Ti LTI (N (N
o
en <X5 v£l "*
r~~
^ CM ixii-H (N n in
ix) cTi in CO 00tH in vD ^ in
in iH in iX) CTi
OOOrH ^ COrH r~- 'J'
<Ti in iH
oooooO O CN CO ^>X> CD CT> iH "a-
O^ '3' in r»l <;J'
i-H (N rH M t-H

8/4/2019 Risk Assessment Ke 00 Sacr
http://slidepdf.com/reader/full/risk-assessment-ke-00-sacr 40/202

8/4/2019 Risk Assessment Ke 00 Sacr
http://slidepdf.com/reader/full/risk-assessment-ke-00-sacr 41/202
C\ OOOOOOOIOOOOOON&i vDrofMi-irMiHrsi <NojiX)i^tHrsi
3 ^ v^
<i)\ ooooooooooo'^oor~m U' ^^nr^OCT^(^)(J^l-^r--ln^X)'3''J'
o\ Lnoooooo loooooo
cx ooooooo loooooo
33 tri
3 O^O^^^N/ V\/Nyo^^V
^ognnnrsitN i ^Mnu^(^JLn«g•
H u f^r^r^rHCNlNiH I (NrJ'rNCO'H.H
^ ^ V s/ V V V ^ ^
oooooooooooooooooooooooooooooooooooooooooo
o o o oo o o ^VO ^ vD CTi
n(N r^ ,-1
<N

8/4/2019 Risk Assessment Ke 00 Sacr
http://slidepdf.com/reader/full/risk-assessment-ke-00-sacr 42/202
I
I

8/4/2019 Risk Assessment Ke 00 Sacr
http://slidepdf.com/reader/full/risk-assessment-ke-00-sacr 43/202
Table 2-4
KESTERSON RESERVOIR SHALLOW GROUNDWATERCONSTITUENTS OF CONCERN
(1984-1985)
Monitoring Data (yjg/l)

8/4/2019 Risk Assessment Ke 00 Sacr
http://slidepdf.com/reader/full/risk-assessment-ke-00-sacr 44/202
I
I
I
I
I

8/4/2019 Risk Assessment Ke 00 Sacr
http://slidepdf.com/reader/full/risk-assessment-ke-00-sacr 45/202
Concentrations of boron in the shallow groundwater beneathKR average 14,000 yg/l or about the same concentrations as
in the surface water.
CHROMIUM
Agricultural drainwater delivered to KR contained 4 to 30 ug/lof chromium. KR surface water samples showed levels from
less than 1 to 19 yg/1. The difference in concentrationsbetween SLD drainwater and KR surface water indicates that
chromium may be removed from the water column. The concen-trations of chromium in the shallow groundwater beneath KR
are approximately equal to surface water at KR, showing thatchromium is not removed from water as it seeps through the
soil into the ground.
MERCURY
Levels of mercury in drainwater varied from less than 0.1 to3 yg/1. Levels up to 0.6 yg/1 have been found in KR surfacewater. The level of mercury in shallow groundwater beneathKR was 0.13 yg/l, approximately equal to backgroundconcentrations of 0.11 yg/l.
MOLYBDENUM
Molybdenum in SLD water delivered to KR ranged from 28 to
140 pg/1. Surface water molybdenum concentrations at KR
ranged from 48 to 540 yg/1, indicating molybdenum concen-
trations increased probably due to evaporation in KR surface
water. Molybdenum concentrations in groundwater beneath KRis lower than KR surface water, indicating that molybdenum
may have been removed in soil as surface water seeped into
the ground.
SALTS
Agricultural drainwater delivered to KR contained 4,992 to
10,896 mg/1 of total dissolved solids (TDS) . Surface water
samples from ponds at KR showed TDS levels 1,272 to
16,880 mg/1, indicating an increase in concentrations pro-
bably due to evaporation.
SELENIUM
Levels of selenium in SLD drainwater averaged approximately
300 yg/1.
Levels of selenium in KR surface water decreased from south
to north, suggesting that selenium was removed from the water
column, probably by chemical or biological processes (LBL,
1986) .
Selenium concentrations in the shallow groundwater beneath
KR are much lower than in KR surface water, also suggestingselenium is being removed in KR soils and sediments.
SAT72/35 2-8

8/4/2019 Risk Assessment Ke 00 Sacr
http://slidepdf.com/reader/full/risk-assessment-ke-00-sacr 46/202

8/4/2019 Risk Assessment Ke 00 Sacr
http://slidepdf.com/reader/full/risk-assessment-ke-00-sacr 47/202
ZINC
Concentrations of zinc in the shallow groundwater beneath KRare similar to those historically found in KR surface water,suggesting that zinc has seeped into the groundwater and hasnot accumulated in KR soils.
PRESENT SOIL AND WATER SUPPLYCONTAMINANT CONCENTRATIONS
Table 2-5 shows constituents of concern levels in KR soils(USER 1986a) . No nearby KR wetland soil background levelsfor these contaminants, except for selenium, have been iden-tified. Table 2-5 also shows expected constituent concen-tration in San Joaquin Valley soils similar to those under-lying KR. Selenium is the only constituent which exceedseither background levels or San Joaquin Valley soils levels.
Table 2-6 shows the quality of groundwater based on analysesof existing water supply which will be applied to KR withimplementation of FRP . Boron and TDS (0.8 x EC) are theconstituents of concern which exceed water quality guide-lines and criteria.
BIOTA
BACKGROUND
Mosquitofish (Gambusia af finis ) captured at KR in May 1982
were found to have high levels of selenium (about 135 ppm -
Saiki 1986). Because of these findings, the U.S. Fish andWildlife Service (USFWS) began intensive studies at KR andat Volta Wildlife Area (a control area 10 km to the south-west which receives surface water) to further define the
effects and extent of contamination resulting from drain-water application to KR.
In 1983, samples collected by USFWS included tissues andeggs of American coots, ducks, eared grebes (Podicepsnigricallis ) , and black-necked stilts ( Himantopus mexicanus )
These samples were analyzed for selenium, arsenic, cadmium,mercury, lead, zinc, and silver. Elements other than seleniumwere found in similar concentrations in the samples from KRand the Volta control site. Samples of food chain compo-nents, including rooted plants, invertebrates, and mosquito-fish, were also collected at both sites in 1983. Thesesamples were analyzed for silver, arsenic, boron, cadmium,chromium, copper, mercury, molybdenum, nickel, lead, sele-nium, and zinc. Only total selenium and boron concentra-tions were significantly higher in food chain samplescollected at KR than in those collected at Volta WildlifeArea (Ohlendorf , et al. 1986)
SAT72/35 2-9

8/4/2019 Risk Assessment Ke 00 Sacr
http://slidepdf.com/reader/full/risk-assessment-ke-00-sacr 48/202

8/4/2019 Risk Assessment Ke 00 Sacr
http://slidepdf.com/reader/full/risk-assessment-ke-00-sacr 49/202
Table 2-5
SUMMARY OF SOIL CONCENTRATIONS (MG/KG) OF
CONSTITUENTS OF CONCERN
San Joaquin Valley
Background Soils
Kesterson Soil'
and SedimentsConstituent

8/4/2019 Risk Assessment Ke 00 Sacr
http://slidepdf.com/reader/full/risk-assessment-ke-00-sacr 50/202
I
I

8/4/2019 Risk Assessment Ke 00 Sacr
http://slidepdf.com/reader/full/risk-assessment-ke-00-sacr 51/202
Table 2-6
QUALITY OF GROUNDWATER TO BE APPLIED TO KESTERSON RESERVOIR UNDER FRP
Site
Name
Well #1
Well #1
Well #1
Well #1
Well #1
Well #1
Well #2
Well #2
Well #2
Well #2
Well #3
Well #3
Well #3
Well #3
Well #3
Well #4
Well #4
Well #4
Well #4
Well #4
Well #4
Well #5
Well #6
Well #7
Well #8
Date
Sampled
07/09/86
07/15/86
07/24/86
07/31/86
08/06/86
09/29/86
07/09/86
07/15/86
07/24/86
09/29/86
07/09/86
07/15/86
07/24/86
08/06/86
09/29/86
07/09/86
07/15/86
07/24/86
07/31/8608/06/86
09/29/86
09/29/86
09/29/86
09/29/86
09/29/86
EC
Umbos/cm
10160
10600
10940
11320
11290
11790
6210
5820
6000
6160
4830
4850
4990
5150
6250
6140
6170
6350
65206530
5280
6670
5320
6320
7460
As Se Cr Cu Mo Ni Zn B Ca Mg
yg/L yg/L yg/L yg/L yg/L yg/L yg/L yg/L Mg/L Mg/L
1 yt -3 /A 1/1 yi /•in Annn lAn •jin14
16
24
20
24
21
5
7
9
8
<4
<4
<4
24
14
12
12
11
12
14
<4
11
6
13
10
<10
<10
<10
<10
<10
<10
<10
<10
<10
<10
<10
<10
<10
<10
<10
<10
<10
<10
<10<10
<10
<10
<10
<10
10
4000 340
4000
5000 3705000 360
5000 360
6000 370
1900 200
1800
2000 200
1500 200
700 250
800
800 160
800 160
1700 190
1800 190
200
2000 210
2000 2102000 210
800 170
2200 230
1000 150
2100 190
2800 250
310
340330
330
340
160
160
160
120
130
130
140
140
160
150160
36
160
120
140
190
SAT 73/76
2-11

8/4/2019 Risk Assessment Ke 00 Sacr
http://slidepdf.com/reader/full/risk-assessment-ke-00-sacr 52/202

8/4/2019 Risk Assessment Ke 00 Sacr
http://slidepdf.com/reader/full/risk-assessment-ke-00-sacr 53/202
Boron found in vegetation at KR tends to concentrate in leaftips where it is available to browsing animals (Gupta et al.
1985) . Few data are available, however, concerning the acuteand chronic toxicity of boron to fish and wildlife. Boroncompounds (boric acid and borax) have been shown to causemortality and teratogenic development when injected into
eggs (Landauer 1952, Birge and Black 1977).
In 1983, researchers concluded that selenium was the mostlikely cause of avian deaths and deformities at KR becausethe types of deformities found in avian embryos and youngwere typical of those induced by exposure to high levels ofselenium, and selenium concentrations in the samples greatlyexceeded those found in other areas of the United States(USDI 1984) . Thus, selenium has been identified as the prin-cipal contaminant of concern at KR.
The importance of selenium as a contaminant at KR is increas-
ed because of the likelihood of bioaccumulation.
Studies byLemly (1985) in an aquatic ecosystem indicated that plankton(zooplankton and phytoplankton combined) concentrated seleniumto 750 times the concentration in the water of Belews Lake,North Carolina, and that fish contained selenium concentrations4,000 times that in water. In addition, sediments contained350 times and benthic invertebrates contained 1,050 timesthe selenium concentrations of water in the lake. Seleniumin water is taken up by biota including marsh plants, phyto-plankton, zooplankton, and insects that contribute to the
diets of higher forms of wildlife in the area (Burau 1985) .
Bioaccumulation has also been documented at KR (Ohlendorf,
et al. 1986)
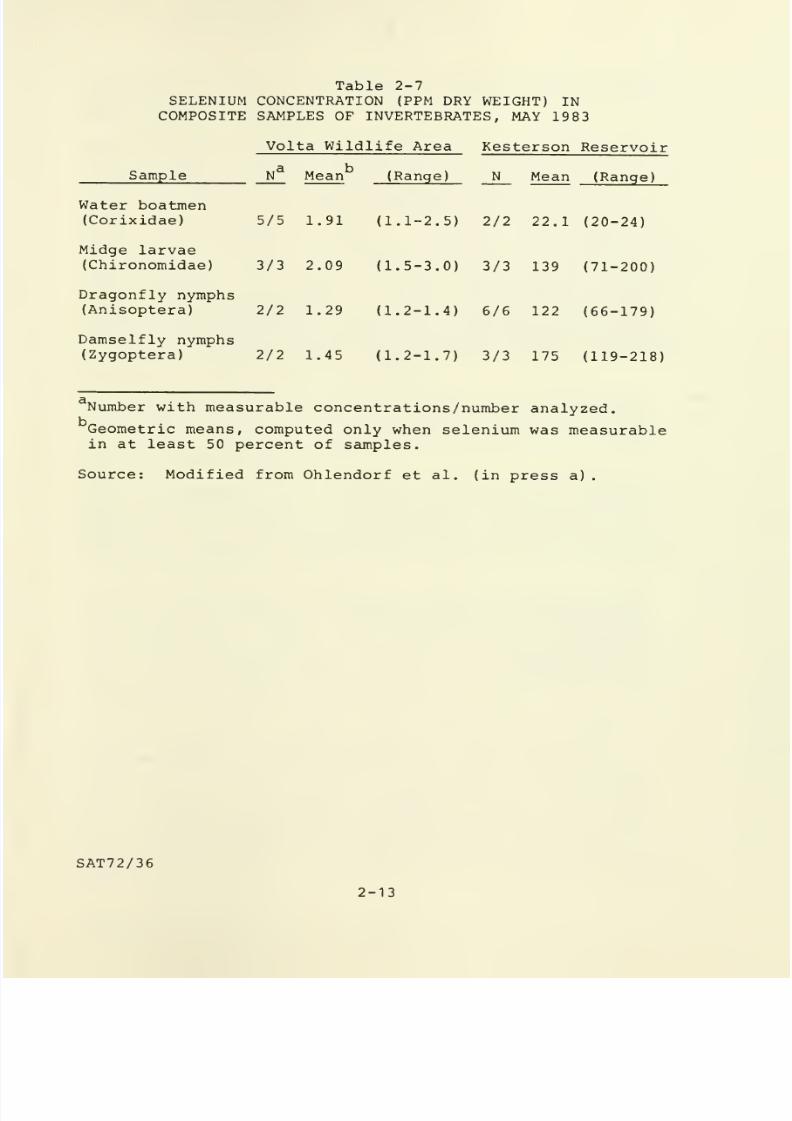
INVERTEBRATES
Data on concentrations of selenium in invertebrates at KRshow levels 12 to 130 times as contaminated as those col-lected at Volta Wildlife Area during the same period(Table 2-7) . More recent data on selenium concentrations in
invertebrates from KR and vicinity are available in a recentLawrence Berkeley Laboratory report (LBL 1986) . These dataare used in the Exposure Assessment section of this report.
BIRDS
Ohlendorf, et al. (in press) found reproductive problems inaquatic birds nesting at KR in 1983-1985. Samples of birdeggs and livers collected at KR contained elevated levels ofselenium. According to Ohlendorf (pers. comm.), seleniumconcentrations in livers of American coots collected in 1984from KR contained almost twice the mean concentrations ofselenium found in livers of coots collected at KR in 1983
(81.5 and 43.1 mg/kg, dry weight, respectively). Seleniumconcentrations in livers of ducks collected at KR in 1983averaged 19.9 mg/kg dry weight (Presser and Ohlendorf in
prep.).In
areas without selenium contamination, dry
SAT72/35 2-12

8/4/2019 Risk Assessment Ke 00 Sacr
http://slidepdf.com/reader/full/risk-assessment-ke-00-sacr 54/202
8/4/2019 Risk Assessment Ke 00 Sacr
http://slidepdf.com/reader/full/risk-assessment-ke-00-sacr 55/202
Table 2-7
SELENIUM CONCENTRATION (PPM DRY WEIGHT) IN
COMPOSITE SAMPLES OF INVERTEBRATES, MAY 19 83
Volta Wildlife Area Kesterson Reservoir
Sample N_ Mean (Range) N Mean (Range)
Water boatmen(Corixidae) 5/5 1.91 (1.1-2.5) 2/2 22.1 (20-24)
Midge larvae(Chironomidae) 3/3 2.09 (1.5-3.0) 3/3 139 (71-200)
Dragonfly nymphs(Anisoptera) 2/2 1.29 (1.2-1.4) 6/6 122 (66-179)
Damselfly nymphs
(Zygoptera) 2/2 1.45 (1.2-1.7) 3/3 175 (119-218)
Number with measurable concentrations/number analyzed.
Geometric means, computed only when selenium was measurablein at least 50 percent of samples.
Source: Modified from Ohlendorf et al. (in press a)
SAT72/36
2-13

8/4/2019 Risk Assessment Ke 00 Sacr
http://slidepdf.com/reader/full/risk-assessment-ke-00-sacr 56/202 I

8/4/2019 Risk Assessment Ke 00 Sacr
http://slidepdf.com/reader/full/risk-assessment-ke-00-sacr 57/202
weight concentrations are usually less than 1 mg/kg in eggs,and less than 10 mg/kg in livers of freshwater birds(Ohlendorf pers. comm.).
Data available on the rates of embryonic mortality and de-formity during the 1985 breeding season at KR (Table 2-8)
indicated that of 124 nests monitored, 39.5 percentcontain-ed at least one dead or deformed embryo (Ohlendorf pers.
comm.). The 1985 data indicated that nesting failures andhigh rates of embryotoxicity continued to occur, despite anactive hazing program in 1985. In contrast, researchersfound no abnormalities in embryos from nests monitored throughlate stages of incubation or hatching at Volta Wildlife Areain 1983-1985. Nests studied included those of pied-billedgrebes ( Podilymbus podiceps
) , killdeer ( Charadrius vociferus)
mallards (Anas platyrhynchos ) , northern pintails (A^ acuta)gadwalls (A_^ strepera
) , cinnamon teal (A_^ cyanoptera ) , Amer-ican coots ( Fulica americana ) , black-necked stilts ( Himaatopusmexicanus) , American avocets ( Recurvirostra americana
) ,
andeared grebes ( Podiceps nigricollis )
The expected incidence of major external malformations inhatchlings of uncontaminated wild populations of birds andin embryos of laboratory-incubated mallard eggs is less thanone percent (Pomeroy 1962, Gilbertson, et al. 1976, Hoffman1978, Hill and Hoffman 1984).
Studies by Heinz, et al. (in press) indicated that when mal-lards were fed diets containing 10 mg/kg selenium as seleno-methionine, some embryos had deformities similar to thoseobserved at KR. Selenium concentrations in eggs of aquaticbirds at KR were far higher than those at the Volta WildlifeArea which served as a control.
In 1983, only a few young were observed from the presumed2 58 coot eggs hatched at Kesterson NWR, and only one youngeared grebe was observed of the presumed 211 eggs hatched(Ohlendorf et al. 1986) . The number of young coots surviv-ing to adulthood is unknown. Despite thorough searches, nocoot broods were observed, although coot and grebe broodswere observed at Volta Wildlife Area. No coots nested at KRin 1984 or 1985 (Ohlendorf pers. comm.).
In 1984, no American avocet or black-necked stilt broodswere observed past 2.5 weeks of age at KR (Niesen andWilliams 1985). In 1985, no American avocet hatchlings over3 weeks of age were observed at KR. Avocet and stilt hatch-lings up to 6 weeks of age were observed at Volta WildlifeArea. No survival of juvenile avocets or stilts was record-ed at KR, while recruitment of juvenile avocets and stiltsinto the adult populations appeared normal at Volta WildlifeArea in 1984 and 1985. In addition, more hatchling carcas-ses were found at KR in 1985 than in 1984 (Niesen and Williams1985)
SAT72/35 2-14

8/4/2019 Risk Assessment Ke 00 Sacr
http://slidepdf.com/reader/full/risk-assessment-ke-00-sacr 58/202

8/4/2019 Risk Assessment Ke 00 Sacr
http://slidepdf.com/reader/full/risk-assessment-ke-00-sacr 59/202
Table 2-8
SUMMARY OF FREQUENCIES OF MORTALITY AND DEFORMITIES IN
EMBRYOS AND CHICKS OF AQUATIC BIRDS NESTING ATKESTERSON RESERVOIR, 1983-85
Nests with EmbryotoxicitySpecies/

8/4/2019 Risk Assessment Ke 00 Sacr
http://slidepdf.com/reader/full/risk-assessment-ke-00-sacr 60/202

8/4/2019 Risk Assessment Ke 00 Sacr
http://slidepdf.com/reader/full/risk-assessment-ke-00-sacr 61/202
Selenium concentrations in duck muscle tissue from 1984 col-
lections at Kesterson NWR by the California Department of
Fish and Game ranged from 0.2-9.2 mg/kg wet weight (Daniel
pars. comm.). Because of potential risks to human healthfrom consuming foods with high selenium concentrations. De-
partment of Health Services recommended that no waterfowl
from Kesterson NWR be consumed (Kizer pers. comm.). Also,the USFWS has prohibited hunting and fishing at KR since
1984.
MAMMALS
A study of potential selenium contamination of mammals at KR
was conducted in 1984. Species collected at KR and at VoltaWildlife Area included the California vole (Microtuscalifornicus ) , harvest mouse ( Reithrodontomys megalotis )
house mouse (Mus musculus ) , ornate shrew ( Sorex ornatus )
desert cottontail ( Sylvilagus auduboni) , California ground
squirrel(
Citellus beecheyi)
, andmuskrat
( Ondatrazibethica
)
Preliminary results are reported below.
Reproductive problems were noted for California voles and
house mice at KR, but not at Volta Wildlife Area. Westernharvest mice and ornate shrews showed reproductive activity
at KR, but a comparison with a control area could not be
made since no females of either species were caught at Volta
Wildlife Area (Clark pers. comm.).
Selenium concentrations were higher than background in the
livers of specimens from KR for all species except the
California ground squirrel (Clark pers. comm.). Preliminary
data for the four most abundant species in this sample
(California vole, harvest mouse, house mouse, and ornate
shrew) are presented in Table 2-9; for these species, sele-
nium levels at KR were 10 to 1,000 times higher than those
at the Volta Wildlife Area. Livers from the carnivorous
ornate shrews averaged 6 times more selenium than harvestmouse livers and 22 times more than California vole livers.
The mean body burden of these species of herbivores (Cali-
fornia vole, house mouse, and harvested mouse) shows a sele-
nium level of 8.18 mg/kg. The single sample of ornate shrew,
a small carnivorous rodent, had a body burden of 47.9 mg/kg,
or about 6 times higher than found in herbivorous rodents of
a similar size. Larger rodents, California ground squirrel
and muskrat, had generally lower liver tissue selenium than
observed in small rodents.
HUMAN POPULATIONS
The Merced County Health Department conducted a limited public
health survey of persons living directly adjacent to KR compar-
ed to a control group from Gustine. This survey included a
questionnaire and blood, urine, and hair analyses. Based on
the limited amount of human toxicological information
SAT72/35 2-16

8/4/2019 Risk Assessment Ke 00 Sacr
http://slidepdf.com/reader/full/risk-assessment-ke-00-sacr 62/202

8/4/2019 Risk Assessment Ke 00 Sacr
http://slidepdf.com/reader/full/risk-assessment-ke-00-sacr 63/202
Table 2-9
SELENIUM CONCENTRATIONS (PPM DRY WEIGHT) IN
LIVERS AND WHOLE BODIES OF ABUNDANT SMALL MAMMAL SPECIES FROM
KESTERSON RESERVOIR AND VOLTA WILDLIFE AREA (PRELIMINARY DATA)
Volta Wildlife Area Kesterson Reservoir

8/4/2019 Risk Assessment Ke 00 Sacr
http://slidepdf.com/reader/full/risk-assessment-ke-00-sacr 64/202 I

8/4/2019 Risk Assessment Ke 00 Sacr
http://slidepdf.com/reader/full/risk-assessment-ke-00-sacr 65/202
available for selenium, no evidence was found to indicateacute toxic effects on area residents resulting from expo-sure to KR (Merced County Health Department 1985).
A public health selenium monitoring program for workers atKR was instituted at KR in 1984. From October 1984 to thepresent, blood chemistry and blood and urine selenium analy-
ses were performed. Symptoms of acute or chronic seleniumtoxicity were not observed, and serum and urine seleniumlevels are within normal ranges (USER 1986b)
IDENTIFICATION OF CONSTITUENTS FOR RISK CHARACTERIZATION
Table 2-10 summarizes the results of the foregoing analyses.Based on this table, only boron and selenium are of potentialconcern with regards to this Risk Assessment. The followingconstituents are not of concern because they have not exceededstandards or guidelines in past measurements of SLD drainwater,
KR surface water, and KR groundwater: cadmium, copper, man-ganese, and nickel. The following constituents are not ofconcern because they have not accumulated in KR soils abovebackground concentration, and their concentrations in KRgroundwater supplies do not exceed standards or guidelines:chromium, mercury, molybdenum, and zinc. TDS is not of con-cern, even though concentrations in KR groundwater suppliesexceed standards and guidelines, because no evidence existsthat TDS concentrations in applied groundwater will causeadverse wildlife effects in KR.
Boron is an essential nutrient for plants in low concentra-
tions and exhibits toxic affects at higher levels. Reviewsof boron nutritional requirements (Gupta, et al. 1985) andtoxicity (Maas 1986) have been summarized by USER (1986a).Typically, plants will exhibit toxic effects when, dependingupon their tolerance, the boron concentrations exceed200 mg/kg. However, many intolerant species of plants areaffected by much lower levels of boron (5 to 50 mg/kg)Boron is accumulated in plant tissues at variable ratesdependent upon species metabolism, soil, water, transpira-tion, and other variable environmental factors (Gupta, etal. 1985, Maas 1986, USER 1986a).
Analytical results from 350 stem and leaf tissue samples ofvegetation collected at KR had leaf tissue concentrationsranging from 10 to 610 mg/kg boron, with an average of174 mg/kg (USER 1986a) . Boron levels exceeded 200 mg/kg in
36 percent of the plant samples, which represented all pondsat KR.
SAT72/35 2-11

8/4/2019 Risk Assessment Ke 00 Sacr
http://slidepdf.com/reader/full/risk-assessment-ke-00-sacr 66/202
I
I

8/4/2019 Risk Assessment Ke 00 Sacr
http://slidepdf.com/reader/full/risk-assessment-ke-00-sacr 67/202
Table 2-10
SU^4MARY OF CONTAMINANT LEVELS IN KR MEDIA
Drainwater,
Surface Water,
or Shallow KR Water Supply
Groundwater > KR Soils > Groundwater KR Biota
Constituents Standards? Background? > Standards? > Background?
Yes Yes
No No
No No
No No
No Yes
No No
Yes NA
Boron

8/4/2019 Risk Assessment Ke 00 Sacr
http://slidepdf.com/reader/full/risk-assessment-ke-00-sacr 68/202
I
I
I
I
I

8/4/2019 Risk Assessment Ke 00 Sacr
http://slidepdf.com/reader/full/risk-assessment-ke-00-sacr 69/202

8/4/2019 Risk Assessment Ke 00 Sacr
http://slidepdf.com/reader/full/risk-assessment-ke-00-sacr 70/202

8/4/2019 Risk Assessment Ke 00 Sacr
http://slidepdf.com/reader/full/risk-assessment-ke-00-sacr 71/202
Chapter 3
EXPOSURE ASSESSMENT
INTRODUCTION
Risk assessment requires estimating selenium exposure that
may occur as a result of implementing each of the several KRcleanup alternatives.
This section presents a description of the cleanup alterna-tives being considered for KR, a description of the biogeo-chemistry of selenium, a description of potential majorselenium exposure pathways resulting from these cleanupalternatives, an identification of key species which arepotential receptors of contamination from these pathways,the population sizes of the key species, a description ofexposure pathway components, an estimate of selenium trans-fer factors (and their uncertainties) between pathway com-
ponents, and key species diet factors.
CLEANUP ALTERNATIVES
Cleanup alternatives under consideration for implementationat KR were developed and qualitatively evaluated in theKesterson Program EIS (USER 1986a). These alternatives are:the Phased Approach, the Onsite Disposal Plan, and the Off-site Disposal Plan. For the purposes of this risk assess-ment, it is necessary to consider components and subalterna-tives of these plans.
PHASED APPROACH
The phased approach consists of three components: the Flex-ible Response Plan (FRP) , the Immobilization Plan, and theOnsite Disposal Plan.
Flexible Response Plan
Under the FRP, the southern ponds (Ponds 1-8) where most ofthe soil selenium contamination occurs would be flooded withlow selenium groundwater, and the northern ponds (Ponds 9-12)
would not have water applied. Vegetation in the northernponds would be controlled by discing. Some areas of thenorthern ponds could be seasonally wet when groundwater risestypically November through April.
Immobilization Plan
The Immobilization Plan is similar to the FRP to the extentthat water would continue to be applied to the southernponds and the northern ponds would not have applied water.
SAT72/77 3-1

8/4/2019 Risk Assessment Ke 00 Sacr
http://slidepdf.com/reader/full/risk-assessment-ke-00-sacr 72/202

8/4/2019 Risk Assessment Ke 00 Sacr
http://slidepdf.com/reader/full/risk-assessment-ke-00-sacr 73/202
Emergent vegetation in the southern ponds would be harvested
and disposed offsite. In the northern ponds, exposure to
contamination would be controlled through discing, and if
necessary, vegetation harvesting and offsite disposal, or
filling seasonal wetlands with soil. These managementactions will reduce risk to wildlife compared to the FRP
Contamination exposure in the northern ponds under the Im-
mobilization Plan is expected to be between that resultingfrom the FRP and the Onsite Disposal Plan. The Immobiliza-tion Plan is therefore not considered further in this risk
assessment. Because insufficient information currently ex-
ists regarding the magnitude of reduced risks to wildlifeachievable with this plan, the immobilization plan will be
tested as part of the FRP.
Onsite Disposal Plan
Under the Onsite Disposal Plan, contaminated soils and
vegetation would be excavated and disposed of onsite in a
lined and capped landfill. This plan has two subalterna-tives: excavating KR soil with selenium levels greater than
4 mg/kg and harvesting all above-ground vegetation (approxi-
mately 450,000 cubic yards) (Onsite-1) and excavating all KR
soil and vegetation (approximately 1,000,000 cubic yards)
(Onsite-2) . These alternatives are addressed in this risk
assessment.
ONSITE DISPOSAL PLAN
Under this plan, onsite disposal (either 450,000 or
1,000,000 cubic yards) would be implemented immediately
rather than as the third component of the phased approach.Since the risk assessment does not consider the time frame
of plan implementation, the risks of this plan are essen-
tially identical to the phased approach onsite disposal
plan.
OFFSITE DISPOSAL PLAN
This plan is similar to the Onsite Disposal Plan with the
exception that excavated and harvested material would be
disposed of offsite rather than onsite. Since the risks of
landfill failure are not being considered, the risks of this
plan are essentially identical to the phased approach onsitedisposal plan.
SELENIUM BIOGEOCHEMISTRY
The major features of selenium chemistry that affect its
movement and toxicity are associated with changes in its
oxidation state and the resulting differences in chemicalproperties
SAT72/77 3-2

8/4/2019 Risk Assessment Ke 00 Sacr
http://slidepdf.com/reader/full/risk-assessment-ke-00-sacr 74/202
I

8/4/2019 Risk Assessment Ke 00 Sacr
http://slidepdf.com/reader/full/risk-assessment-ke-00-sacr 75/202
Selenate is the most mobile form of selenium and makes upthe majority of selenium that has been delivered to KR viathe SLD. Selenium was removed from the drainwater appliedto KR, apparently by biological processes, and also from thewater as it seeped into the groundwater through the anaerobicsediments, probably by both chemical and biological pro-
cesses. This selenium which has accumulated in the soilsand sediments of KR is in reduced inorganic forms, such as
selenite and elemental selenium, and in organic seleniumcompounds. This accumulated selenium can potentially bemobilized into overlying water by physical, chemical, andbiological processes and hence again become bioavailable ormay be transported through the food chain via the detrituspathway.
EXPOSURE PATHWAYS
Potential exposure pathways to residual selenium contamina-
tionat
KR include food chain or ingestion of contaminatedsediments, water, plants, and animals, direct contact anddermal absorption, and air migration and inhalation. All ofthese are possible pathways for potentially exposed humanpopulations
Food chain exposure is considered the most significant expo-sure pathway for wildlife at KR. No information reviewedsuggests that dermal exposure or inhalation is a significantexposure pathway for selenium at KR. Fish, however, aredirectly affected by selenium in the water column but sele-nium concentrations in surface water under all plans areexpected to be below the EPA criterion to
protect aquaticlife (see Chapter 4)
The fish and wildlife food chain exposure pathways can bedivided into subpathways which relate to the properties andmovement of selenium. As described in the Kesterson ProgramFinal EIS (USER 1986) , the potential exists for residualsoil selenium contamination to move into terrestrial andaquatic food chains. The terrestrial food chain representsthe dry areas of KR after implementation of a cleanup al-ternative (e.g., dry areas of northern ponds under FRP)
The aquatic food chain represents either the permanently wetareas (e.g., the southern
pond underFRP)
or the seasonablywet areas (e.g., the low areas of the northern ponds underthe FRP and the low areas of all the ponds under the OnsiteDisposal Plan) . The aquatic food chain is further dividedinto a benthic pathway, a water column pathway, and a rootedplant pathway.
SAT72/77 3-3

8/4/2019 Risk Assessment Ke 00 Sacr
http://slidepdf.com/reader/full/risk-assessment-ke-00-sacr 76/202
I
8/4/2019 Risk Assessment Ke 00 Sacr
http://slidepdf.com/reader/full/risk-assessment-ke-00-sacr 77/202
EXPOSED POPULATIONS
HUMAN POPULATIONS
Insufficient information exists to perform a quantitativerisk assessment for potentially exposed human populations atKR. The Kesterson Program Final EIS (USER 1986a) presents a
thorough, comprehensive analysis of exposure of human popu-lations to KR contaminants, based on the most recent dataavailable. Potentially exposed populations are describedbelow.
Foragers
There is a lack of data on the potentially exposed popula-tion, such as estimates of the population size, frequency oftheir use of the area, their dietary habits in general, whatitems at KR they may consume, their normal dietary intake ofselenium, the selenium concentrations of some potential food
items, or the amount of food or other contaminated mediathey may take in. A preliminary ethnographic survey hasbeen recently completed (USER, 1986c) , but further informa-tion would be necessary to allow quantitative risk assess-ment.
Adjacent Residents
Groundwater exposure is expected to be minimal due to limit-ed selenium migration in the groundwater (USER 1986a, LBL1986) and lack of groundwater beneficial use as described in
the Kesterson Program Final EIS (USER 1986a)
Workers
Each alternative has a different exposed population. Theyinclude the normal Kesterson workers and researchers, butexcavation would also include construction workers.
Hunters
Hunting is not allowed at KR. There is no informationavailable on the fraction of total diet that comes from KRof the birds shot at adjacent duck clubs or other offsite
areas
WILDLIFE POPULATIONS
A list of species present at KR is given in Appendix A andis based on USER (1986a) . The species at KR represent a
variety of trophic levels and, hence, selenium exposure po-tential. Criteria for selection of species for risk charac-terization are described below.
SAT72/77 3-4

8/4/2019 Risk Assessment Ke 00 Sacr
http://slidepdf.com/reader/full/risk-assessment-ke-00-sacr 78/202

8/4/2019 Risk Assessment Ke 00 Sacr
http://slidepdf.com/reader/full/risk-assessment-ke-00-sacr 79/202
IDENTIFICATION OF KEY FISH AND WILDLIFE SPECIES
Appendix A presents a list of wildlife species known or sus-
pected to use KR. It was not possible to perform a quanti-
tative risk assessment for each of these species due to time
and budget constraints. However, it is not necessary to
perform a risk assessment for each of these species because
indicator species can be selected to represent the range ofpossible exposure pathways and risks. Therefore, a quanti-
tative risk assessment performed for these indicator species
will depict risks to the wildlife species using KR.
Selection of indicator or key fish and wildlife species is
based on several considerations: they are the terminus of a
major KR food chain exposure pathway; impacts of KR on the
species have been observed in the past; they are rare or
endangered species; they have particularly sensitive life
stages; or information is available on the effects of
selenium exposure for the species. Not all of the species
selected, of course, satisfy all of these criteria. De-scriptions of the selected species and rationales for their
selection follow.
Mallard
The adult mallard is an omnivore with highly variable feed-
ing habits. During nesting and egg-laying, the diet of the
adult female changes from one relying primarily on vegeta-
tion to one that includes more protein. Exposure during
this period was estimated because of the potential impact on
reproduction. The mallard duckling is probably very sensi-
tive to selenium toxicity and its diet consists primarily ofaquatic invertebrates. Thus, the exposure of the mallard
duckling is probably similar to that of the tricolored
blackbird (discussed below)
The mallard is an important game species in the Pacific
flyway. Another consideration in the selection of mallards
is the fact that there is a relatively large amount of sele-
nium and other toxicology data available for them.
Anterican Coot
The adult American coot is an aquatic species with littledependence on the benthic community at KR. Feeding habits
of the adult coot do not vary substantially with respect to
sex. The adult coot feeds primarily on terrestrial and
aquatic plants, insects, and other epiphytal fauna.
Black-necked Stilt
The adult black-necked stilt relies heavily on the littoral
benthic epifauna. Stilts are wading birds that tend to eat
SAT72/77 3-5

8/4/2019 Risk Assessment Ke 00 Sacr
http://slidepdf.com/reader/full/risk-assessment-ke-00-sacr 80/202
11

8/4/2019 Risk Assessment Ke 00 Sacr
http://slidepdf.com/reader/full/risk-assessment-ke-00-sacr 81/202
epifauna that they can see. Among the four species, stiltsrely on the benthic coimnunity to the greatest extent.
Tricolored Blackbird
The young tricolored blackbird (Agelaius tricolor ) (through
fledgling) is fed almost exclusively adult insects and aqua-
tic insect larvae. The fledgling blackbirds and stilts tendto rely on similar trophic levels for food, although the
blackbird diet is not generally comprised of a significant
amount of epibenthic species. The status of the tricoloredblackbird as a federal candidate for threatened and endan-gered species listing was also a factor in its selection.
Eared Grebe
The eared grebe is a fish-eating bird in which KR impactshave been observed in the past (Ohlendorf , et al. 1986a)
Although the eared grebe does not exclusively eat fish, it
was selected as a key species because fish are an importantpart of its diet and eared grebes also have limited feeding
range, therefore, tending to have a restricted offsite expo-
sure.
Mosquitofish
The mosquitofish ( Gambusia itf finus ) is the only fish whichcurrently exists at KR; it is highly resistant to selenium
toxicosis. Mosquitofish were introduced into California in
1922 and have since spread to waters throughout the state.
The species has a worldwide distribution in warm waters due
to its use for mosquito-control purposes. Mosquitofish areomnivorous and opportunistic feeders utilizing whatever or-
ganisms are most abundant near the waters surface. The dietmay consist of algae, zooplankton, fishes, terrestrial in-
sects and aquatic invertebrates (Moyle 1976) . Under crowded
conditions or periods when animal food is scarce, they may
feed extensively on filamentous algae and diatoms (Moyle
1976) . Mosquitofish were selected because they can survive
with high tissue selenium levels and thus may represent a
concentrated source of selenium.
San Joaquin Valley Kit Fox
The kit fox was included as the terrestrial food chain re-
ceptor because it is a federal and state-listed endangered
species. USFWS surveys indicate that kit foxes forage at KR
as there have been approximately 25 confirmed observationsof this species in the vicinity of KR since 1984. The fre-
quency of sitings has apparently increased in the last sev-
eral years. The kit fox diet consists of both large
grassland animals such as rabbits, hares, California ground
squirrels and small mammals, including California voles.
SAT72/77 3-6

8/4/2019 Risk Assessment Ke 00 Sacr
http://slidepdf.com/reader/full/risk-assessment-ke-00-sacr 82/202
1

8/4/2019 Risk Assessment Ke 00 Sacr
http://slidepdf.com/reader/full/risk-assessment-ke-00-sacr 83/202
deer, mice and other small rodents. Incidental food itemsinclude birds, reptiles, and insects. Little data exist re-
garding the specific diet of the kit fox in the KR area and
the ratio of quantity of food obtained in the vicinity of KR
to the total prey consumption of a typical kit fox is un-
known. Furthermore, the size of the kit fox population nearKR is not well known. USER has funded a kit fox study to
address these issues.
ESTIMATES OF KEY SPECIES POPULATION SIZES
The estimates of population densities and estimates of pastKR-related mortalities given in Table 3-1 are based on datafrom published literature, unpublished surveys by the USFWSand California Department of Fish and Game (DFG) , consulta-tion with personnel from these agencies, and other local
experts. These data are provided to put in perspective the
relative risks of selenium exposure of each population.They are not intended to indicate effects of past exposureto selenium at KR. The population data are indices of den-sity and in most cases the actual values are unknown. They
are presented here only for the purposes of assessing the
relative risks of fish and wildlife contamination under the
cleanup alternatives being considered at KR. Losses given
for KR include all sources of mortality that have been
directly observed, including predation, disease, and chemi-cal-induced toxicosis. The numbers do not reflect reproduc-tive failures that migrant birds may experience on their
breeding grounds that could be due to contaminants acquired
at KR.
As Table 3-1 suggests, the risks of contamination-inducedmortality vary greatly between these species. The data for
mallards suggest that this species is at low risk due to its
small population at KR (probably due to the hazing program)
relative to its San Joaquin Valley and statewide populations,
Both the American coot and black-necked stilt suffered sig-
nificant mortalities at KR during the period 1983-85, butsmall numbers of birds (4 percent) were "lost" relative to
their San Joaquin Valley and statewide populations. In con-
trast, the tricolored blackbird population at KR suffered an
almost total nesting failure in 1986. Only about 100 fledg-
lings were observed from a colony of approximately 47,000breeding adults. This total represents more than half the
San Joaquin Valley population and more than one-third of the
statewide population. The tricolored blackbird is largelyendemic to California, so the statewide population approxi-mates the global population for this species (DeHaven pers.
comm.). Preliminary USFWS data suggest the cause of this
mortality of tricolored blackbird nestlings was due to acute
SAT72/77 3-7

8/4/2019 Risk Assessment Ke 00 Sacr
http://slidepdf.com/reader/full/risk-assessment-ke-00-sacr 84/202

8/4/2019 Risk Assessment Ke 00 Sacr
http://slidepdf.com/reader/full/risk-assessment-ke-00-sacr 85/202

8/4/2019 Risk Assessment Ke 00 Sacr
http://slidepdf.com/reader/full/risk-assessment-ke-00-sacr 86/202
I

8/4/2019 Risk Assessment Ke 00 Sacr
http://slidepdf.com/reader/full/risk-assessment-ke-00-sacr 87/202
+J

8/4/2019 Risk Assessment Ke 00 Sacr
http://slidepdf.com/reader/full/risk-assessment-ke-00-sacr 88/202

8/4/2019 Risk Assessment Ke 00 Sacr
http://slidepdf.com/reader/full/risk-assessment-ke-00-sacr 89/202
selenium toxicosis from eating contaminated insects (Paveglio
pers . comm. a)
ESTIMATES OF TROPHIC RELATIONSHIPS
Trophic relationships of the key species are summarized inFigures 3-1 through 3-6. These ar.e based on discussionswith ecologists familiar with KR and on studies of the ecol-
ogy of the key species conducted elsewhere (Martin, et al.
1951, Pough 1951, Johnsgard 1975).
ADAPTATION FOR RISK ASSESSMENT
Evaluation of the risk of KR cleanup alternatives to fish
and wildlife requires, for each cleanup alternative, a pre-
diction of the exposure of wildlife to selenium. The trans-
fer of selenium through the food chain and concentrations ofselenium in food groups were estimated for each cleanup al-
ternative using empirical relationships (transfer factors)
derived from studies conducted at KR and elsewhere. The
empirical transfer factors served as the basis for the mathe-
matical model used to predict the relationship between sele-
nium in each trophic level and, ultimately, the exposure of
key species to selenium. The model is described in Chap-
ter 5.
In order to model and predict selenium transfer and dietary
exposure to the selenium transfer pathways shown in Fig-
ures 3-1 through 3-6 were simplified. Schematic represen-tations of selenium transfer and exposure used for predic-
tion purposes are shown in Figure 3-7 through 3-9. The sim-
plified selenium transfer diagram was developed in consul-
tation with USFWS personnel after the complex pathways were
identified for each of the key species.
The simplified pathways contain all of the basic selenium
transfer pathways present in the complex transfer diagrams
(Figures 3-1 through 3-6) . Although uptake pathways exist
that are not depicted in the simplified transfer diagrams
(e.g. direct uptake of dissolved selenium by herbivores and
carnivores) , transfer factors are derived to predict thechange in concentrations between compartments or trophic
levels that occurs as a result of all uptake pathways. In
other words, the concentrations of selenium in a particularcompartment is expressed solely as function of the concen-
trations in the adjacent compartment.
The simplified selenium transfer diagrams contain all of the
basic selenium compartments present in the complex pathways.
Since data from KR show that many groups contain similarlevels of selenium, it is not necessary to distinguish be-tween them for modeling purposes. For instance, there is a
SAT72/77 3-10

8/4/2019 Risk Assessment Ke 00 Sacr
http://slidepdf.com/reader/full/risk-assessment-ke-00-sacr 90/202
I
i
I

8/4/2019 Risk Assessment Ke 00 Sacr
http://slidepdf.com/reader/full/risk-assessment-ke-00-sacr 91/202
3-11
8/4/2019 Risk Assessment Ke 00 Sacr
http://slidepdf.com/reader/full/risk-assessment-ke-00-sacr 92/202

8/4/2019 Risk Assessment Ke 00 Sacr
http://slidepdf.com/reader/full/risk-assessment-ke-00-sacr 93/2023-12

8/4/2019 Risk Assessment Ke 00 Sacr
http://slidepdf.com/reader/full/risk-assessment-ke-00-sacr 94/202

8/4/2019 Risk Assessment Ke 00 Sacr
http://slidepdf.com/reader/full/risk-assessment-ke-00-sacr 95/202
> s
o S = g !
it 5 5 J !
3-13
8/4/2019 Risk Assessment Ke 00 Sacr
http://slidepdf.com/reader/full/risk-assessment-ke-00-sacr 96/202

8/4/2019 Risk Assessment Ke 00 Sacr
http://slidepdf.com/reader/full/risk-assessment-ke-00-sacr 97/202
o < -'
1^ I cJ; D <
3-14

8/4/2019 Risk Assessment Ke 00 Sacr
http://slidepdf.com/reader/full/risk-assessment-ke-00-sacr 98/202

8/4/2019 Risk Assessment Ke 00 Sacr
http://slidepdf.com/reader/full/risk-assessment-ke-00-sacr 99/202

8/4/2019 Risk Assessment Ke 00 Sacr
http://slidepdf.com/reader/full/risk-assessment-ke-00-sacr 100/202
H

8/4/2019 Risk Assessment Ke 00 Sacr
http://slidepdf.com/reader/full/risk-assessment-ke-00-sacr 101/202
s -
3

8/4/2019 Risk Assessment Ke 00 Sacr
http://slidepdf.com/reader/full/risk-assessment-ke-00-sacr 102/202

8/4/2019 Risk Assessment Ke 00 Sacr
http://slidepdf.com/reader/full/risk-assessment-ke-00-sacr 103/202

8/4/2019 Risk Assessment Ke 00 Sacr
http://slidepdf.com/reader/full/risk-assessment-ke-00-sacr 104/202
8/4/2019 Risk Assessment Ke 00 Sacr
http://slidepdf.com/reader/full/risk-assessment-ke-00-sacr 105/202
o
iiCO Ii.
O2

8/4/2019 Risk Assessment Ke 00 Sacr
http://slidepdf.com/reader/full/risk-assessment-ke-00-sacr 106/202

8/4/2019 Risk Assessment Ke 00 Sacr
http://slidepdf.com/reader/full/risk-assessment-ke-00-sacr 107/202
CO
< OO O< <5"-
UJu.
me» z
0)
o
Q.
UJ
ooz< X
= 2UJ"
U. I-
<OC
3-19

8/4/2019 Risk Assessment Ke 00 Sacr
http://slidepdf.com/reader/full/risk-assessment-ke-00-sacr 108/202

8/4/2019 Risk Assessment Ke 00 Sacr
http://slidepdf.com/reader/full/risk-assessment-ke-00-sacr 109/202
variety of non-rooted aquatic plants present at KR, includingNitella , attached diatoms, attached green algae, etc. How-ever, since rooted plants can acquire selenium from sedimentand water (and selenium levels in each will be affected dif-ferently by each cleanup alternative) , selenium levels inrooted plants are expected to respond differently than non-rooted plants to implementation of each alternative.
Associated with the simplified selenium transfer diagram foreach of the key organisms are estimates of the selenium con-centrations in each compartment (e.g., sediment, water, non-rooted plants, etc.), transfer factors, and diet factors.Associated with each mean estimate is a variance estimate(plus or minus one standard deviation) that reflects empiri-cal variability and confidence in empirical and literaturevalues.
Important aspects of the simplified pathways, including ex-planations of how key values were determined, are discussedbelow. Data used to derive transfer factors and their sour-ces are summarized in Table 3-2. The transfer factors aregiven in Tables 3-3 through 3-5. Other important aspects ofapplicability of the simplified selenium transfer diagramsto risk assessment are discussed in Chapter 5.
SEDIMENT
Since water applied to KR will have very low selenium con-centration (less than 1 yg/l) , the major potential source ofselenium for biological uptake is the soil. Selenium canenter the biosphere directly from selenium forms in the
sediments or it can dissolve in water that will be presentin the ponds as described in each alternative.
The amount of selenium currently present in sediments is
quite variable but tends to be greater in southern pondsthan in northern ponds. In the FRP alternative, where noremoval of sediment is involved, a value of 7 mg/kg ±7
(±1 standard deviation) is used. This concentration is
representative of the southern ponds which have relativelyhigh sediment selenium concentrations (see Table 4-2, USER1986a) . The variance component of this estimate reflectsthe spatial heterogeneity of selenium measured at KR. Afterexcavating sediment with selenium concentrations greaterthan 4 mg/kg (Onsite Disposal Plan-1) , average sedimentselenium concentrations will be 3 mg/kg ±2. The OnsiteDisposal Plan-2 will result in a sediment selenium concen-tration of 1.5 mg/kg ±1.
SAT72/77 3-20

8/4/2019 Risk Assessment Ke 00 Sacr
http://slidepdf.com/reader/full/risk-assessment-ke-00-sacr 110/202
1

8/4/2019 Risk Assessment Ke 00 Sacr
http://slidepdf.com/reader/full/risk-assessment-ke-00-sacr 111/202
Table 3-2
SUMMARY OF DATA USED TO DERIVE TRANSFER FACTORS'
(±1 STANDARD DEVIATION)
Non-Piscivorous Bird Pathway

8/4/2019 Risk Assessment Ke 00 Sacr
http://slidepdf.com/reader/full/risk-assessment-ke-00-sacr 112/202
I*

8/4/2019 Risk Assessment Ke 00 Sacr
http://slidepdf.com/reader/full/risk-assessment-ke-00-sacr 113/202
Table 3-3
TRANSFER AND DIET FACTORS FOR SIMPLIFIED SELENIUM
TRANSFER DIAGRAM FOR MALLARD, AMERICAN COOT,
TRICOLORED BLACKBIRD, AND BLACK-NECKED STILT
(Standard Deviations are in parentheses)
Sediment Cone, (mg/kg d.w.)
Surface Water Supply (mg/1)
Transfer Factors
1 Sediment - Rooted Plants
2 Sediment - Water
3 Water - Rooted Plants
4 Water - Non-rooted Plants
5 Non-rooted Plants -
Herbivores
6 Herbivores - Carnivores
7 Sediment - Detritus/
Microbes
8 Detritus/Microbes -
Detritivores
9 Detritivores - Carnivores
Relative Supply Factors
a Sediment - Rooted Plants
b Water - Rooted Plants
c Surface Water Supply - Water
d Sediment - Water
Past
Condition

8/4/2019 Risk Assessment Ke 00 Sacr
http://slidepdf.com/reader/full/risk-assessment-ke-00-sacr 114/202
^

8/4/2019 Risk Assessment Ke 00 Sacr
http://slidepdf.com/reader/full/risk-assessment-ke-00-sacr 115/202
Tatle 3-4
TRANSFER AND DIET FACTORS FOR SIMPLIFIED SELDJIUM
TRANSFER DIAGRAM FOR EARED GREBE AND MOSQUITOFISH
(Standard Deviations are in Parentheses)
Sediment Cone, (mg/kg d.w.)Surface Water Supply (mg/1)
Transfer Factors
1 Sediment - Water^
2 Water - Non-rooted Plants
3 Non-rooted Plants -
Herbivores
4 Herbivores - Carnivores
a Surface Water Supply - Water
b Sediment - Water
Past
Condition

8/4/2019 Risk Assessment Ke 00 Sacr
http://slidepdf.com/reader/full/risk-assessment-ke-00-sacr 116/202
i

8/4/2019 Risk Assessment Ke 00 Sacr
http://slidepdf.com/reader/full/risk-assessment-ke-00-sacr 117/202
Table 3-5
TRANSFER AND DIET FACTORS FOR SIMPLIFIED SELENIUM
TRANSFER DIAGRAM FOR SAN JOAQUIN VALLEY KIT FOX
(Standard Deviations are in parentheses)

8/4/2019 Risk Assessment Ke 00 Sacr
http://slidepdf.com/reader/full/risk-assessment-ke-00-sacr 118/202

8/4/2019 Risk Assessment Ke 00 Sacr
http://slidepdf.com/reader/full/risk-assessment-ke-00-sacr 119/202
NON-PISCIVOROUS AQUATIC BIRD EXPOSURE PATHWAY
Aquatic Pathway
One of the three pathways of selenium transfer into and throughthe food chain is the aquatic pathway. Recent studies byLBL (1986) have indicated that selenium flux from sediments
to "clean" water (less than 2 yg/l) will result in a concen-tration in the water column selenium concentration of between
approximately 2 and 15 yg/1. They have found at KR that
introduction of clean water resulted in a water column con-
centration of less than 10 yg/1. Further, their laboratoryexperiments suggest that contaminated sediments can cause up
to a 15 yg/l increase in water column concentration. The
selenium concentrations in the water to be applied to KR
will be less than 2 yg/1. Based on these data, we expect
the selenium in the water column to be between 2 and 15 yg/1.The empirical relationship between the concentrations of se-
lenium in sediments in the Flexible Response Plan (7 mg/kg)
and those expected in the water column (2-15 yg/1) , was usedto calculate a range of transfer factors of 0.0003-0.002.
This range of transfer factors was used in the model to cal-
culate water column selenium concentration for cleanup al-
ternatives. Unlike other transfer factors it is described
with a uniform distribution rather than the log normal dis-
tribution associated with the other transfer factors. There-
fore, no variance component is given.
The transfer factor between water and non-rooted plants at
KR (Nitella and aufwuchs) was calculated to be 187 +22 using
paired observations of selenium concentrations in water and
unrooted plants. This transfer factor reflects the rela-tionship at a water selenium concentrations very much higherthan is expected to result from either cleanup alternative.
Since the uptake and metabolism of selenium probably does
not have a linear relationship with concentrations in water,
a transfer factor appropriate for the predicted range(2-15 yg/1) was derived from literature reviewed by Lemly
(1985a) and Ohlendorf, et al. (1986). The same procedure
was followed for derivation of other transfer factors in the
aquatic food chain. Transfer factors derived from litera-
ture were generally about two to three times higher than
those observed in high water selenium concentrations at KR.
Benthic Pathway
The benthic epifauna and infauna can acquire selenium from
overlying water and from sediments with which they live in
close association. We assumed in our simplified selenium
transfer diagram that sediments would be the major source of
selenium available to benthic organisms since the concentra-tions in water are expected to decline substantially in both
SAT72/77 3-25

8/4/2019 Risk Assessment Ke 00 Sacr
http://slidepdf.com/reader/full/risk-assessment-ke-00-sacr 120/202

8/4/2019 Risk Assessment Ke 00 Sacr
http://slidepdf.com/reader/full/risk-assessment-ke-00-sacr 121/202
alternatives. Since the sediment selenium concentrationsare not expected to change in the flexible response alterna-tive and change by only a factor of two to three (versus 10
to 100 times in the water for the aquatic pathway) , the empi-rical relationship between selenium concentrations in thevarious selenium compartments (e.g., sediment, detritus,etc.) at KR was used to determine the selenium transfer fac-
tors .
Rooted Plant Pathway
Rooted aquatic and semi-aquatic plants at KR can potentiallyacquire selenium from both sediment/soil, via the root/rhizomesystem, and water, via the leaf tissues. There are no defini-tive studies describing selenium uptake pathways of aquaticplants (Denny 1980) . However, studies involving other aquaticangiosperms and compounds other than selenium suggest thataquatic plants are somewhat opportunistic and will acquireions from the most bio-available source (McRoy and Barsdate
1970, Nicholas and Keeney 1976, Faraday and Churchill 1979,Brinkhuis et al. 1980, Denny 1980, Kenworthy et al. 1982).Sculthorpe (1967) indicates that tissues typically associatedwith nutrient translocation are reduced or vestigial in mostaquatic angiosperms. Based on these studies, we have infer-
red an approximate ratio of sediment to aquatic sources of
selenixim uptake by aquatic plants of 1:3. This is shown in
Table 3-3 as a "relative supply factor." These studies indi-cate that metal ions are not transported from sediments to
the water column.
Diets of Key Non-Piscivorous Aquatic Bird Species
An estimate of selenium exposure requires a quantificationof the fraction of the whole diet of each organism (diet
factor) that is contributed by each compartment contained in
the simplified selenium transfer diagram. A review of scien-
tific literature was conducted for each species to quantifytheir food habits (Martin et al. 1951, Rough 1951, Johnsgard
1975, Bellrose 1976) . Qualitative data of Ohlendorf , et al.
(pers. comm.) support the estimates of diet factors given in
Table 3-2. The key to the labels associated with each valuein Table 3-2 is given in Figures 3-7 through 3-9.
Some species had dietary preferences that changed very lit-tle with life stage or season. The preferences of otherspecies changed substantially with season or life stage.Ranges of food preferences were developed, as appropriatefor the specific life stage, sex, etc., of the four species.
This procedure for determining these values is imperfectsince the key species probably do not distinguish between,for instance, epiphytic herbivores and carnivores. In such
SAT72/77 3-26

8/4/2019 Risk Assessment Ke 00 Sacr
http://slidepdf.com/reader/full/risk-assessment-ke-00-sacr 122/202
m

8/4/2019 Risk Assessment Ke 00 Sacr
http://slidepdf.com/reader/full/risk-assessment-ke-00-sacr 123/202
situations, where selection is approximately a function oftheir relative numbers and availability, the ratio of therelative mass of the two groups was used to estimate theratio of their consumption. Mass units were used becauseselenium data are so expressed. For example, if it was de-termined from the literature that the diet of species X is
50 percent (by weight) epiphytic invertebrates, data from KR
would be used to determine their relative availability.Data indicate that the ratio (mass) of herbivores to carni-vores is approximately 5:1. The dietary percentage would bedetermined using the 5:1 ratio, as follows:
Herbivores 5 x 0.50 = 0.42
6
Carnivores 1 x 0.50 = 0.086
Estimates of the variability in diet and confidence in esti-mates of mean dietary percentages are reflected in the vari-ance term associated with each mean.
The simplified selenium transfer diagram also provides for
consumption of uncontaminated food from areas adjacent to
KR. This component of the diet was minimized so that "worstcase" estimates of selenium exposure would be obtained.
FISH/PISCIVOROUS BIRD PATHWAY
The fish/piscivorous bird pathway was developed following a
similar procedure to that used in the development of thenon-piscivorous aquatic bird exposure pathway. The fish/fish-eating bird pathway described in Figure 3-5 containsonly the aquatic pathway and not the benthic or rooted plantpathway. The reasons for omitting the benthic pathway arethat mosquitofish do not use the benthos, and introductionof fish that do use the benthos is not anticipated at KR.
The rooted plant pathway is also not included in the simpli-fied selenium transfer diagram for the fish/piscivorous birdexposure pathway because rooted plants are not a componentof the fish/piscivorous bird food chain.
Fish
Mosquitofish are included in the aquatic carnivore categorybecause of their functional similarity to other members ofthe category at KR. Mosquitofish under past conditions havebeen found at KR to have similar selenium levels as that ofother carnivores such as odonate larvae (USER 1986a, LBL1986) . Although mosquitofish consume some non-rootedplants, their selenium concentrations can be described as a
function of selenium levels in herbivores. Therefore, thesame transfer factors are used in the fish/piscivorous bird
SAT72/77 3-27

8/4/2019 Risk Assessment Ke 00 Sacr
http://slidepdf.com/reader/full/risk-assessment-ke-00-sacr 124/202

8/4/2019 Risk Assessment Ke 00 Sacr
http://slidepdf.com/reader/full/risk-assessment-ke-00-sacr 125/202
pathway as were developed for the non-piscivorous aquaticbird pathway.
Birds
The eared grebe was selected as the ultimate receptor in thefish/piscivorous bird pathway. The eared grebe does not
search for food over a broad habitat range and, therefore,it was assumed that all of its food was obtained at KR andthat fish constitute all of its diet. Eared grebes alsofeed on other types of organisms at KR such as soldierflylarvae. However, since the intent is to model exposure of a
fish-eating bird, fish were emphasized in the model.
TERRESTRIAL PATHWAY
The San Joaquin kit fox population near KR is currently un-der study since little is known of their numbers, feedingrange and feeding habits. However, it is possible to esti-mate exposure based on existing information (although stan-dard deviations associated with transfer and diet factorsare large)
The simplified selenium transfer diagram for the kit fox is
given in Figure 3-9. The transfer factors were derived fromdata in USER (1986a) and are given in Table 3-5. Diet fac-
tors were estimated based on the relative abundance ofherbivorous and carnivorous mammals which appear to consti-tute most of the diet of the kit fox. The fraction of thetotal diet obtained at KR was calculated by dividing the
total estimated kit fox range (1,280 acres) into the uplandarea at KR (350 acres). The fraction obtained at KR is es-
timated to decline in the future as management practicesreduce kit fox feeding habitat. Uptake of selenium from
water drunk at KR is not included and is expected to be
small given the low dissolved selenium levels expected and
the small quantity of water consumed relative to prey.
SAT72/77 3-2!

8/4/2019 Risk Assessment Ke 00 Sacr
http://slidepdf.com/reader/full/risk-assessment-ke-00-sacr 126/202

8/4/2019 Risk Assessment Ke 00 Sacr
http://slidepdf.com/reader/full/risk-assessment-ke-00-sacr 127/202
Chapter 4
TOXICOLOGY OF SELENIUM
INTRODUCTION
The purpose of thisanalysis of selenium toxicity is to put
into context the selenium exposure estimates generated in
Chapter 5. Available data concerning selenium toxicity to
key organisms at KR are reviewed to identify harmful levels
of dietary selenium intake. This analysis is compared with
the results of selenium exposure estimates for each cleanup
alternative in Chapter 5.
ENVIRONMENTAL SOURCES
Selenium in the environment, its occurrence, biogeochemistry
,
and toxicity have been reviewedextensively (Rosenfeld and
Beath 1964, Shamberger 1981-1983, Zingaro and Cooper 1974,
Wilber 1980, NRC 1976, 1980, 1983, Adriano 1986, Eisler
1985) . Selenium may become available to bioaquatic and ter-
restrial organisms from the weathering of rocks and soils
(Rosenfeld and Beath 1984) and the activities of man (USEPA
1980) . Selenium in the environment may occur in numerous
chemical forms due to the processes of oxidation and reduc-
tion and biologically mediated transformations. However,
the various forms of selenium are not distinguished in this
risk assessment because the toxicity evaluation includes all
forms of selenium. This approach is conservative relative
to selenium toxicity because most datacollected at KR de-
scribe total selenium concentrations. The risk charac-
terization also uses total selenium concentrations.
BIRDS
SELENIUM TOXICITY
Excessive selenium has produced toxicity symptoms in numer-
ous animal and human populations. The range of health pro-
blems observed in birds is discussed in the following
section. Extensive reviews of selenium toxicity inother
animals are found in Rosenfeld and Beath (1964), NRC (1976,
1980) , Wilber (1980) , USEPA (1980) ; and human effects are
discussed by Shapiro (1973), and National Academy of
Sciences (1977)
.
A summary of pertinent literature references showing a rela-
tionship between selenium in avian diet and effects is pre-
sented in Table 4-1. A discussion of these findings is
presented in the following sections.
SAT74/40 4-1

8/4/2019 Risk Assessment Ke 00 Sacr
http://slidepdf.com/reader/full/risk-assessment-ke-00-sacr 128/202

8/4/2019 Risk Assessment Ke 00 Sacr
http://slidepdf.com/reader/full/risk-assessment-ke-00-sacr 129/202
n

8/4/2019 Risk Assessment Ke 00 Sacr
http://slidepdf.com/reader/full/risk-assessment-ke-00-sacr 130/202
I
I
I
I
I
I
I
I
I

8/4/2019 Risk Assessment Ke 00 Sacr
http://slidepdf.com/reader/full/risk-assessment-ke-00-sacr 131/202
Selenium toxicity has been shown to occur in poultry, quail,
and mallards from extensive studies dating back to the
1930 's. These studies have shown toxic response to dietary
ingestion of selenium compounds in an array of manifesta-
tions such as reduced growth; reproductive impairment;
embryogenic, hatchling, and adult mortality; deformities;
and teratogenic effects.
The early studies of chickens receiving selenium in the diet
from cereal grains grown in seleniferous soils showed both
reduced growth and reproductive impairment to complete fail-
ure of hatching (Moxon 1937, Foley et al. 1937, Foley and
Moxon 1938, Moxon and Rhian 1943). The selenium content of
the grain has been speculated to have contained as much as
10 mg/kg selenium in the form of selenomethionine (Heinz, et
al. in press). The chicks produced in some studies (Franke
and Tulley 1936) showed severe deformities and high morta-lity. Recent studies (Ohlendorf, et al. 1986, Ohlendorf et
al. in press and Saiki 1986) have correlated diet selenium
and low hatchability embryonic deformity and high mortalityin wild birds at KR.
The mechanism of selenium toxicity is not well understood
(Ohlendorf, et al. 1986) . However, researchers have demon-
strated various aspects of manifestations of avian selenium
toxicity.
Avian Toxicity
Reproductive failure, reduced fecundity, and mortality of
adults have been demonstrated using a seleniiim diet. A
study by Heinz, et al. (in press) showed no effect on repro-ductive success, growth, or survival in mallards with dietary
selenium concentrations up to 10 mg/kg. Higher doses of
selenium show toxicity. Eleven of 12 adults died on a
100 mg/kg diet and one drake died in the 25 mg/kg diet group.
Females on the 25 mg/kg diet showed egg production, fertil-
ity, and hatching success diminished significantly when com-
pared to ducks fed with up to 10 mg/kg selenium. Survival
of ducklings and 21-day-old body weights were reduced for
the ducks receiving 25 mg/kg selenium selenite or 10 mg/kg
selenomethionine. Ten and 25 mg/kg inorganic selenium and
10 mg/kg selenomethionine showed teratogenic effects. Eggs
containing 22.2 percent abnormal embryos were produced by
mallards receiving 25 mg/kg sodium selenite in the diet.
Similarly, mallards fed the 10 mg/kg organic selenium com-
pound showed 18.3 percent abnormal embryos with many indi-
viduals having multiple malformations such as missing or
reduced bills, toes, eyes, and twisted legs.
SAT74/40 4-3

8/4/2019 Risk Assessment Ke 00 Sacr
http://slidepdf.com/reader/full/risk-assessment-ke-00-sacr 132/202
I
I
I
I
i

8/4/2019 Risk Assessment Ke 00 Sacr
http://slidepdf.com/reader/full/risk-assessment-ke-00-sacr 133/202
The Heinz study concluded that selenomethionine was moretoxic to mallards than was selenite. Selenomethionine is
reported as the major form of selenium in plants; thus, it
may pose the greatest threat to herbivorous waterfowl (and
carnivorous/omnivorous waterfowl utilizing herbivorous in-vertebrates/vertebrates for major food items)
.
Embryonic Effects
Selenium compounds introduced into chick embryos produced a
range of deformities due to necrosis of brain and spinalcord tissues, the optic cups and vesicles, and in limb tis-sues (Gruenwald 1985) . Embryonic malformations such as
twisted necks and legs, missing appendages, absent or de-formed beaks, protruding eyes, and edema were observed when15 mg/kg selenium were introduced to the diet of chickens(Foley, et al. 1937, Franke , et al. 1936, Franke and Tulley1936). Chickens fed 7 to 9 mg/kg selenium or sodixim seleniteproduced embryos with edema of the head and neck (Ort and
Latshaw 1978, Arnold, et al. 1973). Mallards fed 10 mg/kgselenium as selenomethionine or sodium selenite producedabnormal embryos (Heinz, et al. in prep.). The abnormali-ties noted in the embryos included stunted growth, swollennecks, hydrocephaly, and malformations such as reduced or
absent lower bill, spoon-shaped bill, missing toes, twisted
legs, and small or missing eyes. Control group abnormalitieswere limited to minor bill defects, stunting, and swollennecks
.
Shell quality as measured by the Radcliffe Index was poorerand duckling weight at birth was lower from eggs produced by
mallard hens fed 25 mg/kg selenium (Heinz, et al. in press).
Hatching Success
Hatching success of fertile eggs has been considered the
most sensitive measure of reproductive effect of selenium(Heinz, et al. in press). Ort and Latshaw (1978) identified5 mg/kg selenium (sodium selenite) as "borderline toxic" in
chickens due to depression of hatching rates. Other studies
of chickens (Ort and Latshaw 1978, Arnold, et al. 1972,
1973) and Japanese quail (El-Begearmi, et al. 1977) showedreduced hatchability success when 7 to 9 mg/kg and 6 to12 mg/kg selenium doses respectively were fed in the diet.
Mallards fed up to 25 mg/kg selenium (sodium selenite) showed
no statistically significant decrease in hatchability, al-
though some decline was noted at 25 mg/kg (Heinz, et al. in
press)
.
FINDINGS
The limited information demonstrating selenium toxicity in
avian species shows that selenium concentrations of 5 mg/kg
SAT74/40 4-4

8/4/2019 Risk Assessment Ke 00 Sacr
http://slidepdf.com/reader/full/risk-assessment-ke-00-sacr 134/202

8/4/2019 Risk Assessment Ke 00 Sacr
http://slidepdf.com/reader/full/risk-assessment-ke-00-sacr 135/202

8/4/2019 Risk Assessment Ke 00 Sacr
http://slidepdf.com/reader/full/risk-assessment-ke-00-sacr 136/202

8/4/2019 Risk Assessment Ke 00 Sacr
http://slidepdf.com/reader/full/risk-assessment-ke-00-sacr 137/202

8/4/2019 Risk Assessment Ke 00 Sacr
http://slidepdf.com/reader/full/risk-assessment-ke-00-sacr 138/202
i
I

8/4/2019 Risk Assessment Ke 00 Sacr
http://slidepdf.com/reader/full/risk-assessment-ke-00-sacr 139/202
Chapter 5
RISK CHARACTERIZATION
INTRODUCTION
Estimation of the risks to fish and wildlife associated with
KR cleanup alternatives is uncertain because of the lack ofcomplete knowledge of the KR ecosystem food chains, uncer-
tainty about the diet of key species, and uncertainty about
the transfer factors which describe the biomagnification of
selenium between food chain components along exposure path-ways. Estimates of uncertainty for diet factors and trans-
fer factors for the key species were presented in Chapter 3.
The uncertainty associated with each diet and transfer fac-
tor is compounded with other uncertainties in the estimationof exposure level and increases the variability in a final
estimate of exposure. The risk characterization provides
estimates of this total variability through the use of aMonte Carlo simulation model.
KESTERSON MONTE CARLO MODEL
A Monte Carlo model is constructed by first building a con-
ceptual model of the system. For KR, the model consists of
a simplified selenium transfer model developed for each of
the key species. These models are described in Chapter 3.
The model simulates the selenium concentration in each
compartment along an exposure pathway by multiplying the
selenium concentration in the previous compartment by theappropriate transfer factor. Key species diet selenium con-
centration is calculated by weighting each component of the
diet by the appropriate diet factor. Boundary or initial
conditions for the model are those selenium concentrations
in KR sediments or surface water after implementation of a
clean-up alternative.
Each estimated transfer factor and diet factor has an assoc-
iated standard distribution, either uniform or lognormal.
The lognormal distribution is used to represent uncertainty
in the transfer and diet factors because it is a common dis-
tribution of selenium concentration data observed in nature.In addition, the lognormal distribution has several statis-
tically desirable properties, such as estimating only posi-
tive values. It is a skewed distribution that produces rare
large values more often than does the normal distribution.The best estimate of the transfer and diet factors is takenas the mean of the distribution and the uncertainty is ex-
pressed as a standard deviation or range.
SAT75/7 5-1

8/4/2019 Risk Assessment Ke 00 Sacr
http://slidepdf.com/reader/full/risk-assessment-ke-00-sacr 140/202

8/4/2019 Risk Assessment Ke 00 Sacr
http://slidepdf.com/reader/full/risk-assessment-ke-00-sacr 141/202
The model is run several hundred times with each iterationusing new values for transfer and diet factors drawn random-ly from the assumed distribution for each factor. The re-sults of each simulation are tabulated and used to create anempirical frequency distribution of predicted selenium con-centrations in the diet of each key species.
Simulations were run for each cleanup alternative for eachkey species. The model was also run under past conditionswith the application of drainwater to KR.
DISCUSSION
MODEL RESULTS
Figures 5-1 through 5-3 summarize results for each of thecleanup alternatives. The figures show the range of pre-dictions of selenium concentration in the diet of key
species. Figures 5-4 through 5-10 show the results usinghistoric conditions with application of drainwater. For anycombination of cleanup alternative and key species, the50-percent probability level represents predicted diet sele-nium concentration resulting from the mean transfer and dietfactors for that particular condition. The uncertainty ofthe exposure estimate is shown by the probability distribu-tion about the mean.
As an example, consider the results of predictions ofmallard exposure under the FRP. The 50-percent probabilitylevel represents a diet selenium concentration of about5 mg/kg (from Figure 5-1). Therefore, 50 percent of thepredictions of diet selenium concentration are less than5 mg/kg, or based on the selenium transfer model and on theuncertainty of transfer and diet factors, the FRP has abouta 50-percent chance of resulting in a mallard diet seleniiom
concentration of less than 5 mg/kg.
MODEL LIMITATIONS
Temporal Context
The exposure estimates for each alternative are based onbasic assumptions regarding the steady state relationshipbetween selenium concentration in sediments and the result-ing concentration in surface water. Although this relation-ship is based on existing knowledge of selenium chemistryand field and laboratory experiments, insufficient data havebeen collected to determine the length of time that willelapse until steady state conditions are achieved. The mod-el results do not take into account the length of time nec-essary to achieve steady state conditions.
SAT75/7 5-2

8/4/2019 Risk Assessment Ke 00 Sacr
http://slidepdf.com/reader/full/risk-assessment-ke-00-sacr 142/202

8/4/2019 Risk Assessment Ke 00 Sacr
http://slidepdf.com/reader/full/risk-assessment-ke-00-sacr 143/202
5-3

8/4/2019 Risk Assessment Ke 00 Sacr
http://slidepdf.com/reader/full/risk-assessment-ke-00-sacr 144/202
1
i

8/4/2019 Risk Assessment Ke 00 Sacr
http://slidepdf.com/reader/full/risk-assessment-ke-00-sacr 145/202

8/4/2019 Risk Assessment Ke 00 Sacr
http://slidepdf.com/reader/full/risk-assessment-ke-00-sacr 146/202
11
11
11
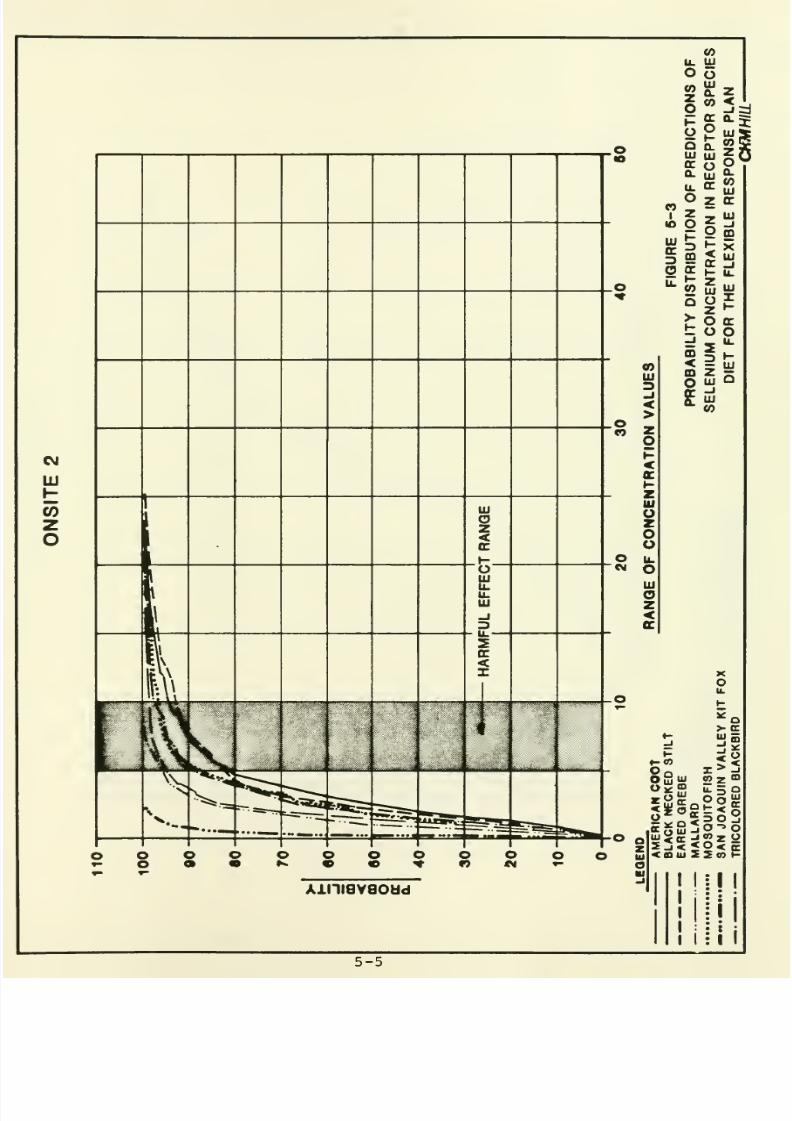
8/4/2019 Risk Assessment Ke 00 Sacr
http://slidepdf.com/reader/full/risk-assessment-ke-00-sacr 147/2025-5

8/4/2019 Risk Assessment Ke 00 Sacr
http://slidepdf.com/reader/full/risk-assessment-ke-00-sacr 148/202
li

8/4/2019 Risk Assessment Ke 00 Sacr
http://slidepdf.com/reader/full/risk-assessment-ke-00-sacr 149/202
r
ij
<
AllKGVaOUd

8/4/2019 Risk Assessment Ke 00 Sacr
http://slidepdf.com/reader/full/risk-assessment-ke-00-sacr 150/202
I

8/4/2019 Risk Assessment Ke 00 Sacr
http://slidepdf.com/reader/full/risk-assessment-ke-00-sacr 151/202

8/4/2019 Risk Assessment Ke 00 Sacr
http://slidepdf.com/reader/full/risk-assessment-ke-00-sacr 152/202

8/4/2019 Risk Assessment Ke 00 Sacr
http://slidepdf.com/reader/full/risk-assessment-ke-00-sacr 153/202
.o
ui
ozoo
ZUl
-iUi•>
-Ui
5cc
o
COCO DQ tr
«r << >
= CD
CD D3 O
5- J?«
< ? o^ w S;a. — w
Ui ° 500 lU lU
U O. zCO CO
zo o
< _l
»- CV4
UJ UJ
OL u. O O
All~N8VaOUd
5-8

8/4/2019 Risk Assessment Ke 00 Sacr
http://slidepdf.com/reader/full/risk-assessment-ke-00-sacr 154/202
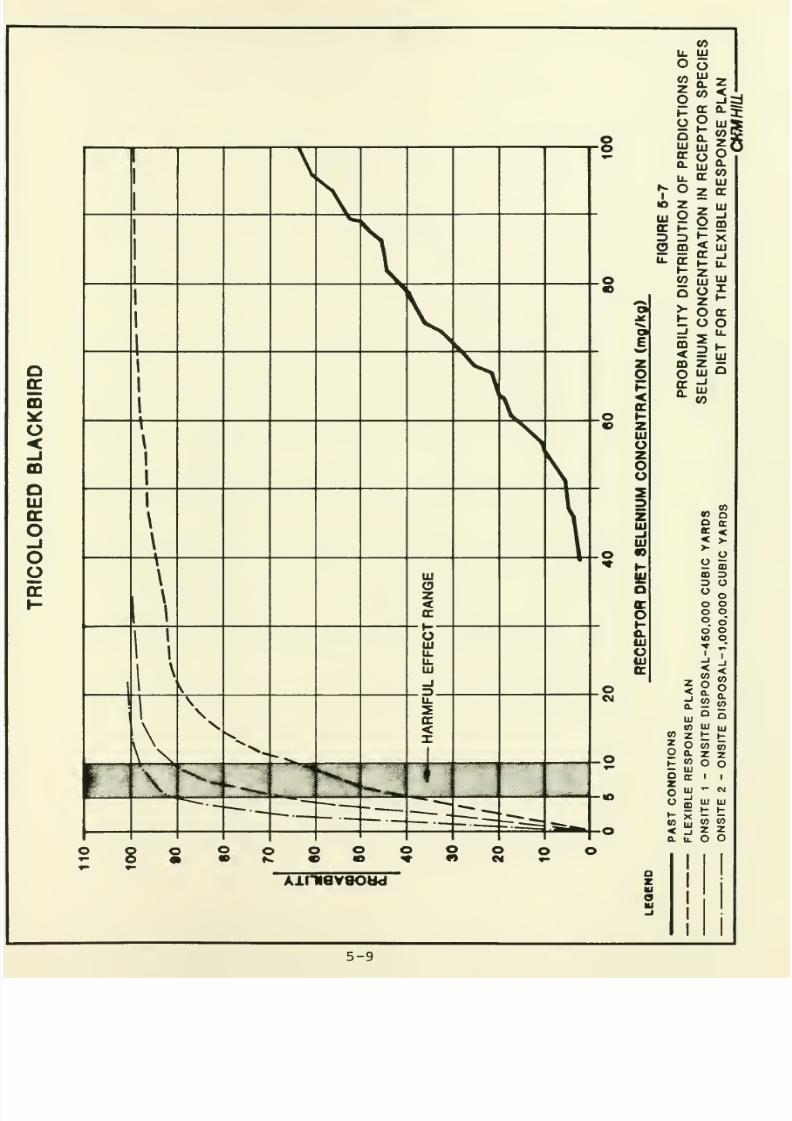
8/4/2019 Risk Assessment Ke 00 Sacr
http://slidepdf.com/reader/full/risk-assessment-ke-00-sacr 155/202

8/4/2019 Risk Assessment Ke 00 Sacr
http://slidepdf.com/reader/full/risk-assessment-ke-00-sacr 156/202

8/4/2019 Risk Assessment Ke 00 Sacr
http://slidepdf.com/reader/full/risk-assessment-ke-00-sacr 157/2025-10

8/4/2019 Risk Assessment Ke 00 Sacr
http://slidepdf.com/reader/full/risk-assessment-ke-00-sacr 158/202

8/4/2019 Risk Assessment Ke 00 Sacr
http://slidepdf.com/reader/full/risk-assessment-ke-00-sacr 159/202

8/4/2019 Risk Assessment Ke 00 Sacr
http://slidepdf.com/reader/full/risk-assessment-ke-00-sacr 160/202
I
I
I
i
I
II

8/4/2019 Risk Assessment Ke 00 Sacr
http://slidepdf.com/reader/full/risk-assessment-ke-00-sacr 161/202
8/4/2019 Risk Assessment Ke 00 Sacr
http://slidepdf.com/reader/full/risk-assessment-ke-00-sacr 162/202

8/4/2019 Risk Assessment Ke 00 Sacr
http://slidepdf.com/reader/full/risk-assessment-ke-00-sacr 163/202
Accuracy of Predictions
The model does not describe uptake and loss rates of selen-ium by the components of the exposure pathways; rather, themodel uses transfer and diet factors observed in the labora-tory and the field. The uncertainty estimates of thesefactors are based on these observations, but they do not
necessarily simulate exact conditions at KR.
Because insufficient information exists to develop quanti-tative dose-response relationship for diet selenium exposurefor the key species at KR, the model results cannot be usedto make quantitative estimates of the impact of cleanupalternatives on the exposed population. The toxicity pro-files, however, can be used along with model results to de-termine the uncertainty of the relative safety of cleanupalternatives
.
Applicability to Other Organisms
Seven species that are representative of common and impor-tant trophic levels at KR were selected for selenium expo-sure evaluation. The impact of each cleanup alternative oneach species can be considered in terms of the fraction of
the total population that resides at KR. This is also truefor other species that were not directly considered in theanalysis since the trophic levels of the seven species arerepresentative of those of a large number of species at KR.
In other words, the transfer and diet factors (and associ-ated uncertainties) and, hence, the selenium exposure esti-mates have broad applicability and are not restricted to the
seven species for which they were derived.
Habitat Changes
The model does not address the potential indirect effect ofimplementation of each alternative on wildlife populationsthat may result from changes in habitat. As discussed ear-lier, this is the primary reason why the Immobilization Planis not addressed in this analysis. Each alternative willaffect the habitat of KR to a variable and unquantified ex-tent. For example, implementation of Onsite-2 will reducetricolored blackbird nesting habitat. Furthermore, diet
factors may change in the case of opportunistic organisms inresponse to changes in food availability brought about byimplementation of a particular alternative.
IMPLICATION OF EXPOSURE PREDICTIONS
The toxicity profiles for selenium developed in Chapter 4
indicate the following diet (average total diet) seleniumconcentrations may result in harmful impacts:
SAT75/7 5-13

8/4/2019 Risk Assessment Ke 00 Sacr
http://slidepdf.com/reader/full/risk-assessment-ke-00-sacr 164/202
I
i
m

8/4/2019 Risk Assessment Ke 00 Sacr
http://slidepdf.com/reader/full/risk-assessment-ke-00-sacr 165/202
Harmful DietDiet Selenium CleanupConcentration Goals
Key Species Group (mg/kg) (mg/kg)
Birds 5-10 3
Mammals 2-5 3
Fish 5-10 5
Harmful diet selenium concentrations are different thancleanup goals because the harmful levels represent concen-trations that are expected to cause harm rather than themore conservative cleanup levels. Table 5-1 shows the per-cent of diet selenium predictions that are below harmfullevels for each key species and for each cleanup alterna-tive.
The risk characterization does not indicate that any of theplans will clearly fail. For avian species, the results for
FRP indicate that 40 to 65 percent of the diet seleniumpredictions will be beneath harmful effect levels. Itshould be noted that the most recent results of LBL researchat KR (LBL 1986) indicate that surface water seleniumconcentrations may be in the 2- to 5-pg/l range under theFRP. The model results are based on a range of 2 to15 yg/1. The FRP may therefore have a greater chance ofbeing effective than the modeling results indicate.
The Onsite Disposal Plan-1 shows a greater frequency of be-low harmful effect predictions than the FRP, 65 to 90 per-cent. The Onsite Disposal Plan-2 results in the highest
frequency of below harmful effect predictions, 85 to 95 per-cent.
Although the Onsite Disposal Plans show 65 to 95 percentaverage probability of diet selenium concentrations belowthe harmful effect level, these plans will be less likely toachieve the more conservative diet cleanup goals. Forexample. Figure 5-11 shows the relationship between theprobability of selenium concentrations in American coot andblack-necked stilt diets being less than 3 mg/kg versusresidual selenium concentrations in KR soils after onsitedisposal. These two species represent the range of predict-
ed responses. The Onsite Disposal Plan-1 appears to haveabout a 30- to 50-percent chance of achieving receptor dietselenium levels less than 3 mg/kg. The Onsite DisposalPlan-2 has about a 55- to 85-percent chance. To achieveprobabilities in the 90- to 100-percent range, soil residu-als would have to be less than 0.5 mg/kg. To achieve theseresidual levels, excavation would have to extend to greaterthan 6 inches (i.e., excavating the entire site to up to2 feet)
.
SAT75/7 5-14

8/4/2019 Risk Assessment Ke 00 Sacr
http://slidepdf.com/reader/full/risk-assessment-ke-00-sacr 166/202

8/4/2019 Risk Assessment Ke 00 Sacr
http://slidepdf.com/reader/full/risk-assessment-ke-00-sacr 167/202
o

8/4/2019 Risk Assessment Ke 00 Sacr
http://slidepdf.com/reader/full/risk-assessment-ke-00-sacr 168/202
I
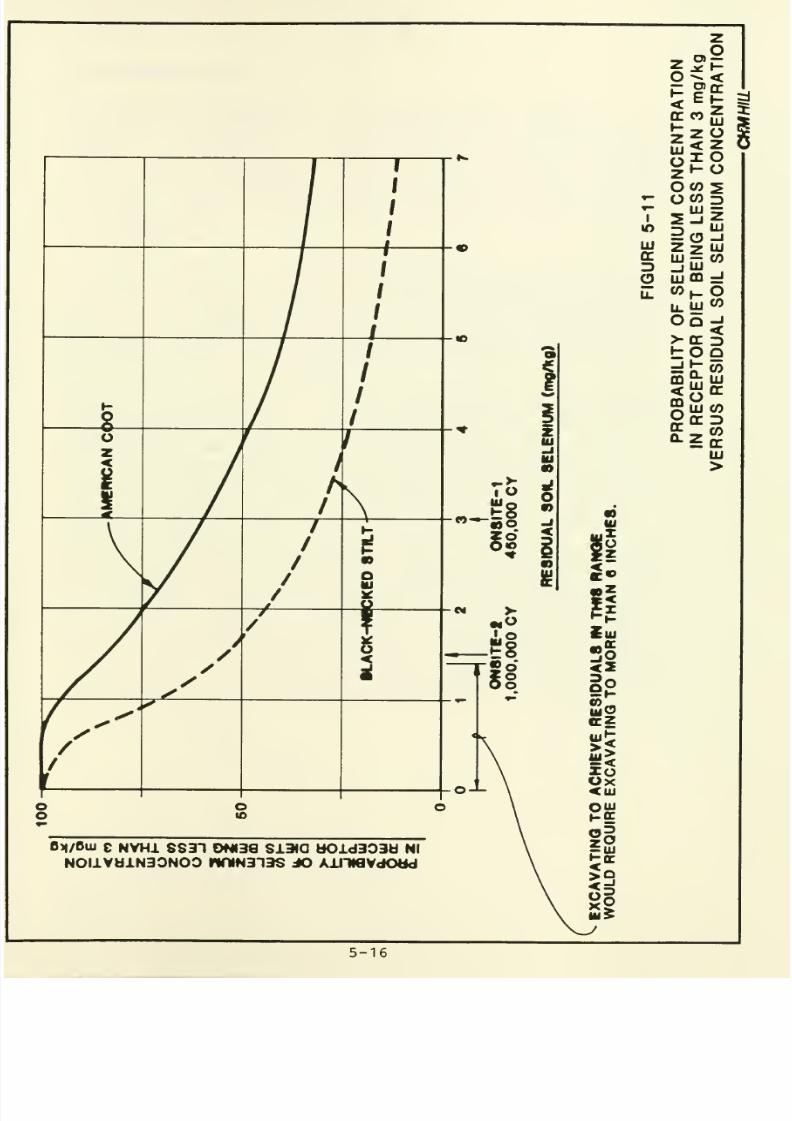
8/4/2019 Risk Assessment Ke 00 Sacr
http://slidepdf.com/reader/full/risk-assessment-ke-00-sacr 169/202

8/4/2019 Risk Assessment Ke 00 Sacr
http://slidepdf.com/reader/full/risk-assessment-ke-00-sacr 170/202
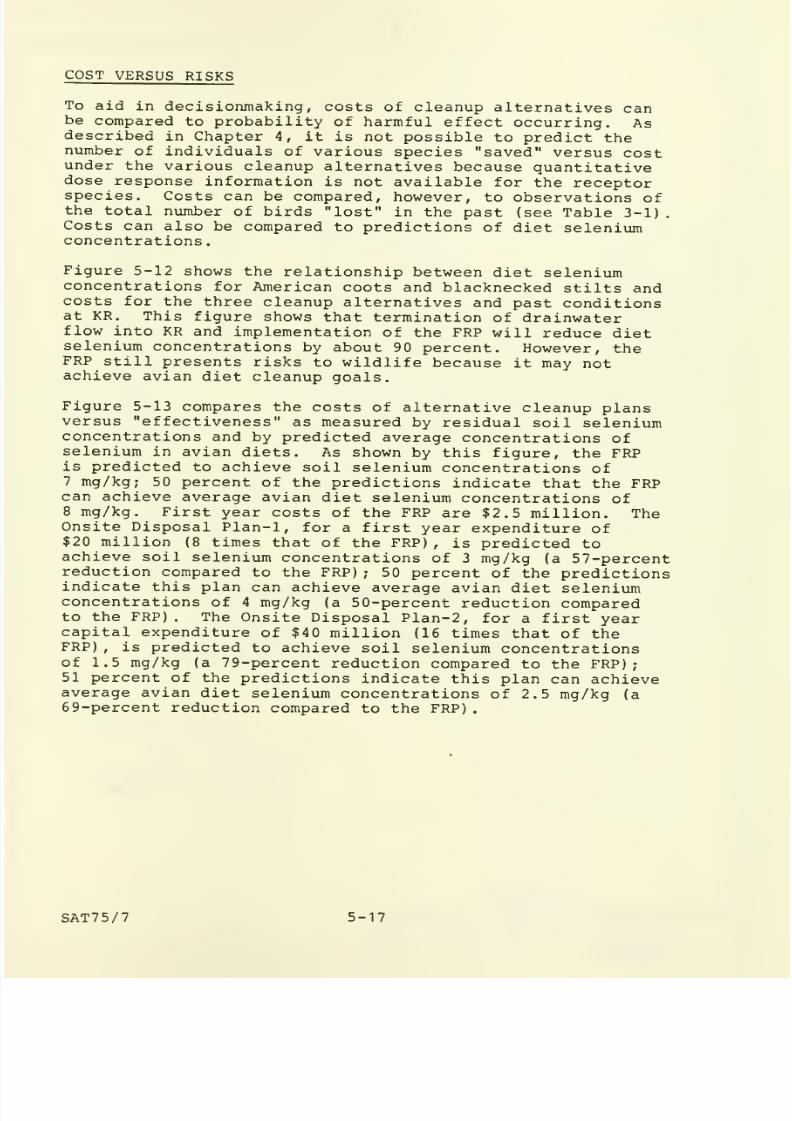
8/4/2019 Risk Assessment Ke 00 Sacr
http://slidepdf.com/reader/full/risk-assessment-ke-00-sacr 171/202
COST VERSUS RISKS
To aid in decisionmaking, costs of cleanup alternatives canbe compared to probability of harmful effect occurring. Asdescribed in Chapter 4, it is not possible to predict thenumber of individuals of various species "saved" versus costunder the various cleanup alternatives because quantitativedose response information is not available for the receptorspecies. Costs can be compared, however, to observations ofthe total number of birds "lost" in the past (see Table 3-1)
.
Costs can also be compared to predictions of diet seleniumconcentrations
.
Figure 5-12 shows the relationship between diet seleniumconcentrations for American coots and blacknecked stilts andcosts for the three cleanup alternatives and past conditionsat KR. This figure shows that termination of drainwaterflow into KR and implementation of the FRP will reduce dietselenium concentrations
by about 90 percent. However, theFRP still presents risks to wildlife because it may notachieve avian diet cleanup goals.
Figure 5-13 compares the costs of alternative cleanup plansversus "effectiveness" as measured by residual soil seleniumconcentrations and by predicted average concentrations ofselenium in avian diets. As shown by this figure, the FRPis predicted to achieve soil selenium concentrations of7 mg/kg; 50 percent of the predictions indicate that the FRPcan achieve average avian diet selenium concentrations of8 mg/kg. First year costs of the FRP are $2.5 million. The
Onsite Disposal Plan-1, for a first year expenditure of$20 million (8 times that of the FRP) , is predicted toachieve soil selenium concentrations of 3 mg/kg (a 57-percentreduction compared to the FRP) ; 50 percent of the predictionsindicate this plan can achieve average avian diet seleniumconcentrations of 4 mg/kg (a 50-percent reduction comparedto the FRP) . The Onsite Disposal Plan-2, for a first yearcapital expenditure of $40 million (16 times that of theFRP) , is predicted to achieve soil selenium concentrationsof 1.5 mg/kg (a 79-percent reduction compared to the FRP)51 percent of the predictions indicate this plan can achieveaverage avian diet selenium concentrations of 2.5 mg/kg (a
69-percent reduction compared to the FRP)
.
SAT75/7 5-17

8/4/2019 Risk Assessment Ke 00 Sacr
http://slidepdf.com/reader/full/risk-assessment-ke-00-sacr 172/202
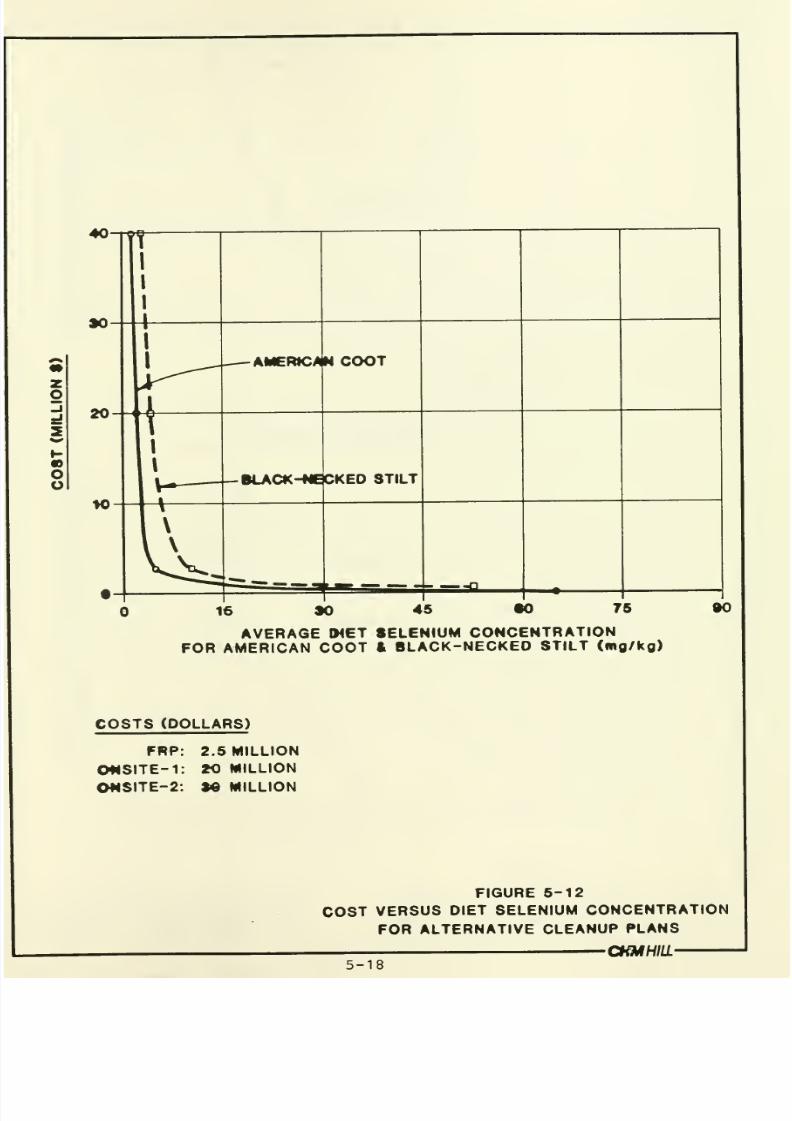
8/4/2019 Risk Assessment Ke 00 Sacr
http://slidepdf.com/reader/full/risk-assessment-ke-00-sacr 173/202

8/4/2019 Risk Assessment Ke 00 Sacr
http://slidepdf.com/reader/full/risk-assessment-ke-00-sacr 174/202
I

8/4/2019 Risk Assessment Ke 00 Sacr
http://slidepdf.com/reader/full/risk-assessment-ke-00-sacr 175/202
i
2 4 6SOIL SELENIUM (mg/kq)
P«rc«ntag*8 r«f«r to chanc*of average avian diet beingless than Y-axis value.
FIGURE 6-13
COSTS OF ALTERNATIVE CLEANUPPLANS VERSUS SOIL & DIET SELENIUM
5-19•CHMHIIL-

8/4/2019 Risk Assessment Ke 00 Sacr
http://slidepdf.com/reader/full/risk-assessment-ke-00-sacr 176/202
I

8/4/2019 Risk Assessment Ke 00 Sacr
http://slidepdf.com/reader/full/risk-assessment-ke-00-sacr 177/202
Chapter 6
REFERENCES
Adriano, D.C. 1986. Trace elements in the terrestrial envi-
ronment . New York: Springer-Verlag.
Anspaugh and Robinson. 1971. Trace elements in biology andmedicine. Prog. Atomic Med. 3:63.
Arnold, R.L., O.E. Olson, and C.W. Carlson. 1972. Selenium
withdrawal and egg selenium content. Poult. Sci. 51:341-342.
Arnold, R.L., O.E. Olson, and C.W. Carlson. 1973. Dietary
selenium and arsenic additions and their effects on tissue
and egg selenium. Poult. Sci. 52:847-854.
Birge, W.J. and J. A. Black. 1977. Sensitivity of verte-
brate embryos to boron compounds, final report.
(EPA-560/1-76-008) . Prepared for: U.S. Environmental Pro-
tection Agency, Office of Toxic Substances. Washington,
D.C. 66 pp.
Brinkhuis, B.H., W.F. Penello, and A.C. Churchill. 1980.
Cadmium and manganese flux in eelgrass Zostera marina II .
Metal uptake by leaf and root-rhizome tissues. Mar. Biol.
58: 187-196.
Browning, E. 1961 Toxicity of Industrial Metals. Butterworths,
London.
Burau, R.G. 1985. Environmental chemistry of selenium.
California Agriculture 39:16-18.
Clark, Donald R. Jr. 1986. Biologist. U.S. Fish and Wild-
life Service, Patuxent Wildlife Research Center, Laurel, MD.
Unpublished data.
Colborn, T. 1982. Measurement of low levels of molybdenum
in the environment by using aquatic insects. Bull. Environ.
Contam. Toxicol., (20) 4CC.
Colborn, T. 1982. Measurement of low levels of molybdenumin the environment by using aquatic insects. Bull. Environ.
Contam. Toxicol., (29) 422.
Denny, P. 1980. Solute movement in submerged angiosperms.
Biol. Rev. 55: 65-92
Eisler, R. 1985. Selenium hazards to fish, wildlife, and
invertebrates: A synoptic review. U.S. Fish & Wildlife
Service Biol. Rep. 85(1.5), Washington, D.C.
SAT74/56 6-1

8/4/2019 Risk Assessment Ke 00 Sacr
http://slidepdf.com/reader/full/risk-assessment-ke-00-sacr 178/202
I
I

8/4/2019 Risk Assessment Ke 00 Sacr
http://slidepdf.com/reader/full/risk-assessment-ke-00-sacr 179/202
El-Begearmi, M.M. , M,L. Sunde, and H.E. Ganther. 1977. Amutual protective effect of mercury and selenium in Japanesequail. Poult. Sci. 56:313-322.
Faraday, W.E. and A.C. Churchill: Uptake of cadmium by theeelgrass Zostera marina . Mar. Biol. 53, 293-298 (1979)
.
Franke, K.W. and W.C. Tully. 1936. A new toxicant occur-ring naturally in certain samples of plant footstuffs. VII.Low hatchability due to deformities in chicks produced fromeggs obtained from chickens of known history. Poult. Sci.15:316-318.
Franke, K.W., A.L. Moxon, W.E. Poley, and W.C. Tully. 1936.Monstrosities produced by the injection of selenium saltsinto hens' eggs. Anat. Rec. 65(l):15-22.
Franke and Painter. 1938. A study of the toxicity andselenium content of seleniferous diets: with statisticalconsideration. Cereal Chem. 15, 1-24.
Gilbertson, M. , R.D. Morris, and R.A. Hunter. 1976. Abnor-mal chicks and PCB residue levels in eggs of colonial birdson the lower Great lakes (1971-1973). Auk 93:434-442.
Gruenwald, P. 1958. Malformations caused by necrosis inthe embryo illustrated by the effect of selenium compoundson chick embryos. Am. J. Pathol. 34 (1 ): 77-103 .
Gupta, V.C., Y.W. Jame, C.A. Campbell, A.J. Leyshon, andW. Nicholaichuk. 1985. Boron
toxicity and deficiency:a
review. Canadian Journal of Soil Science 65 (3) : 381-409.
Halverson, A.W. , I.S. Palmer and P.L. Guss. 1966. Toxicityof Selenium to Post-Weanling Rats. Toxicology and appliedPharmacology. Vol. 9, No. 3, 477-484.
Heinz, G.H., D.J. Hoffman, A.J. Krynitsky, and D.M.G.Weller. In press. Reproduction of mallards fed selenium.Environ. Toxicol. Chem.
Hill, E.F. and D.J. Hoffman. 1984. Avian models for
toxicity testing. J. Amer. Coll. Toxicol. 3:357-56.
Hilton, J.W,, et al. 1982. Absorption distribution,half-life and possible routes of elimination of dietaryselenium in juvenile rainbow trout (Salmo gairdnerii )
.
Comp. Biochem. Physiol., C 71:49.
Hodson, P.V. and J.W. Hilton. 1983. The nutritionalrequirements and toxicity to fish of dietary and waterborneselenium. Ecol. Bull., 35:335.
SAT74/56 6-2

8/4/2019 Risk Assessment Ke 00 Sacr
http://slidepdf.com/reader/full/risk-assessment-ke-00-sacr 180/202

8/4/2019 Risk Assessment Ke 00 Sacr
http://slidepdf.com/reader/full/risk-assessment-ke-00-sacr 181/202
Hoffman, D.J. 1978. Embryotoxic effects of crude oil inmallard ducks and chicks. Toxicology and Applied Pharmacology46:183-90.
Johnsgard, R. 1975. North American Game Birds of Uplandand Shoreline . Lincoln, Nebraska: University of NebraskaPress. 183 pp.
Kenworthy, W.J., J.C. Zieman and G.W. Thayer: Evidence forthe influence of seagrasses on the benthic nitrogen cycle ina coastal plain estuary near Beaufort, North Carolina (USA)
.
Oecologia 54, 152-158 (1982).
Koch, L.M. and R.C. Young. 1983. Effects of Selected InorgaicCoal Gasification Constituents on Aquatic Life: An AnnotatedBibliography. PB84-100130, U.S. Dept. of Commerce. NTISSparingfield, VA.
Landauer, W. 1952. Malformations of chicken embryos produced
by boric acid and the probable role of riboflavin in theirorigin. Journal of Experimental Zoology 120:496-508.
Lawrence Berkeley Laboratory. 1986. Hydrological geochemi-cal and ecological characterization of Kesterson Reservoir.Progress Report No. 3, July 1986-September 1986. (TechnicalReport No. LBID-1213) . Berkeley, CA. 71 pp.
Lemly, A.D. 1985. Ecological basis for regulating aquaticemissions from the power industry: the case with selenium,regulatory toxicology and pharmacology 5:465-486.
Marston, H.R. 1952. Cobalt, Copper, and Molybdenum in theNutrition of Animals and Plants. Physiol. Rev. (32) 66.
Martin, A., H. Zim, and A. Nelson. 1951. American wildlifeand plants: A guide to wildlife food habits . New York,
N.Y. : Dover Publications.
McRoy, C.P. and R.J. Barsdate: Phosphate absorption in
eelgrass. Limnol. Oceanogr 15, 6-13 (1970).
Merced County Health Department. 1985. Proceedings from
the scientific medical committee to review the impact ofKesterson contamination on human residents. July 30, 1985.
Morrell, S.H. 1975. San Joaquin kit fox distribution andabundance in 1975. California Department of Fish and GameAdmin. Rep. No. 75-3 (October 1975)
.
Moyle, P.B. 1976. Inland Fishes of California. Berkeley,California: University of California Press. 405 pp.
SAT74/56 6-3

8/4/2019 Risk Assessment Ke 00 Sacr
http://slidepdf.com/reader/full/risk-assessment-ke-00-sacr 182/202

8/4/2019 Risk Assessment Ke 00 Sacr
http://slidepdf.com/reader/full/risk-assessment-ke-00-sacr 183/202
Moxon, A.L. 1937. Alkali disease or selenium poisoning.S.D. Agric. Exp. Stn. Bull. 311
.
Moxon, A.L. and M. Rhian. 1943. Selenium poisoning. Physiol
.
Rev. 23:305-337.
National Academy of Sciences. 1977. Drinking Water and
Health. Washington, D.C. 344 p.
National Research Council. 1976. Selenium. Comm. on med-ical and biological effects of environmental pollutants.Assembly of Life Sciences, Natl. Res. Counc, National Academyof Sciences, Washington, D.C.
. 1980. Mineral tolerance of domestic animals.Subcomm. on mineral toxicity in animals, Comm. on animalnutrition. Natl. Res. Counc, National Academy of Sciences,Washington, D.C.
Nicholas, D.S. and D.R. Keeney. 1976. Nitrogen nutritionof Myrio phyllum spicatum ; Uptake and translocation of N
by shoots and roots. Freshwat. Biol. 6, 145-154.
Niesen, T. and M. Williams. 1985. Comparative reproductivesuccess of birds at two sites in Merced County, California.Prepared for U.S. Fish and Wildlife Service. Unpublishedreport.
Ohlendorf, H.M., D.J. Hoffman, M.K. Saiki, and T.W. Aldrich.1986. Embryonic mortality and abnormalities of aquatic birds:Apparent impacts of selenium from irrigation drainwater.Sci. Total Environ. 52:49-63.
Ohlendorf, H.M., R.L. Hothem, CM. Bunck, T.W. Aldrich, andJ.F. Moore. In press. Relationships between selenium con-centrations and avian reproduction. Trans. N. Am. Wildl.Nat. Resour. Conf. 51: In press.
Ort, J.F. and J.D. Latshaw. 1978. The toxic level of sodiumselenite in the diet of laying chickens. J. Nutr. 108:1114-1120,
Poley, W.E., A.L. Moxon, and K.W. Franke. 1937. Furtherstudies of the effects of selenium poisoning onhatchability. Poult. Sci. 16:219-225.
Poley, W.E. and A.L. Moxon. 1938. Tolerance levels ofseleniferous grains in laying rations. Poult. Sci. 17:72-76.
Pomeroy, D.E. 1962. Birds with abnormal bills. BreedingBirds 55:48-72.
Pough, R. 1951. Audubon water bird guide. Garden City,N.Y.: Doubleday and Co., Inc. 352 pp.
SAT74/56 6-4

8/4/2019 Risk Assessment Ke 00 Sacr
http://slidepdf.com/reader/full/risk-assessment-ke-00-sacr 184/202

8/4/2019 Risk Assessment Ke 00 Sacr
http://slidepdf.com/reader/full/risk-assessment-ke-00-sacr 185/202
Rosenfeld, J., and O.A. Beath. 1964. Seleniuiti:
Geo-botany, biochemistry, toxicity and nutrition. AcademicPress, New York.
Saiki, M.K. 1986. A field example of selenium contamina-tion in an aquatic food chain. Pp. 67-76 in First AnnualEnvironmental Symposium: selenium in the environment - pro-
ceedings. California State University, Fresno, June 10-12,1985. (CATl-860201) . California Agricultural TechnologyInstitute. Fresno, CA.
Sculthorpe, CD. 1967: The biology of aquatic vascularplants, 610 pp. New York: St. Martins Press.
Shamberger, R.J. 1981. Selenium in the environment. Sci.Total environ. 17:59-74.
1983. Biochemistry of selenium . New York,N.Y.: Plenum Press.
Shapiro J.R. 1973. Selenium compounds in nature and medi-cine: selenium and human biology. In: D.L. Klayman andW.H.H. Guenther (eds.). Organic selenium compounds: theirchemistry and biology. New York: John Wiley and Sons.
SWRCB. 1963. Water Quality Criteria. 2nd Edition. McKee,J.E. and H.W. Wolf Editors. Sacramento. 548 p.
. 1986. Regulation of Agricultural Drainage tothe San Joaquin River. SWRCB Order No. WQ85-1 Tech. Comm.Staff of SWRCB and CVRWQCB
.
. 1985. Kesterson Reservoir monitoring program,report to the State Water Resources Control Board in compli-ance with SWRCB Order No. WQ 85-1 for the Cleanup and Abate-ment of Kesterson Reservoir. Sacramento, CA. May 1985.
U.S. Bureau of Reclamation. 1986a. Kesterson Program FinalEnvironmental Impact Statements Volumes I and II: U.S. Bureauof Reclamation, Mid-Pacific Region, in cooperation with U.S.Fish and Wildlife Service and U.S. Army Corps of Engineers,Sacramento, CA.
1986b. Draft Kesterson Program Public HealthMonitoring Status Report. USBR, Mid-Pacific Region. 10 pp,
. 1986c. Draft ethnographic survey.
U.S. Department of Interior. January 1984. Conference ontoxicity problems at Kesterson Reservoir. December 5-7,
1983. Sacramento, CA.
SAT74/56 6-5

8/4/2019 Risk Assessment Ke 00 Sacr
http://slidepdf.com/reader/full/risk-assessment-ke-00-sacr 186/202

8/4/2019 Risk Assessment Ke 00 Sacr
http://slidepdf.com/reader/full/risk-assessment-ke-00-sacr 187/202
U.S. Environmental Protection Agency. 1979. National In-
terim primary drinking water regulations and national secon-dary drinking water regulations. Federal Register, Vol. 44,
No. 233. December 3, 1979.
1980a. Ambient water criteria for selenium.{EPA 440/5-80-070) . Office of Water Regulations and Stan-
dards. Washington D.C. October 1980. p. C-7.
. 1980b. Other elements: water quality stan-dards criteria summaries: a compilation of state/federalcriteria, October 1980.
. 1985a. Proposed revisions of health advisors.office of Drinking Water, Internal Publication. WashingtonD.C.
1985b. Water quality criteria; availability ofdocuments. Federal Register, Vol. 50, No. 145. Washington,
D.C.
Wilber, C.G. 1980. Toxicology of selenium: A review.Clin. Toxicol. 17:171-230.
Winkler, D.W. , C.P. Weigen, F.B. Engstrom, S.E. Birch. 1977.
Ornithology pp. 88-113 in D.W. Winkler (ed.). An ecologicalstudy of Mono Lake, California. Institute of Ecology, Pub-lication No. 12, University of California, Davis. 188 pp.
Zingaro, R.A. and W.C. Cooper (eds.). 1974. Selenium. NewYork. Van Nostrand Reinhold Company. 835 pp.
PERSONAL COMMUNICATION
Daniel, Dick. 1985. Environmental Services Supervisor,Department of Fish and Game, Sacramento, CA 1985. Unpub-lished data.
DeHaven, Richard. April 1986. Environmental Services, U.S.
Fish and Wildlife Service, Sacramento, CA. Telephoneconversaion.
Gould, G. November 7, 1986. Biologist. California Depart-ment of Fish and Game, Sacramento, CA. Telephone conversa-tion.
Kizer, K.W. October 18 and 23, 1984. Director. CaliforniaState Department of Health Services, Sacramento, CA. Memo-randum to Jack Parnell, Director, Department of Fish andGame, and letter.
SAT74/56 6-6

8/4/2019 Risk Assessment Ke 00 Sacr
http://slidepdf.com/reader/full/risk-assessment-ke-00-sacr 188/202
I
I
I
I
I
i
i

8/4/2019 Risk Assessment Ke 00 Sacr
http://slidepdf.com/reader/full/risk-assessment-ke-00-sacr 189/202
Ohlendorf, Harry. December 1985 and January, February, Sep-
tember, 1986. Research Biologist. U.S. Fish and WildlifeService, Pacific Coast Field Station, Patuxent Wildlife Re-
search Center, Dixon, California.
Paveglio, Fred. January and November 1986. Refuge Biologist.
Kesterson National Wildlife Refuge, Los Bancs, CA. Telephone
conversations and meetings.
SAT74/56 6-7

8/4/2019 Risk Assessment Ke 00 Sacr
http://slidepdf.com/reader/full/risk-assessment-ke-00-sacr 190/202

8/4/2019 Risk Assessment Ke 00 Sacr
http://slidepdf.com/reader/full/risk-assessment-ke-00-sacr 191/202
APPENDIX A

8/4/2019 Risk Assessment Ke 00 Sacr
http://slidepdf.com/reader/full/risk-assessment-ke-00-sacr 192/202

8/4/2019 Risk Assessment Ke 00 Sacr
http://slidepdf.com/reader/full/risk-assessment-ke-00-sacr 193/202
Appendix A
Kesterson Reservoir
Wildlife Species List
Common Name Scientific Name
Mammals
Virginia opossum
Ornate shrew
Marsh shrew
Broad-footed mole
Bat species
Desert cottontail
Black-tailed hare
California ground squirrel
Botta ' s pocket gopher
San Joaquin pocket mouse
Heermann's kangaroo rat
Fresno kangaroo rat
Short-nosed kangaroo rat
Western harvest mouse
Deer mouse
Muskrat
California vole
House mouse
Coyote
San Joaquin kit foxRaccoon
Long-tailed weasel
Mink
Badger
Western spotted skunk
Striped skunk
Birds
Didelphis Virginia
Sorex ornatus
S. bendirii
Scapanus latimanus
Myotis spp. , Lasiurus spp.
Eptesicus spp.
Pipistrellus spp.
Sylvilagus audubonii
Lepus californicus
Spermophilus beecheyi
Thomomys bottae
Perognathus inornatus inornatus
Dipodomys heermanni
D. nitratoides exilis
D. n. brevinasus
Reithrodontomys megalotis
Peromyscus maniculatus
Ondatra zibethicus
Microtus californicus
Mus musculus
Canis latrans
Vulpes macrotis muticaProcyon lotor
Mustela frenata
M, vxson
Taxidea taxus
Spilogale gracilis
Mephitis mephitis
Pied-billed grebe
Horned grebe
Eared grebe
Western grebe
American white pelican
Double-crested cormorant
American bittern
Great blue heron
Great egret
Snowy egret
Cattle egret
Podilymbus podiceps
Podiceps auritus
P. nigricollis
Aechmophorus occidentalis
Pelecanus erythrorhynchos
Phalacrocorax auritus
Botaurus lentiginosus
Ardea herodias
Casmerodius albus
Egretta thula
Bubulcus ibis
SAT 7 3/7

8/4/2019 Risk Assessment Ke 00 Sacr
http://slidepdf.com/reader/full/risk-assessment-ke-00-sacr 194/202

8/4/2019 Risk Assessment Ke 00 Sacr
http://slidepdf.com/reader/full/risk-assessment-ke-00-sacr 195/202
Appendix A
(Continued)
Common Name Scientific Name
Birds (continued)
Green-backed heron
Black-crowned night-heron
White-faced ibis
Tundra swan
Greater white-fronted goose
Snow goose
Ross' goose
Canada goose
Green-winged teal
Mallard
Northern pintail
Blue-winged teal
Cinnamon teal
Northern shoveler
Gadwall
Eurasian wigeon
American wigeon
Canvasback
Redhead
Ring-necked duck
Greater scaup
Lesser scaup
Common goldeneyeBufflehead
Hooded merganser
Common merganser
Ruddy duck
Turkey vulture
Osprey
Black-shouldered kite
Bald eagle
Northern harrier
Cooper ' s hawk
Sharp-shinned hawk
Swainson ' s hawk
Red-tailed hawk
Ferruginous hawk
Rough-legged hawk
Golden eagle
American kestrel
Prairie falcon
Ring-necked pheasant
Virginia rail
Sora
Common moorhen
Butorides striatus
Nycticorax nycticorax
Plegadis chihi
Cygnus columbianus
Anser albifrons
Chen caerulescens
C. rossii
Branta canadensis
Anas crecca
A. platyrhynchos
A. acuta
A. discors
A. cyanoptera
A. clypeata
A. strepera
A. penelope
A. americana
Aythya valisineria
A. americana
A. collaris
A. marila
A. affinis
Bucephala clangulaB. albeola
Lophodytes cucullatus
Mergus merganser
Oxyura jamaicensis
Cathartes aura
Pandion haliaetus
Elanus caeruleus
Haliaeetus leucocephalus
Circus cyaneus
Accipiter cooperii
A. striatus
B. swainsoni
B. jamaicensis
B. regalis
B. lagopus
Aquila chrysaetos
Falco sparverius
F. mexicanus
Phasianus colchicus
Rallus limicola
Porzana Carolina
Gallinula chloropus
SAT73/73

8/4/2019 Risk Assessment Ke 00 Sacr
http://slidepdf.com/reader/full/risk-assessment-ke-00-sacr 196/202
I
I
I
I
I

8/4/2019 Risk Assessment Ke 00 Sacr
http://slidepdf.com/reader/full/risk-assessment-ke-00-sacr 197/202
Appendix A
(Continued)
Common Name Scientific Name
Birds (continued)
American coot
Sandhill crane
Black-bellied plover
Snowy plover
Semipalmated plover
Killdeer
Black-necked stilt
American avocet
Greater yellowlegs
Lesser yellowlegs
Willet
Spotted sandpiperWhimbrel
Long-billed curlew
Marbled godwit
Western sandpiper
Least sandpiper
Baird's sandpiper
Pectoral sandpiper
Dunlin
Short-billed dowitcher
Long-billed dowitcher
Common snipe
Wilson's phalarope
Red-necked phalarope
Bonaparte's gull
Ring-billed gull
California gull
Herring gull
Caspian tern
Forster's tern
Black tern
Rock dove
Mourning dove
Common barn-owlGreat horned owl
Burrowing owl
Short-eared owl
Lesser nighthawk
Belted kingfisher
Northern flicker
Black phoebe
Say ' s phoebe
Western kingbird
Horned lark
Tree swallow
Fulica americana
Grus canadensis
Pluvialis squatarola
Charadrius alexandrinus
C. semipalmatus
C. vociferus
Himantopus mexicanus
Recurvirostra americana
Tringa melanoleuca
T. f lavipes
Ca toptrophorus semipalmatus
Actitus maculariaNumenius phaeopus
N. americanus
Limosa fedoa
Calidris mauri
C. minutilla
C. bairdii
C. melanotos
C. alpina
Limnodromus griseus
L. scolopaceus
Gallinago gallinago
Phalaropus tricolor
P. fulicaria
Larus Philadelphia
L. delawarensis
L,
L.
californicus
argentatus
Sterna caspia
S. forsteri
Chidonias niger
Columba livia
Zenaida macroura
Tyto albaBubo virginianus
Athene cunicularia
Asio flammeus
Chordeiles acutipennis
Ceryle alcyon
Colaptes auratus
Sayornis nigricans
S. saya
Tyrannus verticalis
Eremophila alpestris
Tachycineta bicolor
SAT73/73

8/4/2019 Risk Assessment Ke 00 Sacr
http://slidepdf.com/reader/full/risk-assessment-ke-00-sacr 198/202
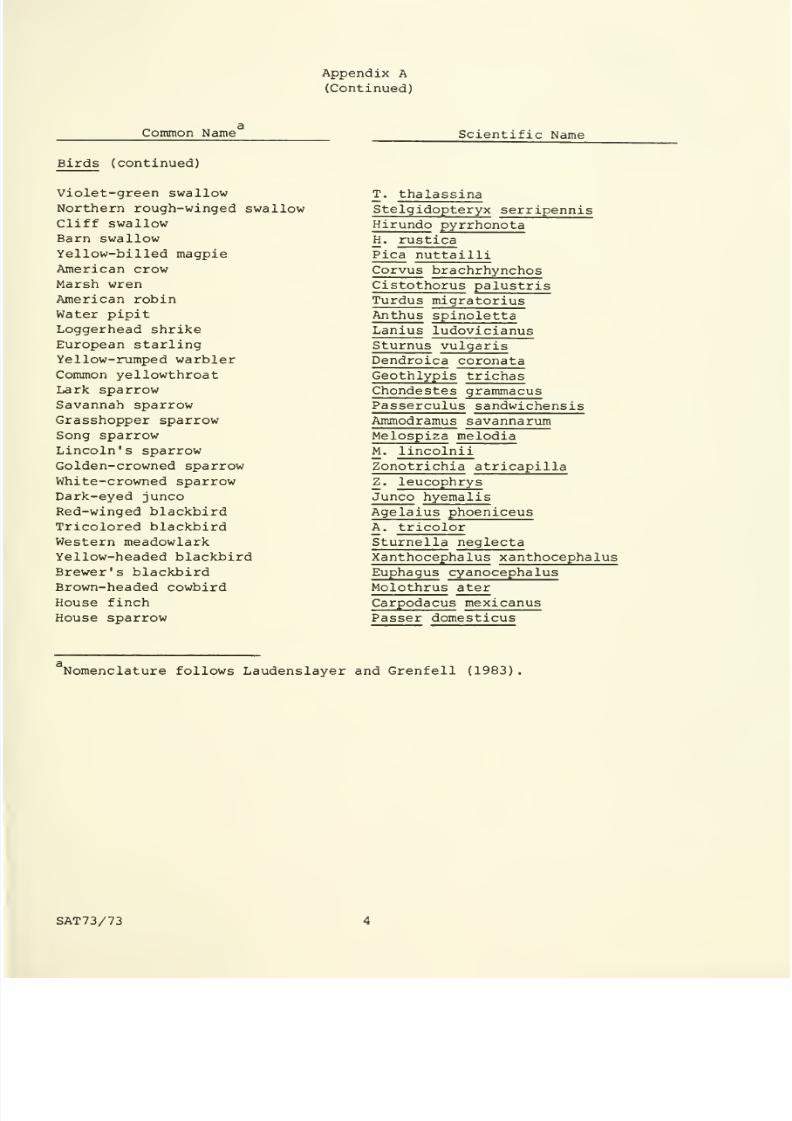
8/4/2019 Risk Assessment Ke 00 Sacr
http://slidepdf.com/reader/full/risk-assessment-ke-00-sacr 199/202
Appendix A
(Continued)
Common Name
Birds (continued)
Scientific Name
Violet-green swallow
Northern rough-winged swallow
Cliff swallow
Barn swallow
Yellow-billed magpie
American crow
Marsh wren
American robin
Water pipit
Loggerhead shrike
European starlingYellow-rumped warbler
Common yellowthroat
Lark sparrow
Savannah sparrow
Grasshopper sparrow
Song sparrow
Lincoln's sparrow
Golden-crowned sparrow
White-crowned sparrow
Dark-eyed junco
Red-winged blackbird
Tricolored blackbirdWestern meadowlark
Yellow-headed blackbird
Brewer's blacJdbird
Brown-headed cowbird
House finch
House sparrow
T. thalassina
Stelgidopteryx serripennis
Hirundo pyrrhonota
H. rustica
Pica nuttailli
Corvus brachrhynchos
Cistothorus palustris
Turdus migratorius
Anthus spinoletta
Lanius ludovicianus
Sturnus vulgarisDendroica coronata
Geothlypis trichas
Chondestes grammacus
Passerculus sandwichensis
Ammodramus savannarum
Melospiza melodia
M. lincolnii
Zonotrichia atricapilla
Z. leucophrys
Junco hyemalis
Agelaius phoeniceus
A, tricolor
Sturnella neglecta
Xanthocephalus xanthocephalus
Euphagus cyanocephalus
Molothrus ater
Carpodacus mexicanus
Passer domesticus
Nomenclature follows Laudenslayer and Grenfell (1983).
SAT73/73

8/4/2019 Risk Assessment Ke 00 Sacr
http://slidepdf.com/reader/full/risk-assessment-ke-00-sacr 200/202
,.oN /

8/4/2019 Risk Assessment Ke 00 Sacr
http://slidepdf.com/reader/full/risk-assessment-ke-00-sacr 201/202
^''
%'^

8/4/2019 Risk Assessment Ke 00 Sacr
http://slidepdf.com/reader/full/risk-assessment-ke-00-sacr 202/202
^^t^^Jo^'^^ copy
f'RO.CRAf^