Risk Assessment in Software Release Practice in Public ...
168
Risk Assessment in Software Release Practice in Public Organization Information Management Systems by Vivian L. Martin A dissertation submitted to the Graduate Faculty of Auburn University in partial fulfillment of the requirements for the Degree of Doctor of Philosophy Auburn, Alabama December 12, 2015 Keywords: risk assessment in software release practice, software quality, software implementation, software process, maturity models, software risk models Copyright 2015 by Vivian L. Martin Approved by Linda Dennard, Chair, Professor of Political Science and Public Administration, Auburn University at Montgomery Cynthia Bowling, Professor of Political Science Joseph Vonasek, Assistant Professor of Political Science James Nathan, Professor of Political Science and Public Administration, Auburn University at Montgomery Michael W. Kometer, PhD, Principal Systems Engineer, MITRE Federally Funded Research and Development Corporation, Montgomery (Professor of Air and Space Technology at the School of Advanced Air and Space Studies, retired, Maxwell AFB)
Transcript of Risk Assessment in Software Release Practice in Public ...
Risk Assessment in Software Release Practice in Public Organization Information Management Systems
by
Vivian L. Martin
A dissertation submitted to the Graduate Faculty of Auburn University
in partial fulfillment of the requirements for the Degree of
Doctor of Philosophy
Auburn, Alabama December 12, 2015
Keywords: risk assessment in software release practice, software quality, software implementation, software process, maturity models, software risk models
Copyright 2015 by Vivian L. Martin
Approved by
Linda Dennard, Chair, Professor of Political Science and Public Administration, Auburn University at Montgomery
Cynthia Bowling, Professor of Political Science Joseph Vonasek, Assistant Professor of Political Science
James Nathan, Professor of Political Science and Public Administration, Auburn University at Montgomery
Michael W. Kometer, PhD, Principal Systems Engineer, MITRE Federally Funded Research and Development Corporation, Montgomery (Professor of Air and Space
Technology at the School of Advanced Air and Space Studies, retired, Maxwell AFB)
ii
Abstract
The purpose of this paper is to document the United States Air Force’s (USAF)
approach to risk assessment of software during the release phase of development and to
provide material to support improvement recommendations in the USAF approach. The
USAF faces the problem common to all software development projects in that its
organizations must decide how much to test software before releasing it for its intended
purpose. At issue is the accurate assessment of risk that supports decision making and
leads to the appropriate use of resources for testing, including other quality control
measures, and the appropriate acceptance of residual risk at the time of software release.
Organizations that carry out risk assessments are accountable for the efficient and
effective allocation of resources to risk reduction, which makes fidelity in risk assessment
a worthy endeavor for accountability in public administration. The research methodology
was informed by grounded theory and generative social science (Charmaz, 2008; Epstein,
2006) and included lesson drawing (Rose, 1993), and affinity diagramming (Straker,
1995).
This work provides a literature review cast with a wide net to address risk
assessment at the intersection of software development and a public administration
environment. The result is a list of both broad and specific ways in which a USAF
method of risk assessment for software can be improved, an initial version of a software
defect prediction model constructed from the analysis results, and a list of high-level

iii
steps to add the practice of modeling to the tool kit of USAF software professionals. The
steps can be pursued with minimum commitment, by building upon the initial model for
software defect prediction and adding the modeling to risk assessment tasks, in
furtherance of the objective of the research. Additionally, this research provides
suggested entry points to public administration topics suitable for further research with
applicability to software development in the public sector.

iv
Acknowledgments
I am grateful to my parents and spouse for their support across time and space. I
am also grateful for the help of my patient and encouraging committee chair, the
members of my committee, and colleagues in my professional endeavors. The collective
support from family, professors, and colleagues has made this work possible. I thank you
all from the bottom of my heart.
v
Table of Contents
Abstract ............................................................................................................................... ii
Acknowledgments.............................................................................................................. iv
Chapter 1: Introduction ....................................................................................................... 1
Chapter 2: Description of Problem and Research ............................................................... 5
Chapter 3: Literature Review .............................................................................................. 7
The US Air Force’s Risk-Assessed Level of Test Approach ................................. 7
Risk Assessment in Software ................................................................................ 24
Relevant Public Administration Theory ............................................................... 65
Chapter 4: Hypothesis ....................................................................................................... 90
Chapter 5: Research Method ............................................................................................. 91
Grounded Theory .................................................................................................. 91
Generative Social Science ..................................................................................... 92
Lesson Drawing .................................................................................................... 94
Affinity Diagramming .......................................................................................... 97
Trends ................................................................................................................... 97
Research for RALOT ............................................................................................ 99
Chapter 6: Question 1 ..................................................................................................... 101
Chapter 7: Question 2 ..................................................................................................... 107
Chapter 8: Question 3 ..................................................................................................... 116

vi
Chapter 9: Question 4 ..................................................................................................... 129
Chapter 10: Summary and Conclusions .......................................................................... 132
Future Research .................................................................................................. 133
References ....................................................................................................................... 140
vii
List of Tables
Table 1. Categories of Weight and Score ..........................................................................18
Table 2. Output of Risk Graph Values for Defects Inserted ............................................122
Table 3. Output of Risk Graph Values for Defects Found in Testing .............................123
Table 4. Output of Risk Graph Values for Residual Defects ...........................................125
Table 5. Output of Risk Graph Values for Defects Found in Operations ........................126

viii
List of Figures
Figure 1. Standardized report format .................................................................................17
Figure 2. Concepts: Key words and phrases. ...................................................................104
Figure 3. Comparison checklist, Version 1. .....................................................................105
Figure 4. Checklist and RALOT notes. ...........................................................................108
Figure 5. Recommendations for concepts ........................................................................112
Figure 6. Reasoning to be pessimistic or optimistic. .......................................................114
Figure 7. RALOT scenario for defect prediction model. .................................................118
Figure 8. AgenaRisk graphs. ............................................................................................121
Figure 9. Counters to criticism.........................................................................................129

ix
List of Abbreviations
AFOTEC Air Force Operational Test and Evaluation Center
CMU Carnegie Mellon University
DoD Department of Defense
DoDAF Department of Defense Architecture Framework
DoDI Department of Defense Instruction
EA Enterprise Architecture
FOSS Free and Open Source Software
GAO General Accounting Office, after 2004 Government Accountability Office
IT Information Technology
MIL-STD Military Standard
MODIST Models of Uncertainty and Risk for Distributed Software Development
RALOT Risk Assessed Level of Test
RBS Risk Breakdown Structure
USAF United States Air Force
1
Chapter 1: Introduction
The purpose of this paper is twofold:
• document the United States Air Force’s (USAF) approach to risk assessment of
software during the release phase of development and
• provide material to support improvement recommendations in the USAF
approach.
The expectation for this research was that additional methods could be adapted to the
USAF’s needs and over time incorporated into USAF practice. A primary motivation for
this research was firsthand experience with software development in a public
administration environment and the researcher’s professional desire to improve the
overall performance of software projects with a contribution of information, methods,
and practical recommendations.
The USAF faces the problem common to all software development projects in
that its organizations must decide how much to test software before releasing it for its
intended purpose. At issue is the accurate assessment of risk that supports decision
making and leads to the appropriate use of resources for testing, including other quality
control measures, and the appropriate acceptance of residual risk at the time of software
release. Organizations that carry out risk assessments are accountable for the efficient
and effective allocation of resources to risk reduction, which makes fidelity in risk
assessment a worthy endeavor for public administration.
2
Federal spending on information technology (IT) is planned to be $86 billion in
2016, of which $37 billion is DoD spending (Office of Management and Budget, 2015, p.
281). Spending on IT has slowed in growth from 7.1 percent annually over the period
2001-2009 to 1.5 percent annually for the period 2009-2016, attributed in part to
improving efficiencies (p. 281). This reflects an ongoing national-level interest in
efficiencies traced to IT expenditures. High fidelity risk assessment can influence testing
and other quality assurance measures to guard against unnecessary expenditures.
This work provides a literature review cast with a wide net to address risk
assessment at the intersection of software development and a public administration
environment. The research methods chosen are reviewed, as well. The research
methodology was informed and compiled from emergent methods and grounded theory
(Charmaz, 2008), generative social science (Epstein, 2006), and included tools and
techniques from affinity diagramming (Straker, 1995) and lesson drawing (Rose, 1993).
Use of affinity diagramming and lesson drawing led to the introduction of additional
methods from Bayesian network modeling (Fenton & Neil, 2013). The result is a list of
both broad and specific ways in which a USAF method of risk assessment for software
can be improved, an initial version of a software defect prediction model constructed
from the analysis results, and a list of high-level steps to add the practice of modeling to
the tool kit of USAF software professionals. In furtherance of the objective of the
research, the steps can be pursued with minimum commitment, by building upon the
initial model for software defect prediction and adding the modeling to risk assessment
tasks, providing recommendations for improvement. Additionally, this research provided

3
suggested entry points to public administration topics suitable for deeper research and
applicable to software development in the public sector.
This dissertation is composed of 10 Chapters, with Chapter 1 being this
introduction. The other chapters are as follows:
Chapter 2 describes the problem and provides an overview of the research.
Chapter 3 is the literature review and covers an USAF risk assessment process for
testing organizations, risk assessment in the software development domain, and relevant
topics from public administration including defense perspectives.
Chapter 4 presents the hypothesis, composed based on emergent methods
(Charmaz, 2008). The hypothesis is that the USAF RALOT model can be improved due
to recent research and application developments.
Chapter 5 provides research methods consulted for this research, research trends
in public administration research, and the specific research questions.
Chapter 6 answers Question 1, which is: What does a review of the literature
reveal about improvement opportunities in the way of risk assessment and predictive
methods?
Chapter 7 answers Question 2, which is: For selected methods, what does a
comparison with RALOT content reveal about specific opportunities for improvement?
Chapter 8 answers Question 3, which is: Can initial versions of specific
improvements to RALOT be constructed from the results of the analysis?
Chapter 9 answers Question 4, which is: What steps would be needed to refine
and validate the initial version for actual use?

4
Chapter 10 contains a summary, conclusions, and opportunities for further or
deeper research.
5
Chapter 2: Description of Problem and Research
The Unites States Air Force (USAF) faces a problem common to all software
development projects in that its organizations must decide how exhaustively software
should be tested before it is released for its intended purpose. Critical to the process is
the accurate assessment of risk. It is the level and degree of risk which supports decision
making and leads to the determination of the appropriate resources for testing, including
other quality control measures, as well as the acceptance of the appropriate level of
residual risk at the time of software release. Organizations that carry out risk assessments
are accountable for the efficient and effective allocation of resources to accomplish risk
reduction. This makes fidelity in risk assessment a worthy endeavor for public
administration.
The research conducted here consists of a literature review of subjects related to
software development in public administration and defense settings. Considering
software development, the topics fan out from their potential in dealing with risk,
including software risk assessment, modelling techniques, software quality, software
testing, process maturity models, and software project management. Viewed from the
perspectives of public administration and defense, topics crosscut subjects rising out of
the environment addressed in this research. This includes theories of organization,
systems, decision making, project management and implementation, policies and policy
development, risk assessment, accountability, and defense applications and technology
environments for information superiority. The study also includes ideas and concepts
6
drawn from the literature used to guide comparison and model building and used to
organize and aid the research process. Those include sources of risk, finding and
anticipating risk, gauging risk, mitigating risk, and criticisms. Additional specific
variables for modeling arose in the form of design process quality, problem complexity,
defects inserted, testing quality, defects found and fixed, residual defects, operational use,
and defects found in operation (Fenton & Neil, 2013). The study includes model
development for analysis. Model development is mapped between USAF project
characteristics and Fenton and Neil (2013) work specific to defect prediction, with the
prediction of defects remaining to be found in operations a potential measure for residual
risk and improved accuracy in risk assessment. Findings indicate that the USAF’s
method of risk assessment can be improved by employing recent developments in
modeling software organizations’ characteristics that relate to software defects by using
Bayesian network modeling. Future research suggestions include calibrating the Fenton
and Neil (2013) model data with Air-Force-specific data and employing the research
methodologies associated with grounded theory and generative social science (Charmaz,
2008; Epstein, 2006). These approaches can potentially contribute to continuous
improvement in risk assessment and consequently the use of risk assessments in decision
making for software releases and testing formalities.
7
Chapter 3: Literature Review
The literature addressing the research topic being presented can generally be
considered as consisting of three separate areas. First is the documentation of the
USAF’s approach to risk assessment in software projects. Second is the collection of
material related to risk assessment in software development. And third is a collection of
public administration material that contributes to the context of software programs, such
as accountability in public agencies. These three areas focus the research on the
environment of practice and the intersecting perspectives of theory from software
engineering and public administration.
The US Air Force’s Risk-Assessed Level of Test Approach
This section is devoted to the case of the USAF’s Risk Assessed Level of Test
(RALOT) model for assessing risk in a software system component that is in the pipeline
for release. RALOT is a case in point, in practice, maintained and carried out by test
professionals charged with planning for system tests. Software systems subjected to
operational testing in the USAF are typically acquired and developed under U.S.
Department of Defense Instruction (DoDI) 5000.02, Operation of the Defense
Acquisition System. This instruction manual is maintained by the Under Secretary of
Defense (Acquisition, Technology, and Logistics; DoDI 5000.02, p. 1). Further, 5000.02
references a collection of 82 additional tomes of policy, procedures, instructions, memos,
directives, regulations, and concepts of operation (DoDI 5000.02, pp. 8-11). The test
professionals that use RALOT are subject to this set and numerous others that branch

8
from them. The additional collections are unique to their organizations, are recognized
best practices, or form tacitly through combination and practice.
The Air Force Operational Test and Evaluation Center (AFOTEC) is
headquartered at Kirtland Air Force Base, New Mexico. AFOTEC is charged with
implementing testing policy for the U.S. Department of Defense (DoD) and the Air Force
by planning and executing the operational testing of software systems. The AFOTEC
mission statement is as follows: “AFOTEC tests and evaluates new warfighting
capabilities in operationally realistic environments, influencing and informing national
resource decisions” (www.AFOTEC.af.mil, Last updated: Feb 7, 2014, p.1).
AFOTEC is an independent test organization whose responsibilities include
testing in many acquisition scenarios including aircraft-centric weapon systems,
communications, software systems, and systems of systems (Kometer, Burkhart, McKee,
& Polk, 2011). Kometer et al. provided an updated perspective of USAF testing as
impacted by the arrival of the Information Age, the interoperability of systems across
networks, and the concept of capability as a collection of interoperating systems, or
system of systems. Kometer et al. discussed the basic responsibility of the test
professional to make recommendations to decision makers about how to proceed with the
capability under test. That recommendation stems from a prediction about whether or not
a system, or a system of systems, will perform as expected once fielded. These
recommendations are subject to error in that testing outcomes may fail a worthwhile
capability or accept a deficient and possibly harmful one (p. 41). Such recommendations
are complicated by the onset of networked systems interacting to produce a capability
that is delivered in degrees, a characteristic of the Information Age. The authors call for

9
creative means such as distributed testing, system of system testing infrastructure, and
combined testing and training events to be used to support future decision makers’ need
to “gauge effectively the risks involved with their decisions for fielding new capability”
(p. 48). In addition to testing, a method of risk assessment in practice is RALOT. The
RALOT method does not address the need to reorient test objectives from localized
system requirements to system of system capabilities. The method is instead aimed at
software components or software intensive systems, but could potentially be augmented
with improvements that could positively contribute to better decision making about
fielding of capabilities, in the Information Age, that include software.
Other USAF organizations are responsible for testing activities, as well. One such
organization is the 605th Test and Evaluation Squadron (TES) a member of the 505th
Command and Control Wing located at Hurlburt Field, Florida. The 605th testing
activities include independent operational testing for a subset of USAF intelligence,
surveillance, and reconnaissance systems as well as performing test management duties
for the USAF Warfare Center and Air Combat Command (USAF 505th Command and
Control Wing, 2013).
AFOTEC and the 605th TES have maintained and used the RALOT model of
determining risk associated with software. RALOT materials facilitate implementation
of the policy document titled, Guidelines for Conducting Operational Test and Evaluation
for Software-Intensive System Increments. The guidelines were circulated as an
attachment to a memorandum from the Director of DoD Operational Test and Evaluation
and addressed to, among others, the testing organizations of the USAF, including
AFOTEC (Guidelines, 2003; Office of the Secretary of Defense, 2003). This 2003 memo

10
was superseded (Guidelines, 2010; Office of the Secretary of Defense, 2010);
Differences introduced by the 2010 version are addressed in a subsequent paragraph and
in general, were intended to streamline procedures.
The terminology of RALOT appears in policies, procedures, and instructions for
systems professionals. The primary sources used for a basic description of RALOT are a
presentation designed to train testing personnel in the use of the model, including its
accompanying documentation, and a spreadsheet designed to capture data relevant to the
risk assessment. The material in the primary sources dates from 2010 to 2014, although
it is not clear when RALOT first matured into a repeatable method with an associated
taxonomy of risk indicators. However, McQueary, in his capacity as director of
Operational Test and Evaluation, provided an interview on the subject of testing to
Defense Acquisition, Technology, and Logistics, in which he mentioned that RALOT had
been in use for several years (McQueary, 2008). Elucidating documents on RALOT are
as follows:
• “Risk Analysis Level of Test (RALOT) Process,” a PowerPoint presentation
authored for the 605th TES and used to brief facilitators. (Sweda & Ratcliffe,
2010)
• “605 TES Risk Assessment Level of Test (RALOT) Process Guidelines,” a
document authored as integrating and supplemental instruction. (Sweda &
Ratcliffe, 2014a)
• Spreadsheet with file name: “CalculatedRALOT(MASTERJan14).xlsx”
which is a multitab Excel product used for data entry and presentation of
questionnaire responses. (Sweda & Ratcliffe, 2014b)
11
Significant to the understanding and roots of the RALOT model are 14 pages of
guidelines in which the word risk appears 38 times (Guidelines, 2003), an indication of
the central theme’s concentration.
The summary that follows consists of (a) the basic categorization of risks
associated with software as noted by policy makers, (b) the synthesis of risk sources and
means to uncover them into procedures for test professionals, (c) the components of a
tactical aid in carrying out an assessment, and (d) the resulting judgment of how much
testing is appropriate. Of note is the underlying motivation for the update to policy that
the guidelines represent. The background speaks to the increased use of commercial
software products and initiatives to streamline acquisition as a call for more responsive
approaches to operational testing (Guidelines, 2003, p. 1). The trajectory for streamlining
continued in the 2010 version, while the basic guidelines and concepts endured
(Guidelines, 2010).
The guidelines provide several definitions that bound scope and focus
practitioners regarding the nature of their work (Guidelines, 2003). In effect, the policy’s
definitions establish conceptually their applicability to those whose organizations
perform testing tasks for software-intensive systems. The qualification of risk as
operational and the qualification of software as an increment provide scope to a variety of
activities that produce software. The software is presumed to be “militarily useful”
(Guidelines, 2003, p. 1) and as an increment is presumed to be on an acquisition track
headed to mission users. Two definitions form the crux of this understanding:
operational risk and increment.

12
• A basic definition of operational risk is “a compound function of the
likelihood and mission impact of an increment’s failure to be operationally
effective and suitable” (Guidelines, 2003, p. 1).
• A basic definition of increment is as follows:
An increment of a software-intensive system is a militarily useful and
supportable operational capability that can be effectively defined,
developed, deployed, and sustained as an integrated entity or building
block of the target system. An increment may be composed of one or
more spirals or other developmental elements (Guidelines, 2003, p. 1).
The categories of risk are suggested and reflect aspects of the source of that risk:
software production, software characteristics, and operational concerns. Each of the six
categories identified is clarified by a series of questions that, when answered, deepen test
professionals’ knowledge of what will be tested. Generalizing from the questions
provides a high-level definition of the categories, as follows:
Development. Characteristics related to the processes followed by the parties
contributing to the production of the software increment are considered developmental.
For example, the questions tie to software developers’ quality programs, mission owners’
approaches to producing and specifying their requirements, and developers’ and mission
owners’ approaches and results from early stage testing, such as prototyping and
integration (Guidelines, 2003, pp. 5-6).
Implementation. Challenges to the user and the benefiting organization in
folding the software into their mission are considered implementation. For example,
questions tie to the preparation and commitment of the users, in terms of personnel skill
13
needs, and the organizations, in terms of operating policies and procedures. A question
notably establishes the recognition that changes to business processes can be associated
with the increment and can drive preparation needs (Guidelines, 2003, pp. 6-7).
Technology. Generic attributes of the technologies employed in the increment are
considered under the heading of technology. For example, dependencies, “commercial
tempo of change” (Guidelines, 2003, p. 7), maturity, integration aspects, source of
technology, and performance history figure into the questions (Guidelines, 2003, p. 7).
The administration capabilities present in the technology are also considered.
Complexity. This category allows for the introduction of complexity measures
across the spectrum of measureable and heuristic scales. For example: “industry standard
complexity metrics” (Guidelines, 2003, p. 7), counts of organizations, proportional and
cumulative change to system components, numbers of technical integration points and
external interfaces, changes to operating systems-level components, modification of low-
level data structures, and the aspects of user interactions with the software (Guidelines,
2003, pp. 7-8).
Safety. A single question focuses on concern for safety regarding hazards to
human operators and their environment from using the system (Guidelines, 2003, p. 8).
Security. Assurances form the basis for the security category in that the system
can be protected, does not introduce vulnerabilities, protects data to the respective
classification level, and does not allow external systems to have unauthorized access
(Guidelines, 2003, p. 8).
In summary, the contribution of these guidelines to the overall focus of risk
assessment is in its organizing principles reflected in the categories above and in the
14
specificity offered by the question set that accompanies each category. In addition to
scope, the guidelines clearly establish risk assessment as an input to test planning for an
increment of software. This mentality did not shift with the superseding memo and
update (Guidelines, 2010; Office of the Secretary of Defense, 2010). The changes
introduced clarified the distinction of business and information systems from other
systems that have risks related to the “potential for loss of life” (Guidelines, 2010, p. 1).
Making this distinction contributed to streamlining the guidance with the removal of the
Level IV category of tests, an implementation change for the RALOT model.
Although the questions posed in the 2003 guidelines serve to focus a risk
assessment and place it in an overarching order with test execution, the training slides
also provide a bridge to the practice of uncovering specific sources of risk (Sweda &
Ratcliffe, 2010). The RALOT process presentation’s target audience includes testing
professionals charged with the decision making associated with selecting testing
formalities. The presentation provides the professionals with the rationale for performing
the tasks found in the guidelines, drills into the processes, and steps through a
spreadsheet-based tool that aids in the collection of inputs that support the assessment.
(Sweda & Ratcliffe, 2014b) The presentation and accompanying documents also provide
an approach for direct connections between knowledge of the system, a scoring
mechanism, and a model for interpreting results, with emphasis on the continuous nature
that risk assessments should imbue (Sweda & Ratcliffe, 2010; 2014a, p. 1).
The activity of gathering inputs and data received detailed support in a
spreadsheet-based tool: Calculated RALOT (Sweda and Ratcliff , 2014b). This support
tool specifically aligns the guidelines’ (Guidelines, 2003; 2010) suggested categories,
15
questions, and probability and impact ranges into a score sheet. It was influenced, as
well, by other material from Sweda and Ratcliff’s research and experience as test
professionals. The spreadsheet contains five tabs. The first tab provides the summary
view of the assessment and the spreadsheet creators took advantage of features in Excel
that allow predetermined lists of values, color coding based on responses, calculations
across cells, and sorting for content of cells. The first tab includes visibility of all
allowable values as well as suggestions for categorizing risk factors and instructions for
modifying the spreadsheet to account for software increment specifics. Test
professionals can capture risk factors in the spreadsheet rows and characterize them using
common themes and in support of the larger process described in Sweda and Ratcliff
(2010, 2014a).
The spreadsheet supports the larger process with columns and calculations leading
up to the choice of the appropriate level of test. A recommended level of test can be
assigned at the risk factor level, allowing for multi-level test events to be planned. The
first column is designated for a text description of the risk factor. Risk factors are
revealed through the larger step-by-step process and Sweda and Ratcliffe’s rule of thumb
is that the number of factors should be no more than 10 (2014a, p. 4). The second
column is designated for a risk category and may include labels tailored to the program,
development phases producing the risk, program management topics (e.g., training and
funding), or operational topics (e.g., readiness for network-centric environments). The
third column is designated for a description of how the risk’s associated failure may be
observed, should it surface in operations. The fourth and fifth columns are designated for
mission impact and likelihood of occurrence, respectively. In addition to common risk
16
numerics, that is the product of impact times probability, the sixth column is designated
as a rating of the difficulty that could be encountered in attempts to expose a flaw
associated with this risk. Columns for impact, probability, and detection rating form the
inputs to a risk priority calculation that is contained in the seventh column. There is an
additional column for recording a risk mitigation strategy. The result of a test
professional completing the spreadsheet is a commonly formatted record, with common
terminology, that supports the test team’s determination of an appropriate level of test.
Table 1 contains the terminology for the parameters of the risk priority
calculation. Each term equates to a number with lowest numbers indicating minor
impact, low probability, and reliable detection methods, while highest numbers indicate
the opposite end of the spectrum. An exception to the scaling is that mission impact
parameters rise by a greater interval with greater impact. This results in a greater weight
for higher impact parameters. The intervals for impact are 1, 3, 7, and 10, rather than a
linear 1, 2, 3, and 4 (Sweda & Ratcliffe, 2014b, p. 1). Multiplying a number from each of
the parameter types results in a product that can be used to rank order the risk factors,
which in turn points to mitigation and testing efforts to be commensurate with perceived
risk. Further the ranking calculations are color coded green (less than 8 is low risk),
yellow (between 9 and 17 is moderate risk), and red (greater than 17 is high risk) as a
visual aid (p. 1).
The spreadsheet includes a standardized presentation format for the results of an
assessment and the application of the assessment to the choice of testing level. Figure 1
depicts the format for results and provides an example of the color coding (Sweda and
Ratcliff, 2014a, p. 8).

17
Table 1
Categories of Impact, Likelihood, and Detection
Mission Impact Likelihood of Occurrence Detection Rating Minor Very Low Easy
Significant Low Standard Severe Moderate Complicated
Catastrophic High May Not Find Very High
Note. Data are from Sweda and Ratcliffe (2014b).
Figure 1. Standardized report format. 605 TES Risk Assessed Level of Test (RALOT) Process Guidelines, by Sweda and Ratcliffe, 2014a. [used with permission]
The spreadsheet and ranking are not intended to be developed or used in isolation.
Sweda and Ratcliffe provided step-by-step instructions for using the spreadsheet in the
605th’s process guidelines. (2014a) While the spreadsheet does contain important
definitions of terms and a tab devoted to interpreting the test levels, specific
recommendations and details on its use are provided as a process description.
Brainstorming and a questionnaire that expounds on questions provided in Guidelines
(2003, 2010), are provided in the process document along with phases for the execution
of activities, how activities relate, and examples of testing circumstances to aid and
clarify labeling.
Additional concepts for measures, sources, and degrees of risk from Guidelines
(2003) provide a helpful backdrop for the 605th’s RALOT process. These include

18
mission impact, context, probability of occurrence, and placement of occurrence (when in
development process), also, notions such as core increment and others. The Guidelines
concepts are described below:
Weight, or impact to mission, can have a value ranging from least to most, and
likelihood can also have values ranging from least to most. Impact to mission or weight
is defined as “the impact of the possible failure of the new increment on the mission of
the whole system” (Guidelines, 2003, p. 8). In this context, whole system is used in the
broadest sense of a system, which is any generic and holistic combination of humans,
tools, processes, and environment related in an aspect of function.
Probability of occurrence is a concept derived from the compounding of threats to
success, which is where the categories of development, implementation, technology,
complexity, safety, security, and their respective characteristics come into play. As flaws
in process, preparations, and applied technologies, as well as the human elements of skills
and commitment, accumulate, the probability of failure of the increment also rises.
Additionally, the guidelines’ narrative (Guidelines, 2003) emphasizes the roles of
increment size (smaller is less risky) and complexity (complicated relationships are more
risky).
Another useful concept from the guidelines is called core increment (Guidelines,
2003). A core increment is an exception in that it, by this policy, must be subjected to
full operational testing. The core increment of a system “normally consists of basic
hardware, system software and tools, and fundamental applications” (Guidelines, 2003, p.
1). Subsequent increments, then, are the object of a decision about the degree of testing
to be performed.

19
A central illustration of Guidelines (2003) was the matrix that models degree of
test as a function of effect on mission and failure potential. Each cell of the matrix
contains a test level labeled with Roman numerals I through IV. Those definitions are
explained further in the guidelines document and “are provided as examples, rather than
requirements” (Guidelines, 2003, p. 10). The four levels are as follows:
Level I: The least amount of dedicated operational testing resources is required
for testing at this level. In a Level I test, the results from developmental testing efforts
have considerable credibility. Development contractors are permitted to participate, the
presence of a validated recovery plan mitigates failure possibilities, size and complexity
are minimal, limited early fielding efforts are permitted, and test responsibility can be
delegated (Guidelines, 2003, p. 10).
Level II: Enough operational testing resources to perform over-the-shoulder
participation in developmental testing are required in a Level II test. This means that the
operational test personnel are allowed to provide additional test scenarios to the
developmental test team and observe any test activities. Development contractors are
allowed to participate, limited early fielding is a source of test feedback, and minor risk
associated with software improvements qualifies the increment for Level II testing.
Reporting procedures keep upper-level management informed (Guidelines, 2003, p. 11).
Level III: The amount of operational testing resources required, in addition to
time, includes increased expertise in the areas of mission, testing, and systems. Level III
tests include an independent testing phase or phases, test preparations and execution for
well-scripted test events, potentially more than one test site, and an increased emphasis
on the realism of the test. Responsibility and supervision of latter phases of the test are in

20
the complete control of the independent testing organization. In reporting, independent
evaluations of the operational effectiveness and suitability of the increment accompany
fielding decisions (Guidelines, 2003, pp. 11-12).
Level IV: Level IV tests drive the highest resource requirements for stakeholders
and the testing organization. A Level IV test is reserved for the riskiest attempts to field
an increment. Additional parameters for operational effectiveness and suitability may be
introduced. Independently collected operational test data are broad in scope and receive
the highest consideration. The increment may be described as new. Although full
constraints are imposed, testing professionals may deem parts of the increment suitable
for a lower level of testing (Guidelines, 2003, p. 12).
With the 2010 version of Guidelines, came the streamlining of test levels to
account for the distinctions of information and business systems when compared to other
types of traditional weapon systems (p. 1). This is a key difference in the newer
guidelines which allowed for substitution of three levels of test for information and
business systems. The three test levels are comparable to the original Level I through III
with the exception that the newer Level III test is the most rigorous level described as
applicable to an information and business system. Level IV testing is dropped from the
2010 guidance and is not included in the Calculated RALOT tool or test level
interpretations (Sweda & Ratcliffe, 2014b, p. 1 & 5).
The 605th’s process guide and tool introduce additional interpretations to aid the
interviewing and decision-making roles (Sweda & Ratcliff, 2014a; 2014b). The
abbreviated descriptions in the spreadsheet, for example, expose the rigor of the test
environment and test scenarios. The spreadsheet describes a progression from a
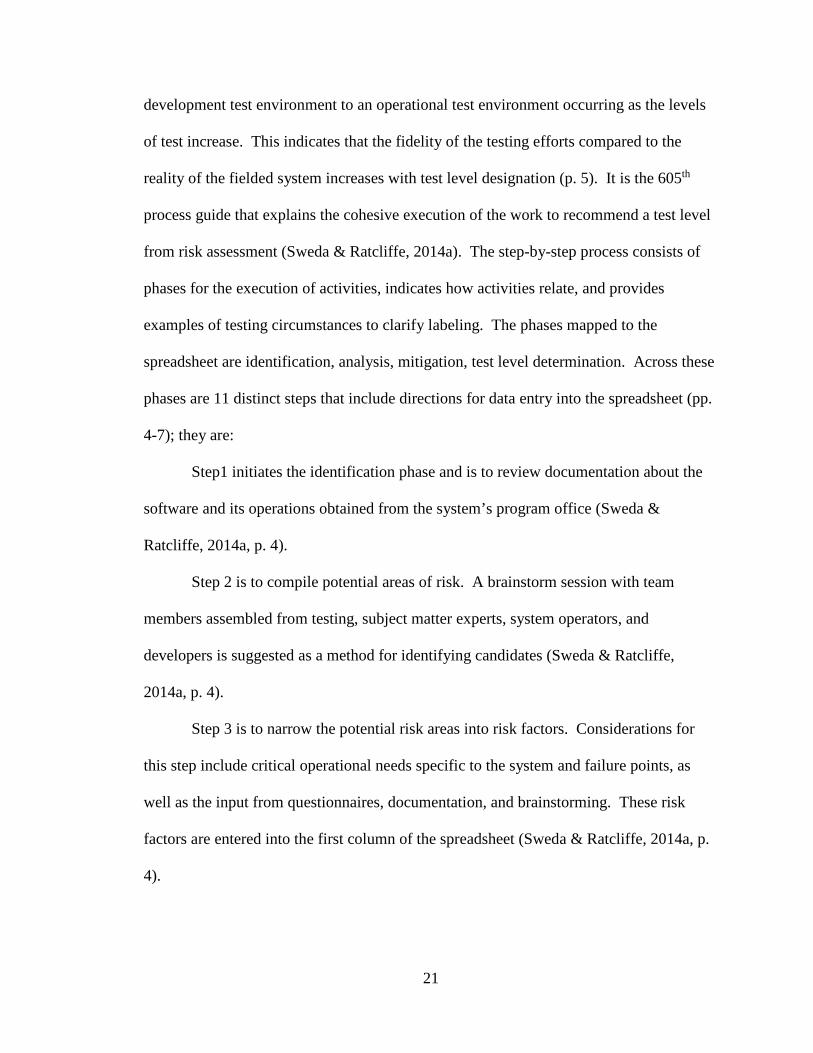
21
development test environment to an operational test environment occurring as the levels
of test increase. This indicates that the fidelity of the testing efforts compared to the
reality of the fielded system increases with test level designation (p. 5). It is the 605th
process guide that explains the cohesive execution of the work to recommend a test level
from risk assessment (Sweda & Ratcliffe, 2014a). The step-by-step process consists of
phases for the execution of activities, indicates how activities relate, and provides
examples of testing circumstances to clarify labeling. The phases mapped to the
spreadsheet are identification, analysis, mitigation, test level determination. Across these
phases are 11 distinct steps that include directions for data entry into the spreadsheet (pp.
4-7); they are:
Step1 initiates the identification phase and is to review documentation about the
software and its operations obtained from the system’s program office (Sweda &
Ratcliffe, 2014a, p. 4).
Step 2 is to compile potential areas of risk. A brainstorm session with team
members assembled from testing, subject matter experts, system operators, and
developers is suggested as a method for identifying candidates (Sweda & Ratcliffe,
2014a, p. 4).
Step 3 is to narrow the potential risk areas into risk factors. Considerations for
this step include critical operational needs specific to the system and failure points, as
well as the input from questionnaires, documentation, and brainstorming. These risk
factors are entered into the first column of the spreadsheet (Sweda & Ratcliffe, 2014a, p.
4).

22
Step 4 is to categorize the risk factors using the suggested terms of “design &
development, net-ready, operational effectiveness, operational suitability, operational
environment, programmatic, and other” (Sweda & Ratcliff, 2014a, p. 4). The categories
are entered into the second column of the spreadsheet
Step 5 initiates the analysis phase and is compilation of a description of how the
potential failure manifests for the user, called “failure mode” (Sweda & Ratcliff, 2014a,
p. 4). The text describing the user’s experience with a failure is entered into the third
column.
Step 6 is the assessment of the risk factor’s potential impact to the system as a
whole or in its role as a member of a system of systems and includes critical operational
issues. Impact is a number reflecting minor to catastrophic consequences that is entered
into the fourth column (Sweda & Ratcliffe, 2014a, p. 5).
Step 7 is determination of the probability and likelihood of failure from potential
threats to success of the effort and is described as a judgment call aggregating from
cumulative threat effects. Each failure mode figures into the determination independently
and can apply during test execution or as has potential for mission operations.
Likelihood of occurrence is a number reflecting very low to very high probability entered
into the fifth column (Sweda & Ratcliffe, 2014a, p. 5-6).
Step 8 is assignment of a detection rating relating to the reliability of the methods
of revealing the failure modes and marks the beginning of the risk mitigation phase.
These ratings are taken from the effort and tools available and necessary to detection.
They range from scenarios where tools are easily and simply executed to situations where
complications may lead to variations in methods and test results. The least reliable
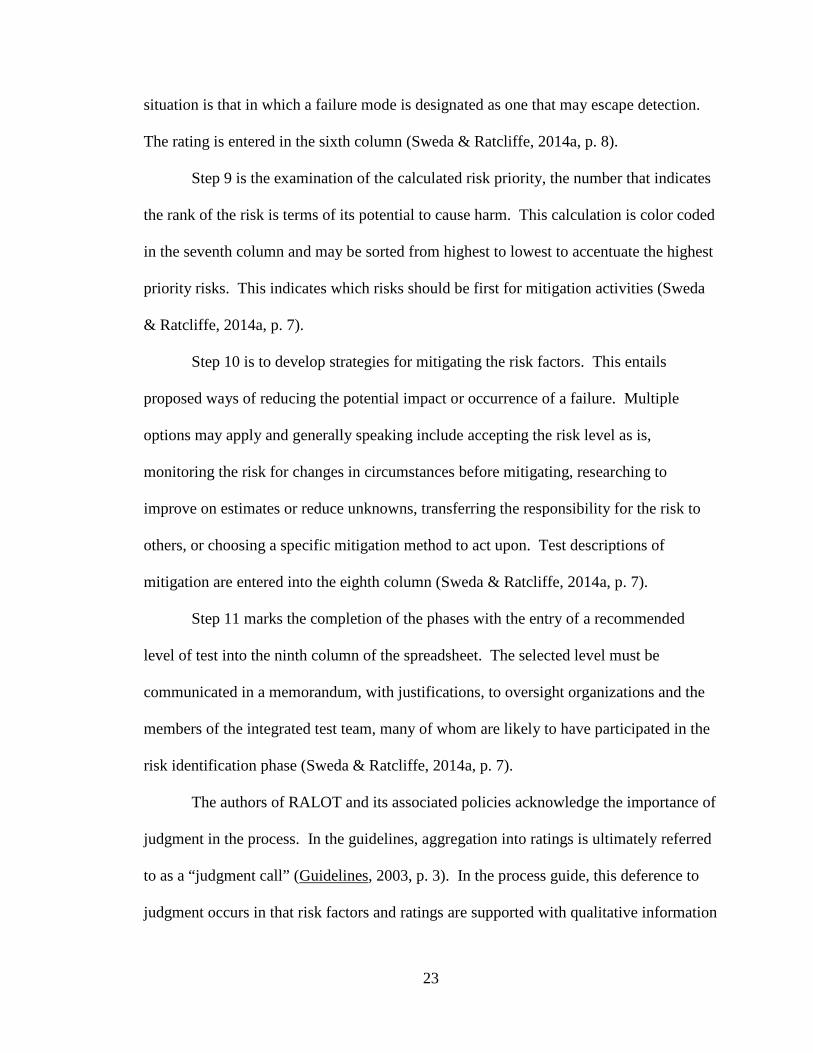
23
situation is that in which a failure mode is designated as one that may escape detection.
The rating is entered in the sixth column (Sweda & Ratcliffe, 2014a, p. 8).
Step 9 is the examination of the calculated risk priority, the number that indicates
the rank of the risk is terms of its potential to cause harm. This calculation is color coded
in the seventh column and may be sorted from highest to lowest to accentuate the highest
priority risks. This indicates which risks should be first for mitigation activities (Sweda
& Ratcliffe, 2014a, p. 7).
Step 10 is to develop strategies for mitigating the risk factors. This entails
proposed ways of reducing the potential impact or occurrence of a failure. Multiple
options may apply and generally speaking include accepting the risk level as is,
monitoring the risk for changes in circumstances before mitigating, researching to
improve on estimates or reduce unknowns, transferring the responsibility for the risk to
others, or choosing a specific mitigation method to act upon. Test descriptions of
mitigation are entered into the eighth column (Sweda & Ratcliffe, 2014a, p. 7).
Step 11 marks the completion of the phases with the entry of a recommended
level of test into the ninth column of the spreadsheet. The selected level must be
communicated in a memorandum, with justifications, to oversight organizations and the
members of the integrated test team, many of whom are likely to have participated in the
risk identification phase (Sweda & Ratcliffe, 2014a, p. 7).
The authors of RALOT and its associated policies acknowledge the importance of
judgment in the process. In the guidelines, aggregation into ratings is ultimately referred
to as a “judgment call” (Guidelines, 2003, p. 3). In the process guide, this deference to
judgment occurs in that risk factors and ratings are supported with qualitative information
24
which is submitted to an automated calculation. The aggregating activity of choosing
levels is performed by the operator of the spreadsheet and entered as data. Comments are
accommodated. A comprehensive set of topics and a diligent investigation are apparent
in the materials. This provides decision makers and stakeholders much needed evidence
to support their actions given the procedural and constraining nature imposed upon them
by of DoDI 5000.02 (2008). Visualizations aid interpretation of the data, and
opportunities to introduce engineering measures of complexity occur through the topics
covering interactions, size, and dependencies. The backbone of RALOT risk assessment
progresses from requirements and development to fielding decisions and is described as
continuous, which allows strategic viewpoints to form in early stages.
Risk Assessment in Software
For the purposes of this research and readability, the literature review for risk in
software engineering and development is generally organized around three domains in an
effort to find the ways existing approaches contribute to an assessment of risk at
deployment time of a software development project. The three domains are in keeping
with the scope of subject matter found in the RALOT methodology and account for many
factors to be as true as possible to the complexity of the environment. The three domains
are software testing, project management, and risk assessment, which also includes a
literal search for risk assessment approaches specific to the software task.
Software testing: The first subsection addresses software testing as a discipline.
The traditional testing approach centers on testing for software quality when the software
operates in its intended system environment. The typical quality characteristics relate to
requirements deficiencies, code deficiencies, and security vulnerabilities. The test results

25
describe how the software deviates from expectations. The underlying assumption is that
deviations have a risk potential and fewer deviations are better. Four variations on this
theme are as follows and are described in subsequent paragraphs with more detail:
• Technical debt: The assertion that a deviation from a standard or the
occurrence of a deficiency can be tolerated but must eventually be addressed
(Allman, 2012).
• The bug bounce (Robin et al., 2005) is an event in tracking defect occurrence.
• Software analysis and complexity metrics.
• Subjective or philosophical approaches.
Software project management: The second subsection addresses software project
management. As a branch of generalized project management, project risk management
provides a body of work relevant to software development projects. The trade space of a
project is assessed for impact due to deviations from the project plans and risk mitigation.
The plans consist of cost, schedule, and performance parameters. Trade-offs consist of
exchanges such as increasing cost in order to decrease schedule and can be risk
motivated. Performance for a software project is often reflected in the characteristics of
the software product, such as the number of features. Variations on this theme are as
follows:
• Process improvement models for consistent attention to quality.
• Information technology (IT) service management, Information Technology
Infrastructure Library for specific descriptions of services.
• Risk management as a practice with leadership visibility.

26
Software risk assessment: A specific search in the area of risk assessment but
limited to software engineering provides a connection to research in decision making and
statistical modeling. The third subsection covers the work done in this area.
Software testing. This material includes testing methods for software programs.
Recent thinking in testing approaches. Chen, Probert, and Sims (2002)
described their highly structured method for choosing regression tests that provide the
biggest payoffs in terms of critical path coverage and risk reduction. Chen et al. first
distinguished between tests that are targeted (i.e., those that hit important business
functions) and tests that are safety (i.e., those that hit riskier areas and are ranked thus).
The tests were characterized by their relationship to activity diagrams as opposed to the
code, making for black box (specification) tests rather than white box (code-based) tests.
The justification for specification-based testing was that code-based testing becomes
unmanageable as components are combined, are larger, or are at a subsystem level of
abstraction.
Choosing a subset of the total test suite for regression testing was based on two
views in Chen et al. (2002): (a) traceability between the requirements (represented in
Unified Modeling Language activity diagrams) and the test cases (specification-based)
and (b) risk exposure as calculated. In specification-based choice, nodes and edges in the
diagram are mapped to test cases. Coders document the change history from the code to
the nodes and edges affected. Testers map defects to test cases. Between these two
relationships and control flow analysis of the delta, i.e., the net change, in the
specification, all elements that underwent a change are identified and corresponding tests
selected.
27
In risk-based choice for safety tests, any remaining test time is devoted to those
tests that further ensure the performance of the software. The tests are ranked for their
coverage of risk and executed accordingly until time and resources are expended. Risk
exposure is calculated familiarly as impact times the probability of occurrence. Chen et
al. (2002) extended the formula by adapting probability with severity and summed risk
exposure to rank end-to-end test scenarios for execution. As scenarios are executed, the
risk exposure is recalculated and remaining tests are ranked again for further execution.
Chen et al. (2002, pp. 1-14) found, by performing a case study of the IBM Websphere
product, that their method exposed more defects than the subjective method of choosing,
that the structured nature allowed for cost savings, and that it provided better overall
coverage for risks and paths than the manually chosen test suite.
Technical debt. Technical debt is the assertion that a deviation from a standard of
performance or the occurrence of a deficiency can be tolerated but must be managed and
eventually addressed. Allman (2012) described Cunningham’s original notion and
collected others’ contributions to the idea that shortcuts or cost-saving measures,
although resulting in known issues with software products, can be tested for and tracked
as technical debt. When the risk or cost associated with living with the defect exceeds
the benefit of deferring the maintenance, the technical debt must be addressed (Allman,
2012).
The bug bounce. Robin et al. (2005) described a threshold for declined risk
beyond which risk is manageable. According to Robin (2005), “Zero-bug bounce is the
point in the project when development finally catches up to testing and there are no active
bugs—at least for the moment” (p. 23).
28
Software analysis and complexity metrics. Automated code analysis is a
method of indicting the quality of code, and therefore the code’s potential to be
troublesome, through accountings of undesirable code characteristics that survive
compilers such as certain kinds and numbers of paths through code, indicators of
modularity in collections of code, and simpler descriptive statistics. A pivotal work in
this area was the McCabe complexity metric, also known as Cyclomatic complexity,
which is a count of paths through blocks of code (McCabe, 1976, p. 308).
An example of the application of software analysis and complexity metrics put
into practice was a case study of Microsoft’s distributed development and its relationship
to code quality by Bird, Nagappan, Devanbu, Gall, and Murphy (2009). In this study, the
code for Vista was analyzed for a variety of metrics to determine how distributed teams
affect the occurrence of flaws (Bird et al., 2009, p. 91). This work by Bird et al.
examined how the geographical dispersion of labor to write code for a large system does
or does not affect the number of defects found after software was released to operations
and found that distinction by geography revealed a negligible difference in the defect
occurrence for the Microsoft Vista development team. Bird et al. listed strategies that can
be used to address other factors that negatively address defect occurrence when teams are
distributed. These included (a) removing competitive situations and pay differences
among sites; (b) removing cultural barriers through collocation in early stages to dispel
trust issues, alleviate perceptions about capabilities, and improve response times in
communications; (c) using synchronous communication tools every day, such as
conference calls; (d) using common sets of software development or project management
tools; (e) establishing consistent code ownership responsibilities for control of software
29
units; (f) sharing schedules with known time frames for milestones; and (g) employing
organizational structures not based on geography to aid employee integration (Bird et al.,
2009, pp. 92-93).
Bessey et al. (2010) described their tenure as pioneers in the business of writing
code that detects bugs in others’ code. This kind of analysis revealed what seemed to be
useful metrics and specifics about bugs, yet encounters with compiler idiosyncrasies,
false positives and false negatives, defensive programmers, and counterintuitive
economics (allowing bugs to remain latent) threatened early tool development and sales
(Bessey et al., 2010, pp. 70-75).
Additionally, Ammar, Nokzadeh, and Dugan (2001) revealed the insufficiency of
considering a single metric in a comparison of analyses of design approaches. In their
work, it took four such metrics to find the differentiator of the group (Ammar et al., 2001,
p. 182).
Subjective approaches. Compare the examples above to a more philosophical
approach to testing provided by Armour (2005):
The challenge in testing systems is that testers are trying to develop a way to find
out if they don’t know that they don’t know something. This is equivalent to a
group of scientists trying to devise an experiment to reveal something they are not
looking for. . . . It is not possible to be wholly deterministic about testing since we
don’t know what to be deterministic about. (p. 15)
Armour (2005) is like Chen et al. in that probability is inserted, but unlike Chen et
al. in that Armour asserted there is an underlying, virtually autonomic, sixth sense
possessed by a good tester able to wring results from the otherwise inefficient practice of

30
dynamic testing. Armour reminded readers of the things testers do to control the
situation of not knowing what they do not know, all of which were more than helpful.
This included heuristic testing strategies such as constructing test cases that covered the
range of possible inputs and outputs or that represent bizarre or unlikely occurrences in
the execution environment. Armour provided the following summary:
If we cannot duplicate, in sufficient detail and with sufficient control, the
situations that will occur in the customer’s environment when we release the
software, we cannot expose these defects. Of course, the customer’s
environment, not being subject to this limitation, usually has no difficulty in quite
publicly demonstrating our lack of knowledge. (p. 17)
This comes from the emergent behavior associated with the myriad of elements in
the mix, including software, hardware, people, events, relationships, dependencies, and
competitors. Gharajedaghi (1999) offered the following definition of emergent behavior:
Emergent . . . properties are the property of the whole, not the property of the
parts, and cannot be deduced from properties of the parts. However, they are a
product of the interactions, not a sum of the actions of the parts, and therefore
have to be understood on their own terms. Furthermore, they don’t yield to the
five senses and cannot be measured directly. If measurement is necessary then
one can measure only their manifestation. (p. 45)
An effective physical example of emergent behavior is an Office Depot rubber
band ball. A ball made by taking equally sized rubber bands and stretching them over
each other until the circumference is roughly a slight stretch of one of the rubber bands.
The ball is nicely spherical and has a nice bounce. Even after removing a band or two.
31
But is there anything a tester can do to one of those rubber bands that will reveal how
high the ball will bounce or in what direction?
Bounce and trajectory are often representative of the very business result sought
by IT consumers. A measure of performance such as profit, time to close a deal, market
share, or air space dominance is the emergent behavior. Nothing in the parts of the IT
system, separated from the environment of the system, is likely to predict the really
desired behavior when provoked with a test. Testers perform all sorts of tests until their
confidence is sufficient (Armour’s good tester) or until they run out of time, or run out of
money (Chen’s efficient use of resources), but only the fielded system tells stakeholders
what they did not know that they did not know. It seems there is no longer the luxury of
employing only ceteris paribus when constructing testing strategies. Ability to respond in
a live environment is mandatory (when things go right or when things go wrong) and the
efficiency of structure is mandatory (arts and crafts are overcome by discipline).
Slocum (2005) offered the following analysis and prediction: Structure and
discipline resulted in the productivity revolution (as in Taylor’s scientific management
[as cited in Shafritz & Hyde, 1997, pp. 30-32] and Ford’s [1922] assembly lines);
structure and discipline gave us the quality revolution (Carnegie Mellon University
[CMU], 2002; Crosby, 1979; Deming, 1986; Humphrey, 1989; Juran, 1988); next will
come the innovation revolution. Slocum asked what each revolution has in common and
noted it systematizes a previously arts-and-crafts effort with discipline, processes, and
measures (Slocum, 2005). The dilemma is that flexibility is required but structure must
prevail. To summarize, software testing supplies a product-focused, measureable
technique; however, it presumes that testing can account for every variable and that a
32
product exists to test. Therefore as indicators of risk, tests are laggards. This lag in
knowledge is a contributor to the items of the problem statement having to do with
accurate risk measurement in a situation, including accumulation of unrecognized,
untimely risk. This transitions into the domain of project management as applied to
software and information technology risk.
Software project management. Project management and the triangle of cost,
schedule, and quality trace back to Martin Barnes, as captured in Boyce’s (2010) history
of project management compiled for the Association of Project Management. Solomon
wrote extensively on the subject and adapted the work to include earned value to
accommodate the U.S. defense industry and to recognize the needs of software
development (Solomon, 2013, p. 28). The field has remarkable reach, adaptation, and
variation as applied in IT.
Process improvement models. The Capability Maturity Model Integration body
of work, originating in 1991, comes from the Carnegie Mellon Software Engineering
Institute (CMU, 2002, p. i) and describes successive levels of process maturity originally
targeting software projects. The evaluation of projects with respect to their achievement
of levels of maturity is believed to indicate lessened risk at the higher maturity levels.
This model has now been generalized into many areas of product and service
management. See also the 1995 work on the model prior to its name change to include
integration work (Paulk, 1994). Adding integration to the concept expanded the scope of
application to include the operation of separate software products as an integrated unit.
The movement’s concentration on process, however, led to a debate on the significance
of process compared to the quality expectation for the end product.
33
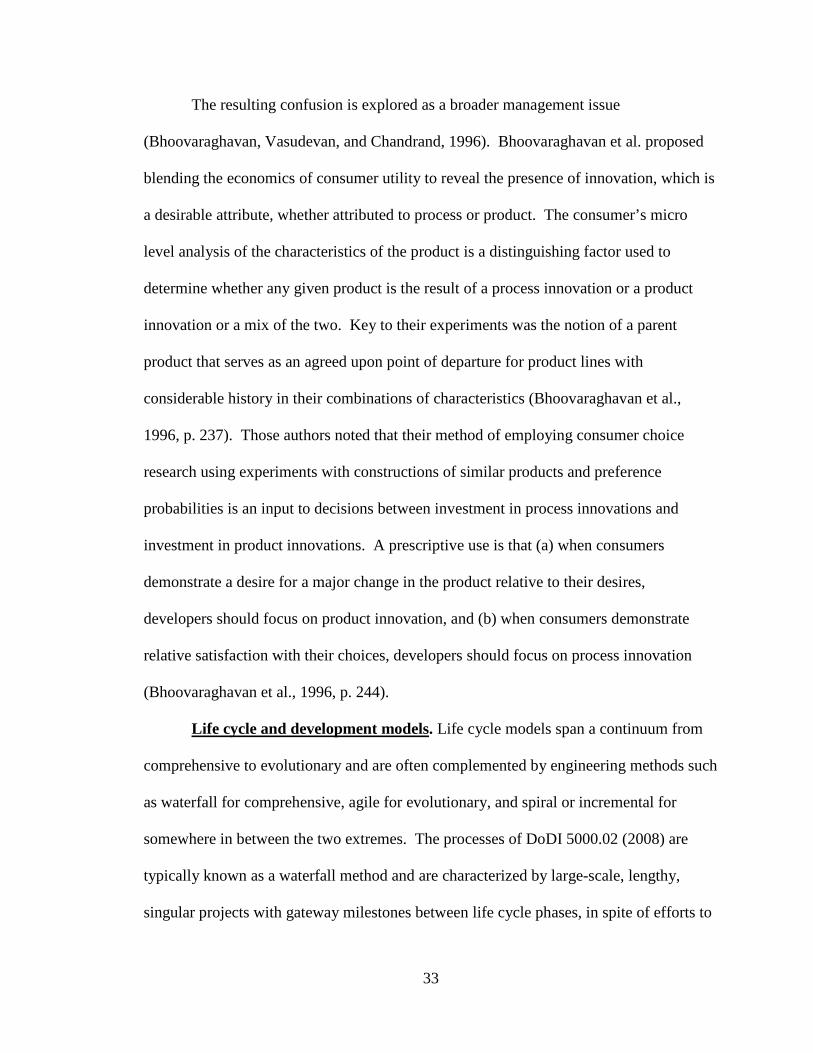
The resulting confusion is explored as a broader management issue
(Bhoovaraghavan, Vasudevan, and Chandrand, 1996). Bhoovaraghavan et al. proposed
blending the economics of consumer utility to reveal the presence of innovation, which is
a desirable attribute, whether attributed to process or product. The consumer’s micro
level analysis of the characteristics of the product is a distinguishing factor used to
determine whether any given product is the result of a process innovation or a product
innovation or a mix of the two. Key to their experiments was the notion of a parent
product that serves as an agreed upon point of departure for product lines with
considerable history in their combinations of characteristics (Bhoovaraghavan et al.,
1996, p. 237). Those authors noted that their method of employing consumer choice
research using experiments with constructions of similar products and preference
probabilities is an input to decisions between investment in process innovations and
investment in product innovations. A prescriptive use is that (a) when consumers
demonstrate a desire for a major change in the product relative to their desires,
developers should focus on product innovation, and (b) when consumers demonstrate
relative satisfaction with their choices, developers should focus on process innovation
(Bhoovaraghavan et al., 1996, p. 244).
Life cycle and development models. Life cycle models span a continuum from
comprehensive to evolutionary and are often complemented by engineering methods such
as waterfall for comprehensive, agile for evolutionary, and spiral or incremental for
somewhere in between the two extremes. The processes of DoDI 5000.02 (2008) are
typically known as a waterfall method and are characterized by large-scale, lengthy,
singular projects with gateway milestones between life cycle phases, in spite of efforts to

34
accommodate new methods. The results are held until the end of the project. Spiral
development was coined by Barry Boehm (1988), who wrote the breakthrough
publication to address reducing traditionally large and unwieldy projects into manageable
parts. He described the approach as risk-driven and juxtaposed spiral with waterfall to
make his argument (Boehm, 1988, p. 1). The Agile Manifesto began a body of work to
increase flexibility by creating a stream of even smaller projects, each with working
software delivered (Beck, 2001). Speed of development is often associated with agile
approaches, which are also a source of criticism. An example was the report describing
Silicon Valley’s pursuit of fast implementation for new features and the trade-offs
engineers entertain in the process, at times choosing risk as a parameter of product
improvement (Vance, 2013). With DoDI 5000.02 being the policy governing many
software development organizations, hybrid attempts to meld aspects of development
models continue to surface in projects (West, 2011, p. 1).
IT Service Management, Information Technology Infrastructure Library.
This library of best practices extends the developmental stages of software applications
into the sustainment arena. It was originally documented by the United Kingdom’s
Office of Government Commerce. As businesses sought to maximize the value of their
IT investments, add support of IT to the equation, and avert risk in acquisition strategies,
service management providers (for example, the common help desk for software support)
grew in sophistication as a segment of the industry. Since the 1980s, the Information
Technology Infrastructure Library following has produced many volumes of service
management best practices (Office of Government Commerce, 2007, pp. 3-4).
35
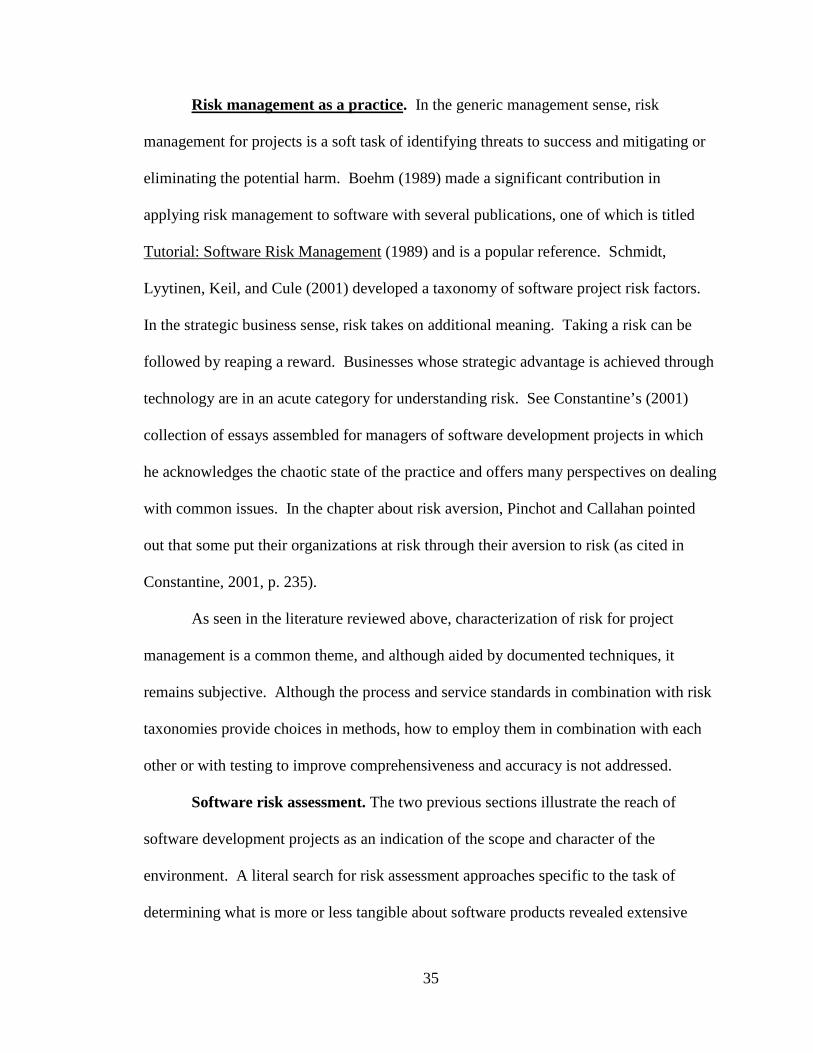
Risk management as a practice. In the generic management sense, risk
management for projects is a soft task of identifying threats to success and mitigating or
eliminating the potential harm. Boehm (1989) made a significant contribution in
applying risk management to software with several publications, one of which is titled
Tutorial: Software Risk Management (1989) and is a popular reference. Schmidt,
Lyytinen, Keil, and Cule (2001) developed a taxonomy of software project risk factors.
In the strategic business sense, risk takes on additional meaning. Taking a risk can be
followed by reaping a reward. Businesses whose strategic advantage is achieved through
technology are in an acute category for understanding risk. See Constantine’s (2001)
collection of essays assembled for managers of software development projects in which
he acknowledges the chaotic state of the practice and offers many perspectives on dealing
with common issues. In the chapter about risk aversion, Pinchot and Callahan pointed
out that some put their organizations at risk through their aversion to risk (as cited in
Constantine, 2001, p. 235).
As seen in the literature reviewed above, characterization of risk for project
management is a common theme, and although aided by documented techniques, it
remains subjective. Although the process and service standards in combination with risk
taxonomies provide choices in methods, how to employ them in combination with each
other or with testing to improve comprehensiveness and accuracy is not addressed.
Software risk assessment. The two previous sections illustrate the reach of
software development projects as an indication of the scope and character of the
environment. A literal search for risk assessment approaches specific to the task of
determining what is more or less tangible about software products revealed extensive

36
attempts to quantify, measure, predict, scale, rank, calibrate, or conduct other activities to
understand the nature of a particular piece of software’s risk qualities and what to do
about them. Various authors have addressed risk assessment. From specialty areas such
as systems architecture and space programs to more generalized sources such as
standards and metrics, the authors referenced below stepped through their viewpoints and
practical research attempts into the matter as follows:
A computer systems expert, Zachman (1987) synthesized a comprehensive model
of information systems by intersecting the components of blueprints for building plans
and bills of material for manufacturing with components of information systems to form
a set of systems architecture viewpoints. In Zachman’s conclusions, he noted that risks
are associated with not producing the entire set of viewpoints, because each represents
important aspects of the system to be reasoned with, such as the perspectives of the
owner, designer, and builder, as well as the system technology itself (pp. 282, 291-292).
Observations from programs fed this view: Boehm (1991) compiled the state of
software risk management in answer to the often dismal performance of systems
development projects while he was the director of the Defense Advanced Research
Project Agency’s Information Science and Technology Office. Boehm noted that a
common quality of successful project leadership is that it includes good risk
management. At that time, those good risk managers were not necessarily using a
common vocabulary of risk, nor were managers cognizant in a concrete way of their
sense of risk exposure. Boehm described the issue of software risk management, “The
emerging discipline of software risk management is an attempt to formalize these risk-
oriented correlates of success into a readily applicable set of principles and practices” (p.
37
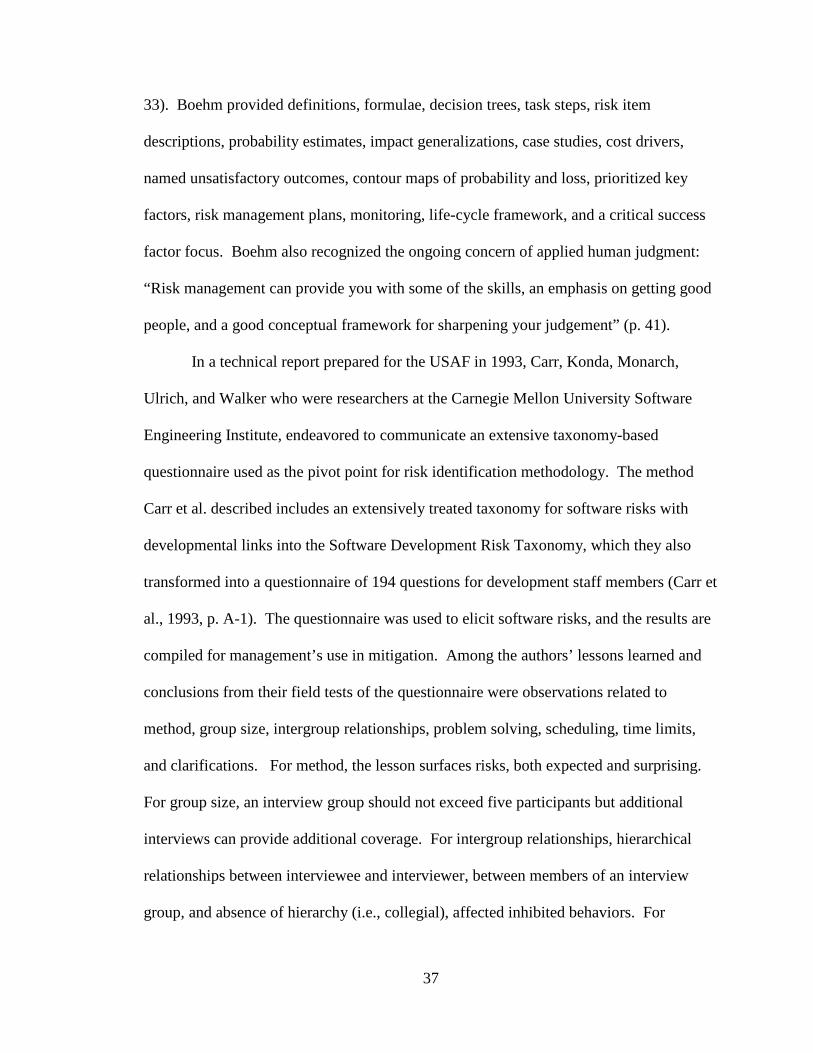
33). Boehm provided definitions, formulae, decision trees, task steps, risk item
descriptions, probability estimates, impact generalizations, case studies, cost drivers,
named unsatisfactory outcomes, contour maps of probability and loss, prioritized key
factors, risk management plans, monitoring, life-cycle framework, and a critical success
factor focus. Boehm also recognized the ongoing concern of applied human judgment:
“Risk management can provide you with some of the skills, an emphasis on getting good
people, and a good conceptual framework for sharpening your judgement” (p. 41).
In a technical report prepared for the USAF in 1993, Carr, Konda, Monarch,
Ulrich, and Walker who were researchers at the Carnegie Mellon University Software
Engineering Institute, endeavored to communicate an extensive taxonomy-based
questionnaire used as the pivot point for risk identification methodology. The method
Carr et al. described includes an extensively treated taxonomy for software risks with
developmental links into the Software Development Risk Taxonomy, which they also
transformed into a questionnaire of 194 questions for development staff members (Carr et
al., 1993, p. A-1). The questionnaire was used to elicit software risks, and the results are
compiled for management’s use in mitigation. Among the authors’ lessons learned and
conclusions from their field tests of the questionnaire were observations related to
method, group size, intergroup relationships, problem solving, scheduling, time limits,
and clarifications. For method, the lesson surfaces risks, both expected and surprising.
For group size, an interview group should not exceed five participants but additional
interviews can provide additional coverage. For intergroup relationships, hierarchical
relationships between interviewee and interviewer, between members of an interview
group, and absence of hierarchy (i.e., collegial), affected inhibited behaviors. For

38
problem solving, evoked discussions tended to devolve into problem-solving sessions.
For scheduling, interview scheduling was important to maintaining formality and
avoiding disruptive interruptions. For time limits, 2 hours 30 minutes was the group
session limit. For clarifications, additional sessions for clarifications were indicators for
further analysis (Carr et al., 1993, pp. 19-20).
In a 1999 updated DoD military standard addressing product verification (called
MIL-STD-1540D), the DoD noted, “The large number of independent organizations
involved and the complexity of equipment and software means that extensive verification
of launch and space systems is necessary to reduce the risk of failure” (p. ii). The focus
of the standard was determining a response to the risk of failure on mechanisms that
precipitate failure, where assessment of risk leads to the establishment of testing
requirements using those mechanisms. The generalized notions of verification given
were “analysis, test, inspection, demonstration, similarity, or a combination of these
methods” (DoD, 1999, p. 6). Much of the material appeared to be relevant to software in
combination with hardware components and appeared to acknowledge the combination as
driving the need for extensive verification. Software is called an integral component
throughout the document. However, the authors noted, “Details of other verification
activities required such as for software and for integrated system level requirements are
too extensive for inclusion in this document” (DoD, 1999, p. 70).
Further, risk management is viewed as a life-cycle process calling for the periodic
reassessment of risk elements. Specific factors are provided in a series of tables relating
tests to risks in mitigation categories for technical, cost, and schedule risks. Notable
guidance from this document calls on industry support of a common database for life-

39
cycle data to be used for process improvements (DoD, 1999, p. 16). The specification is
“approved for use by all Departments and Agencies of the Department of Defense”
(DoD, 1999, p. ii).
In a standards based legacy, NASA provided standards and guidance on risk as
related to software as well. As examples, each publication below provided useful risk
assessment and management concepts and practical guidance for software developers,
while the chronological listing provides an indication of progress in the field:
• “Manager’s Handbook for Software Development” (1990) documented the
use of prototype software to mitigate risks related to new technologies (pp. 1-
5).
• “Software Safety NASA Technical Standard” (1997) provided guidance to
ensure risk assessment accompanies plans for testing known as independent
verification and validation and includes a software criticality rating (p. 4).
• “Software Safety Standard” (2004) expanded on the previous version and
provides additional material in guidebook form. NASA acknowledged that
revisions to its standard are regularly warranted and included treatments of
commercial off-the-shelf software and security issues (p. i).
Returning to the architectural viewpoint, Bass, Clements, and Kazman (1998)
described their software architecture analysis method, which is a means of examining the
quality attributes and objectives of desired systems with scenarios and walkthroughs
designed to uncover weaknesses or inappropriate separations of functionality (pp. 194-
206). This type analysis is generally referred to as occurring at the architectural level,
which indicates that abstractions are employed to make determinations about the

40
outcomes at a lower level of detail, which was researched by Yacoub, Ammar, and
Robinson (2000).
Yacoub et al. (2000) referenced and used NASA’s 1997 standard in their article
on architectural-level risk assessment as the source of risk definitions. The basic
definition of risk Yacoub et al. applied to their work is a function of three elements:
frequency of occurrence of a negative event, severity of the event’s impact, and the
uncertainty associated with the occurrence and impact (Yacoub et al., 2000, p. 210). The
article’s focus is on a shift from subjective risk assessment methods to those that are
quantitative. Yacoub et al. proposed tapping known qualities of software and their
quantitative representations, which can be derived from architectural representations.
Those qualities include coupling and complexity, which are also associated with the
appearance of flaws in software that equate to reliability risks. For example, by viewing
software as a collection of components and connectors, the authors could rely on
architectural-level representations to characterize software risk.
This means that risk assessments can be performed without the completed
software product and do not solely rely on the questionnaire and taxonomy-styled
assessments. Dynamic metrics are those captured through the execution of the
architectural model, as in simulation. Yacoub et al. used Unified Modeling Language
and component dependency graphs as the means of capturing the architectural
component’s and connector’s behavior during a simulation of their interactions and noted
a correlation between the occurrence of faults and the complexity with roots to McCabe’s
Cyclomatic measurements (p. 213). Yacoub et al. compiled execution scenarios and used
this to chart a path through the software, which is then accompanied by a probability of
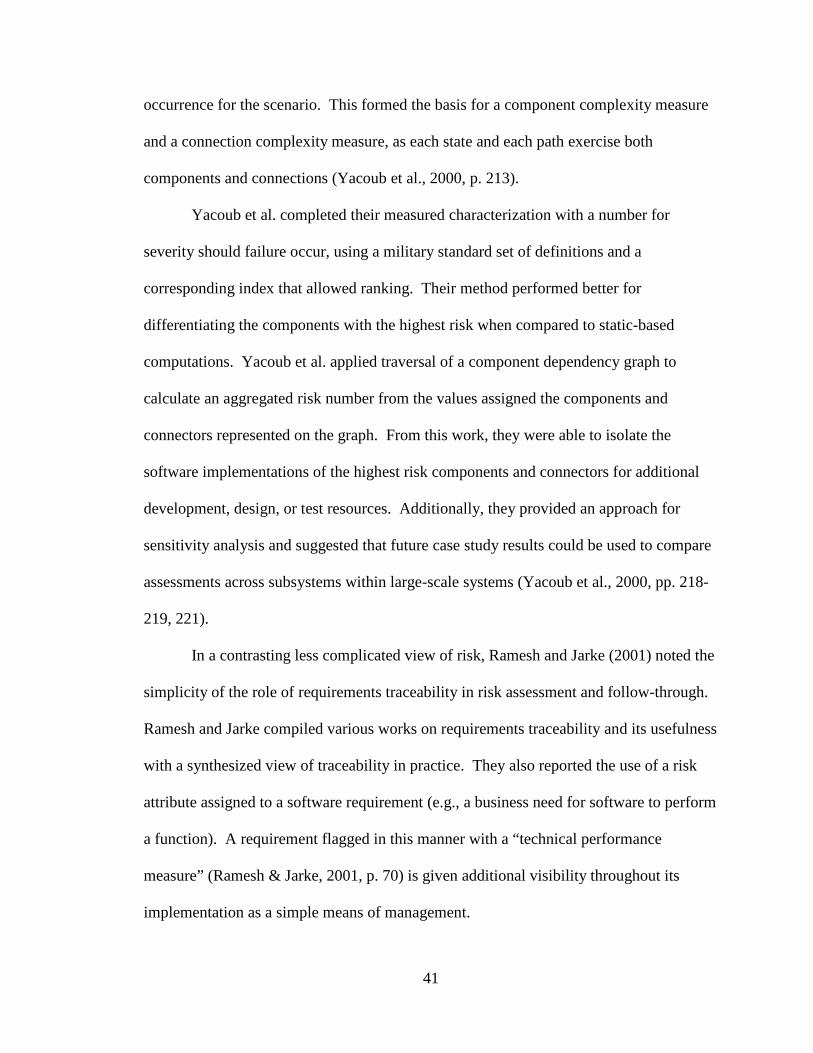
41
occurrence for the scenario. This formed the basis for a component complexity measure
and a connection complexity measure, as each state and each path exercise both
components and connections (Yacoub et al., 2000, p. 213).
Yacoub et al. completed their measured characterization with a number for
severity should failure occur, using a military standard set of definitions and a
corresponding index that allowed ranking. Their method performed better for
differentiating the components with the highest risk when compared to static-based
computations. Yacoub et al. applied traversal of a component dependency graph to
calculate an aggregated risk number from the values assigned the components and
connectors represented on the graph. From this work, they were able to isolate the
software implementations of the highest risk components and connectors for additional
development, design, or test resources. Additionally, they provided an approach for
sensitivity analysis and suggested that future case study results could be used to compare
assessments across subsystems within large-scale systems (Yacoub et al., 2000, pp. 218-
219, 221).
In a contrasting less complicated view of risk, Ramesh and Jarke (2001) noted the
simplicity of the role of requirements traceability in risk assessment and follow-through.
Ramesh and Jarke compiled various works on requirements traceability and its usefulness
with a synthesized view of traceability in practice. They also reported the use of a risk
attribute assigned to a software requirement (e.g., a business need for software to perform
a function). A requirement flagged in this manner with a “technical performance
measure” (Ramesh & Jarke, 2001, p. 70) is given additional visibility throughout its
implementation as a simple means of management.
42
With a work combining many views discussed above and in 2003, the U.S.
General Accounting Office (GAO) produced an executive guide for assessing and
improving the management of enterprise architecture. Note that in 2004, the GAO
changed its name to the Government Accountability Office. The authors began with
applied theory dating to Zachman’s framework and combined with the maturity models
of the 1990s to form a means of assessing the quality of an organization’s enterprise
architecture efforts. The GAO promoted enterprise architecture as a “hallmark of
successful public and private organizations” (p. i) and a critical success factor. The
report mentioned other significant work in this area such as the Federal Enterprise
Architecture Framework published in 1999. The GAO placed value on risk management
as a component of IT investment strategies and associated risk management with the
higher levels of maturity in conducting enterprise architecture functions (pp. 9, 12, 13,
14). The DoD introduced additional sources of enterprise architecture guidance with the
DoD Architecture Framework (DoDAF); the most recent version being 2.02. The
guidance included a section devoted to using the architecture in decision making in which
risk management for technical risks is supported by the information captured in the
architecture products. It included complexity in the flow of information, performance of
components, requirements for throughput, and indicators for deeper examination as
examples of information useful to risk assessments (DoD, 2010, Sect. 6-1, p. 1-2)
Also in 2003, Ni et al. reported on their work employing software to compute risk
indices associated with a power system. Likelihood and severity are basic concepts Ni et
al. employed to quantify risk in a control room situation for potential overloads of the
power system. Their software produced three-dimensional visualizations that allowed
43
high-risk situations to be perceived at high-level viewpoints in models and provided for a
hone-in function that allowed the user to drill into the specifics of the risk sources
occurring at lower levels (Ni et al., 2003, pp. 1170-1171).
In the following year, 2004, Abdelmoez et al., having recognized the growing
importance of software architectures to software engineering, described an architectural-
level attribute called error propagation probability (p. 2) that captures, as a stochastic
characteristic, the event that errors in one architectural component of a software system
will propagate to other components. Using a command and control system as a case,
Abdelmoez et al. conducted a comparison of their analytical computations with their
empirically produced computations (experimental simulations) in which they found “a
fairly meaningful correlation” (p. 9). This result led them to conclude that an
architectural-level specification is useful for estimating error behavior in the planned
system and that future work could extend the usefulness to estimating change impact for
both solution changes and requirements changes (Abdelmoez et al., 2004, p. 9).
In addition to architectural representations, in a 2005 briefing for Ultimus, Inc.,
Barnes, then vice president of Product Management and Marketing, remarked that
models of business process (compared to the architectural components used by
Abdelmoez et al., 2004) served additional purposes by capturing human roles and
responsibilities and their interactions with software solutions. In Barnes’s scenario of
adaptive discovery, what could be construed as an error behavior is simply the occurrence
of an unforeseen, and therefore undefined, use of the IT provided by the solution. At this
stage of deployment, much could be known about the solution. Barnes’s
recommendation was to use the model as a means of capturing and propagating the event
44
and its newly formed rules, respectively, at the time of occurrence because model and
solution were integrated (p. 7). This was a differing viewpoint, in that information
systems projects were said to begin at deployment rather than at the architectural
development stage. While appropriate for many businesslike transactions, a risk
assessment would likely play a role in whether something defined as inherently an error
at a development phase proves simply to be an unforeseen event at execution time.
Determining whether an event was an error or simply unforeseen can be a
qualitative endeavor. Fenton et al. described their work with qualitative factors and
software defect prediction at a conference in 2007. This was a validation effort based in
part on previous work on the MODIST project which was named from the phrase
“Models of Uncertainty and Risk for Distributed Software Development” and devoted to
stochastic models of risk and uncertainty in software (as cited in Agena, 2004; as cited in
Fenton et al. 2007, p. 20). Fenton et al. presented validation efforts for the MODIST
models based on their collection of data from 31 software projects. The MODIST model
was rooted in a Bayesian network of these causal factors for defect insertion: design and
development, specification and documentation, scale of new functionality, testing and
rework, and existing code base (Fenton et al., 2007, p. 20). Fenton et al. prepared a
questionnaire to solicit qualitative data that were coded into ordinate scales for their
validation effort. The authors made several points about the validation. Fenton et al.
were able to accommodate variation in software project characteristics by adjusting the
description question. By capturing the conditional probability tables for Bayesian nodes
from experts, they accounted for the model’s performance from one project to the next
within the same organization. Several data collection issues required attention, such as

45
substituting lines of code counts for function point counts, size affected by reused
software modules, and use of the attributes of the Bayesian approach to handle missing
data. Fenton et al. were able to reach a “very high accuracy” (R2 of .9311) between the
predicted and actual number of defects found in independent testing (p. 9).
Flowing from the semantic likeness of predictable and prone, in 2009, Cataldo,
Mockus, Roberts, and Herbsleb examined several types of dependencies and their
usefulness in explaining failure proneness in software. As a reminder from previous
sections, testing software is a means of eliminating software failures and a means,
therefore, of removing risk from operations. It follows that sources of failure proneness
are relevant to risk discussions, even though, as in the case for Cataldo et al.’s article and
others, risk assessment is not a key word, but instead quality and metrics are recurring
themes. Cataldo et al.’s examination of dependencies was anchored to sources of error.
Cataldo el al. looked at error resulting from dependencies that can be described in further
detail. Errors could be described as originating from developers failing to recognize
dependencies, from control and data flow relationships and dependencies, from logical
coupling dependencies that are masked until exposed by a change to the dependent
components, and from developer organizational workflows in the production of software.
These sources of error are defined as “syntactical, logical, and work dependencies”
(Cataldo et al., 2009, p. 864). Cataldo et al sought to explain the relative impact due to
dependency type as a means to aid in the allocation of resources, because others had
established that dependencies are sources of error proneness. Cataldo et al. measured the
types of dependencies based on release histories. The histories included circumstances
under which components accompany one another in a release. Another circumstance
46
explored was how procedures for producing a changed component consisted of workflow
and coordination among developers accomplishing the modification. From those
measures, Cataldo et al. observed that logical dependencies are more relevant than the
syntactic variety in failure proneness. They suggested further study into the nature of
logical dependencies (Cataldo et al., 2009, p. 876). Notably, Cataldo et al. replicated
their results using data from two unrelated companies. Cataldo et al. cite the difficulty of
achieving external validity when data sources have proprietary concerns about the use of
their data. In this case, Cataldo et al. took extra measures to ensure data sources could
not be identified from characteristics of the data itself (p. 875).
Besides the reluctance attributed to proprietary concerns, other pitfalls of data
collecting in the software development arena befell NASA. In 2011, Gray, Bowes,
Davey, Sun, and Christianson examined the use of NASA’s defect data, collected in
accordance with NASA’s software development guidance and identified 17 papers using
NASA data between 2004 and 2010 (p. 97). Gray et al. listed reasons that software
defect data are difficult to obtain, including that such data can be a negative reflection on
their source. This explained, in part, the popularity of the NASA data set, since it is or
was readily available and easily consumed.
In spite of being readily used, however, Gray et al. noted that NASA data require
considerable preprocessing to be useful in modeling scenarios. Gray et al. found the need
to perform data cleansing tasks against the data set to eliminate duplicated data, keep data
that train a model separated from data that test it, correct the same data from being
classified two mutually exclusive ways, and remove noise, in general. By performing
these tasks, each of the 13 data sets showed “6 to 90 percent less of their original

47
recorded values” (Gray et al., 2011, pp. 97-99). Additionally, they noted that repeated
data affect classifier or group performance, but the impact is specific to the algorithm
used. Naïve Bayes classifiers are resilient to such duplication (Gray et al., 2011, p. 102).
From the field of project management, though narrowed to software projects, V.
Holzmann and Spiegler (2011) applied a general methodology of risk identification and
management to an IT organization. V. Holzmann and Spiegler proposed developing a
risk breakdown structure (RBS) using a bottom-up strategy rather than adopting an
existing taxonomy from others’ research (V. Holzmann & Spiegler, 2011). Through this
method, the IT organization would be able to capitalize on its experiences and form a risk
approach tailored to its circumstance. The object from their viewpoint was the IT project,
rather than any particular software component. Projects initiate software products, and a
successful project includes objectives related to software products. V. Holzmann and
Spiegler included summaries of several project management risk approaches related to
both generic and IT applications. Those included (a) Project Management Institute’s
body of knowledge; (b) Software Engineering Institute’s software risk evaluation for
projects; (c) Boehm’s risk assessment and control approach; (d) approaches organized by
phases, levels, budget and schedule, and project life cycle; and (e) those stemming from
use of an RBS (V. Holzmann & Spiegler, 2011, pp. 538-540).
The definition of an RBS was as follows: “The RBS is a hierarchical structure that
represents the overall project and organizational risk factors and events organized by
group and category” (V. Holzmann & Spiegler, 2011, p. 539). They described various
ready-made structures from a generic perspective and from the source industry (e.g., IT,
construction, and engineering). Of note for IT projects was the Software Engineering
48
Institute’s Software Risk Evaluation’s Taxonomy-Based Questionnaire (Carr et al., 1993;
R. C. Williams, Pendelios, & Behrens, 1999).
Although, a meta-analysis of IT projects that employed risk management yielded
results that were inconclusive, many other studies across industries have revealed a
positive effect when employing risk management (V. Holzmann & Spiegler, 2011, p.
538). Specifically, V. Holzmann and Spiegler performed an analysis of an IT
organization’s lessons-learned documents and constructed an RBS using content analysis
and clustering. The results were affirmed by the organizations’ management and project
leadership through interviews and open forum. The management also viewed the method
itself as preferable to scenario and possibility generation because it used available data.
V. Holzmann and Spiegler also noted compatibility between their resulting risk
dimensions and other studies, as well as the suitability of the RBS as a foundation for
mitigation activities (p. 544).
In 2012 project viewpoint met architecture viewpoint in another treatment of risk.
Bernard (2012) presented risk treated from several perspectives in his enterprise
architecture text that distinguished implementation risk as a characteristic of project
management. In the discussion of implementation risk, Bernard connected
implementation risk to the involvement of stakeholders with increased risk following the
lack of such involvement “in all aspects of project development” (p. 217). Risk in this
respect is something controlled at the project level. Another view of risk is the
architectural effect of threat considerations such that a thread of security and privacy
attributes are integrated throughout the enterprise architecture, which is a higher order
49
architecture than an architecture restricted to the scope of software components (Bernard,
2012, p. 221).
Of interest to the environment of this paper (USAF, military, and public
administration) is Bernard’s (2012) linking of enterprise architecture frameworks to
organizational theory and systems theory. Bernard charted influences from the various
subfields of organizational theory and systems theory (and their concepts) to fields and
concepts encompassed by enterprise architecture. In this way, Bernard accounted for the
derivation of enterprise architecture components from concepts such as Leavitt’s (1965)
juxtaposition of people, structure, tasks, and technology; the Parsons/Thompson (cited in
Bernard, 2012, p.54) model of institutional, managerial, and technical levels; and
Bernard’s variation of an organizational network model accounting for the less
hierarchical themes, lines of business, and largely autonomous units implementing
executive direction (pp. 55-57). Similarly, from systems theory, the concept of risk and
the fields of computer science and operations research are mentioned. However, risk was
associated with uncertainty and subjective exercises for project management and threats
to security and privacy exercises throughout, without diving into specific uses of model
types for simulation or mathematical modeling.
Further, Bernard (2012) made assertions about the use of enterprise architecture in
the U.S. military in his treatment of future trends. He observed the increasing
dependence on information in supporting and performing missions and the broader use of
DoDAF standards in capturing data about IT resources. Bernard mentioned the pursuit of
consolidation of IT capability for efficiency’s sake, achieved through the revelations that
DoDAF models lay plain about duplication of effort as a source of risk. The risk

50
introduced stems from creating single points of failure and the increased exposure to risk
created by more use of the consolidated IT. Bernard recommended that enterprise
architecture professionals “promote a risk adjusted level of interoperability and functional
duplication, and the subsequent cost inefficiency be viewed as acceptable to reduce IT
vulnerabilities” (p. 262).
While efficiency is generally considered a quality attribute, in a 2013 review of
software product quality intuitively related to risk, Wagner generalized about quality
models applicable to the control of quality attributes of software (Wagner, 2013b).
Wagner promoted a continuous approach to quality control, improved and evolved over
time for relevance and effectiveness. In the examination of quality models, a key phrase
from ISO/IEC 25010 surfaced: “Freedom From Risk” (Wagner, 2013b, p. 16). Wagner
(2013b) provided a critique of quality models in which those models of a taxonomic
nature were difficult to decompose into specific definitions and were subject to semantic
disagreements. Models that relied heavily on measures were noted as deficient in their
ability to impart an impact on software quality. Predictive models were critiqued for the
difficulties posed in interpreting equations, dependencies on context, and collection and
agreement on data. Although risk occurred in his discussions, specific interpretations
were limited to the by-products of other discussions, which were mainly the identification
of negative quality factors or test selection concerns (Wagner, 2013b, pp. 40-42, 63, 97,
136, 139, 141, 142, 148, 172).
Wagner (2013b) differentiated a view of software product quality from that of
software process quality (see the Process Improvement Models section above). Wagner
identified approaches such as Capability Maturity Model Integration and ISO 9000 as
51
being process related, associated with additional bureaucratic burdens, and based on the
assumption that “good processes produce good software,” without characterization of the
product itself (Wagner, 2013b, pp. 8-9).
In another work, Wagner (2013a) asked how comprehensive a model must be for
it to be effective (e.g., what depth in quality characteristics is needed for a model to be
useful). Wagner looked for improvement of models over random guessing and found that
a model with as few as 10 measures was 61% accurate and that the presence of expert-
based measures such as an assigned ranking degraded performance by approximately
15% (Wagner, 2013a, pp. 23, 26).
Also in 2013 and with small scale as in Wagner (2013a), Tasse looked at
classifiers for the type of change to a file of code as a short-term predictor of propensity
to defects using the analogy that if two files of code are subject to the same kinds of
changes and, in the past, one of them turned up buggy, the other one would, too. Tasse
concluded that the approach tested performed better than comparisons to data-mining
approaches such as naïve Bayes, BayesNet, and others (pp. 17, 20).
Fenton and Neil compiled a text published in 2013 on the assessment of risk and
the accompanying decision making that captured their work performing the task with
Bayesian networks. The authors provided the components of a Bayesian network in a
definition that included a graphic depiction of dependencies between variables, where
each variable has probability associated with it. The directed graph of nodes and arcs is
not allowed arcs that would cause circular reasoning (an arc cannot reverse course to a
previous node), and each node has a table of probabilities given its parent nodes (Fenton
& Neil, 2013, p. 141). Fenton and Neil addressed the prediction of software defects
52
under the general modeling subject of systems reliability. Fenton and Neil noted
appropriateness for software organizations that have well defined testing phases and data
collection, have expertise for organizational and project-specific probability tables, have
supplemental appreciation for the extensiveness of factors that cannot be well
represented, and appreciate the strength in simplicity of the causal model (Fenton & Neil,
2013, p. 404).
Also in 2013, Walkinshaw added to Fenton and others’ work by offering an
alternative to Bayesian networks as a means of aggregating knowledge (or lack thereof)
about software and making assessments about software quality. Walkinshaw’s
improvements included ways to account for unknowns literally, as opposed to probably,
such that unknowns have labeled representation in the overview of the assessment. The
method also allowed for the sum of probability in a factor to be less than 1 as a way of
capturing profound lack of knowledge for a factor. Additionally, the approach is
adaptable to the myriad of quality frameworks that are available or could be assembled in
the future. Walkinshaw charted the course from software characteristic models to
multiattribute decision analysis to Dempster-Schaefer theory to evidential reasoning to
belief functions for the purpose of constructing algorithms that work the characteristics
and beliefs about a piece of software from the bottom up to an aggregate quality, see his
example case, “Maintainability” (Walkinshaw, 2013, pp. 1-8). Dependencies appear to
have a smaller role and not the same rigor as Fenton’s system reliability approach.
In other algorithm work, Treleaven, Galas, and Lalchand (2013) described an
approach to testing software that combines the need to train models and test software.
They described the use of test data sets in ways that are suitable to both the models and

53
the software implementation incorporating many mathematical models with synthesized
execution. The functional domain for these applications is stock market trading systems,
specifically known as algorithmic trading (Treleaven et al., 2013, p. 76).
There are several overarching topics contained in Treleaven et al.’s (2013) article,
taken in the general context of software risk assessment. One such topic was the
pinpointing of risk from an operational perspective, which was not risk posed by a system
but risk to the success of the mission. Other important topics were the importance and
sensitivity to data selection and quality, as well as the testing method applied in the
highly complex environment.
Treleaven et al. (2013) described the underlying parameters and concerns in the
risk approach that illustrated the areas of operations, data selection, and environment
complexity. A risk reward ratio resulted from the effort to limit size or amount of risk
and to limit types of risks. Thresholds applied to the value at risk triggered actions based
on a rule set. Quality data used in calculations is difficult to acquire and the sensitivity of
outcomes to poor data are acknowledged to be paramount. The testing method, known as
back-testing, combines the needs to train models (algorithms) and test software. The
system is subjected to historical data to reveal how it would have performed under
historical conditions. Two phases characterize the approach. The phase devoted to
optimize model selection, known as in-sample strategy performance, is measured by the
Sharpe ratio. The Sharpe ratio is maximized as it portrays the best trade-off between the
performance (reward) and the risk. The Sharpe ratio then leads to the selection of
strategy for the out-of-sample test phase. Treleaven et al. pointed out that the tests say
nothing of the predicted performance of the system of models (pp. 84-85).
54
It is beneficial to return to a project management viewpoint to consider the
overarching theme of risk assessment. Irizar and Wynn (2013), both IT experts, wrote
about risk epistemologies in the context of project management. For their purposes, risk
had an interpretation as “objective fact” and “subjective construct” (Irizar & Wynn, 2013,
p. 135). The objective fact view of risk alluded to its probabilistic occurrence, whereas
the subjective construct view allowed for additional dimensions, such as experience,
organization, and culture. Those authors proposed that using subjective constructs can
improve the practice of risk management by improving communication between project
managers and stakeholders. Irizar and Wynn researched the degree to which the ideas of
subjective construct already appeared in the literature and how they also appeared in risk
registers. This research supported that the reflection of subjective constructs of risk can
be improved to enhance project successes (Irizar & Wynn, 2013, p. 140).
While Irizar and Wynn (2013) branched from IT to project management, Misirli
and Bener (2014) borrowed from other fields to find application in IT. Misirli and Bener
(2014) reported on the use of Bayesian networks in software engineering decision
making. Misirli and Bener begin with the premise that using Bayesian networks provides
several advantages to decision makers in general and noted specific use in other fields
had also been rewarding. Computational biology and health care are two fields
researched. The advantages Misirli and Bener summarized were as follows:
• Bayesian networks aggregate decision factors into a single model and capture
the supporting data for use over time. Supporting data may include collections
of observations, distributions of historical data, changes in assumptions, and
the influence of expert judgment.
55
• Bayesian networks capture causal information useful in prediction.
• Bayesian networks allow for simulation runs that accommodate hypothetical
changes to factors for seeking optimization.
• Bayesian networks supplement the human ability to reason by extending the
thought process with otherwise humanly incomprehensible amounts of
historical data (p. 533).
Misirli and Bener (2014) also carried out a systematic review of Bayesian
network use in software engineering. By composing three models each for two software
development establishments and evaluating each model’s potential usefulness, they found
that characteristics of the software development establishment could be accounted for and
impacted building a Bayesian network specific to the probability of defects surfacing in
software after release. In the process of composing the six models, Misirli and Bener
employed various methods as suggested by the software engineering community, health
care industry, and biology studies, as well as generalized modeling methods and
techniques.
Misirli and Bener observed: (a) 72% of the published uses of Bayesian networks
in the software engineering field between 1998 and 2012 were to predict quality, with use
in testing and building software increasing over the same period, (b) over half of the
studies primarily employed expert knowledge and a quarter employed software
development artifacts (e.g., architectural depictions), (c) authors were weak in their
details about the inference mechanisms used to build their models with expert knowledge
and existing tools paired in 27.35% of works, (d) categorical variables (assignment of a
value to a labeled group) are popular in that experts find it easier to associate

56
probabilities with categories and they were aware of existing tools that employed the
approach (Misirli & Bener, 2014, pp. 537-540). Their recommendations to software
engineering professionals, after comparing the results of models built for two software
development establishments, were (a) that a hybrid approach is warranted to leverage a
situation, internal and external data on hand, and expertise because they observed
performance improvements by decreasing reliance on expertise and (b) that researchers
should improve their underlying knowledge of Bayesian network construction to select
and justify means of populating model dependencies (structure) and model node
characteristics (parameters such as distributions; Misirli & Bener, 2014, p. 549). Misirli
and Bener explored and addressed possible threats to the validity of their work, such as
bias in data collection through questionnaires (p. 551).
Among Misirli and Bener’s (2014) techniques for identifying dependency was
using a chi-plot as described by Fisher and Switzer (2001). The chi-plot offers
improvement over a scatter diagram in distinguishing patterns of relationships between
variables. The chi-plot diagrams provide visible distinctions when two variables are
independent, dependent in some degree either positively or negatively, or have a complex
relationship. Fisher and Switzer provided an extensive set of reference diagrams to
support the usability of the technique.
To build upon this work, Moreno and Neville (2013) proposed a statistical
hypothesis-testing approach to comparing networks. Moreno and Neville looked for
methods to answer the following question: Given two networks, is the difference between
them statistically significant? Moreno and Neville used observed networks to test
hypotheses about the underlying system. A mixed Kronecker product graph model and

57
threshold statistic was employed to determine whether networks were from the same
distribution or to distinguish them as being from different distributions (Moreno &
Neville, 2013, p. 1163). They also compared methods and concluded that the mixed
Kronecker product graph model approach employed performed well under circumstances
“where only a few networks are available for learning a model of ‘normal’ behavior”
(Moreno & Neville, 2013, p. 1168).
Other types of networks have also been evaluated for similar and additional
reasons. Wahono, Herman, and Ahmad (2014) cited cost as a driver in pursuing defect
prediction because identifying and correcting defective code is expensive, and the
common use of human review and testing is a poor method for finding defects. Wahono
et al. reviewed the shortcomings and strengths of neural networks as a means of
prediction for the presence or absence of software defects. Although neural networks are
viewed as strong in fault tolerance and the handling of nonlinear situations of software
defect data, the methods of constructing the neural network architecture introduce
difficulty in optimizing models. Another peculiarity to software cited is data-set
imbalance that leads to an overly frequent prediction that a unit is not defect prone, which
affects reliability. Wahono et al. proposed making improvements to the construction of
the neural network via genetic algorithms and balancing the issue with data sets via a
“bagging technique” (p. 1952).
Wahono et al. (2014) also noted that although the track record for prediction with
neural networks that are architected with genetic algorithms has variety in application, an
investigation into their use in software defects revealed little. Wahono et al. did find the
imbalance issue had been addressed in software defect scenarios. Generally, they found

58
imbalance is addressed with variations on sampling. Wahono et al.’s proposed method
combines a genetic algorithm for choosing the best neural network parameters and
bagging to address imbalance in data sets, which was a combination they had not found
in use with software defect prediction (p. 1952). In an experiment, Wahono et al. used
NASA data sets divided into 10 equal parts for training purposes and measured them
using the “area under curve” for accuracy (p. 1954). The basic neural net model
performed with mixed results and improved with statistical significance after adding
methods for genetic algorithms and bagging (Wahono et al., 2014, pp. 1954-1955).
Shepperd, Bowes, and Hall (2014) found that the main factor for explaining the
performance of software defect proneness models was the researcher group at 31% (p.
612). Although their expectation was that most variability would be explained by
researchers’ choice of prediction method, the results indicated that method choice had the
least explanatory value of the factors considered (p. 612). The research involved several
steps: (a) the selection of studies based primarily on the prediction of software as either
defective or not defective; (b) a meta-analysis of the 42 selected studies containing 600
empirical reports; (c) calculation of the Matthews correlation coefficient, a common
measure of performance chosen for its comprehensive treatment of the confusion matrix;
and (d) a meta-analysis that involved testing four factor types using analysis of variance
procedures. The four factor types were membership relationships of researchers; chosen
data sets for modeling; measures of system characteristics used; and classifier family,
which is the methodology for prediction (Shepperd et al., 2014, p. 610).
Researcher group as a factor in variability of models was taken a step further
toward individuals in Mockus (2014). In a briefing to professionals in predictive
59
modeling for software engineering, Mockus noted the drawbacks of using statistical
methods with the data available to many software engineers, offered advice, and revisited
usefulness. The drawbacks include an examination of data quality, shortfalls in defect
modeling in general, and the role of individuals harboring a perhaps illogical fascination
with defects at the expense of other risk factors. At issue with data quality is that data
sources for software engineering are not up to the standard of rigor associated with
experiment data that are carefully designed and measured. Software engineers typically
have operational observation instead, which is likely highly variable from one instance to
the next.
Further, Mockus (2014) described three primary areas of concern with the status
of defect prediction: context, absence, and inaccuracy (p. 7). Mockus noted that the
context of the software is often unaccounted for with respect to key characteristics, such
as duplication in user reporting, stability in releases, overall use frequency of software,
and idiosyncrasy related to software project domains. With respect to absence of defects,
he noted a paradox in that defects cannot all be uncovered; however, the more defects
people find, the better the situation to improve the quality of the software; and defects
uncovered through code analysis do not correspond or match to those reported by users of
the software (p.7). Mockus further noted the inaccuracy related to the fact that what
developers count is actually fixes to defects because total defects are never known. From
there, Mockus noted that not every fix is truly a fix, but instead could be fixing a defect
other than the one reported, or the fix may introduce other defects. An additional
problem with defects is that defects are not consistent as a unit of measure. Defects vary
in their impact. Mockus has worked with others regarding the measure of a defect’s

60
impact (Shibab, Mockus, Kamei, Adams, & Hassan, 2011). Mockus asked if the
criticisms of attempting prediction add up to make further pursuit an “irrational behavior”
(p. 11), since their track record for performance is easily impugned. Mockus proposed
that the answer lay in risk assessment, cost–benefit analysis, and historical understanding,
with a shift toward more informed decision making rather than accurate or air-tight
prediction. In the decision-making realm, Mockus related common engineering decisions
about resources to the ability to understand or predict defects. Of common concern was
choosing ways to prevent, find and eliminate, and predict defects. In the prediction
department, Mockus suggested three useful applications: (a) “When to stop testing and
release,” (b) where in code will defects surface, and (c) what is the impact to the
customer (p. 5). Mockus created a scenario describing which software-use domains can
employ the information to their advantage, thereby justifying the effort to understand
defects. For example, IT managers in different industries appreciate defects in different
ways. Managers of medical and safety applications are likely to benefit from
understanding the impact of inoperable software. Communications managers are likely
to benefit from understanding costs to prevent defects. Operators of large-scale
electronics applications are likely to benefit from understanding costs to repair defects
(Mockus, 2014, p. 30). Of note is how these parameters coincide with general risk
management inputs.
Software project domains could include those related to so-called legacy systems.
For an application of grounded theory as a research design, see Khadki, Batlajery, Saeidi,
Jansen, and Hage (2014). The study explored a particular domain of software
engineering to determine the perceptions of its professionals and explained use of

61
grounded theory for its strength in uncovering “new perspectives and insights” (p. 37) in
contrast to methods of a confirming nature. The authors were particularly interested in
the common perception that legacy systems are both obsolete and invaluable to an
organization in performing its operations. Khadki et al. wondered if practitioners shared
the same viewpoint as academia and used as a definition for legacy system a software
system that is resistant to change and critical to operations, such that its failure would
have serious impact (p. 37). Khadki et al. tracked this definition to two IEEE articles on
the subject (Bennett, 1995; Bisbal, Lawless, Wu, & Grimson, 1999). Khadki et al. had
various sources that recorded the efficacy and benefit of modernization projects for these
systems and provided sources for figures stating that as many as 200 billion lines of
legacy code, much of it COBOL, remain useful (pp. 36, 38).
In the course of research, Khadki et al. (2014) interviewed professionals from
government and various types of business and industry on the nature of reliance on
legacy software. The interviewees with experience in legacy modernization projects
identified 11 industry domains: IT services, financial services, government, software
development, consulting, aviation, manpower (security), flower auction, food and dairy,
machinery production, and poultry. The topic of risk and fears surfaces in the interviews
conducted. The risks and fears mentioned included those related to the diminishing
availability of expertise, system failures related to lack of support, modernization project
risks (data migration problems, schedule slips, poor documentation quality, unrealized
return on investment), and organizational discord from technical staff whose professional
strengths are threatened by a modernization project (Khadki et al., 2014). Among the
authors’ conclusions is that while academia regard legacy systems as quagmires and use

62
the risks and fears associated with them as reason to undertake modernization efforts,
practitioners have a differing view on this point. Practitioners tend to view the long-lived
system as a cash cow for its business value, despite issues (p. 43). Khadki et al.
acknowledged authors whose approaches to modernization projects address risk, such as
Seacord, Plakosh, and Lewis (2003) and Sneed (1999). They suggested further research
by academia related to the perception of the quagmire of risks that legacy systems pose.
Perception and understanding motivated the StackExchange (2013) which
provides an online question and answer forum titled “Cross Validated” for the education
and practice of various methods such as those employed by individuals seeking to predict
or otherwise understand occurrence of defects. In a question and answer session
comparing machine learning as a genre to statistical modeling (the site has an internal
scoring system for reputation and usefulness that aids mediation of quality), various
authors provided their perspective on the development of modeling disciplines over a
time span of approximately thirteen years. This particular post included references to
other developing methods, such as data mining, in an attempt to differentiate the
motivations and placement of significance by the groups of scholars and practitioners.
For example, machine learners are distinguished by their emphasis on predictive accuracy
and statisticians by their emphasis on underlying behavior, as well as differences in
preferences for methods of evaluating those qualities (StackExchange, 2013). The thread
of questioning leads to a reconciliation of sorts calling for differing approaches to reflect
on the ways each can improve the body of knowledge by examining the others’ strengths
and weaknesses.
63
From discussions of the predictive methods, above, back to software defects as a
source of risk, G. Holzmann (2014) revisited the use of mathematics in making software
reliable, which he traced back to Dijkstra in 1973. Dijkstra’s article appeared in
American Mathematical Monthly the following year (Dijkstra, 1974). Dijkstra proposed
developing a program and its proof jointly, which falls prey to doubts that programmers
can master the mathematical skill necessary and that a large-scale proof could be
constructed for a large-scale program. G. Holzmann catalogued verification methods that
are now automated in answer to the scale issue, but the question of what the software
should do remains. An incomplete or incorrect answer for what software should be doing
results in verification that is less useful because the result is accepting an incorrect
program. A software specification documents what software should be doing and
verification can be performed with a mathematical discipline or other discipline, but
verification accepting a program written to an incorrect specification is a poor outcome.
G. Holzmann explored the challenge of programming to deal with errors to promote
software’s reliability. From a testing viewpoint, anticipating error circumstances dealt by
reality was previously noted as challenging (Armour, 2005). G. Holzmann used as an
example the Mars Global Surveyor spacecraft, which after “an unexpected combination
of low-probability events” (p. 18) became inoperable and was lost. G. Holzmann
introduced the perspective of “fault intolerance” (p. 19) in recognition of the potential
combination of small risks equating to a large failure. This defensive posture leads
programmers to investigate any possible source of future inconsistency, even though, for
example, a common compiler warning may logically seem immaterial to the
circumstance at the time of coding. Later, its existence could interact with reality in
64
unanticipated ways; intolerance of small issues is proposed to combat those occurrences.
Redundancy is useful as well, because added code can be used to double check assertions
that would otherwise be assumed during execution in the same way back-up hardware
improves the overall reliability of a mechanical device (G. Holzmann, 2014, p. 20).
In the case of the Heartbleed vulnerability, a seemingly low-probability risk
source, it appears that economics may have interfered with the adequate performance of
risk assessment. Heartbleed was nationally reported in April 2014 as a serious flaw in a
software solution called OpenSSL that affected up to 66% of web servers connected to
the Internet, many of which performed services using personal financial data (Kelly,
2014). The flaw allowed those accessing web sites with the prefix https:// of the
OpenSSL solution, which is an additional layer of security over the prefix http://, to be
vulnerable to having their user security information compromised. In the case of
financial transactions, users’ personal access information could be captured by those with
criminal intent. In a follow-up to the discovery of the vulnerability, Kamp (2014) offered
an explanation in “Quality Software Costs Money: Heartbleed Was Free.” His succinct
title references the genre of software production known as Free and Open Source
Software (FOSS). In this model for software development and use, the software is free to
users, the code itself is openly shared, and maintenance is donation dependent. Kamp
described his personal experience in this regard as a contributing programmer to two
other FOSS projects, which was an economics lesson in how to fund a concept such as
FOSS. The article described the FOSS foundations, such as the Apache Foundation, and
the emergence of crowd-sourcing as a method. In the effort to explain the specific
occurrence of the Heartbleed vulnerability in OpenSSL, the author noted that the $2,000

65
in annual donations that the OpenSSL Foundation received to maintain the software
would not cover much effort. A consequence of the bug surfacing included a flood of
dollars, as organizations realized they were impacted and subsequently donated.
However, Kamp noted that FOSS is underfunded, and plenty of open source software is
in use (p. 50). Later reports reported the time lapse between the announcement of the
Heartbleed vulnerability and the onslaught of attackers exploiting it for nefarious
purposes was 4 hours (Weise, 2015).
Weise (2015) who reported that hackers are organizing (i.e., they are no longer
individuals motivated by ego) also elaborated on the activities of hackers with figures
from Symantec’s 2015 Internet threat report that indicated hackers pulled off 312
breaches, which represented a 23% increase from 2013 to 2014 (Symantec, 2015, p. 78).
Symantec additionally reported that one out of every 965 e-mails is a phishing attack
designed to trick recipients into allowing malware to infect their computer (p. 12).
Ransomware attacks in which cyber thieves lock up victims’ computers and hold data for
ransom, and in which paying off then makes victims a good future target, doubled from
4.1 million in 2013 to 8.8 million in 2014 (p. 17).
Relevant Public Administration Theory
The following sections review contributions in the areas of decision making,
implementation, policy development, risk assessment, accountability, and chronological
coverage for completeness that includes research design viewpoints, relevant U.S.
Government Accountability Office reporting, and DoD influences.
Decision making. M. D. Cohen, March, and Olsen (1972) provided the garbage
can theory of decision making that is observable in cases of public organizations
66
describing a decision making logic in which goals and technology are unclear and
participants are transient. The description of an organizational situation in which goals
and technology are unclear and participants are transient appears to have much in
common with software development projects. March’s later work with Cyert included an
epilogue addressing the series of developments in the literature in the time frame
following the original edition (Cyert & March, 1992). Although the original article’s
central ideas of bounded rationality, organizational adaptation, and conflicting interests
address the problem of decisions, Cyert and March (1992) included extensions by way of
economic theory that include reference to Bayesian estimation (pp. 216-217). Attention
mosaics key on the divided attention of participants and on the linkages among solutions,
participants, and situations and their arrival rates, sequences, and temporal characteristics.
From that discussion came the following quote: “At the limit, almost any solution can be
associated with almost any problem—provided they are contemporaries” (Cyert &
March, 1992, p. 235). Recognizing these qualities in administrative settings for software
development is elucidating. Likewise, these works are useful in predicting an
organization’s general ability to make choices in the dynamics of the particular situation
a software release presents. However, use in a specific scenario would require an
information bridge as an underpinning in facing any particular software choice and
adjudicating its risks.
Other decision-making theorists contribute frameworks that are useful in
explaining software dilemmas and perhaps their outcomes, but when considered purely in
stand-alone analyses, they appear to leave a gap in suggesting decision methods or
approaches to specific risk and trade-off assessments. Decisions then happen in the
67
passive voice, such that decision making is better nomenclature than decide. At the same
time, lining up applicable public administration theories to software release processes is
conceptually simplistic so much so that it is a daunting task to make a case for labeling
any public administration literature as irrelevant to the development and implementation
of software. This is particularly true for decision making, which can be bounded
somewhat by its intersections with the development, testing, and fielding aspects of
systems’ life cycles. Decisions happen during development as software products are
chosen to be built, during testing as quality and value are reasoned, and during fielding as
accepting the automation falls to consumers.
The remainder of this subsection on decision making connects the topic to Allison
and Zelikow’s (1999) framework, Lindblom’s (1959, 1979) muddling, and Simon’s
(1997) satisficing, to name a few. The choice of these influences reflects their ready
comparison to later developments in software engineering practice, that are also covered.
Allison and Zelikow’s (1999) framework refers specifically to their work in
analyzing the events and decisions of the Cuban Missile Crisis using the lenses of rational
actor, organizational behavior, and governmental politics (pp. 13, 143, 255). Each of the
three viewpoints are distinguishable and collide in software programs. Engineers, in their
leadership role as Lead Engineer or Chief Engineer, are often the rational actor, as
rationality is in the nature of the engineering discipline. Program administrators
represent organizational behavior through their responsibilities of compliance with
guidelines and procedures. Program managers, mission owners, and acquisition leaders
are drawn into bargaining over requirements and budget control that characterize
governmental politics. These are the players in designing release procedures, making
68
release decisions, and setting policy. Rational and comprehensive approaches, as
described by Lasswell (1965) and discounted by Lindblom’s root discussion to problem
solving and decision making, are natural to engineers, especially when designing a bridge
to cross a river, but not necessarily in software disciplines. Waterfall approaches to
software development have a kinship with Lasswell’s seven decision-making phases.
However, Lindblom’s “Muddling Through” was prophetic (Lindblom, 1959, 1979) to a
much later development in software engineering circles that first gained attention as
spiral development and prototyping with Boehm’s (1988) work. Although Lindblom first
acknowledged incrementalism as a possibly legitimate way to make choices in an
organizational setting, software engineers did not begin exploring the idea in writing and
applying the idea to building, testing, and fielding software until 29 years later.
Simon’s (1997) satisficing (p. 119) which traces to earlier editions of his work,
likewise has an example in software engineering. Using Simon’s earlier work date of
1947 (p. vii), 54 years later marked the arrival of the Agile Manifesto in 2001, in which
repeated deliveries of software that simply works are good enough to sustain progress
(Beck, 2001, p. 2). Etzioni’s (1967) mixed scanning combined aspects from both rational
and incremental decision making to account for the cost of potentially missing
information that may later prove to have been crucial and to provide for ongoing
evaluation of conditions after the decision is made.
It may not be entirely fair to calculate how long it took for software development
to apply decision making theories, because software wasn’t much to think about as far
back as 1947. But with the advent of software development coming after much had been
69
discussed about rational and comprehensive approaches in comparison to
incrementalism; it is reasonable to contemplate.
Implementation. Carrying out policies in practice through program
implementation intersects with software development concerns through repeatability, test
methods, and rollout strategies. Of particular note for this study was the performance of
activities in which interactions among organizations include cooperation with external
organizations and where policy implementation comes with a keen sense of desired
benefit. With that in mind, two works in the genre of policy implementation provide
insight.
The first work was that of Pressman and Wildavsky (1984), which has expanded
to several editions, that to some degree soothes professionals who have faced an
implementation nightmare. The palliative explanation can be extended to many software
professionals. An example is the story behind the USAF’s Expeditionary Combat
Support System, widely reported in 2012 as a pile of software waste that cost taxpayers
$1.1 billion (“$1 Billion Wasted,” 2013; Kanaracus, 2012, p. 1; Shalal-Esa, 2012, p. 1).
In this case commercial software was evaluated to be a suitable solution, but in the
implementation phase the solution failed. To tease apart that which pertains to evaluation
and that which pertains to implementation, as Pressman and Wildavsky discussed,
generically comes in contact with software testing and rollout, because testing is
evaluative and rollout pertains to the actual deployment and fielding of software, an
implementation aspect. Pressman and Wildavsky looked at the advantages and
disadvantages of separating the functions (pp. 201-205) and concluded: “The conceptual
distinction between evaluation and implementation is important to maintain, however

70
much the two overlap in practice, because they protect against the absorption of analysis
into action to the detriment of both” (p. 205). This thought, in combination with the
interorganizational qualities of software development in public administration (e.g.,
testing organizations are independent of developing organizations, which are independent
from mission organizations), results in an implementation environment similar to those
described by O’Toole and Montjoy (1984), yet each type of interdependence occurs
simultaneously and potentially confounds the theory’s use as a predictor (pp. 493, 495).
Policy. In an effort to control and instill accountability, the DoD has a broad
array of policies, procedures, guidelines, instructions, memorandums that are specific to
technology development and too numerous to contemplate. Policies have evolved to
cover the establishment of technology programs, to ensure quality technology products,
and to address time frames of accountability. However, one particular acquisition policy
is a staple to software development, which is “Operation of the Defense Acquisition
System” (DoDI 5000.02, 2008). In this policy, systems are treated broadly and include
the overlap of weapons systems and information systems. This means that weapons
systems, such as aircraft, and information systems, such as software for business needs,
are within scope and jurisdiction, with 2.5 of the 80 pages devoted to distinctions for IT.
This has been challenging for IT programs because administrators must often translate
language intended to guide aircraft manufacturing into language that can be applied to
software development. Recent legislation known as the Federal IT Acquisition Reform
Act was passed in 2014, in part to address the challenges and now requires
implementation. Among the provisions are centralized accountability at agencies’ chief
information office level (Moore, 2014).
71
Risk assessment. The blending of viewpoints between administrative concerns
and software systems concerns has a considerable foundation. For example, Perrow
(1984), Short (1984), Douglas (as cited in Short, 1984), Constantine (2001), and Yourdon
(as cited in Page-Jones, 1988) provided points of intersection. Perrow concentrated his
treatment of risk on “properties of systems themselves” (p. 62) as a means of exposing
the underlying factors common to systems that explain why one system might be more or
less susceptible to an accident. Short took a sociological approach to understanding
perceptions of risk, which is important to human open-mindedness as players in risk-
exposing and risk-inducing processes. Short then integrated research from cognitive
science, behavioral decision theory, and organizational decision theory to note how
human limitations influence risk perception and acceptance (pp. 718-719). Constantine
and Yourdon provided basic engineering definitions of coupling and cohesion (as cited in
Page-Jones, 1988, pp. 57-102) in now classic discussions in software design pivotal to
understanding the software quality of relatedness in execution. Douglas called engineers
to task for failing to consider that an approach to risk, while fact-based and convincing to
those of similar training, can be improved upon in responsiveness by considering, for
example, cognitive psychology (as cited in Short, 1984, p. 718).
The connection between Perrow’s (1984) sources of risk that produce failures in
the broadest sense of systems and qualities of software that become subjects of risk
assessments is not necessarily intuitive. Software interdependencies captured in the
notions of coupling and cohesion are connected to the breakout of complexity and
coupling that led Perrow to his quadrant chart that illustrated combinations of tight and
loose coupling with linear and complex interactions. He used the combinations to

72
describe examples of systems and their propensity toward accidents (e.g., placement of a
chemical plant occurs in the complex interactions, tight coupling quadrant; p. 97).
Seacord et al. (2003) provided an example illustration of similar qualities in software
when documenting a retail supply software system known to the researcher as being a
military logistics system. The diagram is dramatic and quite literal in its representation
of the relationships in the software code shown with lines and boxes (Seacord et al.,
2003, p. 256). A software programmer would not be blamed for running away from this
software, and yet this software remains in operation. This brings about a point of
deficiency in how administrators represent risk assessments to management for action in
software development and release. The risks associated with a chemical plant and
bringing it into production are not on par with those of supply software systems, although
one could have an amusing argument with the comparison. Perrow distinguished an
incident from an accident to clarify such cases: an incident entails damage to lower levels
of a system’s units or subsystems and an accident is the complete failure of the system
having escalated from multiple unit or subsystem failures that interacted in unanticipated
ways (pp.70-71). A need arises to illustrate the propensity to incident or accident brought
about by the employment of software. Perrow’s work emerged as a necessity in pursuit
of such an illustration.
Accountability. Two examples are provided here of the accountability
expectation with respect to the development of software in the government. The two
examples relate to the continuation of investment under a poor performance situation and
recommendations for accountability in defense financial and business management
systems.

73
The GAO (2004b) impugned the DoD’s ability to control inventory using its
current set of software systems and its likelihood of improving the situation with the
active investments in future such systems. The investment dollars at stake are presented
as the DoD-requested amount of $19 billion in 2004 to care for 2,274 business systems
(GAO, 2004b). The report indicated that DoD’s compliance with legislation requiring a
review of system improvement projects was lacking, in that $479 million in spending for
projects over $1 million was not vetted by the DoD comptroller (GAO, 2004b).
Additionally, two cited projects were experiencing serious delivery delays, cost overruns,
and capability deficiencies. These two projects were said to “only marginally improve
DoD business operations” and to potentially hamper DoD objectives. The GAO
explanation included process problems in requirements and testing (GAO, 2004b).
In an additional report, the GAO (2004a) acknowledged the challenge of
attempting an overhaul of its financial and business systems and asserted, “DoD is one of
the largest and most complex organizations in the world” (p. 2). Another statement
indicated, “The department has acknowledged that it confronts decades-old problems
deeply grounded in the bureaucratic history and operating practices of a complex,
multifaceted organization” (GAO, 2004a, p. 11). The GAO also reported that Secretary
Rumsfeld had estimated that improvements to these systems could save 5% annually, if
successful. GAO’s estimate of 1 year’s savings was $22 billion (GAO, 2004a, p. 2). A
project from this domain mentioned in a previous section was ultimately cancelled in
2012, after significant time and money had been spent (“$1 Billion Wasted,” 2013).
Chronological coverage of environmental influences. This section is organized
approximately by date. In exceptions for readability, some subjects are grouped by date

74
leading to some entries being inserted at earlier points in time. The overarching
chronology casts a broad net on topics influencing the environment in which the RALOT
process is carried out. Shankland (2012) covered the history of an influential
prognostication in technology that dated to 1965 and is still widely viewed as relevant.
One of Intel’s founders, Gordon Moore (Shankland, 2012), posited that chip
improvements (for example, electronics technologies that increase processing speed and
reduce physical size, reduce power requirements, and decrease heat generation all while
decreasing costs) would follow a 2-year cycle. The concept is known as Moore’s law,
after Gordon Moore, an Intel Corporation cofounder; it became widely discussed after
Moore’s (1975) article refining and supporting the forecast. This law explains the rapid
pace of change for computing technologies that is not present in other industries
(Shankland, 2012).
As previously mentioned, Perrow (1984) provided a characterization of
technological risk. This work and others were later associated with an emergence of the
idea that such risk is a sociological concern (Perrow, 1984). Clarke and Short (1993)
noted the emerging concern and collected common thoughts from fields other than
sociological works. They provided a clarifying set of issues for consideration in
organizational environments of risk and posited that no integrating theories had emerged
to mark the research agenda. Clarke and Short summarized the arguments into six broad
areas, while accounting for miscellany. The key areas of their synthesis are (a) a
comparison of technological and natural disasters, (b) constructionist realities versus
objective risk definition, (c) fairness and responsibility in decisions with risk
components, (d) human error versus systems as structural sources of risk, (e)

75
organizational track records for reliability, and (f) generalized organizational response to
disaster (Clarke & Short, 1993, pp. 376-394).
Further, Clarke and Short (1993) described their central theme in treating the
subject of risk from the contextual basis of organizational and institutional roles in the
creation, assessment, and response to uncertainty and hazard (p. 375). Within their
reviews, many disciplines are represented with works from psychology, economics,
technologists, engineering, science, practitioners, decision making (in its contexts),
statistics and probability theory, disaster researchers, constructionists, management,
politics (interests and power), information, systems research, marketing and public
relations, highly reliable organization theorists, and law. This observation is also
reflected in the subject matter of the examples and cases cited that, spanning the public
and private sectors, include military, maritime, petroleum industry, health care,
information and systems, housing, aviation, chemical industry, community response, trust
and responsibility in government and science, leadership, transportation regulation,
accountability in government, reliability, toxic waste disposal, organizational learning,
disaster response, nuclear power generation, fishing communities, media and press, and
individual responsibility. It is beneficial to note that this listing specifically calls out
information and systems, making it directly relatable to this research. Also notable is that
most if not all of the other examples are employers of IT in some degree.
Clarke and Short’s (1993) call for additional research included a prognostication
about the intellectual route of risk. In one scenario, risk research and study become a
topic in the overall subject matter of social problems, “important in its own right” (pp.
395-396) because of its potential for initiating social change and developing social

76
theory. The second scenario plays risk toward a mainstream of generalities in which the
precise study of risk in sociology is no longer needed.
The year 2000 brought continued recognition of the power of networks and their
impact on IT. Two publications in particular significantly demonstrate this, one applying
network theory and technology to warfare (Alberts, Garstka, & Stein, 2000), the other
applying network theory and technology to democracy (Barney, 2000). Alberts et al.
(2000) collaborated to produce a strategic view of how the network contributes to
information superiority. The research conveyed several concepts of interest to risk in
releasing technologies in the arena of defense. The first concept is the distinction of the
“infostructure” (Alberts et al., 2000, p. 6) as a concatenation and abbreviation of
“information infrastructure,” which is a label for the cost of entry into an environment
that exploits the value proposed by networks. The second concept is the distinction of a
mission capability package and the coevolution of such packages (Alberts et al., 2000,
pp. 210, 227). The third concept is the broad use of the term risk to cover a wide range of
happenstances, such as risks of declining public support, allocating finite resources to
rival needs, increasing operational costs, declining value creation, accumulating
unneeded inventories, being outmaneuvered, threatening life situations, and maintaining
unrelenting operational tempo (Alberts et al., 2000, pp. 20, 37-38, 41, 64, 69, 82). The
coevolution of mission capability packages is the combination of existing infostructure,
experimentation (versus slow traditional research and development), and the elements of
defense processes (e.g., logistics, personnel, training, organization, weapon systems) with
operational tempo being a key theme throughout (Alberts et al., 2000, p. 210).

77
In other significant work, Barney (2000) approached the potential impact of
network technology on democracy and noted that the nature of the network tends to
negate distinctions between information and communication such that the two working in
tandem create a “giant, expanding database” (p. 92). Barney explored the ability of
governments or capitalists to control the use of networks and what it portends for
economies, enforcement and policing, software ownership, citizen participation, and
ultimately the resulting quality of democracy. The research concluded that the activities
of the governed, in their pursuit of democratic self-government using network
technology, are a poor substitute for the art and science of politics. Those activities,
however devoted to the betterment of democratic practice, actually feed the appearance
of “the periodic registration of private opinions derived from self-interest and propaganda
to stand in for democratic self-government” (Barney, 2000, p. 268). Of note in Barney’s
research was the period of time that it became attractive for network traffic to be
encrypted.
Barney chose two cases from the 1990s to illustrate political outcomes in testing
the ability of government to control what is released to the network and is consequently
no longer governed in a traditional sense. The first case was used to support the idea that
network technology creates a community immune to law and enforcement (Barney,
2000). Phil Zimmerman, famous for developing encryption protocols, faced a dilemma
with respect to governance and ownership of software. The dilemma presented itself
when it came time for him to decide what to do with his break-through encryption
technology. In the interest of averting undue privacy invasions by states, Zimmerman put
his product on the Internet, making it accessible for free and subsequently endured a 3-

78
year criminal investigation for allegedly violating arms trafficking laws in the United
States that restrict the export of encryption algorithms prior to government approval.
When the U.S. Customs Service closed the investigation, they neither explained the
charges nor the reasons Zimmerman was indicted.
In a second case, Barney (2000) reported that Daniel Bernstein, a mathematician
and cryptologist, approached a similar circumstance by suing the U.S. State Department
that was requiring him to apply for a permit to export his encryption software. A U.S.
District Court ruled that Bernstein’s source code was a form of free speech, which
prevented enforcement of the permit process. Barney noted that this case illustrated not
an inherent network characteristic as the source of control issues, but instead preexisting
political preference for freedom over order (pp. 240-242). The advent of the Internet
stimulated considerable avenues and perspectives on the impact of IT (e.g., a sociological
impact as well; Cavanagh, 2007).
The research stream begun by Alberts et al. (2000) continued in a series of
publications from the Center for Advanced Concepts and Technology, which is a
subgroup of the Command and Control Research Program sponsored by the DoD Office
of the Under Secretary of Defense (Acquisition, Technology, and Logistics). This
subgroup devoted effort to demonstrating the significance of the Information Age to
national security and reached into material written previous to the net-centric work to
help distinguish the notion of the Information Age. Many of these publications have
particular relevance for coping with characteristics of IT in a defense environment. For
example, the threads of the Information Age, complexity theory, modeling and
simulation, agility, and decision making are woven into a discussion of command and

79
control functions. Two authors who specifically address the topic of technology risk are
Moffat (2003) and Alberts (2011).
Moffat (2003) summarized six complexity concepts and related them to qualities
of combat forces in the Information Age. As part of his case that the tools of complexity
analysis can be used in the analysis of warfare, he provided examples from biological,
physical, and economic systems to reach the commonalities necessary to his argument
that such tools are useful in predicting the future of warfare. Further, Moffat played out
conceptual principles through computer-supported war-gaming scenarios, applying the
relationships between complexity concepts and Information Age force qualities. The
mapping included (a) nonlinear interaction of the parts comprising combat forces, (b)
decentralized control in that each combatant action is not dictated from a master point, (c)
self-organization in that seemingly chaotic localized actions conform to order over time,
(d) nonequilibrium order in that conflict is by nature an occurrence far from equilibrium,
(e) adaptation in the coevolution of forces that are continually adapting, and (f)
collectivist dynamics through continuous feedback among combatants and command
structures (Moffat, 2003, p. 49).
Alberts’s (2011) work progressed from the implications of a platform of network
technology to the application of agility concepts as well as complexity theory. Alberts
applied these ideas to enterprises and their actions in a 2011 publication charting an
agility course for command and control functions. Alberts suggested that organizations
lacking in an appreciation of agility are Industrial Age outfits equipped with Information
Age technologies, such as extensive networks. This is appreciably acute in risk
assessment, starting with distinctions between uncertainty and risk as related to the

80
perceptions of probabilities and exposure to both undesirable results and missed
opportunities. Alberts noted risk assessment is not the linear contemplation of severity
and the probability of occurrence and proposed a third dimension to risk: the
management approach that moves from ignoring the risk to mandatory action (pp. 34-43).
Time frames associated with risk motivated action and acceptance of consequences
combine in Alberts’s description of decision-making components (uncertainty, risk, and
time pressure) that support his introduction to decision making in complex scenarios and
why it is different than decision making in simple or even complicated situations
(Alberts, 2011, p. 46).
Alberts (2011) concluded that many of the decision-making tools employed are
hampered significantly by complex situations. In demonstration thereof, Alberts posited
that emergent behaviors prevent effective use of decision strategies that break difficult
problems into manageable component problems that can be solved (p. 62). Alberts
described and explored the use of information advantage in addressing better decision
making via military efforts to exploit network technology and the associated criticisms.
For example, net-centric warfare “longs for an enemy worthy of its technological
prowess” (p. 124). Alberts asserted that criticisms in this vein are the result of using
Industrial Age models to evaluate a key transformative characteristic of the Information
Age. Information overload, misguided connectivity, and misinterpreted business case
were areas cited. Alberts reviewed the work associated with the phrase power-to-the-
edge, which labels efforts to exploit the power of networks by making information
increasingly accessible and subject to fewer constraints. An Information Age military is
said to be characterized by its policies of information sharing and collaboration.

81
However, Alberts concluded the organizational structures and mind-sets of militaries still
reflect more of industrialization than information. He asserted that pursuit of agility
addresses the new age that has resulted from complexity. Alberts’s crafted definition of
agility is “the ability to successfully effect, cope with, and/or exploit changes in
circumstances” (p. 188).
Alberts (2011) provided a series of experiments to aid in the understanding of
how factors in four areas affect characteristics of agility. The four factors are (a)
infostructure agility related to network links and performance applied to sharing and
quality (b) individual agility related to human characteristics applied to cognition and
correctness, (c) organizational agility related to policies and effectiveness, and (d)
compensating agility related to the ability of more agile participants to make up for
deficient agility in others (pp. 256-269). Using experiments comprised of both human
trial information and agent-based modeling, Alberts compared and contrasted the results
of organizational forms (conventional hierarchies to collaborative edge arrangements)
and their performance, given sets of information and correctness outcomes. Notably, the
infostructure in the experiments is held at a constant level of normal performance for
most runs of the models (p. 328). His research findings indicated that some
organizational options are inappropriate in certain situations (e.g., using an edge approach
when information contains high levels of noise takes longer to reach correct outcomes
and using hierarchies when the challenge contains complexity results in poor outcomes).
For Alberts, choosing the most appropriate organizational and informational approach
means choosing the approach that covers the most area of the endeavor space
(requirements for shared knowledge, demands for timeliness, and degree of noise in

82
information). How an option covers this space (operating successfully) is the degree of
its agility (Alberts, 2011, p. 352).
Using a subset of the models can simulate the impact to agility due to the loss of
infostructure support. The removal of some models explores what happens to the
probability of success in the case of a damaged network and the case of the loss of a
website. Doing so illustrates vulnerability and suggests resilience qualities. Information
lacking trustworthiness could not be accommodated by the agent-based modeling tool
used at the time (Alberts, 2011, pp. 391-401). Alberts asserted that the construction of
the explanatory “model of potential agility” (p. 516) addresses a need to assess whether
an entity can be successful under unexpected circumstances and, though crude, helps
make sense of what it means to be agile.
Recently from a public administration viewpoint, the impact of network formation
took the tack toward civil networks (Musso and Weare, 2015). This is in contrast to the
flow of network study from Alberts, Garstka, and Stein (2000) and Alberts (2011), which
traversed the topic from literal impacts of technological networks and information
sharing to the importance of network infrastructure in military agility. Musso and Weare
(2015) viewed the network for its human component, rather than technology basis and
centered their research accordingly. They studied the formation of interpersonal
relationships as a part of institutional reform and produced a network simulation of a Los
Angeles city charter reform of 1999 (p. 151). Their purpose was to explore the
relationship between individual motivations in a reform network and the higher-order
structure of the network that emerges (p. 152). While risk is considered in the context of
bonds of trust and engagement in information sharing and risky protest activities (p.153),
83
the motivations of individuals in forming networks, the relationships in civic
engagement, and use of network simulation to explore those relationships, do not appear
to have affinity with risk assessment in software development and release.
An affinity between low risk software and highly reliable organizations seems
more likely. Powers, Stech, and Burns (2010) noted that highly reliable organizations are
characterized by their formal models and mechanisms for performance measurement and
seek to apply those concepts to team sense making. This paper investigated the reliability
of defense organizations and capabilities such as aircraft carriers and intelligence
agencies. Powers et al. explored the qualities of sense-making teams and proposed a set
of behaviors they derived from sense-making principles as an initial model for
performance. These behaviors, they noted, can be observed in team situations.
Using an additional research method, Powers et al. (2011) carried out an
experiment in collecting data from an exercise situation by reviewing video recordings.
Powers et al. counted instances of the behaviors in their proposed model. The four-day
collection of observations provided interesting results (for example, more enabling
behaviors occurred than inhibiting behaviors for this group), but Powers et al. concluded
sense-making metrics are just a start in understanding the relationship to performance,
thresholds for tolerance, and usefulness of the behaviors listed (p. 9).
Others have contributed to the concept of sense-making applied to complex
decisions in defense scenarios. Lafond et al. (2012) carried out a simulation for defense
and security designed to train decision makers that included the sense-making behavior
model. Burns (2014) continued the work into a geospatial defense scenario by employing
Bayesian methods for prognostic and forensic inferences. Burns provided the following
84
definition of sense-making: “a recurring cycle of obtaining evidence and updating
confidence in competing hypotheses, to explain and predict an evolving situation”
(Burns, 2014, p. 6).
Bankes (2002) investigated the specific case of complex systems and the use of
agent-based modeling and other model types for policy analysis. Bankes noted that for
some results of systems modeling, even the best estimate approach will seriously
underperform due to the phenomenon of deep uncertainty. Bankes proposed “an
ensemble of alternative plausible models” (p. 7264) to address the performance shortfall
while exploiting otherwise unused information about the system under examination in a
process involving iterative analysis. Bankes presented criticisms of statistical decision
theory’s mathematical models with prerequisite knowledge requirements and a discount
of human qualitative and tacit information. Bankes recommended iteratively integrating
computer-based quantitative data with human reasoning pertaining to complex, open
systems (p. 7264). This approach allows ranges of policies to develop through the
deepening knowledge that is being created by ongoing modeling activities of differing
types. Bankes’s examples included simple mathematical models of prediction, Monte
Carlo analyses, uncertainty analyses, graphical regions of policy forecasts, and a
graphical representation of a military combat situation (pp. 7264-7265). This approach
was offered as an alternative to a single policy recommendation based on its performance
in a single agent-based modeling examination. The proposed graphics presented maps of
solution space that allow policy makers to choose combinations of strategy components
rather than static configurations of strategies, which was proposed to account for policy
making in complex adaptive systems, in which the policy making was also adaptive.
85
Bankes’ proposed approach can be used to find the breaking points for particular strategy
sets to prompt additional configurations. Bankes reported successful use for deeply
uncertain, nonlinear, situations of policy contemplation (p. 7266).
Bankes’ (2002) use of agent-based model concepts illustrated an increased level
of sophistication in modeling when compared to the simple modeling attempt associated
with early decision making theories. In 2001, two articles appeared in American Political
Science Review in a revisit of the original 1972 work on the garbage can model
mentioned earlier in this research as elucidating to the organizational scenario that results
in software being released. The first was a critique by Bendor, Moe, and Shotts (2001)
that included several examinations: (a) the lineage of the garbage can and new
institutionalism, (b) the behavior of the computer model and its programmed constraints,
and (c) the alignment of the model with the accompanying text. Bendor et al.
disassembled the series of works and criticized not only the original authors but also the
community for failing to explore its weaknesses (p. 183). Olsen (2001) responded to the
critique of the garbage can model body of work. In particular, Olsen took issue with the
way Bendor et al. viewed the computer model. Olsen defended the garbage can model as
a reproduction of a common experience: “moving through a series of meetings on
nominally disparate topics, reaching a few decisions, while talking repeatedly with many
of the same people about the same problems” (p. 192). Olsen’s early model could be said
to have provided a glimpse of future possibilities with modeling, now possible on a
grander scale like Bankes’ model because of advances in computation.
In the same time period that Bankes (2002) explored modeling and Bendor et al.
(2001) critiqued an early modeling attempt, Klinke and Renn (2002) revisited the
86
controversies of risk management. In their view, several of the issues pointed out by
Clarke and Short (1993) remained or were restated, amended, and reduced. The list of
issues was as follows: reality versus construction, public concerns, uncertainty handling,
science and precaution approaches, integrated analytics, and deliberations (Klinke &
Renn, 2002, p. 1072). The primary application studied was centered on hazard to
environment and health in regulatory decision making for which was proposed a
taxonomy of evaluation criteria, tolerance concepts, risk classification scheme, decision
tree, management style map, strategy and instrument matrix, and discourse escalation
guidance (Klinke & Renn, 2002, pp. 1078-1080, 1082, 1083, 1090). Klinke and Renn
provided a visualization of the resulting classifications of risk situations (named by
corresponding Greek mythology characters that evoke the situations in terms of
complexity, confidence, and value judgments) against a backdrop graphic of increasing
scope of damage on one axis and increasing probability of occurrence on the other (p.
1082). They concluded the advantage of distinguishing between types of discourse, each
appropriate to the risk regulation situation, such that procedure and outcome do not
compete for priority. An intelligent combination of deliberation types and risk scenarios
(cognitive and expert, reflective and stakeholders, participatory and normative) provides
democratic legitimation of regulatory (political) decision making (Klinke & Renn, 2002,
p. 1092).
While Klinke and Renn (2002) used mythology as an arguably unifying
visualization, Macgill and Siu (2005) made a case that risk paradigms did not include
observations about the nature of risk that would unify risk analysis. Macgill and Siu
proposed a new multidimensional paradigm that resulted from their effort to understand

87
the dynamics of a metaview, rather than those constrained by a perspective, such as those
offered from disciplines. The research explored risk analysis perspectives from techno-
engineering, sociocultural, political institutional, economics, and so forth (p. 1108). The
mechanism for illustrating the state of a risk was by its plot on a three-dimensional scale
of expected effect, scientific doubt, and social conflict, with the fourth dimension of
acceptability also recorded (p. 1114). In concluding remarks, Macgill and Siu
commented on the ability of their structure to accommodate rather than replace existing
risk analysis methods and reviewed how their methods of illustration and coding capture
each of five principles of systems analysis credited to Capra (as cited in Macgill & Siu,
2005, pp. 1126-1127). Those principles are definitional (“union of dynamically evolving
risk knowledge of the physical and social worlds,” p. 1110), structural (physical, social,
and resolution), trust and certainty (perceptions of valid knowledge and openness to
accept knowledge), procedural (mediation of the ebb and flow of evolutionary knowledge
attainment), and managerial (self-organizing control of the risk system; pp. 1126-1127).
From the metaview to an individual’s view, Ito (2015) included a case in which
he personally participated after the tsunami that led to the nuclear disaster at Fukushima
Daiichi in Japan. In this scenario, an ad hoc team accomplished something important to
survivors and those affected that the official response organizations with planning and
resources could not. The team assembled itself from networked colleagues available at
the time of need. These geographically separated experts tapped existing, inexpensive,
easily assembled electronic and software components to provide survivors with
understandable radiation readings from their immediate surroundings. Ito also explained
his notion of “antidisciplinarian” (Ito, 2014, para. 1 ) as a concept in which the

88
boundaries of disciplines are subject to less emphasis than the “space between the dots”
(Ito, 2014, para. 4). Ito described as common the fate of innovations that attempt to work
in the “space between the dots” (Ito, 2014, para. 4). Those humans that are creative in
this way are rejected by the established disciplines within the reaches of their work,
which leads to a loss of progress. Ito reinvented the MIT Media Lab with this mantra.
Ito described this era of technology as a post-Internet phenomena and titled his
presentation After Internet (2015), in recognition of the disruption.
In contrast, at earlier stages of network technology circa 1996, a predecessor of
Ito, Nicholas Negroponte, told the World Economic Forum that cyberspace was
uncontrollable and that those saying otherwise were to be doubted (as cited in Barney,
2000, p. 238). Controlling cyberspace may not be so much the issue as exploiting it for
both its strengths and weaknesses.
Similarly, Johansson (2006) espoused a route to innovation via the intersection of
disciplines, along with the same warning about protected boundaries of established
disciplines (pp. 157-158). Johansson added a perspective that the sheer quantity of ideas
generated relates to the ability of intersections to highlight combinatorial variations in
ideas, thereby increasing the likelihood that a groundbreaking notion will surface
(Johansson, 2006, pp. 91-92).
This literature review cast a broad net on software risk assessment, relevant public
administration topics, and environmental influences, having first provided background
and a review of material describing the RALOT approach. While the use of
questionnaires figures prominently in the RALOT approach and in the literature of
software risk assessment, the remaining subjects introduced dimensions that are not
89
clearly present, by employing simply reading comprehension, in RALOT. Therefore, this
material was staged as an integral part of the research method, in order to glean from it
opportunities to improve the USAF’s software risk assessment methods and outcomes.
The process to complete the research and the results are documented in the remainder of
the dissertation.
90
Chapter 4: Hypothesis
The RALOT model can be improved due to recent research and application
developments.
This hypothesis was expressed in keeping with a tenet from grounded theory, an
emergent research method (Charmaz, 2008). The applied tenet is “minimizing
preconceived ideas about the research problem and the data” (p. 155). For this reason,
the hypothesis is a simple statement of expectation, which allowed the research methods
and techniques applied to reveal avenues of action and middle-range theoretical
possibilities (pp. 155, 163).
The chapter that follows provides a review of the methods and techniques chosen
as potentially useful to the task of examination of the content of the literature review, in
the overall context of the hypothesis stated above. The review expands on grounded
theory and methods similar to grounded theory. It also includes material on the means
for synthesizing the literature review and making selections from alternative
improvement subject matter. Material on research trends in public administration is also
included.
The research questions are presented after the discussion of the methods and
techniques. This serves the overall objective of this dissertation which is identification of
improvement opportunities for software risk assessment in the USAF.
91
Chapter 5: Research Method
Three methods of inquiry support the identification of the hypothesis and
questions, as well as paths for future research. The first method described is grounded
theory, second is generative social science, third is lesson drawing, and fourth is affinity
diagramming. An additional section reports from a trends article found in Public
Administration Review.
Grounded Theory
Hesse-Biber and Leavy (2010) provided the following description:
Emergent methods are flexible; they can comprise qualitative methods or
quantitative methods or a combination of these two types of methods. Emergent
methods stress the interconnections between epistemology, who can know and
what can be known; methodology, theoretical perspectives and research
procedures that emanate from a given epistemology; and method, the specific
techniques utilized to study a given research problem. (p. 2)
As an emergent method, grounded theory stems from emergent logic, and Charmaz
(2008) qualified emergent methods by adding that they are “inductive, indeterminate, and
open-ended” (p. 155). As a methodology, grounded theory includes a minimalist
approach to preconceptions surrounding the problem and data, simultaneous collection of
data and analysis that iteratively informs, ongoing openness to a variety of explanations,
and construction of mid-range theory from ongoing data analysis (p. 155). As a

92
qualitative view, Charmaz contended that the method emerges and becomes explicit
through employing creativity and imagination, which are necessary to develop theoretical
categories and not only inquiry results. Emergence, in this context, has its roots in the
idea that a whole, or loosely a system, can have characteristics that the parts do not, with
Charmaz noting this includes “movement, process, change” (p. 157).
Grounded theory allows reasoning to move from inductive to abductive processes,
which introduces otherwise unrepresented possibilities. Critiques of the method include
divergence on the application of emergence definitions and their effect, mechanical
interpretations of the process, objective abstraction versus interpretive description, latent
versus explicit main concerns, prescriptive coding techniques, constructivist view of
research components, observation of many cases and researchers’ characteristics, and
adoption of theoretical codes (Charmaz, 2008, pp. 158-161). Charmaz discussed coding
qualitative data, writing memos, clarifying sampling, and recognizing theoretical
saturation (pp. 163-167).
Generative Social Science
Epstein (2006) provided a treatment of the use of agent-based computational
modeling as generative social science under the auspices of Princeton studies in
complexity. Generative science may be characterized as a paired question and
experiment. The generativist’s query is as follows; “How could the decentralized local
interactions of heterogeneous autonomous agents generate the given regularity” (Epstein,
2006, p. 5)? The generativist’s experiment is as follows: “Situate an initial population of
autonomous heterogeneous agents in a relevant spatial environment; allow them to
interact according to simple local rules, and thereby generate—or ‘grow’—the

93
macroscopic regularity from the bottom up” (Epstein, 2006, p. 7). In tracing the first
applications of this concept, Epstein noted that computers were not a prerequisite to
establishing generative science. However, using them today in the agent-based
computation model of an experiment makes large-scale work possible (p. 7). Epstein
provided the following features list that includes heterogeneous agents, autonomous
individual behavior, defined space, interacting neighbor agents, and specifically
“bounded rationality” (pp. 5-6).
Microspecifications are sufficient if they generate the macrostructure of interest
but may yet be only a candidate explanation leading to additional microspecifications that
also result in the macrostructure of interest. These additional results must be compared.
Epstein (2006) provided a motto for generative social science that refers to how the
macroconfiguration is explained and the dynamics of its formation: “If you didn’t grow
it, you didn’t explain its emergence” (p. 8). Epstein further provided a history of the
concept of emergence and challenged what would be a criticism of the overall method
with a specific definition of emergent occurrences: “stable macroscopic patterns arising
from local interaction of agents” (p. 31). This definition and Epstein’s exploration of
other definitions of emergence resulted in his conclusion that generativists accept that an
observed feature of a whole may or may not be explained. This is different from the
classical conclusion that such an explanation is precluded by virtue of emergence itself
(Epstein, 2006, p. 36). Epstein noted that generative science seeks a microspecification
that is sufficient to explain the behavior of the whole while leaving no mystery through
insufficiency or flaw. It is appropriate under the condition of analyzing “spatially
94
distributed systems of heterogeneous autonomous actors with bounded information and
computing capacity” (p. 38).
Epstein (2006) provided several cases of applied agent-based computations, each
accompanied with animations. Notable was Epstein’s model of an adaptive organization
that addresses the following query: “Can one ‘grow’ optimally adaptive organizations
from the bottom up—that is, devise rules of individual behavior that endogenously
generate optimal structural adaptations” (p. 309). Epstein referred the reader to a vein of
literature on the origin and size of firms and attendant topics that include M. D. Cohen et
al.’s (1972) garbage can. No data supported the model, instead support arose from the
execution of rules and their effect on structure of the organizational form, i.e., the model
or organizational form varies with the variation in rules or behaviors. The two basic
organizational models explored are flat and hierarchical. The model successfully
produces dynamic structure behaviors from the execution of the rules. The behavior of
the model can be likened to both profit seeking and military settings. One variation in the
model with a hybrid objective (the organization concerns itself equally with profit and
market share) had surprising results. Where Epstein expected a fixed result (one form of
organization over another, as optimal), the model in these scenarios oscillated between
flat and hierarchical (pp. 309-342).
Lesson Drawing
Rose (1993) provided a concise guide to lesson drawing as can be applied in
public administration scenarios for policy analysis and decision making. Rose described
the quest of public officials for programs (in whole or in part) that are successful in some
instance and have potential to address dissatisfaction that has arisen within their own

95
spheres (pp. 50, 57). These searches extend over time as well as other terrain. Candidate
solutions may exist, either in a historical context or in an organizational or geographical
context that Rose referred to as space (p. 90). Rose posited seven hypotheses about the
likelihood that any given candidate program will have a repeat performance elsewhere
that is successful, defined simply as a working program that evades dissatisfaction.
Those seven hypotheses are described below and include the word “fungible” denoting
that an agreeable outcome can be expected, to some degree, by employing lessons
learned from an outside or previously executed program in a different time (i.e., now) and
different space (i.e., here):
• Fewer unique aspects improve fungibility.
• Substitutable institutions of delivery improve fungibility.
• Resource equivalence improves fungibility.
• Simple structures of cause and effect improve fungibility.
• Smaller introduced change from the new aspects improve fungibility.
• Interdependencies between separate jurisdictions influenced by the same
dissatisfaction improve fungibility.
• Harmonious, shared values between policy makers and the candidate program
improve fungibility (Rose, 1993).
Rose concluded that, for the dimension of time, obstacles a lesson-drawn program faces
become variables. That is, decision-time road blocks can be challenged over the time
frames of the new program’s execution environment (Rose, 1993, pp. 143-144).
James and Lodge (2003) compared Rose’s lesson drawing and another body of
work represented by Dolowitz and Marsh’s (as cited in James & Lodge, 2003)
96
contribution to policy transfer. James and Lodge posited that both approaches lack
distinction on three fronts, which means they have limited usefulness over and above
more specific views of learning and the relationship of policy-making styles to their
respective outcomes (p. 190). The three areas of concern for James and Lodge are (a)
distinction of the two from conventional forms of policy making; (b) distinction of the
precursors to lesson drawing, policy transfer, or conventional; and (c) examination of
why lesson drawing or policy transfer or conventional rationale may have different
effects on policy and success (p. 179).
M. F. Williams (2009) provided a viewpoint of public policy development that
accentuated the technological aspects, such that a comparison of software development
processes and policy development (rule-making, specifically) processes is possible (p.
453). M. F. Williams drew on both software development sources and policy
development sources (such as Rose, 1993) to juxtaposition the software development life
cycle with a similar process developed by Kerwin (2003) to describe the iterations of rule
making. The exercise reflected on the use of E-Rulemaking, which is a blending of the
process of developing the web-based software iteratively with the process of soliciting
stakeholder inputs to regulation development, also iteratively. M. F. Williams warned
that blending the technologies can have an adverse impact in that access to the Internet
excludes some stakeholders, does not seem to be improving the language of regulation
from highly technical to layman’s terms, and must be supplied to students for the
furtherance of communication technologies through the blurring of disciplinary lines
(professional vs. technical genres of communication; p. 461).
97
Affinity Diagramming
A technique for exposing relatedness in topics and new or unnoticed concepts and
ideas was found in Straker’s (1995) practical guide for performing affinity diagramming.
Situations in which an affinity diagram is useful included (a) when seeking to bring order
to disorderly information (fragments, uncertainty, unclear structure), (b) when seeking
consensus with subjective and provocative material but avoiding argumentative
situations, (c) when opinions about existing systems hamper potential to uncover new
solutions, and (d) when creative order has value over logical order (Straker, 1995). The
completed affinity diagram is constructed of groups of subject matter instances with
affinity labels that provide a basic organizational structure to the material and content
revealed during the process.
Straker (1995) provided a process for developing an affinity diagram for a small
group of participants presented with a problem statement. The group collects data about
the problem and then transfers the information to 3 × 5 cards (or Post-It notes) and
shuffles them. In iterations of gathering the cards into groups under header cards and
rearranging them, the group arrives at a diagram documenting their progress. Silence and
feeling are preferred over discussion and logic. Arrows may be added for relationships
(Straker, 1995).
Trends
In keeping with tradition, Public Administration Review editors employed
researchers to report on its efforts to take stock of research represented in its publication
over the period of 2000-2009 (Raadschelders & Lee, 2011). Among the challenges for
such an undertaking was how to categorize topics across current events and historically
98
established subjects, account for the declining contributions from public-administration-
practicing authors, and draw conclusions about future direction and purpose from the
resulting observations. Among those observations were that statistical and empirical
approaches dominated among the methods chosen for pieces during the 10-year period
under review (Raadschelders & Lee, 2011, p. 24); planning, organizing, staffing,
directing, coordinating, reporting, and budgeting (known as POSDCORB and describes
the duties of the chief executive according to Gulick; as cited in Shafritz & Hyde, 1997,
p. 88) remained a dominant topical scheme with variations in titles of seemingly little
significance (Raadschelders & Lee, 2011, p. 27); and an underserved subject surfaced
that related to the material of this paper: science and technology innovation
(Raadschelders & Lee, 2011, p. 27).
Among the conclusions of the PAR inventory were a charge of overspecialization
characterized by statistical and empirical research that is less and less useful to
practitioners and only understood by limited numbers of experts; a call for
interdisciplinary exposure for public administration students designed to encompass the
range of social sciences and implications for policy challenges; and a prediction of the
decline or end of practitioner interest in public administration study: “If quantitative-
statistical, empirical, specialized, studies eclipse a generalist administrative science . . .”
(Raadschelders & Lee, 2011, p. 29). A contrary view appeared in the volume edited by
Hesse-Biber and Leavy (2010), while data supported the idea that quantitative methods
have outpaced qualitative in use for social science. In that volume, Staller, Block, and
Horner (2010) reported that 2004 marked the most recent intersection after which interest
in quantitative methods exceeded interest in qualitative methods, although data from Sage
99
publication frequencies revealed several points in history in which the two jockeyed for
dominance (pp. 32-33). Further, Staller et al. reported, “These methods employing
statistical techniques—which were once utilized only by specialists—are now routinely
expected to be mastered (or at least tackled) by undergraduate students taking basic
research methods courses” (p. 34), thus raising the bar for generalists to accept the
techniques of the specialists.
Research for RALOT
The research method being employed in this study entailed comparing recent
research and development efforts with the content of RALOT to identify characteristics
of approaches that are not represented in the RALOT method. Those additional
approaches were addressed as potential improvements to the RALOT method. A trial
construction of an additional method or methods for the RALOT approach was
assembled using existing supporting material from the new research. A trial method of
refining and validating the new model was proposed. The research method consisted of
four questions:
Question 1: What does a review of the literature reveal about improvement
opportunities in the way of risk assessment and predictive methods?
Question 2: For selected methods, what does a comparison with RALOT content
reveal about specific opportunities for improvement?
Question 3: Can initial versions of specific improvements to RALOT be
constructed from the results of the analysis?
Question 4: What steps would be needed to refine and validate the initial version
for actual use?
100
Answering each question was carried out as follows. Question 1 was answered by
a concept search through the literature review section of this paper for categories of
practiced or proposed means of dealing with risk. The search was as broad as humanly
possible in the time frame allocated and in keeping with emergent and generative
approaches. Chapter 6 contains the analysis of Question 1, in the form of an affinity
diagram. Question 2 was answered by a subjective comparison of the qualities present in
RALOT against those concepts revealed by Question 1. Coding occurred for action and
analytic possibility, in keeping with grounded theory. Chapter 7 contains the comparison
produced in responding to Question 2. Question 3 was answered by selecting a mode of
improvement, using lesson drawing (Rose, 1993) from those exposed by Question 2’s
comparison and constructing a prototypical model of how the improvement could be
implemented, with emphasis on the value potential and feasibility. Chapter 8 contains
the prototypical model of the improvement, a Bayesian network implemented with Agena
software. Question 4 was answered with an implementation strategy and step-wise plan
for the improvement to be introduced into practice, which can be used for further study.
Chapter 9 contains the planning material. Chapter 10 summarizes the results and
recommendations supported.
101
Chapter 6: Question 1
As a reminder, Question 1 was as follows: What does a review of the literature
reveal about improvement opportunities in the way of risk assessment and predictive
methods? The literature review revealed a wide array of topics, techniques and tools, and
insights that are both general and specific, and can potentially improve the fidelity of risk
assessment for the USAF’s software endeavors.
Question 1 was designed in the broadest sense possible with acknowledgment of
the subject’s depth, breadth, complexity, history, timeliness, scope, and impact that make
the research approaches of grounded theory and generative social science attractive. Risk
is an amorphous topic; software is a generically useful invention. In addition, a wide net
across material seems a practical, if slightly improbable, way to narrow the possibilities
afforded by the generation of many combinations of ideas after two or possibly more
disciplines are seen as relevant to a single endeavor and will form an intersection or a
convergence point (Johansson, 2006).
A shortcoming is that literature research must be bounded. This is particularly
important to this research, because of the technology environment, and is a reason to
employ the research approaches of Charmaz (2008) and Epstein (2006). The references
are only a sample of possibly applicable concepts bounded by the time and imagination
of the researcher in keywords and intersections that may be contemplated. Conversely,
new or additional information continues to be discovered; even if it is not published or
disseminated. Impacts of software failures are newsworthy, and each new report
102
potentially shapes perceptions of risk. In April 2015, news sources reported that
Starbucks customers were treated to free beverages due to a surprise failure of the point-
of-sale system (Soper, 2015). Starbucks reported a simple omission of a database table
during a routine software release created a global outage and led to millions in lost
revenue (Bishop, 2015). Who was responsible for that release and the reason why they
believed it was okay to release are not yet reported and might not ever be reported.
Likewise, the pace of change in software technology means that new applications are
potentially around every corner. For example, also in April 2015, the Association for
Computing Machinery reported defense command and control applications employing
new “sketch-thru-plan multimodal interfaces” (P. R. Cohen et al., 2015, p.56) with
remarkable user acceptance rates over the previous technology through the concept of
“user juries” (p. 63). Neither of the ideas in quotes surfaced in the literature review in
Chapter 3. Drawing a cut line was a challenge. This illustrates the weakness of any
literature review because of constantly evolving information.
Several readings of the articles summarized in Chapter 3 revealed a myriad of
inputs suitable for a practitioner charged with developing a comprehensive risk
assessment program for the release of software in a public administration setting. Figure
2, below, captures through categories of key words and phrases in an affinity diagram,
those concepts so that they could be used for the purpose of the comparison in answering
Question 2 (Straker, 1995). The categories that emerge from the key words and phrases
are sources of risk, finding and anticipating risks, gauging risks, mitigating risks, and
criticisms. The purpose of the categories is to aid in the communication of the key words
103
and phrases from Chapter 3 by a loose organization of their context. The exercise could
be improved by expanding the effort to other participating researchers.
To prepare the content of Figure 2 further for use in answering Question 2, it was
useful to form the key words and phrases into a checklist. The checklist was then used to
look for subject matter in the RALOT material that indicated the concepts behind the key
words and phrases were present. Through these means potential improvements surfaced
for consideration.
In the preparation of the checklist, an affinity diagram exercise was useful in
elucidating the key words and phrases with conceptual overlap and incremental value
above a central theme. The incremental value stems from the actionable nature of the
resulting collection, an alignment with Charmaz’s advice on coding, pertaining to the
next research question. Charmaz advised that coding in grounded theory, an emergent
method, seeks “actions and theoretical potential” as a distinguishing feature (Charmaz,
2008, p. 163).
To avoid semantic misgivings that were likely to emerge by overanalysis of the
material, the analysis of key words and phrases stopped with the affinity diagram
preparation. The purpose for gathering the material was not to reconcile or purify the
entirety of the viewpoints with established theories or practice. Rather, the purpose was
to mine the research for ideas and means of improving an existing approach, RALOT.
While blunt criticisms of the works are useful, overanalysis of the works would consume
the study to the detriment of its purpose.
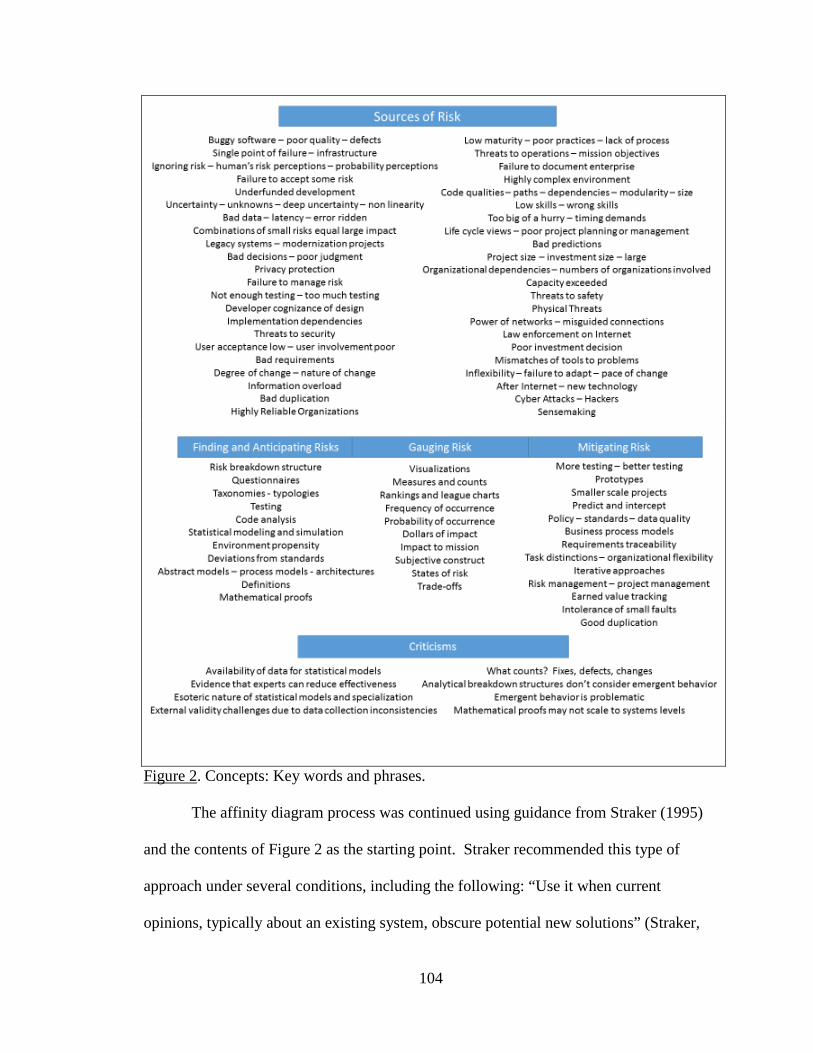
104
Figure 2. Concepts: Key words and phrases.
The affinity diagram process was continued using guidance from Straker (1995)
and the contents of Figure 2 as the starting point. Straker recommended this type of
approach under several conditions, including the following: “Use it when current
opinions, typically about an existing system, obscure potential new solutions” (Straker,

105
1995, p. 89). The resulting checklist is in Figure 3, Comparison Checklist Version 1.
Order is alphabetic within major headings.
1. Sources of Risk 1.15.3 Cyber attacks - hackers 1.1 Change Cycles 1.15.4 Law enforcement on Internet 1.1.1 Degree of change 1.15.5 Power of networks – misguided connections 1.1.2 Failure to adapt 1.16 Understanding Environment 1.1.3 Inflexibility 1.16.1 Bad duplication 1.1.4 Nature of change 1.16.2 Combinations of small risks equal large impact 1.1.5 Pace of change 1.16.3 Development cognizance of design 1.1.6 Timing demands 1.16.4 Failure to document enterprise 1.1.7 Too big of a hurry 1.16.5 Highly complex environment 1.2 Enterprise management 1.16.6 Nonlinearity 1.2.1 Bad data, latency, error ridden 1.16.7 Single point of failure 1.2.2 Bad decisions – poor judgment 1.16.8 Uncertainty- unknowns – deep uncertainty 1.2.3 Capacity exceeded 2. Finding and Anticipating Risk 1.2.4 Information Overload 2.1 Abstract models – process, architecture 1.2.5 Poor investment decision 2.2 Code analysis 1.2.6 Highly reliable organizations 2.3 Definitions 1.3 Organizational dependencies 2.4 Deviations from standards 1.3.1 Implementation dependencies 2.5 Environment propensity 1.3.2 Infrastructure 2.5 Mathematical proofs 1.3.3 Number of organizations involved 2.6 Questionnaires 1.4 Failure to manage risk 2.7 Risk breakdown structure 1.5 Human subjectivity 2.8 Statistical modeling and simulation 1.5.1 Failure to accept some risk 2.9 Taxonomies and typologies 1.5.2 Ignoring risk 2.10 Testing 1.5.3 Probability perceptions 3. Gauging Risk 1.5.4 Risk perceptions 3.1 Dollars of impact 1.5.5 Sensemaking 3.2 Frequency and probability of occurrence 1.6 Legacy systems modernization projects 3.3 Impact to mission 1.7 Mission expectations 3.4 Measures and counts (metrics) 1.7.1 Bad requirements 3.5 Rankings and league charts 1.7.2 User acceptance low 3.6 Subjective construct 1.7.3 User involvement poor 3.7 States of risk 1.8 Physical threats 3.8 Trade-offs 1.9 Privacy protection 3.9 Visualizations 1.10 Project Management 4. Mitigating Risk 1.10.1 Life cycle views 4.1 Business process models 1.10.2 Low maturity–poor or lacking processes 4.2 Earned value tracking 1.10.3 Low skills–wrong skills 4.3 Good duplication 1.10.4 Mismatches of tools to problems 4.4 Intolerance of small faults 1.10.5 Poor project planning 4.5 Iterative approaches 1.10.6 Poor project management 4.6 Policy – standards – data quality 1.10.7 Project large–investment large 4.7 Predict and intercept 1.10.8 Underfunded development 4.8 Prototypes 1.11 Safety threats 4.9 Project management 1.12 Security threats 4.10 Requirements traceability 1.13 Software quality 4.11 Risk management 1.13.1 Code qualities 4.12 Task distinctions – organizational flexibility 1.13.1.1 Paths 4.13 Testing – better and/or more 1.13.1.2 Dependencies 4.14 Smaller scale projects 1.13.1.3 Modularity 5. Criticisms 1.13.1.4 Size 5.1 Availability of data for statistical methods 1.13.2 Buggy software-defects 5.2 Analytical breakdown structures do not consider emergent behavior 1.13.3 Not enough testing - too much testing 5.3 Esoteric nature of statistical models and specialization 1.14 Operational threats-mission objective threats 5.4 Evidence that experts can reduce effectiveness 1.15 Technology forecasts 5.5 External validity challenges due to data collection inconsistencies 1.15.1 Bad predictions 5.6 Mathematical proofs may not scale to systems levels 1.15.2 After Internet – new technology 5.7 Emergent behavior is problematic 5.8 What counts? Fixes, defects, changes
Figure 3. Comparison checklist, Version 1.
106
Several noteworthy observations for the affinity diagram process were (a) for the
researched material, lines of responsibility were not drawn, as was the case for AFOTEC
and the 605th, which are organizations with a specific mission; (b) there are likely some
issues that cannot be resolved; (c) performance of normal duties under typical
organizational schemes, such as project management, engineering, or in defense, threat
assessments, can be confused with risk mitigation. Likewise, the embedding of risk
mitigation activities into routines can be a deliberate strategy; (d) explicit or implicit
assumptions made on the part of risk assessment personnel are likely unavoidable; (e)
keeping scope to software, where risk is concerned, is difficult due to the way software is
employed by organizations; (f) some concepts require quality or value definitions of their
own that are beyond the scope of this paper, such as mission requirements; (g) things
done to mitigate risk may well be the routinization of those things done to find,
anticipate, and gauge risk, thus comprising risk management; (g) it is unclear that the
affinity diagram process improved upon the original list, other than by organizing the
sources of risk material and allowing additional observations.

107
Chapter 7: Question 2
Figure 4 provides the input for answering Question 2, which was as follows: For
selected methods, what does a comparison with RALOT content reveal about specific
opportunities for improvement? A positive result is coded by the locale of the concept’s
coverage in the RALOT material (i.e., concept appears in the policy, questionnaire, or
training). Coding was P, Q, and T, respectively. The coding was executed by two
methods. The first method was searching specific words and phrases directly in the
source files using Adobe Acrobat, Microsoft Word, Excel, and PowerPoint features. The
second method was by using visual scanning and rereading of documents. The second
method was used to confirm or seek possible synonyms and root words that may have
evaded the computer file searches. A single confirmation in a source was enough to rate
a positive observation. No attempt was made to quantify degree of emphasis or
extensiveness of the treatment of the subject, because this paper was not evaluative in
that respect.
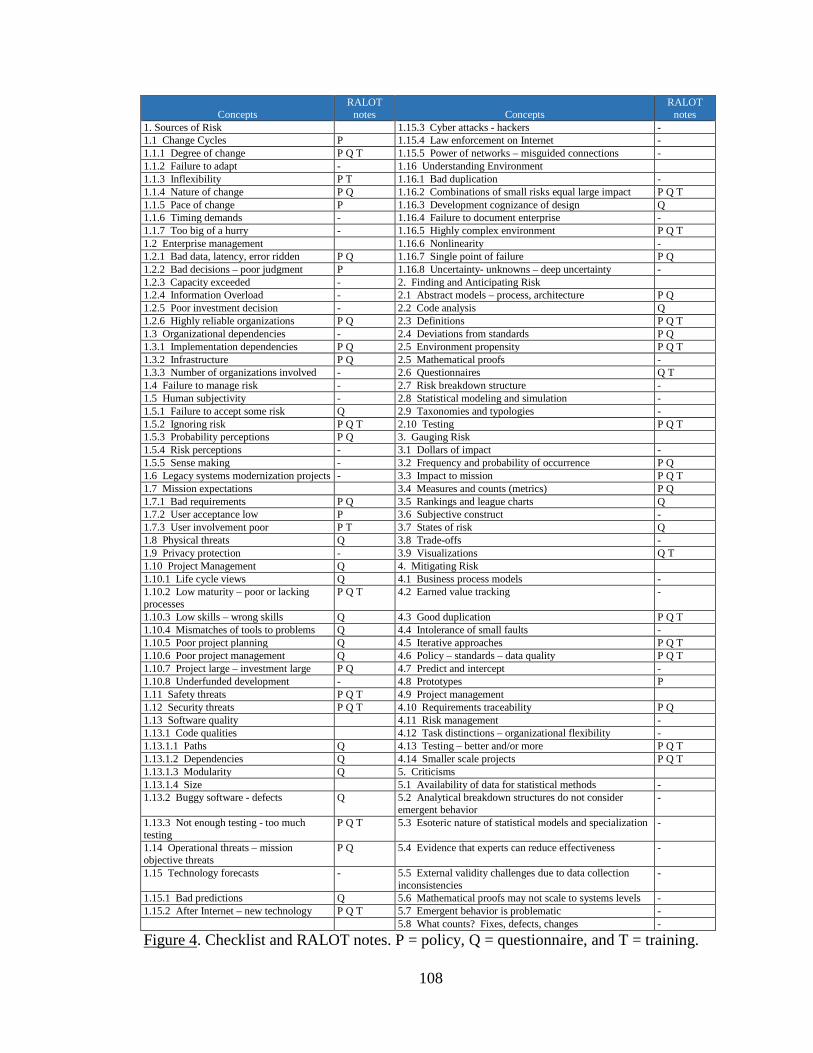
108
Concepts RALOT
notes Concepts RALOT
notes 1. Sources of Risk 1.15.3 Cyber attacks - hackers - 1.1 Change Cycles P 1.15.4 Law enforcement on Internet - 1.1.1 Degree of change P Q T 1.15.5 Power of networks – misguided connections - 1.1.2 Failure to adapt - 1.16 Understanding Environment 1.1.3 Inflexibility P T 1.16.1 Bad duplication - 1.1.4 Nature of change P Q 1.16.2 Combinations of small risks equal large impact P Q T 1.1.5 Pace of change P 1.16.3 Development cognizance of design Q 1.1.6 Timing demands - 1.16.4 Failure to document enterprise - 1.1.7 Too big of a hurry - 1.16.5 Highly complex environment P Q T 1.2 Enterprise management 1.16.6 Nonlinearity - 1.2.1 Bad data, latency, error ridden P Q 1.16.7 Single point of failure P Q 1.2.2 Bad decisions – poor judgment P 1.16.8 Uncertainty- unknowns – deep uncertainty - 1.2.3 Capacity exceeded - 2. Finding and Anticipating Risk 1.2.4 Information Overload - 2.1 Abstract models – process, architecture P Q 1.2.5 Poor investment decision - 2.2 Code analysis Q 1.2.6 Highly reliable organizations P Q 2.3 Definitions P Q T 1.3 Organizational dependencies - 2.4 Deviations from standards P Q 1.3.1 Implementation dependencies P Q 2.5 Environment propensity P Q T 1.3.2 Infrastructure P Q 2.5 Mathematical proofs - 1.3.3 Number of organizations involved - 2.6 Questionnaires Q T 1.4 Failure to manage risk - 2.7 Risk breakdown structure - 1.5 Human subjectivity - 2.8 Statistical modeling and simulation - 1.5.1 Failure to accept some risk Q 2.9 Taxonomies and typologies - 1.5.2 Ignoring risk P Q T 2.10 Testing P Q T 1.5.3 Probability perceptions P Q 3. Gauging Risk 1.5.4 Risk perceptions - 3.1 Dollars of impact - 1.5.5 Sense making - 3.2 Frequency and probability of occurrence P Q 1.6 Legacy systems modernization projects - 3.3 Impact to mission P Q T 1.7 Mission expectations 3.4 Measures and counts (metrics) P Q 1.7.1 Bad requirements P Q 3.5 Rankings and league charts Q 1.7.2 User acceptance low P 3.6 Subjective construct - 1.7.3 User involvement poor P T 3.7 States of risk Q 1.8 Physical threats Q 3.8 Trade-offs - 1.9 Privacy protection - 3.9 Visualizations Q T 1.10 Project Management Q 4. Mitigating Risk 1.10.1 Life cycle views Q 4.1 Business process models - 1.10.2 Low maturity – poor or lacking processes
P Q T 4.2 Earned value tracking -
1.10.3 Low skills – wrong skills Q 4.3 Good duplication P Q T 1.10.4 Mismatches of tools to problems Q 4.4 Intolerance of small faults - 1.10.5 Poor project planning Q 4.5 Iterative approaches P Q T 1.10.6 Poor project management Q 4.6 Policy – standards – data quality P Q T 1.10.7 Project large – investment large P Q 4.7 Predict and intercept - 1.10.8 Underfunded development - 4.8 Prototypes P 1.11 Safety threats P Q T 4.9 Project management 1.12 Security threats P Q T 4.10 Requirements traceability P Q 1.13 Software quality 4.11 Risk management - 1.13.1 Code qualities 4.12 Task distinctions – organizational flexibility - 1.13.1.1 Paths Q 4.13 Testing – better and/or more P Q T 1.13.1.2 Dependencies Q 4.14 Smaller scale projects P Q T 1.13.1.3 Modularity Q 5. Criticisms 1.13.1.4 Size 5.1 Availability of data for statistical methods - 1.13.2 Buggy software - defects Q 5.2 Analytical breakdown structures do not consider
emergent behavior -
1.13.3 Not enough testing - too much testing
P Q T 5.3 Esoteric nature of statistical models and specialization -
1.14 Operational threats – mission objective threats
P Q 5.4 Evidence that experts can reduce effectiveness -
1.15 Technology forecasts - 5.5 External validity challenges due to data collection inconsistencies
-
1.15.1 Bad predictions Q 5.6 Mathematical proofs may not scale to systems levels - 1.15.2 After Internet – new technology P Q T 5.7 Emergent behavior is problematic - 5.8 What counts? Fixes, defects, changes -
Figure 4. Checklist and RALOT notes. P = policy, Q = questionnaire, and T = training.
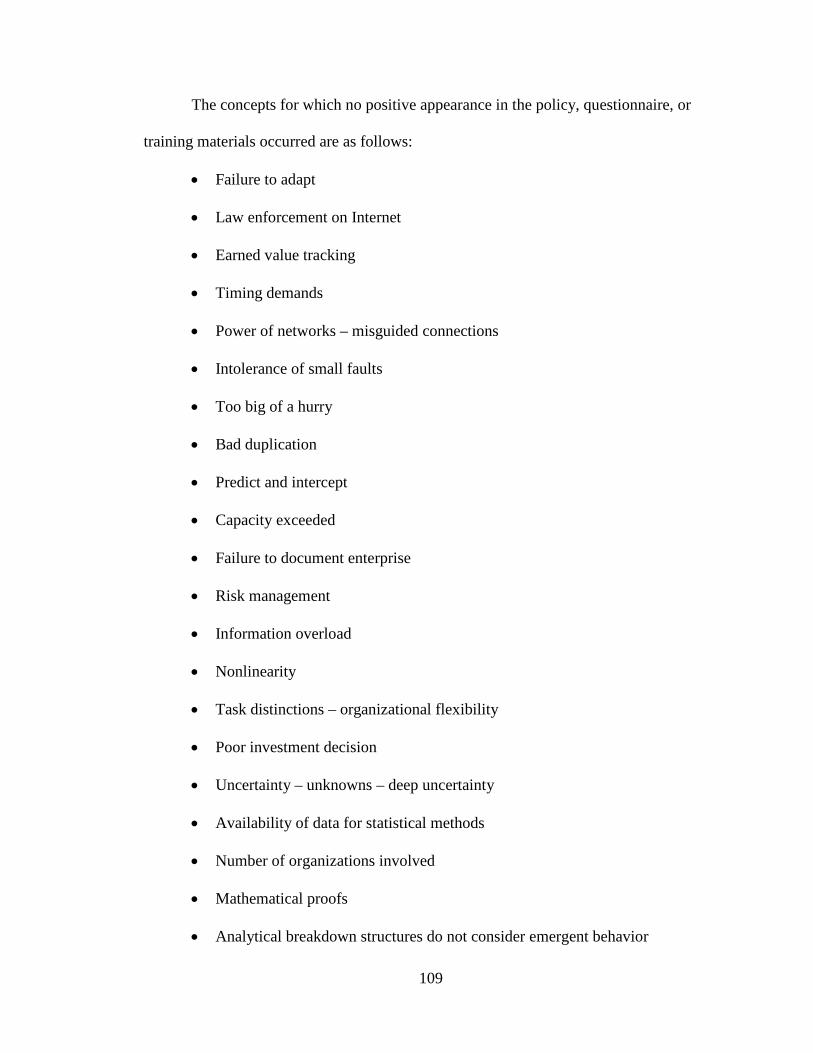
109
The concepts for which no positive appearance in the policy, questionnaire, or
training materials occurred are as follows:
• Failure to adapt
• Law enforcement on Internet
• Earned value tracking
• Timing demands
• Power of networks – misguided connections
• Intolerance of small faults
• Too big of a hurry
• Bad duplication
• Predict and intercept
• Capacity exceeded
• Failure to document enterprise
• Risk management
• Information overload
• Nonlinearity
• Task distinctions – organizational flexibility
• Poor investment decision
• Uncertainty – unknowns – deep uncertainty
• Availability of data for statistical methods
• Number of organizations involved
• Mathematical proofs
• Analytical breakdown structures do not consider emergent behavior
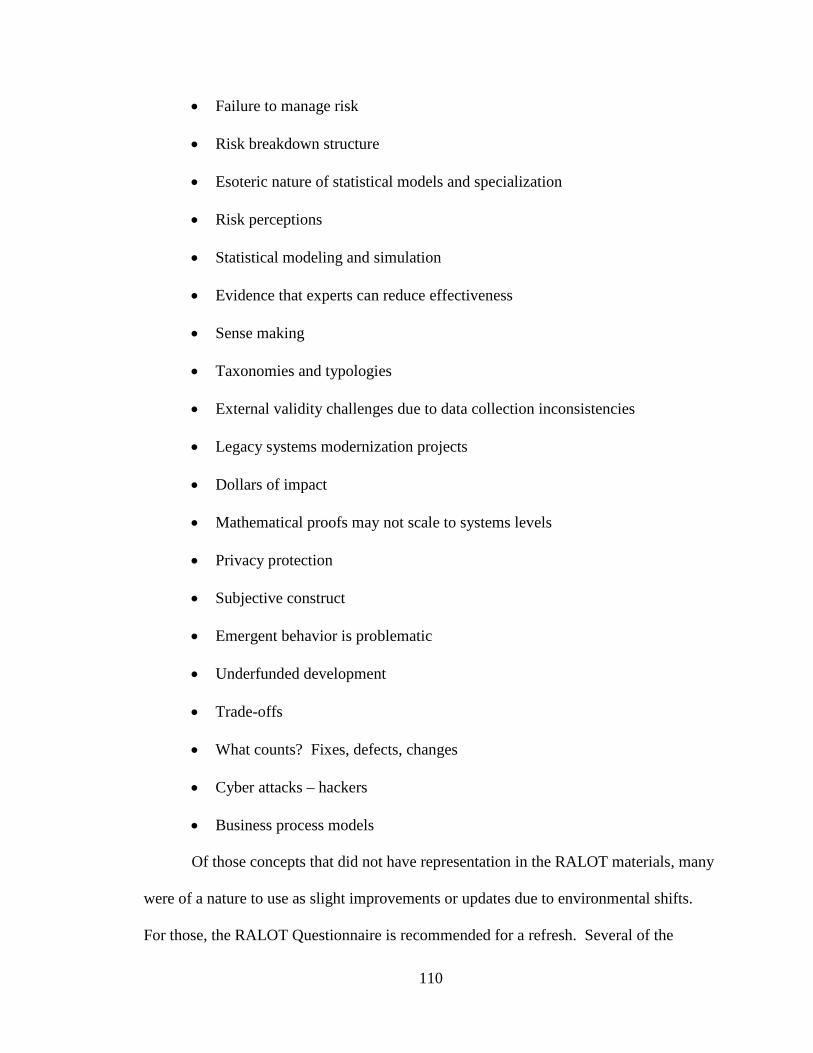
110
• Failure to manage risk
• Risk breakdown structure
• Esoteric nature of statistical models and specialization
• Risk perceptions
• Statistical modeling and simulation
• Evidence that experts can reduce effectiveness
• Sense making
• Taxonomies and typologies
• External validity challenges due to data collection inconsistencies
• Legacy systems modernization projects
• Dollars of impact
• Mathematical proofs may not scale to systems levels
• Privacy protection
• Subjective construct
• Emergent behavior is problematic
• Underfunded development
• Trade-offs
• What counts? Fixes, defects, changes
• Cyber attacks – hackers
• Business process models
Of those concepts that did not have representation in the RALOT materials, many
were of a nature to use as slight improvements or updates due to environmental shifts.
For those, the RALOT Questionnaire is recommended for a refresh. Several of the

111
concepts were too broad or soft to lead to anything prescriptive. None of the criticisms
were represented. Figure 5 includes the unrepresented concepts with a suggestion for
incorporating them into the set of RALOT materials. In fulfillment of coding that
highlights actionable areas of concern and potential for research, the coding was as
follows: F = further study, as these needed more specifics than this study allowed or
potentially exceeded the scope of an independent testing organization; Q =
questionnaire, as these could stimulate additional RALOT facilitator interview; P =
policy, as implementation would likely need leadership support or the item reflects an
enterprise concern (e.g., investment related); and T = training, as the means to convey the
concepts to RALOT facilitators.
A short list of practical recommendations flowed from several concepts that had
applicability to the responsibilities of USAF testing organizations and were coded as
recommendations (R). Those were as follows:
• Sensemaking (Powers et al., 2011)
• Statistical modeling and simulation
• Predict and intercept
• Availability of data for statistical methods
• Analytical breakdown structures do not consider emergent behavior
• Esoteric nature of statistical models and specialization
• Evidence that experts can reduce effectiveness
• External validity challenges due to data collection inconsistencies
• Emergent behavior is problematic
• What counts? Fixes, defects, changes

112
Question 2 Input F Bad duplication F Failure to adapt F Mathematical proofs F Mathematical proofs may not scale to systems levels F Non-linearity F Number of organizations involved F Poor investment decision F Risk perceptions F Subjective construct F Task distinctions- organizational flexibility F Taxonomies and typologies F Uncertainty – unknowns – deep uncertainty F, Q, T Information overload P Capacity exceeded P Dollars of impact P Earned value tracking P Failure to document enterprise P Failure to manage risk P Intolerance of small faults P Law enforcement on Internet P Legacy systems modernization projects P Power of networks – misguided connections P Risk breakdown structure P Risk management P Trade-offs P Underfunded development Q, T Business process models Q, T Cyber attacks - hackers Q, T Privacy protection Q, T Timing demands Q, T Too big of a hurry R Analytical breakdown structures don’t consider emergent behavior R Availability of data for statistical methods R Emergent behavior is problematic R Esoteric nature of statistical models and specialization R Evidence that experts can reduce effectiveness R External validity challenges due to data collection inconsistencies R Predict and intercept R Sensemaking R Statistical modeling and simulation R What counts? Fixes, defects, changes
Figure 5. Recommendations for concepts. F = further study, P = policy, Q = questionnaire, T = training, R = Recommended.
Sensemaking and statistical modeling and simulation were both sources of
practical application. The risk assessment technique for statistical modeling and
simulation recommended was the use of defect prediction (e.g., predict and intercept
concept; Fenton & Neil, 2013). This approach was within the means and responsibility

113
of an independent testing organization. Likewise, the precepts of lesson drawing add
credence to the likelihood that the team could be successful with either or both of these
suggestions, as addressed in the next paragraph.
Recall the summary of lesson drawing from Chapter 3, which included criticisms.
Rose (1993) provided a useful thought process for estimating the likelihood of a
workable outcome. Rose targeted large-scale programs of governments. While the
independent testing organization of a defense branch is arguably large scale, its context is
governmental and public administration. Rose’s approach appears to have value in this
instance, as this is a practical matter rather than a theoretical one, from whence the
criticism arises. Perhaps use in this paper serves as a contribution to research on the
specifics of the criticism, but it is not a purpose of the paper. Rose’s hypotheses (Rose,
1993, pp. 120-141) could aid in identifying the advantages and disadvantages of
attempting sensemaking or statistical modeling in the context of USAF software program
responsibilities. Figure 6 contains paraphrasing of Rose’s hypotheses repeated from
Chapter 3, along with advantages and disadvantages for using sensemaking and defect
prediction in the USAF setting.
The application of Rose’s (1993) lesson drawing in Figure 6 suggests a reason to
be optimistic and a reason to follow Rose’s advice “time turns obstacles into variables”
(p. 143), which is encouragement for any practitioner of process improvement. The
advantages, if perhaps superficial, do tend to emerge as a reason to be optimistic, while
the disadvantages tend to suggest Rose’s variables or simple unknowns.
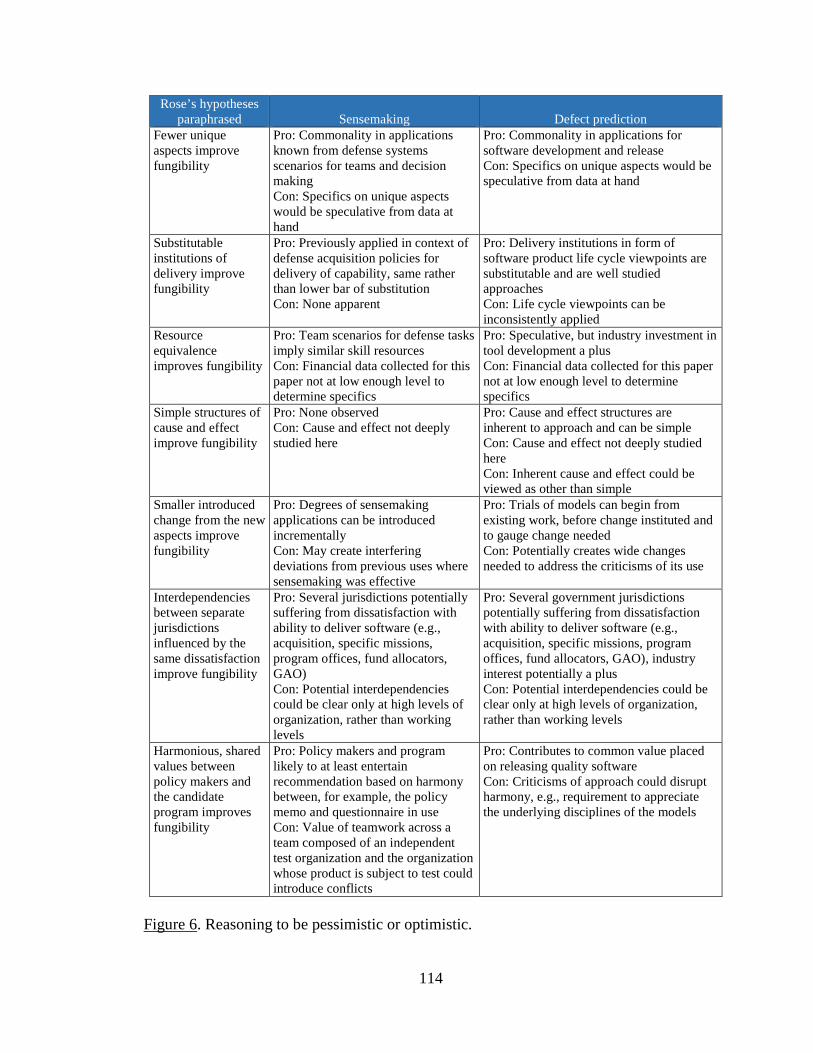
114
Rose’s hypotheses paraphrased Sensemaking Defect prediction
Fewer unique aspects improve fungibility
Pro: Commonality in applications known from defense systems scenarios for teams and decision making Con: Specifics on unique aspects would be speculative from data at hand
Pro: Commonality in applications for software development and release Con: Specifics on unique aspects would be speculative from data at hand
Substitutable institutions of delivery improve fungibility
Pro: Previously applied in context of defense acquisition policies for delivery of capability, same rather than lower bar of substitution Con: None apparent
Pro: Delivery institutions in form of software product life cycle viewpoints are substitutable and are well studied approaches Con: Life cycle viewpoints can be inconsistently applied
Resource equivalence improves fungibility
Pro: Team scenarios for defense tasks imply similar skill resources Con: Financial data collected for this paper not at low enough level to determine specifics
Pro: Speculative, but industry investment in tool development a plus Con: Financial data collected for this paper not at low enough level to determine specifics
Simple structures of cause and effect improve fungibility
Pro: None observed Con: Cause and effect not deeply studied here
Pro: Cause and effect structures are inherent to approach and can be simple Con: Cause and effect not deeply studied here Con: Inherent cause and effect could be viewed as other than simple
Smaller introduced change from the new aspects improve fungibility
Pro: Degrees of sensemaking applications can be introduced incrementally Con: May create interfering deviations from previous uses where sensemaking was effective
Pro: Trials of models can begin from existing work, before change instituted and to gauge change needed Con: Potentially creates wide changes needed to address the criticisms of its use
Interdependencies between separate jurisdictions influenced by the same dissatisfaction improve fungibility
Pro: Several jurisdictions potentially suffering from dissatisfaction with ability to deliver software (e.g., acquisition, specific missions, program offices, fund allocators, GAO) Con: Potential interdependencies could be clear only at high levels of organization, rather than working levels
Pro: Several government jurisdictions potentially suffering from dissatisfaction with ability to deliver software (e.g., acquisition, specific missions, program offices, fund allocators, GAO), industry interest potentially a plus Con: Potential interdependencies could be clear only at high levels of organization, rather than working levels
Harmonious, shared values between policy makers and the candidate program improves fungibility
Pro: Policy makers and program likely to at least entertain recommendation based on harmony between, for example, the policy memo and questionnaire in use Con: Value of teamwork across a team composed of an independent test organization and the organization whose product is subject to test could introduce conflicts
Pro: Contributes to common value placed on releasing quality software Con: Criticisms of approach could disrupt harmony, e.g., requirement to appreciate the underlying disciplines of the models
Figure 6. Reasoning to be pessimistic or optimistic.
115
Figure 6 also highlighted that studies on the order of disciplined cost–benefit
analysis would be one way to improve the selection (note for resource equivalence, no
data are available from this study). A highly encouraging observation is that inspired by
smaller introduced change. The models available through Fenton and Neil’s (2013) work
with the Agena product allow experimentation with very low investment and little threat,
because experiment results can inform implementation decisions. For that reason, in
answer to Question 2, Question 3 was scoped to defect prediction using Fenton and
Neil’s Bayesian network applications. See also the advantages for such an approach from
Misirli and Bener (2014, p. 533) in Chapter 3.

116
Chapter 8: Question 3
Question 3 was as follows: Can initial versions of specific improvements to
RALOT be constructed from the results of the analysis? From Chapter 7, a promising
suggestion for improvement emerged with Fenton and Neil’s (2013) Bayesian network
applications. This chapter will be used to capture the effort of constructing an initial
Bayesian network model by using Agena software and its out-of-the-box applications.
To the extent practical, the generalized scenario of the RALOT approach will be used as
context for construction of the model’s parameters. Chapter 3 contained the RALOT
background. The data that Agena includes will be used as a starting point for a trial run.
The software used was AgenaRisk Lite Version 6.1 Revision 1859 (Agena, 2015).
The out-of-the-box solution and model for software defect prediction was discussed in
Fenton and Neil (2013, pp. 395-405). The Bayesian network model is illustrated in
Figure 7. This model is useful for estimating residual defects, a metric that could be
input to a decision to declare whether or not testing has been sufficient and release is
warranted. A comparison of a residual defect metric to other decision inputs which
include that all tests have been executed (were they the right tests?), time and money for
testing have been exhausted (should more resources be sought?), and no serious
(detected) defects remain unmitigated (mitigate lesser but known defects as well?) aids
the thought process. Residual defects are those found in operations by users, which is the
least desirable way to discover them (Fenton & Neil, 2013, p. 395). Adding an estimate
for residual defects improves the decision maker’s position, when considering the

117
shortcomings of other decision inputs and effort to improve on those shortcomings. In
the context of the RALOT model, at the completion of a Level I test, the estimate of a
high number of residual defects could bolster the case that additional testing is warranted.
Such additional testing would require justification for funding and schedule delay,
supportable with the modeling effort. This potentially leads to additional understanding
of newly detected defects and detected but unmitigated defects. Roll-out plans could be
adjusted as well, to smaller releases, to accommodate the criticism that only fielding
software tells all about how it will behave in its intended environment.
Note that Figure 7 includes captions for the logic of cause and effect among the
nodes and relationships to the RALOT scenario. For this model, the cause and effect
relationships are intuitive to software professionals, which is an answer to criticism that
these models could be difficult to understand (Fenton & Neil, 2013, p. 404). For
example, see also points from Rose (1993) and Raadschelders and Lee (2011). The
researcher accepted that residual defects are a function of the total defects inserted during
development less the total removed during testing. Likewise, design process quality and
problem complexity can naturally be expected to affect total occurrence of defects.
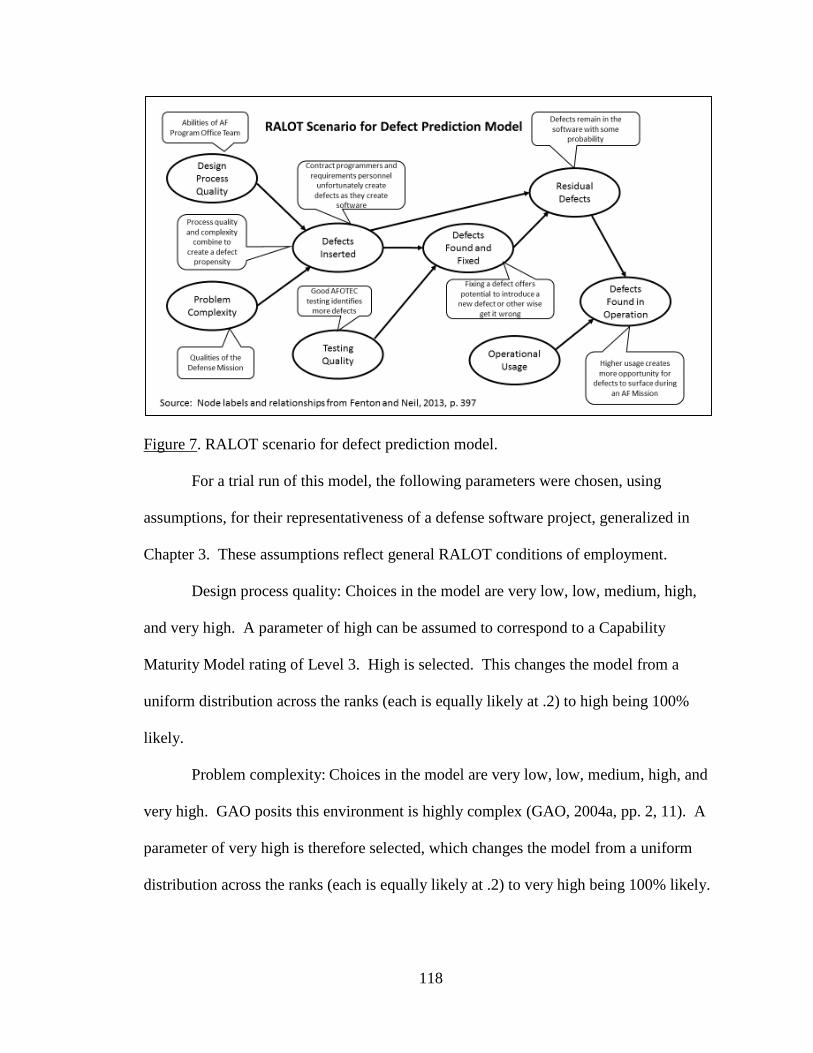
118
Figure 7. RALOT scenario for defect prediction model.
For a trial run of this model, the following parameters were chosen, using
assumptions, for their representativeness of a defense software project, generalized in
Chapter 3. These assumptions reflect general RALOT conditions of employment.
Design process quality: Choices in the model are very low, low, medium, high,
and very high. A parameter of high can be assumed to correspond to a Capability
Maturity Model rating of Level 3. High is selected. This changes the model from a
uniform distribution across the ranks (each is equally likely at .2) to high being 100%
likely.
Problem complexity: Choices in the model are very low, low, medium, high, and
very high. GAO posits this environment is highly complex (GAO, 2004a, pp. 2, 11). A
parameter of very high is therefore selected, which changes the model from a uniform
distribution across the ranks (each is equally likely at .2) to very high being 100% likely.
119
Defects inserted: This parameter is left to be calculated by the model. The
calculation will be performed using a truncated normal distribution, where the range is 0
to 500 defects. The mean is equal to the value of complexity x (1 - value of design) × 90.
The variance is provided by the model at 300. These values are taken from the model’s
internal data and would need to be recalibrated.
Testing quality: Choices in the model are very low, low, medium, high, and very
high. AFOTEC and related test organizations are assumed to be world-class testing
organizations; therefore, very high is chosen. This changes the model from a uniform
distribution across the ranks (each is equally likely at .2) to very high being 100% likely.
Defects found and fixed: This parameter is left to be calculated by the model. It is
a binomial distribution with number of trials represented by defects inserted and
probability of success represented by testing quality.
Residual defects: Also left to be calculated by the model, residual defects are
represented by which ever number is higher, zero or the difference in defects inserted and
defects found (including those fixed).
Operational use: Choices in the model are very low, low, medium, high, and very
high. For these purposes, very high is chosen, reflecting the assumption that the software
is critical to a fast-paced defense application. This changes the model from a uniform
distribution across the ranks (each is equally likely at .2) to very high being 100% likely.
Defects found in operation: This parameter is left to be calculated by the model.
It is a binomial distribution with number of trials represented by residual defects and
probability of success represented by operational use.
120
The properties of the nodes are located in the software by right clicking on the
node graph and selecting “properties.” The definitions of the nodes provided above came
from the software defect prediction model under node properties.
The run of the model with the parameters set as described above provides a mean
value, or expected value, for those parameters identified as left to the model to calculate.
Those to be calculated by the model were defects inserted, defects found in testing,
residual defects, and defects found in operations.
Figure 8 shows the graphical output of the run described above. The nodes, as
illustrated in Figure 7, are now shown including output from AgenaRisk software. The
nodes for design process quality, complexity, testing quality, and operations use reflect
the assumed value rather than the uniform probability. The nodes for defects inserted,
defects found in testing, residual defects, and defects found in operations now reflect
graphs of the generated statistics. The statistics associated with each calculated node
were exported and are provided in Tables 2 through 5.
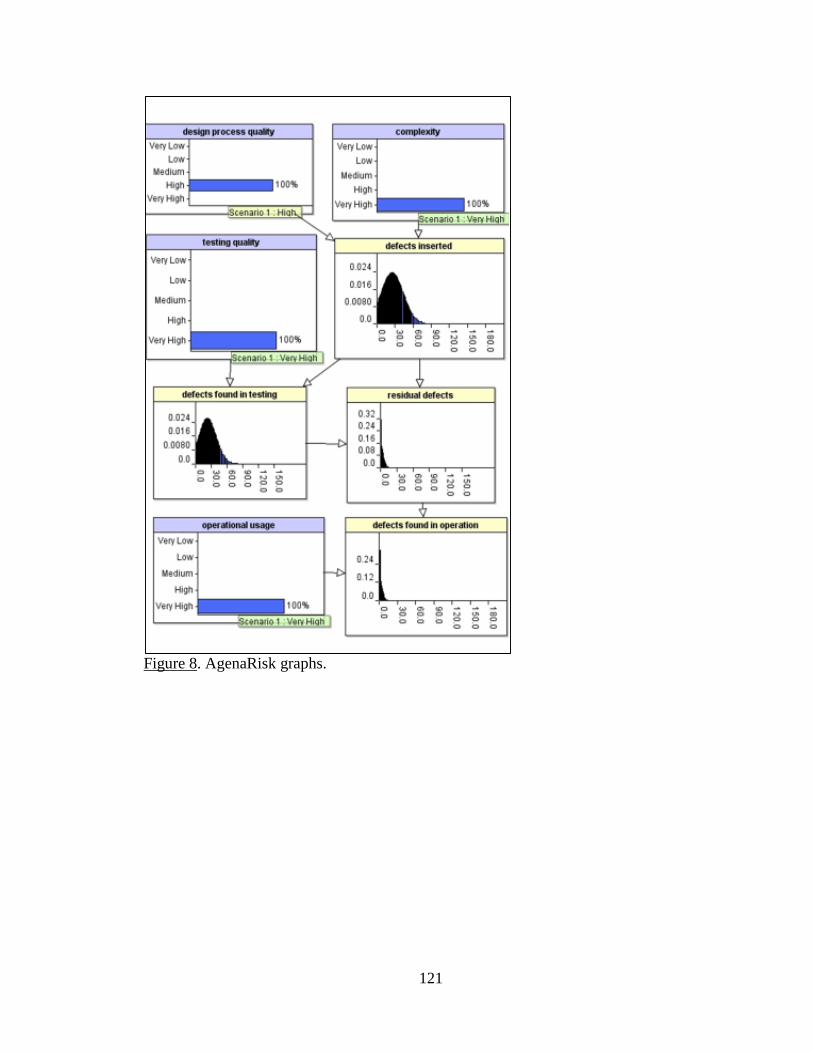
121
Figure 8. AgenaRisk graphs.

122
Table 2
Output of Risk Graph Values for Defects Inserted
Lower bound Upper bound Value 0 0.010249034 1 0.010987646 2 0.01174407 3 0.012514871 4 0.01329626 5 0.014084116 6 0.014874013 7 0.015661264 8 0.01644095 9 0.017207984 10 0.017957149 11 0.018683169 12 0.019380759 13 0.020044694 14 0.020669864 15 0.02125136 16 0.021784512 17 0.022264963 18 0.022688739 19 0.023052281 20 0.023352511 21 0.023586871 22 0.023753354 23 0.02385054 24 0.023877613 25 0.023834368 26 0.02372122 27 0.023539195 28 0.023289911 29 0.022975562 30 0.022598879 31 0.022163091 32 0.021671882 33 0.021129344 34 0.02053991 35 0.019908298 36 0.019239457 37 0.018538496 38 0.017810613 39 0.017061051 40 0.01629502 41 42 0.030251555 43 0.013948617 44 0.013166323 45 0.012391319 46 0.011627585 47 0.010878768 48 0.01014816 49 0.009438685 50 0.008752886

123
Table 2 (continued) Lower bound Upper bound Value
51 0.008092931 52 0.007460604 53 0.006857327 54 0.00628416 55 0.005741825 56 58 0.014284071 59 0.003884551 60 62 0.009443692 63 65 0.006710519 66 67 0.003287827 68 73 0.005940703 74 78 0.002206121 79 89 0.001434948 90 99 1.72E-04 100 101 7.78E-06 102 500 1.24E-05 Risk object Software defect prediction Node name Defects inserted Node ID d_in Summary statistics Mean 27.27753872 Median 26 Variance 246.9261988 Standard deviation 15.71388554 Lower percentile [25.0] 15 Upper percentile [75.0] 38
Table 3
Output of Risk Graph Values for Defects Found in Testing
Lower bound Upper bound Value 0 0.011562558 1 0.012497193 2 0.013455066 3 0.014430293 4 0.015416353 5 0.016406171 6 0.017392196 7 0.018366482 8 0.019320793 9 0.020246744 10 0.021135909 11 0.021979934 12 0.02277069 13 0.023500431 14 0.024161873 15 0.024748357 16 0.025253938 17 0.025673496

124
Table 3 (continued) Lower bound Upper bound Value
18 0.026002854 19 0.026238784 20 0.026379121 21 0.026422769 22 0.026369695 23 0.026220938 24 0.025978586 25 0.025645727 26 0.025226325 27 0.024725197 28 0.024147928 29 0.023500746 30 0.022790529 31 0.022024682 32 0.021211028 33 0.020357549 34 0.019472135 35 0.018562416 36 0.017635597 37 0.016698563 38 0.015758507 39 0.014823889 40 0.013902863 41 0.012918025 42 0.01217768 43 0.011221072 44 0.010381669 45 0.009574448 46 47 0.01686931 48 0.007370454 49 0.00671314 50 51 0.011612198 52 54 0.013476014 55 0.00360472 56 59 0.010853223 60 62 0.005243097 63 67 0.005107357 68 78 0.003754735 79 99 6.96E-04 100 101 1.66E-06 102 999 9.96E-06 Risk object Software defect prediction Node name Defects found in testing Node ID d_test Summary statistics Mean 24.56547505 Median 23 Variance 210.4950043 Standard deviation 14.50844596 Lower percentile [25.0] 14 Upper percentile [75.0] 34

125
Table 4
Output of Risk Graph Values for Residual Defects
Lower bound Upper bound Value 0 0.318698557 1 0.144505085 2 0.124374353 3 0.099356242 4 0.07895764 5 0.06208117 6 0.04776736 7 0.035727807 8 0.026536329 9 0.019819917 10 12 0.029658267 13 0.004427112 14 15 0.0046622 16 0.001224273 17 22 0.002034443 23 33 1.57E-04 34 45 1.10E-06 46 55 3.09E-07 56 78 7.11E-07 79 99 6.49E-07 100 101 6.18E-08 102 999 9.32E-06 Risk object Software defect prediction Node name Residual defects
Node ID Residual Summary statistics
Mean 2.765280375 Median 2 Variance 12.8405074 Standard deviation 3.583365373 Lower percentile [25.0] 0 Upper percentile [75.0] 4
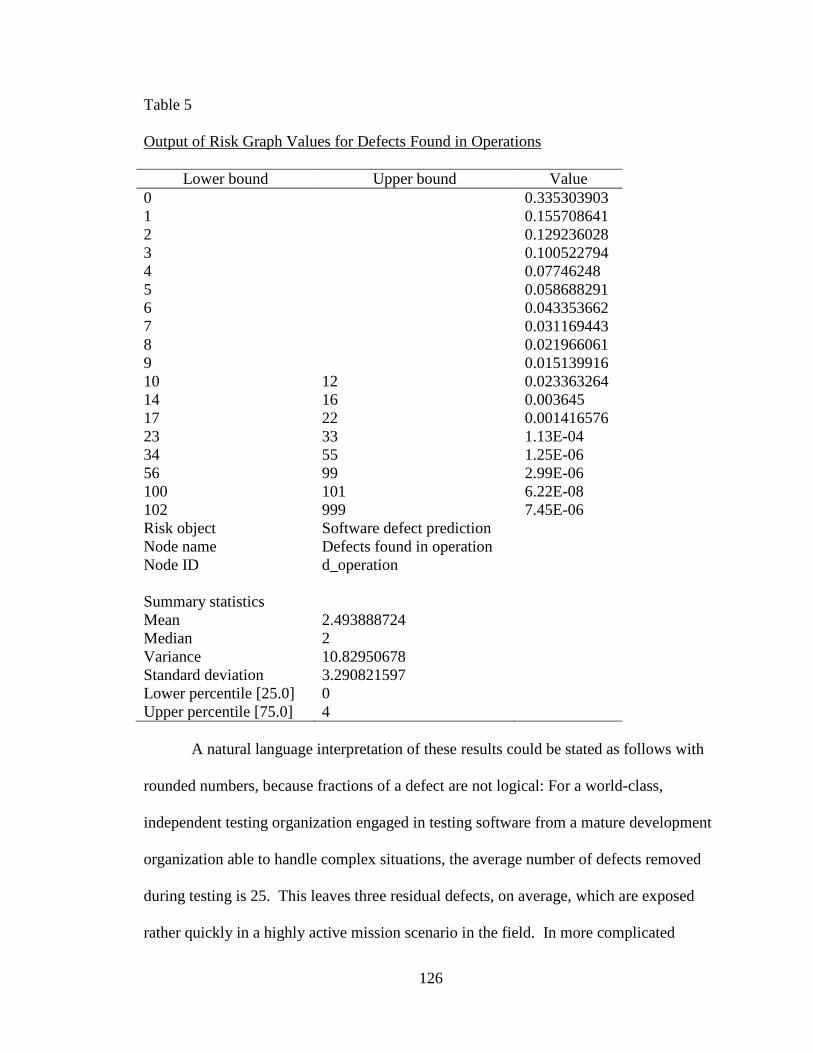
126
Table 5
Output of Risk Graph Values for Defects Found in Operations
Lower bound Upper bound Value 0 0.335303903 1 0.155708641 2 0.129236028 3 0.100522794 4 0.07746248 5 0.058688291 6 0.043353662 7 0.031169443 8 0.021966061 9 0.015139916 10 12 0.023363264 14 16 0.003645 17 22 0.001416576 23 33 1.13E-04 34 55 1.25E-06 56 99 2.99E-06 100 101 6.22E-08 102 999 7.45E-06 Risk object Software defect prediction Node name Defects found in operation Node ID d_operation Summary statistics Mean 2.493888724 Median 2 Variance 10.82950678 Standard deviation 3.290821597 Lower percentile [25.0] 0 Upper percentile [75.0] 4
A natural language interpretation of these results could be stated as follows with
rounded numbers, because fractions of a defect are not logical: For a world-class,
independent testing organization engaged in testing software from a mature development
organization able to handle complex situations, the average number of defects removed
during testing is 25. This leaves three residual defects, on average, which are exposed
rather quickly in a highly active mission scenario in the field. In more complicated
127
versions of the model, estimations of the probability of finding a defect and the overall
efficacy of testing are possible, because a series of tests can be accounted for, rather than
treating testing in the aggregate (Fenton & Neil, 2013, pp. 401-404). In other runs of the
model, Fenton and Neil (2013) were able to demonstrate why a popular myth about
defect proneness of a software component should be challenged. Fenton and Neil
provided a training scenario with the software development and test data accumulated
that illustrates that a prerelease unit of software that was found to be relatively bug free is
quite buggy once introduced to operations. This is counter to the idea that a unit that is
prone to defects stays prone to defects, which means the rate of defects surfacing would
be more consistent. Cataldo et al. (2009) noted that software with poorly understood
dependencies is defect prone, as mentioned in Chapter 3.
As the initial model above demonstrates, methods that have potential to improve
the RALOT process are available and can begin with limited commitment. There remain
criticisms, however, to address for using this kind of approach. The criticisms were
introduced in Questions 1 and 2, having been compiled from Chapter 3. The criticisms
are as follows:
• Availability of data for statistical methods.
• External validity challenges due to data collection inconsistencies.
• Analytical breakdown structures do not consider emergent behavior.
• Emergent behavior is problematic.
• Esoteric nature of statistical models and specialization.
• Evidence that experts can reduce effectiveness.
• What counts? Fixes, defects, changes.
128
These constitute the basis for challenges (or obstacles, using Rose’s vocabulary)
that would need to be addressed or considered long term in a trade-off of implications.
Chapter 9 includes a discussion of how these challenges may influence an attempt to
introduce a Fenton & Neil (2013) Bayesian network model to the testing or project
management tool kit of software development and delivery.
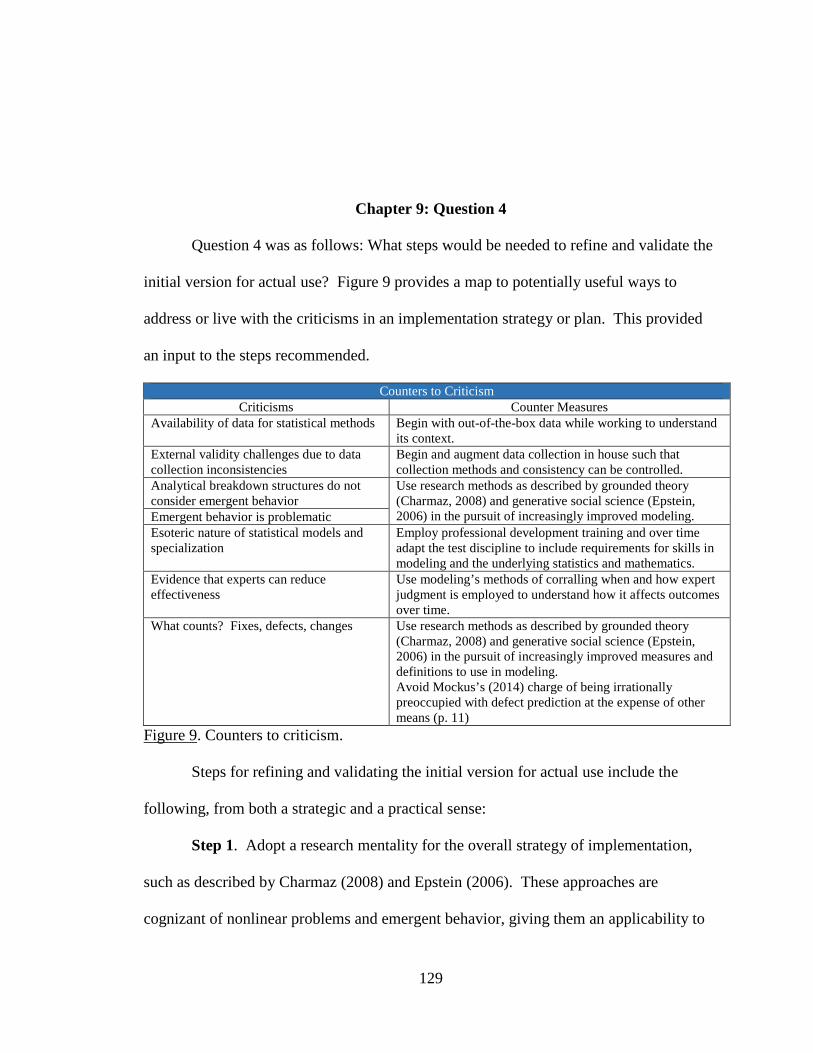
129
Chapter 9: Question 4
Question 4 was as follows: What steps would be needed to refine and validate the
initial version for actual use? Figure 9 provides a map to potentially useful ways to
address or live with the criticisms in an implementation strategy or plan. This provided
an input to the steps recommended.
Counters to Criticism Criticisms Counter Measures
Availability of data for statistical methods Begin with out-of-the-box data while working to understand its context.
External validity challenges due to data collection inconsistencies
Begin and augment data collection in house such that collection methods and consistency can be controlled.
Analytical breakdown structures do not consider emergent behavior
Use research methods as described by grounded theory (Charmaz, 2008) and generative social science (Epstein, 2006) in the pursuit of increasingly improved modeling. Emergent behavior is problematic
Esoteric nature of statistical models and specialization
Employ professional development training and over time adapt the test discipline to include requirements for skills in modeling and the underlying statistics and mathematics.
Evidence that experts can reduce effectiveness
Use modeling’s methods of corralling when and how expert judgment is employed to understand how it affects outcomes over time.
What counts? Fixes, defects, changes Use research methods as described by grounded theory (Charmaz, 2008) and generative social science (Epstein, 2006) in the pursuit of increasingly improved measures and definitions to use in modeling. Avoid Mockus’s (2014) charge of being irrationally preoccupied with defect prediction at the expense of other means (p. 11)
Figure 9. Counters to criticism.
Steps for refining and validating the initial version for actual use include the
following, from both a strategic and a practical sense:
Step 1. Adopt a research mentality for the overall strategy of implementation,
such as described by Charmaz (2008) and Epstein (2006). These approaches are
cognizant of nonlinear problems and emergent behavior, giving them an applicability to
130
software development, test, and release scenarios in public administration. Sensemaking
also may contribute practical team building to this mentality (Burns, 2014, p. 6).
Step 2. Select a small number of testing professionals to participate in a pilot
project employing the out-of-the-box model. This step could be expanded to include a
search for other vendors that supply such software. Scope the pilot project such that the
objective is a recommendation for a software product that builds and executes models
and a timeline for its rollout.
Step 3. Add modeling as a topic in professional training for testers and
development personnel. Interest can be generated by the abilities of the out-of-the-box
model, such as manipulated in Chapter 8, to entertain multiple scenarios of quality in
process and feeder parameters, including the distributions associated with defect insertion
during development. Model executions can be quite engaging when challenging beliefs
about defects and their occurrences, display the relative impacts of the quality of
development practice and complexity of the environment, expose the potential of
judgment errors, and provide other insights.
Step 4. Examine existing metrics programs for their harmony with modeling
projects. Existing test data, prepared in house, can be a baseline upon which to build a
consistent approach to the measures needed to address criticism and produce valid
models. The formal test procedures of AFOTEC and related organizations may be
conducive to standard data collecting.
Step 5. Prepare management plans for resources. Although the excursion
described in this study was not a great consumer of resources and a version of the
software comes with the Fenton & Neil (2013) book, an organizational commitment

131
would be another matter. More powerful versions of modeling software can be expected
to cost more and perhaps drive a need for engaging consultants. Likewise, the staff
would require training and having an added skill could affect wages long term. A cost–
benefit analysis may be appropriate. Execution of Steps 2 through 4, above, can provide
information to substantiate management plans.
Step 6. Choose an upcoming test event and contact the development program
office about the potential of being the first to employ a model for decision-making
purposes. It can be argued that confidence in a release decision will be improved. The
first such use will further enlighten plans for organization-wide implementations, as well
as provide inputs for changes to policy and instruments such as the existing RALOT
questionnaire, as suggested in Question 2.
Step 7. Roll out the modeling capability to additional programs incrementally.
Step 8. Plan to revisit progress and place recurring evaluations into the overall
practice plans. These evaluations can be part of a process maturity practice (see Chapter
3) already in place for developers or test organizations. Additionally, the mind-sets of
grounded theory, generative social science, and sensemaking would likely lead to
periodic or otherwise reoccurring evaluations and feedback.
The initial version of the model presented in Chapter 8 demonstrated that a
specific improvement recommendation could come out of the research and analysis
contained in this paper. This improvement could supplement existing practice.
132
Chapter 10: Summary and Conclusions
The overall conclusion of this research is that the RALOT model can be improved
based on the application of the concepts identified here and the availability of modeling
software designed specifically for software development applications, such as defect
prediction. The literature review provides context, history, and theoretic connections to
risk assessment in the development of software in public administration venues and how
it feeds decisions for testing formality and, ultimately, for decisions regarding the
readiness of software for release. A forecast of defects and associated probabilities,
potentially able to pinpoint discrete software modules within a system, is a decision input
that can only be captured in the RALOT approach through expert judgment using the
existing questionnaire approach. As seen in the literature, some methods have been
impugned by studies concluding that expert inputs actually contributed to less reliability.
With modeling, expert judgment can be isolated and examined for ways to improve or
make its insertion into a decision more explicit. The node characteristics of a Bayesian
network model allow the explicit expression of judgment compared to the existing
method in RALOT, which encourages judgment in the final choice of testing formality as
an umbrella function with an overriding authority rather than as a component function.
There is no call here to eliminate expert judgment, but the results of this study indicated
that it could be better understood. These results can supplement existing practice.
This research potentially benefits the field of software development in public
venues by extending research results from the field of software development and
133
engineering into the research domain of public administration and vice versa. This
research integrates literature in PA and public policy with computational and information
systems literature through the identification of risk assessment improvements that benefit
both; allowing one to inform the other and providing a means for fitting public policy risk
management concerns into information technology models. The intersection of an
administrative task of understanding and decision making with the engineering concerns
of software quality and process exposed the potential for improved efficacy by growing
the use and performance of models and their application in risk taking. It also highlights
criticisms that can be used to identify ways to prevent or overcome the resulting pitfalls.
Public administration topics crosscut and appear throughout the development and release
of software, including the implementation of policy such as DODI 5000.02 during the
acquisition of IT, the myriad of decision-making situations in allocating resources such as
for testing formalities and quality processes, the accountability to taxpayers and media
spotlight of failures, basic project management, and risk management. This list is not
complete without considering the organizations that participate in developing and testing
IT and the complexity of the overall defense environment. A benefit of this research was
derived from the attempt to draw on the software development and public administration
literature with an open aperture for these topics related to what is essentially an
engineering problem.
Future Research
Future research suggestions include implementing and calibrating Fenton and
Neil’s (2013) model with Air-Force-specific data and employing the research
methodologies associated with grounded theory and generative social science (Charmaz,

134
2008; Epstein, 2006). This dissertation also revealed the need for further research
employing a long-term view of the potential of modeling to represent what otherwise
may fall prey to a classic and perhaps defeatist definition of emergent behavior. The
emergent approaches, grounded theory and generative social science, can potentially
contribute to continuous improvement in risk assessment and consequently the use of risk
assessment outcomes in decision making for software releases and testing formalities.
This can reasonably be expected to improve overall accuracy in risk assessment, the
identification of residual risk, and the efficient allocation of resources, as well as affect
policy.
In Figure 5, some topics received a code for further study (F) and are addressed in
some modest way only, by this research. Those topics include non-linearity and
uncertainty. Some additional topics arose in the ways to follow through with the initial
defect prevention model in Figure 7, as discussed in the previous paragraph. The
complete list of 13 topics coded for further study was as follows, but this list can be
improved upon:
• Bad duplication
• Failure to adapt
• Mathematical proofs
• Mathematical proofs may not scale to systems levels
• Non-linearity
• Number of organizations involved
• Poor investment decision
• Risk perceptions
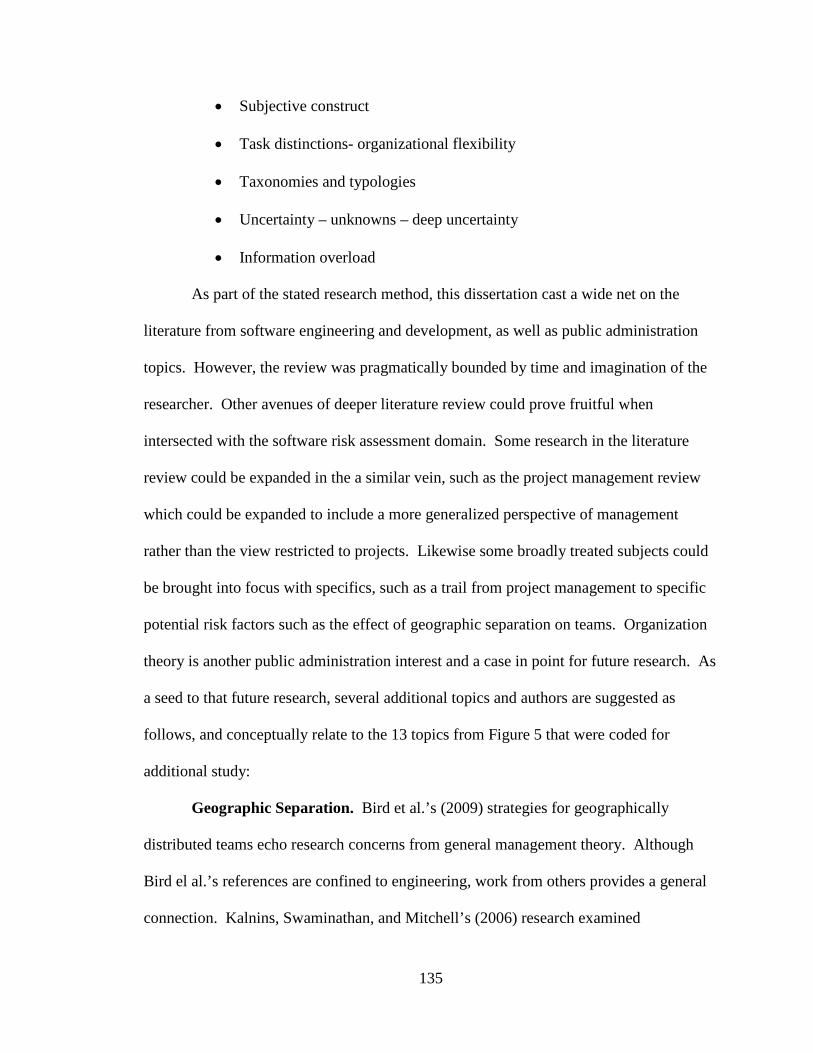
135
• Subjective construct
• Task distinctions- organizational flexibility
• Taxonomies and typologies
• Uncertainty – unknowns – deep uncertainty
• Information overload
As part of the stated research method, this dissertation cast a wide net on the
literature from software engineering and development, as well as public administration
topics. However, the review was pragmatically bounded by time and imagination of the
researcher. Other avenues of deeper literature review could prove fruitful when
intersected with the software risk assessment domain. Some research in the literature
review could be expanded in the a similar vein, such as the project management review
which could be expanded to include a more generalized perspective of management
rather than the view restricted to projects. Likewise some broadly treated subjects could
be brought into focus with specifics, such as a trail from project management to specific
potential risk factors such as the effect of geographic separation on teams. Organization
theory is another public administration interest and a case in point for future research. As
a seed to that future research, several additional topics and authors are suggested as
follows, and conceptually relate to the 13 topics from Figure 5 that were coded for
additional study:
Geographic Separation. Bird et al.’s (2009) strategies for geographically
distributed teams echo research concerns from general management theory. Although
Bird el al.’s references are confined to engineering, work from others provides a general
connection. Kalnins, Swaminathan, and Mitchell’s (2006) research examined
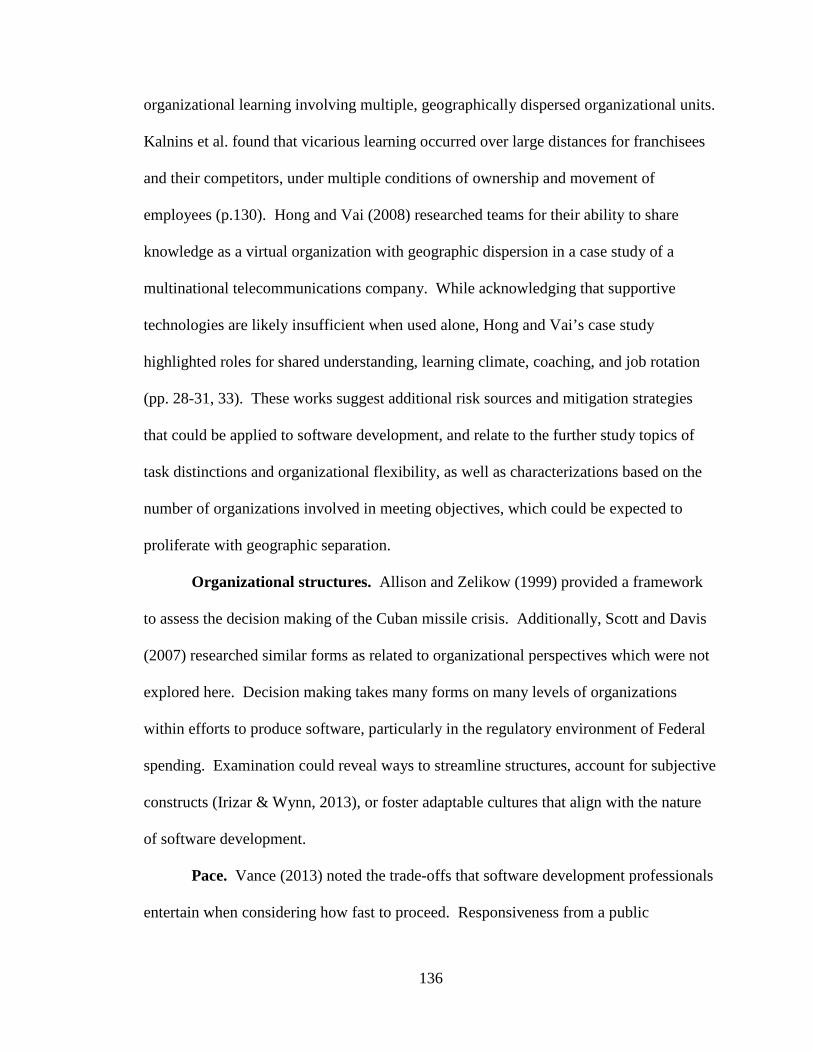
136
organizational learning involving multiple, geographically dispersed organizational units.
Kalnins et al. found that vicarious learning occurred over large distances for franchisees
and their competitors, under multiple conditions of ownership and movement of
employees (p.130). Hong and Vai (2008) researched teams for their ability to share
knowledge as a virtual organization with geographic dispersion in a case study of a
multinational telecommunications company. While acknowledging that supportive
technologies are likely insufficient when used alone, Hong and Vai’s case study
highlighted roles for shared understanding, learning climate, coaching, and job rotation
(pp. 28-31, 33). These works suggest additional risk sources and mitigation strategies
that could be applied to software development, and relate to the further study topics of
task distinctions and organizational flexibility, as well as characterizations based on the
number of organizations involved in meeting objectives, which could be expected to
proliferate with geographic separation.
Organizational structures. Allison and Zelikow (1999) provided a framework
to assess the decision making of the Cuban missile crisis. Additionally, Scott and Davis
(2007) researched similar forms as related to organizational perspectives which were not
explored here. Decision making takes many forms on many levels of organizations
within efforts to produce software, particularly in the regulatory environment of Federal
spending. Examination could reveal ways to streamline structures, account for subjective
constructs (Irizar & Wynn, 2013), or foster adaptable cultures that align with the nature
of software development.
Pace. Vance (2013) noted the trade-offs that software development professionals
entertain when considering how fast to proceed. Responsiveness from a public
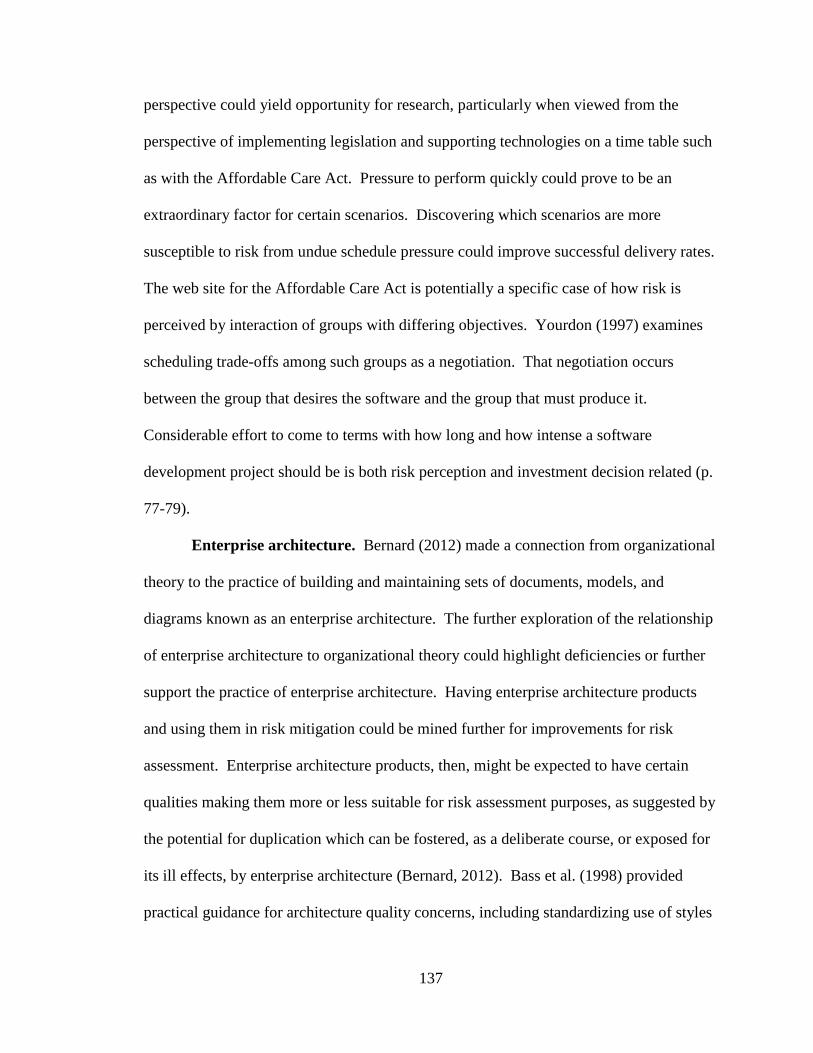
137
perspective could yield opportunity for research, particularly when viewed from the
perspective of implementing legislation and supporting technologies on a time table such
as with the Affordable Care Act. Pressure to perform quickly could prove to be an
extraordinary factor for certain scenarios. Discovering which scenarios are more
susceptible to risk from undue schedule pressure could improve successful delivery rates.
The web site for the Affordable Care Act is potentially a specific case of how risk is
perceived by interaction of groups with differing objectives. Yourdon (1997) examines
scheduling trade-offs among such groups as a negotiation. That negotiation occurs
between the group that desires the software and the group that must produce it.
Considerable effort to come to terms with how long and how intense a software
development project should be is both risk perception and investment decision related (p.
77-79).
Enterprise architecture. Bernard (2012) made a connection from organizational
theory to the practice of building and maintaining sets of documents, models, and
diagrams known as an enterprise architecture. The further exploration of the relationship
of enterprise architecture to organizational theory could highlight deficiencies or further
support the practice of enterprise architecture. Having enterprise architecture products
and using them in risk mitigation could be mined further for improvements for risk
assessment. Enterprise architecture products, then, might be expected to have certain
qualities making them more or less suitable for risk assessment purposes, as suggested by
the potential for duplication which can be fostered, as a deliberate course, or exposed for
its ill effects, by enterprise architecture (Bernard, 2012). Bass et al. (1998) provided
practical guidance for architecture quality concerns, including standardizing use of styles

138
and notation. Clements, Kazman, and Klein (2001) explored the evaluation of software
architecture and the connections to system properties. Hubert (2002) proposed the
concept of a “convergent component” that results from the semantic coupling of a
business perspective and a software perspective (p. 60). The business perspective
includes organizations, processes, and resources. Yet, Hubert does not explore the
organizational theory connection further. He posits that the translations between
unaligned business and IT create “sources of error, cost, and risk in projects” (p. 61),
indicating such exploration could be fruitful. Note that the term, business, is often used
synonymously for any mission, public or private. Bernard’s (2012) work on the
organizational theory connection came later and appears to have been novel and thorough
(p. 53), but would require additional research to determine.
Power and politics. Allison and Zelikow (1999) posit power to be a component
of decisions made under the model of organizational behavior in terms of “factored
problems and fractionated power” (p.167) and under the model of governmental politics
in terms of presidential power to persuade and power to impact outcomes (p. 260).
Power’s influence in high risk situations of technology release could also provide
research opportunities when applied to software risk assessment.
Decision making. Bendor (2015) examined incrementalism tradition marking the
75th anniversary of Lindblom (1959). Bendor found no indication that “computer
scientists or applied mathematicians working on optimization via local search have read
anything” Lindblom wrote (Bendor, p.204). Bendor observed that several scientific
communities have independently arrived at “optimization via local search” approaches
(p. 204). This observation suggests that research could trace those independent chains of

139
thought on decision making for additional insight. This could lead researchers to deeper
looks at mathematical proofs and how they scale in systems (Dijkstra, 1974).
Other potential research opportunities. From the broad review of the literature
that was foundational to this dissertation’s research method, many public administration
topics could be mined for additional useful works. An incomplete summary includes (a)
cooptation (Selznick, 1949; O’Toole & Meier, 2004) and (b) planning philosophies as in
Eisenhower and von Moltke (cited in Faley, 2014, p. 133). In summary, this work
included a literature review cast with a wide net to address risk assessment at the
intersection of software development and the public administration environment, with a
central theme of software risk assessment. The result was a list of both broad and
specific ways in which a USAF method of risk assessment for software can be improved,
an initial version of a software defect prediction model constructed from the analysis’
results, a list of high-level steps for adding the practice of modeling to the tool kit of
USAF software professionals, and suggestions for future research.

140
References
$1 billion wasted on Air Force computer system. (2013, February 8). Retrieved from
http://www.nbcnews.com/video/nightly-news/50749586#50749586
Abdelmoez, W., Nassar, D. M., Shereshevsky, M., Gradetsky, N., Gunnalan, R., Ammar,
H. H., . . . Mili, A. (2004, September 14-16). Error propagation in software
architectures. In IEEE Proceedings of the 10th International Symposium on
Software Metrics. Los Alamitos, CA: IEEE Computer Society. doi:
10.1109/metric.2004.1357923
Agena. (2004). Models of uncertainty and risk for distributed software development
(IST-2000-28749). Retrieved from http://www.agenarisk.com/resources
D7.1%20MODIST%20Method%20and%20Tool%20User%20Manual%20v3.pdf
Agena. (2015). AgenaRisk software. Retrieved from
http://www.bayesianrisk.com/software .html
AFOTEC, Air Force Operational Test and Evaluation Center. Website:
http://www.afotec.af.mil/index.asp
Alberts, D. S. (2011). The agility advantage: A survival guide for complex enterprises
and endeavors. Retrieved from DoD Command and Control Research Program
website: http://www.dodccrp-test.org/ccrp-books
Alberts, D. S., Garstka, J. J., & Stein, F. P. (2000). Network centric warfare: Developing
and leveraging information superiority. Washington, DC: Assistant Secretary of
Defense (C3I/Command Control Research Program).

141
Allison, G., & Zelikow, P. (1999). Essence of decision: Explaining the Cuban Missile
Crisis (2nd ed.). New York, NY: Addison Wesley Longman.
Allman, E. (2012). Managing technical debt. Communications of the ACM, 5(5), 50-55.
doi:10.1145/2160718.2160733
Ammar, H. H., Nokzadeh, T., & Dugan, J. B. (2001). Risk assessment of software-system
specifications. IEEE Transactions on Reliability, 50, 171-183.
doi:10.1109/24.963125
Armour, P. G. (2005). The unconscious art of software testing. Communications of the
ACM, 48, 15-18. doi:10.1145/1039539.1039554
Bankes, S. C. (2002). Tools and techniques for developing policies for complex and
uncertain systems. Proceedings of the National Academy of Sciences, 99(suppl
3), 7263-7266. doi:10.1073/pnas.092081399
Barnes, H. (2005, August 30). Key capabilities/approaches for human-centric processes.
Retrieved from http://www.ultimus.com
Barney, D. (2000). Prometheus wired: The hope for democracy in the age of network
technology. Chicago, IL: University of Chicago Press.
Bass, L., Clements, P., & Kazman, R. (1998). SEI series in software engineering:
Software architecture in practice. Reading, MA: Addison Wesley Longman.
Beck, K., Beedle, M., van Bennekum, A., Cockburn, A., Cunningham, W., Fowler, M., . .
. Thomas, D. (2001). Manifesto for Agile software development. Retrieved from
http://agilemanifesto.org/
Bendor, J. (2015). Incrementalism: Dead yet Flourishing. Public Administration Review,
75(2), 194-205. doi:10.1111/puar.12333
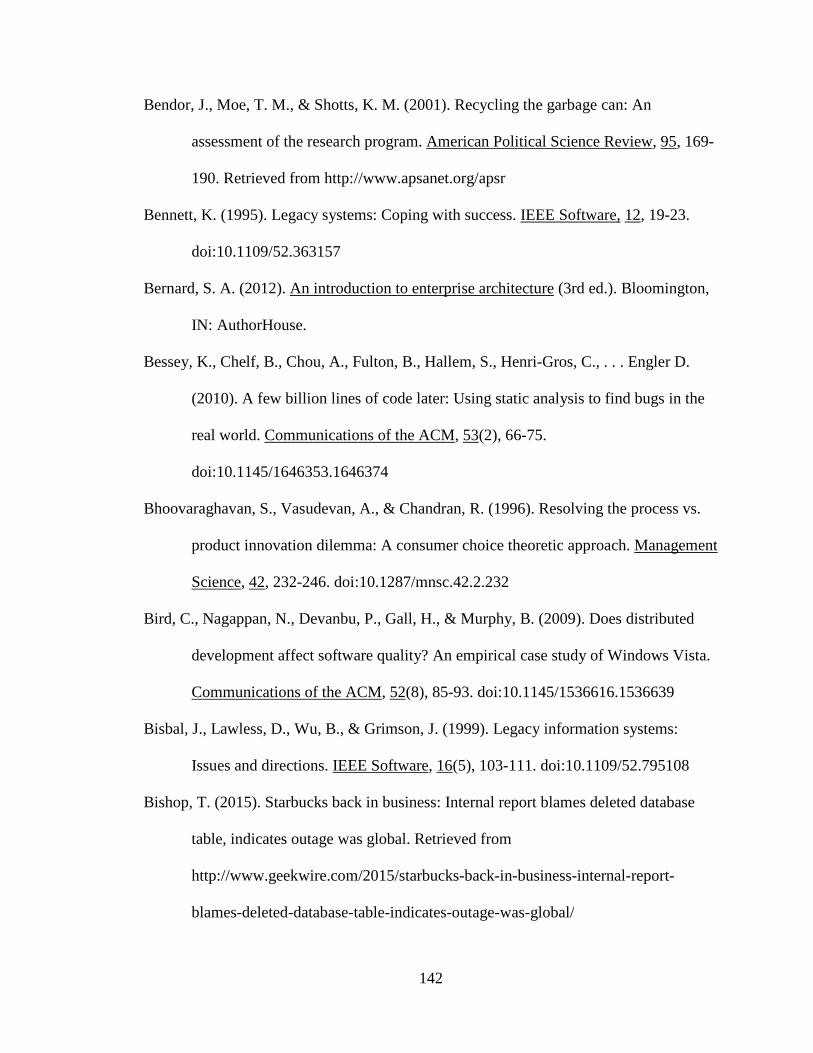
142
Bendor, J., Moe, T. M., & Shotts, K. M. (2001). Recycling the garbage can: An
assessment of the research program. American Political Science Review, 95, 169-
190. Retrieved from http://www.apsanet.org/apsr
Bennett, K. (1995). Legacy systems: Coping with success. IEEE Software, 12, 19-23.
doi:10.1109/52.363157
Bernard, S. A. (2012). An introduction to enterprise architecture (3rd ed.). Bloomington,
IN: AuthorHouse.
Bessey, K., Chelf, B., Chou, A., Fulton, B., Hallem, S., Henri-Gros, C., . . . Engler D.
(2010). A few billion lines of code later: Using static analysis to find bugs in the
real world. Communications of the ACM, 53(2), 66-75.
doi:10.1145/1646353.1646374
Bhoovaraghavan, S., Vasudevan, A., & Chandran, R. (1996). Resolving the process vs.
product innovation dilemma: A consumer choice theoretic approach. Management
Science, 42, 232-246. doi:10.1287/mnsc.42.2.232
Bird, C., Nagappan, N., Devanbu, P., Gall, H., & Murphy, B. (2009). Does distributed
development affect software quality? An empirical case study of Windows Vista.
Communications of the ACM, 52(8), 85-93. doi:10.1145/1536616.1536639
Bisbal, J., Lawless, D., Wu, B., & Grimson, J. (1999). Legacy information systems:
Issues and directions. IEEE Software, 16(5), 103-111. doi:10.1109/52.795108
Bishop, T. (2015). Starbucks back in business: Internal report blames deleted database
table, indicates outage was global. Retrieved from
http://www.geekwire.com/2015/starbucks-back-in-business-internal-report-
blames-deleted-database-table-indicates-outage-was-global/

143
Boehm, B. W. (1988). A spiral model of software development and enhancement.
Retrieved from http://csse.usc.edu/csse/TECHRPTS/1988/usccse88-
500/usccse88-500.pdf doi:10.1109/2.59
Boehm, B. W. (1989). Tutorial: Software risk management. Washington, DC: IEEE
Computer Society Press.
Boehm, B. W. (1991). Software risk management: Principles and practices. IEEE
Software, 8, 32-41. doi:10.1109/52.62930
Boyce, D. (2010). A history of the Association for Project Management: 1972-2010.
Buckinghamshire, UK: Association for Project Management.
Burns, K. (2014). Integrated Cognitive-neuroscience Architectures for Understanding
Sensemaking (ICArUS). Retrieved from http://www.mitre.org/sites/default/files
/publications/pr_14-3960-icarus-phase-2-challenge-problem-design-test.pdf
Carnegie Mellon University. (2002) Capability Maturity Model Integration, Version 1.1:
CMMI SM for software engineering continuous representation (CMU/SEI-2002-
TR-028). Pittsburgh, PA: Author.
Carnegie Mellon University CMMI Product Team. (2001). CMMI for Systems
Engineering/Software Engineering, Version 1.1, Staged Representation (CMMI-
SE/SW, V1.1, Staged) (CMU/SEI-2002-TR-002). Retrieved from
http://resources.sei.cmu.edu /library/asset-view.cfm?AssetID=6041
Carr, M. J., Konda, S. L., Monarch, I., Ulrich, F. C., & Walker, C. F. (1993). Taxonomy-
based risk identification (Tech. Rep. CMU/SEI-93-TR-6). Pittsburgh, PA:
Software Engineering Institute, Carnegie Mellon University.
144
Cataldo, M., Mockus, A., Roberts, J. A., & Herbsleb, J. D. (2009). Software
dependencies, work dependencies, and their impact on failures. IEEE
Transactions on Software Engineering, 35, 864-878. doi:10.1109/TSE.2009.42
Cavanagh, A. (2007). Sociology in the age of the Internet. New York, NY: McGraw-Hill
International.
Charmaz, K. (2008). Grounded theory as an emergent method. In S. N. Hesse-Biber and
P. Leavy (Eds.), Handbook of emergent methods (pp. 155-172). New York, NY:
Guilford Press.
Chen, Y., Probert, R. L., & Sims, D. P. (2002). Specification-based regression test
selection with risk analysis. Paper presented at the IBM Centre for Advanced
Studies Conference, Proceedings of the 2002 Conference of the Centre for
Advanced Studies on Collaborative Research, IBM Canada and National
Research Council Canada, Toronto.
Clarke, L., & Short, J. F., Jr. (1993). Social organization and risk: Some current
controversies. Annual Review of Sociology, 19, 375-399.
doi:10.1146/annurev.so.19.080193.002111
Clements, P., Kazman, R., Klein, M. (2001). SEI series in software engineering:
Evaluating software architectures. Reading, MA: Addison Wesley Longman.
Cohen, M. D., March, J. G., & Olsen, J. P. (1972). A garbage can model of organizational
choice. Administrative Science Quarterly, 17, 1-25. doi:10.2307/2392088
Cohen, P. R., Kaiser, E. C., Buchanan, M. C., Lind, S., Corrigan, M. J., & Matthews
Wesson, R. (2015). Sketch-Thru-Plan: A multimodal interface for command and
control. Communications of the ACM, 58(4), 56-65. doi:10.1145/2735589

145
Constantine, L. L. (2001). Beyond chaos: The expert edge in managing software
development. Boston, MA: Addison-Wesley ACM Press.
Crosby, P. B. (1979). Quality is free. New York, NY: McGraw-Hill.
Cyert, R. M., & March, J. G. (1992). A behavioral theory of the firm (2nd ed.). Malden,
MA: Blackwell.
Deming, W. E. (1986). Out of the crisis. Cambridge, MA: MIT Center for Advanced
Engineering.
Department of Defense. (1999). Space and Missile Systems Center, MIL-STD-1540D,
Department of Defense Standard Practice Product Verification Requirements for
Launch, Upper Stage, and Space Vehicles. El Segundo, CA: Space and Missile
Systems Center.
Department of Defense Architecture Framework, Version 2.02. (2010). Retrieved from
http://dodcio.defense.gov/TodayinCIO/DoDArchitectureFramework.aspx
Dijkstra, E. (1974). Programming as a discipline of mathematical nature. American
Mathematical Monthly, 81(6), 608-612. doi:10.2307/2319209
DODI 5000.02. (2008, December 8). Operation of the Defense Acquisition System.
Retrieved from the Office of the Secretary of Defense Acquisition website:
http://www.acq.osd.mil
/asda/docs/dod_instruction_operation_of_the_defense_acquisition_system.pdf
Etzioni, A. (1967). Mixed-scanning: a 'third' approach to decision-making. Public
administration review, 27(5), 385-392. doi:10.2307/973394
Faley, T. (2014). The Entrepreneurial Arch. Cambridge University Press.
146
Fenton, N., & Neil, M. (2013). Risk assessment and decision analysis with Bayesian
networks. Boca Raton, FL: Taylor and Francis.
Fenton, N., Neil, M., Marsh, W., Hearty, P., Radlinski, L., & Krause, P. (2007). Project
data incorporating qualitative factors for improved software defect prediction.
Paper presented at the 3rd International Workshop on Predictor Models in
Software Engineering (PROMISE’07), Minneapolis, MN.
doi:10.1109/promise.2007.11
Fisher, N. I., & Switzer, P. (2001). Graphical assessment of dependence: Is a picture
worth a 100 tests? The American Statistician, 55, 233-239.
doi:10.1198/000313001317098248
Ford, H. (2007) My life and work. Retrieved from Cosimobooks.com. (Originally
published 1922)
Gharajedaghi, J. (1999) Systems Thinking: Managing Chaos and Complexity - A
Platform for Designing Business Architecture. Boston: Butterworth Heinemann.
Gray, D., Bowes, D., Davey, N., Sun, Y., & Christianson, B. (2011). The misuse of
NASA metrics data program data sets for automated software defect prediction.
Paper presented at the 15th annual Evaluation and Assessment in Software
Engineering (EASE 2011) conference. Retrieved from
http://www.researchgate.net/publication
/235271425_The_Misuse_of_the_NASA_Metrics_Data_Program_Data_Sets_for
_Automated_Software_Defect_Prediction doi:10.1049/ic.2011.0012
147
Guidelines for Conducting Operational Test and Evaluation (OT&E) for Software
Intensive System Increments. (2003, June 13). Retrieved from
http://www.dote.osd.mil/pub/reports/ guidelines_ote_sisi_june03.pdf
Guidelines for Operational Test and Evaluation of Information and Business Systems.
(2010, September 14). Retrieved from
http://www.dote.osd.mil/pub/policies/2010/20100914Guidelines_forOTEofInfo_a
ndBusSystems.pdf
Hesse-Biber, S. N., & Leavy, P. (Eds.). (2010) Handbook of emergent methods. New
York, NY: Guilford Press.
Holzmann, G. (2014). Fault intolerance. IEEE Software, 31(6), 16-20.
doi:10.1109/MS.2014.136
Holzmann, V., & Spiegler, I. (2011). Developing risk breakdown structure for
information technology organizations. International Journal of Project
Management, 29, 537-546. doi: 10.1016/j.ijproman.2010.05.002
Hong, J. F., & Vai, S. (2008). Knowledge-sharing in cross-functional virtual teams.
Journal of General Management, 34(2), 21. Retrieved from
http://www.braybrooke.co.uk/JournalofGeneralManagement/tabid/56/Default.asp
x
Hubert, R. (2002). Convergent architecture: building model-driven J2EE systems with
UML. John Wiley & Sons.
Humphrey, W. S. (1989). Managing the software process. Reading, MA: Addison-
Wesley.

148
Irizar, J., and Wynn, M. (2013, February 24 - March 1). Risk as a subjective construct:
Implications for project management practice. Paper presented at the eKNOW
2013: The Fifth International Conference on Information, Process, and
Knowledge Management, Nice, France.
Ito, J. (2014, October 2). Antidisciplinary. Retrieved from
http://joi.ito.com/weblog/2014/10/02/antidisciplinar.html
Ito, J. (Speaker). (2015, April). After Internet. Bedford, MA: MITRE Federally Funded
Research and Development Corporation.
James, O., & Lodge, M. (2003). The limitations of ‘policy transfer’ and ‘lesson drawing’
for public policy research. Political Studies Review, 1, 179-193.
doi:10.1111/1478-9299.t01-1-00003
Johansson, F. (2006) The Medici effect: What elephants & epidemics can teach us about
innovation. Boston, MA: Harvard Business School Press.
Juran, J. M. (1988) Juran on planning for quality. New York, NY: MacMillan.
Kalnins, A., Swaminathan, A., & Mitchell, W. (2006). Turnover events, vicarious
information, and the reduced likelihood of outlet-level exit among small multiunit
organizations. Organization Science, 17(1), 118-131. doi:10.1287/orsc.1050.0174
Kamp, P. H. (2014). Quality software costs money—Heartbleed was free.
Communications of the ACM, 57(8), 49-51. doi: 10.1145/2631095
Kanaracus, C. (2012, November 14). Air Force scraps massive ERP project after racking
up $1B in costs. Computerworld. Retrieved from http://www.computerworld.com

149
Kelly, H. (2014). The ‘heartbleed’ security flaw that affects most of the Internet.
Retrieved from http://www.cnn.com/2014/04/08/tech/web/heartbleed-
openssl/index.html
Kerwin, C. (2003). Rulemaking: How government agencies write law and make policy
(3rd ed.). Washington, DC: Congressional Quarterly Press.
Khadki, R., Batlajery, B. V., Saeidi, A. M., Jansen, S., & Hage, J. (2014, May). How do
professionals perceive legacy systems and software modernization? Proceedings
of the 36th International Conference on Software Engineering (pp. 36-47). New
York, NY: Association for Computing Machinery. doi:10.1145/2568225.2568318
Klinke, A., & Renn, O. (2002). A new approach to risk evaluation and management:
Risk‐based, precaution‐based, and discourse‐based strategies. Risk Analysis, 22,
1071-1094. doi:10.1111/1539-6924.00274
Kometer, M. W., Burkhart, K., McKee, S. V., & Polk, D. W. (2011, March). Operational
testing: From basics to system-of-systems capabilities. International Test and
Evaluation Association Journal, 32, 39-51. Retrieved from:
http://www.itea.org/journal-abstracts/2012-02-29-15-44-28.html
Lafond, D., DuCharme, M. B., Rioux, F., Tremblay, S., Rathbun, B., & Jarmasz, J.
(2012, March 6 - 8). Training systems thinking and adaptability for complex
decision making in defence and security. Paper presented at the 2012 IEEE
International Multi-Disciplinary Conference on Cognitive Methods in Situation
Awareness and Decision Support (CogSIMA), New Orleans, Louisiana.
doi:10.1109/cogsima.2012.6188408
Lasswell, H. (1963). The future of political science. Transaction Publishers.
150
Leavitt, H. (1965). Applied organizational change in industry: Structural, technological,
and humanistic approaches. In J. G. March (Ed.), Handbook of organizations (pp.
1144-1170) Chicago: Rand McNally
Lindblom, C. E. (1959). The science of muddling through. Public Administration
Review, 19(2), 79-88. doi:10.2307/973677
Lindblom, C. E. (1979). Still muddling, not yet through. Public Administration Review,
39, 517-525. doi:10.2307/976178
Macgill, S. M., & Siu, Y. L. (2005). A new paradigm for risk analysis. Futures, 37, 1105-
1131. doi: 10.1016/j.futures.2005.02.008
McCabe, T. J. (1976, December). A complexity measure. IEEE Transactions on Software
Engineering, pp. 308-320. doi:10.1109/TSE.1976.233837
McQueary, C. E. (2008). The key to weapons that work. Defense A T & L, 37, 2.
Retrieved from http://www.dau.mil/publications/DefenseATL/default.aspx
Misirli, A. T., & Bener, A. B. (2014). Bayesian networks for evidence-based decision-
making in software engineering. IEEE Transactions on Software Engineering, 40,
533-554. doi:10.1109/TSE.2014.2321179
Mockus, A. (2014, September 17). Defect prediction and software risk. Paper presented
at the 10th International Conference on Predictive Models in Software
Engineering (PROMISE '14), Turin, Italy. doi:10.1145/2639490.2639511
Moffat, J. (2003). Complexity theory and network centric warfare. Retrieved from DoD
Command and Control Research Program website: http://www.dodccrp-
test.org/ccrp-books
151
Moreno, S., & Neville, J. (2013, December 7 - 10). Network hypothesis testing using
mixed Kronecker product graph models. Paper presented at the 2013 IEEE 13th
International Conference on Data Mining (ICDM), Dallas, Texas.
doi:10.1109/icdm.2013.165
Moore, G. E. (1975). Progress in digital integrated electronics. IEDM Technical Digest,
pp. 11-13. Retrieved from
http://ieeexplore.ieee.org/search/searchresult.jsp?newsearch=true&queryText=IE
DM%20technical%20digest
Moore, J. (2014, December). FITARA analysis: Will CIOs use their new powers for
good? Retrieved from http://www.nextgov.com/cio-briefing/2014/12/fitara-
analysis-will-cios-use-their-new-powers-good/101160/
Musso, J. A., & Weare, C. (2015). From participatory reform to social capital: micro‐
motives and the macro‐structure of civil society networks. Public Administration
Review, 75(1), 150-164. doi:10.1111/puar.12309
NASA. (1990). Manager’s handbook for software development (Revision 1, SEL-84-
101). Retrieved from http://everyspec.com /NASA/NASA-General/SEL-84-
101_REV-1_1990_30283/
NASA. (1997). Software safety NASA technical standard (NASA-STD 8719.13A).
Retrieved from
http://www.hq.nasa.gov/office/codeq/doctree/canceled/ns871913.htm
NASA. (2004). Software safety standard (NASA-STD 8719.13B). Retrieved from
http://www.system-safety.org/Documents/NASA-STD-8719.13B.pdf

152
Ni, M., McCalley, J., Vittal, V., Greene, S., Ten, C. W., Ganugula, V. S., & Tayyib, T.
(2003). Software implementation of online risk-based security assessment. IEEE
Transactions on Power Systems, 18, 1165-1172.
doi:10.1109/TPWRS.2003.814909
Office of Government Commerce. (2007). The official introduction to the ITIL service
lifecycle. London, England: The Stationary Office.
Office of Management and Budget. (2015, February 2). Fiscal year 2016 analytical
perspectives of the U.S. Government. Retrieved from http://www.gpo.gov
Office of the Secretary of Defense. (2003, June 16). Subject: Guidelines for conducting
operational test and evaluation for software intensive system increments [Memo].
Retrieved from
http://www.dote.osd.mil/pub/reports/guidelines_ote_sisi_june03.pdf
Office of the Secretary of Defense. (2010, September 14). Subject: Guidelines for
operational test and evaluation of information and business systems [Memo].
Retrieved from
http://www.dote.osd.mil/pub/policies/2010/20100914Guidelines_forOTEofInfo_a
ndBusSystems.pdf
Olsen, J. P. (2001). Garbage cans, new institutionalism, and the study of politics.
American Political Science Review, 95(1), 191-198. Retrieved from
http://www.apsanet.org/apsr
O'Toole, L. J., & Meier, K. J. (2004). Desperately seeking Selznick: Cooptation and the
dark side of public management in networks. Public Administration Review,
64(6), 681-693. doi:10.1111/j.1540-6210.2004.00415.x
153
O’Toole, L. J., & Montjoy, R. S. (1984). Interorganizational policy implementation: A
theoretical perspective. Public Administration Review, 44, 491-503.
doi:10.2307/3110411
Page-Jones, M. (1988). The practical guide to structured systems design (2nd ed.). New
Jersey: Yourdon Press.
Paulk, M. C., Weber, C. V., Curtis, B., & Chrissis, M. B. (1994). The Capability Maturity
Model: Guidelines for improving the software process. Reading MA: Addison
Wesley Longman.
Perrow, C. (1984). Normal accidents: Living with high-risk technologies. New York,
NY: Basic Books.
Powers, E., Stech, F., & Burns, K. (2010). A behavioral model of team sensemaking.
International C2 Journal, 4(1), 1-10. Retrieved from
http://www.dodccrp.org/html4/journal_main.html
Pressman, J. L., & Wildavsky, A. (1984) Implementation: How great expectations in
Washington are dashed in Oakland; Or, why it’s amazing that federal programs
work at all, this being a saga of the economic development administration as told
by two sympathetic observers who seek to build morals on a foundation of ruined
hopes (3rd ed., expanded). Berkeley: University of California Press.
Raadschelders, J. C., & Lee, K. H. (2011). Trends in the study of public administration:
Empirical and qualitative observations from Public Administration Review,
2000–2009,” Public Administration Review, 71, 19-33. doi:10.1111/j.1540-
6210.2010.02303.x

154
Ramesh, B., & Jarke, M. (2001). Toward reference models for requirements traceability.
IEEE Transactions on Software Engineering, 27, 58-93. doi:10.1109/32.895989
Robin, A., Haynes, P., Paschino, E., Kroes, R., Oikawa, R., Getchell, S., . . . Dyas, H.
(2005). U.S. Patent No. 2005011489A1. Washington, DC: U.S. Patent and
Trademark Office.
Rose, R. (1993) Lesson-drawing in public policy: A guide to learning across time and
space. Chatham, NJ: Chatham House.
Schmidt, R., Lyytinen, K., Keil, M., & Cule, P. (2001). Identifying software project risks:
An international Delphi study. Journal of Management Information Systems,
17(4), 5-36.
Scott, W., & Davis, G. (2007). Organizations and organizing: Rational, natural, and open
system perspectives. Prentice Hall.
Seacord, R. C., Plakosh, D., & Lewis, G. A. (2003). Modernizing legacy systems:
Software technologies, engineering processes, and business practices. Boston,
MA: Addison-Wesley.
Selznick, P. (1949). TVA and the grass roots: A study of politics and organization (Vol.
3). University of California Press.
Shafritz, J. M., & Hyde, A. C. (1997). Classics of public administration (4th ed.). Fort
Worth, TX: Harcourt Brace College.
Shalal-Esa, A. (2012, December 5). US senators question Pentagon on $1 bln canceled
program. Retrieved from http://www.reuters.com/article/2012/12/05/airforce-
logistics-idUSL1E8N5ITN20121205

155
Shankland, S. (2012). Moore's law: The rule that really matters in tech. Retrieved from
http://www.cnet.com/news/moores-law-the-rule-that-really-matters-in-tech/
Shepperd, M., Bowes, D., & Hall, T. (2014). Researcher bias: The use of machine
learning in software defect prediction. IEEE Transactions on Software
Engineering, 40, 603-616. doi:10.1109/TSE.2014.2322358
Shibab, E., Mockus, A., Kamei, Y., Adams, B., & Hassan, A. E. (2011, September 5-9).
High-Impact Defects: A Study of Breakage and Surprise Defects. Proceedings of
the 19th ACM SIGSOFT symposium and the 13th European Conference on
Foundations of Software Engineering (ESEC/FSE ’11). New York, NY:
Association for Computing Machinery.
Short, J. F., Jr. (1984). The social fabric at risk: Toward the social transformation of risk
analysis. American Sociological Review, 49, 711-725. doi:10.2307/2095526
Simon, H. A. (1997). Administrative behavior: A study of decision-making processes in
administrative organizations (4th ed.). New York, NY: The Free Press.
Slocum, M. (2005, November). Business performance excellence and the roles of
innovation and Six Sigma. Paper presented at DCI’s Business Process
Management Conference, San Diego, CA.
Sneed, H. M. (1999, October 6-8). Risks involved in reengineering projects. Paper
presented at the Sixth Working Conference on Reverse Engineering, Atlanta,
Georgia. doi:10.1109/wcre.1999.806961
Solomon, P. (2013, January/February). Basing earned value on technical performance.
Retrieved from http://www.crosstalkonline.org/storage/issue-
archives/2013/201301/201301-Solomon.pdf
156
Soper, T. (2015, April). Starbucks lost millions in sales because of a ‘system refresh’
computer problem. Retrieved from http://www.geekwire.com/2015/starbucks-
lost-millions-in-sales-because-of-a-system-refresh-computer-problem/
StackExchange. (2013). Cross validated, the two cultures: Statistics vs. machine learning.
Retrieved from http://stats.stackexchange.com/questions/6/the-two-cultures-
statistics-vs-machine-learning
Staller, K., Block, E., & Horner, P. S. (2008). History of methods in social science
research. In S. N. Hesse-Biber & P. Leavy (Eds.), Handbook of emergent methods
(pp. 155-172). New York, NY: The Guilford Press.
Straker, D. (1995). A toolbook for quality improvement and problem solving. Upper
Saddle River, NJ: Prentice Hall Manufacturing Practitioner.
Sweda, J. & Ratcliffe, D. (2010). Risk analysis level of test (RALOT) process. USAF
505th Command & Control Wing/605th Test and Evaluation Squadron. Hurlburt
Field, Fl.
Sweda, J. & Ratcliffe, D. (2014a). 605 TES risk assessment level of test (RALOT)
process guidelines. 505th Command & Control Wing/605th Test and Evaluation
Squadron. Hurlburt Field, Fl.
Sweda, J. & Ratcliffe, D. (2014b). CalculatedRALOT(MASTERJan14).xlsx [Excel
Spreadsheet] USAF 505th Command & Control Wing/605th Test and Evaluation
Squadron. Hurlburt Field, Fl.
Symantec Corporation. (2015, April). Internet security threat report, 20. Retrieved from
http://www.symantec.com
157
Tasse, J. (2013, October 9). Using code change types in an analogy-based classifier for
short-term defect prediction. Paper presented at the 9th International Conference
on Predictive Models in Software Engineering (PROMISE’13) Conference,
Baltimore, MD. doi:10.1145/2499393.2499397
Treleaven, P., Galas, M., & Lalchand, V. (2013). Algorithmic trading review.
Communications of the ACM, 56(11), 76-85. doi:10.1145/2500117
USAF 505th Command and Control Wing. (2013). Fact sheet: 605th Test and Evaluation
Squadron. Retrieved from:
http://www.505ccw.acc.af.mil/shared/media/document/AFD-130730-027.pdf
U.S. General Accounting Office. (2003). Information technology: A framework for
assessing and improving enterprise architecture management (GAO-03-584G).
Washington, DC: Author.
U.S. General Accountability Office. (2004a). Department of Defense: Further actions
needed to establish and implement a framework for successful financial and
business management transformation (GAO-04-551T). Testimony before the
Subcommittee on Readiness and Management Support, Committee on Armed
Services, U.S. Senate.
U.S. General Accountability Office. (2004b). DoD business systems modernization:
Billions continue to be invested with inadequate management oversight and
accountability (GAO-04-615). Washington, DC: Author.
Vance, A. (2013, April 29). LinkedIn: A story about Silicon Valley's possibly unhealthy
need for speed. Bloomberg Business Week. Retrieved from
http://www.businessweek.com/
158
Wagner, S. (2013a, October 9). Are comprehensive quality models necessary for
evaluating software quality? Paper presented at the 9th International Conference
on Predictive Models in Software Engineering (PROMISE'13), Baltimore, MD.
Wagner, S. (2013b). Software product quality control. Heidelberg, Germany: Springer.
doi:10.1007/978-3-642-38571-1
Wahono, R. S., Herman, N. S., & Ahmad, S. (2014). Neural network parameter
optimization based on genetic algorithm for software defect prediction. Advanced
Science Letters, 20, 1951-1955. doi:10.1109/METRIC.2002.1011343
Walkinshaw, N. (2013, October 9). Using evidential reasoning to make qualified
predictions of software quality. Paper presented at the 9th International
Conference on Predictive Models in Software Engineering (PROMISE'13)
Baltimore, MD. doi:10.1145/2499393.2499402
Weise, E. (2015, April 15). Gangs of hackers cause spike of 23% in cyber breaches:
Health care firms were a major target. USA Today. Retrieved from
http://www.usatoday.com
West, D. (2011, July 26). Water-scrum-fall is the reality of agile for most organizations
today. Cambridge, MA: Forrester.
Williams, M. F. (2009). Understanding public policy development as a technological
process. Journal of Business and Technical Communication, 23, 448-462.
doi:10.1177/1050651909338809
Williams, R. C., Pendelios, G. J., & Behrens, S. G. (1999). Software Risk Evaluation
(SRE) method description (Version 2.0) (Technical Report CMU/SEI-99-TR-029,
159
ESC-TR-99-029). Pittsburgh, PA: Software Engineering Institute, Carnegie
Mellon University.
Yacoub, S. M., Ammar, H. H., & Robinson, T. (2000, October 8-11). A methodology for
architectural-level risk assessment using dynamic metrics. Paper presented at the
11th International Symposium on Software Reliability Engineering, San Jose,
California. doi:10.1109/issre.2000.885873
Yourdon, E. (1997). Death March: The Complete Software Developers Guide to
Surviving Mission Impossible Projects (Yourdon Computing Series). Upper
Saddle River, New Jersey: Prentice Hall.
Zachman, J. A. (1987). A framework for information systems architecture. IBM Systems
Journal 26, 276-292. doi:10.1147/sj.263.0276