Risk Assessment in Shipping Bank Loans: Lending through ...
79
Risk Assessment in Shipping Bank Loans: Lending through Shipping Cycle Author: Giochana Kyrio A thesis presented for the degree of ”BSc. Shipping, Trade and Transport” Supervisor: Theodoros Syriopoulos School of Business Studies University of the Aegean Chios, Greece 2019
Transcript of Risk Assessment in Shipping Bank Loans: Lending through ...

Risk Assessment in Shipping Bank Loans: Lending throughShipping Cycle
Author: Giochana Kyrio
A thesis presented for the degree of”BSc. Shipping, Trade and Transport”
Supervisor: Theodoros Syriopoulos
School of Business StudiesUniversity of the Aegean
Chios, Greece2019

Acknowledgments
This is my Barchelor Thesis to obtain the Barchelor of Science degree inShipping, Trade and Transport at University of the Aegean. I chose mar-itime economics as a field of study due to my affection into finance science.The field of shipping came into my life through my best friend and Mastergraduate economist Christos Patsis and his wisdom on professional orien-tation. After several opinions and personal search, I finally choose it andtravel far away from my hometown to beautiful island of Chios. The reasonsI studied hard was the unique character of shipping that, as I stated above,in the conclusions of my thesis paper, and how brings people together fromdifferent sectors and cultures.
I would like to thank several people who supported me during all mystudies and in particularly during this Barchelor Thesis project. Firstly,i want to thank my supervisor Theodoros Syriopoulos for all the time heinvested in guiding and helping me during this process. Secondly, i wantto thank all my professors for all the knowledge and experience that theyimparted to me. Last but definitely not least, i want to thank my family andmy close friends for the continuous support throughout these years.
1

Abstract
The aim of this thesis paper is to inform about the shipping finance andmore specifically, the bank finance, through loans. In addition I analyzed theterm “shipping bank loan” from the aspect of the borrower, which was theshipping bank, through the riskiness factor of cyclicality and the view of adry bulk shipping company when borrows, through shipping cycles’ stages.In most papers and scientific articles, the risk assessment of the shippingloans is examined at a timeline with main event the global financial crisis of2008. However, due to the abovementioned trend, I chose to select the crisisas an initial milestone, being the start of the shipping cycle as a trough. Ialso chose cyclicality as the risk benchmark that correlates with the frameloans are signed in shipping.
At first I chose to approach the issue of investment financing in the ship-ping industry, more broadly. The first chapter begins with the logic of financ-ing and the available, contemporary and traditional ways of raising funds inshipping, that are mostly divided into two categories, equity and debt. Fromthe debt category of financing comes of the bank loans that is timelessly themost common way of shipping finance. Furthermore, by combining the twosides of a shipping loan, the lender and the borrower but through a criticalidiosyncrasy of shipping industry that weights risk in her investment activ-ities, the cyclicality and shipping cycles, depicts on making the right riskassessment. From the shipping bank perspective, the most important assess-ment of the risk is the relationship banking, more accurately the selectionand closed monitoring of clients-borrowers that is timeless.
Therefore, I talked about the today’s reality of shipping banks that wasaffected a lot from the Basel accords. Then comes a case study of a typicalshipping bank, the DVB Bank SE, about the her shipping portfolio, how andwhy it changed after global recession hit and until today, in order to surviveand remain a leading bank in the shipping finance industry. Then I choseto refer, every important aspect of a shipping loan, from the loan procedure,the pricing of the loan, the events of default, the meaning of problem loans,what happens after the sanction, the issue of refinancing and in the end ofthe chapter, the sad procedures after a loan defaults.
Due to the fact that the default is the main risk in shipping finance, in or-der to avoid it is absolutely important to find the sources and reasons behindthe risk in shipping industry. Therefore, I chose to show the risks taking partin the shipping market and to address the drivers of it which come from the
2

insides of maritime sector. Then, I chose to focus on a certain idiosyncrasyof shipping that produces a substantial risk and danger on shipping activityand profitability, which is cyclicality that creates the shipping cycles andthe cyclical risk. However, it is needed to examine how shipping companies,shipyards and especially shipping finance deal with cyclicality, behave andprotect from her risks.
At the last chapter, after analyzing shipping finance, shipping loans andrisk of shipping cycles, comes subsequently the time to serve the title of mythesis paper, the risk assessment in shipping bank loans but through theshipping cycles. Before addressing the risk assessment of the shipping loans,I firstly presented the important elements, the default risk drivers and thecredit review as risk assessment method. The latter consists of two parts,the qualitative, referred as “6 C’s of credit investment analysis” and thequantitative one with the financial indicators.
To close the paper, I chose a case study of the credit review of NaviosMaritime Holdings’ loans under a timeline of the recent dry bulk shippingcycle from the global financial crisis of 2008 until today’s minor recovery.The loans have been chosen in accordance of representing the cycle’s stages,with selective qualitative and quantitative indicators as well as every loan’ssubstantial structure information. Afterwards, I conclude the case study, bystating the correlation and patterns known in shipping finance theory, basedwith the resulting observations of the way those loans have been signed,priced and cycle’s stage timing, always according to the risk assessed andfinally undertaken. Then there are the overall conclusions of the thesis,theory and case studies, and the bibliography.
3

Contents
1 Shipping Finance and Market 61.1 Introduction to Shipping . . . . . . . . . . . . . . . . . . . . . 61.2 Shipping Market Overview . . . . . . . . . . . . . . . . . . . . 71.3 Shipping Finance . . . . . . . . . . . . . . . . . . . . . . . . . 9
1.3.1 WACC and IRR . . . . . . . . . . . . . . . . . . . . . 91.3.2 Shipping Finance Today . . . . . . . . . . . . . . . . . 11
1.4 Funding . . . . . . . . . . . . . . . . . . . . . . . . . . . . . . 111.4.1 Common Sources of Raising Funds . . . . . . . . . . . 121.4.2 Contemporary Ways of Raising Funds . . . . . . . . . 13
2 Shipping Bank Loans 162.1 Shipping Banks . . . . . . . . . . . . . . . . . . . . . . . . . . 172.2 Relationship Banking . . . . . . . . . . . . . . . . . . . . . . . 182.3 Basel Accords . . . . . . . . . . . . . . . . . . . . . . . . . . . 192.4 Case Study ”DVB Bank SE” . . . . . . . . . . . . . . . . . . . 202.5 Credit Rating in Shipping: Moody’s . . . . . . . . . . . . . . . 242.6 Loan Procedure . . . . . . . . . . . . . . . . . . . . . . . . . . 262.7 Shipping Bank Loan Pricing . . . . . . . . . . . . . . . . . . . 272.8 Events of Default . . . . . . . . . . . . . . . . . . . . . . . . . 282.9 Problem Loans . . . . . . . . . . . . . . . . . . . . . . . . . . 292.10 Post-Sanction . . . . . . . . . . . . . . . . . . . . . . . . . . . 302.11 Refinancing . . . . . . . . . . . . . . . . . . . . . . . . . . . . 312.12 After the Default . . . . . . . . . . . . . . . . . . . . . . . . . 31
3 Risk in Shipping Finance 333.1 Risk Drivers in Shipping . . . . . . . . . . . . . . . . . . . . . 333.2 Shipping Market Risks . . . . . . . . . . . . . . . . . . . . . . 343.3 Cyclicality . . . . . . . . . . . . . . . . . . . . . . . . . . . . . 36
3.3.1 Shipping Cycles and Risk . . . . . . . . . . . . . . . . 363.3.2 Shipping Companies Through Cycles . . . . . . . . . . 393.3.3 Shipyards Through Cycles . . . . . . . . . . . . . . . . 413.3.4 Shipping Finance Through Cycles . . . . . . . . . . . . 43
4 Risk Assessment in Shipping Bank Loans 464.1 Default Risk Drivers in Shipping Bank Loans . . . . . . . . . 464.2 6 C’s of Credit and Investment Analysis . . . . . . . . . . . . 47
4

4.3 Credit Review as Risk Assessment Method in Shipping BankLoans . . . . . . . . . . . . . . . . . . . . . . . . . . . . . . . 50
4.4 Credit Review in Dry Bulk Shipping Cycle 2008-2018 - CaseStudy: ’Navios Maritime Holdings Loans’ . . . . . . . . . . . . 52
5 Conclusion 69
6 Bibliography 72
5
1 Shipping Finance and Market
1.1 Introduction to Shipping
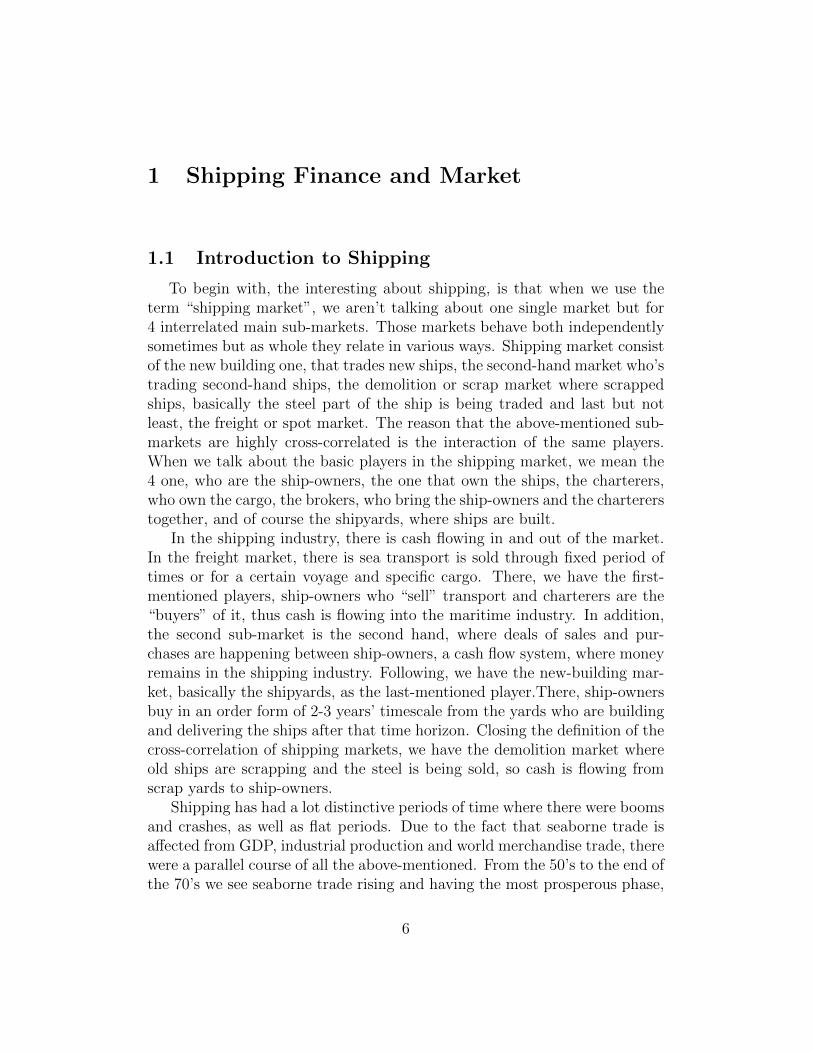
To begin with, the interesting about shipping, is that when we use theterm “shipping market”, we aren’t talking about one single market but for4 interrelated main sub-markets. Those markets behave both independentlysometimes but as whole they relate in various ways. Shipping market consistof the new building one, that trades new ships, the second-hand market who’strading second-hand ships, the demolition or scrap market where scrappedships, basically the steel part of the ship is being traded and last but notleast, the freight or spot market. The reason that the above-mentioned sub-markets are highly cross-correlated is the interaction of the same players.When we talk about the basic players in the shipping market, we mean the4 one, who are the ship-owners, the one that own the ships, the charterers,who own the cargo, the brokers, who bring the ship-owners and the chartererstogether, and of course the shipyards, where ships are built.
In the shipping industry, there is cash flowing in and out of the market.In the freight market, there is sea transport is sold through fixed period oftimes or for a certain voyage and specific cargo. There, we have the first-mentioned players, ship-owners who “sell” transport and charterers are the“buyers” of it, thus cash is flowing into the maritime industry. In addition,the second sub-market is the second hand, where deals of sales and pur-chases are happening between ship-owners, a cash flow system, where moneyremains in the shipping industry. Following, we have the new-building mar-ket, basically the shipyards, as the last-mentioned player.There, ship-ownersbuy in an order form of 2-3 years’ timescale from the yards who are buildingand delivering the ships after that time horizon. Closing the definition of thecross-correlation of shipping markets, we have the demolition market whereold ships are scrapping and the steel is being sold, so cash is flowing fromscrap yards to ship-owners.
Shipping has had a lot distinctive periods of time where there were boomsand crashes, as well as flat periods. Due to the fact that seaborne trade isaffected from GDP, industrial production and world merchandise trade, therewere a parallel course of all the above-mentioned. From the 50’s to the end ofthe 70’s we see seaborne trade rising and having the most prosperous phase,
6

with Japan and US, being the major importers. After that period and till themid 80’s, the phase is starting to get flat and stagnant, with two major oilcrises, happening at the mid 70’s and the begging of 80’s, causing a dramaticdecline in the demand for shipping services. Afterwards were returning in asteady rising period for shipping until at 2008, global financial crisis hits.
1.2 Shipping Market Overview
The outbreak of global financial crisis, causing financial system problems,was absolutely devastating for the world economy, affecting mostly every in-dustry, with huge declines on world GDP, global trade, and so the oceangoingshipping sector of course. There were huge declines on the freight rates withworld fleet growing faster than trade, vessel values went down, financing gotstrict and shipping companies started to collapse with many to bankruptand others to merge or get acquiesced from groups and go on alliances toprotect from dying. There was an unrepeatable depression that made ev-ery investor and financial institution to turn his back to shipping industry,although there were speculators that took advantage of this crisis and gotstronger. Of course, although this trough has lasted 8 devastating years, itisn’t over yet.
Shipping market today is mostly characterized by a change on sea tradegrowth, world shipyard capacity, zero emissions challenges and a digital rev-olution. The pattern of shipping center has changed a lot, shifting from Westto East, making Asia and her developing countries-giants the new leader inship building, broking, seaborne trading and scrapping and ship financing.China now is a major exporter, investor and together with the other Asian gi-ants is driving the trade, leading to a huge change on the world trade pattern.The OECD countries who were the old times leaders in maritime industry,are now importing less than the half it was 50 years ago, losing market sharefrom the non-OECD ones. Furthermore, shipbuilding trades have changedtoo, with Europe stepping out of that business and the 3 Asian shipbuildinggiants, Japan, Korea and China standing now, as the three dominant onesglobally.
The era of technology that we are getting through, of course, is affectingshipping industry too. The question is, if shipping players are intelligentenough to implement information and communications technology revolu-tion to evolve sea transport. Today we have three ways that changed theshipping business model, “smart ships”, “smart fleets” and “smart global
7

logistics”. The term“Smart ships” means the ones with satellite communica-tion, telematics, data storage, smart phone-style apps, information systemsand of course atomization, leading to better quality and efficiency standards.“Smart fleets” are the ones who manage the abovementioned like transportfactories and smart global logistics, integrate the whole thing door to door.
Besides the financial challenges that shipping industry is supposed to facedue to the current depressing situations, lately, IMO and his environmentalregulations about several pollution issues like, ballast water management,SOX,NOX CO2 emissions as well as energy efficiency in general.
To begin with ballast water management, there has been a Conventionthat is eligible from past September, describing a ballast water dischargingstandard. It is supposed that every vessel until 2024 should install an IMO-approved treatment system. However, since 2013 that the regulations aboutthe management of ballast water, the market has began to present 6 differentsystems globally, to suit every player’s appetite and need, so can complywith IMO. Energy efficient vessels are also a new promise of the ship-ownersto IMO regulations about their design, so EEDI, Energy Efficiency DesignIndex, is an issue to be discussed and agreed at its fourth phase commencingin 2025.
The most challenging regulations, though, are the ones about the Sulphurdioxide emissions that come from the heavy fuel oil that is used on mostvessels, with a cap at 0.5 percent, to be implemented from 2020 accordingto IMO. This issue has provoked a lot of intensity and ongoing discussionsabout how practically this is going to be applied and it could have majorimpact if some non-compatible fuels are going to be banned. There willbe significant financial and operational implications about ship operators’decision on the optimal strategy to the regulations, from a bunch of solutionthat the market is starting to offer like, scrubbers, LNG, and hybrid fuels.Of course, we expect a lot of consequences on the fuels demand by the finalcomplying deadline that, due to the global character of IMO’s regulations,the playing field of shipping is going to change once and forever.
CO2 and energy efficiency issues have stepped in to the maritime industryfield too. Climate change is the political force driving the abovementionedregulations. All vessels above 5,000 GT are obliged to monitor report andverify their CO2 emissions at EU ports together with cargo data and averageenergy efficiency. Due to the EU’s decision of publishing those data, mon-itoring plans are needed to require confidentiality, calculation of efficiencymetrics about the fuel consumption and a more global approach is made
8

from IMO, known as IMO DCS (IMO Fuel Consumption Data CollectionsSystem) with 2019 first year of implementation.
Although for others polluting industries, low emissions are a past chal-lenge, shipping always comes last when talking about environmental issues.The point is that all those technologies that need to be pat in action so they’llcomply with IMO, are significantly costly. In addition are hard to managefinancially, so for the recently past years and until 2020, IMO emissions time-horizon, there has been a chaos about choosing the most viable technologicalsolutions. The problem is that there is no one-size-fits-all solution becauseevery new building vessel in the order book, from now on, is required to haveeither scrubber installed, a main engine burning LNG or MGO, with hugefixed costs that should concern every one investing in shipping.
1.3 Shipping Finance
1.3.1 WACC and IRR
To begin with, shipping finance forms vary between debt and equity, esti-mating the required amount of external funds. If firm’s assets are expectedto grow more than the internally generated funds, the external ones will beraised to fill the gap. Most of the firms raise external funds needed throughborrowing and use Weighted Average Cost of Capital (WACC) in order tocalculate firm’s cost of capital in which each category of capital is propor-tionately weighted. WACC includes all sources of capital, including commonstock, preferred stock, bonds and any other long-term debt. A company’sWACC increases as the rate of return on equity increases due to the fact thatan increase in the WACC denotes a decline in valuation and an increase inrisk. The formula is :
WACC=E/V*Re + D/V*Rd*(1-Tc)
Re: Cost of equityRd: Cost of debtE: Market value of the company’s equityD: Market value of the company’s debtV=E+D: Total market value of the company’s financing (equity and debt)
9

E/V: Percentage of financing that is equityD/V: Percentage of financing that is debtTc: Corporate tax rare
More broadly, a company finances its assets either through equity orby debt. Weighted Average Cost of Capital is the average of the costs ofthese types of financing, each of them is weighted by its proportionate usein a certain situation. A weighted average, taken this way, determines theamount of interest a company owes for each dollar it finances. Debt andequity are the two parts that constitute a company’s capital funding. Equityholders and lenders expect to receive returns on the funds or capital theyprovided. Cost of capital is the return that equity owners and debt holdersexpect, with WACC indicating the return that both stakeholders expect toreceive.
Internal rate of return (IRR) is a metric used in capital budgeting, es-timating the profitability of potential investments. IRR is a discount rate,making the net present value of al cash floew of a project equal to zero. Theformula is:
Ct: Net cash inflow during the period tCo: Total initial investment costsr: Discount ratet: Number of time periods
The higher, the IRR of the project is, the more desirable it is to under-take it. IRR is uniform for investments of several types and can be used torank multiple prospective projects on a relatively even basis. IRR is some-times referred to as the economic rate of return, the discounted cash flow rateof return and the use of “internal” means the omission of external factors,like the cost of capital or inflation from the calculation. A popular use ofInternal Rate of Return is comparing the profitability when establishing newoperations and when expanding ones.
10
1.3.2 Shipping Finance Today
Shipping finance has always been a critical issue for both counterparties,lending institutions and shipping companies. The reasons vary, but mostlydue to the huge investments’ initial fixed costs, ship’s prices, making everylender skeptical about entering in shipping finance market. Before going deepin defining and describing the term “shipping finance”, it’s more preferableto see what is happening now and especially with Basel III. Shipping financehas always been risky like her “mother’s” type of business, and when thegood days passed and financial crisis came, lending institutions stop thefunding and Basel came for good. As a result many shipping banks left theshipping industry or minimized their shipping portfolio by tightening creditstandards, increasing spreads and shortening tenors, to reduce the exposure.Then, shipping market started to face financing difficulties and new roads offunding, just to stay alive and keep moving.
During the financial crisis many big banks gave up and bankrupt, acqui-esced and others merged trying to survive but consequences were still lethal.German banks came vulnerable after the total collapse of KG limited part-nership model of shipping finance either because they funded or promotedthem. Shipping industry after all became a particular focus area for assetquality review and stress testing and through Basel III framework, as a regu-latory initiative, impacted shipping finance significantly. Basel III were morestrict then the other two, in liquidity rules and capital reserves. So today,ship-owners and ship operators are changing financing policy slowly, by leav-ing the traditional bank loans and turning into capital markets or innovativefinancing ideas like leasing.
1.4 Funding
Financing sources are split into two common categories: Debt and Equityand some alternative ways that will be analyzed in the next subsection.Bonds are a typical way of funding through debt, but first the shippingcompany needs an IPO (Initial Public Offer) in a stock exchange market andthen has to issue the bonds.
11

1.4.1 Common Sources of Raising Funds
Shipping companies chose to enter the stock market, in order to raisefunds, financing their investments. So when choosing to enter the stock ex-change, an Initial Public Offering (IPO) is absolutely needed. Through anIPO the candidate firm issues shares to shareholders but with several requiredsteps. Firstly, there has to be issued a brochure where the appropriate sub-scription price is settled, the number of rights required to buy one new share,the ex-rights price of a share and a value of right, the effect of rights issueon wealth of existing shareholders and the role of investment banks in rightsofferings. The possible investors are being approached during a road showwhere the company is being advertised from the managers.
If a minimum number of shares isn’t sold in the show, then the IPO iscancelled. The initial pricing is made through fixed-price offerings, auctionand book-building. The last one is more preferred then the other two. Thekey factors on stock price behavior are the robust fundamentals, the efficient,well reputed management and the high cash flows and earnings. Additionally,the realistic market valuations, the mergers and acquisition corporate stories,the growth potential and the bullish stock markets but in shipping, specif-ically, upward freight markets and rick cash liquidity conditions are vital.Shipping companies use IPO’s for vessel acquisitions, asset play, debt repay-ments and trading activities. There are several share pricing puzzles, like theunder pricing one, the hot issue market and the long-run underperformance.
In case of seeking funding through debt, investors buy bonds in the pricesold the IPO day and her value is trading every day reflecting company’sfinancial situation. Bonds holders are company’s debtors, bond term is stablealthough the interest payable can vary and there are short term, mediumterm and long term but not more than 12 years. Corporate bonds can beconvertible or callable, are of a higher yield than the government ones butalways with a bigger risk of default. A convertible bond can be redeemed intoshare capital in a certain time like a stock option and a callable one can beredeemed only under company’s willing, before the end but with a premium.In the past many shipping bonds, fell on the BB+ category or lower, a noninvestment grade, they were called “junk” bonds.
In the paper ......., where is being examined what determines the rate ofthe spread in those specific kind of bonds, reflecting their return regardingtheir risk. The spread rate is in other words, the actual “price” that ship-ping market pays to the bondholder or in a more figurative way, spread is
12

the result of the theoretical discussion of the relation risk-return, putted topractice. Therefore, the conclusions of this article reveal that primarily whatdetermines a shipping bond’s spread is market-wide volatility and shippingindustry’s cyclicality from a more general point of view.
But more specifically, changes in the market value of the high-yield ship-ping bonds reflect its liquidity and the changes in its rating, its riskiness ofcourse. Due to the abovementioned idiosyncrasy of shipping, market seg-mentation, shipping bonds’ spreads are affected from the specific segment’slagged freight earnings. According to the examination of time periods dur-ing subprime financial crisis shipping bondholders wanted a higher freightearnings risk premium, leading to the high increase of their bond spreads.
1.4.2 Contemporary Ways of Raising Funds
And then, there are some alternative ways or raising capitals without in-volving financial institutions but completely lawful. Firstly we have the useof retained earnings, a complete healthy way of financing an investment aswell extending the share capital by issuing new stocks. Asset play, selling anasset high taking advantage of the high freight rates of the cycle at secondhand ships’ values and buying another one low. Another alternative financingsource in shipping are carte blanche and special purpose acquisition compa-nies. The former is company without any specific business plan or purposeor has just stated as one to be part of a non specific merger or acquisitionand is commonly used in speculative investment. The latter is a companycreated by citizens in order to raise funds through an IPO, that afterwardswill be locked in a trust until an investment happen or a certain time periodpasses. Until that period SPAC’s managerial personnel is working withoutgetting paid and if no deal takes place until end’s period, funds are returningto investors together with a refund to that bank and fees to the broker.
KS and KG are used in North Europe and at her peak contributed in thecreation of whole fleets but the main premise of those funds was that nationallaws allow less taxation on those forms’ earnings. Professionals from everywork field were interested in investing that way just to extend their tradingactions and business risk especially in Germany have been made partnershipswhere certain members had the absolute responsibility for company’s debtsand others a limited one equal to their amount of money they invested.Capital funds raised that way represented the equity and afterwards soughtfor additional financing from banks or other institutions so they can buy a
13

second had or a new building ship. Of course this kind of financing is notopen for everyone due to the fact that needs to be settled in a country thatalready has those laws.
Private investment in a public equity where potential advantages of areverse merger includes the ability to complete the transaction without en-gaging an underwriter, thus reducing overall costs, avoiding the IPO processrigors and long road shows. This alternative ship finance instrument is lessvulnerable than an IPO to the vicissitudes of the public markets and risk ofbeing unsuccessful and also has the ability to complete the transaction in ashorter time, provided the private company to have audited financial state-ments and other required information available at the time of the transaction.Furthermore we have private equity funding that has recently introduced inthe shipping industry means equity capital that is not quoted on a publicexchange and can be considered to have a complementary, yet independent,financing function to equity markets. Private equity consists of funding byprivate investors and funds that make investments directly into private com-panies or conduct buyouts of public companies that result in a delisting ofpublic equity.
Then there is mezzanine finance, a hybrid of debt and equity financing,is basically debt capital that gives the lender the rights to covert to an own-ership or equity interest in the company if the loan is not paid back in timeand in full. I t is generally subordinated to debt provided by senior lenderssuch as banks and venture capital firms. Since mezzanine financing is usu-ally provided to the borrower in short time with limited due diligence on thepart of the lender and limited or no collateral on the part of the borrower.This type of financing is aggressively priced with the lender targeting a re-turn at an estimated range of 20-30 percent and the reason that this kindof financing is advantageous is that is treated like equity on a company’sbalance sheet and may make it easier to obtain standard bank financing. Inorder to attract this abovementioned financing is by demonstrating a trackrecord in the industry with an established reputation and product, a historyof profitability and a viable expansion plan for the business.
Last from the list of the alternative ship finance instruments is the “At-The-Market” offerings where companies with no pressure to complete anissue within a tight time-framework, can proceed at their own pace and ide-ally have some control over what price the shares are sold at over weeksor months. Weather an ATM offering targets additional funding to repaydebt is an important issue for investors to evaluate and according to market
14

experts, increased trading volumes seen at times in a number of listed ship-ping companies may have been boosted by ATM share offerings rather thanprimary trading activity.
Ailing publicly listed shipping companies are also seen to employ this tech-nique to raise capital and recapitalize their impaired balance sheets. Whena shipping company is interested in selling a large trance of shares in un-favorable equity market conditions It will be extremely difficult to attractinvestors’ attention. But under these circumstances, institutional investorswould make a placement only in case they can acquire a percentage of sharesat a substantially discounted price. However these offerings when used topay down debt and recapitalize are highly dilutive.
Besides financing through debt, there are methods of raising money fromthe equity capital with securities issuing. In firm’s assets are expected togrow more than internally generated funds and external must be the one tobe raised to fill the gap and most of firms raise external funds needed throughborrowing. Shipping firms have high debt/equity ratios, albeit at diverginglevels and this holds irrespective of corresponding market segment supportingthe view that shipping finance is heavily dependent on debt funding over time.
Firms issue securities by setting an appropriate subscription price firstly,the number of rights required to buy one new share, the ex-rights price forshare and value of right, the effects of rights issue on wealth of existing share-holders and the role of investment banks in rights offerings. External equitycapital comes from two sources, common stock and preferred stock. Com-mon stocks are valuated by a dividend discount model so market efficiencyand equity pricing in an efficient market the observed share price is the bestestimate of the value of a share. The key factors for corporate value creationand an upward stock price in shipping are the upward freight markets andthe rich cash liquidity conditions.
15

2 Shipping Bank Loans
The most popular, historically, financing ships either second hand or newbuildings, as a source of capital were term loans. Based on the borrower’srelation with the bank leads to faster offering of the required capital fundscompared to other sources. The “fast money” factor plays a significant role inshipping, a market where speed of decision making can make the difference tothe best deal and it makes no difference to the ownership structure comparedto the ones requiring an IPO. But the most important factor is the nonrequired disclosure of business’s information to the bank and the public ingeneral.
Of course, before banks granted the loans to the shipping firms they firstassess them by credit analysis on their shipping department either if it’s acommercial or an investment bank. Total values of shipping loans that areadvanced globally through time isn’t always the same but keeps track withthe cyclicality of the shipping market.
At the peak counted 115 billion dollars, gaining 75 percent of the externalfunding in the shipping industry and at its fall together with the subprimecrisis fell to 32 percent of the total ship finance market and just 46 billiondollars. To begin with, bank loans are a financing medium where the lender(bank) offers capitals to the borrower(ship-owner) under a loan agreement.Loan agreements are flexible mediums which can be amended under bothparties’ will but also have a significant amount of mutual terms. All loanagreements refer the tenor of the loan, the fixed or variable spread, bank feesincluding arrangement and commitment ones mainly and law terms, meaningcertain conditions that borrower should fulfill lender’s rights in an event ofdefault and collaterals.
Collaterals are tangible or intangible assets in which the lender has accessin an event of default. Loans can be of two types, fund based as working cap-ital and term loan, and non-fund based as letter of credit and bank guaran-tee. The shipping finance portfolio has its own ship finance products that arebilateral transactions with the following asset-backed products like the short-term finance, including overdrafts and credit facilities. Long-term ones arefor post-delivery for newbuilding vessels, medium-term finance also knownas term loans are commonly selected for secondhand vessels, pre-deliveryfinance for newbuilding vessels, corporate loans and guarantee facilities.
One really interesting kind of bank loans that has recently emerged in theshipping finance market is the syndicated loan. When capital requirements
16

are over passing bank’s credit limit for a single client, they create a syndicatewhere every member of it covers a part of the whole facility. Syndicationsusually have a leader who is responsible for the negotiation of the terms andrequirements between the syndication and the borrower. After the end ofthat stage, leader bank manages the other syndicators’ credit flows to theborrower and reversely at the repayment stage.
Syndicated loans offer a variety benefits in addition to meeting fund-ing needs, depending on transaction purpose because they improve financialsoundness. That leads to the rationalization of company’s balance sheet,securing financing at prevailing market interest rates; also achieve flexibleterms that meet the requirements of company’s cash flow plan. Therefore,managing company’s funds efficiently, unify the terms of transactions withfinancial institutions and secure liquidity. Additionally, they result on en-hancing flexibility of financing due to the fact that they lead on facilitatingrising of large-scale financing, diversifying funding sources because syndicatedloans have become established as a key means of raising funds alongside bi-lateral loans and corporate bonds. In addition they help developing newbusiness relationships with financial institutions, reviewing company policytowards transactions with financial institutions and consolidating existingtransactions.
2.1 Shipping Banks
Lehman Brothers, a well known American commercial bank collapsedin 2008 marking exuberance’s end by commercial banks. Banks, after thecommencement of financial crisis changed their strategies and deleveragedabout the profoundly affected shipping industry. Western banks like HSH,RBS, Natixis, Lloyds Bank, slimed their exposure to shipping by minimizingtheir shipping loans portfolio. and some of them like Commerzbank and Bankof Ireland left for good. However there were some other banks-speculatorswho grasped the opportunity like ABN, DVB, ING and Credit Suisse thattook advantage of the shipping loans’ offering much higher yields.
From 2008 until 2015 the total European Banks ship finance global port-folios within the 40 top banks around the globe declined by 24,5 percentandwithin 1 year, they fell 4,5 percent.The banks that wished to leave the ship-ping industry altogether or downsize the possible damage started to sell offparts of their loan portfolio at a discount price. In the beginning the above-mentioned banks who slimed their exposure were examples of such sales with
17

favorable terms for them in the performing an strong loan portfolios. Fur-thermore private equity funds like Oaktree and Carlisle were interested byconcluded deals.
As the shipping market declined in dry bulk, tankers and container ves-sels, selling more loans was harder and the ones already sold got affectedfrom that decline going through restructures. Banks hoped for a shipping re-covery and an increase in 2013-2014 on the rate of loan sales. Furthermore, itbecame harder for banks to find buyers for their loan portfolios, so the onlyclients were private equity funds, though wanting heavy discounts for thedistressed loans. At the second half of 2014 loan portfolio sales slowed downbut the funds started picking loans on a case by case basis that met theircriteria. As the market continued to be poor loan discounts went deeper andsome banks sought to find clients to sell whole fleets but US private equityfunds’ demand remained strong. Those funds grew explosively in size helpingshipping to be considered as an attractive area for growth and profits. Loandiscounted sales are beneficial for the banks because they allowed them togrow again utilizing the good client base. They cleared their loan portfolioand involving loans with lending terms and conditions, a lot more attractive.
2.2 Relationship Banking
But the ones with the biggest importance in predicting the probabilityof default are the one measuring the current and expected of the futureconditions in the freight market. In addition is the obligor’s risk appetitereflected in the chartering policy when he decides between time charter orvoyage. From the bank’s perspective, the way she assesses the undertakenrisk of the loan is reflected by the percentage of the arrangement fee. Manyempirical studies showed that, before and after a shipping loan is grantedthe reasons are found in the relationship between the bank and the shippingcompany. In shipping finance the qualitative factors are the most important.
Despite turbulent times, like the subprime financial crisis but also in for-mal and uniform environments with measurable rigorousness, it’s all aboutthat relationship. This is what not only increases bank’s willingness to takemore risks in relation to loan borrowing and also in assessing more accuratelyits performance. Although those days are the ones with shipping banks moreprudent about financing this industry. That leads to shrinkage of their ship-ping portfolios and change in the nature of the abovementioned relationshipwith more formal and rigid criteria in the lending procedure.
18

2.3 Basel Accords
Due to the Basel IV framework and the constraints on the capitals, mon-itoring and European Central Bank regulation in increase, huge losses onloans and provisions, policy changes on lowering the risk undertaken abouttheir portfolio, European banks reduced their ship lending appetite. There-fore, the ones benefited from this situation were the Chinese and Asia basedbanks that focused on publicly owned and large private shipping groups. Alsoexport credit institutions centered in China and Korea becoming the leaderin the newbuilding finance. Chinese, Japanese and Korean leasing companieswho are associated with major banks were benefited too due to the advantageof less strict capital requirements compared to the western ones. Shadowsbanking providers or investment funds are emerging with their own way offunding and client selection gained advantage as well as some new banks likeMM Bank in Norway, Berenberg, Warburg, Pareto Bank, Carnegie Bank andothers with margins at 4-5 percent and loan to value of 30-50 percent.
Basel III framework was created to strengthen the capital adequacy andbanks’ liquidity and it isn’t directing to shipping but the requirements willaffect it the industry. They had a serious critique from the banking sectorbecause it imposes restraints on long-term lending. Despite this, maybeit will have a live-saving impact to a more balanced approach introducedto shipping finance. Shipping banks suffered, when a mismatch happenedbetween their long-term shipping loans and short-term liabilities. Basel IIIdeveloped minimum standards for funding, in order to reduce banks’ risk of iton a longer horizon to require those funding assets with a minimum amountof stable sources.
The second standard of liquidity was to promote resilience short-termlywith requirements of maintaining sufficient assets of high quality convertibleto cash. Basel III also, required for shipping banks to reduce shipping loans’tenor when shipping industry has relied on facilities of 5 to 10 years tenors fortheir capital expenditures. So shipping companies seek for alternative waysof financing like the high yield debt market with multiple advantages such asthe long maturity, incurrence based covenants and lower spreads. The latestBasel accord is the Basel IV that didn’t cause many changes as the previous,just keeping a higher amount of capital as compensation for the shippingloans with more financial expenses at the industry. Basel IV will just pushmore shipping companies to turn to bond market.
19

2.4 Case Study ”DVB Bank SE”
After discussing about the banks and their role into shipping finance, it isreally helpful to examine a typical shipping bank, like DVB Bank that almosthalf of her loan portfolio is involved into all sectors of shipping industry. Ichose a timeline that starts from the appearance of global financial crisis of2008, that affected hugely the shipping market and of course the way thatshipping finance changed and the exposure of shipping banks declined. Theend of timeline is the fiscal year of 2017, where a certain recovery on theindustry has made its entrance. As criteria of DVB’s behavior I selected herexposure in shipping by the percentage in her entire portfolio and also as theamount in USD, every year.
DVB Bank overview
DVB Bank SE is part of the DZ BANK Group, specialized in internationaltransportation finance and her headquarters are in Frankfurt/Main, Ger-many. DVB is a listed on the Frankfurt Exchange from 1988, with officesin Europe, Asia, North and South America. In addition, provides financingand advisory services in the global transportation market and specifically, inshipping (45,9 percent), aviation (33.6 percent), offshore (9.3 percent) andland transport finance (6.2 percent). The bank was founded in 1923 with thename Deutsche Verkehrs-Kredit-Bank AG as several banks and industrialcompanies, after 1949 unified in two locations and the latest name changewas at 2008, as DVB Bank SE. In 2016 her market capitalization was 1.25bn dollars.
DVB’s Shipping Finance division
DVB’s Shipping Finance provides to her clients with support and lendingsolutions. Maritime clients vary from small to large public and privatecompanies, shipowners, shipping companies, trading houses and charterers.DVB’s assets financed are among others, tankers of crude oil, gas, chemi-cal and product, dry bulk vessels, container carriers, container boxes andRo-Ros. Therefore, her products and services range in shipping finance are,structured asset lending, encompassing mainly senior secured and secondlien structures. In addition is the risk distribution and loan participations,encompassing syndication activities and assisting at Transport Finance and
20

Investment Management business divisions in raisinf non-public market debtor equity.
DVB also finds suitable bank partners to join in its financing of transportassets, on an underwritten or book building basis, as well as when sourcingliquidity either in form of mezzanine and equity acts as central and coor-dinator for financial institutions of a wide range. Deutsche Verkehrs Bankoperates also in corporate finance solutions, advising clients in mergers andacquisitions, private and public placements of debt and equity instruments.More specifically, provides solutions to two sectors: Advisory and MA aswell as Capital Markets. In the former, include balance sheet optimization,corporate strategy and value maximization, restructuring advisory, deal ne-gotiation support and liquidation management. Additionally, sell-side andbuy-side advice services, focusing on conventional mergers, joint ventures,divestitures, privatizations and spin-offs, are part of the services.
On equity and debt capital markets services are disclosed follow-on equityofferings, private equity plus equity-linked products, convertible bonds andhigh-yield bonds, mezzanine capital, preferred shares through public issuesand private placements where are comprised asset-backed securities, projectbonds, receivables securitization and charter monetization. Last but not leastin her Shipping Finance division is the asset and market research, provid-ing with valuable and up-to-date information on shipping markets/segments,shipping assets and trade flows in distinct sectors.
21

ObservationsFrom the timeline’s start, the financial crisis of 2008, that the shipping
collapse started, freight rates decreased in every sector, but mostly in thedry bulk market. DVB however, during that times chose to adapt a newsectorisation structure from a regional geographical model. Through 2009,the economic slowdown continued with the shipping portfolio of the Germanbank, burdening given the traditional cyclical nature of the industry. Soduring a year the portfolio decreased its exposure by 1.5 bn dollars, fromalmost 14.6 bn dollars to 13.1 bn dollars. The same year, Lehman Brothers,one of the oldest and strongest American banks, as a victim of the crisis,collapsed, bringing anxiety to the overall banking sector.
During 2010, the shipping crisis hit many shipping countries in Europeaffecting the banking lending appetite and several banks left the industryfor good. So the competition went lower due to the more and more reducedshipping banks. DVB continued the sector approach and came closer toher clients with the known risk management strategy of relationship bank-ing. The bank also reduced the number of shipping finance sectors from10 to 8 and increased her lending volumes. In 2011 the sectors became 7(container business group, dry bulk group, chemical, LPG Product tankergroup, offshore support group, offshore drilling production group and cruiseferry group) when shipping was drowning in oversupply and irrational orderbooks as well as the continuing low freight and time charter rates.
In 2012, container ships, crude oil tankers and dry bulk carriers experi-enced the worst oversupply and freight rates, with scrapping reaching recordlevels. New regulations and increased oil prices made their appearance mak-ing the scene even more risky in terms of investing in shipping. 2012 wasyear with the hardest decrease in exposure percentage. In 2013, some cargodemand growth gave the shipowners the illusion of recovery, ended up onmore shipbuilding contracts and more supply surplus leading to lower rates.The exposure during the latter year, was significantly stable, descending only0.5 basis points. During the fiscal year of 2014, there was a cautious improve-ment in shipping and financial market conditions putting 0.5 bn dollars morein the shipping portfolio of the bank. The year was characterized of a risingdemand that unfortunately led to stronger supply growth putting pressurein the freight rates and asset values.
2015’s year was challenging for the shipping industry, while the oil pricewent lower benefiting the oil tankers by increasing the vessels earnings andvalues. During that year, DVB strategy led to client selection, risk manage-
22

ment and offered specialized financing solutions understanding the corporatecredit risk. The exposure kept stable, with a small decrease of 0.2 bn dollars.2016 was a year where the recovery for the dry bulk and container shippingbegan after 8 devastating years. Demand grew slightly more than supplyand freight rates revived. DVB during the abovementioned year, kept atsubstantial yet low level, to maintain the risk management and monitoringpractices. 2017 was struggling with overcapacity in most ship segments, withlow second-hand values and generally low demand for financing. DVB’s per-formance was affected by increased allowance for credit losses although theyear showed an upward trend with historical low orders. That movementstarted last year, with improvements in some market segments like the drybulk, and some others like the tanker market that remained low.
DVB’s range of exposure in shipping industry was 15.7 bn dollars to 11.4bn dollars, with an average of 13.35 bn dollars and a average percentage ofexposure at 49.8 percent during the timeline of 2008-2017. The maximumexposure, in terms of percentage, was at 2008, where the crisis began andthe minimum at 2014. In terms of money, the maximum was at 2012, at 15.7bn dollars and the minimum was at timeline’s end, 2017’s year, at only 11.4bn dollars.
It is absolutely obvious, the decline of exposure in shipping finance, likemany shipping banks chose to, in order to protect their portfolio from therisk of defaulted loans. The reason was the global financial crisis that yearafter year hit shipping market’s profitability for good. From 2008 that thepercentage was at her highs, at 56.7 percent, during the next 6 years reducedby 23 percent , by touching the lowest at 2014, with an involvement of 43.5percent in shipping finance. However, there was plenty of volatility in thepercentage range, with 2009-2010, a small increase, but from 2010 to 2011,a small decrease and again a peculiar ascending of 1,8 points during 2011-2012. This shows, exactly how the bank, wanted to take advantage of everyspeculating chance appeared to boost the shipping industry by financing her.
Of course, as every business in a crisis period where there is much uncer-tainty and decreased cash flow, wants to protect itself and stay away fromrisky business like shipping industry. DVB from the beginning of the ship-ping crisis started with 14.59 bn dollars, ending with 11.4 bn dollars, themost recent fiscal year, 2017. That shows, her desire, besides the harsh 9years passing, to survive without losing her leading role in the shipping fi-nance banking sector. Basel accords and especially Basel III, that the bankwas required to implement from 2013 until 2015, resulted on reducing the
23

exposure as much as possible, in respect of the Basel Committee. That pe-riod, we saw the shipping portfolio ascending by almost 17.5 percent during2012-2013.
2.5 Credit Rating in Shipping: Moody’s
Credit rating agencies in issuing letter “grades” provide objective analysesand independent assessments of companies. Credit ratings, debt ratings orbond ratings are issued to individual companies and to specific classes ofindividual securities such as preferred stock and corporate bonds. Ratingscan be assigned to short-term and long-term obligations. Short-term ratingsfocus on the specific securities’ ability to perform given the company’s currentfinancial condition and general industry performance conditions. Long-termratings analyze and assess a company’s ability to meet its responsibilitieswith respect to all of its securities issued. The Big Three Agencies, Moody’,Standard Poor’s and Fitch control nearly the entire market, thus makingthe global rating industry highly concentrated.
More than century ago, Moody’s rating systems evolved in response tothe increasing depth and breadth of the global capital markets, its needs forclarity around the elements of credit risk or to demands for finer distinctionsin rating classifications. The rating symbols and definitions of Moody’s arethe followed:
Aaa: Highest quality, subject to the lowest level of credit riskAa: High quality and subject to very low credit riskA: Upper-medium grade and subject to low credit riskBaa: speculative and subject to moderate credit risk and as suck may possesscertain speculative characteristicsB: Speculative and subject to substantial credit riskCaa: Speculative of poor standing and are subject to very high credit riskCa: Highly speculative and are likely in or very near default with someprospect of recovery of principal and interestC: Lowest rated and typically in default with little prospect for recovery ofprincipal or interest
Moody’s appends numerical modifiers 1,2 and 3 to each generic rating clas-sification from Aa through Caa. The modifier 1 indicates that the obligationranks in the higher end of its generic rating category. The modifier 2 indi-
24

cates a mid-range ranking and the modifier 3 indicates a ranking in the lowerend of that generic rating category.
Aaa-A3: Prime-1 (Issuers have a superior ability to repay short-term debtobligations)A3-Baa2: Prime-2 (Issuers have a strong ability to repay short-term debtobligations)Baa2-Baa3:Prime-3 (Issuers have an acceptable ablity to repay short-termobligations)Ba1-C: Not Prime (Issuers do not fall within any of the Prime rating cate-gories)
Moody’s Investors Service, of the big three agencies, provides creditratings, research and risk analysis, contributing to integrate and financialmarkets. Moody’s ratings and analysis track debt covering more than 135sovereign nations, approximately 18,000 public finance issuers, 5,000 non-financial corporate issuers , 4,000 financial institutions issuers, 1,000 infras-tructure and project finance issuers and 11,000 structured finance transac-tions. Moody’s rating methodology in shipping industry explains the above-mentioned agency’s approach to assess credit risk for companies in this in-dustry around the world. Additionally, intends to provide general guidancethat helps investors, companies and market participants in order to under-stand how qualitative and quantitative risk characteristics are likely to affectrating outcomes for shipping companies.
Credit rating in shipping industry uses a scorecard that is a reference tool,used to approach credit profiles within the shipping sector in most cases. Italso provides summarized guidance for the elements that are in general mostimportant in assigning ratings to companies in the industry. The scorecardis a summary that doesn’t always include every rating consideration, withweights showing each factor’s importance for rating decisions but actual im-portance may vary significantly. In ratings assessment in the shipping sectorthere are 5 factors that are mostly important. These are scale, profitability,leverage and coverage, fleet characteristics and financial policy.
To begin with, the methodology implements a broad range of shippingcompanies, including liquid and dry bulk carriers and other bulk cargo carri-ers, liner operators and diversified shipping companies. The rating methodol-ogy has five sections the identification and discussion of the scorecard factors,the measurement or estimation of factors in the scorecard, the mapping score-
25

card factors to the rating categories, the assumptions, limitations and ratingconsiderations that are not included in the scorecard, and the last containsthe determination of the overall scorecard-indicated rating.
Moody’s uses the corporate family ratings, those are long-term ratings,reflecting the default’s relative likelihood on a corporate family’s debt anddebt-like obligations as well as the possible financial loss in the event of adefault. A corporate family rating is assigned to a corporate family as ifit had a debt of a single class and a single consolidated legal entity struc-ture. Corporate family ratings, in general are employed for speculative gradeobligors and sometimes can be assigned to investment grade obligors, too.
2.6 Loan Procedure
The first process before the sanction is the credit appraisal, where is be-ing appraised the credit worthiness of the loan applicant. Credit appraisalmeans an investigation or assessment done by the bank prior before pro-viding any loans and advances or project finance. Furthermore, checks thecommercial, financial and technical viability of the project proposed. Theproper evaluation of the costumer is preferred which measures the financialcondition and ability to repay back the loan in future. The credit appraisal isalso a process with multiple stages and required documents where firstly wehave the receipt of application from applicant, then the receipt documentsas balance sheet, different government registration number, Memorandum ofAgreement and properties documents. Following is the pre-sanction visit bybank officers, the defaulters list’s check, the preparation of financial data, theproposal preparation, assessment of proposal, sanction/approval of proposalby appropriate sanctioning authority, the committee, required documents forthe agreement and the mortgages and disbursement of loan.
When looking in a shipping loan agreement, there are some key clausesfound commonly also known as commercial terms. They restrict the businessactivities of the borrower during the loan period, who wants the opposite, sothe negotiations of them are tough and have a difficulty when drafted. Soinside the heart of most financial documents are the abovementioned termsin addition with the financial ones, which in summary are called operativeclauses. The spread, the interest periods, the loan amount, the last avail-ability date and the repayment profile consist of the financial terms. Theoperative clauses are the ones who function as a protection for the risks thata banks exposed to before and after the drawdown as well as on termination.
26

Representations and warranties, conditions precedent, covenants, mandatoryprepayment, events of default, assignment and transfer provisions are the op-erative clauses in a shipping bank loan agreement.
During the loan procedure, an overview of Management and options is thefirst in order to qualify if a loan is good. An overview is all about the charac-teristics of the business and the related industry, management’s quality, thenature of the loan request and the data quality. Then it is absolutely requireda financial Ratio Analysis, including liquidity, leverage and profitability ra-tios. Afterwards, come the examination of the cash flow statements, whereare being seen the sources and uses of funds, loan payments’ sources and thetiming of cash flows for the loan’s payment. In addition it is important tohave a financial projection, meaning projecting financial needs of the bor-rowers, cash flows from the loan payment’s options and determining whenthe whole loan can be repaid.
In general, shipping credit analysis is done by a loan-officer who mustbe in a position assess the parameters of a qualitative model which, brieflyincludes management’s expertise and integrity, debt, equity and net worthalong with cash flows. Additionally, contains the mortgaged vessels and guar-antees for the loan, the external economic and financial environment, wherethe company operates. The model provides a deep knowledge of borrower’scompany and loans and the assessment should provide the probability of loanrepayment or default. However, besides the most common credit-worthinessanalysis method that will be discussed broadly in the next paragraph, thereare more methods of credit analysis process, like the financial analysis, thevaluation of securities, the costumer meetings and the business associatemeetings
2.7 Shipping Bank Loan Pricing
Besides the processes and documentations needed at the credit appraisal,there comes the most significant part of the lending, the pricing of the loan.So the key to loan pricing is to satisfy the bank’s requirements and remaincompetitive enough. Literally, pricing is the spread of the loan, interest ratecharged minus banks cost of funds that is equal to bank lending rate minusthe bank borrowing rate. Pricing a shipping bank loan is all about choosingthe fixed rate of interest and the levels of the fees, cover bank’s cost of fundsand provide the acceptable gross profit level. Along goes the contributionto reserve assets’ costs and provisions also called default risk premium and
27

providing an acceptable return to shareholders for the taken risk.The most important factors in shipping bank loan pricing is the cost of
funds, the gross profit level and the fees. To begin with the cost of funds,there is the cost of the costumer deposit held on savings and time depositaccount and the cost of funds in Interbank Offered market that dependson creditworthiness of the borrowing bank, includes the ‘London InterbankOffered Rate’ (LIBOR) of a time period either 3, 6 or 12 months. Thereforeis the gross profit level that is determined by spreads and fees reflectingbank’s administrative and overhead expenses and reserve asset costs andother provisions. Fees, when pricing a shipping loan are putted up front,in the duration or at the back end, are categorizes as commitment facility,penalty default, cancellation or termination and extension fees.
Average spread through time had shown that from 2005 until 2007 hada lowering movement, then after financial crisis came and until now is goinghigher and higher, nearly triplicated during 6 years. The amount of theloan will be based on a comprehensive determination of the profitability ofthe transaction and will not exceed the price of acquiring the vessel. Theloan period will be for the duration of the charter contract (including theconstruction period). A repayment schedule will be set in order to ensurethat the actual repayment period will be within the legally-defined period.
2.8 Events of Default
Inside the loan agreement there are events that if they happen might ac-celerate the loan, enforcing the security package. Events that are defined asevents of default might be an insolvency and commencement of her proceed-ings, cross default events, material adverse change, events related to the ship,a representation or covenant breach and more usually a non-payment. Bankshave the right to declare the default at its own discretion, but always accord-ing to the related legal footage. The most important part of the declarationis the actual assurance at a high degree that it really happened although itisn’t always absolutely clear. An event of default, that was called wrongfullymay render the bank on having liabilities on the possible damage or renderinsolvent the borrower’s business or its group belonging.
When pricing a loan, we’re taking also measures for the possible event ofdefault, like the default risk premium. This kind of premium, it’s actually thedifference between risk-free loan and risky one, contributing to assets costsand provisions and generally to the economic capital of the bank. It is a
28

provision of an acceptable return to shareholders for the taken risk, meaningalways that as we mentioned on previous chapter, that greater risk comes informs of higher spreads and also relates to the terms and conditions of theloan as the duration, size and collateral securities.
Besides events of default in shipping bank loans, there is also a defaultrate, which measures the credit risk in the High Yield Shipping Bond market.It reflects relative likelihood that there may be a difference between whatinvestors was promised versus what they actually receive by bond issuer.Here a default implies any missed or delayed disbursement of interest orprincipal. Among 1981 to 2008 the bonds with the highest default rate werethe ones with the duration of 3 months and CCC/C graded, with the 3 yearsand B graded coming next with a small difference.
2.9 Problem Loans
What causes a problem loan, meaning, a loan that would have compli-cations during its tenor, is the poor management quality, such as a lack ofdepth and diversity in management expertise. In addition, inadequate plan-ning and accounting systems, outright fraud as well as general incompetencecan lead to multiple problems. Furthermore, an inadequate initial capital-ization causes possible loan default because some owners underestimate thecosts of opening the doors for businesses and overestimate the speed at whichthey can turn a profit. Therefore, choosing high financial leverage exposesthe firm to large interest payments even when sales decline. Also, high oper-ating leverage exposes the firm to substantial depreciation and maintenanceexpenses when sales decline. A firm’s operating problems are accentuatedwhen it grows too fast.
That leads into slowing inventory’s turnover and collection of receivables,increases operating overhead so more assets are needed and more financingis required. Strong completion pushes the firm to regularly improve existingoperations and introduce new products to remain competitive and react tothe competition offensively or defensively because if it doesn’t adapt, eventu-ally decays. Last problem cause, but not least could be a possible economicdownturn because many firms cannot generate sufficient cash flows when theeconomy slows down. So they don’t have assets to sell or expenses to cut,resulting into having a strain on their cash flows, forcing them to rely onincreased bank borrowing until economic growth accelerates.
Common reasons for most loan losses could be overvalued collaterals,
29

improperly margined so they fail to get the appraisal. Possible dispersalof funds before documentation finishes and if the bank officer makes “goodold boy” loans, bypassing the loan committee due to personal friendshipwith the borrower. In addition, granting a loan to a new business with aninexperienced owner or manager could lose a loan as well as renewing onefor increasing amount, with no additional collateral taken. Another commonreason to lose a loan is rewriting repeatedly a loan to delinquent interest dueand not analyzing borrower’s cash flows as well as repayment capacity. Anofficer can fail to review a loan status frequently enough and also the fundsto not be applied as represented, diverting to borrower’s personal use maybe the reasons of a possible loan loss.
Losing a loan happens sometimes, also because the repayment plan isn’tclear or not stated on the face of the note. Along goes the failure to receive orinfrequently receipt of borrower’s financial statements and to realize on col-lateral because borrower raised nuisance legal defenses. Sometime the bankmay fail to follow its own written policies and procedures or the president ofthe bank may be too dominant inpushing through loan approval. Ignoringoverdraft situation as a tip-off to borrower’s major financial problems andalso a failure to inspect borrower’s business premises can lead into a loan loss.If the lending is against fictitious book net worth of business and with noaudit or verification of borrower’s financial statement is a common reason.As well as failing to get or ignore negative credit bureau reports or othercredit references. Failing also to call the loan or to move against collateralquickly when deterioration becomes obviously hopeless is a good reason fora lost loan.
2.10 Post-Sanction
After the end of the credit appraisal, when the loan agreement it’s done andthe loan is granted to the borrower, it seems that the loan process is mostlyover. The last stage of it is the credit review, where the performance of theoutstanding loans is being monitored and the handling of problem loans isdone. In addition, a scheduled information submission and routine checkout on the adherence of loan covenants are required and the problem loansworkout that most of the time is a “to-be-or-not-to-be” issue. Mostly postsanction activities such as receiving stock statements, review of accounts, re-new of accounts on regular basis. The loan administration and especially thepost sanction process can be broadly classified into three stages, the follow-
30

up, the supervision and the monitoring. Together they facilitate efficient andeffective credit management and maintaining high level of standard assets.
2.11 Refinancing
There is a post-sanction option when a loan it’s too risky and all predictionsare negative about its in time repayment, it can be refinanced by negotiatingand improving the terms of it and your finances. It’s more like replacingthe existing loan with a new one, which pays off the current debt by noteliminating it when you do the procedure. The process has 4 stages, thefirst is when you have that loan you need to improve somehow, and thenyou seek for a new lender with better terms and apply for that loan. Thethird stage is when the new one pays off the existing debt wholly and thelast one when you start to make payments for the new loan until you payit off or refinance. The advantages of that procedure are the money savedfrom higherinterests costs of the previous problematic loan, the payments ofcourse are lower due to the lower interests. The loan term is shortened, thedebts are being consolidated, the loan type is changed and that you pay offa loan that is due, not defaulted. Disadvantages are the transaction costs ofthe procedure; the interest costs may be higher in order to extend the periodor to lower monthly payments. Some benefits that the previous loan hadmaybe lost if you choose to refinance but what doesn’t change is the loanbalance, the collaterals and the payments.
2.12 After the Default
There is a standard technique with actions and procedures applied accord-ing to previous experiences, EU regulations and Central Banks dictationssince 2014. The first key step when handling problematic loans is the earlydetection but also immediate action, with a work-out or a liquidation plan,is important too. The frontline officer whose credit or particular obligor hasbeen assigned and he’s the one to downgrade the borrower. In order to detectthe problem is firstly to follow shipping market movements and prospects. Iffreight rates downward, the officer should be alerted of any rate renegotia-tions and delays in hires’ collection. Liquidity pressure reflected in bloatedtrade payables and poor maintenance are useful indicators needed good in-formation flow, though. Financial statements hide clues of poor profitability,inadequate working capital and delays or overruns in new building projects or
31

on scheduled repair works too. Of course failing to pay interest and principalinstallments are the most easily detected acute problems.
Once the problem is detected there are two kinds of methods to choosefrom. The one dictates that once the loan default emerges, the bank switchesthe whole management from the responsible officer to the “special creditsdept.”. So they take over and decide independently the strategic moves. Thesecond method dictates the abovementioned dept. involving less stringently,allowing the responsible bank officer to handle the loan without supervisionand guidance from the specialists. This is happening supporting the viewthat the bank officer through the years has developed a level of rapport withthe borrower. So he has the clear picture of the borrower’s predicamentand their relationship amplifies the chances of the uninterrupted informationflow. Despite this, due to the fact that handling a problem loan is reallycomplicated and unpredictable and every defaulted loan is unique. So thebank gathers a group of consultants from every profession needed to worktogether.
Remedial action by the bank is absolutely indispensable when the loandefault approaches. Technical default starts when the covenant loan-to-valueratio breaches, first the remedial action just restore the compliance with theterms. But if principals and interest payments are missed then bank startsto be stricter with the borrower. There are two options, the restructuring theloan with negotiations one and the more amicable, the bank to get her moneyback in a forced way. Along comes the moment for the bank to review themortgage documentations. Specifically is done the further examination ofthe collateral vessel about her condition, fair market value and whereabouts.Then, it’s planed a meeting with the borrower for further information forthe initiation of a work out plan but also to estimate the potential loss.Afterwards starts the liquidation with or without the client’s cooperation,identifying the primary and secondary sources of repayment. Next is thesearch of the creditors according to the trade debt of the borrower and themaritime liens in priority.
32

3 Risk in Shipping Finance
3.1 Risk Drivers in Shipping
Maritime business is overall highly risky, unstable and absolutely unpre-dictable. This is happening due to the fact that is a capital intensive-kind-of-business, meaning that all of her investments have a high starting cost ofcapital, putting barriers to new-comers and of course putting enough risk.Furthermore, has the characteristic of cyclicality, that means has her peaksthen goes down, reaching her trough moments but next she goes up andall this process again and again, sometimes facing longer cycles and othershaving faster ones. Moreover, shipping follows seasonality, defining it as nothaving uniform revenues throughout the economic year and following busi-ness cycles as well. She is market segmented across types of commodity, forexample if we are talking about dry market; it depends from grains, agricul-tural, coal, iron ore’s demand. If we are discussing about wet market, thenis crude oil’s and oil products’ demand. Maritime business is also segmentedacross vessel sizes and types, meaning different size have different demandand supply as well as the same happening with different types of vessels.
One typical idiosyncrasy of shipping industry is her overall high volatil-ity and volatility is the most critical parameter for risk management andderivatives pricing. Volatility is defined as a statistical measure of disper-sion of an asset’s returns, reflecting the level of uncertainty or risk aboutsize of changes in asset’s value. Higher volatility means that an asset’s valuecan potentially be spread out over a larger range of values because assets’prices in shipping can change dramatically over a short amount of time up-wards but yet often, downwards. On the other hand, lower volatility meansthat asset’s value does not fluctuate majorly but changes at a steady paceover time, so the higher the volatility the riskier the asset, the vessel, youown. However, volatile properties are interesting to discuss, because in ahigh volatility environment, spot freight rates are expected to move aroundaggressively. Opposing, in a low volatility type of environment, they’re ex-pected to move around very little, so when it’s being talked about trends involatility, means she has changed from calm to volatile or the opposite thing.
However, shipping companies as shipping operators and sometimes ship-owners undertake a multiple amount of risks due to the type of shipping
33

business. Company’s “factory” is way too far from the assistant office andthis is causing communication, management and monitoring problemsandalso additional communication costs that due to the long distance isn’t of-ten. Therefore, revenues’ volatility is makingthings harder to manage as wellas the right decisions to be taken. Additionally, as we mentioned above, dueto the inability of predicting the critical factors of shipping market, like shipprices and freight rates. Shipping company’sunobstructedoperationsare neg-atively affected from many external factors like port strikes, canals’ blockadesand foreign countries restrictions about importing and exporting goods. Seaservices create a huge multinational interaction due to the global capital andlabor force transfers. In addition, global political and financial developmentsof sea services’ demand and supply put transport costs’ predictions in dan-ger. Last but not least shipping financing is mostly done from banks thatfinance ship-owning companies all over the world even if the country originof the two parties is completely different.
3.2 Shipping Market Risks
Freight mechanism, due to its character creates many risks in shippingfrom broad sources like business, liquidity, default, financial risk, political,technical, physical, credit and market risks. Relating to the particularities ofshipping market and its analysis, the main major risks are belonging to thetwo last abovementioned categories, market and credit risks. Market riskscan be the variability of freight in short time periods, of total income, fuelprice, running costs, new-built and second-hand ship as well as scrap whodetermine the withdrawal of any excessive capacity which affects the supplybalance. Same variability is showed due to technological developments oradjustments who affect operating or capital costs, due to changes in theinstitutional framework, affecting the factors that determine operating costs.
Variability on the loan interest and exchange rate, particularly whereloan payments and collections take place in different currencies and alsoannual maintenance cost variability in the context of the operational man-agement policy applied by each ship owner. Market can show variabilitydue to weather conditions, political developments and even natural disas-ters. Equally important risks are also the one driven from shifting towardspurchases of ships of different capacity, geographic variations of freight inrespect of ships of the same capacity, locality of the supply/demand balanceand financial risks due to selecting a certain loan currency.
34

The other major category of risks, the credit ones can be the counterparty’s solvency, the default risk, relating to all forms of it including techni-cal, financial, failure to make interest or capital payments for a long periodof time etc. Next, comes the exposure risk, which refers to the borrower’soverall exposure to risk and his shipping portfolio diversification. Then isthe recovery risk, meaning the level of security of the financial institution incase of default or insolvency of the borrower. This kind of risk is difficult inparticular if you want to determine it because vessels’ are serving as securi-ties and their prices are not constant and depend on many market risks aswell as the legal risks involved in the transaction process. The credit spreadrisk is another significantly important risk arising from the up’s in the creditspreads, particularly when a second market has developed and its prices arebeing determined according this specific market. Of course, choosing cyclicalor counter-cyclical policy about maintaining liquidity margins contains al-ways important risks because some tend to follow the cycle and other applya mixed investment and disinvestment strategy.
Ship-owner’s and the ship manager’s policy in terms of his participationin practices and the overall orientation in asset management, operating andchartering yield of the fleet. Preserving the cash flows, general and instantliquidity maintains several risks as well as what the ship-owner chooses interms of long-term borrowing potentials. Ship-owners tend to vary theirpolicy when it comes to financial leverage and ship managers to the typeof chartering being applied either if it is voyage, bare boat or time charter,with its own risks. Last but not least participating in the credit risks is aboutthe yield of each vessel and its employment during one year. So banks inorder to protect them and act proactively are preoccupied to make a creditrisk assessment (CRA). CRA models adopted the bank take into accountall possible factors into appraising the risks associated with the loan. Thesefactors duly weighted are aggregated to arrive at a credit decision whetherloan should be given or not.
Besides the abovementioned category of the broad sources of risk in ship-ping, there are the specific ones meaning the ownership risk, including everyrisk undertaken when someone holds a vessel in his/her portfolio. That meansbeing exposed to price fluctuations and more serious ones like accident andlosses. On the other hand, operators or managers are exposed to the op-erational risk, which is particularly shown in day-to-day operations of thevessel including freight and revenues as well as costs and expenses relatingto its activities. So to conclude about the risks we have to mention the main
35
financial risks which are the freight, exchange and interest rates risks as wellas the bunker price, vessel’s value, counterparty risk and last the externalevents, global shocks and crashes.
3.3 Cyclicality
To begin with explaining the shipping cycles and their definition, weshould firstly discuss about a significant idiosyncrasy of shipping, cyclicality.Seaborne trade, besides high volatility, seasonality, capital intensity, vulner-ability from business cycles is also a cyclical industry. The type of industrywe are calling cyclical is the one that is vulnerable to business cycles. In thatcase, revenues tend to be, in general, higher to periods that are defined offinancial prosperity and expansion. However, in periods that economy goesdown, characterized by financial downturn and contraction, generally, thesame happens with the revenues. The cyclical fluctuations are the above-mentioned time periods, from the peak to the trough of the business cycle.Demand, either if is consumers or business’s, falls during downturn and risesup when things go better. Businesses, in order to survive those fluctuations,tend to cut costs and take investment decisions with a delay.
Cyclical risks are the business cycles’ ones or the economic kinds thataffect adversely companies’ profits, investments’ returns and assets’ values.The abovementioned risks are due to the cyclic movement of global economy,from peak to downturn and after a trough of low activity. Between thefat and the skinny cows, investments are experiencing values falling, profitslowering and an amount of uncertainty about the future returns. Risks ofcyclicality do not have, generally, a tangible measure but they’re reflectingon assets’ prices or valuations. Cyclical risks are systematic ones and theyaffect broadly, market economies. For example, recent financial crisis of 2008triggered the beginning of a recessionary cycle with negative impacts on manymarket areas but mostly in financial services.
3.3.1 Shipping Cycles and Risk
A typical shipping cycle has 4 stages. The first is called trough and hasthree traits. The first is the surplus of shipping capacity and slow-steamingto save fuel. Then freight rates fall to the operating cost of the least efficientships, moving into a lay-up. Next, comes the negative cash flow due to thelow freight rates and the tight credit. Financial pressures are building up,
36

leading to stagnation as tough decisions are put off and distress. Old ships’prices fall to scrap prices, resulting on an active demotion market, where theseeds of a recovery are showing and a state of calmness comes in. In thesecond stage, called recovery, supply and demand move towards equilibriumand freight rates are edging above OPEX. The laid up tonnage starts tofall and confidence, to gradually grow although there is uncertainty in themarket. Despite optimism, there is still doubt about the recovery I real.Furthermore liquidity improves, second-hand vessel prices increase and themarket becomes prosperous.
The third stage, called peak or plateau characterized of surplus beingabsorbed leading to tight demand and supply. Fleet is operating in fullspeed, freight rates rise becoming 3 times as the OPEX, increased liquidity,higher earnings lead to excitement and bank are keen to lend against strongasset values.Then comes the time where new shipping players are entering inthe industry, over-trading starts. Second-hand prices are higher than theirreplacement cost and older ships are bought without inspection. Ordersabout new-buildings increase slowly in the beginning and then a lot faster.The duration of the peak lasts from a few weeks, to, even, several yearsbut related to pressures of supply and demand balance. Obviously, as theduration is growing so does the feeling of excitement.
The last stage of a shipping cycle is the one called “collapse”. When ship-ping industry is at the stage, which means supply overtakes demand, leadingto the convulsion of the market. Freight rates fall rapidly and abruptly,vessels reduce operating speed and owners do not want to sell their vesselscheaply. However liquidity remains in high levels, less attractive vessel waitto be chartered, market start to feel confused, it’s constantly changing withthe rates and doesn’t want to accept peak’s end. The collapse is usuallyformed by the downturn of the business cycle, port’s congestion clearing,vessels deliveries ordered at the peak. Depression is in general reinforced ofthe above-mentioned drivers and in addition of an economic shock.
Shipping cycles, similar to business cycles are either long-term, medium-term or short-term. But at the center of cyclicality is the long-term cycleand due to its importance, will be the one to be discussed first. Long-termcycles are mostly driven by financial, technical or regional change, makingthem highly important although they have a certain difficulty in order todetect them. Kondratieff was the first to develop the long-cycle theory ofthe world’s economy. He identified that major Western countries, from 1790to 1916 had three periods where the economic activity was characterized
37

of slow expansion and contraction. The length between cycle’s peak andtrough was 20-30 years and from trough to trough lasted almost 50 years.Schumpeter supported the view that technological innovation explains thelong-term cycles. Another scientist, Braudel identified of long cycles lastingnearly a century or more. After all, shipping history made it clear that longcycles are driven from long-term social, political and technical changes.
Short economic cycles were firstly discussed after a series of brutal crisesin UK economy in the 19th century. Scientists defined those crises as partsof a cycle, easy but conspicuous to see. Those short-term cycles were char-acterized with a periodicity irrespective of duration either if they’re of anequal length or not. Lord Overstone said that “the state of trade revolvesapparently in an established cycle of quiescence, improvement, prosperity,excitement, overtrading, convulsion, pressure, stagnation and distress. So,according to Overstone, the structure of short cycles in modern shipping isconsists of four basic stages, the market trough, than a recovery, afterwardsa market peak followed by a collapse. The trough lasted 4 years, reached apeak 7 years after the first market peak and then fell aggressively. While theeconomy was at the trough, the market started to recover in 8th year, fail-ing and slowly subsiding to a recession again at the 10th year. In shipping,those kind of abortive recoveries result from counter-cyclical ordering. Dueto the fact that investors foresee the recovery, tend to order a big amount ofcheap vessels, dampening the supply off the recovery. If investors were lessaggressive shipping cycle lasted not 7 but 4 years.
The last category of shipping cycles includes the seasonal ones that occurwidely in shipping industry. The reason that causes this kind of cycles arefreight rates fluctuations in a year and at specific seasons responding to sea-sonal patterns of sea transport’s demand. In the agricultural trends, freightrates for ships carrying grain, form a noticeable cycle due to harvest’s tim-ing. For example, during September and October in North America there isa surge in grain movements because the harvest is ready to be shipped. Insummer there’s a quieter period because the shipment of the previous sea-son’s stock is running down. Same happens in the reefer trade related to thefresh fruit movement during the harvest in the Northern Hemisphere as wellas the peak demand of oil stock in the winter.
Shipping cycles and shipping risk are inseparably tied, with the lattertechnically defined as the “measurable liability for any financial loss arisingfrom unforeseen imbalances between the supply and demand for sea trans-port”. Generally, shipping cycles have their own key risk features. Firstly,
38

there are two prime risk-takers, the ship-owners reflecting the supply sideand the cargo owners, reflecting the demand side. They both try to bal-ance, adjusting supply to demand, and when they fail to, the one or theother losses money. Due to the fact that demand and supply, practically, arenever exactly balanced, so freight rates fluctuate around the break-even costof transport trend. Cargo owner’s risk, in a short-term cycle starts whenfreight rates rise above the trend cost and reach the peak. In opposition,ship-owner’s risk starts when freight rates fall below the break-even cost oftransport line and maximizes when it hits the trough.
When there is a demand surplus, meaning that cargo owners have toomany cargo then freight rates are shooting above the trend. Cash is trans-ferring to the ship owners, who respond by ordering more vessels in orderto balance the demand to supply. When the opposite happens and a sup-ply surplus occurs, meaning that there are too many vessels in the market,freight rates go below the trend. That leads ship-owners end up subsidingthe shippers and they cut back on investment. When the latter happens,cycles start exerting economical pressure in order to fix up the imbalancedsituation, so rates go back to trend.
Volatility of the cycles, gives to individual companies, the advantage to“play the cycle” and in the same way to be exposed to shipping risk. Theway that ship and cargo owners choose to adjust their exposure, is the samewith the one controlling the development of the market cycle’s supply side.Furthermore, when deciding in which way to charter, both ship owners andshippers either choose to take the risk or pass it. It’s worth-mentioning thatregardless the decision they take, shipping risk’s amount isn’t changing butit just redistributed. Every party of course has her own strategy in everycycle’s stage, because risk distribution between spot and period market is amatter of policy. Both markets have cycles, with the former to have the mostvolatile ones.
3.3.2 Shipping Companies Through Cycles
When analyzing short and long shipping cycles, people and the way theyreact on signs that market prices send. Changes in freight rates and ships’prices are the ones marking the next round of investment decisions. Highfreight rates cause new building orders and supply surplus affect them neg-atively, while low freight rates delay the orders and encourage market de-pression. At the lowest part of the cycle, the trough, orders reduction and
39

depression increase minimizing supply led on the rise of freight rates. Ship-ping cycles create an environment where weak shipping companies are pushedoutside the market, leaving the strongest free to survive and prosper.
Shipping companies, when shipping is experiencing a collapse period theyfollow certain strategies to reduce the cost in order to survive. First of all byusing the slow steaming strategies, where shipping companies reduce vessels’speed so the fuel consumes get reduced to. This way they somehow offsetlow freight rates because if vessels slow down 10 percent of their speed, thereis a 25 percent fuels consume. But this strategy result on occupying morevessels because the frequency needs to stay the same. Laying up the fleet bystop using vessels and anchor them in ports because they aren’t productivewhen in force. During hard times deliveries in shipyards are cancelled orpostponed because orders and deliveries are happening in different times. Sofor some shipping companies, orders of many ships are unprofitable to deliver.However those contracts resold in a discounted price to shipping companieswho had the appropriate liquidity.
Orders, off course, start to reduce because in terms of financial crisis theabovementioned should be almost at stagnant. Another survival strategy isscrapping each company’s old ships due to their high maintenance cost thatmakes them too expensive to operate during the financial crisis. The mostimportant factor that makes demolition profitable, is steel’s price, exchangerates of the country where the scrap yard is located and other market factors.So, many ship owners prefer keeping those vessels until they decide that is theright moment to scrap them. However, although during the financial crisismost shipping companies suffered, there were others that not only survivedbut expanded and upgraded their fleet. Of course the few companies thatachieved that, had made the right choices and followed the right strategiesat market’s peak as well as taking advantage of the opportunities given.
Greek shipping has always been family business, passing this culture fromone generation to another with a high degree in technical “know-how” of mar-itime industry. They used to finance their investments through relationshipbanking and disclose their business plans. As familiar businesses, Greek ship-ping companies were characterized of high self-discipline and taking fast andflexible decisions. So as this knowledge about shipping is passing from fatherto son, is giving him the required supplies in order to manage a shippingcompany in the future. In addition, all this culture helps Greek ship-ownersto predict shipping cycles and use the counter-cyclical behavior.
Counter-cyclical behavior means that, the ship-owner chooses to buy
40

when the market is low so he can get a ship in a more cheap and favor-able pricing than buy it at the peak of the market. He will also wait, untilthe market overpass the trough and starts to rise until the peak comes anddemand is bigger then supply, vessels’ values start to increase and shippingplayers want to buy in any price. So this is a successful asset play where thereis an income absolutely depended on knowing the market and forecast theshipping cycles’ duration and stages. They do the same with new-buildingstoo, ordering them when the cycle is low and shipyards are characterized ofovercapacity and low demand. This is the secret of Greek ship-owners growththat makes them unique in the shipping world.
Greek ship-owners do not prefer IPOs because they’re afraid of losingtheir company’s control, when in Greek shipping; ownership comes alwaystogether with administration. Furthermore, Greek shipping families tend togain earnings from asset play. However asset play in order to be successfulshould be done in the right moment, so the ship-owner must forecast it. Ifthe shipping cycle is at its trough, then there will be huge losses. So whenthe shipping company forecast it right, can make bigger profits but the riskis bigger. Therefore, their forecasting talent is due to their experience inthe market. Also, Greek ship-owners don’t choose public markets not onlybecause can put their asset’s values in risk but because of the lack of financialknow-how. Another reason is their preference in bank loans because they canborrow money in more favorable terms so they don’t want to undertake thepossible risk of an IPO.
3.3.3 Shipyards Through Cycles
A normal cycle, in terms of ship building, starts at a low level of newbuilding prices that leads into massive ordering, ending up having excessship capacity. As the freight rates fall, ship buildings orders slowdown andscrapping increases. Then freight rates recover and the demand for newbuildings increases again together with the investments in shipyard capacityresulting on decreased new building prices. Furthermore, it is obvious thatcyclicality holds in check, commercially. Capacity of shipyards is a variable,politically dominated and specifically for the three major shipbuilding coun-tries including China, Korea and Japan. All that, led to a non stable marketin terms of newbuilding prices regarding demand-supply balance.
In the last decade shipbuilding output has experienced globally a supercycle from 18.3 million CGT in 2001 to 52.6 million CGT in 2010, in other
41

words, a 12.5 percent growth rate. This surge started after the developmentof the major shipbuilding countries in Asia, with Japan at 1975 accountedfor the 52 percent of the total global shipbuilding production. Then followedSouth Korea and China, with the latter, within 13 years increased her marketshare in ship building industry more than 5 times. China between Japanand Korea, experienced the strongest growth in her shipbuilding capacity.Especially during the peak of 2008, 50 Chinese shipyards delivered their firstvessel, with a small decline in 2013. This decline didn’t lead into a globalbalance between supply and demand although the government supported thesector by thinking about it as a critical industry for the national security.The reason China got that boom in her shipbuilding industry due to thepeak of 2008.
Local government encouraged new shipbuilding capacity so they can takeadvantage of the tax-sharing system. Of course due to having order bookcoverage that lacked sufficiency and lacking down payments for new orders,there were liquidity problems. However, the Chinese government in orderto maintain and protect her long-term market share in shipbuilding andoffshore industry, started to channel new orders to its state owned yardsand helped consolidation. The Chinese Export Import Bank, also providedloans to foreign ship owners in order to support domestic shipyards orders.Furthermore, the government took a plan of a certain amount of shipyardsthat decide to support. On the other hand Korea stood on a leading positiondue to Korean government support although now it’s near to close. Thisis happening because her order books were dominated by containerships,high value offshore units and gas carriers. In addition Korea’s medium-sizedshipyards focused into conventional ships, leading to deleveraging pressure.
However, Japan’s shipbuilding capacity characterized of a relatively goodmanagement, took advantage of the yen’s depreciation and new orders fromforeign players. Additionally, Japan produced vessels required technical“know-how” to build, like LNG, LPG carriers and chemical tankers. There’sa flooding effect happening to global shipbuilding capacity, depended on vari-ation on the lead time of different ship types. When there are small annualchanges in lead time, the shipbuilding market is consider as supply driven.When there are big changes, shipbuilding capacity for a certain segment isscarcer. For example, lead time of bulk carriers, containerships and crudeoil carriers usually responds less to contracting because their slots’ supply isover the top bigger than its demand. On the other hand ships like chem-ical tankers and LPG carriers are immune to the limited amount of slots
42

available.Furthermore, their lead time responds more to contracting due to the
fact that building those vessels’ types is required more specific experience,limited on their availability. LNG carriers together with the abovementionedtypes, have a more adjusted to demand, supply. But, one thing is for sure, if aspecific ship sector became a trend for the market, over ordering is inevitable.However, the global excess shipyard capacity puts tremendously pressure onlead time. The time required from the contracting to the delivery time hasdecreased across segments. Before 2008 ship owners waited up to 50 months,when today in a lot of segments lead time is about 24 months. China was theshipbuilding country who accepted the challenge of the quicker shipbuildingproduction but when ship owners started to postpone delivery, productionprocesses slowed down too. Although it is positive for the shipyards to keeptheir production lines running, however that results on a vicious cycle ofovercapacity.
3.3.4 Shipping Finance Through Cycles
It is really interesting to get to know how ship-owners used to financetheir investments and how financing trends have been changed through time.To begin with, in the first half of the 20th century financing approaches wereconservative. They tend on using their retained earnings with low leverage.In 1950, where European industrial economies started to rise, they wereneeded cheap raw materials. So, in order to transport them in low cost,ships started to get bigger and take advantage of economies of scale. Theproblem was that, big vessels were expensive and retained earnings weren’tenough to finance them. However due to the fact that charterers offeredlong-lasting contracts and time-charters that worked as collateral for banksto grant them loans with high leverage.
Until 1970, this was the status quo for shipping investments but becauseof the fact that charterers did not have anymore the need to make long-lasting contracts in order to charter a big vessel. In addition, 1970 was ayear where petroleum and iron trading had slowed down and strong inflationhit. Banks, after two decade of high leverage, suddenly changed their lendingpolicies by wanting the ship as a first mortgage with additional security.Furthermore, banks also started to see vessels as floating property. Due tothe inflation and possible accidents, cash flows and time chartering weren’tthat safe as collateral for them. There was a common belief that ships’ values
43

will be stable, so banks during the devastating 1970 decade, started to financeaccording to that. Vessels’ prices were the only security they used and thatresulted on unlimited ordering with a small amount of equity capitals.
1973 was a year of money made from oil industries that were spread allover the world and shipping market too. Banks credited huge amounts ofmoney for new-building tankers above 100 million dwt, delivering half of thefleet in only one year. Due to that bubble, tankers market needed 15 yearsto revive. 1980 was another one year with oil money spreading all over thesectors and desperate shipyards using credits as a disguised way of buildingships in stock. Mortgage’s debt supported the orders of 40 million dwt bulkcarriers from 1983 to 1984, when freight transport market rocked bottom.That was a rational behavior according to cyclical deliveries but the problemlaid on the over ordering that led into supply surplus and recession in 1986.The results were ship owners having problems paying out their debts, loandefaults and secondhand prices started to fall. Ship owners needed extracash so they started to sell their vessels in low prices.
When shipping market hit bottom for a period lasting more than usual,asset play used as a financing type, wasn’t possible. But there were only fewconventional sources of equity and debt interested on financing more vessels.So there was a need of new financing sources like the self-liquidating shippingfunds in 1984, and during the 1980 decade, raising capitals from people whoweren’t involved in shipping. A popular example was Norwegian companyK/S who persuade many people invest a small amount on shipping. Therewere a lot of tax-free benefits, with that money re-invested in a period of hightaxation in Norway. K/S succeeded due to its appeal on private investorsregardless of its unconventional structure.
An interesting phenomenon in the shipping finance after financial crisis hitwas Private Equity funds behavior in shipping finance. PEs took advantageof the situation, by investing at the low point of the shipping cycle and thenafter two or five years, when the cycle will be at its peak, exit. This strategywas representing significant returns, in a short time and with two exit options,an IPO or an asset sale when second-hand values will be fully increased. Ofcourse this never happened because shipping’s cyclicality hasn’t reboundedyet to the expected point (peak). There were several argues that PEs fundingled to over-ordering and excess supply, being the reason, shipping’s cyclicalnature is disappearing.
Shipping finance decisions, in order to be successful should be taken ac-cording to shipping cycle’s stage. This is really vital because, a shipping loan
44
can be successfully paid when freight rates and vessels’ values are high andmarket is on its shipping cycle’s peak. Freight market’s rise creates a posi-tive vibe leading to easier funding. So, at the rise-phase of the cycle, due tothe increased earnings of the companies, loans’ security increases too. Thisis happening because the lender knows that the borrower is going to repayhim for sure. In the contrary, when the market is low, revenues are confinedand vessels’ values aren’t enough as loan collateral. So banks, start payingattention on shipping companies cash flows, that don’t correlate always onhigh freight rates but on company’s ability to manage OPEX. In market’strough, there’s major uncertainty that results on more restricted funding.
Banks’ mentality is all about financing shipping investments based onnew building’s future cash flows. Investments on a mature freight marketwith time charter policy are favored by this mentality and the amount fi-nanced to shipping companies is always related to the cycle’s phase. Atthe recovery phase of long cycles, banks increase the general positivity andgrant loans with favorable terms. This situation may attract nontraditionalbankers, boost the competition and lower the shipping lending standards.When the phase named “collapse” comes, banks are unwilling to finance ves-sels. But even if they do, they give a margin that doesn’t exceed the amountof 50 percent, compared to the margin given in the recovery phase, whichreaches 80-90 percent. This is happening because companies’ cash flows showinstability, thus the borrower’s repaying ability starts getting doubtful.
Shipping finance itself, affects supply levels, where the latter is a criticalfactor of shipping cycles. So maybe there is an interrelationship betweenshipping finance and shipping cycles. Even when companies fund their in-vestments from internal sources, they need to have high earnings in order toand so the market is required to be high. The most important, when fundinga shipping investment, is to be familiar with the current shipping cycle atthe moment. How much will last, how risky the cycle is and his main charac-teristics in order to be predicted and be managed appropriately by shippingfinancers. This situation is similar with the relationship banking where thebank feels more secure to lend on familiar clients with good reputation be-cause she can trust them. The same with the cycle, you feel safer when youknow him. Therefore, when knowing a lot about the cycle, it is able to takeadvantage of him.
45

4 Risk Assessment in Shipping Bank Loans
4.1 Default Risk Drivers in Shipping Bank Loans
After stating the common reasons and causes of problematic and lost loansin general, it’s time to specialize that analysis to shipping bank loans andtheir default risk drivers. The drivers are categorized into firm characteristics’-specific, loan-specific, industry-specific and macro-economical ones. The firmcharacteristics’ specific drivers include the age of the shipping company, theyears of cooperation with the bank and her time chartering or voyage pol-icy. Into the loan specific category belong the ratio of Arrangement fee-to-Amount of the loan because is the main source of profit for the bank alongwith the spread charged and are computed as a percentage of the wholeamount of the loan. Along goes the tenor of the loan, defined as the numberof years from the initiation of the agreement until the final maturity of theloan and the balloon payment. Of course together goes the margin that isthe spread over the LIBOR and the internal bank rating about the risk ofthe loan.
The asset coverage ratio is the market value of the ship over the amountof the loan. This ratio splits into the contractual and the actual, where theformer is defined by the bank as a threshold which should be maintained atlower levels than the latter that is estimated by the ship-brokers, changingover time. Moving to industry specific, where there is the 1 year time charterminus the spot for bulkers and tankers as well as the 3 year time charter minusthe spot for both dry and wet bulk. At the macro economical drivers arefirstly the ratio of the order book-to-total fleet which is defined as the worldorder book for each broad subsector. Along goes the inactive tonnage-to-total fleet defined as the total removals of tonnage for the world fleet dueto several reasons including lay-up over the total fleet measured in milliondwt. Two important indexes are the ClarkSea index, that is constructed as aweighted average of earnings in all shipping subsectors and the MSCI worldstock index, constructed to be representative of the stock market sentimentat a global level.
46

4.2 6 C’s of Credit and Investment Analysis
Afterwards, comes the financial analysis through the well-known methodof the 6 C’s in determining creditworthiness or the C’s of credit and invest-ment analysis. C’s are meant the categories of factors that are essentialto the loan appraisal, character, capacity, capital, company, conditions andcollateral adjusted in the shipping industry. Sometimes some financial ana-lysts choose to merge the categories named “character” and “capacity” andthat’s why some call the method 5 C’s of credit analysis. In the first cat-egory, “character/capacity”, it’s all about the factors associated with thehead of the company, its integrity, company’s mission, strategic and businessplans as well as strategies to achieve them in particular .In addition, is beingchecked everything like investment and finance, chartering, insurance, tech-nical, cost management, creditors, human resources along with the characterof the ship-owner who’s got to be coherent, forward looking and learningfrom the past. Then is the category named “capital”, including the financialstructure, ship-owner’s or company’s head shareholding stake, the analysis ofthe financial statements and of course financial ratio analysis including thegearing ratio (total debt/total assets), the long-term debt/total cap, the networth and the pre-tax interest coverage.
The third “C” is meant for the factors associated with the structureof the company, meaning the inflows and the outflows. While inflows aredefined as forms of employment, the choice, the quality and the contractwith charterers as well as the effective utilization of the vessels. As outflowsare the operating costs, including the administrative, technical, insuranceand crew costs, and the voyage costs, depended on the markets of operationand market share that together make the company’s operating position. The4th category is the collateral’s one, related to the fleet’s composition andcondition, vessel’s economic life and securities like mortgages, assignment ofincome, assignment of insurance and personal and corporate guarantees. Soa “good” loan, the one that won’t be defaulted or refinanced, but will be paidon schedule, the borrower in general should have liquidity, low leverage, highprofitability, loan payment cash flows’ with a right timing, secure sources ofloan payments and a financial projection that determines when the wholeloan can be repaid. What actually makes a good loan could be definedaccording to the abovementioned method of 5 or 6 C’s, by quantifying them.To begin with the character of the borrower, in order to have a successfullypaid loan, he should be willing to pay. That means, he must have a past
47

credit history of non-defaulted loans, a good reputation in the market andof course a managerial talent. About the capacity, high after-tax profits,satisfying cash flows and about the capital, the borrower must have a big networth position, high quality assets as collateral of the loan and about theconditions, his vulnerability to an economic downturn should be low.
The most common collateral at a loan agreement is the vessel that’s be-ing financed through that loan, thus it has a lot of differences from the usualsecurities used in other sectors. In the event of default, bank has the right toarrest the vessel, operate it, auction it, sell it and impose the terms upon theborrower about restriction regarding where it should be traded or the main-tenance value, technical changes and sale prohibition, acting independentlyfrom the ex-ship-owner. However ship mortgages as form of security, haveseveral limitations. Those limitations mainly occur due to the volatile valueof the vessels in general and specifically at the possible incapability that thefunds released from the sale of the vessel to satisfy the outstanding debt.
Sometimes, banks tend to trade the vessel, continuing the charter party,operating the vessel from a subsidiary. In an event of a negative equityoccurrence, the bank either asks from the insurer to cover the gap. They arealso rising problems when there is a clash between a claim that is secured bya maritime lien and one secured by a mortgage, especially when it comes topayback priorities. Another one rises when the vessel might be damaged orsank with costs on rights determination on the wreck. As final drawback isthe possibility of the mortgagee to lose the priority of getting paid over othercreditors.
During the subprime crisis another one occurs, due to the lax fundingtrend associated with house mortgages, the subprime mortgage crisis. Cheapmoney trend also sparked in the shipping industry, occurring the ship mort-gage crisis at the same time period. The mechanism was similar for shipfinance, where loans and bonds were both ship covered and there was aninterest rate reduction in the shipping industry. Philippe Louis-Dreyfus tellsits impact as follows (Larocco, 2012):“Banks put pressure on the ship-ownersto accept money almost for free and sometimes offering 100 percent financ-ing with no equity at all. So banks have played the very awkward if not theperverse, role in proposing cheap money to ship-owners who not only didn’tdeserve it but didn’t really even want it.” Firstly, banks should do the ratio-nalization of leverage “sin”, meaning how percent of asset will be financed bythe lender, a debt-to-asset (vessel price) ratio. Leverage has to perspectives,the borrower’s one (loan) and the lender’s one (banks).
48

If vessel prices rise than the denominator grows, so the leverage is get-ting smaller and a false belief leads on financing more and the numeratorincreases, but the most important question is what is the solution if later thevessels’ prices fall. From the banks perspective, the leverage ratio is definedas Tier 1 Capital (Liquid Capital) to Consolidated Assets (assets, liabilities,mortgages), which according to Basel Accords should be at least 5 percent.At October 2012, Moody’s downgraded public-sector and ship covered bondsissued by HSH Nordbank AG but not the mortgages. At July 2014,the IMFalso, said that shipping loans could be a source of further impairments, asthey reviewed the German banking industry. A well arranged trick thatbanks did to hide shipping losses, was valuating ships with the HamburgShip Valuation method. In the Hamburg method the estimate of the vessel’searnings projection is substituted with the historical average of them andthe OPEX of the last ten years. Eventually, that saved the shipping port-folio from massive default which may have ignited further and deeper creditcrunch in the shipping industry and ship mortgaged-backed bonds’ solvency,indirectly.
Then, comes the 5th“C”, which stands for the category “conditions” andis all about the financial markets, interest rates, world economy, politicalconditions, seaborne trade, specific commodities, manufactured goods, struc-tural and cyclical changes. Furthermore there are factors related with theshipping markets, present and future conditions, and demand and supplyanalysis, shipping investment cycle, fragmentation, subsidies and barriers toentry. Closing the conditions’ category, with the regulatory framework of thecountries, port authorities, international organization as IMO, ISM code andOPA 90 as well as other organizations’ requirements of classification societies,major oil companies, insurance companies and PI clubs.
However the key factors on shipping loan decisions ranked from 1 to 23and weighted from 17.25 percent to 1.21 percent. The one ranking first isthe borrower’s integrity, reputation and managerial capacity, nearly 3 pointsover the second one which was about creditworthiness and loan record butwith a big difference of 50 percent more than the third which is about col-laterals. The next 20 are not much different from each other beginning withthe project’s cash flow projections at 5.86 percent then is ownership’s equitystake in the project, experience and time length in the market. Along goesborrower’s investment decisions, project Hull-to-Debt ratio, specific sectorconditions and prospects, condition of the vessel(s) to be financed, Hull-to-Debt ratio of the borrower’s fleet, cash capacity of the owner, shipping indus-
49

try conditions and prospects. The last 9 key factors begin with the age of thevessel at 2.96 percent and then comes the chartering policy, world economy’sconditions, charterers reputation, cost control, future default loans, financialstatements, company’s size, company’s structure and ends with engineeringmeaning the qualifications of the technical team at 1.21 percent.
4.3 Credit Review as Risk Assessment Method in Ship-ping Bank Loans
Risk assessment is different from risk management, because the latterdeals with the dangers when the former is determining them. Formerly, riskmanagement systems were implementing after disasters occur and that’s whywe need a more proactive approach so we can identify the risks and mitigatethem in every procedure. Risk assessment starts with the determinationof the risks, and then we’ll have to collect data and information about thefrequency and its consequences. However there are two types of risk assess-ment, the qualitative and the quantitative one. The quantitative requireshuge amounts of data from similar occurrences in several locations, whenthe qualitative uses the risk with a more comparable way between activitiesdifferent amounts of risk.
However every bank’s credit committee decides on the basis of realisticfacts, reflecting the actual and integral view of each client. The credit grad-ing report is a snapshot of borrower’s conditions and an analyst typicallystarts an evaluation of industry/market in which firm operates. Then as-sess business and financial risk factors on a stand-alone basis and comparedto peers. Shipping bank’s policy is conservative as to category and type ofvessel financing, leverage percentage, amortization schedule, vessel’s marketvalue, provisions for future freight levels and cash flows. Bank, in order toensure loans’ quality and minimize operational risk, probably during loan’sreimbursement, the bank should select her clients carefully and based on aninternal rating based approach. This approach is made of a large scale ofdetailed and classified historical observations. The most important criteriaare categorized according to user and on a scoring system.
A credit model or a criteria matrix is made of the most critical quali-tative and quantitative rating criteria. The qualitative ones are the yearsof cooperation with the bank, the frequency of it, the credit consistency to-wards the bank and the years of cooperation with other banks. Along goes
50

the credit consistency and financial commitments to 3rd parties, manager’sexperience in specific sector, his quality, the biggest shareholder’s ownershippercentage and the supplier’s relationship with the client. Besides manager’sevaluation, market’s perspective criteria like size, maturity, and growth level,cyclicality of market as well as competition intensity, client’s influence andstatutory/business environment effect are equally important. The quantita-tive criteria are the financial indicators like the loan to value, the liquidity,the borrowing coverage and the past consecutive net profitability. The otherpart of the quantitative criteria are the valuation indicators regarding thetotal loan deal with bank, including the asset cover ratio, the financed ves-sel’s average age in maturity date and the estimated operational earnings tocover loan commitments.
A bank credit analyst has to calculate two sub-scores, the subtotal ofthe qualitative and the quantitative criteria to get the total credit scoretransforming it into a scale of 1-9. So he can provide a simple and efficientway to communicate the creditworthiness and credit quality. The shippingcredit division should check and revaluate the rating criteria in a reasonabletime-span. In addition, should assess the effectiveness of specific criteria(modification) or probably implement new ones innovations to evaluate therisks perceived as inherent in a loan portfolio. The financing correlation isexamined on the basis of specific real shipping banking cases with an objectiveto search of deviations to facility limit approval due to alteration of client’scredit grading. They also, in order to segregate the burden of one of financialcriteria, implement weighted function.
Besides the credit model, also helpful is the risk grade scale, comprisingthe grading rank of every bank facility separately. It is a 10-grade scale ofcredit line gradation, relevant to prospective percentage damage (loss givendefault and recovery percentage ratio. This means that each client has manyrisk grades as the number of his facilities. In order to form the scale, the creditofficer has to consider the collateral type. The risk grade estimation differsfrom the credit grade estimation because takes a snapshot of each bank facil-ity. The credit grade assesses client’s current and prospect situation and thecredit committee may conclude combining both risk and credit grade. Everysecurity is combined to a recovery ratio given default taking into accountsecurity’s quality and liquidation’s capability. Additionally should take intoaccount the time period needed for receiving payment through liquidationand managerial cost required for such procedure.
51
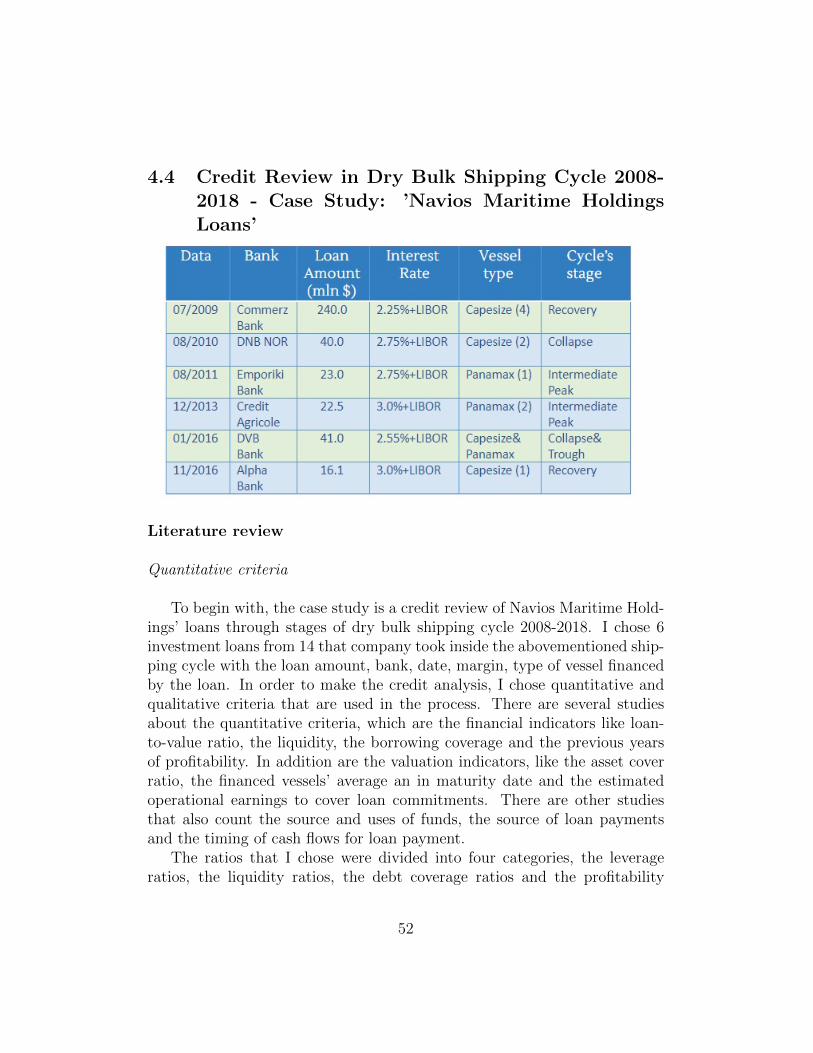
4.4 Credit Review in Dry Bulk Shipping Cycle 2008-2018 - Case Study: ’Navios Maritime HoldingsLoans’
Literature review
Quantitative criteria
To begin with, the case study is a credit review of Navios Maritime Hold-ings’ loans through stages of dry bulk shipping cycle 2008-2018. I chose 6investment loans from 14 that company took inside the abovementioned ship-ping cycle with the loan amount, bank, date, margin, type of vessel financedby the loan. In order to make the credit analysis, I chose quantitative andqualitative criteria that are used in the process. There are several studiesabout the quantitative criteria, which are the financial indicators like loan-to-value ratio, the liquidity, the borrowing coverage and the previous yearsof profitability. In addition are the valuation indicators, like the asset coverratio, the financed vessels’ average an in maturity date and the estimatedoperational earnings to cover loan commitments. There are other studiesthat also count the source and uses of funds, the source of loan paymentsand the timing of cash flows for loan payment.
The ratios that I chose were divided into four categories, the leverageratios, the liquidity ratios, the debt coverage ratios and the profitability
52
ones. The liquidity factor is used as an indication of the level of liquiditymaintained in comparison to the debt principal and interest payments due.They provide an indication of the ability of the company to pay off its debtsas they come due, say over the next year or so. It is called current ratioand is calculated as: Current Assets/Current Liabilities. The leverage isindicative of the loan gearing of the company, which is of the mix of debtand equity used to finance the company. The expected sign is positive sincethe higher the financial leverage, the higher is the expected probability ofdefault of the loan. The ratio is called debt ratio and is calculated as: TotalLiabilities/Total Assets.
The profitability factors is important because indicates the health of thecompany and her ability to operate profits giving safety to the bank, thatthe loan will be repaid in time. There are two most important ratios, thereturn on assets, that tells investors how efficiently a company generatesprofit growth from the capital is has been granted, both debt and equity andthe return on equity. The return on equity describes the rate of profit growtha business generated for shareholders and owners. ROA is calculated as: NetIncome/Total Assets. ROE is calculated as: Net Income/Total Assets-TotalLiabilities.
Last but not least is the debt coverage ratio that uses as an indicationof the ability of the firm to cover short-term and long-term debt burdenthrough its operating profits. The higher the ratio, the higher is the ex-pected probability of default for the shipping bank loan. There are threedebt coverage ratios, the Current Liabilities/Earnings before interest, taxes,depreciation and amortization, the Long-term Debt/EBITDA and the TotalLiabilities/EBITDA. In shipping due to the huge amount of loan needed tofinance a vessel acquisition, indicators related to debt, are very increasedcompared to other industries that borrow money to fund their investments.
Qualitative criteria
Based on the abovementioned “6 C’s of credit investment analysis” andMoody’s credit rating methodology in shipping industry, were the qualita-tive criteria used in the case study credit review. For the “character” I chosethe age of the company, the fleet size, average age and diversity, as well asthe nationality, cargo transported and chartering policy. In addition, for the“conditions” I chose the Baltic Exchange Dry Index and Baltic ExchangeCapesize Index, the shipping cycle’s stage of the market, the market’s per-
53

spective. I gave a lot of importance to the market conditions and specificallythe timing of each loan in the stages of the 2008-2018’s shipping cycle. Liter-ally, I placed the loans in the timeline of a whole shipping loan, divided in thepeaks and troughs, collapses and recoveries that represent more accuratelythe market’s conditions. Furthermore, the approximate freight rates, the LI-BOR and the Moody’s Credit Agency rating. I also chose the mentioned theshipping portfolio exposure of the bank lending each loan.
Navios Maritime Holdings
Navios Maritime Holdings is one of the leading global brands in seaborneshipping, specialized in bulk cargoes. Navios operate a diverse portfolioof Capesize, Panamax, Ultra-Handymax and Handy size bulk carriers, de-ploying owned, chartered and leased. The company owns and operates thelargest bulk terminal in Uruguay and her fleet consists of 39 owned vessels, 1Handysize, 12 Ultra-Handymax, 12 Panamax and 14 Capesize vessels. Addi-tionally depending on short-term requirements and market conditions, NMHsupplements the core with short-term or long-term charters. Their long-termchartered-in vessels in operation are 27, 1 Handysize, 6 Ultra-Handymax, 13Panamax and 7 Capesize vessels. Navios is listed in NYSE from 2005, wasestablished in 1954 as a wholly-subsidiary of United States Steel and is aMarshall Islands company. Her market capitalization is 384.1 mln dollars.
Navios operating market
In the beginning, in the bulk shipping market, dry bulk segment hasits own idiosyncrasies, unique definitions of peak and troughs. In dry cargoshipping, troughs are characterized with freight near operating costs, old shipprices falling to scrap, usually little ordering, a lot of demolition sales, banksreluctant to lend and pessimistic market sentiment. On the other hand peaksare defined with freight over thrice the OPEX, 5-year-old ship costs same asnewbuilding, heavy ordering, few demolition sales, banks keen to lend andimplausibly positive market sentiment.
The demand for dry bulk freight rates is defined by commodities trans-ported’ demand and furthermore, raw materials demand in the global pro-duction chain. Specifically, dry bulk freight demand comes as a result ofcommodity markets’ economics, international seaborne trade and world eco-nomic activity. The dry bulk shipping market is characterized with high
54

volatility even in different vessel classes and in the past decade the marketfluctuations reached the highest level. Moreover by separating the main com-modities shipped by bulk carriers, iron ore and coal are unevenly distributedand mined in a variety of regions across the world.
To begin with, iron ore is concentrated in few countries, mostly in China,Australia and Brazil and its consumers are Far East Asian countries likeKorea, Japan and China. European countries like Italy, UK, Poland, Franceand Germany are big consumers of iron ore, too. In general, iron ore marketis very fragmented, influencing a lot the structure of the dry bulk cargoindustry. However, the industry we’re talking about can be divided in a largenumber of different markets defined by quality, liquidity and asymmetry ofinformation, affecting enough freight rates’ prices. Freight rates interact withvessels characteristics, contract features and route types. Dry bulk marketis determined by homogenous products but has as well as a big numberof players. However space influences cargoes distribution that can competecommercially in the auctions, meet the lay can period in port level and havelow entry barriers.
Furthermore, freight indices are developed by a party that is independentand absolutely represents the freight being hedged and can’t be manipulated.In dry bulk industry, this party is Baltic Exchange in London that created theBaltic Freight Index. The abovementioned index was based on a weightedaverage of 11 different trade routes, four routes for grain, three for coal,three for iron ore and trip charter, collected in a daily basis from a panel ofbrokers. After 16 years, BFI was turned into 4 dry cargo indices, the BalticCapesize Index (BCI), the Baltic Exchange Panamax Index (BPI), the BalticExchange Handymax Index (BHMI) and the Baltic Exchange Dry Index.Baltic indices as well as the underlying route assessments from which theyare compiled rely on rates estimated by independent competitive shipbrokers,who act as panelists.
NMH is more focused in the Capesize sub-segment of dry bulk market.Capesizes average size is 156,000 DWT and this category can include somevery large ships with a capacity of 400,000 DWT. Primarily, Capesizes trans-port coal (30 percent) and iron ore (70 percent) on long-distance routes andin some occasions they transport grains. Those vessels are too wide to passthe Panama Canal and their name derive from this although generally theterm means all the vessels exceeding 85,000 DWT. They mostly cover theroutes of South America and Australia to China and Japan, Western Europeand North America when they transport iron ore. When they rarely had
55

to transport coal the routes are Australia and North America to Japan andWest Europe.
They also have deep draught, a small number of commodities that theycan carry and the operation of these kinds of carriers when talking abouttrading routes is pretty restricted. Due to their deeper draught, huge sizeand are used in the transportation of less commodities than the Handysizevessels, makes them less flexible than small size vessels. A recent develop-ment in iron ore carriers that pushed further the holding capacity are the newVery Large Ore Carriers, 200,000 DWT that have benefits from economiesof scale and greater efficiency in handling raw materials of a very low price-to-volume ratio. The Capesize sector is the riskiest in terms of freight ratevolatility compared to other dry-bulk shipping sectors. Capesize vessels areinvolved in limited types of trades and results on the volatility of their pricesand their freight rates, compared to Handy and Panamax vessels.
Diagram: BDI and BCI Financial Crisis 2008-2018
56

First Loan - 07/2009 (1st Recovery 2009-2010)
Commerzbank AG - 240 million dollars - 2,25%+LIBORCapesize(4)
Financial Analysis
Qualitative Criteria
Market
China’s increased iron ore imports.BDI and BCI: 3,361 and 5,628 respectivelyCapes’ freight rates: $42,000-$100,000LIBOR: 0.242%
Company
Age: 4 yearsFleet size: 6,6 mln dwtFleet diversity: 25 Capesize, 18 Ultra Handymax, 14 Panamax, 2 Handysize,1 Product tanker HandysizeFleet average age: 4.4 yearsMoody’s rating: B1
Bank’s shipping portfolio
Exposure to shipping finance: 8,52%Shipping loans: $22 bnExposure to dry bulk finance: 22%, $5 bn
Quantitative Criteria
Leverage
Debt ratio(=Total Liabilities/Total Assets): 64%
Liquidity
57

Current Ratio(= Current Assets/Current Liabilities): 218%
Profitability
ROE(=Net Income/Total Assets-Total Liabilities): 7%ROA (= Net Income/Total Assets): 2%
Debt Coverage
Debt Coverage ratio 1(=Current Liabilities/EBITDA): 1.01Debt Coverage ratio 2(=Long-term Debt/EBITDA): 8.39Debt Coverage ratio 3(=Total Liabilities/EBITDA): 9.69
Second Loan - 08/2010 (1st Part Collapse 2010-2012)
DNB NOR - 40 million dollars - 2,75%+LIBORCapesize(2)
Financial Analysis
Qualitative Criteria
Market
Strong supply overcapacity. Panamax worst from all sub-segmentsBDI and BCI: 2,432 and 2,987 respectivelyCapes’ freight rates $17,360-$57,590LIBOR 0.231%
Company
Age: 5 yearsFleet size: 6,6 mln dwtFleet diversity: 25 Capesize, 18 Ultra Handymax, 14 Panamax, 2 Handysize,1 Product tanker HandysizeFleet average age: 4.4 yearsMoody’s rating: B1
58

Bank’s shipping portfolio
Exposure to shipping finance: 8%
Quantitative Criteria
Leverage
Debt ratio(=Total Liabilities/Total Assets): 64%
Liquidity
Current Ratio(= Current Assets/Current Liabilities): 174%
Profitability
ROE(=Net Income/Total Assets-Total Liabilities): 11%ROA (= Net Income/Total Assets): 4%
Debt Coverage
Debt Coverage ratio 1(=Current Liabilities/EBITDA): 0.53Debt Coverage ratio 2(=Long-term Debt/EBITDA): 5.41Debt Coverage ratio 3(=Total Liabilities/EBITDA): 6.15
Third Loan - 08/2011 (1st Intermediate Peak(Mid2011-Mid2012)
Emporiki Bank - 23 million dollars - 2,75%+LIBORPanamax(1)
Financial Analysis
Qualitative Criteria
Market
Asia’s strong demand for iron ore and coal from due to Japan’s reconstruc-tions from tsunami. Declining Panamax rates.BDI: 1,386
59

Panamax freight rates $9,000-$13,000LIBOR 0.145%
Company
Age: 6 yearsFleet size: 5.8 mln dwtFleet diversity: 19 Capesize, 20 Ultra Handymax, 16 Panamax, 2 HandysizeFleet average age: 5.4 yearsMoody’s rating: B1
Bank’s shipping portfolio
Shipping Loans: $2.73 bn.
Quantitative Criteria
Leverage
Debt ratio(=Total Liabilities/Total Assets): 60%
Liquidity
Current Ratio(= Current Assets/Current Liabilities): 147%
Profitability
ROE(=Net Income/Total Assets-Total Liabilities): 4%ROA (= Net Income/Total Assets): 1%
Debt Coverage
Debt Coverage ratio 1(=Current Liabilities/EBITDA): 1.22Debt Coverage ratio 2(=Long-term Debt/EBITDA): 7.04Debt Coverage ratio 3(=Total Liabilities/EBITDA): 8.41Fourth Loan - 12/2013 (2nd Intermediate Peak(Mid2013-Mid2014)
Credit Agricole - 22,5 million dollars - 3,00%+LIBORPanamax(2)
60

Financial Analysis
Qualitative Criteria
Market
Short lasting, increased iron ore and coal imports from China, strong Pana-max oversupply.BDI: 2,178Panamax freight rates $6,600-$8,250LIBOR 0.100%
Company
Age: 8 yearsFleet size: 6.3 mln dwtFleet diversity: 17 Capesize, 20 Ultra Handymax, 27 Panamax, 2 HandysizeFleet average age: 7,2 yearsMoody’s rating: B2
Bank’s shipping portfolio
Exposure to Shipping Finance: 3 %Shipping Loans: $18.1 bn.
Quantitative Criteria
Leverage
Debt ratio(=Total Liabilities/Total Assets): 59%
Liquidity
Current Ratio(= Current Assets/Current Liabilities): 227%
Profitability
61

ROE(=Net Income/Total Assets-Total Liabilities): -9%ROA (= Net Income/Total Assets): -4%
Debt Coverage
Debt Coverage ratio 1(=Current Liabilities/EBITDA): 1.80Debt Coverage ratio 2(=Long-term Debt/EBITDA): 18.17Debt Coverage ratio 3(=Total Liabilities/EBITDA): 20.80
Fifth Loan - 01/2016 (2nd Part Collapse 2014-2016)
DVB Bank - 41 million dollars - 2,55%+LIBORCapes&Pana
Financial Analysis
Qualitative Criteria
Market
Existing surplus capacity, high rate volatility, strong deliveries, slow coaltrade and limited growth in iron ore trade, Indonesia ban on minor bulksexports, China’s falling demand for dry bulk commodities. Many bankrupt-cies.BDI and BCI : 386.3 and 277.6 respectively (historical lows)Panamax freight rates $6,260-$6,580Capes’ freight rates: $6,960-$13,309LIBOR 0.366%
Company
Age: 11 yearsFleet size: 6.7 mln dwtFleet diversity: 15 Capesize, 20 Ultra Handymax, 23 Panamax, 2 HandysizeFleet average age: 8 yearsMoody’s rating: Caa1
Bank’s shipping portfolio
62

Exposure to Shipping Finance: 45.9 %Shipping Loans: $11.9 bn.Exposure to dry bulk finance: $2.92 bn
Quantitative Criteria
Leverage
Debt ratio(=Total Liabilities/Total Assets): 71%
Liquidity
Current Ratio(= Current Assets/Current Liabilities): 108%
Profitability
ROE(=Net Income/Total Assets-Total Liabilities): -37%ROA (= Net Income/Total Assets): -11%
Debt Coverage
Debt Coverage ratio 1(=Current Liabilities/EBITDA): -2.45Debt Coverage ratio 2(=Long-term Debt/EBITDA): -16.06Debt Coverage ratio 3(=Total Liabilities/EBITDA): 18.96
Sixth Loan - 11/2016 (2nd Part Recovery 2016-now)
Alpha Bank - 16,1 million dollars - 3%+LIBORCapesize(1)
Financial Analysis
Qualitative Criteria
Market
Increased scrapping, deliveries’ reductions and postponements, increased ironore imports from Chinese government’s growth plan, lower supply growth,and demand exceeded supply.
63

BDI and BCI : 1,071 and 2,157 respectivelyCapes’ freight rates: $11,450-$15,300LIBOR 0.434%
Company
Age: 11 yearsFleet size: 6.7 mln dwtFleet diversity: 15 Capesize, 20 Ultra Handymax, 23 Panamax, 2 HandysizeFleet average age: 8 yearsMoody’s rating: Caa3Bank’s shipping portfolioShipping Loans: $2.1 bn.
Quantitative Criteria
Leverage
Debt ratio(=Total Liabilities/Total Assets): 71%
Liquidity
Current Ratio(= Current Assets/Current Liabilities): 108%
Profitability
ROE(=Net Income/Total Assets-Total Liabilities): -37%ROA (= Net Income/Total Assets): -11%
Debt Coverage
Debt Coverage ratio 1(=Current Liabilities/EBITDA): -2.45Debt Coverage ratio 2(=Long-term Debt/EBITDA): -16.06Debt Coverage ratio 3(=Total Liabilities/EBITDA): 18.96
64

Final Table
Case Study’s conclusions
To begin with, all the loans, from the first recovery of 2009-2010, whereNavios’ 1st loan is located and until the last one, the 6th, where another re-covery takes part, the interest rate is increasing. From an interest rate of 2.25percent+ LIBOR in the first loan, to the interest rate of 3.0 percent+LIBOR,in the 6th loan. The increased trend of the margins reflects the undertakenrisk of banks when financing investments during depressive conditions of thedry bulk market. Banks, and especially the ones with small exposure, lessthan 10 percent, chose Navios to be financed from. Additionally the loanamount, as the dry bulk shipping cycle go by, is getting decreased reflectingagain the high risk of default. Navios from her side, also wanting to protect
65

herself from the descending seaborne trade of the major dry bulk commodi-ties, reduces the tonnage and capacity investing to. The latter decision, isobvious at the vessels’ size and type, when, at her first loan, a heavy one dueto the loan amount and the tonnage wanting to acquire, 4 Capesize vessels.
However, Navios Maritime Holdings, from the beginning of the crisisstarted with Capesize vessels, almost being part in half of the fleet. Dueto the high volatility of the large tonnage vessels during turbulent times,Navios lowered the Capesize percentage in the fleet from 41 percent to 25percent as well as the ships being financed with the loans, choosing Panamaxvessels to balance the large tonnage risk. However during the recovery periodof the dry bulk market at the 6th loan, where Capesize market also boostedand Navios, as a speculator took the advantage to invest this period of re-vived freight rates and iron ore imports. However, although the last quarterof 2016 was positive for the shipping companies, yet low and uncertain forshipping banks, reflecting to the high interest rate and LIBOR, at 3.43 per-cent. Moody’s credit rating affected also the banks that, after downgradingNavios from B1 to B2, from the 3rd to the 4th loan, interest rate was in-creased, because it reflected the increased default risk of the company. Thesame pattern happened also from the 5th to the 6th loan, where Navios wasdowngraded from the credit agency, from Caa1 to Caa3 and the interest ratewas raised.
Nevertheless the only loan that exceeded the pattern was the 5th one,signed with DVB that is a continuing leading bank in the shipping financeindustry, with a big exposure at nearly half of her portfolio. That’s whythis loan has different characteristics from the others that were signed withbanks of a small exposure. In the 5th loan, we see a lower interest rate and anincreased loan amount, during a downgrade of NMH from B2 to Caa1 and amarket walking from an intermediate peak to the worst historical trough. Inaddition, we see that the shipping company chose to invest in two segments,one vessel from the Capesize market, and one vessel from the Panamax one.By diversifying the investment, downsizes the risk, because invests in twomarkets of different vessels’ tonnage. Navios Maritime Holdings, had beencooperating with DVB since 2004, and at the absolute depression of the drybulk market in the beginning of 2016, where the 5th loan is located, the twoshipping players agreed on a loan of favorable terms for NHM related to thefinancial environment. Relationship banking had made again the differenceeven in a time period that shipping industry was drowning.
On the other hand, the quantitative criteria, the financial indicators of
66

leverage, liquidity, profitability and debt coverage ratios of Navios MaritimeHoldings, vary during the dry bulk cycle. Firstly, the leverage of Navios,through the total debt ratio, that indicates how much of the total assetsit’s financed through debt, is meaning borrowing activity. Well, Navios atthe time period he took the 1st loan had 64 percent leverage and at the6th loan, the total debt ratio came at 71 percent, with the lowest at the4th loan, at 59 percent. Those debt ratios are pretty high in general butare normal in shipping industry due to the fact that, it is a market that istraditionally funded mostly by debt, meaning borrowing, so those ratios donot affect borrowing conditions. Furthermore, liquidity of the company fromthe 1st to the 4th loan is in normal levels, especially in the first three loansand corresponds with the relatively low interest rates. That gives the banks’involved, safety that their principal and interest payments will be paid due,because the company has enough liquidity to do so.
In terms of profitability and earnings, NHM, at the first three loans haspositive returns, and this is obvious from the ROE and ROA, that rise fromthe peak of freight rates in the beginning of the collapse, at the 2nd loan.Return on equity from 7 percent rose to 11 percent and Return on Assetsfrom 2 percent to 4 percent, as income rose too. However at the 4th, 5thand 6th, ROE and ROA went negative due to consecutive losses, leading tohigh interest rates. Especially, the banks, and more the ones with a smallshipping portfolio, in order to protect themselves from a default risk that isgreater when lending to a non-profitable company, by increasing the interestrate. Again, mentioning that DVB is an exception that set lower interest rateand a higher loan amount, although to a company with losses and negativeROE and ROA, due to her big exposure in shipping industry and the years ofcooperation with the company. Moody’s, naturally, when observed losses toNavios’ financial statements, directly downgraded the company and pushedbanks to increase the interest rate.
The Earnings before Interest Taxes Depreciation and Amortization com-pared to net income went negative at the 5th and the 6th loan, where mar-ket conditions got worst and LIBOR increased too. Firstly, the decreasingEBITDA, affected the high debt coverage ratios increasing the interest rates,due to the fact that showed Navios Maritime Holdings unable to cover itsshort and long-term liabilities with its EBITDA, increasing the default risk.Only the current liabilities to EBITDA had the smallest value compared tothe other too debt coverage ratios that contained the long-term debt and theone containing the total liabilities. For the banks that were the borrowers,
67

those ratios percentage showed that Navios’ EBITDA can cover twice or 100percent the principal amounts and interest rates but the long-term is above5 times bigger than its annual EBITDA. In the 2nd loan, where EBITDAwas higher that period, compared to the other loans and the debt coverageratios were surely affected.
68

5 Conclusion
Closing, shipping industry, although weighting her prosperity on bank financethrough loans, due to the last 10 years of a second historically great worlddepression, lost her dependence on European shipping banks. In order tosurvive, the latter, left shipping finance or minimized their exposure and riskfrom an industry that was collapsing more and more. The results of thisfinancing catastrophe, made shipping to look for funds elsewhere. Shippingcompanies searching for finance for their survival’s investments, turned intoAsian banks and alternative ways, besides term loans. So the “center ofgravity” in shipping finance, during the crisis, started to move easterly, whereAsian countries were developing at a fast track, when European ones facedrecession.
Chinese banks were focusing on the shipping industry, giving hope todepressed shipowners, ending on taking the leading role in shipping finance.Chinese banks, involved their shipyards into the loan contracts, to strengthenthe economy of their country. Besides the change of shipping finance’s “moth-erland”, and due to unfavorable lending terms, turn into alternative and un-conventional sources that mostly came from Asia, again. Leasing, syndicatedterm loans, private equity are the shipping finance “fruits” of the last tenyears after the beginning of the subprime crisis that started with the lasthuge peak of shipping industry and led into the historically worst trough ofit. However the transition is still in progress due to the fact that traditionalshipping companies are connected years and years with their shipping bankdivision, but the modern ones in order to keep making profits are trying thosenew options.
After the two case studies, the first with DVB Bank SE, a typical Eu-ropean shipping bank during the timeline of the last ten years, that startedwith the collapse of Lehman Brothers and consequently the leave of manybanks from the shipping finance. Due to those difficult times, DVB in orderto assess and avoid the risk of defaulted shipping loans, became more selectiveon their clients, because due to falling asset values, the only trustful collat-eral was their reputation and character. Besides the relationship banking,DVB, to assess and manage the risk, leaned on a sector structure approachand a more geographical model. Nevertheless, as all shipping banks, it isabsolutely obvious that although she kept her shipping personality, had tolower the exposure in both, percentage of shipping portfolio and in terms ofmoney.
69
On the other hand, the second case study of Navios Maritime Holdings,as the borrower’s side, during the turbulent ten years of dry bulk recession,kept on borrowing from different banks. Those banks, with their own creditreviews on different times where Navios choose to borrow funds, inside ofthe dry bulk shipping cycle that defined and during the different stages ofit. So, each loan due to its timing and borrower’s financial state was pricedin order to assess the risk undertaken. NMH with its loans showed thatwas influenced from the other dry bulk companies who helped on elongatingthe recession. That happened due to before crisis exuberance of 2007-2009and overexcitement who led on banks’ continued lending, shipping companiesirrational endless investing. So, they both overpass the objective risk assess-ment of those loans, leading on the major overcapacity that needed manyyears and mostly, less investments and less investment finance to overcomethe imbalance.
Navios Maritime Holdings, behaved like a typical dry bulk company thatduring the shipping cycle 2008-2018, invested, made orders of newbuildingand signed term loans to finance them as the other dry bulk shipping compa-nies resulting on tremendous overcapacity. However, as a traditional Greekshipping company, found the market perspective and timing convenient fora sequence of investment loans. That is the countercyclical investment ap-proach of Greek shipowners, where they choose collapses and recession pe-riods to invest, the known low-cycle investments. Their shipping “wisdom”is based on the fact that, when times are low, vessels values fall, shipownersneed to get off tonnage to lower the OPEX, so it’s the right time to buyor/and order because shipyards lower the newbuilding prices to find clientsand cancellations are good opportunities too. Then after surviving from thecollapse, they begin the asset play with huge profits.
The last two years, shipping has left the historical trough of 2016 andspecific sectors like dry bulk shipping, are facing a diminutive yet revivingtime that shows a positive outlook and is continuing today, with a slow pacethough. The coveted supply and demand balance, with demand finally over-coming supply and supply surplus starting to fade are some of the charac-teristics of this new age, full of hope after the long recession. Many analystssupport the view of reasoning this recovery to the strong demolition activity,decreased orderbook and increased seaborne trade, to the limited shippingfinance that stopped the shipowners from irrational overinvesting. Loan pro-cedures, pricing and credit review have become stricter giving shipowners therationality of acting in order to remember and avoid mistakes of the past.
70

However, exuberance and overexcitement are factors that fuddle investors,by giving the illusion that is going to last more than they think. Afterwards,after the end of the party, the harsh reality takes revenge with dramatic con-sequences as did in the dry bulk sector. Due to this new recovery, shipownersmay again fell to the same mistakes by their over optimism when seeing themarket moves slightly upwards. Banks on the other hand, in order to avoidsimilar situations with the past, have made smart regulations related withthe risk undertaken in every sector but most in shipping due to the high risk.Shipping banks or banks who have a small shipping portfolio, now assessand manages shipping market’s risk more wisely but also at a more selfishan self-protective way.
The new parameters in shipping, today, are more directed to environ-ment’s protection with the new IMO regulations about the EEDI, Sox andNOx emissions, green fuel and ballast treatment have put more pressure inshipping companies. Therefore, shipping loans have now, this parameteralso, mainly due to the high cost of this transition into a greener maritimeindustry. So today when thinking of investing on shipping, it is substantial toinvolve that new regulations’ criteria that sets off the past way of planningand pricing a vessel’s acquisition or construction’s loan. Today a vessel’svalue and price has also the cost of a scrubber, a more fuel efficient engine, aconstruction’s design based on energy efficiency, a testified ballast treatmenttechnology and a sewage management method, too. Thus, a today’s loancredit review has to significantly consider the entire above mentioned burdenin order to make the right risk assessment and the shipowner should thinktwice before taking the risk on becoming a banks’ loan borrower or searchfor alternative financing sources.
Last but not least, shipping industry will always be risky, volatile andprone to cycles. Will always after a long recession, find alternative solutionsto recover and look forward as her environment will continually change butshe will always adapt and be profitable. There comes the role of financein this beautiful industry, giving the tool and the push to achieve it. Ship-ping will always move and transforms but will always remain global makingdifferent countries, cultures, currencies, mentalities, traditions, economies,languages not an obstacle to bloom. Shipping will be seeing there an op-portunity to cooperate, remove borders and walls, finding a universal way ofcommunicating. This is happening because we’re citizens of the earth, sailingin the same sea wanting to prosper by transporting goods but also culturesand civilizations through the merchant vessels.
71

6 Bibliography
Books
1. Martin Stopford, 2009, Maritime Economics, 3rd Edition, USA2. Manolis G. Kavussanos, Ilias D. Visvikis, 2016, The International Hand-book of Shipping Finance, London3. Elias Karakitsos, Lambros Varnavides, 2014, Maritime Economics: AMacroeconomic Approach, London
E-Resources
1. United Nations Conference On Trade And Development, 2008, Reviewof Maritime Transport2. United Nations Conference On Trade And Development, 2009, Review ofMaritime Transport3. United Nations Conference On Trade And Development, 2010, Review ofMaritime Transport4. United Nations Conference On Trade And Development, 2011, Review ofMaritime Transport5. United Nations Conference On Trade And Development, 2012, Review ofMaritime Transport6. United Nations Conference On Trade And Development, 2013, Review ofMaritime Transport7. United Nations Conference On Trade And Development, 2014, Review ofMaritime Transport8. United Nations Conference On Trade And Development, 2015, Review ofMaritime Transport9. United Nations Conference On Trade And Development, 2016, Review ofMaritime Transport10. United Nations Conference On Trade And Development, 2017, Reviewof Maritime Transport11. United Nations Conference On Trade And Development, 2018, Reviewof Maritime Transport12. Navios Maritime Holdings Inc., Annual Report 2017,http://www.annualreports.com/Company/navios-maritime-holdings-inc
13. Navios Maritime Holdings Inc., Annual Report 2009,http://www.annualreports.com/Company/navios-maritime-holdings-inc
72

14. Navios Maritime Holdings Inc., Annual Report 2010,http://www.annualreports.com/Company/navios-maritime-holdings-inc
15. Navios Maritime Holdings Inc., Annual Report 2011,http://www.annualreports.com/Company/navios-maritime-holdings-inc
16. Navios Maritime Holdings Inc., Annual Report 2013,http://www.annualreports.com/Company/navios-maritime-holdings-inc
17. Navios Maritime Holdings Inc., Annual Report 2016,http://www.annualreports.com/Company/navios-maritime-holdings-inc
18. Moody’s Investors Service, 2011, Rating Action: Moody’s assigns (P)B3rating to Navios’s USD325 million notes (Greece),https://www.moodys.com/research/Moodys-assigns-PB3-rating-to-Navioss\
-USD325-million-notes-Greece?docid=PR_212409
19.Moody’s Investors Service, 2012, Announcement: Moody’s changes out-look on Navios Holdings’ B1 rating to negative,https://www.moodys.com/research/Moodys-changes-outlook-on-Navios-Holdings\
-B1-rating-to-negative--PR_244500
20. Moody’s Investors Service, 2012, Rating Action: Moody’s downgradesNavios Holdings to B2, outlook stable,https://www.moodys.com/research/Moodys-downgrades-Navios-Holdings-to-B2\
-outlook-stable--PR_258302
21. Moody’s Investors Service, 2013, Rating Action: Moody’s changes out-look on Navios Holdings’ B2 rating to negative from stablehttps://www.moodys.com/research/Moodys-changes-outlook-on-Navios-Holdings\
-B2-rating-to-negative--PR_272322
22. Moody’s Investors Service, 2009, Rating Action: Moody’s assigns a (P)Ba3 rating to Navios’s new senior secured notes, negative outlookhttps://www.moodys.com/research/Moodys-assigns-a-P-Ba3-rating-to-Navioss\
-new-senior--PR_188836
23. Moody’s Investors Service, 2015, Announcement: Moody’s: Navios Hold-ings’ B2 rating buyed by mild dry-bulk rate increases and affiliate supporthttps://www.moodys.com/research/Moodys-Navios-Holdings-B2-rating-buoyed\
-by-mild-dry-bulk--PR_337204
24. Moody’s Investors Service, 2016, Rating Action: Moody’s downgradesNavios Holdings’ rating to Caa1; stable outlookhttps://www.moodys.com/research/Moodys-downgrades-Navios-Holdings-rating\
-to-Caa1-stable-outlook--PR_342189
25. Moody’s Investors Service, 2016, Rating Action: Moody’s downgradesNavios Holdings’ ratings to Caa3; negative outlook
73

https://www.moodys.com/research/Moodys-downgrades-Navios-Holdings-ratings\
-to-Caa3-negative-outlook--PR_347693
26. Moody’s Investors Service, 2017, Rating Action: Moody’s revises NaviosHoldings’ outlook to positivehttps://www.moodys.com/research/Moodys-revises-Navios-Holdings-outlook-to-\
positive--PR_366012
27. Moody’s Investors Service, 2017, Rating Action: Moody’s UpgradesNavios Holdings; CFR at B3https://www.moodys.com/research/Moodys-Upgrades-Navios-Holdings-CFR-at-B3\
--PR_375537
28. Moody’s Investors Service, 2014, Rating Methodology: Shipping Indus-tryhttps://www.moodys.com/researchandratings/rating-methodologies/003006001/
methodology/rating-methodologies/003006001/003006001%7C00500000200D/
-/0/0/-/0/-/-/-/-1/-/-/-/en/global/pdf/-/rra
29. Moody’s Investors Service, 2018, Rating Symbols and Definitionshttps://www.moodys.com/Pages/amr002002.aspx
30. Investopedia, 2018, A Brief History Of Credit Rating Agencieshttps://www.investopedia.com/articles/bonds/09/history-credit-rating-\
agencies.asp 31. Moody’s, About Us,https://www.moodys.com/Pages/atc.aspx
32. Navios Maritime Holdings Inc., About Navios: Corporate Overviewhttps://www.navios.com/Corporate/Overview.asp
33. www.global-rates.com , US Dollar LIBOR rates 2011,https://www.global-rates.com/interest-rates/libor/american-dollar/
2011.aspx
34. www.global-rates.com , US Dollar LIBOR rates 2010,https://www.global-rates.com/interest-rates/libor/american-dollar/
2010.aspx
35. www.global-rates.com , US Dollar LIBOR rates 2013,https://www.global-rates.com/interest-rates/libor/american-dollar/
2013.aspx
36. www.global-rates.com , US Dollar LIBOR rates 2016,https://www.global-rates.com/interest-rates/libor/american-dollar/
2016.aspx
37. www.global-rates.com , US Dollar LIBOR rates 2009,https://www.global-rates.com/interest-rates/libor/american-dollar/
2009.aspx
74

38. Lloyd’s list: Maritime Intelligence, 2018, Chinese leasing orders seen asdrag on dry bulker prospects, Yan Haihttps://lloydslist.maritimeintelligence.informa.com/LL1125260/Chinese\
-leasing-orders-seen-as-drag-on-dry-bulker-prospects
39. Investopedia, 2018, Baltic Dry Index – BDI,https://www.investopedia.com/terms/b/baltic_dry_index.asp
40. G. De Monie, J.-P. Rodrigue, T. Notteboom, 2009, Economic Cycles inMaritime Shipping and Ports: The Path to the Crisis of 2008, ResearchGatehttps://www.researchgate.net/publication/229045634_Economic_Cycles_
in_Maritime_Shipping_and_Ports_The_Path_to_the_Crisis_of_2008?enrichId=
rgreq-de2e0731bf45e61d5dcd83ef7eefa81e-XXX&enrichSource=Y292ZXJQYWdlOzIy\
OTA0NTYzNDtBUzoxMDIwODczNDYwOTgxODJAMTQwMTM1MDkyODQwNg%3D%3D&el=
1_x_2&_esc=publicationCoverPdf
41. Hellenic Shipping News, 2018, Lack of available shipping finance hascontributed to dry bulk market’s revival,https://www.hellenicshippingnews.com/lack-of-available-shipping-finance\
-has-contributed-to-dry-bulk-markets-revival/
42. Dry Bulk Magazine, 2017, Will 2018 bring further growth for the drybulk industry?https://www.drybulkmagazine.com/special-reports/21122017/will-2018-bring\
-further-growth-for-the-dry-bulk-industry/
43. Maritime Connector, Capesize,http://maritime-connector.com/wiki/capesize/
44. BMTI Technik Informations GmbH, Baltic Capesize Index (BCI),https://www.bmti-report.com/baltic-capesize-index-bci/
45. Hellenic Shipping News, 2018, Dry Bulk Market: Capesize Market Look-ing For New Momentumhttps://www.hellenicshippingnews.com/dry-bulk-market-capesize-market\
-looking-for-new-momentum/
46. Hellenic Shipping News, 2018 Dry Bulk Market: Capesize Market In theDoldrumshttps://www.hellenicshippingnews.com/dry-bulk-market-capesize-market\
-in-the-doldrums/
47. Nautemporiki, 2018, Profit over 80% for the Capesize ships in one weekhttps://www.naftemporiki.gr/finance/story/1343639/kerdi-pano-apo-80-\
gia-ta-capesize-ploia-se-mia-ebdomada
48. Manolis G. Kavussanos, Dimitris A. Tsouknidis, 2016 Default risk driversin shipping bank loans, Elsevier
75

https://www.sciencedirect.com/science/article/pii/S1366554516300849
49. Maria-Monica Haralambie, Bogdan Stefan Ionescu, 2016 Corporate qual-itative and quantitative assessment from credit risk perspectivehttp://revista.cafr.ro/temp/Article_9491.pdf
50. www.commerzbank.de, Enhancing profitability through optimizationand de-risking, Investors’ Day 2009https://www.commerzbank.de/media/aktionaere/investors_day/091125-ABF_
Investors-Day-2009_FINAL.pdf
51. www.norwayexports.no 2010 DnB NOR’s conservatism internationalambitionshttps://www.norwayexports.no/dnb-nors-conservatism-international\
-ambitions-2/
52. Credit Agricole S.A Annual Report 2013 https://www.amf-france.
org/technique/\multimedia?docId=37223915-69e2-4a3b-a80f-3832e8b85133&
famille=BDIF&bdifId=3810-41.D_D.14-0183
53. DVB Group SE Annual Report 2017https://www.dvbbank.com/~/media/Files/D/dvbbank-corp/financial-reports\
-en/2017/dvb-group-annual-report-2017.pdf
54. DVB Group SE Annual Report 2016https://www.dvbbank.com/~/media/Files/D/dvbbank-corp/financial-reports\
-en/2016/dvb-group-annual-report-2016.pdf
55. DVB Group SE Annual Report 2015https://www.dvbbank.com/~/media/Files/D/dvbbank-corp/financial-reports\
-en/2016/dvb-group-annual-report-2015.pdf
56. DVB Group SE Annual Report 2014https://www.dvbbank.com/~/media/Files/D/dvbbank-corp/financial-reports\
-en/2016/dvb-group-annual-report-2014.pdf
57. DVB Group SE Annual Report 2013https://www.dvbbank.com/~/media/Files/D/dvbbank-corp/financial-reports\
-en/2016/dvb-group-annual-report-2013.pdf
58. DVB Group SE Annual Report 2012https://www.dvbbank.com/~/media/Files/D/dvbbank-corp/financial-reports\
-en/2016/dvb-group-annual-report-2012.pdf
59. DVB Group SE Annual Report 2011https://www.dvbbank.com/~/media/Files/D/dvbbank-corp/financial-reports\
-en/2016/dvb-group-annual-report-2011.pdf
60. DVB Group SE Annual Report 2010https://www.dvbbank.com/~/media/Files/D/dvbbank-corp/financial-reports\
76

-en/2016/dvb-group-annual-report-2010.pdf
61. DVB Group SE Annual Report 2009https://www.dvbbank.com/~/media/Files/D/dvbbank-corp/financial-reports\
-en/2016/dvb-group-annual-report-2009.pdf
62. DVB Group SE Annual Report 2008https://www.dvbbank.com/~/media/Files/D/dvbbank-corp/financial-reports\
-en/2016/dvb-group-annual-report-2008.pdf
63. www.dvbbank.com , Shipping finance: Productshttps://www.dvbbank.com/en/business-and-expertise/shipping-finance/
products
64. Ted Petropoulos, Petrofin Research 2016, Key Developments and Growthin Greek Ship-Financehttps://www.petrofin.gr/wp-content/uploads/2018/04/PetrofinBankResearch\
-end2015.pdf
65. Dimitris Gavalas , 2017,CREDIT RATING IN BANK SHIPPING FI-NANCE: A Preliminary Analysis of Bank Rating Criteria66. Facilitation of transport and trade in Latin America and the Caribbean,2011, The maritime cycle and the post-crisis ups and downshttps://www.cepal.org/en/publications/36364-maritime-cycle-and-post-crisis\
-ups-and-downs
67. Claudio Ferrari, Malvina Marchese, Alessio Tei, 2018, Shipbuilding andeconomic cycles: a non-linear econometric approachwww.emeraldinsight.com/2397-3757.htm
68. Ted Petropoulos, Petrofin Research 2015https://www.petrofin.gr/wp-content/uploads/2018/03/Nafs-May2015-Ship_
finance\_banks_become_more_aggressive.pdf
69. www.compassmar.com , 2009, What’s in the value of a vessel?http://www.compassmar.com/CMSdoclinks/2009 70. Allan D. Reiss, Mor-gan Lewis Bockius LLP, 2014, Shipping Finance in the Wake of Basel IIIhttps://shippingfinance.files.wordpress.com/2016/07/2014-shipping-finance\
-in-the-wake-of-basel-iii.pdf
71. Moody’s Investors Service, 2016, German Ship Lenders Peer Compari-son: Large exposure to the shipping sector will require further provisioninghttp://cmjrieff.pt/feed-items/moodys-german-ship-lenders-will-require-\
further-provisioning-due-to-large-exposures/
72. Ted Petropoulos, Petrofin Research 2017 Who will replace Europeanbanks as the primary ship-lending institutions?https://www.nafsgreen.gr/articles-2/3328-ted-petropoulos-who-will-replace\
77

-european-banks-as-the-primary-ship-lending-institutions.html
73. Dimitris Gavalas Theodore Syriopoulos 2015, An integrated credit rat-ing and loan quality model: application to bank shipping financehttps://doi.org/10.1080/03088839.2014.904948
74. Evangelos Sambracos and Marina Maniati 2015, Analysis of FinancialCrisis Results on Dry Bulk Market Financinghttps://ideas.repec.org/p/pra/mprapa/68601.html
75. K. Mitroussia,n, W. Abouarghouba, J.J. Haidera, S.J. Pettita, N. Tigka,2015,Performance drivers of shipping loans: An empirical investigationhttps://www.sciencedirect.com/science/article/pii/S0925527315003801
76. Okan Duru, 2013, Irrational Exuberance, Overconfidence and Short-termism: Knowledge-to-Action Asymmetry in Shipping Asset Managementhttps://www.sciencedirect.com/science/article/pii/S2092521213000230
77. Ted Petropoulos, Head of Petrofin Research, 2015 Ship finance banks be-come more aggressive, in streamlining their loan portfolioshttp://www.petrofin.gr/en-gb/mNews.aspx?ElementId=6ab15485-a67d-44c9\
-8562-d4816b0ed9e6
78. Maritimecyprus.com, 2018, Upcoming Maritime Regulations 2018 andonwardshttps://maritimecyprus.com/2018/03/05/upcoming-maritime-regulations-\
2018-and-onwards/
79. Manolis G. Kavussanos, Dimitris A. Tsouknidis 2014, The determinantsof credit spreads changes in global shipping bondshttps://www.sciencedirect.com/science/article/pii/S1366554514000969
80. Stephen X.H. Gong, Yvonne Yiyi Zeng, Heng-Qing Ye, 2016, Ship Fi-nancing Practices in Hong Kong: What Changes Has the Financial TsunamiWrought?https://www.researchgate.net/publication/267710850_Ship_Financing_
Practices\_in_Hong_Kong_What_Changes_Has_the_Financial_Tsunami_Wrought
81. Dimitris Gavalas, 2015, 10 Core Principles in Modern Corporate Finance82. Dimitris Gavalas 2015, Notes from undergraduate lesson “Financialsources in Shipping” , Dept Shipping , Trade and Transport, University ofthe Aegean83. Dr. Theodore Syriopoulos, Notes of lesson “Shipping Finance”, DeptShipping , Trade and Transport, University of the Aegean
78