Risk Assessment for Storm Hardening - Department of … Ed.Resiliency... · Risk Assessment for...
27
Risk Assessment for Storm Hardening DOE Technical Workshop on Resilience Metrics April 29 th , 2014 J. Mark Drexel Department Manager Engineering and Planning
-
Upload
trinhduong -
Category
Documents
-
view
218 -
download
3
Transcript of Risk Assessment for Storm Hardening - Department of … Ed.Resiliency... · Risk Assessment for...

Risk Assessment for Storm Hardening
DOE Technical Workshop on
Resilience Metrics
April 29th, 2014
J. Mark Drexel
Department Manager
Engineering and Planning
Risk Assessment for Storm Hardening
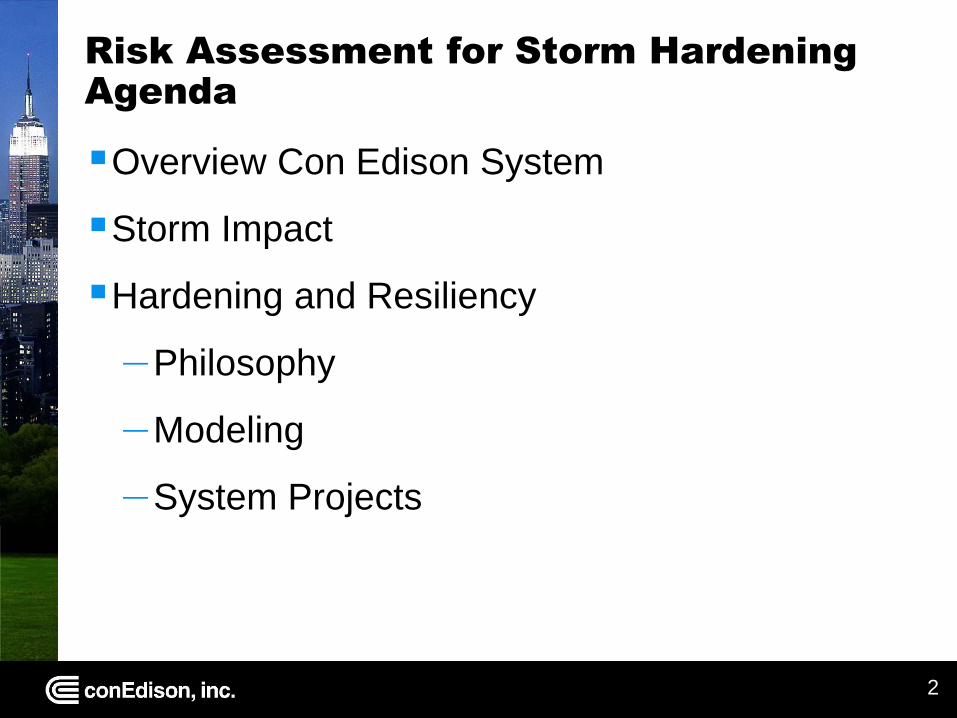
Agenda
Overview Con Edison System
Storm Impact
Hardening and Resiliency
–Philosophy
–Modeling
–System Projects
2

Con Edison of New York
(CECONY) Area: 47,214 sq mi
Peak Demand: 33,939 MW
Load Density: 0.72 MW/sq mi
Con Edison Footprint
604 sq mi
Electric
3.3 million electric customers
Peak Demand: 13,189 MW
Load Density: 21.8 MW/sq mi
Underground network distribution: 86%
690 MW of regulated generation
36,000 miles of overhead transmission and distribution lines
94,000 miles of underground transmission and distribution lines
Gas
Manhattan, Bronx, Queens and Westchester
1.1 million gas customers
4,300 miles of gas mains
Steam
Manhattan – below 96th Street
1,760 steam customers
105 miles of steam mains and lines
3
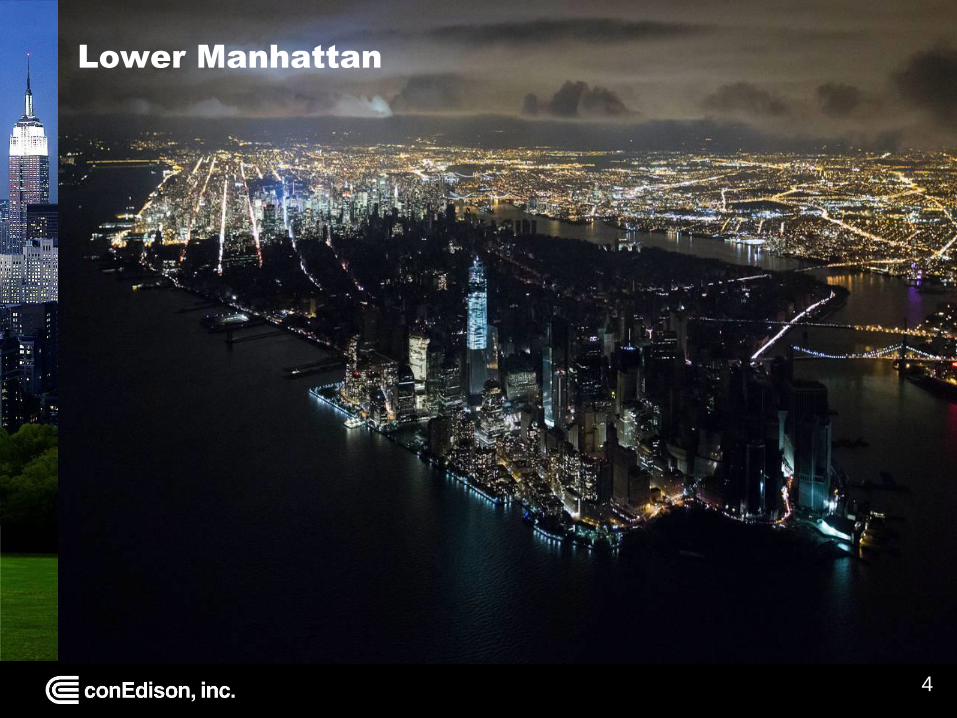
Lower Manhattan
4

Superstorm Sandy
Areas that Flooded
Source: http://project.wnyc.org/flooding-sandy-new/index.html#11.00/40.6846/-74.0224
5

Impact of Sandy on Con Edison Facilities
6

Impact of Sandy on Con Edison Facilities
7
7

Storm Hardening and Resiliency
Guiding Principles
Protect infrastructure – Relocate and envelope equipment to
minimize exposure to wind and water infiltration.
Harden components – Strengthen equipment to withstand water
inundation and tree damage.
Mitigate impact – Improve flexibility to allow for advanced flow
controls around damage equipment.
Facilitate restoration – To identify location and description of
damaged equipment, install remote monitoring and improve
communications to expedite information flow.
8

Hardening and Resiliency Philosophy
Threat Approach
Wind/Tree Caused Damage Protect Infrastructure
Harden Components
Coastal Flooding / Storm Surge Mitigate Impact
Facilitate Restoration
9

Wind / Tree Damage
Hardening and Resiliency
Approach Solution
Protect Infrastructure Tree Trimming
Selective Undergrounding
Harden Components New Pole Designs
Resilient Cable Designs
Mitigate Impact
Increased Automation
Reduced Customer Density per Circuit
Smart Switches
Isolation Devices
Sacrificial Components
Facilitate Restoration
Enhanced Communications
Remote Monitoring and Control
Automatic Meter Infrastructure
10

Coastal Flooding / Storm Surge
Hardening and Resiliency
Approach Solution
Protect Infrastructure Elevate Equipment
Flood Barriers
Harden Components
Waterproofing
Submersible Equipment
Fiber-optic Cable
Float Check Valves
Mitigate Impact
Network Reconfiguration
Increased Automation
Sectionalizing Switches
Facilitate Restoration Enhanced Communications
Remote Monitoring and Control
11

Hardening and Resiliency Modeling
Risk
The likelihood of a significant storm occurring was based on historical information
For the transmission and distribution network systems susceptible to storm surge flooding estimates of the likelihood of specific surge level impacts on those systems were derived from historical New York City surge data.
For Overhead distribution assets storm damages are essentially driven by wind. Probability estimates of this damage based across a range of wind speeds were calculated and applied as impact likelihoods for the OH system assets.
Combining the likelihood of a storm event, the probability of that event resulting in flooding or wind damage, and the population and infrastructure potentially impacted by those occurrences results in an estimate of the total relative risk for the specific asset under consideration.
12

Hardening and Resiliency Modeling
Risk Prioritization
The storm hardening prioritization methodology estimates the
vulnerability of electric system assets based upon the:
Likelihood of a significant storm occurring;
Probability of assets being affected by either flooding or wind
damage based on their location;
Ultimate impact of that electric system damage to population and
supporting critical infrastructure.
13

Storm Hardening and Resiliency
Risk and Risk Reduction Metrics
Risk Assessment Methodology
– Vulnerability
– Duration
– Hardening initiatives.
Factors
– Population
– Critical infrastructure
– Outage duration
14

Storm Hardening and Resiliency
Risk Model
Model’s goal
– To gauge in terms of risk reduction to customers and critical
infrastructure
– Model quantifies and ranks the reduction in risk associated with
each of the storm hardening projects related to the Company’s
transmission, substation, underground network, and overhead
distribution systems.
– Demonstrate a cost causality linkage between capital funding
allocated for storm hardening and the reduction in risk obtained
via that investment.
– Rank all of the asset level risk reductions in highest to lowest
order results in an indication of the relative risk reduction
benefits across all resiliency programs.
15

Storm Hardening and Resiliency
Economic Analysis
Economic cost value analysis
– to quantify, in monetary terms, the benefits of each storm
hardening project including, internal cost savings and avoided
societal costs.
Key Expectation
– help identify the resiliency measures that will have the most
impact and be the most cost-effective,
– select an optimal combination of measures, and prioritize the
order of completing them
16
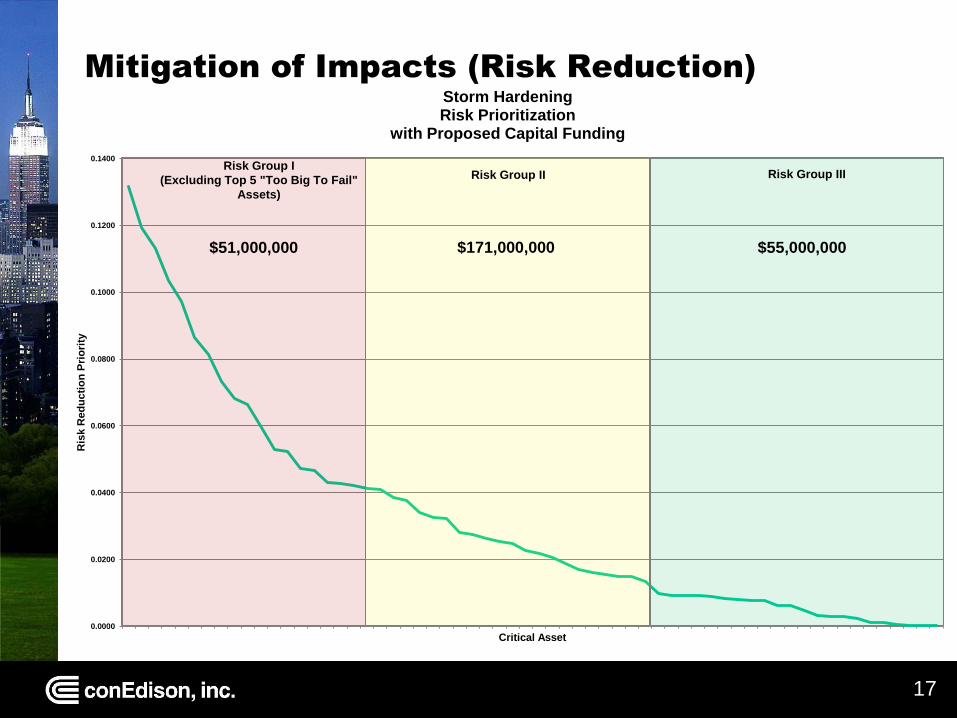
Mitigation of Impacts (Risk Reduction)
17
0.0000
0.0200
0.0400
0.0600
0.0800
0.1000
0.1200
0.1400
Ris
k R
ed
uc
tio
n P
rio
rity
Critical Asset
Storm Hardening Risk Prioritization
with Proposed Capital Funding
Risk Group I
(Excluding Top 5 "Too Big To Fail"
Assets)
Risk Group II Risk Group III
$51,000,000 $171,000,000 $55,000,000

Reduce total outage hours
REDUCE SYSTEM RISK: WEATHER
Con Edison is executing a two-fold strategy to reduce outages and outage duration
18
Cu
sto
mer
ou
tag
es
Time
Fortify utility infrastructure
Reduce outages
Enhance restoration
process
Reduce outage duration
Pre Sandy
Post
Sandy
Risk Assessment for Storm Hardening
DOE Technical Workshop on
Resilience Metrics
April 29th, 2014
J. Mark Drexel
Department Manager
Engineering and Planning

Hardening and Resiliency
Projects
20

Overhead System
21
Advanced Equipment
Selective Undergrounding
Reduce Segment Size
Sacrificial Components
Enhanced Technology

Underground Network System
Network Reconfiguration
Bowling Green:
123 MW
Fulton: 115 MW
New Sub-Networks
BG - 2
F - 2
F - 1
BG - 1
Utilize Latest Technology
Harden Components
Mitigate Impact
Facilitate Restoration
26

Substations and Generating Stations
Protect Infrastructure
Establish New Design
Flood Elevation for Each
Station
Control Flood Waters
Raise Critical Equipment
Harden Operating
Circuits
32

Before After
Steam Generation Plants
Flood Gates
40

Gas Distribution System
Harden Components
Replace Cast Iron & Bare Steel in
Flood Prone Areas
Install Float Check Valves
Evaluate Options for 62 Regulator
Stations in Flood Zones
Con Edison Developed
Float Check Valve
42

Tunnel Hardening
Protect Infrastructure
43
Water Intrusion Management
– Install Two Additional High Flow
Rate Pumps Per Tunnel
– Install Backup Diesel Generators
Build Reinforced Concrete Head
Houses
– First Avenue
– Ravenswood
– Astoria
– Hudson Avenue

Risk Assessment for Storm Hardening
DOE Technical Workshop on
Resilience Metrics
April 29th, 2014
J. Mark Drexel
Department Manager
Engineering and Planning