
RISK ASSESSMENT -...
27
RISK ASSESSMENT Submitted to: Ministry of Environment and Forests Prepared For Prepared By GAIL (India) Limited SENES Consultants India Pvt. Ltd. (An Arcadis Company) March 2015 Onshore Oil and Gas Exploration (Exploratory Drilling) CAMBAY BASIN, CB-ONN-2010/11 GUJARAT
Transcript of RISK ASSESSMENT -...

RISK ASSESSMENT
Submitted to:
Ministry of Environment and Forests
Prepared For Prepared By
GAIL (India) Limited
SENES Consultants India Pvt. Ltd.
(An Arcadis Company)
March 2015
Onshore Oil and Gas Exploration (Exploratory Drilling)
CAMBAY BASIN, CB-ONN-2010/11 GUJARAT

EIA study for exploratory drilling - Cambay Basin CB-ONN-2010/11
SENES/D-20484/March’15 i GAIL
INFORMATION ABOUT EIA CONSULTANTS
Brief Company Profile
This Environmental Impact Assessment (EIA) report has been prepared by SENES Consultants India Pvt. Ltd. SENES India, registered with the Companies Act of 1956 (Ranked No. 1 in 1956), has been operating in the county for more than 11 years and holds expertise in conducting Environmental Impact Assessments, Social Impact Assessments, Environment Health and Safety Compliance Audits, Designing and Planning of Solid Waste Management Facilities and Carbon Advisory Services.
Addresses of SENES offices across India are as below:
Noida (Head Office): 3rd Floor, Tower B, Logix Techno Park, Plot No. 5, Sector – 127, Noida Uttar Pradesh -201301
Tel: +91-020-4368400 Fax: +91-020-4368401
Mumbai: 711, Mayuresh Cosmos
Plot No. 37, Sector 11 CBD, Mumbai – 400614 Tel: +91-22-27576298 Fax: +91-22-27564781
Kolkata : Stesalit Tower 6th Floor, E 2-3, EP &GP, Block Sector V, Salt Lake
Kolkata – 700091 Tel: +91-33-23578070/73
Hyderabad: 305, Third Floor, 12-13-97, Tata Tycoon Tarnaka Hyderabad – 500017 Tel: +91-40-40180801 Fax: +91-40-40180802
QCI/NABET Accreditation Status
As on date, SENES has been granted accreditation by the Quality Council of India / National Accreditation Board for Education & Training (QCI / NABET) in 12 sectors vide Certificate No. NABET/EIA/RA016/040 valid up to March 5, 2017. The certificate of accreditation is enclosed in the following page.

EIA study for exploratory drilling - Cambay Basin CB-ONN-2010/11
SENES/D-20484/March’15 ii GAIL

EIA study for exploratory drilling - Cambay Basin CB-ONN-2010/11
SENES/D-20484/March’15 iii GAIL

EIA study for exploratory drilling - Cambay Basin CB-ONN-2010/11
SENES/D-20484/March’15 iv GAIL
Declaration by Experts contributing to EIA study for Seismic & Exploratory Drilling of Onshore Oil and Gas Block CB-ONN-2010/11, Ahmedabad and Anand, Gujarat for GAIL (India) Limited. I, hereby, certify that I was a part of the EIA team in following capacity that developed this EIA. EIA Coordinator: Name: MANGESH DAKHORE
Signature: Period of involvement: June’13 - till date Contact information: SENES CONSULTANTS INDIA PRIVATE LIMITED IST FLOOR, TOWER B, LOGIX TECHNO PARK PLOT NO. 5 SECTOR 127, NOIDA, UP Functional Area Experts: Functional Area Experts (FAEs) involved in carrying out EIA study for GAIL’s onshore exploratory drilling project in Cambay Basin block CB-ONN-2010/11 are enlisted below.
S. N Functional Areas Name of Expert/s
Involvement (Period & Task**) Signature& Date
1 AQ* Debanjan Bandyopadhyay Full Time
01.03.2015
2 LU* Girish Shukla Full Time
01.03.2015
3 SE Ranjit Mukherjee Empanelled
25.02.2015
4 RH*, SHW*, AP*and WP * Mangesh Dakhore Full Time
01.03.2015
5 EB* Abhishek Goswami Full Time
22.02.2015 *See overleaf for the details

EIA study for exploratory drilling - Cambay Basin CB-ONN-2010/11
SENES/D-20484/March’15 v GAIL
Declaration by the Head of Accredited Consultant Organization I, MAINAK HAZRA, hereby, confirm that the above mentioned experts prepared the EIA study for Seismic & Exploratory Drilling of Onshore Oil and Gas Block CB-ONN-2010/11 in Ahmedabad and Anand, Gujarat for GAIL (India) Limited. I also confirm that I shall be fully accountable for any mis-leading information mentioned in this statement. Signature:
Name: MAINAK HAZRA Designation: Director Name of the EIA Consultant Organization: SENES CONSULTANTS INDIA PRIVATE LIMITED NABET Certificate No. & Issue Date: NABET/EIA/RA016/040 & 11 August 2014
S. N Functional Area Code Complete name of the Functional Areas
1 AP Air Pollution Prevention, Monitoring & Control
2 WP Water Pollution Prevention, Control & Prediction of Impacts
3 SHW Solid Waste and Hazardous Waste Management
4 SE Socio-Economics
5 EB Ecology and Biodiversity
6 AQ Meteorology, Air Quality Modeling & Prediction
7 NV Noise/ Vibration
8 LU Land Use
9 RH Risk Assessment & Hazard Management

EIA study for exploratory drilling - Cambay Basin CB-ONN-2010/11
SENES/D-20484/March’15 vi GAIL
TABLE OF CONTENTS
1.0 QUANTITATIVE RISK ASSESSMENT .....................................................................8
1.1 Objective of the QRA Study .......................................................................................... 8
1.2 Risk Assessment Methodology ...................................................................................... 9
1.2.1 Hazard Identification .......................................................................................10 1.2.2 Frequency Analysis ..........................................................................................11 1.2.3 Consequence Analysis ......................................................................................12
1.2.4 Risk Evaluation ................................................................................................13
1.3 Risk Assessment of Identified Project Hazards ........................................................... 14
1.3.1 Blow Outs/Loss of Well Control ......................................................................14 1.3.2 Process Leaks/Fires .........................................................................................23 1.3.3 Non-process fires/explosions ...........................................................................26
List of Tables
Table No. Page No. Table 1-1: Frequency Categories and Criteria ......................................................................... 12
Table 1-2: Severity Categories and Criteria ............................................................................. 13
Table 1-3: Risk Matrix ............................................................................................................. 14
Table 1-4: Risk Criteria and Action Requirements.................................................................. 14
Table 1-5: Blow Out Cause Distribution for Failures During Exploratory Drilling................ 16
Table 1-6: Pool Fire Modeling Scenarios ................................................................................ 18
Table 1-7: Pool Fire Diameter and Steady State Burning Area ............................................... 18
Table 1-8: Thermal Radiation Intensity Threshold Values Impact Criterion .......................... 18
Table 1-9: Distance to Thermal Radiation Threshold Levels .................................................. 19
Table 1-10: Jet Fire Modeling Scenarios ................................................................................. 20
Table 1-11: Jet Fire Flame Length For Risk Scenarios Considered ........................................ 20
Table 1-12: Jet Fire Hazard Ranges ......................................................................................... 21
Table 1-13: Pool Diameter for Oil Spill Risk Scenarios.......................................................... 22
Table 1-14: Leak Frequencies for Process Equipment ............................................................ 23
Table 1-15: Project Process Equipment’s Leak Frequencies ................................................... 24
Table 1-16: Generic Ignition Probabilities .............................................................................. 25
Table 1-17: Frequency of Occurrence - Non-Process Fires ..................................................... 26

EIA study for exploratory drilling - Cambay Basin CB-ONN-2010/11
SENES/D-20484/March’15 vii GAIL
List of Figures
Figure No. Page No. Figure 1-1: Risk Assessment Methodology ............................................................................. 10
Figure 1-2: Blow Out Frequencies in Oil and Gas Industry .................................................... 17

EIA study for exploratory drilling - Cambay Basin CB-ONN-2010/11
SENES/D-20484/ March‘15 GAIL 8
QRA as a part of integrated risk management process for the proposed project consists of the following iterative steps:
Identification of hazards Setting Acceptance Standards for the defined risks Evaluation of likelihood and consequences and risks of possible events. Confirmation of arrangements to mitigate the events and respond to the same on
occurrence. Establishment of performance standards Establishment of continuous monitoring, review and auditing of arrangements
1.0 QUANTITATIVE RISK ASSESSMENT
This section on Quantitative Risk Assessment (QRA) aims to provide a systematic analysis of major risks that may arise as a result of onshore exploration activities by GAIL in the CB-ONN-2010/11 block. The QRA process outlines rational evaluations of identified risks based on significance and provides the outline for appropriate preventive and risk mitigation measures. Results of the QRA provide valuable inputs into the overall project planning and decision making process for effectively addressing identified risks. This will ensure that project risks stay below As Low as Reasonably Practicable (ALARP) levels at all times during project implementation. In addition, the QRA will also help in assessing risks arising from potential emergency situations like a blow out and develop structured Emergency Response Plan (ERP) to restrict damage to personnel, infrastructure and environment.
QRA – INTEGRATED RISK MANAGEMENT PROCESS
Risk study for onshore exploration activities has considered all aspects of operation of the drilling rig and other associated activities during the exploratory phase. Oil spills, loss of well control / blow-out and process leaks constitute major potential hazard that may be associated with the proposed onshore drilling for oil and gas in the exploratory block. The study however does not examine risks or hazards associated with development and production program of exploratory wells.
The following section describes objectives, methodology of the risk assessment study and then presents the assessment for each of the potential risk separately. This includes identification of major hazards, hazard screening and ranking and frequency and consequence analysis for major hazards. Hazards have subsequently been quantitatively evaluated through a criterion based risk evaluation matrix. Risk mitigation measures to reduce significant risks to acceptable levels are also recommended as part of risk assessment study.
1.1 OBJECTIVE OF THE QRA STUDY
The overall objective of this QRA with respect to the proposed project involves the identification and evaluation of major risks, prioritizing risks identified based on their hazard

EIA study for exploratory drilling - Cambay Basin CB-ONN-2010/11
SENES/D-20484/ March‘15 GAIL 9
consequences and formulating suitable risk reduction/mitigation measures in line with the ALARP principle. Hence, in order to ensure effective management of any emergency situation (with potential individual and societal risks) that may arise during the exploratory drilling phase, the following specific objectives need to be achieved.
Identifying potential risk scenarios that may arise from proposed drilling and other associated activities like operation of ancillary facilities and equipment’s, mud chemicals storage and handling etc.
Analyzing the possible likelihood and frequency of such risk scenarios by reviewing historical accident related data for offshore oil and gas industries.
Predicting consequences of potential risk scenarios and if consequences are high, establishing the same through application of quantitative simulations.
Recommending feasible preventive and risk mitigation measures as well as providing inputs for drawing up of Disaster Management Plan (DMP) for the project.
1.2 RISK ASSESSMENT METHODOLOGY
The risk assessment process is primarily based on likelihood of occurrence of risks identified and their possible hazard consequences particularly being evaluated through hypothetical accident scenarios. With respect to the proposed project, major risks viz. blow outs, process leaks and fires, non-process fires etc. is assessed and evaluated through a risk matrix generated to combine risk severity and likelihood factor. Risk associated with exploratory drilling activities is determined semi- quantitatively as the product of likelihood/probability and severity/consequence by using order of magnitude data (risk ranking = severity/consequence factor X likelihood/probability factor). Significance of such project related risks is then established through their classification as high, medium, low, very low depending upon risk ranking.
The risk matrix is a widely accepted and standardized method of quantitative risk assessment and is preferred over purely quantitative methods, given its inherent limitations to define a risk event with certainty. The application of this tool has resulted in the prioritization of potential risks events for the proposed seismic and exploratory drilling operations thus providing the basis for drawing up risk mitigation measures and leading to formulation of plans for risk and emergency management. The overall approach is summarized in the Figure 1.1

EIA study for exploratory drilling - Cambay Basin CB-ONN-2010/11
SENES/D-20484/ March‘15 GAIL 10
FIGURE 1-1: RISK ASSESSMENT METHODOLOGY
1.2.1 Hazard Identification
Hazard identification for the purpose of this QRA comprises of a review of the project and associated activity related information provided by GAIL. In addition, guidance provided by knowledge platforms/portals of the upstream oil and gas industry including OGP, ITOPF and DNV, Norwegian Petroleum Directorate etc. were used to identify potential hazards that can arise out proposed project activities.
Taking into account applicability of different risk aspects in context of drilling operations to be undertaken in the CB-ONN-2010/11 Block, there are three major categories of hazards that can be associated with proposed project is dealt with in detail. This includes:
Blowouts leading to pool fires/jet fires and oil spills Process leaks and fires Non-process fires / explosions

EIA study for exploratory drilling - Cambay Basin CB-ONN-2010/11
SENES/D-20484/ March‘15 GAIL 11
Well control incident covers a range events which has the potential of leading to blow outs but are generally controlled by necessary technological interventions. Hence such incidents are considered of minor consequences and as a result not well documented. Other possible hazard scenarios like mud chemical spills, falls, etc. has also not been considered for detailed assessment as preliminary evaluation has indicated that overall risk may arise out of it and would be low. In addition, it is understood that causative factors and mitigation measures, for such events can adequately be taken care of through exiting safety management procedures and practices of GAIL.
It must also be noted here that many of the hazards identified are( sometimes) interrelated with one hazard often having the ability to trigger off another hazard through a domino effect. For example, a large oil spill in most instances is caused by another hazardous incident like a blowout or process leak. This aspect is considered while drawing up hazard mitigation measures and such linkages (between hazards) has also been given due importance for managing hazards and associated risks in a composite manner through GAIL’s Health, Safety and Environmental Management System (HSEMS) and through Disaster Management Plan, if a contingency situation arises.
1.2.2 Frequency Analysis
Frequency analysis involves estimating likelihood of each of the failure cases identified during hazard identification stage. The analysis of frequencies of occurrences for the key hazards that has been listed out is important to assess the likelihood of such hazards to actually unfold during the lifecycle of the project. The frequency analysis approach for the proposed project is based primarily on historical accident frequency data, event tree analysis and judgmental evaluation. Major oil and gas industry information sources viz. statistical data, historical records and global industry experience are considered during frequency analysis of major identified risks1.
For the purpose of QRA undertaken for the proposed project, various accident statistics and published oil industry databases are consulted for arriving at probable frequencies of identified hazards. However, taking into account the absence of representative historical data/statistics with respect to onshore operations2 relevant offshore accident databases are considered in the frequency analysis of identified hazards. The same is recommended in “Risk Assessment Data Directory” published by International Association of Oil and Gas Producers (OGP). Key databases/reports referred as part of the QRA study includes Worldwide Offshore Accident Databank (WOAD), Outer Continental Shelf (OCS) Reports, Norwegian Petroleum Directorate Directives, Offshore Reliability Data (OREDA) Handbook, HSE Offshore Incident Database, SINTEF Offshore Blowout Database etc.
1 It is to be noted that the frequency of occurrences are usually obtained by a combination of component probabilities derived on basis of reliability data and /or statistical analysis of historical data. 2 Although Alberta Energy and Utilities Board (EUB) maintains a database for onshore incidents for the period 1975-1990 the same has not been considered in the context of the present study as the Alberta wells are believed to be sour with precaution being taken accordingly to minimize the likelihood of release.
EIA study for exploratory drilling - Cambay Basin CB-ONN-2010/11
SENES/D-20484/ March‘15 GAIL 12
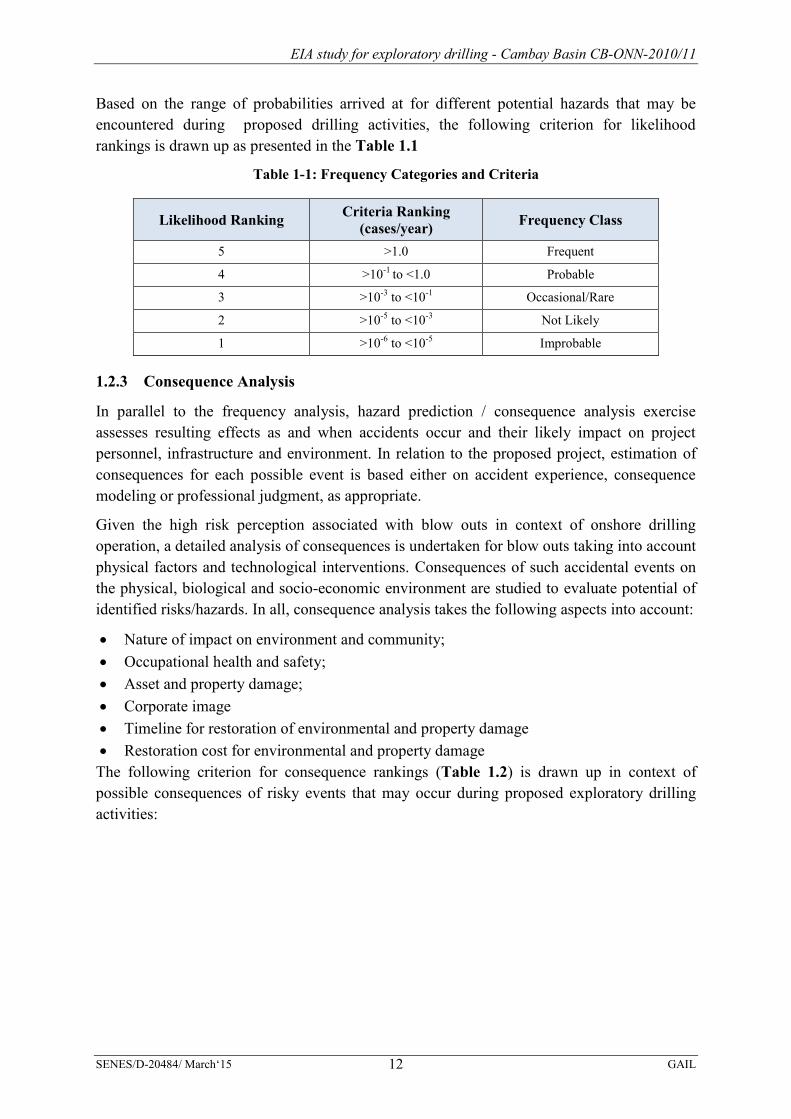
Based on the range of probabilities arrived at for different potential hazards that may be encountered during proposed drilling activities, the following criterion for likelihood rankings is drawn up as presented in the Table 1.1
Table 1-1: Frequency Categories and Criteria
Likelihood Ranking Criteria Ranking (cases/year) Frequency Class
5 >1.0 Frequent
4 >10-1 to <1.0 Probable
3 >10-3 to <10-1 Occasional/Rare
2 >10-5 to <10-3 Not Likely
1 >10-6 to <10-5 Improbable
1.2.3 Consequence Analysis
In parallel to the frequency analysis, hazard prediction / consequence analysis exercise assesses resulting effects as and when accidents occur and their likely impact on project personnel, infrastructure and environment. In relation to the proposed project, estimation of consequences for each possible event is based either on accident experience, consequence modeling or professional judgment, as appropriate.
Given the high risk perception associated with blow outs in context of onshore drilling operation, a detailed analysis of consequences is undertaken for blow outs taking into account physical factors and technological interventions. Consequences of such accidental events on the physical, biological and socio-economic environment are studied to evaluate potential of identified risks/hazards. In all, consequence analysis takes the following aspects into account:
Nature of impact on environment and community; Occupational health and safety; Asset and property damage; Corporate image Timeline for restoration of environmental and property damage Restoration cost for environmental and property damage
The following criterion for consequence rankings (Table 1.2) is drawn up in context of possible consequences of risky events that may occur during proposed exploratory drilling activities:

EIA study for exploratory drilling - Cambay Basin CB-ONN-2010/11
SENES/D-20484/ March‘15 GAIL 13
Table 1-2: Severity Categories and Criteria
Consequence Ranking Criterion Definition
Catastrophic 5
Multiple fatalities/Permanent total disability to more than 50 persons Severe violations of national limits for environmental emission More than 5 years for natural recovery Net negative financial impact of >10 crores Long term impact on ecologically sensitive areas International media coverage National stakeholder concern and media coverage
Major 4
Single fatality/permanent total disability to one or more persons Major violations of national limits for environmental emissions 2-5 years for natural recovery Net negative financial impact of 5 -10 crores Significant impact on endangered and threatened floral and faunal species Loss of corporate image and reputation
Moderate 3
Short term hospitalization and rehabilitation leading to recovery Short term violations of national limits for environmental emissions 1-2 years for natural recovery Net negative financial impact of 1-5 crores Short term impact on protected natural habitats State wide media coverage
Minor 2
Medical treatment injuries 1 year for natural recovery Net negative financial impact of 0.5 – 1 crore Temporary and mitigable environmental impacts Local stakeholder concern and public attention
Insignificant 1
First Aid treatment with no Lost Time Incidents (LTIs) Natural recovery < 1year Net negative financial impact of <0.5 crores. No significant impact on environmental components No media coverage
1.2.4 Risk Evaluation
Based on ranking of likelihood and frequencies, each identified hazard is evaluated based on the likelihood of occurrence and magnitude of consequences. The significance of risk is expressed as product of likelihood and consequence of the risk event, expressed as follows:
Significance = Likelihood X Consequence
Table 1.3 below illustrates all possible product results for five likelihood and consequence categories while Table 1.4 assigns risk significance criterion in four regions that identify the limit of risk acceptability as per HSE management system of GAIL. Depending on the position of intersection of a column with a row in the risk matrix, hazard prone activities are classified as low, medium and high, thereby qualifying for a set of risk reduction / mitigation strategies.

EIA study for exploratory drilling - Cambay Basin CB-ONN-2010/11
SENES/D-20484/ March‘15 GAIL 14
Table 1-3: Risk Matrix
Con
sequ
ence
→
Likelihood →
Frequent Probable Remote Not Likely Improbable
5 4 3 2 1
Catastrophic 5 25 20 15 10 5
Major 4 20 16 12 8 4
Moderate 3 15 12 9 6 3
Minor 2 10 8 6 4 2
Insignificant 1 5 4 3 2 1
TABLE 1-4: RISK CRITERIA AND ACTION REQUIREMENTS
Risk Significance Criteria Definition and Action Requirements
High (16 - 25) “Risk requires attention” – Project HSE Management need to ensure that necessary mitigation are adopted to ensure that possible risk remains within acceptable limits
Medium (10 – 15) “Risk is tolerable” – Project HSE Management needs to adopt necessary measures to prevent any change/modification of existing risk controls and ensure implementation of all practicable controls.
Low (5 – 9) “Risk is acceptable” – Project related risks are managed by well-established controls and routine processes/procedures. Implementation of additional controls can be considered.
Very Low (1 – 4) “Risk is acceptable” – All risks are managed by well-established controls and routine processes/procedures. Additional risk controls need not to be considered
1.3 RISK ASSESSMENT OF IDENTIFIED PROJECT HAZARDS
As already discussed in the previous section, three major categories of risk are identified in relation to proposed exploratory well drilling activities. A comprehensive risk assessment study is undertaken to assess and evaluate significance of the identified risks in terms of severity of consequences and likelihood of occurrence. Risk assessment study details are summarized in subsequent sections below:
1.3.1 Blow Outs/Loss of Well Control
Blow out is an uncontrolled release of well fluid (primarily hydrocarbons viz. oil and/or gas and may also include drilling mud, completion fluid, water etc.) from an exploratory or producing well. Blow out results from failure to control a kick and regain pressure control

EIA study for exploratory drilling - Cambay Basin CB-ONN-2010/11
SENES/D-20484/ March‘15 GAIL 15
and are typically caused by equipment failure or human error. The possible blow out caused events occurring in isolation or in combination is listed below:
Formation fluid entry into well bore Loss of containment due to mal-operation (viz. wire lining) Well head damage (e.g. by fires, storms, dropped object etc.)
The most common cause of blow out can be associated with sudden/unexpected entry/release of formation fluid into well bore that may arise as a result of following events discussed in Box 1.1 below.
Box 1-1 PRIMARY CAUSES OF BLOW OUTS
Shallow gas In shallow formations, there may be pockets of shallow gas. In these instances, there is often insufficient mud density in the well. If the hole strikes shallow gas, the gas may be released through diverter from drilling rig very rapidly. Main preventative measures of shallow gas are to carry out prior seismic surveys of the area. Typical geological features which suggest presence of shallow gas can then be detected. Historically, striking of shallow gas is one of the most frequent causes of blowouts in drilling. Swabbing As the drill pipe is pulled upwards during trips out of the hole or upward movement of the drill string, pressure in the hole beneath the drill bit is reduced, creating a suction effect. Sufficient drilling mud must be pumped down-hole to compensate for this effect. Well fluids may enter the bore. Swabbing is also a frequent cause of drilling blowouts. High formation pressure Drilling into an unexpected zone of high pressure may allow formation fluids to enter the well before mud weight can be increased to prevent it. Insufficient mud weight Primary method of well control is the use of drilling mud; in correct operation. The hydrostatic pressure exerted by mud prevents well fluids from entering the well bore. A high mud weight provides safety against well fluids in-flows. However, a high mud weight reduces drilling speed, therefore, the mud weight is calculated to establish the weight most suitable to safely control anticipated formation pressures and allows optimum rates of penetration. If the required mud weight is incorrectly calculated then well fluid may be able to enter the bore. Lost Circulation Drilling mud circulation can be lost if the mud enters a permeable formation instead of returning to the rig. This reduces the hydrostatic pressures exerted by the mud throughout the well bore and may allow well fluids from another formation to enter the bore. Gas cut mud Drilling fluids are denser than well fluids; this density is required to provide hydrostatic pressure which prevents well fluids from entering the bore. If well fluids mix with mud then its density will be reduced. As the mud is circulated back to surface, the hydrostatic pressure exerted by the mud column is reduced. Once the gas reaches surface it is released into the atmosphere.
Source: A Guide to Quantitative Risk Assessment for Offshore Installations; John Spouge – DNV Technical Publication 99/100a
EIA study for exploratory drilling - Cambay Basin CB-ONN-2010/11
SENES/D-20484/ March‘15 GAIL 16
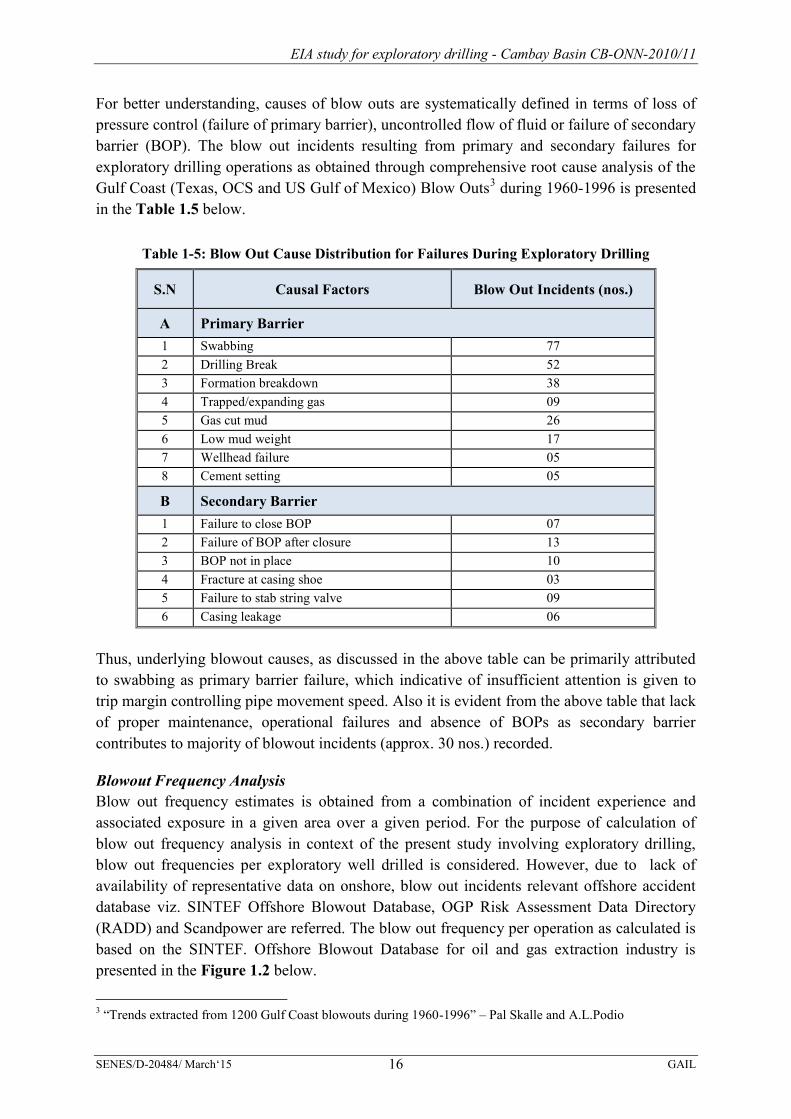
For better understanding, causes of blow outs are systematically defined in terms of loss of pressure control (failure of primary barrier), uncontrolled flow of fluid or failure of secondary barrier (BOP). The blow out incidents resulting from primary and secondary failures for exploratory drilling operations as obtained through comprehensive root cause analysis of the Gulf Coast (Texas, OCS and US Gulf of Mexico) Blow Outs3 during 1960-1996 is presented in the Table 1.5 below.
Table 1-5: Blow Out Cause Distribution for Failures During Exploratory Drilling
S.N Causal Factors Blow Out Incidents (nos.)
A Primary Barrier 1 Swabbing 77 2 Drilling Break 52 3 Formation breakdown 38 4 Trapped/expanding gas 09 5 Gas cut mud 26 6 Low mud weight 17 7 Wellhead failure 05 8 Cement setting 05
B Secondary Barrier 1 Failure to close BOP 07 2 Failure of BOP after closure 13 3 BOP not in place 10 4 Fracture at casing shoe 03 5 Failure to stab string valve 09 6 Casing leakage 06
Thus, underlying blowout causes, as discussed in the above table can be primarily attributed to swabbing as primary barrier failure, which indicative of insufficient attention is given to trip margin controlling pipe movement speed. Also it is evident from the above table that lack of proper maintenance, operational failures and absence of BOPs as secondary barrier contributes to majority of blowout incidents (approx. 30 nos.) recorded.
Blowout Frequency Analysis Blow out frequency estimates is obtained from a combination of incident experience and associated exposure in a given area over a given period. For the purpose of calculation of blow out frequency analysis in context of the present study involving exploratory drilling, blow out frequencies per exploratory well drilled is considered. However, due to lack of availability of representative data on onshore, blow out incidents relevant offshore accident database viz. SINTEF Offshore Blowout Database, OGP Risk Assessment Data Directory (RADD) and Scandpower are referred. The blow out frequency per operation as calculated is based on the SINTEF. Offshore Blowout Database for oil and gas extraction industry is presented in the Figure 1.2 below.
3 “Trends extracted from 1200 Gulf Coast blowouts during 1960-1996” – Pal Skalle and A.L.Podio

EIA study for exploratory drilling - Cambay Basin CB-ONN-2010/11
SENES/D-20484/ March‘15 GAIL 17
FIGURE 1-2: BLOW OUT FREQUENCIES IN OIL AND GAS INDUSTRY
With respect to the proposed project, blow out occurrence frequency as based on analysis of historical data4 is considered to be 7.5 X 10⁻³ per well drilled. Based on given frequency and information provided by GAIL on the proposed exploratory drilling program, the blow out frequency is calculated as follows:
No of exploratory wells to be drilled = 8 (A) (Eight well are to be drilled) Blow out frequency for exploratory drilling = 7.5 X 10⁻³ per well drilled (B) Frequency of blow out occurrence for the proposed project = (A X B) = 8 X 7.5 X 10-3
= 6 X 10⁻⁴ per well drilled
Thus the blow out frequency for the proposed project is calculated to be 6 X 10⁻⁴ per well drilled i.e. the likelihood of its occurrence is “Remote”
Blowout Consequence Analysis Blow out from a hydrocarbon exploratory and/or producing well may lead to the following possible risk consequences: Pool fires and smoke plumes resulting from ignited oil blow-outs Jet fires resulting from ignited gas blow outs Oil slicks resulting from un-ignited oil pools.
Pool fire A pool fire is a turbulent diffusion fire burning above a pool of vaporizing hydrocarbon fuel where the fuel vapor has negligible initial momentum. The probability of occurrence of pool fires for oil and gas exploration is high due to continuous handling of heavy hydrocarbons.
4 Analysis of the SINTEF database for the US GoM OCS/North Sea for the period 1980-92 by Scand power (1995)

EIA study for exploratory drilling - Cambay Basin CB-ONN-2010/11
SENES/D-20484/ March‘15 GAIL 18
The evaporation of hydrocarbons from a pool forms a cloud of vapor above the pool surface which on ignition lead to the generation of pool fire.
For the purpose of consequence modeling for pool fires resulting from blowouts, following hypothetical scenarios in terms of hydrocarbon (particularly crude oil) release rates (Table 1.6) are considered based on DNV Technica’s FLARE programme.
TABLE 1-6: POOL FIRE MODELING SCENARIOS Scenario Release Rate (kg/s) Release Type
Scenario - I 1 Small Scenario - II 10 Medium Scenario – III (Worst Case) 50 Large
Release rates as specified for aforesaid scenarios is utilized in computing the pool fire diameter utilizing the following equation and input parameters: D = √4Q/πb Where D = pool diameter (m)
Q = release rate (kg/s)
b = burning rate (kg/m2s)
The mass burning rate for crude oil is considered 0.05 kg/m2s Based on the above equation, pool fire diameter and steady study burning areas computed for various release types are presented in the Table 1.7 below.
TABLE 1-7: POOL FIRE DIAMETER AND STEADY STATE BURNING AREA
Scenario Release
Rate (kg/s) Release
Type Pool fire
diameter (m) Steady State
Burning Area (m2) Scenario - I 1 Small 5.05 6.37 Scenario - II 10 Medium 15.96 63.69 Scenario - III 50 Large 35.69 318.47
Impact zone for long duration fires is conveniently described by thermal radiation contours and its effects on the people who are exposed to such radiation levels for one minute (60sec). The thermal radiation threshold values (measured in kilowatts per square meter) defined for crude oil pool fire consequence modeling is provided in Table 1.8 below:
TABLE 1-8: THERMAL RADIATION INTENSITY THRESHOLD VALUES IMPACT CRITERION Threshold Radiation
Intensity Threat Zone
Impact Criterion
5.0 kW/m2 Green Escape actions within one minute. Cause second degree burns within 60 sec.
12.5 kW/m2 Blue Escape actions lasting for few seconds. Cause second degree burns within 40 sec.
37.5 kW/m2 Red Results in immediate fatality. Pain threshold is instantaneous leading to second degree burns within 8 sec.

EIA study for exploratory drilling - Cambay Basin CB-ONN-2010/11
SENES/D-20484/ March‘15 GAIL 19
For estimating the distance to a pool fire, heat radiation level that could cause second degree burns and fatality for a maximum exposure of 60 secs, the following EPA equation and input parameters are utilized.
))T - (T C (H 5000
A0.0001 H X
ABpvc
Where: X = distance to the heat radiation level (m) HC = heat of combustion of the flammable liquid (joules/kg) HV = heat of vaporization of the flammable liquid (joules/kg) A = pool area (m2) CP = liquid heat capacity (joules/kg-ºK) TB = boiling temperature of the liquid (ºK) TA = ambient temperature (ºK) For crude oil HC = 42600000 joules/kg; HV = 957144 joules/kg; CP = 1892 joules/kg-ºK; TB = 633 ºK and TA = 300 ºK. The following input parameter along with pool area (m2) computed for blow out risk scenarios provides distance to the threshold heat radiation levels for the threat zones and is presented in Table 1.9 below
TABLE 1-9: DISTANCE TO THERMAL RADIATION THRESHOLD LEVELS
Release Type
Pool fire diameter (m)
Pool fire area (m2)
Distance to 5.0 kW/m2
(m)
Distance to 12.5 kW/m2
(m)
Distance to 37.5 kW/m2
(m) Small 5.05 6.37 6.81 4.31 2.49 Medium 15.96 63.69 21.54 13.62 7.86 Large 35.69 318.47 48.16 30.46 17.59
The worst hazard for release and ignition of crude oil at a rate of 50kg/s for a thermal radiation intensity of 37.5 kW/m2 is likely to be experienced to a maximum distance of 17.59m from the source with potential lethal effects experienced within 8 sec.
Risk Ranking – Blowout Pool Fire (Worst Case Scenario)
Likelihood ranking 3 Consequence ranking 4
Risk Ranking and Significance = 12 i.e. “Medium” Jet fire Jet fires are burning jets of gas or sprays of atomized liquids resulting from gas and condensate released from high pressure equipment and blow outs. Jet fires may also result in the release of high pressure liquid containing dissolved gas due to gas flashing off and turning the liquid into a spray of small droplets. In context of the present study, formation of jet fires can be attributed to the high pressure release and ignition of natural gas, if encountered during exploration of block hydrocarbon reserves.
EIA study for exploratory drilling - Cambay Basin CB-ONN-2010/11
SENES/D-20484/ March‘15 GAIL 20
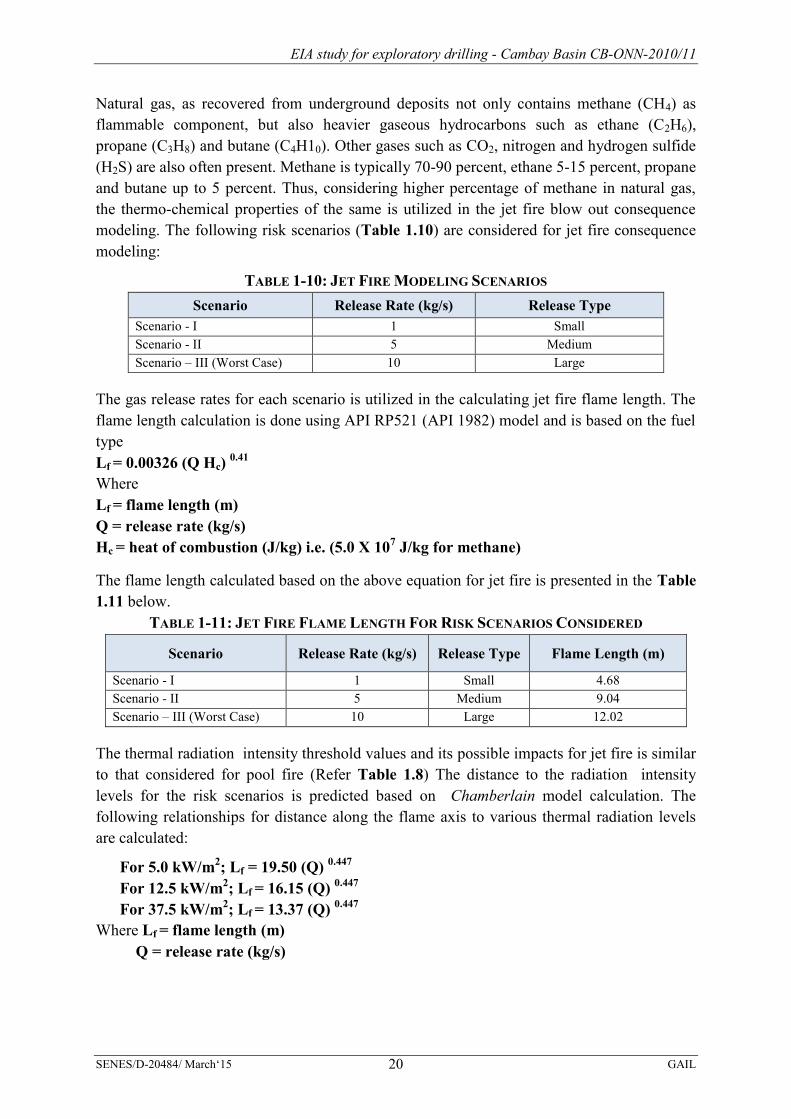
Natural gas, as recovered from underground deposits not only contains methane (CH4) as flammable component, but also heavier gaseous hydrocarbons such as ethane (C2H6), propane (C3H8) and butane (C4H10). Other gases such as CO2, nitrogen and hydrogen sulfide (H2S) are also often present. Methane is typically 70-90 percent, ethane 5-15 percent, propane and butane up to 5 percent. Thus, considering higher percentage of methane in natural gas, the thermo-chemical properties of the same is utilized in the jet fire blow out consequence modeling. The following risk scenarios (Table 1.10) are considered for jet fire consequence modeling:
TABLE 1-10: JET FIRE MODELING SCENARIOS Scenario Release Rate (kg/s) Release Type
Scenario - I 1 Small Scenario - II 5 Medium Scenario – III (Worst Case) 10 Large
The gas release rates for each scenario is utilized in the calculating jet fire flame length. The flame length calculation is done using API RP521 (API 1982) model and is based on the fuel type Lf = 0.00326 (Q Hc) 0.41
Where Lf = flame length (m) Q = release rate (kg/s) Hc = heat of combustion (J/kg) i.e. (5.0 X 10⁷ J/kg for methane)
The flame length calculated based on the above equation for jet fire is presented in the Table 1.11 below.
TABLE 1-11: JET FIRE FLAME LENGTH FOR RISK SCENARIOS CONSIDERED
Scenario Release Rate (kg/s) Release Type Flame Length (m)
Scenario - I 1 Small 4.68 Scenario - II 5 Medium 9.04 Scenario – III (Worst Case) 10 Large 12.02
The thermal radiation intensity threshold values and its possible impacts for jet fire is similar to that considered for pool fire (Refer Table 1.8) The distance to the radiation intensity levels for the risk scenarios is predicted based on Chamberlain model calculation. The following relationships for distance along the flame axis to various thermal radiation levels are calculated:
For 5.0 kW/m2; Lf = 19.50 (Q) 0.447 For 12.5 kW/m2; Lf = 16.15 (Q) 0.447 For 37.5 kW/m2; Lf = 13.37 (Q) 0.447
Where Lf = flame length (m) Q = release rate (kg/s)

EIA study for exploratory drilling - Cambay Basin CB-ONN-2010/11
SENES/D-20484/ March‘15 GAIL 21
Based on the equation specified for thermal radiation intensities, the distance of flame calculated for various gas release rates under the risk scenarios discussed are presented in the Table 1.12 below.
TABLE 1-12: JET FIRE HAZARD RANGES
Release Type
Release Rate (kg/s)
Distance to 5.0 kW/m2
(m)
Distance to 12.5 kW/m2
(m)
Distance to 37.5 kW/m2
(m) Small 1 19.5 16.2 13.4
Medium 5 40.0 33.2 27.5 Large 10 54.6 45.2 37.4
As provided in the above table, flame length for the jet fire risk scenarios considered at respective threshold radiation intensity values is likely to vary from
19.5 – 54.6m for 5.0 kW/m2 thermal radiation 16.2 – 45.2m for 12.5 kW/m2 thermal radiation 13.4 – 37.4m for 37.5 kW/m2 thermal radiation
The worst hazard for release and ignition of natural gas at a rate of 10kg/s for a thermal radiation intensity of 37.5 kW/m2 is likely to be experienced to a maximum distance of 37.4m from the source with potential lethal effects likely to be experienced within 8 secs. Risk Ranking – Blowout Jet Fire (Worst Case Scenario)
Likelihood ranking 3 Consequence ranking 4
Risk Ranking and Significance = 12 i.e. “Medium”
Oil Spill Crude oil spills resulting from blow out may result in the formation of unignited pools of liquid, the spreading of which is governed by physical factors viz. wind speed, sea currents (for offshore spills), release rates and spilled chemical characteristics viz. density. Near the source of a continuous release, the spreading is dominated by gravity and limited by internal forces with thickness, generally varying within 10-20mm. The spill movement is then resisted by the viscous shear forces which then continue until the spill thickness is about 1.0mm. Subsequently, surface tension takes over as the dominant spreading mechanism and it continues until thickness has reduced to 0.01 – 0.1mm which may take about 7-10 days for a large spill depending on various factors discussed earlier.
With respect to the QRA study, hypothetical release rates of 1.0kg/s, 5.0 kg/s and 10.0 kg/s for 1 day, 4days and 7days are considered as possible risk scenarios for modeling the spread of oil spill following a blow out incident. The diameter of the pool in the first phase of an unignited continuous release is obtained by the following equation:
D = 2 [g X Q/ρL 2π] t3/4
Where D = pool diameter (m) g = acceleration due to gravity (m/s2)

EIA study for exploratory drilling - Cambay Basin CB-ONN-2010/11
SENES/D-20484/ March‘15 GAIL 22
Q = release rate (kg/s) ρL = liquid density (kg/m3) (crude oil density is 790 kg/ m3) t = time since start of release (s) The pool fire diameter so calculated for the aforesaid risk scenarios are presented in the Table 1.13 below.
TABLE 1-13: POOL DIAMETER FOR OIL SPILL RISK SCENARIOS
Release Type Release Rate (kg/s) Release Time (s) Oil Spill Pool Diameter (m)
Small 1 86400 19.9 Medium 5 259200 226.9
Large 10 432000 665.7
Hence for a worst case spill scenario involving a crude oil release rate of 10kg/s for a period of 7 days the pool diameter for an un-ignited continuous release is predicted to be about 665.7 m. The ignition of oil pool may lead to formation of pool fires, consequences of which is discussed earlier under risk related to pool fires. Although unignited pool is not considered of major significance, it may gain significance based on the environmental impacts that may results from it depending on sensitive receptors identified abutting the proposed project of exploratory well sites. Risk Ranking – Blowout Oil Spills (Worst Case Scenario)
Likelihood ranking 3 Consequence ranking 3
Risk Ranking and Significance = 9 i.e. “Low” Preventive and Mitigation Measures Blowouts being events, catastrophic to well operation, is essential to take up a preventive measure that is feasible. This includes: Necessary active barriers (For eg. well-designed blowout preventors) be installed to
control or contain a potential blowout event. Weekly blow out drills be carried out to test reliability of BOP and preparedness of
drilling team. Close monitoring of drilling activity be done to check for signs of increasing pressure,
like shallow gas formations. Installation of hydrocarbon detectors. Periodic monitoring and preventive maintenance be undertaken for primary and
secondary barriers installed for blow out prevention, including third party inspection and testing
An appropriate Emergency Response Plan be formulated and implemented by GAIL. Marking of hazardous zone (500 meters) around the well site and monitoring of human
movements in the zone.
EIA study for exploratory drilling - Cambay Basin CB-ONN-2010/11
SENES/D-20484/ March‘15 GAIL 23
Training and capacity building exercises/programs be carried out for onsite drilling crew on potential risks associated with exploratory drilling and their possible mitigation measures.
Installation of mass communication and public address equipment. Good layout of well site and escape routes.
1.3.2 Process Leaks/Fires
Process leaks are defined as hydrocarbon releases from process equipments excluding blowouts and are relatively frequent events. In most cases, they are small in nature and can be effectively controlled. However, in its absence, they can trigger events like fire or explosions which may potentially have higher consequences.
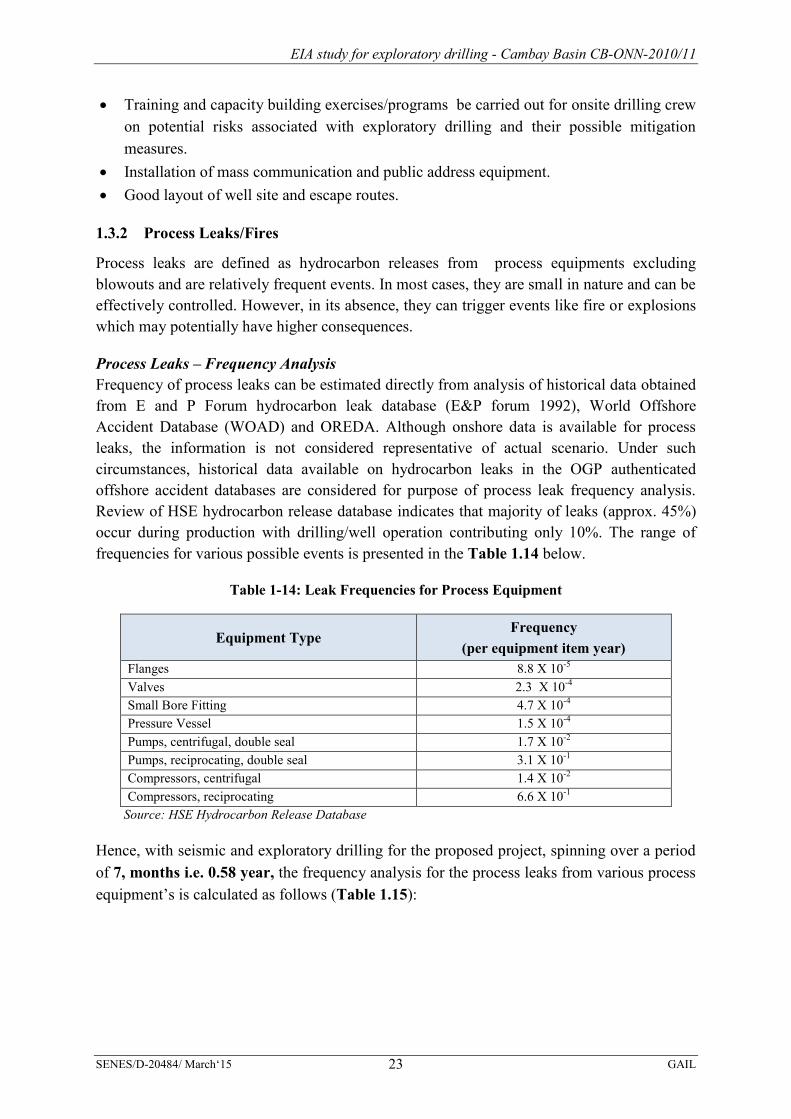
Process Leaks – Frequency Analysis Frequency of process leaks can be estimated directly from analysis of historical data obtained from E and P Forum hydrocarbon leak database (E&P forum 1992), World Offshore Accident Database (WOAD) and OREDA. Although onshore data is available for process leaks, the information is not considered representative of actual scenario. Under such circumstances, historical data available on hydrocarbon leaks in the OGP authenticated offshore accident databases are considered for purpose of process leak frequency analysis. Review of HSE hydrocarbon release database indicates that majority of leaks (approx. 45%) occur during production with drilling/well operation contributing only 10%. The range of frequencies for various possible events is presented in the Table 1.14 below.
Table 1-14: Leak Frequencies for Process Equipment
Equipment Type Frequency
(per equipment item year) Flanges 8.8 X 10⁻⁵ Valves 2.3 X 10⁻⁴ Small Bore Fitting 4.7 X 10⁻⁴ Pressure Vessel 1.5 X 10⁻⁴ Pumps, centrifugal, double seal 1.7 X 10⁻² Pumps, reciprocating, double seal 3.1 X 10⁻¹ Compressors, centrifugal 1.4 X 10⁻² Compressors, reciprocating 6.6 X 10⁻¹
Source: HSE Hydrocarbon Release Database
Hence, with seismic and exploratory drilling for the proposed project, spinning over a period of 7, months i.e. 0.58 year, the frequency analysis for the process leaks from various process equipment’s is calculated as follows (Table 1.15):

EIA study for exploratory drilling - Cambay Basin CB-ONN-2010/11
SENES/D-20484/ March‘15 GAIL 24
Table 1-15: Project Process Equipment’s Leak Frequencies
Equipment Type Frequency (A) (per item year)
Drilling Period (yrs) –(B)
Occurrence Frequency (A x B)
Frequency Class
Flanges 8.8 X 10⁻⁵ 0.97 8.54 X 10⁻⁵ Improbable
Valves 2.3 X 10⁻⁴ 0.97 2.23 X 10⁻⁴ Not Likely
Small Bore Fitting 4.7 X 10⁻⁴ 0.97 4.56 X 10⁻⁴ Not Likely
Pressure Vessel 1.5 X 10⁻⁴ 0.97 1.46 X 10⁻⁴ Not Likely Pumps, centrifugal, double seal 1.7 X 10⁻² 0.97 1.65 X 10⁻⁴ Not Likely Pumps, reciprocating, double seal 3.1 X 10⁻¹ 0.97 3.01 X 10⁻¹ Occasional/Rare Compressors, centrifugal 1.4 X 10⁻² 0.97 1.36 X 10⁻³ Not Likely Compressors, reciprocating 6.6 X 10⁻¹ 0.97 6.40 X 10⁻¹ Occasional/Rare
Thus, as discussed above in most of the cases, the frequency of occurrence of process leaks for the proposed project is either “Not Likely” or “Occasional/Rare” .Under the conditions of hydrocarbon releasing from reciprocating pumps, the compressor is predicted to be “Probable”. Furthermore, taking into account that GAIL plans to undertake periodic monitoring and preventive maintenance of such process equipment’s, it is anticipated that occurrence of such process leaks is likely to be less frequent.
Process Leaks – Consequence Analysis The potential consequences of a hydrocarbon leak from process equipment’s will depend, to a large extent, on steps that can be taken to control or mitigate its effect. There is considerable chance of a process leak might being ignited (either immediate or delayed) ,resulting in a fire or explosion. The following scenario can occur if a hydrocarbon leak is ignited:
Jet fires resulting from gas releases ignited early Pool fires and smoke plumes from ignited oil releases.
Evolution of a fire or explosion scenario, as a result of a process leak can follow a complex chain of events which can be studied in detail through a ‘fault tree’ or’ what-if ‘analysis. On one hand, fires or explosions resulting from ignition of hydrocarbon leaks can cause severe consequences, as and when it goes out of control. On the other hand it may damage equipment’s, including drilling rig itself.
The process leak consequences viz. jet fire and pool fire is likely to arise following ignition of the oil pool/vapour cloud formed. However, the same is dependent on ignition probabilities accounted in relevant databases maintaining records of accidental events occurring over the years with respect to oil and gas industry. Reviewing of SINTEF database

EIA study for exploratory drilling - Cambay Basin CB-ONN-2010/11
SENES/D-20484/ March‘15 GAIL 25
for major and minor process leaks indicates the following generic ignition probabilities (Table 1.16).
Table 1-16: Generic Ignition Probabilities
Release Rate Category Release Rate (kg/s) Gas Leak
Probability Oil Leak
Probability Minor <1 0.01 0.01 Major 1-50 0.07 0.03 Massive >50 0.30 0.08
Although reviewing records of OCS and Norwegian oil and gas installations indicates, ignition delay for process leaks, but also OCB/Technica (1988) reveals that for half the instances, ignition is delayed by about 5 minutes or more allowing escape of onsite crew and drilling personnel.
However, as similar consequences, viz. pool fire and jet fires are anticipated from process leaks, as in blow outs, identical risk scenarios are considered (in terms of oil and gas release rates) for leak consequence modeling based on professional judgment and analysis of process leak accident database. Hence, consequence modeling for process leaks/fires will be similar to that undertaken for exploratory well blow outs as discussed in the earlier section (Refer section 1.3.1).
Risk Ranking – Process Leak Pool fire and Jet fire (Worst Case Scenario)
Likelihood ranking 2 Consequence ranking 4
Risk Ranking and Significance = 8 i.e. “Low” Preventive and Mitigation Measures
Preventive and mitigation measures for process leaks, fires and explosions will be implemented with:
Provision of adequate leakage and fire detection alarm systems; Installation of firefighting equipment’s, both portable and fixed. Minimizing, (as far as practicable) potential sources of ignition like welding/hot works,
compressors, electrical equipment, compressors etc. Arrangement of proper ventilation for hazardous areas to allow inflammable gases to
dissipate, when a release has occurred; Proper mechanisms like ESDs which can isolate leaks effectively to be installed, in high
risk process trains. Effective barriers in form of blast walls, blast relief panels, etc. installed to shield
workers from high risk area where explosions may occur. Strict implementation of permits to work system and hazardous zone classification. Basic firefighting training to all working on the drilling rig. Installation of electrical equipment as per hazardous zone classification.

EIA study for exploratory drilling - Cambay Basin CB-ONN-2010/11
SENES/D-20484/ March‘15 GAIL 26
1.3.3 Non-process fires/explosions
Non-process fires are fires and explosions that involve materials other than hydrocarbons (e.g. electrical fires, diesel fires, accommodation fires, DG set fires, miscellaneous sources etc.). Most non-process fires are small incidents which can be managed within the facility using existing firefighting equipment’s. Such fires have, however, a higher frequency of occurrence compared to process fires and explosions as recorded by HSE database and World Offshore Accident Database (WOAD). Due to absence of veritable data source, recording non-process fire/explosion incidents for onshore installations, aforesaid databases for upstream oil and gas sector is referred in an effort to analyze non-process fire/explosion risks with respect to proposed onshore exploratory project.
Historically, few fatalities are reported from non-process fires and most of them are successfully managed at installation level. Based on WOAD 1996 statistical report, average fatality rate for non-process fires is estimated at 10-3 platform year. Again, these fatalities are already addressed under risks covered within the purview of personal accidents and need not be considered for fatalities due to non-process fires. However, as they have a higher probability to occur, such incidents may cause inconveniences and come in way of smooth operation of the drilling activities. The frequency of occurrence of fires due to possible non-process accident is listed in the Table 1.17 below:
TABLE 1-17: FREQUENCY OF OCCURRENCE - NON-PROCESS FIRES
Non-Process Accidents Frequency (per year)
Electrical fires 7.0 X 10⁻²
Diesel fires 9.2 X 10⁻³
Machinery fires 2.2 X 10⁻³
Miscellaneous fires 2.1 X 10⁻³ Source: WOAD As a result, though damage potential is low, it is important to take appropriate safeguarding measures to minimize their occurrence. Many of these measures are implemented through the stipulation of simple work instructions and procedures. Risk Ranking for Non-Process Fires
Likelihood ranking 3 Consequence ranking 1
Risk Ranking and Significance = 3 i.e. “Low” Preventive and Mitigation Measures Preventive and mitigation measures for small non-process fires will be implemented by delineating appropriate operational procedures through existing safety management system.