@RISK and Six-Sigma Guide
13
@RISK and Six-Sigma Guide This short guide is designed to give you a very brief introduction to Six Sigma, and an overview of the features that @RISK provides to aid your Six Sigma analyses. In today’s competitive business environment, quality is more important than ever. @RISK is the perfect companion for any Six Sigma or quality professional. Contents What is Six Sigma? ........................................................................................................................................ 2 The Importance of Variation ......................................................................................................................... 2 Six Sigma Methodologies .............................................................................................................................. 3 Six Sigma / DMAIC ..................................................................................................................................... 3 Design for Six Sigma (DFSS) ....................................................................................................................... 4 Lean or Lean Six Sigma .............................................................................................................................. 4 @RISK and Six Sigma ..................................................................................................................................... 5 @RISK and DMAIC ..................................................................................................................................... 5 @RISK and Design for Six Sigma (DFSS) .................................................................................................... 6 @RISK and Lean Six Sigma ........................................................................................................................ 6 Using @RISK for Six Sigma ............................................................................................................................ 7 RiskSixSigma Property Function ................................................................................................................ 7 Six Sigma Statistics Functions ................................................................................................................... 9 Six Sigma and the Results Summary Window ......................................................................................... 10 Six Sigma Markers on Graphs ................................................................................................................. 11 Six Sigma Example Models .......................................................................................................................... 13 Version 1 - Last Updated 4/17/2020
Transcript of @RISK and Six-Sigma Guide

@RISK and Six-Sigma Guide This short guide is designed to give you a very brief introduction to Six Sigma, and an overview
of the features that @RISK provides to aid your Six Sigma analyses.
In today’s competitive business environment, quality is more important than ever. @RISK is the
perfect companion for any Six Sigma or quality professional.
Contents
What is Six Sigma? ........................................................................................................................................ 2
The Importance of Variation ......................................................................................................................... 2
Six Sigma Methodologies .............................................................................................................................. 3
Six Sigma / DMAIC ..................................................................................................................................... 3
Design for Six Sigma (DFSS) ....................................................................................................................... 4
Lean or Lean Six Sigma .............................................................................................................................. 4
@RISK and Six Sigma ..................................................................................................................................... 5
@RISK and DMAIC ..................................................................................................................................... 5
@RISK and Design for Six Sigma (DFSS) .................................................................................................... 6
@RISK and Lean Six Sigma ........................................................................................................................ 6
Using @RISK for Six Sigma ............................................................................................................................ 7
RiskSixSigma Property Function ................................................................................................................ 7
Six Sigma Statistics Functions ................................................................................................................... 9
Six Sigma and the Results Summary Window ......................................................................................... 10
Six Sigma Markers on Graphs ................................................................................................................. 11
Six Sigma Example Models .......................................................................................................................... 13
Version 1 - Last Updated 4/17/2020

@RISK | Six Sigma Guide
2
What is Six Sigma?
Six Sigma is a set of practices to systematically improve processes by reducing process variation and
thereby eliminating defects. A defect is defined as nonconformity of a product or service to its
specifications. While the particulars of the methodology were originally formulated by Motorola in the
mid-1980s, Six Sigma was heavily inspired by six preceding decades of quality improvement
methodologies such as quality control, TQM, and Zero Defects. Like its predecessors, Six Sigma asserts
the following:
• Continuous efforts to reduce variation in process outputs is key to business success
• Manufacturing and business processes can be measured, analyzed, improved and controlled
• Succeeding at achieving sustained quality improvement requires commitment from the entire
organization, particularly from top-level management
Six Sigma is driven by data, and frequently refers to “X” and “Y” variables. X variables are independent
input variables that affect the dependent output variables, Y. Six Sigma focuses on identifying and
controlling variation in X variables to maximize quality and minimize variation in Y variables.
The term Six Sigma (or in symbols, 6σ) is very descriptive. The Greek letter sigma (σ) signifies standard
deviation, an important measure of variation. The variation of a process refers to how tightly all
outcomes are clustered around the mean. The probability of creating a defect can be estimated and
translated into a “Sigma level.” The higher the Sigma level, the better the performance. Six Sigma
refers to having six standard deviations between the average of the process center and the closest
specification limit or service level. That translates to fewer than 3.4 defects per one million
opportunities (DPMO).
The cost savings and quality improvements that have resulted from Six Sigma corporate
implementations are significant. Motorola has reported billions in savings since implementation in the
mid-1980s. Lockheed Martin, GE, Honeywell, and many others have also experienced tremendous
benefits from Six Sigma.
The Importance of Variation
Many Six Sigma practitioners rely on static models that don’t account for inherent uncertainty and
variability in their processes or designs. In the quest to maximize quality, it’s vital to consider as many
scenarios as possible.
That’s where @RISK comes in. @RISK uses Monte Carlo simulation to analyze thousands of different
possible outcomes, showing you the likelihood of each occurring. Uncertain factors are defined with
probability distribution functions that describe the possible range of values your inputs could
take. @RISK allows you to define Upper and Lower Specification Limits and Target values for each
output, and it includes a wide range of Six Sigma statistics and capability metrics on the outputs.

@RISK | Six Sigma Guide
3
@RISK Industrial edition also includes RISKOptimizer, which combines the power of Monte Carlo
simulation with genetic algorithm-based optimization. This gives you the ability to tackle optimization
problems that have inherent uncertainty, such as:
• Resource allocation to minimize cost
• Project selection to maximize profit
• Optimize process settings to maximize yield or minimize cost
• Optimize tolerance allocation to maximize quality
• Optimize staffing schedules to maximize service
Six Sigma Methodologies
@RISK can be used in a variety of Six Sigma and related analyses. The three principal areas of analysis
are:
• Six Sigma / DMAIC
• Design for Six Sigma (DFSS)
• Lean or Lean Six Sigma
Each of these is described in a little more detail below.
Six Sigma / DMAIC When most people refer to Six Sigma, they are in fact referring to the DMAIC methodology. The DMAIC
methodology should be used when a product or process is in existence but is not meeting customer
specification or is not performing adequately.
DMAIC focuses on evolutionary and continuous improvement in manufacturing and services processes,
and is almost universally defined as being comprised of five phases - Define, Measure, Analyze, Improve
and Control:
1. Define the project goals and customer (internal and external Voice of Customer or VOC)
requirements
2. Measure the process to determine current performance
3. Analyze and determine the root cause(s) of the defects
4. Improve the process by eliminating defect root causes
5. Control future process performance
@RISK | Six Sigma Guide
4
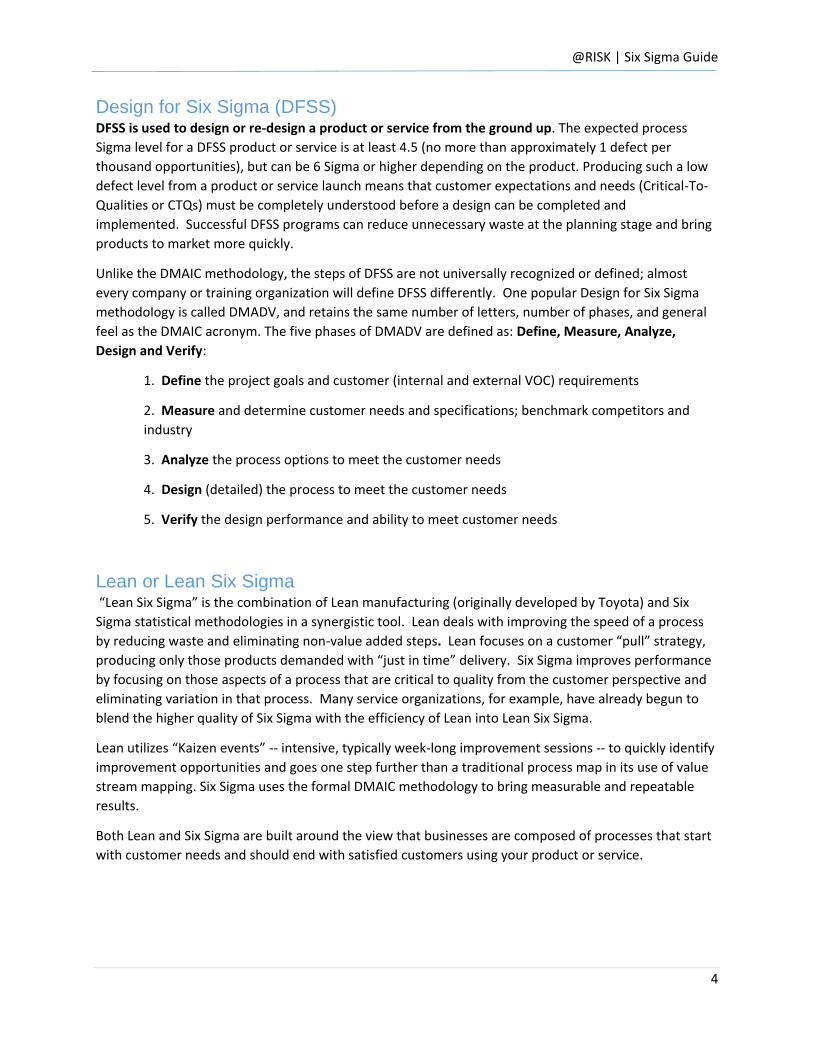
Design for Six Sigma (DFSS) DFSS is used to design or re-design a product or service from the ground up. The expected process
Sigma level for a DFSS product or service is at least 4.5 (no more than approximately 1 defect per
thousand opportunities), but can be 6 Sigma or higher depending on the product. Producing such a low
defect level from a product or service launch means that customer expectations and needs (Critical-To-
Qualities or CTQs) must be completely understood before a design can be completed and
implemented. Successful DFSS programs can reduce unnecessary waste at the planning stage and bring
products to market more quickly.
Unlike the DMAIC methodology, the steps of DFSS are not universally recognized or defined; almost
every company or training organization will define DFSS differently. One popular Design for Six Sigma
methodology is called DMADV, and retains the same number of letters, number of phases, and general
feel as the DMAIC acronym. The five phases of DMADV are defined as: Define, Measure, Analyze,
Design and Verify:
1. Define the project goals and customer (internal and external VOC) requirements
2. Measure and determine customer needs and specifications; benchmark competitors and
industry
3. Analyze the process options to meet the customer needs
4. Design (detailed) the process to meet the customer needs
5. Verify the design performance and ability to meet customer needs
Lean or Lean Six Sigma “Lean Six Sigma” is the combination of Lean manufacturing (originally developed by Toyota) and Six
Sigma statistical methodologies in a synergistic tool. Lean deals with improving the speed of a process
by reducing waste and eliminating non-value added steps. Lean focuses on a customer “pull” strategy,
producing only those products demanded with “just in time” delivery. Six Sigma improves performance
by focusing on those aspects of a process that are critical to quality from the customer perspective and
eliminating variation in that process. Many service organizations, for example, have already begun to
blend the higher quality of Six Sigma with the efficiency of Lean into Lean Six Sigma.
Lean utilizes “Kaizen events” -- intensive, typically week-long improvement sessions -- to quickly identify
improvement opportunities and goes one step further than a traditional process map in its use of value
stream mapping. Six Sigma uses the formal DMAIC methodology to bring measurable and repeatable
results.
Both Lean and Six Sigma are built around the view that businesses are composed of processes that start
with customer needs and should end with satisfied customers using your product or service.

@RISK | Six Sigma Guide
5
@RISK and Six Sigma
Whether it’s in DMIAC, DFSS, or Lean Six Sigma, uncertainty and variability lie at the core of any Six
Sigma analysis. @RISK uses Monte Carlo simulation to identify, measure, and root out the causes of
variability in your production and service processes. Each of the Six Sigma methodologies can benefit
from @RISK throughout the stages of analysis.
@RISK and DMAIC @RISK is useful at each stage of the DMAIC process to account for variation and hone in on problem
areas in existing products.
1. Define. Define your process improvement goals, incorporating customer demand and business
strategy. Value-stream mapping, cost estimation, and identification of CTQs (Critical-To-Qualities) are
all areas where @RISK can help narrow the focus and set goals. Sensitivity analysis in @RISK zooms in
on CTQs that affect your bottom-line profitability.
2. Measure. Measure current performance levels and their variations. Distribution fitting and over 35
probability distributions make defining performance variation accurate. Statistics from @RISK
simulations can provide data for comparison against requirements in the Analyze phase.
3. Analyze. Analyze to verify relationship and cause of defects, and attempt to ensure that all factors
have been considered. Through @RISK simulation, you can be sure all input factors have been
considered and all outcomes presented. You can pinpoint the causes of variability and risk with
sensitivity and scenario analysis, and analyze tolerance. Use @RISK’s Six Sigma statistics functions to
calculate capability metrics which identify gaps between measurements and requirements. Here we see
how often products or processes fail and get a sense of reliability.
4. Improve. Improve or optimize the process based upon the analysis using techniques like Design of
Experiments. Design of Experiments includes the design of all information-gathering exercises where
variation is present, whether under the full control of the experimenter or not. Using @RISK simulation,
you can test different alternative designs and process changes. @RISK is also used for reliability analysis
and – using RISKOptimizer - resource optimization at this stage.
5. Control. Control to ensure that any variances are corrected before they result in defects. In the
Control stage, you can set up pilot runs to establish process capability, transition to production and
thereafter continuously measure the process and institute control mechanisms. @RISK automatically
calculates process capability and validates models to make sure that quality standards and customer
demands are met.

@RISK | Six Sigma Guide
6
@RISK and Design for Six Sigma (DFSS) One of @RISK’s main uses in Six Sigma is with DFSS at the planning stage of a new project. Testing
different processes on physical manufacturing or service models or prototypes can be cost prohibitive.
@RISK allows engineers to simulate thousands of different outcomes on models without the cost and
time associated with physical simulation. @RISK is helpful at each stage of a DFSS implementation in
the same way as the DMAIC steps. Using @RISK for DFSS gives engineers the following benefits:
• Experiment with different designs / Design of Experiments
• Identify CTQs
• Predict process capability
• Reveal product design constraints
• Cost estimation
• Project selection – using RISKOptimizer to find the optimal portfolio
• Statistical tolerance analysis
• Resource allocation – using RISKOptimizer to maximize efficiency
@RISK and Lean Six Sigma @RISK is the perfect companion for the synergy of Lean manufacturing and Six Sigma. “Quality only” Six
Sigma models may fail when applied to reducing variation in a single process step, or to processes which
do not add value to the customer. For example, an extra inspection during the manufacturing process
to catch defective units may be recommended by a Six Sigma analysis. The waste of processing
defective units is eliminated, but at the expense of adding inspection which is itself waste. In a Lean Six
Sigma analysis, @RISK identifies the causes of these failures. Furthermore, @RISK can account for
uncertainty in both quality (ppm) and speed (cycle time) metrics.
@RISK provides the following benefits in Lean Six Sigma analysis:
• Project selection – using RISKOptimizer to find the optimal portfolio
• Value stream mapping
• Identification of CTQs that drive variation
• Process optimization
• Uncover and reduce wasteful process steps
• Inventory optimization – using RISKOptimizer to minimize costs
• Resource allocation – using RISKOptimizer to maximize efficiency

@RISK | Six Sigma Guide
7
Using @RISK for Six Sigma
@RISK’s standard simulation capabilities have been enhanced for use in Six Sigma modeling through the
addition of four key features. These are:
1. The RiskSixSigma property function for entering specification limits and target values for
simulation outputs.
2. Six Sigma statistics functions, including process capability indices such as RiskCpk, RiskCpm
and others which return Six Sigma statistics on simulation results directly in spreadsheet cells.
3. Columns in the Results Summary window that provide Six Sigma statistics on simulation
results in table form.
4. Markers on graphs of simulation results that display specification limits and the target value.
The standard features of @RISK, such as entering distribution functions, fitting distributions to data,
running simulations and performing sensitivity analyses, are also applicable to Six Sigma models.
RiskSixSigma Property Function In an @RISK simulation the RiskOutput function identifies a cell in a spreadsheet as a simulation
output. A distribution of possible outcomes is generated for every output cell selected. These
probability distributions are created by collecting the values calculated for a cell for each iteration of a
simulation.
When Six Sigma statistics are to be calculated for an output, the RiskSixSigma property function should
be entered as an argument to the RiskOutput function. This property function specifies the lower
specification limit, upper specification limit, target value, long term shift, and the number of standard
deviations for the Six Sigma calculations for an output. These values are used in calculating Six Sigma
statistics displayed in the Results window and on graphs for the output. For example:
=RiskOutput(“Part Height”,,RiskSixSigma(0.88,0.95,0.915,1.5,6))
specifies an LSL of 0.88, a USL of 0.95, target value of 0.915, long term shift of 1.5, and a number of
standard deviations of 6 for the output Part Height. You can also use cell referencing in the RiskSixSigma
property function.
These values are used in calculating Six Sigma statistics displayed in the Results window and as markers
on graphs for the output.
When @RISK detects a RiskSixSigma property function in an output, it automatically displays the
available Six Sigma statistics on the simulation results for the output in the Results Summary window
and adds markers for the entered LSL, USL and Target values to graphs of simulation results for the
output.
You can type the RiskOutput function, together with the RiskSixSigma function, directly into the cell’s
formula, or you can have @RISK help you do this using the user interface.

@RISK | Six Sigma Guide
8
From the Add Output dialog, click the Settings/Actions button at the bottom of the window and select
‘Show Advanced Properties’:
The Six Sigma tab of the dialog contains fields for configuring all the options:
Clicking the OK button will add the RiskOutput function, together with the RiskSixSigma function, to the
cell’s formula.
The options available in the Six Sigma tab are:
Calculate Capability Metrics for This Output - Specifies that capability metrics will be calculated and
displayed in reports and graphs for the output. These metrics will use the entered LSL, USL and Target
values.
LSL, USL and Target - Sets the LSL (Lower Specification Limit), USL (Upper Specification Limit) and Target
values for the output.
Use Long Term Shift and Shift - Specifies an optional shift for calculation of long-term capability metrics.

@RISK | Six Sigma Guide
9
Upper/Lower X Bound - The number of standard deviations to the right or the left of the mean for
calculating the upper or lower X-axis values.
Six Sigma Statistics Functions @RISK includes a set of Six Sigma statistics functions which can be entered directly into a spreadsheet
model to perform Six Sigma calculations. For example, consider the simple model shown below:
Cell C15 contains a RiskOutput function with a RiskSixSigma property function:
=RiskOutput(C14,,,RiskSixSigma(C4,C5,C6,0,6)) +RiskNormal(C10,C11)
The green cells in column C contain the following Six Sigma statistics functions:
=RiskCpk(C15)
=RiskPNC(C15)
=RiskDPM(C15)
These statistics functions, like other @RISK statistics functions, show relevant results only after a
simulation has been run. They rely on the parameter values (LSL, USL, and so on) in the RiskSixSigma
property function in cell C15 for their values.
Note also in this screenshot how the graph of the output in C15 shows the LSL, Target, and USL as
markers. These markers also rely on information provided by the RiskSixSigma property function in cell
C15.
@RISK | Six Sigma Guide
10
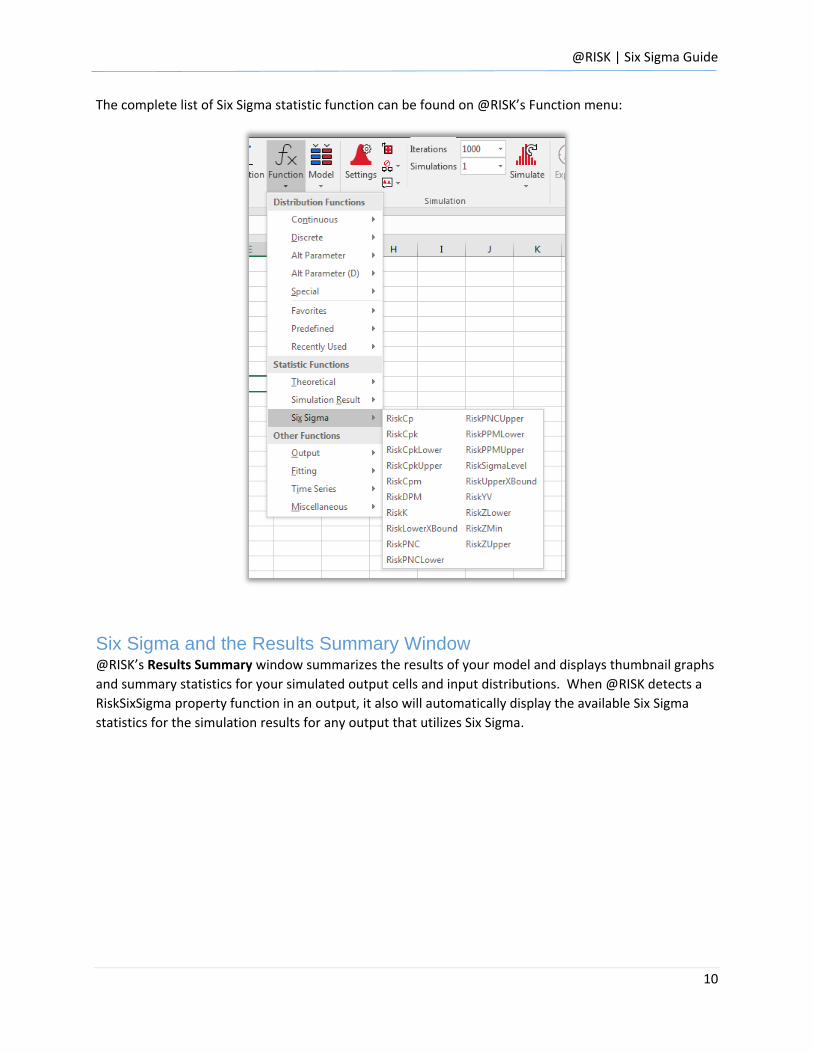
The complete list of Six Sigma statistic function can be found on @RISK’s Function menu:
Six Sigma and the Results Summary Window @RISK’s Results Summary window summarizes the results of your model and displays thumbnail graphs
and summary statistics for your simulated output cells and input distributions. When @RISK detects a
RiskSixSigma property function in an output, it also will automatically display the available Six Sigma
statistics for the simulation results for any output that utilizes Six Sigma.

@RISK | Six Sigma Guide
11
This table can be exported to Excel, the printer, or a PDF file by clicking the Export button in the bottom
right corner of the window.
Clicking the Table Settings item from the Settings/Actions menu displays a dialog from which you can
customize which statistics to display in the window:
Six Sigma Markers on Graphs When @RISK detects a RiskSixSigma property function in an output, it adds markers for the LSL, USL and
Target values to graphs of simulation results for the output. It also adds Six Sigma statistics to the
statistics grid to the right of the graph.

@RISK | Six Sigma Guide
12
You can configure the display of both the markers and the grid from by choosing the Graph Formatting
Options item on the Settings/Action menu.

@RISK | Six Sigma Guide
13
Six Sigma Example Models
A number of examples models that demonstrate the use of Six Sigma can be found on Palisade’s
website. Please visit https://www.palisade.com/models/ and search for Six Sigma (results pictured
below).