Risk and Capital Management 2020
89
Landsbankinn hf. Pillar III risk report 31.12.2020 LANDSBANKINN HF. | KT. 471008-0280 | LANDSBANKINN.IS Risk and Capital Management 2020
Transcript of Risk and Capital Management 2020

Landsbankinn hf. Pillar III risk report 31.12.2020
LANDSBANKINN HF. | KT. 471008-0280 | LANDSBANKINN.IS
Risk and Capital Management 2020

Landsbankinn hf. in brief
Landsbankinn hf. was founded on 7 October 2008 by the Ministry of Finance on behalf of the Icelandic State
Treasury. The Bank is a limited liability company incorporated and domiciled in Iceland. The Bank is licensed
as a commercial bank and operates in accordance with Act No. 161/2002, on Financial Undertakings. The
Bank is subject to supervision by the Financial Supervisory Authority of the Central Bank of Iceland (FSA) in
accordance with Act No. 87/1998, on Official Supervision of Financial Activities.
Landsbankinn hf. is the largest financial services company in Iceland and provides reliable universal services
based on long-standing business relationships to individuals, corporates and investors throughout Iceland.
The National Treasury of Iceland holds 98.2% of shares in the Bank. The Bank itself owns 1.6% of shares and
other shareholders own 0.2% of shares in the Bank.
1 Risk and Capital Management 2020

Contents
1 2020 Highlights and Outlook . . . . . . . . . . . . . . . . . . . . . . . . . . . . . . . . . . . . . 3
2 Risk management . . . . . . . . . . . . . . . . . . . . . . . . . . . . . . . . . . . . . . . . . . . 8
3 Capital management . . . . . . . . . . . . . . . . . . . . . . . . . . . . . . . . . . . . . . . . . 19
4 Credit risk . . . . . . . . . . . . . . . . . . . . . . . . . . . . . . . . . . . . . . . . . . . . . . . . 32
5 Market risk . . . . . . . . . . . . . . . . . . . . . . . . . . . . . . . . . . . . . . . . . . . . . . . 55
6 Liquidity risk . . . . . . . . . . . . . . . . . . . . . . . . . . . . . . . . . . . . . . . . . . . . . . 61
7 Operational risk . . . . . . . . . . . . . . . . . . . . . . . . . . . . . . . . . . . . . . . . . . . . 70
8 Regulatory developments . . . . . . . . . . . . . . . . . . . . . . . . . . . . . . . . . . . . . . . 76
9 Remuneration report . . . . . . . . . . . . . . . . . . . . . . . . . . . . . . . . . . . . . . . . . 82
10 Disclosure policy . . . . . . . . . . . . . . . . . . . . . . . . . . . . . . . . . . . . . . . . . . . . 85
The disclosures have solely been comprised to explain the basis of preparation and disclosure of certain capital
requirements and provide information about the management of certain risks. They do not constitute any form
of audited financial statement. They should not be relied upon in making judgements about the Bank. The
disclosures will only be subject to external verification to the extent that they are equivalent to those made
under accounting requirements.
In the interest of simplifying text, Landsbankinn Group, which consists of the parent entity, Landsbankinn, and
its subsidiaries, is referred to as the ‘Bank’ in the disclosures. Where necessary, a distinction is made in the
report between the group and the parent entity. For further information, see Note No. 89.1 – Consolidation in
the Bank’s Consolidated Financial Statements for 2020.
This publication, Risk and Capital Management 2020, has not been audited by external auditors. However, it
includes information from the audited Consolidated Financial Statements 2020 and has been verified internally
and approved by the Board of Directors. There may be some discrepancies between this report and financial
information in the Consolidated Financial Statements 2020, as the report has been prepared for the purpose
of Article 18 of Act No. 161/2002, on Financial Undertakings, cf. Article 11 of Act No. 96/2016, and the
provisions of Directive 36/2013/EU of the European Parliament and of the Council of 26 June 2013 (CRD IV)
and Regulation (EU) No. 575/2013 of the European Parliament and of the Council of 26 June 2013 (CRR)
incorporating the Basel Pillar III disclosure requirements, rather than in accordance with IFRS.
Additional Pillar III disclosures required under CRR can be downloaded from https://corporate.landsbankinn.
com/en/the-bank/investor-relations/reports-and-financials
2 Risk and Capital Management 2020

1 2020 Highlights and OutlookIn 2020, the Bank experienced an increase in all
significant risk areas. In March 2020, when the first
wave of Covid-19 hit, both credit risk and market risk
increased within a very short time due to the uncer-
tainty and fluctuations that followed. At the same
time, the Bank had to relocate the workstations of
the majority of employees due to health concerns
relating to the pandemic, thus raising operational
risk. Those events, along with the Covid-19 related
relief measures for the Bank’s borrowers, put the
Bank’s crisis management to a significant test for
the first half of the year. The Bank managed to
function at near-normal levels despite a closing of
branches and a dispersed workforce.
The Central Bank of Iceland (CBI) embarked on a
rapid rate cut during the year in response to the
pandemic and banks followed suite, reducing their
deposit and lending rates. This in turn sparked
increased demand for non-indexed mortgages with
variable interest rates and a search for yield amongst
individuals and investors.
The Bank’s overall risk position increased in 2020
mainly due to increased credit risk. General morato-
ria and subsequent further measures have, although
necessary, increased uncertainty in the Bank’s loan
portfolio. This was met with increased provision-
ing and manual credit rating changes for corporate
customers, mainly in the travel industry and with
borrowers in payment difficulties.
Market conditions lead to fluctuations in market risk
in 2020. Market risk decreased towards the end of
2020 and was well within risk appetite at the end
of year. Liquidity ratios remained strong and above
the Bank’s risk appetite over the course of the year.
1.1 Capital position
The Bank’s total capital ratio remained strong in
2020, ending in 25.1%, decreasing slightly from 2019.
The uncertainty resulting from the pandemic caused
the minimum requirement set by the CBI through the
Supervisory Review and Evaluation Process (SREP)
to remain unchanged between 2019 and 2020 at
11.4%. The Bank’s minimum capital requirement,
as determined by the FSA, is the sum of Pillar I and
Pillar II-R requirements. Due to a reduction in the
countercyclical capital buffer, from 1.7% to 0%, the
combined buffer requirement decreased from 9.07%
to 7.38%, resulting in a total capital requirement
of 18.8%. The Bank did not pay dividends in 2020
following guidance from the CBI.
Risk exposure amount (REA) increased by ISK 101
billion, or 9.8%, in 2020. Two notable changes were
made to calculation of REA to accommodate reg-
ulatory changes and changes in the use of credit
mitigation. The Bank’s equity increased by ISK 10.5
billion between 2019 and 2020.
The Bank measures internal capital requirements
by economic capital (EC) for all material risks with
regard to risk-weighted assets. The internal assess-
ment of EC increased in 2020, driven mostly by rising
credit risk, to ISK 110 billion at year end. The ratio
to REA increased by 0.2 percentage points to 9.8%.
1.2 Credit risk
The carrying amount of the Bank’s loan portfolio to
customers grew by 12% in 2020. As in 2019, the
increase was primarily driven by increased residen-
tial mortgage lending to individuals. Demand for
non-indexed mortgages increased in 2020 from the
previous year, mainly due to decreasing interest rates
and favourable refinancing costs. The credit quality
of the mortgage portfolio remained high with an
average PD of 1.3% and a slight increase in average
loan-to-value to 57.7%. The share of non-indexed
mortgages in the portfolio continued to increase from
42.0% in 2019 to 61.0% in 2020.
The Bank’s corporate portfolio grew by 1.3% in 2020,
with low growth largely attributable to uncertainty
3 Risk and Capital Management 2020

in the economy and granting of moratoria measures.
Credit risk increased as measured by probability of
default (PD), rising from 2.9% to 4.1% between
2019 and 2020, primarily due to a downgrade in the
rating grades of corporates in the travel industry ex-
periencing financial difficulties during the pandemic.
A total of 4 exposures are classified as large expo-
sures at year-end 2020 as opposed to 5 at year-end
2019.
Credit risk of the total loan portfolio increased in
2020, with general moratoria granted to customers
and higher PD in the corporate portfolio for certain
sectors, most notably the travel industry. Credit risk
slightly exceeded the Bank’s risk appetite and un-
certainties remain while current economic conditions
persist and parts of the portfolio remain in moratoria.
EC for credit risk for other assets increased, driven
by increased exposure and a higher risk weight for
equities in the banking book.
1.3 Market risk
The Bank’s market risk increased in 2020 due to
severe fluctuations in equity markets. Despite this,
market risk was well within the Bank’s risk appetite
for 2020 and remains modest. Market risk to REA
decreased by 0.2 percentage points from year-end
2019 to year-end 2020 and the Bank’s exposure in
the trading portfolio remained largely unchanged.
However, the Bank’s net FX balance increased by
ISK 1 billion in 2020, remaining well within the
Bank’s risk appetite. The Bank’s CPI imbalance de-
creased even further in 2020 with increased borrow-
ing compounded by decreased lending in CPI-linked
mortgages and refinancing. The imbalance was 26%
of equity at year-end 2020, compared to 52% at
year-end 2019, a record low for the Bank.
1.4 Liquidity risk and funding
Liquidity risk is a current risk factor which remained
relatively stable over the year despite the pandemic
and market fluctuations. The Central Bank of Ice-
land took action in response to the pandemic, further
strengthening the Bank’s access to liquidity if needed.
The Bank’s total LCR at year-end was 154%, LCR
ISK was 105% and 424% in foreign currencies, well
above regulatory limits and the Bank’s risk appetite.
The Bank’s net stable funding ratio in foreign cur-
rencies is strong at 132% and total NSFR was 116%
at year end.
The largest part of the Bank’s funding continues to
be in the form of deposits from customers, which
increased by 86 billion in 2020 and amounted to ISK
793 billion at year end. The Bank was an active
issuer on the domestic bond market in 2020 with
issuance of covered bonds in the domestic market
and issuance of bonds in foreign currencies under its
EMTN programme. At year-end 2020, bond issuance
in foreign currencies amounted to ISK 227 billion,
increasing by ISK 4 billion during the year. The
size of the programme for covered bond issuance at
year-end was ISK 250 billion and was increased from
ISK 200 billion in 2020. Regular auctions of covered
bonds were held in 2020, tapping previously issued
bonds and issuing two new bond series. At year end,
outstanding covered bonds issuance amounted to
ISK 189 billion, increasing by ISK 49 billion during
the year 2020.
In April 2020, the Bank’s credit rating was lowered
by one notch, to BBB/A-2 with stable outlook. The
downgrade was triggered by S&P’s assessment of
industry risk with regard to a reduction in economic
activity due to the Covid-19 pandemic. The stable
outlook of the Bank’s credit rating was based on
S&P’s expectation that the Bank will withstand the
consequences of the economic recession by maintain-
ing solid capital positions and comfortable funding
and liquidity profiles.
1.5 Operational risk
The Bank’s operational risk increased significantly in
2020. Two of the Bank’s most important pandemic
crisis plans were put to the test and operations and
services showed resilience and remained stable. The
Bank’s response to the pandemic was successful in
part due to the focus on straight-through processing
and customer self-service, as well as data storing and
processing, which has been at the forefront in the
4 Risk and Capital Management 2020

Bank’s strategy since 2017.
It was expected that such large-scale relocation of
staff and segregation of employees in those units
required to work on-site would lead to a significant
increase in operational and loss incidents. This risk
did not materialise, with only a few recorded inci-
dents linked to the pandemic response.
ICT risk and third-party risk management remains a
significant focus point for the Bank because of its re-
liance on third-party providers of software solutions.
For the Bank’s customers, fraud and cybercrime re-
main a growing risk. The Bank continues to place
strong emphasis on reducing the likelihood of cus-
tomers falling prey to such criminal activity, employ-
ing customer outreach and other measures.
The Bank suffered no major operational incidents in
2020 and most incidents that did occur were caused
by weaknesses in processes or systems.
The Bank has increased its prudence regarding fraud
and money-laundering because of the Covid-19 pan-
demic. Customer behaviour has changed, altering
the use of cash and digital solutions. Necessary
changes to the Bank’s operation during the pan-
demic have lead to heightened awareness of conduct
risk. No loss events or signs of increased customer
misconduct in the Bank’s systems can be attributed
to the pandemic to date.
1.6 Economic outlook
Landsbankinn Economic Research forecasts an 8.5%
contraction in domestic product in 2020 as a result
of Covid-19. There is still a great deal of uncertainty
about the economic outlook, but it now appears that
the pandemic will hamper economic growth well into
2021. At this point, Economic Research does not
expect the economy to begin its recovery until fall
2021 yet growth is nevertheless expected to be posi-
tive by 3.4% in 2021. Robust growth is expected in
2022 and 2023, or 5% each year, alongside a speedy
recovery of the travel industry. Unemployment lev-
els have risen considerably, averaging 5.5% in 2020.
Unemployment is expected to rise to 8.4% in 2021
before coming down to 5.8% in 2022.
Inflation averaged 2.8% in 2020. It rose to 4.3% in
January 2021, well above the inflation target of 2.5%.
Inflation is expected to recede in coming months as
the effects of last year’s ISK depreciation dwindle
and to trend towards target levels in the second half
of the year.
5 Risk and Capital Management 2020

Risk metrics overview
. . . . . . . . . . . . . . . . . . . . . . . . . . . . . . . . . . . . . . . . . . . .
Risk exposure
amount837 924 1,001 1,020 1,122
2016 2017 2018 2019 2020
1,122
ISK bn
. . . . . . . . . . . . . . . . . . . . . . . . . . . . . . . . . . . . . . . . . . . .
REA to total
assets75% 77% 75% 72% 72%
2016 2017 2018 2019 2020
72%
. . . . . . . . . . . . . . . . . . . . . . . . . . . . . . . . . . . . . . . . . . . .
Total capital
ratio
30.2%26.7% 24.9% 25.8% 25.1%
2016 2017 2018 2019 2020
25.1%
. . . . . . . . . . . . . . . . . . . . . . . . . . . . . . . . . . . . . . . . . . . .
Loans and
advances to
customers853 926 1,065 1,140 1,273
2016 2017 2018 2019 2020
1,273
ISK bn
. . . . . . . . . . . . . . . . . . . . . . . . . . . . . . . . . . . . . . . . . . . .
6 Risk and Capital Management 2020

. . . . . . . . . . . . . . . . . . . . . . . . . . . . . . . . . . . . . . . . . . . .
Large
exposures to
eligible capital 20% 22%
34% 38% 40%
2016 2017 2018 2019 2020
40%
. . . . . . . . . . . . . . . . . . . . . . . . . . . . . . . . . . . . . . . . . . . .
Economic
capital99 99 100 98 110
2016 2017 2018 2019 2020
110
ISK bn
. . . . . . . . . . . . . . . . . . . . . . . . . . . . . . . . . . . . . . . . . . . .
Stage 3 loans∗ 1.5%**
0.9%** 0.8%** 0.8%** 0.8%**
2.4%
2.0% 2.0% 2.1% 2.0%
2016 2017 2018 2019 2020
2.0%
. . . . . . . . . . . . . . . . . . . . . . . . . . . . . . . . . . . . . . . . . . . .
Liquidity
coverage ratio
total
128%157% 158% 161% 154%
2016 2017 2018 2019 2020
154%
. . . . . . . . . . . . . . . . . . . . . . . . . . . . . . . . . . . . . . . . . . . .∗ Staging of loans was implemented in 2018. For 2016-2017, defaulted and impaired loans are used as a proxy for stage 3.∗∗ Of which 90 days past due.
7 Risk and Capital Management 2020

2 Risk management
2.1 Risk appetite . . . . . . . . . . . . 9
2.2 Risk identification . . . . . . . . . 10
2.3 Risk management structure . . . . 10
2.4 Risk measurement . . . . . . . . . 14
2.5 Risk monitoring . . . . . . . . . . 17

Risk Management
The Board of Directors has reviewed the adequacy
of the Bank’s risk management arrangements, pro-
viding assurance that the risk management systems
put in place are adequate with regard to the Bank’s
profile and strategy, in accordance with Article 435
of CRR.
Risk is inherent in the Bank’s activities. It is man-
aged through a process of on-going identification,
measurement, management and monitoring, subject
to risk limits and other controls. Risk identification
involves finding the origins and structures of possible
risk factors in the Bank’s operations and undertak-
ings. Risk measurement entails measuring identified
risk for management and monitoring purposes. Fi-
nally, risk controls and limits promote compliance
with rules and procedures, as well as adherence with
the Bank’s risk appetite.
The objective of the Bank’s risk policies and pro-
cedures is to ensure that the risks in its operations
are detected, measured, monitored and effectively
managed. Exposure to risk is managed to ensure
that it remains within limits and that the risk ap-
petite adopted by the Bank complies with regulatory
requirements. To limit and manage fluctuations that
might affect the Bank’s equity, liquidity and perfor-
mance, the Bank has adopted policies regarding the
risk structure of its asset portfolio, which are covered
in more detail under each risk type.
Risk policy is implemented through risk appetite,
goal setting, business strategy, internal policies and
limits that comply with the regulatory framework of
the financial markets.
2.1 Risk appetite
The Bank’s risk appetite for 2021 has been reviewed,
revised and implemented. Section 2.4 lists the risk
appetite metrics, targets for the present year and
year-end values for the past three years. The Bank’s
risk policy is as follows:
The Bank’s operations, risk diversification and de-
cisions shall always be in accordance with its risk
appetite, sound business practices, financing, liquid-
ity and equity position. The Bank seeks to ensure
diversified and sound financing and a sustainable risk
profile in its balance sheet. The Bank has set internal
limits with the aim of maintaining a strong capital
and liquidity position which, along with active risk
management, are important to achieve long-term
profitability and strong standing. In this manner, the
Bank aims to minimise fluctuation in its operations
and is well positioned to withstand stress scenarios.
Risk appetite defines the type and extent of risk
that management is willing to take to meet the
Bank’s business objectives. The Bank has set itself
objectives regarding financial position, asset quality,
exposures and sustainable long-term profitability. In
pursuit of its goals, the Bank only takes on risks
that it understands, and can measure, evaluate and
manage.
The Bank seeks to maintain solid business relation-
ships, having regard for its own position as well as
that of its customers at all times, and with due re-
gard to any internal connections between customers.
The Bank pursues long-term business relationships
and aims to minimise and contain reputational risk.
The Bank has set a policy on corporate social respon-
sibility that integrates economic, social and environ-
mental factors in its operations. The policy aims to
promote sustainability in Iceland, to ensure that the
Bank is a dynamic force in the community and that
it operates in accordance with the principles of good
corporate governance.
The Bank is obligated to comply with relevant laws
and regulations in all its operations. The main focus
areas within the Bank’s risk culture are adherence
to rules, integrity, ethical behaviour, professionalism
and the promotion of good risk culture by all senior
management.
9 Risk and Capital Management 2020

Figure 2.1: Risk policy structure
2.2 Risk identification
The Bank is exposed to the following material risks
that arise from financial instruments:
] Credit risk
] Market risk
� Currency risk
� Interest rate risk
� Other market risk
] Liquidity risk
] Operational risk
Table 2.1 provides a link between the Bank’s business
units and the material risks that they are exposed to.
The risk significance is assessed within the context
of the Bank as a whole and is measured based on
allocation of economic capital (EC) within the Bank.
The Bank also manages other relevant risks, includ-
ing, but not limited to, concentration risk, business
risk, legal risk, reputational risk, conduct risk, com-
pliance risk, data risk and modelling risk.
2.3 Risk management structure
The Bank aims to operate in line with international
best practice and guidelines on risk management.
The Bank devotes substantial resources to develop-
ing and maintaining its risk management systems
and operations.
The Bank’s risk management is based on guidelines,
policies and instructions determined by the Board of
Directors. The Bank has prepared specific instruc-
tions on risk management for individual business
units based on the general policies set by the Board
of Directors. At the unit level, these instructions are
used, among other things, as the basis for business
and control procedures.
2.3.1 Risk committees
The Bank’s risk management governance structure
at year-end 2020 is shown in Tables 2.2 and 2.3.
Effective sub-committees provide important prepa-
ration for Board meetings. The establishment of
Table 2.1: Material risks exposed by the Bank’s business units
Material risk Personal Banking CorporateBanking
Markets Treasury
Credit risk High High Low Low
Operational risk Medium Medium High Medium
Market risk Low Low Medium High
Liquidity risk n/a n/a n/a High
10 Risk and Capital Management 2020

Table 2.2: Key risk management bodies and committees
Committee Chair Other members
Executive Board CEO Managing Directors
Risk & Finance Committee CEO CFO, CRO, Head of Legal Department
Credit Committee CEO CRO, MD of Corporate Banking
Operational Risk Committee CRO MD of Personal Banking, MD of IT, ChiefCompliance Officer, Senior Director of Operation,Director of Operational Risk
Project Committee CEO Managing Directors
sub-committees is designed to facilitate discussion
and deeper analysis of issues for the Board’s atten-
tion and its efficacy.
The Board assesses its need for sub-committees at
the Board level, according to legal requirements and
the size and scope of the Bank at each time, as well
as the composition of the Board. The Bank’s cor-
porate governance statement is required to provide
information on the establishment and appointment
of sub-committees. There are currently four sub-
committees of the Board of Directors.
The Audit Committee’s role is to ensure the quality
of the Bank’s financial statements and other finan-
cial information, as well as the independence of its
auditors. The Committee’s function is, among other
things, to supervise accounting procedures. The
Committee also monitors the organisation and func-
tion of internal auditing. Moreover, the Committee
supervises auditing of the Bank’s financial and con-
solidated statements and assesses the independence
of the Bank’s external auditors. It also supervises
other tasks performed by external auditors and sub-
mits proposals to the Board of Directors for the
selection of external auditors.
The Risk Committee serves as a consulting entity
to the Board of Directors in the development of the
Bank’s risk strategy and risk appetite. The Com-
mittee also advises the Board on the Bank’s risk
culture and on the organisation and effectuation of
the Bank’s risk policy, as well as reviewing the Bank’s
policy as set forth in risk rules. The Committee as-
sesses the Bank’s risk management framework on an
annual basis, concerning all significant risk factors
and reviews reports from internal control functions
on internal control factors that relate to risk man-
agement. The Committee also reviews policies on
capital management and funding, ICAAP/ILAAP
reports, the results of stress tests, credit decision
issues, the status of the Bank’s loan portfolio, pro-
cedures for impairment calculations, the activities of
Compliance and other types of risks as and where
applicable.
Table 2.3: Sub-committees of the Board of Directors
Supervision by the Board of Directors and
its sub-committees
Audit Committee
Remuneration Committee
Risk Committee
Strategic Development Committee
The Remuneration Committee reports annually to
the Board of Directors. The Committee guides the
Board of Directors and the CEO on remuneration
policy and monitors the implementation of that pol-
icy after it has been approved. For further details
on the Bank’s remuneration policy, see Chapter 9.
The Strategic Development Committee prepares the
Board of Directors for discussion and decisions on
the future vision and strategy of the Bank. The
Strategic Development Committee monitors changes
in the Bank’s operating environment and deliberates
on the Bank’s position and business plan with regard
to strategic development.
The Board of Directors has overall responsibility for
the establishment and oversight of the risk manage-
ment framework, risk appetite, and setting risk limits.
The CEO is responsible for the effective implemen-
tation of the framework and risk appetite through
the corporate governance structure and committees.
11 Risk and Capital Management 2020

Figure 2.2: Risk management governance structure
The CEO is the chairman of the Executive Board, the
Risk & Finance Committee, the Credit Committee
and the Project Committee.
The Credit Committee covers credit risk, including
individual credit decisions, credit limits for customers
and credit risk policy.
The Risk & Finance Committee primarily covers mar-
ket risk, liquidity risk and legal risk. The Risk &
Finance Committee monitors the Bank’s overall risk
position, is responsible for enforcing the Bank’s risk
appetite and risk limits, and reviews and approves
changes to risk models before presentation to the
Board of Directors.
The Executive Board serves as a forum for discus-
sion about business opportunities and challenges,
approves funding for larger projects, and serves as
a decision-making platform on matters that do not
fall under the remit of other committees.
The Operational Risk Committee is a forum for dis-
cussion and decisions on operational risk issues and
review of the effective implementation of the opera-
tional risk framework.
The Project Committee selects, prioritises, oversees
and supports the Bank’s bigger projects and digital
transformation projects.
Governance pertaining to specific risks is discussed
in the relevant sections.
2.3.2 Risk Management Division
The Risk Management Division is responsible for the
Bank’s risk management framework. Subsidiaries of
the Bank have their own risk management functions
and the Risk Management Division receives informa-
tion on exposures from the subsidiaries and collates
them into Group exposure. The Risk Management
Division is also responsible for comprehensive risk
reporting on risk positions to various internal depart-
ments and committees and supervisory authorities.
The Risk Management Division comprised seven de-
partments at year-end 2020:
] The Credit Management Department reviews
and confirms or vetos credit decisions made
by the Bank’s business units when credit appli-
cations exceed the business unit’s limits. Con-
firmation by Credit Management implies that
Credit Management has reviewed the credit ap-
plication and does not exercise its veto rights.
Credit applications exceeding the confirmation
limits of the Risk Management Division are
referred to the Bank’s Credit Committee. The
Department also oversees regular updates of
the Bank’s credit policies and other rules re-
lated to the credit process.
] The Credit Risk Department is responsible for
measuring and monitoring credit risk as well as
for providing the Bank with systems and pro-
cesses to measure, monitor and control credit
risk in credit and policy decisions. Credit Risk
12 Risk and Capital Management 2020

is responsible for analysis and reporting on
credit risk, economic capital and impairment.
Credit Risk is also responsible for rules and
procedures regarding credit risk, such as pro-
cedures for impairment measurement, credit
mitigation and forbearance.
] The Market Risk Department is responsible for
measuring, monitoring and reporting on mar-
ket risk, liquidity risk and interest rate risk in
the banking book along with limit monitoring
and reporting. The Department develops and
maintains the Bank’s market risk models and
maintains the Bank’s Market Risk Policy and
Liquidity Risk Policy, as well as implementing
processes to measure and monitor market risk
and liquidity risk within the Bank. Market Risk
is also responsible for monitoring all derivatives
trading the Bank enters into, both for hedging
and trading purposes, as well as FX balance
monitoring for the Bank.
] The Operational Risk Department is respon-
sible for ensuring centralised management of
operational risk on a Group level. The depart-
ment assists in mapping the Bank’s operational
risk in a comprehensive risk assessment and
in executive assessment and analysis of op-
erational and loss events. The Operational
Risk department is involved in the design and
testing of the Group’s continuity plans. The
Department is responsible for the organisa-
tional structure and operation of the IT and
for ensuring compliance with the ISO 27001
standard for information security.
] The Risk Manager for Pension Funds is an
independent entity, responsible for develop-
ment and implementation of risk policy and
risk governance, execution of risk assessment
and correspondence with regulators such as
the Central Bank and its financial supervisory
function. The Risk Manager also ensures that
monitoring of regulatory compliance is carried
out, reviews calculations and results, and per-
forms tolerance interval monitoring. The Risk
Manager has direct access to the boards of
the pension funds and also reports to their
managing directors.
] The Internal Modelling Department is respon-
sible for providing the Bank with IRB and
EC models and related processes to estimate
credit risk and link the risk to equity, as well as
for providing support during the implementa-
tion of those models and processes within the
Bank. The Department is also responsible for
the development of models for pre-approved
limits.
] The Risk Solutions Department develops and
operates external solutions used by the Risk
Management Division, and maintains the IT
reporting and development environment for
the Risk Management Division. The Depart-
ment is also responsible for monitoring and
maintaining periodic executions of code by the
Division and reporting to supervisory parties.
The Department is responsible for effective
risk data aggregation and risk reporting, in
accordance with BCBS 239.
2.3.3 Compliance
Compliance is an independent management unit
which reports directly to the CEO and operates in
accordance with a letter of appointment from the
Board of Directors. The operations of the Compli-
ance unit are shaped by its independence from other
units.
Compliance is part of the Bank’s second level con-
trol and is responsible for monitoring compliance
with laws and actions against money laundering and
financing of terrorist activities, laws on securities
trading and data protection laws. Compliance also
monitors the efficiency of the Bank’s policy on com-
pliance with laws, regulations and internal rules.
Compliance consults and instructs management on
the effects of changes to the legal environment on
the Bank’s operations, measures to prevent conflict
of interest and action necessary to ensure that the
Bank operates in accordance with proper and sound
business practices with the aim of strengthening the
credibility of and confidence in financial markets.
13 Risk and Capital Management 2020

The Data Protection Officer works independently
out of Compliance, in accordance with a letter of
appointment from the Board of Directors.
2.3.4 Internal Audit
Internal Audit is an independent, objective assurance
and consulting activity that is a part of the Bank’s
organisational chart and an element of its monitor-
ing system. The Board of Directors has oversight
of Internal Audit and appoints the Chief Audit Ex-
ecutive. The role of Internal Audit is to improve
and protect the Bank’s value with risk-focused and
objective verification, consultation and insight. In-
ternal Audit evaluates and improves the risk manage-
ment framework, control and governance processes
through systematic and disciplined practices, thus
supporting the Bank in accomplishing its objectives.
The Chief Audit Executive is responsible for ensur-
ing that Internal Audit works in accordance with
laws, recommendations from the FSA no. 3/2008,
and standards and guidelines cited therein, including
the benchmarks of the Institute of Internal Auditors
(IIA).
2.4 Risk measurement
The Bank regularly monitors and assesses its current
risk profile in important business areas and for the
most significant, measurable risk types. It also con-
stantly seeks to improve the process for setting risk
appetite in order to supplement the risk management
framework and to support the business model.
The risk appetite framework considers key risks rel-
evant to the Bank’s business activities by setting
risk appetite targets and limits. On an aggregate
level, risk appetite is represented in terms of credit
risk, market risk, liquidity risk, operational risk and
funding risk. Each target or limit varies in detail,
as well as which metrics are used. In addition, the
Bank measures and monitors other key risk indica-
tors to capture process risk, as well as additional
credit, market, operational and funding risk.
Economic capital (EC) is a key element in the man-
agement of the Bank’s risk and capital structure, as
well as in day-to-day financial management. One of
the benefits of EC is that it presents an aggregate
figure for all measurable risk types, products and
business units. It thus produces a unified risk mea-
surement expressed as a single unit of value. Further
details on EC are provided in Section 3.4.2.
2.4.1 Stress testing and
sensitivity analysis
Stress testing and sensitivity analysis are important
tools used to quantify risk in severe, unlikely but plau-
sible scenarios. This section provides an overview
of stress testing and sensitivity analysis for different
risk types within the Bank.
2.4.1.1 Capital and liquidity
Stress testing is an important part of the Bank’s
capital and liquidity planning process. Internal stress
tests are used as an important risk management
tool to determine how severe, unlikely but plausi-
ble changes in the business and macro environment
affect the Bank’s capital need and liquidity posi-
tion. Stress tests reveal how the capital need and
liquidity ratios vary during a stressed scenario, where
impact on financial statements, regulatory capital re-
quirements and capital ratios are tested. The stress
testing process is divided into the following steps:
] Scenario development and approval
] Scenario translation
� Translation model to determine loan loss
� Translation method to determine the ef-
fect on financial statements
� Translation model to determine EC
] Calculation
] Analysis and reporting
] Management actions
The Bank aims to develop dynamic, forward-focused
scenarios that simultaneously cover key aspects of
the Bank’s operations, including system-wide inter-
action and feedback effects.
These scenarios, which include a baseline scenario,
assume developments of key macro indicators over
a three-year period. The scenarios demonstrate an
alternative development of key economic variables
induced by various shocks compared to the baseline
14 Risk and Capital Management 2020

Table 2.4: Overview of risk appetite metrics
Riskcategory
Risk type Metric 31.12.2020
2020 year-end target
31.12.2019
31.12.2018
Credit risk
Credit quality
Expected loss (% of total loans) 0.5% <0.5% 0.4% 0.4%
Probability of default 2.9% <2.7% 2.4% 2.5%
Loss given default 14.3% <18.0% 14.5% 14.7%
Industryconcentration
Largest industry (% of totalloans)
16.6% <25.0% 20.6% 21.1%
Single nameconcentration
Large exposures (% of eligiblecapital)∗
39.6% <50.0% 38.0% 33.6%
Marketrisk
Market risk Total market risk (% of REA) 1.0% <5.5% 1.2% 1.8%
Equity Risk-weighted position in thetrading book (% of REA)
0.3% <2.0% 0.4% 0.9%
Bonds Risk-weighted position in thetrading book (% of REA)
0.2% <0.5% 0.4% 0.2%
Currency Risk-weighted currency position(% of REA)
0.4% <3.0% 0.4% 0.6%
Interest raterisk
Interest rate & inflation risk inthe banking book (% of equity)
3.0% <10.0% 3.4% 3.0%
Inflation risk Net position (% of equity) 26.4% <80.0% 52.2% 71.5%
Liquidityrisk Liquidity risk
Liquidity coverage ratio - Total 154.2% >140.0% 160.5% 158.0%
Liquidity coverage ratio - FX 424.0% >200.0% 768.8% 531.9%
Liquidity coverage ratio - ISK 104.8% >70.0% 60.6% -
Operationalrisk
Change inREA
12-month change in REA 6.4% +/-4.0% -0.7% 5.1%
IT risk Number of open issues invulnerability scans of the Bank’swebsites
0 0 - -
Compliancerisk
Expired serious issues flagged byInternal Audit and regulators
0 0 - -
Fundingrisk
FundingNet stable funding ratio - FX 132.1% >120.0% 143.0% 165.7%
Net stable funding ratio - Total 116.5% >120.0% 117.0% 120%
Economiccapital
EC/REA 9.8% <10.5% 9.6% 10.0%
Capital ratio Total capital ratio 25.1% >23.0% 25.8% 24.9%
Risk-weightedcapital
S&P’s risk adjusted capital(RAC) ratio
17.9% >15.0% 17.9% 17.9%
∗In addition to monitoring large exposures as a % of eligible capital, the Bank also monitors the largest single exposure as a % ofeligible capital. The goal is <20% and as at 31.12.2020, the largest exposure is well below that goal. External regulation mandatesa ratio of <25%.
15 Risk and Capital Management 2020
macroeconomic forecast of the Bank’s Economic
Research Department. Idiosyncratic events are also
defined within the scenarios to stress specific asset
classes or operations of the Bank.
The Bank uses a loan loss model which incorporates
macroeconomic variables and produces probability
of default (PD), default rates, as well as loss given
default (LGD), which can be translated into loan
losses for a given scenario. In addition to the loan
loss model results, expert judgement is applied for
loan loss on selected large exposures by industries
affected within each scenario.
Scenario results are compared with the Bank’s cur-
rent business plan, risk appetite, and the Bank’s
solvency.
The effect on financial statements is translated and
calculated with a resulting impact on the capital
base and liquidity position. EC for the Bank is calcu-
lated for each scenario, as well as various risk metrics
within the Bank’s risk appetite. If the risk appetite
constraints are violated, management actions are
required within the scenario.
Act No. 54/2018, amending Act No. 161/2002,
on Financial Undertakings, transposed into Icelandic
law the provisions of the Bank Recovery and Resolu-
tion Directive No. 2014/59/EU (BRRD) on recovery
plans, early intervention and intra-group financial
support. According to Article 82(a) of the Act on
Financial Undertakings, the Bank has prepared a re-
covery plan on a group level, based on consolidated
financial information as at 30 September 2020. In
accordance with Article 82(f) of the Act, the Bank
has identified several recovery indicators with the
aim to assess the overall financial strength of the
Bank, as well as relevant threshold levels indicating
the need for pre-emptive measures to be taken.
2.4.1.2 Market risk
The Bank conducts stress tests and sensitivity analy-
sis pertaining to market risk on a regular and ad-hoc
basis. Comprehensive market risk stress testing is
conducted as part of the Bank’s ICAAP/ILAAP once
a year with a time horizon of three years. Other stress
tests and sensitivity analyses of the Bank’s trading
and non-trading portfolios with regard to equity and
interest rate risk and currency risk are made on a
case-by-case basis. These stress tests are subjec-
tive in nature and may pertain to specific portfolios,
instruments or issuers, and usually stem from con-
cerns regarding the Bank’s operating environment,
economic conditions, portfolio composition, or other
reasons relevant to the Bank at the time.
The Bank uses value-at-risk (VaR) and expected
shortfall (ES) as a common ground for measuring
market risk in different products. An internal VaR
model is in place for the quantification of market risk
and estimation of EC, and the Bank calculates daily
VaR at the 99% confidence interval using at least
one year of historical data. Both parametric and
historical VaR for the Bank’s trading books in equity,
fixed income and FX are calculated and reported to
relevant business units.
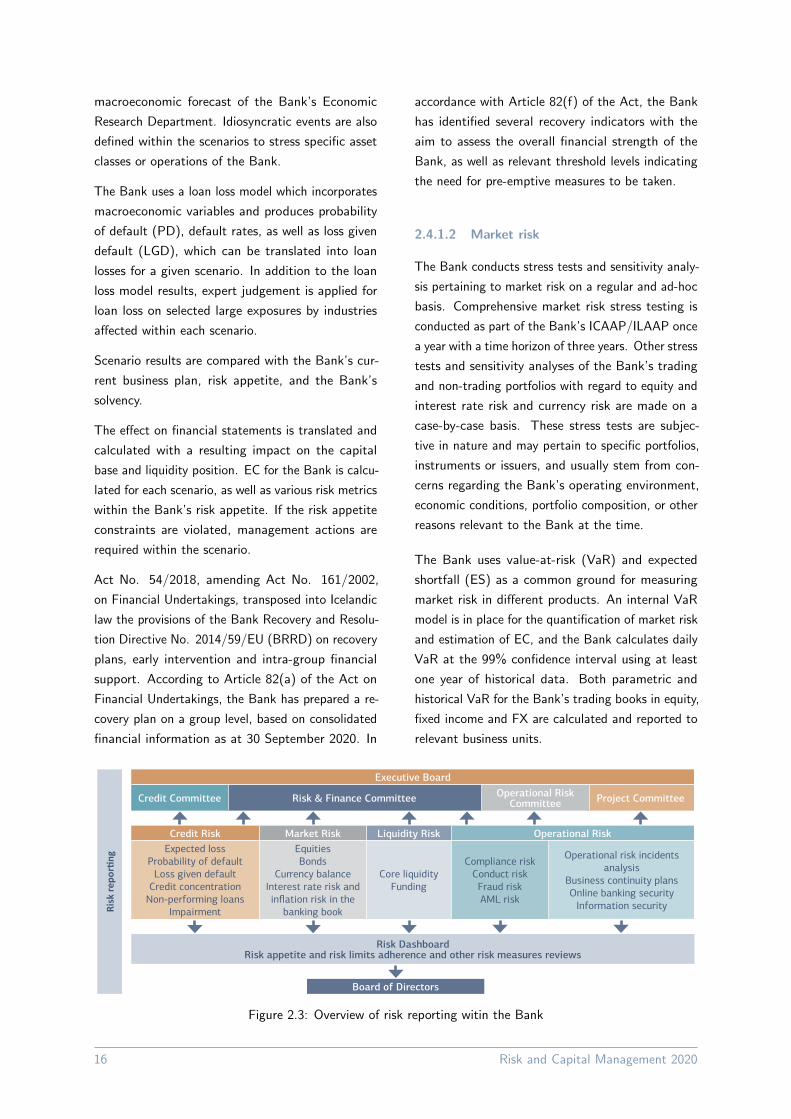
Figure 2.3: Overview of risk reporting witin the Bank
16 Risk and Capital Management 2020

The Bank is aware that all VaR models have limita-
tions that can have a major effect on model outcomes
and hence, may not hold in real adverse market con-
ditions. The Bank therefore compliments VaR cal-
culations with other methods such as stress testing
and sensitivity analysis and does not employ VaR to
control market risk or set trading book limits, but
rather views it as one of several indicators to better
enable market risk management.
2.4.1.3 Liquidity risk
Various stress tests have been constructed to try to
efficiently model how different scenarios affect the
Bank’s liquidity position and liquidity risk. The stress
tests are based on the Bank’s balance sheet mixture
and take the Bank’s current operating environment
into account. Key liquidity metrics are also mapped
onto annual internal stress tests that are used as
an important risk management tool in order to de-
termine how severe, unlikely but plausible changes
in the business and macro environment affect the
capital need and liquidity position of the Bank. The
Bank’s own subjective views, historical trends and
expert opinion are key factors in constructing the
stress tests. All stress tests are regularly reviewed
by the Risk & Finance Committee and the stress
test results are a part of the Bank’s early warning
indicators for liquidity risk. The Bank also tracks
the volatility and VaR numbers of the liquidity ratios
and performs other internal stress tests that may
vary from time to time.
2.5 Risk monitoring
The Bank allocates considerable resources to ensure
on-going adherence with approved risk limits and for
risk monitoring. It has set guidelines for reporting
to relevant management bodies, including the Board
of Directors, the Risk Committee, the Risk & Fi-
nance Committee, the Operational Risk Committee,
the Project Committee and the Executive Board on
developments in risk measures and risk appetite.
17 Risk and Capital Management 2020

Table 2.5: Principal reporting to the Board of Directors
AnnualRisk and capital managementreport
Pillar III disclosures
ICAAP/ILAAP report Evaluation of the risk profile and solvency need. The report containsconclusions drawn from stress testing, including the effect of variousscenarios on expected losses and capital needs. The ICAAP/ILAAPreport is subject to the FSA’s Supervisory Review and EvaluationProcess (SREP)
Economic capital report Thorough analysis of EC developments and EC breakdown by risk typesand business units as well as REA and other related aspects
Recovery plan The recovery plan focuses on measures to protect and restore theBank’s financial position, following a significant deterioration. Itincludes governance and decision-making processes, continuity ofcritical economic functions and core business lines, specification oftrigger points to activate recovery options and internal and externalcommunications
Compliance report Annual assessment of the role, independence, authorisations and workof Compliance, and whether Compliance has sufficient funding toperform its duties.
Bi-annualCredit risk report Thorough risk report providing analysis of such issues as development in
risk appetite, past due loans, average exposure-weighted probability ofdefault (PD), default rate vs. PD, distribution of loan portfolio inrating categories and migration analysis and other analysis of credit riskaspects
Market & liquidity risk report Thorough risk report summarising the Bank’s liquidity risk and marketrisk exposures and any concerns regarding liquidity and/or market risk
Operational risk report Thorough risk report providing analysis of operational risk aspects
MonthlyRisk report An aggregate report containing information on the Group’s risk appetite
and material from the credit, market, liquidity and operational riskreports. The report is interactive and available electronically
Executive management report An aggregated report containing risk related material such as riskappetite, EC and RAROC
Bi-weekly or more oftenMarket & liquidity risk report∗ Market and liquidity risk report highlighting the Bank’s market risk
exposures, risk appetite, market risk limit utilization and liquidity riskand any concerns regarding liquidity and/or market risk
∗Daily during adverse conditions
18 Risk and Capital Management 2020

3 Capital
management
3.1 Capital management framework . . 20
3.2 Capital policy, capital requirement
and capital targets . . . . . . . . . 21
3.3 Capital position . . . . . . . . . . 24
3.4 Capital assessment . . . . . . . . . 24
3.5 Leverage ratio . . . . . . . . . . . 30

Capital Management
The purpose of the Bank’s capital manage-
ment is to support the Bank’s strategy and
ensure that it has sufficient capital to cover
its risk at all times.
] The Bank’s total capital ratio decreased by
0.7 percentage points in 2020 to 25.1%.
] Due to prevailing economic uncertainty
and precautionary guideance from the FSA,
the Bank did not pay dividends in 2020.
] The overall economic capital and the risk
exposure amount both increased in 2020,
resulting in an EC/REA ratio of 9.8% at
year-end.
] Compared to the most recent SREP re-
quirement of 18.8% and an implied man-
agement buffer of 3.2%, the Bank’s excess
capital is 3.1 percentage points or ISK 35
billion.
Capital positionas at 31.12.2020
89.7 110.1 89.7
38.1
82.8
36.1
34.9
260.2
21.4
0
50
100
150
200
250
300
Regulatory capital
requirements
Economic capital
Total capital
requirements
Management buffers
Capital base
Capital buffers Excess capital
Implied management buffer Pillar I
Pillar II−R Tier 1 capital
Tier 2 capital Total
ISK bn
3.1 Capital management
framework
The purpose of the Bank’s capital management
framework is to support the Bank’s strategy and
ensure that it has sufficient capital to cover its risks.
The capital management framework of the Bank
is comprised of 4 interdependent activities: capi-
tal assessment, risk appetite/capital target, capital
planning, and reporting/monitoring.
The Bank uses standardised approaches in measuring
the regulatory capital requirement for Pillar I risks
and economic capital (EC) for capital management
purposes.
The Bank’s capital management governance struc-
ture at year-end 2020 is as follows:
Board of Directors
The Board of Directors of Landsbankinn is responsi-
ble for reviewing and approving the Bank’s business
strategy and policy on aggregate exposure and de-
termines the Bank’s risk appetite. The Board of
Directors approves the Bank’s current funding pro-
gramme and subordinated borrowings. The Board
of Directors shall be actively involved in the design
and implementation of stress tests and ensure that
they are based on robust and efficient governance
and methodology.
CEO, Risk & Finance Committee
The CEO is responsible for implementation of the
capital structure policy. The CEO has formed the
Risk & Finance Committee to manage and oversee
the implementation. The Committee is responsible
for ensuring compliance with the policy in the devel-
20 Risk and Capital Management 2020

opment of the Bank’s business and financial plans.
The Risk & Finance Committee is responsible for the
design and presentation of stress tests and scenarios.
Finance & Operations
The CFO is responsible for the day-to-day capital
management and funding of the Bank and reports
to the Risk & Finance Committee. The Finance &
Operations Division is tasked with monitoring the
risk-weighted asset base, the capital base and capital
position at any given time, and reporting on these
matters. Reporting incorporates regular reports on
developments in the capital base and equity require-
ments and plans, as well as the ICAAP/ILAAP report
and the recovery plan. Finance & Operations is re-
sponsible to the Risk & Finance Committee for the
design and presentation of scenarios and implementa-
tion of stress testing of the Bank’s capital structure.
Treasury, a department within Finance & Operations,
is responsible to the Risk & Finance Committee for
the management of the Bank’s funding, both in ISK
and foreign currency.
Risk Management
The CRO is responsible for risk assessment and mon-
itoring of risk factors and reports to the Risk &
Finance Committee. Risk Management is also re-
sponsible for the EC framework and measurement
and the Pillar III risk report.
Managing directors of
income-generating divisions
The managing directors of income-generating divi-
sions shall comply with the capital structure policy in
their activities. This means, inter alia, that business
decisions taken within these divisions shall comply
with the business plan and budget, risk appetite and
the Bank’s current profitability target.
Internal Audit
Internal Audit shall regularly review and comment
on the framework and work procedures related to
the capital structure policy and, thereby, help ensure
that the policy extends to and is proportional to
the nature, scope and risk inherent in the Bank’s
operation.
Figure 3.1: Capital management framework
3.2 Capital policy, capital
requirement and capital
targets
3.2.1 Capital policy
The Bank has a policy on capital structure, the objec-
tive of which is to ensure appropriate management,
efficiency and economic utilisation of the Bank’s eq-
uity, while additionally ensuring that the Bank fulfils
regulatory capital requirements. With active cap-
ital management, the Bank ensures that dividend
payments are based on its dividend policy and do
not violate equity and liquidity positions in excess of
set limits, and that the Bank can at all times meet
increased risk in its operating environment.
The total capital ratio target is reviewed annually.
When setting the target, EC, Pillar I and II capital re-
quirements, regulatory capital buffers, management
capital buffer, risk appetite, and strategic objectives
are considered. The Bank’s aim is to maintain a
capital ratio above the FSA’s total capital require-
ment at any given time, plus a management buffer
specified in the Bank’s risk appetite. The Bank also
aims to be in the highest category for risk-adjusted
capital ratio, as determined and measured by the
relevant credit rating agencies.
The Bank aims to pay regular dividends to share-
holders, amounting to around 50% of the previous
year’s profit. In addition, and in line with the Bank’s
target capital and liquidity ratios, the aim is also
to make special dividend payments to optimise the
21 Risk and Capital Management 2020

Table 3.1: Capital Requirement
31.12.2020 CET1 Tier 1 Total
Pillar I 4.5% 6.0% 8.0%
Pillar II-R 1.9% 2.6% 3.4%
Minimum requirement under Pillar I and Pillar II-R 6.4% 8.6% 11.4%
Systemic risk buffer 2.88% 2.88% 2.88%
Capital buffer for systematically important financial institutions 2.00% 2.00% 2.00%
Countercyclical capital buffer 0.00% 0.00% 0.00%
Capital conservation buffer 2.50% 2.50% 2.50%
Combined buffer requirement 7.38% 7.38% 7.38%
Total capital requirement 13.8% 16.0% 18.8%
Bank’s capital structure. No dividend was paid in
2020 because of the prevailing economic uncertanity
and precautionary guidance from the FSA.
In determining the amount of dividend payments, the
Bank’s continued strong financial position should be
considered. Risk in the Bank’s internal and external
environment, growth prospects and the maintenance
of a long-term, robust equity and liquidity position
shall be taken into account, as well as compliance
with regulatory requirements of financial standing at
any given time.
3.2.2 Capital requirement and capital
target
The Internal Capital/Liquidity Adequacy Assessment
Process (ICAAP/ILAAP) under Pillar II is the Bank’s
own assessment of its capital need. It is based on
EC calculations, stress testing and current results
from the Supervisory Review and Evaluation Process
(SREP) by the FSA. ICAAP/ILAAP and SREP form
the foundation for the Bank’s capital planning, in-
cluding the business and financial plan for the next 3
years. The Bank’s most recent capital requirements,
as determined by the FSA, are shown in Table 3.1
(%/REA).
The capital requirement of 18.8% is based on the
outcome of the FSA’s 2019 SREP, having regard
for the latest decisions on capital buffer require-
ments (the domestic countercyclical capital buffer
was eased from 1.75% as of 15.5.2019 to 0.0% from
19.03.2020 to date).
The Covid-19 pandemic hit in the early stages of
the 2020 SREP. This has led to great economic and
operational uncertainty for financial institutions. Re-
sponding to these unprecented circumstances, the
Financial Stability Committee of the Central Bank
of Iceland in September 2020 decided to maintain
the 2019 SREP capital requirements for Pillar II-R of
3.4%. The FSA closely monitors the most significant
risk factors for systematically important financial in-
stitutions (SIFIs) and will review the Pillar II-R and
Pillar II-G (current Pillar II-G requirement is 0%)
requirement in the 2021 SREP at the latest.
The Bank’s capital target is based on the current
regulatory capital requirement of 13.8% CET1 and
18.8% total capital ratio. In addition, the Bank
defines a management buffer for the purpose of
targeting and managing its capital position comfort-
ably above the overall regulatory capital requirement.
Determination of the management buffer is based
on various current and forward-looking factors such
as the economic and funding outlook, competitive
issues, risk profile and business plan.
As shown in Table 3.2 the Bank’s total targeted cap-
ital ratio is ≥ 22% and ≥ 18% for the CET1 ratio.
Given the 18.8% TCR requirement, the Bank’s cur-
rent implied minimum management buffer is 3.2%.
The total capital ratio at year-end 2020 was 25.1%
meaning the Bank’s excess capital is 3.1% of REA,
or ISK 35 billion.
22 Risk and Capital Management 2020

Table 3.2: Capital Ratio
Goal 2020 2019 2018 Comment
Total capital ratio ≥22.0% 25.1% 25.8% 24.9% Long-term goal
Common equity Tier 1 ≥18.0% 23.2% 23.9% 23.6% Long-term goal
Dividend pay-out ratio Around50%
0% 52% 78% The target dividend pay-out ratio isaround 50% of the previous year’sprofit. In addition, the Bank aims tomake special dividend payments tooptimise capital structure.
Taking precautionary measuresrelated to economic uncertainty, theBank did not pay a dividend from2019 profits in 2020.
Table 3.3: Capital buffers
15.5.2019 1.2.2020 19.3.2020 Effectivecapital buffers
at year-end2020
Systemic risk buffer 3.00% 3.00% 3.00% 2.88%
Capital buffer for systematically importantfinancial institutions
2.00% 2.00% 2.00% 2.00%
Countercyclical buffer 1.75% 2.00% 0.00% 0.00%
Capital conservation buffer 2.50% 2.50% 2.50% 2.50%
Combined capital buffer requirement 9.25% 9.50% 7.50% 7.38%
3.2.3 Capital buffers
CRD IV introduced a combined buffer requirement
that applies in addition to the solvency need ratio.
The combined buffer consists of a countercyclical
buffer, a capital conservation buffer, O-SII buffer
and a systemic risk buffer. Capital buffers must be
funded with CET 1 capital.
The combined capital buffer requirement as deter-
mined by the Icelandic Financial Stability Council
(FSC) for SIFIs is 7.50% of REA at year-end 2020 as
compared to 9.50% at year-end 2019. The change
is driven by a Covid-19 related decrease in the do-
mestic countercyclical capital buffer in March 2020.
Easing the countercyclical capital buffer requirement
aims to allow the banking system to better support
households and businesses through the pandemic.
The capital buffers are expressed as a proportion
of consolidated REA. However, the systemic risk
buffer only applies to domestic REA, meaning that
the effective requirement for the buffer is somewhat
lower than defined by the financial authorities, or
2.88% instead of 3.0%, as foreign exposures account
for 4% of total REA. The systemic risk buffer is
high in Iceland compared to other countries. The
Bank maintains the viewpoint that this buffer over-
estimates the systemic risk present in Iceland. The
effective countercyclical capital buffer is determined
using the weighted average of the prevailing capi-
tal buffer level in the countries where the Bank has
exposure. As the buffer is currently 0% in Iceland,
like in most other European countries, the Bank’s
effective requirement for the countercyclical capital
buffer is close to 0%, or 0.004%.
The effective total regulatory capital buffer for the
Bank at year-end 2020 is 7.38% of consolidated REA.
In addition, and as previously mentioned, the Bank
has set an implied minimum management buffer of
3.2%, bringing total capital buffers at year-end up
to 10.6%.
23 Risk and Capital Management 2020

Table 3.4: Domestic and foreign REA
2020 2019
Domestic REA 96% 95%
Foreign REA 4% 5%
Total 100% 100%
3.3 Capital position
The Bank’s equity increased by ISK 10.7 billion in
2020 and amounted to ISK 258.3 billion (2019: ISK
247.7 billion) at 31 December 2020. The capital ad-
equacy ratio is calculated in accordance with Article
84 of Act No. 161/2002, on Financial Undertakings.
The Bank’s total capital ratio decreased by 0.7 per-
centage points in 2020, remained strong at 25.1%
as at 31 December 2020 (2019: 25.8%).
The capital base consists of 23.2% CET1 based on
core equity only and 1.9% of Tier 2 capital, with
two instruments in the form of subordinated liabil-
ities: firstly, an EUR 100 million (ISK 15.7 billion)
instrument with final maturity in September 2028
but callable in September 2023 and, secondly, an
ISK 5.7 billion fixed-rate inflation-linked instrument
with final maturity in December 2029 but callable
in December 2024.
On 4 May 2020, regulation No. 452/2020 transposed
into Icelandic law Regulation (EU) 2017/2395 of the
European Parliament and of the Council amending
Regulation (EU) No. 575/2013, as regards, inter alia,
transitional arrangements for mitigating the impact
of the introduction of IFRS 9 on own funds. The
Financial Supervisory Authority (FSA) has granted
permission for the Bank to apply IFRS 9 transitional
arrangements in accordance with the aforementioned
regulations. The effect of the arrangements on the
Bank’s CET1 capital was positive by ISK 5.4 bn and
REA increased by the same amount.
Changes in the Bank’s TCR for the year 2020 are
demonstrated in Figure 3.2.
The Board of Directors intends to propose that the
annual general meeting (AGM) approve a dividend
of ISK 0.19 per share, to be paid to shareholders
in 2021. Should the AGM approve this dividend
proposal, the Bank’s capital will be reduced by an
amount equivalent to the dividend payment and the
Bank’s capital ratios, in accordance with the Act on
Financial Undertakings, will decrease by 0.4 percent-
age points.
3.3.1 CET1 capital - statutory
deductions and transitional
arrangements
CET1 capital consists of core equity less statutory
deductions according to requirements of the FSA
based on Article 10 of Act No. 161/2002.1 The
Bank makes deductions in order to determine its
CET1 capital where applicable.
] Carrying amounts of intangible assets
] Deferred tax assets
] Capital holdings in other credit and financial
institutions amounting to more than 10% of
their capital
] Foreseeable dividends in next year’s operations
Furher to CET1 statutory deductions, the Bank
makes transitional arrangements by mitigating the
impact of the introduction of IFRS 9 on own funds
based on regulation 452/2020.
3.4 Capital assessment
3.4.1 Minimum capital requirement
The regulatory minimum capital requirement (CR)
under Pillar I of the Directive is 8% of risk-weighted
assets for credit risk, market risk and operational
risk. The Bank uses the standardised approach2 in
measuring Pillar I capital requirements for credit risk
and market risk. For operational risk, it uses the
basic indicator approach.
The Bank’s risk exposure amount (REA) was ISK
1,122 billion at year-end 2020 and increased by ISK
101 billion, or 9.8%, for the year. Accordingly, the
minimum capital requirement for the Bank was ISK
1Article 55, see http://www.althingi.is/lagas/145b/2002161.html2See Staðalaðferð http://www.stjornartidindi.is/Advert.aspx?ID=f051707c-8c23-4e99-a305-68dcb6f97a29
24 Risk and Capital Management 2020

Table 3.5: Breakdown of the capital base
31.12.2020 31.12.2019
Share capital 23,625 23,625
Share premium 120,630 120,630
Reserve 19,250 14,334
Retained earnings 94,750 89,145
Total equity attributable to owners of the Bank 258,255 247,734
Intangible assets -1,696 -2,296
Deferred tax assets -23 -20
Fair value hedges -1,696 -1,327
Adjustment under IFRS 9 transitional arrangements 5,353 -
CET1 260,246 244,091
Non-controlling interests 0 0
Tier 1 capital 260,246 244,091
Subordinated liabilities 21,366 19,081
Tier 2 capital 21,366 19,081
Capital base 281,612 263,172
Risk exposure amount (REA)
Credit risk 1,010,588 908,249
Market risk 11,526 11,754
Operational risk 99,485 100,394
Total REA 1,121,599 1,020,396
CET1 ratio 23.2% 23.9%
Total capital ratio 25.1% 25.8%
25.8%1.0% 0.4% −2.4%
0.0% 0.2% 25.1%
10%
12%
14%
16%
18%
20%
22%
24%
26%
28%
30%
1.1.2020 Profit 2020
Adjustments under IFRS 9
transitional arrangements
Changes in REA
Dividends Other changes
31.12.2020
Figure 3.2: Change in capital ratio
25 Risk and Capital Management 2020

89.7 billion as compared to ISK 81.6 billion at year-
end 2019. Credit risk is the single largest risk type
or 90.1% of total REA and minimum capital require-
ment.
In 2020, the SME factor was implemented in Iceland
and the Bank was authorised to apply the factor to
decrease risk exposure amounts to customers who
fulfil the SME factor requirements. Application of
the SME factor decreased the risk exposure amount
at year-end 2020 by a total of ISK 11.5 billion for ex-
posures classified as ‘corporate’, ‘retail’ and ‘secured
by immovable property’.
During the year 2020, the Bank implemented the
European Banking Authority’s (EBA) guidelines for
exposures with high risk (EBA/GL/2019/01). In
line with these guidelines, certain exposures were
re-classified as high risk resulting in an increase in
REA by ISK 51.7 billion. These exposures are mainly
either equities in the banking book or speculative
immovable property financing (corporates and re-
tail). This increase in REA, and therefore in Pillar
I capital requirement, will likely be offset in the up-
coming SREP as these exposures have a higher Pillar
II capital requirement, which means that the Pillar
II requirement will most likely decrease as a result.
Other material changes in REA were in line with
increased lending, mostly in mortgages.
3.4.2 Economic capital
Economic capital (EC) is a risk measure that is ap-
plied to all material risks. It captures unexpected
losses and reduction in value or income for which
the Bank needs to hold capital to avoid insolvency.
It arises from the unexpected nature of losses as dis-
tinct from expected losses. EC is calculated as the
difference between unexpected losses and expected
losses, where unexpected loss is defined as the 99.9%
Value-at-Risk (VaR), with a one-year time horizon.
The purpose of the EC framework is to enable the
Table 3.6: Capital requirement and REA
31.12.2020 31.12.2019
CR REA CR REA
Credit risk breakdown
Central governments or central banks 129 1,616 69 867
Regional governments or local authorities 151 1,884 159 1,984
Public sector entities 12 152 0 0
Institutions 804 10,050 802 10,024
Corporates 41,895 523,691 45,185 564,810
Retail 7,149 89,368 9,217 115,214
Secured by mortgages on immovable property 16,460 205,750 12,220 152,747
Exposures in default 2,446 30,576 2,118 26,481
Items associated with particular high risk 9,811 122,639 0 0
Equity 76 947 0 0
Other items 1,913 23,914 2,890 36,122
Credit risk 80,847 1,010,588 72,660 908,249
Market risk breakdown
Traded debt instruments 209 2,613 293 3,658
Equities 313 3,913 305 3,807
CVA 14 172 8 106
Currency risk 536 6,698 606 7,571
Market risk 386 4,828 335 4,183
Operational risk 7,959 99,485 8,032 100,394
Total capital requirement and REA 89,728 1,121,599 81,632 1,020,397
26 Risk and Capital Management 2020

Bank to assess the amount of capital it requires to
cover the economic effects of risk-taking activities,
as well as to compare different risk types using a
common “risk currency”. The EC framework further
measures unexpected losses, decomposes EC on var-
ious levels to enable capital allocation, limit-setting,
pricing of products, risk-adjusted performance mea-
surement and value-based management.
The framework covers the following risk types: credit
risk, market risk, currency risk, operational risk, con-
centration risk, interest rate risk in the non-trading
book, inflation risk, legal risk and business risk.
Table 3.7 summarises how the Bank calculates its
EC for the risks included in the framework.
EC amounted to ISK 110.1 billion at 31 December
2020 and increased by ISK 11.8 billion or 15.9%
during the year (2019: ISK 98.2 billion). The ratio
of EC to REA increased from 9.6% to 9.8% during
the year.
Credit risk is the driving factor for increase in EC
in 2020 with increase of ISK 10.4 billion for the
year. EC for the retail loan portfolio increased by
ISK 1.8 billion, or 13%, for the year due to increased
mortgage lending. However, the credit quality of
the retail portfolio improved with 2.3% EC/EAD
(2019: 2.5% EC/EAD), mainly due to higher ratio
of mortgages in the portfolio. EC for the corporate
loan portfolio increased by ISK 8.1 billion, or 17%,
and EC/EAD increased from 7.0% to 8.0% in 2020,
where PD increased from 2.5% to 4.1% for the year.
The increase in EC was mainly due to the increase in
PD for the portfolio, largely caused by downgrade in
rating grade for corporates within the travel industry
that are in financial difficulties due to Covid-19.
EC for other risk categories than loans to customers
and credit institutions amounted to ISK 37.9 billion
at year-end 2020 (2019: ISK 35.9 billion). EC for
market risk and currency risk increased collectively
by ISK 1 billion, primarily due to extreme market
volatility following the Covid-19 pandemic.
Table 3.9 shows a breakdown for credit risk, probabil-
ity of default by asset class, as well as LGD, EAD and
EC for loans to customers and credit institutions.
3.4.3 Pillar II
Pillar II sets forth the framework for the supervi-
sory review process (SREP) and the framework for
the Bank’s internal capital/liquidity adequacy assess-
ment process (ICAAP/ILAAP). The Bank is exposed
to many risks, and they are not limited to those
that are quantified under Pillar I (credit, market and
operational risks). Pillar II concerns the Bank’s risks
in a wider sense, yet is still specific to its operation,
i.e. risk profile and business environment.
Table 3.10 shows the results of the 2020 SREP as
published by the FSA on 1 February 2021. The Pillar
II requirements are 3.4% of REA and as a result, the
Bank’s minimum capital requirement under Pillar I
and Pillar II-R is 11.4% plus capital buffers of 7.38%.
The Pillar II requirement is unchanged from the pre-
vious year as the Central Bank of Iceland financial
stability committee decided in September 2020 to
withhold the 2019 SREP capital requirements for
Pillar II-R until the 2021 SREP process at the latest.
3.4.4 Capital allocation to business
lines
The Bank makes an internal capital allocation across
business divisions on the basis of each unit’s con-
tribution to the Bank’s total risk as estimated by
the Bank’s EC model. Capital exceeding the Bank’s
minimum capital target and the management buffer
is allocated to Treasury. Allocated capital plus re-
tained earnings per business unit at year-end 2020
is shown in Figure 3.3.
Figure 3.3: Capital allocation per business line
15%
46%
2%
37%
Corporate banking Markets
Personal banking Treasury
27 Risk and Capital Management 2020

Table 3.7: Calculation method of economic capital
Risk Calculation method
Credit risk The main credit risk EC model is the asymptotic single risk factor (ASRF) modelfrom the Basel framework internal rating based (IRB) approach’s risk weightformula, i.e., EC equals the capital requirements of the IRB approach in the capitalrequirements directive. The main inputs to the model are the risk parametersprobability of default (PD), loss given default (LGD) and exposure at default(EAD). EC for counterparty credit risk is calculated according to theMark-to-Market Method in the CRR and for equities in teh banking book thesimple risk weight approach in the CRR is applied. EC for credit risk for all otherexposure classes is measured by the standardised approach.
Market risk Market risk EC includes EC for interest rate risk in the trading book and EC forequity price risk in the trading book.Each EC is calculated according to a stressed VaR model as specified in theinternal model’s approach in the capital requirements directive (CRR). The modelinputs are calibrated to historical data from the previous 5 years.EC for credit valuation adjustment (CVA) equals the capital requirements for CVA.
Currency risk EC for foreign exchange risk is calculated according to a modified stressed VaRmodel, where the model inputs are calibrated to historical data from a period ofsignificant stress relevant to the Bank’s net FX position. The time horizon is oneyear.
Concentration risk EC for single name concentration is calculated by adjusting for the granularity andnon-homogeneity in the loan portfolio. This is necessary as the credit risk ECmodel assumes that the portfolio is infinitely large and homogeneous; hence, thesingle name concentration EC is given as an add-on.An internal model is used to measure the additional EC for credit risk related toindustry concentrations in the loan portfolio, i.e. a concentration add-on. Themodel calculates the industry concentration risk for the loan portfolio and subtractsthe industry concentration risk for Iceland to get the EC add-on for industryconcentration.
Interest rate riskand inflation risk inthe banking book
EC for interest rate risk and inflation risk in the banking book is equal to the sumof:
i The loss in economic value corresponding to the 99.9th percentile for ISKand the 99th percentile for significant foreign currencies of risk factorchanges estimated by a Monte Carlo simulation model.
ii The loss in economic value due to a +/- 200 bps shift of risk factors in othercurrencies (whichever results in a larger loss).
Operational risk EC for operational risk is calculated using the basic indicator approach, whichmeans that it equals the Bank’s capital requirement.
Business risk EC for business risk is measured at least annually in the ICAAP and is based on theeffects of the base case scenario on the Bank’s balance sheet and operations andits effect on the Bank’s capital base.
Legal and politicalrisk
EC for legal and political risk is calculated by adding the potential loss of on-goingdisputes weighted by their status within the legal system.
28 Risk and Capital Management 2020

Table 3.8: Economic capital
2020 2019
Credit risk - Loans to customers and credit institutions 72,194 62,292
Credit risk - Other assets 7,583 7,098
Market risk 2,300 1,511
Currency risk 964 776
Operational risk 7,959 8,031
Single name concentration risk 7,226 6,331
Industry concentration risk 1,618 1,539
Interest rate and inflation risk 7,878 8,587
Business risk 0 0
Legal and political risk 2,329 2,067
Total 110,051 98,232
REA 1,121,599 1,020,396
EC/REA 9.8% 9.6%
Table 3.9: Credit risk - loans to customers and credit institutions
Credit risk as at 31 December 2020 PD LGD EAD EC
Financial institutions 0.1% 45.0% 47,884 770
Public entities 0.7% 45.0% 9,832 163
Retail 1.8% 24.7% 671,855 15,245
Corporates 4.1% 34.0% 702,549 56,016
Total 2.9% 30.1% 1,432,120 72,194
Credit risk as at 31 December 2019 PD LGD EAD EC
Financial institutions 0.1% 45.0% 47,531 765
Public entities 0.6% 45.0% 10,063 163
Retail 2.1% 25.0% 545,597 13,408
Corporates 2.5% 33.7% 686,248 47,956
Total 2.2% 30.5% 1,289,439 62,292
Table 3.10: SREP results
2020 2019
% REA % REA
Pillar I Credit risk 7.1% 7.1%
Market risk 0.1% 0.1%
Operational risk 0.8% 0.8%
Minimum capital requirement 8.0% 8.0%
Pillar II Credit, counterparty and concentration risk 1.9% 1.9%
Market risk and IRRBB 1.3% 1.3%
Other risk 0.2% 0.2%
Additional P-II R 3.4% 3.4%
Additional P-II G 0.0% 0.0%
Minimum requirement under Pillar I and Pillar II-R 11.4% 11.4%
29 Risk and Capital Management 2020

3.4.5 Risk-adjusted return on capital
To analyse the Bank’s risk-adjusted profit and prof-
itability, i.e. including the cost of risk, the measures
risk-adjusted profit (RAP) and risk-adjusted return
on capital (RAROC), are reported monthly to senior
management. The objective of these metrics is to
assess shareholder value creation and profitability in
relation to the equity capital needed to cover the
undertaken risks, i.e., the economic capital. The
measures enable risk-based pricing, increase incen-
tives to measure and manage risk appropriately, focus
on long-term profit, and support the assessment of
the Bank’s optimal capital structure. These mea-
sures have been implemented throughout the Bank
and are used in individual credit decisions for large
corporate customers, as well as to determine the pric-
ing of loan products for smaller corporate customers
and individuals.
3.5 Leverage ratio
The Capital Requirements Regulation (CRR), as part
of the Basel III framework, requires banks to mea-
sure, report and monitor their leverage ratios. The
ratio is defined as CET1 capital as a percentage of
total leverage exposure (see table 3.11) and acts as
a credible supplementary measure to the risk-based
capital requirements.
A credible leverage ratio is one that ensures broad
and adequate capture of both the on and off-balance
sheet sources of the Bank’s leverage, aimed at re-
vealing hidden leverage on the Bank’s balance sheets.
The ratio reinforces the risk-based requirements with
a simple non-risk based “backstop” measure and is
intended to restrict the build-up of leverage in the
banking sector. The leverage ratio minimum require-
ment is 3%.
At 31.12.2020, the Bank’s leverage ratio was 15.4%.
Further information about the leverage ratio can be
found in the additional disclosures accompanying
this document.
Figures 3.4 and 3.5 show the Bank’s leverage ratio
for the past years. Despite trending downwards in
this period, the ratio is still over five-fold the min-
imum 3% requirement. The main drivers of the
decreasing leverage ratio are increasing total assets
and decreasing Tier 1 capital, in line with the Bank’s
policy to better optimise its capital structure.
Figure 3.4: Leverage ratio
20.3%18.2%
16.1% 15.7% 15.4%
0%
5%
10%
15%
20%
25%
2016 2017 2018 2019 2020
In theory, if the Bank would want to decrease its
leverage ratio and aim for the minimum of 3%, it
would not be able to do so without breaching other
regulated, or internal risk appetite ratios first. Fur-
thermore, off balance sheet exposures and derivatives
instrument exposure are not significant factors of
the Bank’s leverage ratio. Therefore, the risk of
excessive leverage is not considered a significant risk
factor for the Bank. Nevertheless, leverage ratio
is a part of the Bank’s risk appetite and is consid-
ered a relevant risk indicator both in the Bank’s
ICAAP/ILAAP as well as within BRRD. The Bank
has management actions in place to meet scenarios
that would adversely affect the Bank’s leverage ratio.
30 Risk and Capital Management 2020

Table 3.11: Leverage ratio
2020 2019
Tier 1 capital 260,246 244,091
Leverage exposure
- On balance sheet exposure (excluding derivatives) 1,556,541 1,423,634
- Derivatives instrument exposure 5,944 2,695
- Potential future exposure on derivatives 4,366 1,625
- Off balance sheet exposure 130,089 125,848
- Regulatory adjustments to Tier 1 capital -3,362 -3,643
Total leverage exposure 1,693,578 1,550,158
Leverage ratio 15.4% 15.7%
249
1,109
113
243
1,191
141
236
1,324
147
244
1,424
126
260
1,563
130
0
200
400
600
800
1000
1200
1400
1600
1800
2016 2017 2018 2019 2020
Off balance sheet exposures Tier 1 capital
Total assets (excl. regulatory adjustments to T1, derivative instruments and SFTs)
ISK bn
Figure 3.5: Leverage ratio breakdown
31 Risk and Capital Management 2020

4 Credit risk
4.1 Credit risk management . . . . . . 33
4.2 Credit portfolio . . . . . . . . . . . 39
4.3 Risk concentration . . . . . . . . . 53

Credit Risk
Credit risk is defined as the risk of loss if
customers fail to fulfil their agreed obliga-
tions and the estimated value of pledged
collateral does not cover existing claims.
] The Covid-19 pandemic had an effect on
the Bank’s risk profile in 2020, reflected
in moratoria measures for customers, in-
crease in ECL, increase in ratio of stage 2
loans and deteriorating credit quality for
customers with forborne loans.
] Probability of default, weighted by gross
carrying amount, increased to 2.8% at year-
end 2020 (2019: 2.3%).
] Economic capital due to credit risk from
loans to customers and credit institutions
increased in 2020, due to higher PD val-
ues for corporates and increased mortgage
lending.
] Total expected credit loss was ISK 25 bil-
lion at year-end 2020 (2019: ISK 15 bil-
lion)
] Total credit exposure from lending activ-
ities increased by 12%, driven by growth
in the mortgage portfolio.
EC - Credit and concentration risk
67
63
78
72
2
2
0
25
50
75
2019 2020
Industry concentration risk
Single name concentration risk
Credit risk − Other assets
Credit risk − Loans to customers and credit institutions
ISK bn
4.1 Credit risk management
The Bank offers loans, credits, guarantees and other
credit-related products as part of its business model
and thus takes on credit risk. Regular risk reporting
enables the ongoing monitoring of the Bank’s credit
risk position relative to its risk appetite.
The credit risk appetite is converted by the busi-
ness units to their specific key performance indica-
tors (KPIs) in collaboration with Risk Management.
Monitoring functions determine whether credit facili-
ties are granted in accordance with the risk appetite.
Risk Management monitors and challenges the per-
formance and reports the progress to the Executive
Board and the Board of Directors.
Credit risk is primarily managed through the credit
process and the Bank’s credit risk models which in-
clude PD, LGD and EAD modelling. The models are
used for various purposes, such as in provisioning,
calculating EC and management reporting.
33 Risk and Capital Management 2020

4.1.1 Identification
Credit risk is defined as the risk of loss if customers
fail to fulfil contractual obligations and the estimated
value of pledged collateral does not cover existing
claims.
The Bank’s activities may give rise to risk at the time
of settlement of transactions and trades. Settlement
risk is the risk of loss due to the failure of an entity
to honour its obligations to deliver cash, securities
or other assets as contractually agreed. Settlement
risk is deemed immaterial in the Bank’s operations.
Credit risk is the greatest single risk faced by the
Bank and arises principally from loans and advances
to customers and from investments in debt securities,
but also from commitments, guarantees and docu-
mentary credits, counterparty credit risk in deriva-
tives contracts, and the aforementioned settlement
risk.
4.1.2 Assessment
Credit risk is measured in three main dimensions:
probability of default (PD), loss given default (LGD)
and exposure at default (EAD). To measure PD, the
Bank has developed an internal rating system, includ-
ing a number of internally developed rating models.
The objectives of the rating system are to provide
a meaningful assessment of obligor characteristics;
a meaningful differentiation of credit quality; and
accurate and consistent quantitative estimates of
default risk, i.e. probability of default (PD). Internal
ratings and associated PD values are essential in
the risk management and decision-making process,
and in the credit approval and corporate governance
functions.
The rating system has an obligor rating scale which
exclusively reflects quantification of the risk of obligor
default, or credit quality. The obligor rating scale
has 10 rating grades for non-defaulted obligors from
1 to 10, with 10 indicating the highest credit quality,
and the grade 0 for defaulted obligors. The rating
assignment is supported by rating models, where
information such as industry classification, financial
accounts and payment behaviour is taken into ac-
count.
The internal rating system is used to assign ratings
and calculate risk-weighted exposure amounts for
the majority of the Bank’s customers for economic
capital. However, there are a few exceptions. Ex-
ternal ratings, from Standard & Poor’s, Moody’s
and Fitch, are used for foreign credit institutions
and ratings from Creditinfo are used for new retail
customers.
Figure 4.1: The credit process
34 Risk and Capital Management 2020

Table 4.1: Internal mapping from internal rating grade to external rating agencies
Internal rating grade Standard & Poor’sand Fitch
Moody’s Lower PD Upper PD
10 AAA/AA+/AA/AA- Aaa/Aa1/Aa2/Aa3 0.00% 0.04%
9 A+/A/A- A1/A2/A3 0.04% 0.10%
8 BBB+ Baa1 0.10% 0.21%
7 BBB/BBB- Baa2/Baa3 0.21% 0.46%
6 BB+/BB Ba1/Ba2 0.46% 0.99%
5 BB- Ba3 0.99% 2.13%
4 B+ B1 2.13% 4.54%
3 B B2 4.54% 9.39%
2 B- B3 9.39% 18.42%
1 CCC/C Caa1/Caa2/Caa3/Ca/C 18.43% 99.99%
The rating assignment and approval is an integrated
part of the credit approval process and assignment
shall be updated at least annually, or when mate-
rial information on the obligor or exposure becomes
available, whichever is earlier. The rating assessment
of corporate obligors having financial difficulties, as
a result of the Covid-19 pandemic, were updated in
2020. These more frequent updates of rating assess-
ment usually led to a downgrade in rating grade.
Figure 4.2: Rating system overview
35 Risk and Capital Management 2020

The Bank’s estimation and validation process in-
cludes quality controls to assess the performance
of models, procedures and systems, and is designed
to ensure the accuracy of the parameters through
adjustments where necessary.
The rating models are validated annually, both quan-
titatively and qualitatively. The quantitative valida-
tion includes statistical tests of the models’ discrimi-
natory power, i.e. the models’ ability to distinguish
default risk, and absolute accuracy, i.e. the ability
to predict default levels.
The PD parameters are re-estimated and validated
annually by a quantitative and qualitative assessment.
The quantitative assessment includes statistical tests
to ensure that the estimates remain valid when new
data is added. PD estimates are based on observed
default frequency in available internal data and ad-
justed to long term default frequencies through an
add-on. The adjustment for the length of internal
data available is embedded in the margin of conser-
vatism which also includes an add-on to compensate
for statistical uncertainty in the estimation.
LGD is measured using an internal LGD model for
the purpose of EC calculations and provisioning. The
internal LGD model takes into account more types
of collateral and is more sensitive to the collater-
alisation level than the model defined in the Basel
framework, and is calibrated to historical loss data.
Exposure at default (EAD) is an estimate of the
amount outstanding (drawn amounts plus likely fu-
ture drawdowns of yet undrawn lines) in case the
borrower defaults. The Bank uses the standard ap-
proach for estimating REA and EC but uses internal
models for provisioning.
4.1.3 Management and policy
The Bank’s credit risk management objective is to en-
sure compliance with the Bank’s credit policy, which
entails that the only risk taken is one that the Bank
understands, can evaluate, measure and manage.
The Bank’s credit risk management is based on active
monitoring by the Board of Directors, the CEO, the
Risk & Finance Committee, the Credit Committee,
the credit departments within the Risk Management
Division and the business units. The Bank manages
credit risk according to its risk appetite statement
and credit policy approved by the Board of Directors,
as well as detailed credit policies approved by the
CEO. The risk appetite and credit policy include
limits on large exposures to individual borrowers or
groups of borrowers, concentration of risk and ex-
posure to certain industries. The CEO ensures that
the risk policy is reflected in the Bank’s internal
framework of regulations and guidelines. The Bank’s
Managing Directors are responsible for ensuring that
the Bank’s business units execute the risk policy
appropriately and the CEO is responsible for the
oversight of the process as a whole.
Figure 4.3: Credit risk management framework
Incremental credit authorisation levels are defined
based on size of units, types of customers and the
lending experience of credit officers. The Bank has
also set industry policies that describe its appetite to
provide credit to specific industries. Credit decisions
exceeding authorisation levels of business units are
subject to confirmation by Credit Management. The
Corporate Banking Credit Committee has authorisa-
tion levels exceeding that of individual business unit
managers and meets regularly to make credit deci-
sions. Credit Management has veto powers over the
decisions of the Corporate Banking Credit Commit-
tee. Credit decisions exceeding the signing limits of
the Corporate Banking Credit Committee are subject
to approval by the Bank’s Credit Committee. Credit
decisions exceeding the limits of the Credit Commit-
tee are subject to approval by the Board of Directors,
which holds the highest credit authorisation within
the Bank.
36 Risk and Capital Management 2020

4.1.4 Mitigation
Mitigating risks in the credit portfolio is a key ele-
ment of the Bank’s credit policy, as well as an in-
herent part of the credit-decision process. Securing
loans with collateral is the main method of mitigating
credit risk, whereas for some loan products collateral
is required by legislation, as in the mortgage finance
market, or is standard market practice.
The most important types of collateral are real estate,
vessels and financial assets (shares or bonds).
The amount and type of collateral required depends
on an assessment of the credit risk associated with
the counterparty. Valuation parameters and the
acceptability of different types of collateral are de-
fined in the Bank’s credit policy. Credit extended
by the Bank may be secured on residential or com-
mercial property, land, listed and unlisted securities,
transport vessels, fishing vessels together with their
non-transferable fishing quotas, etc. The Bank also
secures its loans by means of receivables, inventory
and operating assets, such as machinery and equip-
ment. Residential mortgages involve the underlying
residential property. Less stringent requirements are
set for securing short-term personal loans, such as
overdrafts and credit card borrowings.
The Bank regularly assesses the market value of re-
ceived collateral. The Bank estimates the value as
the market value less a haircut. A haircut in this
context is a discount factor which represents a con-
servative estimate of the costs to sell in a forced
sale. Costs to sell include maintenance costs during
the period the asset is held for sale, external fees
and loss in value. For listed securities, haircuts are
calculated with an internal model based on variables,
such as price volatility and marketability.
The Bank monitors the market value of mark-to-
market collateral and may require additional collat-
eral in accordance with the underlying loan agree-
ments.
In order to further limit the credit risk arising from
financial instruments, the Bank enters into netting
agreements, under which the Bank is able to set
off all contracts covered by the netting agreement
against the debt in cases of default. The arrange-
ments generally include all market transactions be-
tween the Bank and the customer.
Generally, collateral is not held over loans and ad-
vances to financial institutions, nor is it usually held
against bonds and debt instruments.
The Bank includes all collateral to which a value
is assigned in accordance with its internal proce-
dures. Guarantees are included if they imply lower
risk weights than the original exposure. In addition,
collateral is volatility-adjusted (by means of a hair-
cut) in order to take price volatility and the expected
costs of repossession and sale of the pledge into
account.
4.1.4.1 Derivative financial instruments and
securities financing
In order to mitigate credit risk arising from deriva-
tives and securities financing transactions, the Bank
chooses the counterparties for derivatives and mar-
gin trading based on stringent requirements. The
Bank also enters into standard International Swaps
and Derivatives Association (ISDA) master netting
agreements and similar general netting agreements
with financial counterparties.
Collateral and margin requirements are in place for all
derivative contracts and securities financing transac-
tions the Bank enters into. Collateral management
and monitoring is performed daily, and derivative
contracts with customers are usually fully hedged.
The Bank’s supervision system monitors both expo-
sure and collateral value and calculates an intraday
credit equivalent value for each derivative. It also
issues margin calls and manages netting agreements.
In the case of derivatives, amounts due to and from
the Bank are offset when the Bank has a legally
enforceable right to set off a recognised amount and
intends either to settle on a net basis or to realise the
asset and settle the liability simultaneously. External
ratings are used where applicable to assist in manag-
ing the credit risk exposure of bonds. Otherwise the
Bank uses fair value estimates based on available
information and the Bank’s own estimates.
37 Risk and Capital Management 2020

4.1.5 Control and monitoring
The Bank has set limits for large exposures as well
as policies for exposure ratio for different portfo-
lios to control the credit risk in the Bank’s credit
portfolio and ensure risk diversification. The credit
risk decision process is controlled with limits set in
the Bank’s Credit rules approved by the Board of
Directors. The rules set the limit for each credit
decision party within the Bank where the credit ap-
proval authority is based on the underlying credit
risk measured by exposure size, credit rating and
colour classification code.
The credit risk monitoring process is based on regu-
lar reporting, monitoring systems and other manual
monitoring. There is increased monitoring for signifi-
cant exposures and for customers with indications of
financial difficulties. One of the integral part of the
credit risk monitoring process is the Early Warning
System.
The Bank monitors exposures to identify signs of
weakness in customer earnings and liquidity, or other
issues that could increase the Bank’s credit risk, as
soon as possible. To monitor customers, the Bank
uses an Early Warning System, which is supplemen-
tal to ratings and classifies credit exposures to four
credit risk groups (green, yellow, orange and red).
The colour classification is as follows:
] Green: the customer is considered as perform-
ing without signs of repayment problems
] Yellow: the customer shows indication of dete-
riorating financial strength, which could lead
to financial difficulties
] Orange: the customer is or has been in finan-
cial difficulties or default
] Red: the customer is in default and in legal
collection and/or restructuring
The Credit Risk Department within Risk Manage-
ment is together with the business units responsible
for the colour classification of customers.
4.1.6 Impairment process
The Bank uses the three-stage expected credit loss
model under IFRS 9. Allowance is calculated as the
12-month expected credit loss (ECL) or the lifetime
expected credit loss.
The Bank recognises loss allowances for ECL on the
following financial instruments that are not measured
at fair value through profit or loss:
] Cash and balances with Central Bank
] Bonds and debt instruments
] Loans and advances to financial institutions
] Loans and advances to customers
] Other assets
Off-balance sheet exposures:
] Financial guarantees and underwriting com-
mitments
] Undrawn loan commitments
] Undrawn overdraft/credit card facilities
When measuring ECL, the Bank uses a forward-
focused model in compliance with IFRS 9. This
requires considerable judgement over how changes
in economic factors affect ECL. ECL reflects the
present value of cash shortfalls due to possible de-
fault events either over the following twelve months
or over the expected life of a financial instrument,
depending on credit deterioration from origination.
The Credit Risk Department is responsible for as-
sessing impairment on loans and receivables and a
Valuation Team, comprised of the CEO, the man-
aging directors of Finance, Risk Management, Cor-
porate Banking and Personal Banking, reviews and
approves the assessment.
In general, all impairment charges are loan-specific
based on the aforementioned ECL models. If needed,
the Valuation Team can assess and issue additional
general impairment charges.
In 2019, the lifetime PD models were validated.
Based on the validation results, new and revised
lifetime PD models were implemented in February
2020. In 2020, the staging allocation model and
the LGD model were validated. These efforts are
a clear indication of the Bank’s continued focus on
the quality of the impairment process.
38 Risk and Capital Management 2020

4.2 Credit portfolio
4.2.1 Credit exposure
At year-end 2020, 90% of the Bank’s risk exposure
amount (REA) was due to credit risk, most of which
comes from lending activities. On the same date,
total loans and advances amounted to ISK 1,321
billion (2019: ISK 1,188 billion), with ISK 1,273 bil-
lion coming from lending activities (2019: ISK 1,140
billion) and ISK 48 billion from loans and advances
to financial institutions (2019: ISK 48 billion).
The Covid-19 pandemic had a considerable effect on
the Bank’s credit risk profile in 2020. Overall credit
quality deteriorated, primarily in the corporate port-
folio. At year-end 2020, 73% of total credit exposure
had rating grades from 5 to 10 (2019: 76%). At
year-end 2020, 83% of total credit exposure to indi-
viduals had rating grades from 5 to 10 (2019: 82%)
and 65% of total credit exposure to corporates had
rating grades from 5 to 10 (2019: 73%). Impairment
charges increased by ISK 10 billion in 2020, mostly in
stage 1 and 2 in the corporate portfolio, but also in
stage 3 in the travel industry. The credit risk profile
is monitored and strengthened in accordance with
the credit risk appetite, which encompasses credit
quality (expected loss) and credit risk concentration
(limits on single names and industries). For further
information on the effects of the Covid-19 pandemic
on the Bank’s credit risk, see note 4 in the Bank’s
consolidated financial statement for 2020.
The Bank’s credit exposure shown in Table 4.2 is
defined as balance sheet items and off-balance sheet
items that carry credit risk. For on-balance sheet
loans and advances, the exposure is calculated net of
accumulated ECL for exposures measured at amor-
tized cost, otherwise at fair value. Off-balance sheet
amounts are the maximum amounts the Bank might
have to pay out in guarantees, loan commitments in
their full amount, and undrawn overdraft and credit
card facilities.
At year-end 2020, the total on-balance carrying
amount was ISK 1,520 billion. ISK 1,273 billion
is derived from lending activities, ISK 68 billion from
cash and balances with the Central Bank, and ISK 85
billion from bonds and debt instruments. The total
off-balance exposure at year-end 2020 was ISK 188
billion. ISK 100 billion is derived from undrawn loan
commitments, ISK 65 billion from undrawn over-
draft/credit card facilities and ISK 24 billion from
financial guarantees and underwriting commitments.
4.2.2 Effects of the Covid-19
pandemic on the credit portfolio
The Bank responded to the effects of the Covid-19
pandemic with direct measures for customers as well
as internal measures to strengthen the monitoring
and measurement of credit risk in light of increased
uncertainty.
The Bank followed the clarifications outlined in the
statement issued by EBA in March 2020 on appli-
cation of the prudential framework regarding de-
fault, forbearance and IFRS9 in light of these cir-
cumstances.1 These guidelines have also been sup-
ported by the FSA. Initially, general measures were
applied under an agreement between domestic banks
and other lenders. These measures consisted of de-
layed payments of principal and interest for up to
6 months within the year 2020. Customers expe-
riencing prolonged financial difficulties due to the
pandemic were granted further delay of payments,
mostly until the second half of 2021. In addition, the
Bank has granted government-backed loans amount-
ing to gross carrying amount of ISK 3.5 billion at
year-end 2020.
The gross carrying amount of loans to customers
who received general moratoria measures was ISK
179 billion at year-end 2020, of which ISK 83 bil-
lion were to corporates in the travel industry, ISK
54 billion to other corporate customers and ISK
42 billion to individuals. As the general measures
expired some customers had further moratoria mea-
sures while some could resume regular payments.
The need for further measures was mostly to cor-
porates in the travel industry. The gross carrying
amount of loans to customers having received further
moratoria measures was ISK 82 billion at year-end
1https://www.eba.europa.eu/eba-provides-clarity-banks-consumers-application-prudential-framework-light-covid-19-measures
39 Risk and Capital Management 2020

Table 4.2: Classification of the Bank’s financial assets carrying credit risk
As at 31 December 2020 Maximum exposure to credit risk
Financial assets Financialinstitutions
Publicentities
Individuals Corporations Total
Cash and balances with Central Bank - 67,604 - - 67,604
Bonds and debt instruments 26 79,204 - 5,994 85,224
Equities and equity instruments in thebanking book
1 - - 18,033 18,034
Derivative instruments 3,000 1 - 302 3,302
Loans and advances to financial institu-tions
48,073 - - - 48,073
Loans and advances to customers - 4,128 592,216 677,082 1,273,426
Other financial assets 15,864 26 65 7,959 23,914
Total on-balance sheet exposure 66,964 150,962 592,281 709,370 1,519,577
Off-balance sheet exposure 139 6,953 32,240 148,955 188,287
Financial guarantees and underwritingcommitments
138 44 645 23,242 24,069
Undrawn loan commitments - - - 99,555 99,555
Undrawn overdraft/credit card facilities 1 6,909 31,595 26,158 64,663
Maximum exposure to credit risk 67,103 157,915 624,521 858,325 1,707,864
As at 31 December 2019 Maximum exposure to credit risk
Financial assets Financialinstitutions
Publicentities
Individuals Corporations Total
Cash and balances with Central Bank - 69,824 - - 69,824
Bonds and debt instruments 11,423 102,181 - 1,658 115,262
Equities and equity instruments in thebanking book
1 - - 17,706 17,706
Derivative instruments 2,202 - 9 483 2,694
Loans and advances to financial institu-tions
47,929 - - - 47,929
Loans and advances to customers - 4,135 467,945 668,104 1,140,184
Other financial assets 2,767 26 76 4,95 7,819
Total on-balance sheet exposure 64,322 176,166 468,03 692,901 1,401,418
Off-balance sheet exposure 3,598 5,051 33,553 141,275 183,477
Financial guarantees and underwritingcommitments
306 168 775 22,718 23,967
Undrawn loan commitments - - - 95,478 95,478
Undrawn overdraft/credit card facilities 3,292 4,883 32,778 23,079 64,032
Maximum exposure to credit risk 67,920 181,217 501,583 834,175 1,584,895
40 Risk and Capital Management 2020

2020, of which ISK 68 billion were to corporates
in the travel industry, ISK 14 billion to other cor-
porate customers and ISK 1 billion to individuals.
70% of gross carrying amount in the travel industry
have received further moratoria while the ratio was
only 2.4% of gross carrying amount to corporates
in other industries at year-end 2020. For further
information on the effects of the Covid-19 pandemic
on the Bank’s credit risk, see note 4 in the Bank’s
consolidated financial statement for 2020.
Figure 4.4 shows the gross carrying amount of
loans with active Covid-19-related measures over
the course of the year 2020.
In addition to direct measures to customers, the
uncertainty of the impact of the pandemic is also
reflected in the Bank’s monitoring and measurement
of credit risk. Credit ratings were downgraded for
corporate customers who received forbearance mea-
sures with further payment delays to reflect their
financial difficulties and increased credit risk. Col-
lateral value in hotels and accommodation was also
lowered. Further measures were applied for impair-
ment assessment as more loans moved to stage 2
and expected credit loss has increased considerably.
The Bank also allocated a general allowance for im-
pairment to certain portfolios to better reflect this
uncertainty. Further information on the Bank’s im-
pairment calculations can be found in Section 4.2.6
on loan impairment.
4.2.2.1 Credit exposure from lending activities
At year-end 2020, the Bank’s total credit exposure
from lending activities amounted to ISK 1,273 bil-
lion, increasing by 12% from ISK 1,140 billion at
year-end 2019. The increase was almost exclusively
driven by a 25% growth in the mortgage portfolio.
The increase in the mortgage portfolio was based
on customers’ increased demand for non-indexed
mortgages that have become more favourable to
indexed mortgages due to lowering interest rates.
The increase in the mortgage portfolio is based on
new lending to customers and comprise of first-time
buyers and customers re-financing their loans from
other lenders such as pension funds. More detailed
information on the mortgage portfolio is in Section
4.2.4.5. The size of the corporate portfolio is largely
unchanged from the previous year, growing only by
1.3%. Increased uncertainty in economic conditions
due to Covid-19 has negatively affected the demand
for new lending to corporates, especially in some
sectors.
The total average PD weighted by gross carrying
amount was 2.8% at year-end 2020 (2019: 2.3%).
Excluding loans to financial institutions, the average
PD was 2.9% (2019: 2.4%). The average PD for
individuals was 1.5% (2019: 1.8%) and the average
PD for corporates was 4.1% (2019: 2.9%). The in-
crease in the weighted average PD in the corporate
portfolio is largely due to a downward re-evaluation
Corporates Individuals
31.3.2020 30.6.2020 30.9.2020 31.12.2020 31.3.2020 30.6.2020 30.9.2020 31.12.2020
0
20
40
60
80
100
120
140
160
Active Expired
ISK bn
Figure 4.4: Active vs. expired Covid-19-related measures
41 Risk and Capital Management 2020

of the credit quality of customers with financial dif-
ficulties which received Covid-19 related moratoria.
Credit quality in the individual portfolio continues
to increase, parallel to a significant growth in the
mortgage portfolio. Increased mortgage lending to
good quality customers drives down the average PD
value for the individual portfolio.
In 2020, LGD decreased slightly for individuals and
increased slightly for corporate customers. The de-
crease in LGD for individuals is largely explained
by the increased ratio of mortgages to other loans
in the individual portfolio, as mortgages generally
have a lower LGD than other loans to individuals,
and the increase in LGD in the corporate portfolio
is largely explained by the fact that during the year
2020, the valuation of pledged collateral for some of
the larger customers in the portfolio was re-evaluated
as a response to the Covid-19 pandemic, primarily
for hotels and other accommodation. At year-end
2020, the total average LGD weighted by gross carry-
ing amount, excluding loans to financial institutions,
was 14.3% (2019: 14.5%). The average LGD for
individuals was 9.1% (2019: 9.5%) and the average
LGD for corporates was 18.7% (2019: 17.9%).
The carrying amount of loans in stage 3 net of accu-
mulated ECL as a percentage of the total portfolio
remained stable in 2020, and is 2.0% at year-end
2020. The ratio increased in the corporate portfolio
and decreased in the individual portfolio, standing
at 3.3% for corporates and 0.6% for individuals at
year-end 2020. For individuals, the ratio decreased
both for individuals with and without morgages. In
the corporate portfolio, the ratio decreased or re-
mained unchanged for most sectors. However, a
slight increase in stage 3 loans for construction and
travel industry companies causes the overall ratio to
increase in the corporate portfolio.
The carrying amount of loans and advances to cus-
tomers past due by 6-90 days decreased in 2020.
General and specific moratoria, granted as a response
to the Covid-19 pandemic skews the overall outlook
regarding loans past due, as many customers that
might otherwise be past due on their loans have
been granted such moratoria. General moratoria,
which was granted in early 2020 to almost every-
one that applied has expired for most customers.
Some customers have been granted further, specific
moratoria. These specific moratoria are classified as
forbearance, and the ratio of loans with forbearance
has risen considerably, from 3.6% at year-end 2019
to 9.4% at year-end 2020. For further information
on Covid-19 related moratoria, refer to Note 4 in the
Bank’s consolidated financial statement for 2020.
Figure 4.5: Probability of default (PD)
0%
1%
2%
3%
4%
5%
2018 2019 2020
Individuals Corporates Total
Figure 4.6: Loss given default (LGD)
0%
5%
10%
15%
20%
2018 2019 2020
Individuals Corporates Total
Figure 4.7: Stage 3 loans (% of total portfolio)
0.0%
0.5%
1.0%
1.5%
2.0%
2.5%
3.0%
3.5%
2018 2019 2020
Individuals Corporates Total
42 Risk and Capital Management 2020

Figure 4.8: Ratio of loans past due 6-90 days
0.0%
0.5%
1.0%
1.5%
2.0%
2018 2019 2020
Individuals Corporates Total
4.2.3 Forbearance
The Bank adopts forbearance plans to assist cus-
tomers in financial difficulty with the goal of pro-
tecting the Bank’s long-term interests. Conces-
sions granted to customers include interest-reduction
schedules, interest-only schedules, temporary pay-
ment holidays, term extensions, cancellation of out-
standing fees and settlements.
Forbearance plans must comply with the Bank’s
Credit Policy. They are used as an instrument to
maintain long-term customer relationships during
economic downturns if there is a realistic possibility
that the customer will be able to meet obligations
again, and are used for minimising loss in the event
of default.
The Bank has implemented EBA’s definition of loans
subject to forbearance measures. Table 4.3 is based
on EBA’s definition where exposures with forbear-
ance measures are divided into performing and non-
performing loans.
Total exposures subject to forbearance measures in-
creased from ISK 41 billion at year-end 2019 to ISK
122 billion (9.4% of the total portfolio) at year-end
2020. In accordance with the EBA Guidelines on leg-
islative and non-legislative payment moratoria, loans
that were granted payment holidays under general
Covid-19 moratoria were in general not classified
as forborne. However, specific moratoria granted
subsequently do trigger forbearance classification,
which explains the substantial increase of loans with
forbearance in 2020.
4.2.4 Credit risk by industry sectors
Table 4.4 shows the carrying amount of loans and
advances by industry sectors along with key risk met-
ric values. PD and LGD averages in the table are
weighted by gross carrying amount, but other ratios
with carrying amount. A more thorough description
of the largest industry sectors follows.
This section describes developments in credit quality
for the four largest corporate sectors in the Bank’s
lending portfolio, as well as in the mortgage portfolio
for 2020.
Table 4.3: Exposures subject to forbearance (ISK millions)
31.12.2020 31.12.2019
Performing Non-performing Performing Non-performing
Modification 85,570 29,996 15,429 16,079
Refinancing 3,437 3,529 424 1,680
- of which: Under probation 2,738 0 2,281 0
Total 89,007 33,525 16,716 24,437
43 Risk and Capital Management 2020

Table 4.4: Overview of credit risk measures by industries
As at 31 December 2020 Carryingamount
PD LGD Past due6-90 days
Stage 2loans
Stage 3loans
TotalECL
Public entities 4,128 1.4% 51.3% 0.0% 3.4% 0.0% -41
Individuals 592,215 1.5% 9.1% 0.9% 6.7% 0.5% -2,308
Mortgages 518,249 1.3% 6.8% 0.8% 5.5% 0.5% -1,221
Other 73,967 2.4% 24.9% 1.5% 15.1% 1.1% -1,086
Corporates 677,083 4.2% 18.5% 1.1% 15.7% 3.3% -22,126
Fisheries 179,713 1.9% 11.4% 0.1% 2.5% 0.4% -1,236
Real estate companies 129,462 3.4% 14.9% 1.2% 9.1% 2.8% -3,335
Construction companies 82,345 6.2% 19.6% 2.9% 16.2% 2.7% -2,482
Travel industry 95,996 10.9% 24.2% 2.9% 58.6% 11.0% -8,507
Services and ITC* 67,352 2.3% 30.1% 0.4% 10.1% 2.6% -2,239
Retail 53,590 2.5% 18.9% 0.7% 8.1% 1.6% -1,400
Manufacturing and energy 30,231 2.0% 31.0% 0.1% 9.2% 8.2% -2,540
Holding companies 31,849 3.2% 14.4% 0.0% 18.1% 0.0% -244
Agriculture 6,544 2.6% 14.0% 1.2% 12.7% 4.1% -144
Other 0 17.9% 55.1% 37.4% 37.6% 0.0% 0
Total loans to customers 1,273,426 2.9% 14.3% 1.0% 11.5% 2.0% -24,475
Financial institutions 48,073 0.1% 55.1% 0.0% 0.0% 0.0% -1
Total loans including1,321,498 2.8% 15.8% 1.0% 11.0% 1.9% -24,476
financial institutions
As at 31 December 2019 Carryingamount
PD LGD Past due6-90 days
Stage 2loans
Stage 3loans
TotalECL
Public entities 4,135 1.4% 52.2% 0.0% 2.7% 0.0% -35
Individuals 467,942 1.8% 9.5% 1.6% 7.5% 0.9% -2,151
Mortgages 391,902 1.6% 6.5% 1.4% 6.2% 0.7% -848
Other 76,040 2.7% 24.6% 2.6% 14.3% 1.8% -1,303
Corporates 668,100 2.9% 17.7% 1.5% 9.5% 2.9% -12,697
Fisheries 151,335 1.6% 9.6% 0.1% 3.2% 0.3% -456
Real estate companies 135,999 3.2% 14.5% 3.3% 9.0% 2.7% -2,174
Construction companies 98,535 4.5% 22.8% 0.7% 19.2% 1.6% -1,677
Travel industry 96,664 3.9% 19.3% 3.5% 10.8% 7.1% -3,306
Services and ITC* 69,604 1.7% 29.3% 1.1% 7.0% 3.1% -1,599
Retail 60,524 2.2% 18.5% 0.9% 7.8% 2.1% -949
Manufacturing and energy 23,836 2.2% 31.1% 0.6% 19.9% 11.7% -2,315
Holding companies 26,154 3.6% 9.5% 0.1% 7.3% 0.3% -129
Agriculture 5,447 2.3% 11.9% 0.4% 10.2% 5.3% -92
Other 1 14.8% 55.1% 0.7% 70.1% 0.0% 0
Total loans to customers 1,140,177 2.4% 14.5% 1.5% 8.6% 2.1% -14,883
Financial institutions 47,935 0.1% 55.1% 0.0% 0.0% 0.0% -1
Total loans including1,188,113 2.3% 16.1% 1.5% 8.3% 2.0% -14,884
financial institutions∗ITC consists of corporations in the information, technology and communication sectors
44 Risk and Capital Management 2020

4.2.4.1 Fisheries
Loans and advances to customers in the fisheries in-
dustry amounted to ISK 180 billion as at 31 Decem-
ber 2020 (2019: ISK 151 billion). Credit exposure
to the sector represented 14% of the Bank’s loan
portfolio. The growth was primarily due to increased
lending and partly due to the depreciation of the
ISK.
Figure 4.9: PD & LGD - Fisheries
1.4% 1.6% 1.9%
9.9% 9.6%
11.4%
0%
2%
5%
8%
10%
12%
2018 2019 2020
PD LGD
Figure 4.10: Default rate vs. PD - Fisheries
0%
1%
2%
3%
4%
5%
6%
7%
2017 2018 2019 2020
Weighted PD Weighted default rate Average PD Default rate
Figure 4.11: Staging - Fisheries
5.7%
3.2%
2.5%
0.8%0.3% 0.4%0%
2%
4%
6%
2018 2019 2020
Stage 2 Stage 3
The average PD value for the sector increased slightly
in 2020 and was 1.9% at year end. The average LGD
value for the sector increased in 2020, having de-
creased steadily for the last few years, and was 11.4%
at year-end 2020. 0.4% of loans in the sector were
in default at year-end 2020, compared to 0.3% at
year-end 2019.
Credit extended by the Bank to the fisheries industry
is primarily secured by fishing vessels together with
their non-transferable fishing quotas, or 74% of the
sector’s total collateral.
The realised default rate for the fisheries sector has
consistently been below the average PD values for
the past few years. The sector remains one of the
strongest in the Bank’s portfolio with relatively low
underlying risk.
The ratio of stage 2 loans in the fisheries sector
decreased in 2020, standing at 2.5% at year-end
2020.
Total ECL for the fisheries sector increased by ISK
780 million in 2020 to a total of ISK 1,236 million
at year end, primarily due to an increase in ECL
in stage 1 due to an increase in point-in-time PD
based on more adverse economic scenarios used in
impairment calculations.
4.2.4.2 Real estate companies
Loans and advances to customers in the real estate
industry amounted to ISK 129 billion at year-end
2020 (2019: ISK 136 billion). Credit exposure to the
sector represented 10% of the Bank’s loan portfolio.
Excluding the travel industry sector, most specific,
Covid-19 related moratoria have been granted to
companies in the real estate sector. The total gross
carrying amount of loans in the sector, with granted
specific moratoria is ISK 7.3 billion or 5.5% of all
loans in the sector.
The average PD value for the sector increased slightly
in 2020 and was 3.4% at year end (2019: 3.2%). The
average LGD value for the sector increased slightly
in 2020, having decreased considerably in 2019, and
was 14.9% at year-end 2020 (2019: 14.5%).
45 Risk and Capital Management 2020

The realised weighted default rate for real estate
companies decreased from the previous year in 2020,
as it did in 2019 and was 0.9%. The realised default
rate for the sector has been consistently below the
average PD values for the past few years.
The ratio of stage 2 loans remained largely un-
changed in 2020, after having increased considerably
in 2019. The ratio of stage 3 loans increased slightly
in 2020 and was 2.8% at year end.
Figure 4.12: PD & LGD - Real estate companies
3.3% 3.2% 3.4%
16.7%
14.5% 14.9%
0%
2%
4%
6%
8%
10%
12%
14%
16%
18%
2018 2019 2020
PD LGD
Figure 4.13: Default rate vs. PD - Real estate com-panies
0%
1%
2%
3%
4%
5%
6%
7%
2017 2018 2019 2020
Weighted PD Weighted default rate Average PD Default rate
Figure 4.14: Staging - Real estate companies
4.0%
9.0% 9.1%
2.8% 2.7% 2.8%
0%
2%
5%
8%
10%
2018 2019 2020
Stage 2 Stage 3
Total ECL for the real estate sector increased by ISK
1,161 million in 2020 to a total of ISK 3,335 million
at year end, primarily due to an increase in ECL in
stage 1 and 2 due to an increase in point-in-time PD
based on more adverse economic scenarios used in
impairment calculations, and increased impairment
for stage 3 loans.
4.2.4.3 Construction companies
Loans and advances to construction companies
amounted to ISK 82 billion at year-end 2020 (2019:
ISK 99 billion). Credit exposure to the sector repre-
sented 6% of the Bank’s loan portfolio. As the credit
portfolio for construction companies is largely project
based the outstanding carrying amount of loans can
fluctuate between periods. This is due to the fact
that as projects are in development the outstanding
amount increases over time while as the properties
begin to sell the outstanding amount decreases. In
2020 the demand for newly built apartments has
been high leading to a decrease in the outstanding
amount.
The average PD value for the sector increased in
2020 and was 6.2% at year-end (2019: 4.5%). This
increase was primarily due to the deterioration of
credit quality for a few large customers in the sector.
The average LGD value for the sector decreased in
2020 and was 19.6% at year end (2019: 22.8%).
Figure 4.15: PD & LGD - Construction companies
4.4% 4.5%6.2%
22.9% 22.8%
19.6%
0%
5%
10%
15%
20%
25%
2018 2019 2020
PD LGD
The realised default rate for construction companies
decreased from the previous year in 2020 and was
3.7%. The realised default rate for the sector has
been consistently below the average PD values for
the past few years.
46 Risk and Capital Management 2020

Figure 4.16: Default rate vs. PD - Constructioncompanies
0%
2%
4%
6%
2017 2018 2019 2020
Weighted PD Weighted default rate Average PD Default rate
The ratio of stage 2 loans decreased in 2020, from
19.2% to 16.2%, after having increased considerably
in 2019. The ratio of stage 3 loans increased slightly
in 2020 and was 2.7% at year-end.
Total ECL for the construction sector increased by
ISK 805 million in 2020 to a total of ISK 2,482
million at year-end.
Figure 4.17: Staging - Construction companies
6.9%
19.2%
16.2%
2.8%1.6%
2.7%0%
5%
10%
15%
20%
2018 2019 2020
Stage 2 Stage 3
4.2.4.4 Travel industry
Loans and advances to customers in the travel in-
dustry amounted to ISK 96 billion at year-end 2020
(2019: ISK 97 billion). Credit exposure to the sector
represented 8% of the Bank’s loan portfolio.
The travel industry has been severely affected by the
Covid-19 pandemic, and the average PD value for
the sector increased considerably in 2020 to 10.9% at
year-end (2019: 3.9%). A large portion of customers
in this sector have received specific Covid-19 related
moratoria (see note 4 in the Bank’s consolidated
financial statement for 2020), and their exposures
are therefore classified as forborne, and their credit
rating decreased as a result of financial difficulties.
At year-end 2020, 85% of the total gross carrying
amount in the sector had a lower credit rating than
at year-end 2019. The average LGD value for the
sector increased in 2020 and was 24.2% at year-end
(2019: 18.7%). This increase is primarily due to a
decrease in value of pledged collateral, mainly hotels
and accommodation.
Figure 4.18: PD & LGD - Travel industry
4.0% 3.9%
10.9%
19.0% 19.3%
24.2%
0%
5%
10%
15%
20%
25%
2018 2019 2020
PD LGD
The realised default rate for the travel industry was
9.7% in 2020. In comparison, the average weighted
PD value for the sector was 3.9% at year-end 2019.
Figure 4.19: Default rate vs. PD - Travel industry
0%1%2%3%4%5%6%7%8%9%
10%
2017 2018 2019 2020
Weighted PD Weighted default rate Average PD Default rate
The ratio of stage 2 loans in the sector increased
significantly in 2020. This is partly due to an in-
crease in point-in-time PD, but also due to manual
transfers of loans to stage 2 as a response to the
adverse conditions in the sector. The ratio of stage
2 loans in the travel industry was 58.6% at year-end
2020 (2019: 10.8%) and the ratio of stage 3 loans
was 11.0% (2019: 7.1%).
Total ECL for the travel industry increased by ISK
5.2 billion in 2020 to a total of ISK 8.5 billion at
year end. The increase in ECL was primarily due to
47 Risk and Capital Management 2020

an increase in point-in-time PD for loans in stage 1
and 2, and a general allowance applied to the sector.
There was an increase in stage 3 ECL by ISK 2 billion
in 2020. The general allowance in the sector was
ISK 841 million at year-end 2020.
Figure 4.20: Staging - Travel industry
11.2% 10.8%
58.6%
3.7%7.1%
11.0%
0%
10%
20%
30%
40%
50%
60%
2018 2019 2020
Stage 2 Stage 3
4.2.4.5 Mortgages
The carrying amount of mortgages to individuals in
the portfolio was ISK 518 billion at year-end 2020
(2019: ISK 392 billion). Credit exposure in mort-
gages represented 41% of the Bank’s loan portfolio
at year-end 2020 (2019: 33%). Demand for non-
indexed mortgages continued to grow in 2020, both
for new customers and existing customers refinanc-
ing due to favourable interest rates in the current
market, and at year-end 2020, non-indexed loans
represented 61% of the gross carrying amount of the
mortgage portfolio (2019: 42%), having represented
only 25% of the mortgage portfolio as recently as
2017.
Figure 4.21: Indexed vs. non-indexed mortgages
0
50
100
150
200
250
300
350
2018 2019 2020
Indexed Non−indexed
ISK bn
All mortgages must meet requirements for credit
rating, payment capacity and collateralisation limits.
For loans exceeding a certain amount, the Bank’s re-
quirements for credit ratings, payment capacity and
capital become more stringent, growing in line with
the loan amount. Mortgages to individuals fall under
the scope of the Act on Housing Loans to Consumers,
as well as external rules on the maximum loan-to-
value (LTV) ratio of real estate loans to consumers
(85%, or up to 90% for first-time buyers). In 2020,
the Bank tightened its requirements for refinancing,
setting a lower collateralisation limit for refinancing
customers than for buyers. In addition, the maxi-
mum loan term for inflation-indexed loans has been
shortened to align the debt service on such loans to
the current interest level of comparable debt service
on non-indexed loans. This is counterbalanced by
the fact that significant and rapid interest rate cuts
have given borrowers a greater scope, leading to
increased demand. It is also relevant that competi-
tion from the pension funds has until now been in
inflation-indexed loans and, with falling interest rates
on non-indexed loans, demand for non-indexed loans
has increased with a corresponding drop in demand
for inflation-indexed loans. Borrowers have increas-
ingly refinanced pension fund loans with non-indexed
credit from banks.
The loan-to-value (LTV) of mortgage loans, i.e., the
ratio of loan value to the value of the underlying
collateral had been decreasing in the past few years
as housing prices in Iceland have risen consistently,
but this ratio increased slightly in 2020, from 56.0%
to 57.7%.
Figure 4.22: Weighted average LTV - Mortgages
62.3% 59.9% 57.6% 56.0% 57.7%
0%
10%
20%
30%
40%
50%
60%
70%
2016 2017 2018 2019 2020
Figure 4.23 shows the gross carrying amount at year-
end 2020 of indexed and non-indexed mortgages and
the weighted-average LTV by year of loan origination.
48 Risk and Capital Management 2020

The figure shows how much the demand for non-
indexed mortgages has grown over the last few years.
This is primarily due to favourable interest rates for
non-indexed mortgages. The figure also shows a
high frequency of refinancing of mortgages due the
ease of refinancing costs. This leads to a high ratio
of the mortgage portfolio being recently issued loans.
The weighted-average LTV is consistent around 60%
for mortgages issued from 2017-2020.
Figure 4.23: Gross carrying amount and LTV ofmortgages at 31.12.2020 by year of loan origination
0
50
100
150
200
250
300
0%10%20%30%40%50%60%70%80%
Earlier 2017 2018 2019 2020
Indexed Non−indexed
LTV (right axis)
ISK bn
The average PD value for mortgages, continued to
decrease in 2020 and was 1.3% at year-end (2019:
1.6%). Total ECL for mortgages increased in 2020
and was ISK 1,221 million at year end (2019: ISK
848 million).
Figure 4.24: Average PD & LGD - Mortgages
1.9% 1.6% 1.3%
6.8% 6.5% 6.8%
0.0%
1.0%
2.0%
3.0%
4.0%
5.0%
6.0%
7.0%
8.0%
2018 2019 2020
PD LGD
4.2.5 Probability of default
& migration analysis
Migration analysis in this section is based on the
Bank’s rating scale and PD estimates. At year-end
2020, the total average PD weighted by gross car-
rying amount was 2.8% (2019: 2.3%). Excluding
loans to financial institutions, which as mentioned
above relates to the management of the Bank’s for-
eign liquidity reserves, average PD was 2.9% (2019:
2.4%).
The overall credit quality of the loan portfolio de-
creased in 2020. Credit quality in the individual
portfolio increased slightly during 2020 while the cor-
porate portfolio declined in credit quality during the
year. Response measures due to effects of the Covid-
19 pandemic are the biggest factor behind this high
ratio of rating downgrades for corporates. A large
part of these downgrades was in the travel indus-
try portfolio, which makes up 14% of the corporate
portfolio. In total, 85% of the gross carrying amount
of loans in the sector received general Covid-19 re-
lated moratoria in 2020, and 70% of the total gross
carrying amount received further, specific moratoria.
In turn, a large part of the travel industry portfolio
was manually downgraded in credit rating due to
financial difficulties and forbearance measures, and
at year-end 2020, 85% of the total gross carrying
amount in the sector had a lower credit rating than
at year-end 2019.
Figures 4.25 and 4.26 show the rating grade dis-
tribution of the loan portfolio for corporates and
individuals.
Figure 4.25: Rating grade distribution - Corporates
0%
10%
20%
30%
40%
10 9 8 7 6 5 4 3 2 1 0
As at 31 December 2019 As at 31 December 2020
Figure 4.26: Rating grade distribution - Individuals
0%
5%
10%
15%
20%
10 9 8 7 6 5 4 3 2 1 0
As at 31 December 2019 As at 31 December 2020
49 Risk and Capital Management 2020

Figures 4.27 to 4.29 show the rating grade migration
for corporates and individuals during 2020, based on
existing customers at year-end 2019 and 2020.
Migration is shown both in terms of number of cus-
tomers and exposure. Migration analysis does not
include customers in default, i.e. customers with a
credit rating of 0.
Figure 4.27: Rating migration of corporates in 2020
0%
10%
20%
30%
40%
50%
−4 −3 −2 −1 0 1 2 3 4
No. of customers Carrying amount
Figure 4.28: Rating migration of individuals in 2020
0%
10%
20%
30%
40%
50%
−4 −3 −2 −1 0 1 2 3 4
No. of customers Carrying amount
The rating and risk grade distribution changes pri-
marily due to three factors: changes in rating grade
for existing customers, or pure migration; different
rating grade distribution of new customers and cus-
tomers leaving the Bank compared to the rating
grade distribution of existing customers during the
comparison period; and, increased or decreased ex-
posure per rating grade to existing customers.
For individuals, the percentage of upgrades was sig-
nificantly higher than the percentage of downgrades,
both in terms of carrying amount and number of
customers. Half of the corporate portfolio remained
unchanged in terms of rating during 2020, with mi-
grations split almost evenly between upgrades and
downgrades, in terms of the number of customers.
In terms of carrying amount however, 37% of the
portfolio was downgraded while only 13% was up-
graded.
The default rate, measured by number of customers,
was 2.4% for corporate customers in 2020, as com-
pared to the estimated 4.0%. No corporate cus-
tomers in rating grades 8, 9 and 10 defaulted. The
default rate of individuals for 2020 was 1.2% as
compared to the estimated 1.4%. Estimated default
rates are based on the average through-the-cycle
(TTC) PD values for each rating category at the
start of the year. For most rating grades, both for in-
dividuals and corporates, the default rate was within
or below the PD bands, the only exceptions being
rating grade 10 for individuals and rating grade 7 for
corporates.
Figures 4.31 and 4.32 show a comparison between
realised default rates and estimated PD values at the
start of each year, weighted by gross carrying amount
and number of customers, for both corporates and
individuals.
Figure 4.31: Default rate vs. PD - Corporates
0%
1%
2%
3%
4%
5%
6%
2017 2018 2019 2020
Weighted PD Weighted default rate Average PD Default rate
Figure 4.32: Default rate vs. PD - Individuals
0%
1%
2%
3%
4%
2017 2018 2019 2020
Weighted PD Weighted default rate Average PD Default rate
Realised default rates have been consistently below
the estimated PD values both for corporates and
individuals for the past four years. The significant
change in the external economic climate during 2020
has not yet led to increased default rates for the
50 Risk and Capital Management 2020

37%
50%
13%
27%
47%
26%
24%
41%
34%
22%
45%
33%
Corporates Individuals
Carrying amount No. of customers Carrying amount No. of customers
0%
25%
50%
75%
100%
Downgrades Unchanged Upgrades
Figure 4.29: Rating migration ratios in 2020
portfolio as a whole. This is partly due to Covid-19
related moratoria that many customers took advan-
tage of during 2020. The default rates will have
to be monitored going forward, as these moratoria
expire, and customers try to recover from the effects
of the pandemic.
4.2.6 Loan impairment
Total ECL amounted to ISK 25.3 billion at year-end
2020 (thereof classified as deduction from gross car-
rying amounts: ISK 24.5 billion), as compared to
ISK 15.2 billion at year-end 2019 (thereof classified
as deduction from gross carrying amounts: ISK 14.9
billion). The increase in ECL is primarily due to
increases in PD values, both point-in-time and life-
time PD, due to deteriorating credit quality of a part
of the corporates loan portfolio and less favourable
economic scenarios. These changes lead to increased
ECL as well as increased transfers from stage 1 to
stage 2. Finally, there is also an increase in ECL in
stage 3, primarily in the travel industry, both due to
new defaults and an increase in ECL for previously
defaulted customers. Details on the development of
ECL during the year can be found in note 67 in the
Bank’s annual financial statement for 2020.
During 2020, economic scenarios used as input in
the Bank’s ECL models were frequently updated
to reflect the rapidly changing external economic
environment. Manual transfers to stage 2 were per-
formed for certain subsets of the loan portfolio, to
Corporates Individuals
10 9 8 7 6 5 4 3 2 1 10 9 8 7 6 5 4 3 2 1
0.01%
0.10%
1.00%
10.00%
100.00%
Rating grade
PD min PD max Default rate
Figure 4.30: 12-month default rate vs. probability of default band
51 Risk and Capital Management 2020

better reflect the increased credit risk in the travel
industry and for customers with active Covid-19 re-
lated moratoria. These same portfolios were also
evaluated for a potential need for the application
of general allowance. At year-end 2020, individuals
with active Covid-19 related moratoria have a general
allowance of ISK 309 million, and the travel industry
portfolio has a general allowance of ISK 841 million.
The total increase in ECL in stages 1 and 2 in 2020
was ISK 6.1 billion. 12-month ECL for loans and
advances to customers was ISK 8 billion at year-end
2020, compared to ISK 4 billion at year-end 2019.
Figure 4.33: Expected credit loss by stage
3 3 41 2
79
11
14
0
5
10
15
20
25
2018 2019 2020
Stage 1 Stage 2 Stage 3
ISK bn
ECL increased across all stages in 2020. For indi-
viduals, the total ECL increased by ISK 151 million
while ECL in the corporate portfolio increased by
ISK 9.9 billion, most notably in the travel industry.
The ratio of ECL to gross carrying amount in stage
1 decreased for individuals in 2020 but increased
significantly for corporates. A decrease in this ratio
signifies increased credit quality for performing loans
without significantly increased credit risk. The ratio
of ECL to gross carrying amount in stage 2 increased
both for individuals and corporates in 2020. The
ratio of ECL to gross carrying amount in stage 3
decreased for individuals but increased for corpo-
rates. The gross carrying amount of loans in stage 3
changed only slightly in 2020 for the total portfolio,
decreasing for individuals but increasing for corpo-
rates. The gross carrying amount of loans in stage
2 increased for corporates in 2020, but decreased
slightly for individuals, as Figure 4.37 shows.
Figure 4.34: ECL to gross carrying amount - Stage1
0.0%
0.2%
0.4%
0.6%
2018 2019 2020
Corporates Individuals Total
Figure 4.35: ECL to gross carrying amount - Stage2
0%
2%
4%
6%
2018 2019 2020
Corporates Individuals Total
Figure 4.36: ECL to gross carrying amount - Stage3
0%
10%
20%
30%
40%
2018 2019 2020
Corporates Individuals Total
Figure 4.37: Gross carrying amount in stage 2
0%
2%
4%
6%
8%
10%
12%
14%
16%
2018 2019 2020
Corporates Individuals Total
52 Risk and Capital Management 2020

4.3 Risk concentration
Concentration risk includes (i) single name concentra-
tions of large (connected) individual counterparties
and (ii) significant exposures to groups of coun-
terparties whose likelihood of default is driven by
common underlying factors, e.g. sector, economy,
geographical location, instrument type, or other.
Limit management for single name and segment con-
centrations is set, monitored and managed through
the Bank’s risk appetite and its limit management
structure. The Bank’s risk profile for concentration
risks is reported monthly to the Risk & Finance
Committee and the Board of Directors according to
internal guidelines.
The Bank uses the identification of risk concentration
in the credit portfolio as a credit risk management
parameter. Risk concentrations arise in the credit
portfolio as an inevitable consequence of the Bank’s
business strategy. Concentration risk is credit risk
related to the degree of diversification in the credit
portfolio and includes both single name concentra-
tion risk and segment concentration risk.
According to FSA Regulation No. 233/2017, on
prudential requirements for credit institutions and
investments firms, exposures to a single customer or
a group of related customers - after the deduction of
particularly secure claims - may not exceed 25% of el-
igible capital. No exposure to a single customer or a
group of related customers exceeded 25% in the year
2020, and at year end, the largest single-customer
exposure was well below 25%.
The Bank’s risk profile for large exposures is mon-
itored daily by Risk management and is reported
monthly to Managing Directors and the Board of
Directors.
As for single name concentration, the Bank’s Board
of Directors sets portfolio limits for segment concen-
tration in the Bank’s risk appetite.
At year-end 2020, lending to individuals represented
47% of the Bank’s total credit exposure (2019: 41%).
Most of the demand from individuals is for mortgages,
and the Bank’s lending to individuals is therefore
mostly secured by real estate.
The Bank’s credit exposures are primarily to Icelandic
corporate customers. Companies in the fisheries, real
estate, travel industry and construction sectors rep-
resent the largest exposure to single industry sectors.
Customers domiciled in Iceland accounted for 97% of
the Bank’s total credit exposure, excluding exposures
to financial institutions, in 2020 (2019: 97%). The
majority of exposures to foreign counterparties relate
to the management of the Bank’s foreign liquidity
reserves, and are classified as loans and advances to
financial institutions.
The Bank estimates sector concentration risk as the
difference between sector concentration for Iceland
and the sector concentration in the Bank’s portfolio.
Figure 4.40 shows a comparison of industry concen-
tration between the Bank’s portfolio and the portfo-
lios of all Icelandic banks as a whole. Data for Iceland
is from the Central Bank of Iceland. Note that this
sector classification includes the travel industry as
part of the services sector.
Figure 4.38: Large exposure between 10% and 20%of the Group’s eligible capital
0%
10%
20%
30%
40%
0
1
2
3
4
2018 2019 2020
Large exposures to eligible capital (left axis)
Number of large exposure (right axis)
Figure 4.39: Loans and advances by geographicalarea
As at 31 December 2019 As at 31 December 2020
Domestic Foreign Domestic Foreign0
200
400
600
800
1,000
1,200
1,400
Loans and advances to financial institutions
Loans and advances to customers
ISK bn
53 Risk and Capital Management 2020

0%
10%
20%
30%
Agricu
lture
Constr
uctio
n co
mpa
nies
Fisher
ies
Holding
com
panie
sIT
C*
Man
ufactu
ring
Real e
state
com
panie
s
Retail
Servic
es
2020 Iceland 2020 Landsbankinn 2019 Landsbankinn
∗ITC consists of corporations in the information, technology and communication sectors
Figure 4.40: Industry concentration
54 Risk and Capital Management 2020

5 Market risk
5.1 Market risk management and policy 56
5.2 Control and monitoring . . . . . . 57
5.3 Market risk exposure . . . . . . . . 57
5.4 Measuring market risk . . . . . . . 57

Market risk
Market risk is the risk that changes in mar-
ket prices will adversely impact the fair value
or future cash flows of financial instruments.
Market risk arises from open positions in cur-
rency, equities and interest rate products, all
of which are exposed to general and specific
market movements and changing volatility
levels in market rates and prices, for instance
in interest rates, inflation, foreign exchange
rates and equity prices.
] The Bank’s market risk increased in 2020,
first and foremost due to extreme volatility
in equity markets following the Covid-19
pandemic, whereas exposure in the Bank’s
trading portfolios increased only temporar-
ily due to market making activities.
] Total market risk in the Bank’s trading
book together with foreign exchange risk
and CVA risk, as measured by economic
capital, was ISK 3.3 billion at year-end
2020, compared to ISK 2.3 billion at the
end of 2019.
] The Bank’s market risk remains modest
and well within the Bank’s risk appetite.
EC - Market risk
0.8
1
0.5
1
1.7
0.5
0
0
0
1
2
3
31 December 2019 31 December 2020
CVA FX Equities Interest rates
ISK bn
5.1 Market risk management
and policy
The Board of Directors is responsible for determining
the Bank’s market risk appetite, and the CEO and
the Risk & Finance Committee are responsible for
developing market risk management policies and pro-
cedures and setting market risk limits. Market risk
is managed centrally by Treasury as well as within
trading units, in accordance with the Bank’s policies,
limits and risk appetite. Together, the risk appetite
of the Bank and the market risk policies set the
overall limits for market risk management within the
Bank in accordance with the Bank’s three lines of
defence principle.
The Bank separates its exposure to market risk into
trading and non-trading portfolios, managing each
separately. Trading portfolios include positions aris-
ing from market-making, derivative sales and propri-
etary position-taking. Non-trading portfolios include
positions arising from the Bank’s retail and commer-
cial banking operations, proprietary position-taking
as part of asset and liability management, and fund-
ing transactions, managed by Treasury. Treasury
is also responsible for daily liquidity management,
which entails exposure to market risk.
56 Risk and Capital Management 2020

Market risk mitigation reflects the Bank’s overall risk
appetite by identifying the target level for market risk
factors and to limit exposure in line with the Bank’s
risk appetite. Other market risk mitigation plans
are made on a case-by-case basis involving hedging
strategies and risk reduction through diversification.
5.2 Control and monitoring
The aim of the market risk management process
is to ensure that market risk levels are within the
Bank’s risk appetite and mitigate the risk of losses
while maintaining acceptable profitability. This en-
tails quickly detecting and correcting deficiencies
in compliance to policies, processes and procedures
along with limit monitoring, handling limit breaches,
risk modelling and reporting. The Bank monitors
various indicators that can provide warning of an
increased risk of future losses. Market risk indicators
need to be concise, reported in a timely manner, give
clear signals, and highlight portfolio risk concentra-
tions and reflect current risk positions. Risk reports
show the Bank’s total risk in addition to summaris-
ing risk concentration in different business units and
asset classes, as well as across other attributes, as
appropriate, pursuant to the Bank’s activities.
Market risk arising from trading and non-trading
activities is measured, monitored and reported on
a daily, weekly and monthly basis. The market risk
limits set by the Risk & Finance Committee are mon-
itored by Market Risk, and exceptions and breaches
of limits are reported on a regular basis to the Risk
& Finance Committee and other relevant parties as
necessary. Furthermore, summarised reports high-
lighting market risk, risk appetite measurements and
any concerns regarding market risk are sent to the
Board of Directors on a regular basis.
5.3 Market risk exposure
Table 5.1 summarises the Bank’s exposure to market
risk at year-end 2020.
The Bank also faces counterparty credit risk aris-
ing from derivative contracts and securities financing
transactions with customers and financial institutions.
Counterparty credit risk is, however, very low com-
pared to other credit risk and is mitigated through
strict collateral requirements and limits. Further in-
formation about the Bank’s exposure to counterparty
credit risk can be found in the additional disclosures
accompanying this document (see also 4.1.4.1).
5.3.1 Banking book exposures
The banking book exposures of the Bank pertaining
to market risk are exposures in equities and bonds.
The vast majority of the equities are unlisted and are,
for the most part, legacy positions obtained through
corporate restructuring, or acquired when the Bank
was established in 2008. The bond holdings in the
banking book are comprised of strategic investments
and liquidity management instruments. Capital re-
served against these exposures is classified as credit
risk.
5.4 Measuring market risk
The Bank uses risk exposure amounts (REA) and
economic capital (EC) as a common denominator
for measuring risk across different asset classes, in-
cluding those assets subject to market risk. Risk
exposure amounts are determined by applying spe-
cific risk weights to the Bank’s assets, according to
capital requirement regulations. Several other indi-
cators are used as measures of market risk as well,
including Value-at-Risk (VaR), profit and loss analy-
Table 5.1: Total net exposure subject to market risk
Net position at year-end
2020 2019
Equities and equity instruments in the trading book 1,951 1,759
Bonds and debt instruments in the trading book 4,272 5,924
FX balance 3,939 2,989
57 Risk and Capital Management 2020

sis, delta positions and net positions across different
attributes such as the currency and issuer. These risk
measurements are supplemented by specific stress
tests and scenario analyses as appropriate, taking
the Bank’s balance sheet composition and operating
environment into account.
Total market risk, measured as the ratio of risk expo-
sure amounts to total REA, remains low, amounting
to 1% at year-end 2020 (compared to 1.2% at year-
end 2019), well within the Bank’s risk appetite.
Figure 5.1: Total market risk (ratio to total REA)
0.0%
0.0%
0.0%0.0%
0.0%
0.4%
0.3%
0.2% 0.4% 0.4%
0.4%
0.7%
0.3%0.3%
0.2%
0.4%0.6%
0.4% 0.4% 0.3%
0.0%
0.5%
1.0%
1.5%
2.0%
Q4 2019 Q1 2020 Q2 2020 Q3 2020 Q4 2020
CVA FX
Equities (trading book) Interest rate (trading book)
5.4.1 Equity price risk in the trading
book
Equity price risk is the risk of equity value fluctua-
tions due to open positions in equity-based instru-
ments. The Bank’s equity trading portfolio is com-
prised of proprietary trading positions and exposures
due to market making, including equity derivatives
and hedging positions. All equity-based derivative
contracts are usually fully hedged with regards to
market risk and are subject to various, strict limit
requirements.
5.4.2 Interest rate risk in the trading
book
Interest rate risk is the risk of loss arising from the
impact of adverse changes in market interest rates.
The Bank’s trading portfolios contain exposures due
to market making and proprietary trading, highly
concentrated on government-guaranteed bills/bonds,
as well as covered bonds and fixed income derivatives.
As with equity-based derivatives, all fixed income
derivative contracts are usually fully hedged with
regards to market risk and are subject to strict limit
requirements.
5.4.3 Interest rate risk in the banking
book
Interest rate risk in the banking book is the current
or prospective risk to earnings and capital arising
from adverse movements in interest rates. Changes
in interest rates on the Bank’s assets and liabilities
impact its interest rate margin and/or the value of
its equity. This risk is primarily the result of duration
mismatch of assets and liabilities. Net positions of
assets and liabilities in the banking book by the in-
terest rate fixing period, at year-end 2020 and 2019,
are shown in Table 5.3.
The Bank employs a monthly stress test of the in-
terest rate risk in the banking book by measuring
the impact of shifting the relevant interest rates for
every currency on the fair value of all interest-rate
sensitive assets and liabilities in the banking book.
Table 5.2: Total market risk (REA measure) at year end
2020 2019
REA Ratio toREA
REA Ratio toREA
Equity price risk in the trading book 3,913 0.3% 3,807 0.4%
Interest rate risk in the trading book 2,613 0.2% 3,658 0.4%
Foreign exchange risk 4,828 0.4% 1,183 0.4%
CVA risk 172 0.0% 106 0.0%
Total 11,526 1.0% 11,754 1.2%
58 Risk and Capital Management 2020

Table 5.3: Assets and liabilities in the banking book by interest rate fixing period
Net position at year-end 2020
Up to 3 M 3-12 M 1-5 Y Over 5 Y Total
Total assets 1,189,237 140,748 160,009 31,595 1,521,589
Total liabilities 927,203 18,529 282,418 67,921 1,296,071
Net on-balance sheet position 262,034 122,219 -122,409 -36,326 225,518
Effect of derivatives held for riskmanagement
-93,660 0 93,660 0 0
Net off-balance sheet position 26,501 -24,501 -2,000 0 0
Total interest repricing gap 194,876 97,718 -30,749 -36,327 225,517
Net position at year-end 2019
Up to 3 M 3-12 M 1-5 Y Over 5 Y Total
Total assets 1,037,797 152,484 148,684 44,747 1,383,712
Total liabilities 814,888 29,736 253,301 62,708 1,160,632
Net on-balance sheet position 222,909 122,748 -104,618 -17,961 223,079
Effect of derivatives held for riskmanagement
-85,357 3,877 81,480 0 0
Net off-balance sheet position 16,143 10,192 -24,335 -2,000 0
Total interest repricing gap 153,696 136,817 -47,473 -19,961 223,079
Table 5.4 summarises the sensitivity of the Bank’s
banking book fair value resulting from a flat 100
bps upward and downward shift of all yield curves
at year-end.
5.4.4 Foreign exchange risk
Foreign exchange risk (FX risk) is the risk of loss due
to exchange rate fluctuations. Foreign exchange risk
within the Bank may arise from holding assets in one
currency and liabilities in another, or from a spot
or forward foreign exchange trade, currency swaps
or other currency contracts that are not matched
with an offsetting contract. The net FX balance at
year-end 2020 and 2019 can be seen in Table 5.5.
Figure 5.2: Net FX balance
1.2%
−0.6%−0.2%
0.4%
1.5%
−2
0
2
4
−2%
0%
2%
4%
Q4 2019 Q1 2020 Q2 2020 Q3 2020 Q4 2020
% of capital base (right axis)
Net FX balance (left axis)
ISK bn
Table 5.4: Interest rate risk (fair value sensitivity) in the banking book at year-end
2020 2019
+100 bps -100 bps +100 bps -100 bps
ISK non-indexed -102 94 205 -248
ISK indexed 4,366 -4,293 4,437 -4,510
EUR 2,074 -2,184 1,405 -1,478
SEK 14 -14 141 -142
USD -74 74 28 -28
Other 14 -14 31 -31
Total 6,293 -6,337 6,247 -6,437
59 Risk and Capital Management 2020

Table 5.5: Net FX balance
Net position at year-end
2020 2019
CHF 174 -142
EUR 933 2,540
GBP 233 489
JPY 88 -21
USD 2,422 335
Other 89 -212
Total 3,939 2,989
5.4.5 Other market risk
Other market risk within the Bank is comprised of
indexation risk and risk due to credit valuation ad-
justment (CVA).
CVA is an adjustment to the fair value (or price) of
derivative instruments to account for counterparty
credit risk. The derivative contracts the Bank enters
into that entail CVA risk are well collateralised, re-
ducing CVA risk. Hence, the Bank’s CVA risk is low
and considered immaterial.
Indexation risk is the risk that the fair value or future
cash flows of CPI-indexed financial instruments may
fluctuate due to changes in the Icelandic CPI index.
Mismatched CPI-linked assets and liabilities expose
the Bank to indexation risk. The Bank’s total CPI
indexation balance continued to decrease in 2020,
amounting to ISK 68 billion at year-end 2020 as
compared to ISK 129 billion at year-end 2019. This
decrease mainly stems from indexed borrowing, de-
creased lending in CPI-linked loans and customers
refinancing indexed mortgages.
Figure 5.3: Indexation imbalance
52%47%
43%37%
26%
0
20
40
60
80
100
120
140
0%
10%
20%
30%
40%
50%
60%
70%
Q4 2019 Q1 2020 Q2 2020 Q3 2020 Q4 2020
% of equity (right axis)
Net indexation imbalance (left axis)
ISK bn
60 Risk and Capital Management 2020

6 Liquidity risk
6.1 Identification . . . . . . . . . . . . 62
6.2 Assessment . . . . . . . . . . . . . 63
6.3 Management . . . . . . . . . . . . 66
6.4 Control and monitoring . . . . . . 66
6.5 Funding profile . . . . . . . . . . . 67

Liquidity risk
Liquidity risk is the risk that the Bank will
encounter difficulty in meeting its financial
liability obligations with cash or other finan-
cial assets, or having to do so at excessive
cost. This risk arises from earlier maturities
of financial liabilities than financial assets.
] Liquidity risk is identified as one of the
Bank’s key risk factors and great empha-
sis is placed on liquidity risk management
within the Bank, which is reflected in both
its risk appetite as well as in internal liq-
uidity management policies and rules. The
Bank’s policy remains to sustain a strong
liquidity position in the near- and longer-
term as is reflected in the Bank’s business
plan.
] The Bank’s liquidity position is sound and
well above regulatory requirements and the
Bank’s risk appetite. The total liquidity
coverage ratio was 154% at year-end 2020
(year-end 2019: 161%) and the Bank’s
LCR in foreign currencies was 424% (year-
end 2019: 769%) and 105% in ISK (year-
end 2019: 61%).
] Uncertainties introduced by Covid-19 and
increased market volatility have not had
a material impact on the Bank’s liquidity
position and the Bank did not experience
increased drawdown of credit facilities nor
an increase in deposit outflows.
Total liquidity coverage ratio
161% 154%
0
20
40
60
80
100
120
140
160
180
31 December 2019 31 December 2020
%
6.1 Identification
The Board sets a liquidity management policy for
the Bank. Liquidity risk management refers to the
internal policies and procedures containing quantita-
tive and qualitative objectives, limits and reporting
put in place. The policy describes how the Bank
identifies, evaluates, measures, monitors, manages
and reports its liquidity. The policy clearly outlines
the structure, responsibilities and controls for man-
aging liquidity risk within the Bank and includes a
liquidity contingency plan. The contingency plan
62 Risk and Capital Management 2020

provides a framework for detecting an upcoming
liquidity event with predefined early warnings and
actions for preventing temporary or longer-term liq-
uidity disruptions.
6.2 Assessment
The Bank measures two key indicators, LCR and
NSFR, to monitor and manage short-term liquidity
risk and medium to long-term liquidity risk, respec-
tively.
6.2.1 Liquidity coverage ratio (LCR)
The Bank measures the liquidity coverage ratio
(LCR) as a key indicator for short-term liquidity.
The objective of the ratio is to promote short-term
resilience by ensuring that the Bank has sufficient
high-quality liquid assets to withstand a significant
stress scenario lasting 30 calendar days. Quanti-
tative information on the Bank’s LCR at year-end
2020 is shown in the EU LIQ1 template on the follow-
ing page. Further information can be found in the
additional disclosures accompanying this document.
Table 6.1 shows the Bank’s deposit base at year-end
2020. Runoff rates are used to estimate deposit
outflows under stressed conditions for the next 30
calendar days and are set according to liquidity rules
No. 266/2017. Figure 6.1 and Figure 6.2 show
further breakdown of the Bank’s deposit base.
Figure 6.1: Total deposits by maturity
75%
25%
0−30 days maturity Over 30 days maturity
Figure 6.2: 0-30 days maturity deposits by groups∗
2% 1%9%
16%3%
5%
24%16%
12% 10%
50% 51%
0%
10%
20%
30%
40%
50%
60%
70%
80%
90%
100%
2019 2020
Pledged Financial customers
Government Large corporates
Small and medium−sized corporates Individuals
∗According to the Central Bank‘s Rules on Liquidity Coverage
Requirements.
Table 6.1: Total deposits by groups
As at 31 December 2020 Runoff rate 0-30 days Over 30 days Total
Retail deposits
Individuals 5-100% 320,408 111,226 431,634
Small and medium-sized corporates 5-100% 78,887 7,092 85,979
Operational deposits 5-25% 0 0 0
Non-operational deposits
Large corporates 20-40% 116,435 20,269 136,704
Government 20-40% 35,071 8,041 43,112
Financial customers 100% 68,961 64,280 133,241
Other∗ 11,082 399 11,481
Total deposits 630,844 211,307 842,151∗Include pledged deposits not included in the Group’s consolidated financial statement.
63 Risk and Capital Management 2020

Table 6.2: EU LIQ1 template
Totalunweighted
value∗
Total weightedvalue∗
31.12.2020 31.12.2020
Number of data points used in the calculation of averages 12 12
High-quality liquid assets
1 Total high-quality liquid assets (HQLA) - 169,286
Cash-outflows
2 Retail deposits and deposits from small businesscustomers, of which:
371,883 28,879
3 Stable deposits 203,383 10,169
4 Less stable deposits 168,501 18,710
5 Unsecured wholesale funding 222,295 131,840
6 Operational deposits (all counterparties) anddeposits in networks of cooperative banks
0 0
7 Non-operational deposits (all counterparties) 218,194 127,738
8 Unsecured debt 4,102 4,102
9 Secured wholesale funding - 0
10 Additional requirements 91,695 10,939
11 Outflows related to derivative exposures and othercollateral requirements
2,560 2,560
12 Outflows related to loss of funding on debtproducts
457 457
13 Credit and liquidity facilities 88,678 7,921
14 Other contractual funding obligations 1,881 0
15 Other contingent funding obligations 32,014 6,915
16 Total cash outflows - 153,609
Cash-inflows
17 Secured lending (e.g. reverse repos) 0 0
18 Inflows from fully performing exposures 110,938 84,110
19 Other cash inflows 7,919 1,869
EU-19a
(Difference between total weighted inflows and totalweighted outflows arising from transactions in thirdcountries where there are transfer restrictions orwhich are denominated in non-convertiblecurrencies)
- 0
EU-19b (Excess inflows from a related specialised creditinstitution)
- 0
20 Total cash inflows 118,857 85,979
EU-20a Fully exempt inflows 0 0
EU-20b Inflows subject to 90% cap 0 0
EU-20c Inflows subject to 75% cap 118,857 85,979
Total adjustedvalue
21 Liquidity buffer - 169,286
22 Total net cash outflows - 92,593
23 Liquidity coverage ratio (%) - 183%∗EU LIQ1 template; values are a simple arithmetic average of end of month data for each month in the previous year.
64 Risk and Capital Management 2020

The Central Bank of Iceland changed the Rules on
Liquidity Coverage Requirements for Credit Institu-
tions in December 2019, effective as of 1 January
2020. The changes include a new minimum re-
quirement for the liquidity coverage ratio in ISK
(LCR-ISK). The implementation of the new mini-
mum requirement is according to a schedule set forth
by the Central Bank which requires the Bank to have
a minimum LCR-ISK of 30% as of 1 January 2020,
40% as of 1 January 2021 and 50% as of 1 January
2022. The Central Bank lengthened the adaption
period by one year in December 2020 to further ease
access to liquidity in ISK due to prevailing economic
uncertainty as a result of the pandemic. Hence, the
minimum LCR in ISK will be 40% as of 1 January
2022 and 50% as of 1 January 2023.
Liquidity coverage ratio in ISK is a part of the Bank’s
liquidity management policy and the Bank’s risk ap-
petite, which together define target levels and con-
straints for liquidity management in ISK. During
2020, the Bank has strengthened its liquidity ratio
in ISK, in line with the Bank’s risk appetite and the
implementation schedule set forth by the Central
Bank. Figure 6.5 shows the development of the
Bank’s LCR in ISK.
Figure 6.3: Liquidity coverage ratio (total)
161%
196% 191% 202%
154%
0%
50%
100%
150%
200%
250%
Q4 2019 Q1 2020 Q2 2020 Q3 2020 Q4 2020
LCR total Regulatory requirement
Figure 6.4: Liquidity coverage ratio (FX)
769%
489% 476%384% 424%
0%
100%
200%
300%
400%
500%
600%
700%
800%
Q4 2019 Q1 2020 Q2 2020 Q3 2020 Q4 2020
LCR FX Regulatory requirement
Figure 6.5: Liquidity coverage ratio (ISK)
61%
96%
114% 114%105%
0%
20%
40%
60%
80%
100%
120%
Q4 2019 Q1 2020 Q2 2020 Q3 2020 Q4 2020
LCR ISK
6.2.2 Net stable funding ratio (NSFR)
The net stable funding ratio has a longer time hori-
zon. Its objective is to capture structural issues in
the balance sheet with the aim to provide a sustain-
able maturity structure of assets and liabilities. The
aim of NSFR is to promote more medium and long-
term funding. It establishes a minimum acceptable
amount of stable funding based on the Bank’s liquid-
ity risk profile and limits over-reliance on short-term
wholesale funding.
NSFR is defined as the ratio between the amount of
available stable funding to the amount of required
stable funding. Available stable funding is defined
as the portion of capital and liabilities expected to
be reliable over the time horizon considered by the
NSFR. The amount of such stable funding required
of the Bank is a function of the liquidity characteris-
tics and residual maturities of the various assets held
by the institution, as well as those of its off-balance
sheet (OBS) exposures. The Bank’s total NSFR was
116% at year-end 2020 (year-end 2019: 117%), and
the NSFR in foreign currencies was 132% (year-end
2019: 143%).
Figure 6.6: Net stable funding ratio (total)
117% 115% 117% 116% 116%
0%
20%
40%
60%
80%
100%
120%
Q4 2019 Q1 2020 Q2 2020 Q3 2020 Q4 2020
NSFR total
65 Risk and Capital Management 2020

Figure 6.7: Net stable funding ratio (FX)
144%127% 121% 123%
132%
0%
20%
40%
60%
80%
100%
120%
140%
160%
Q4 2019 Q1 2020 Q2 2020 Q3 2020 Q4 2020
NSFR FX Regulatory requirement
6.3 Management
The objective of the liquidity management policy is
to ensure that sufficient liquid assets and funding are
available to meet financial obligations and sustain
withdrawals of deposits in a timely manner and at a
reasonable cost, even under stressed conditions.
The policy aims to ensure that the Bank does this
by maintaining an adequate level of unencumbered,
high-quality liquid assets that can readily be con-
verted into cash. The Bank has also implemented
stringent stress tests that have a realistic basis in the
Bank’s operating environment to further measure
the Bank’s ability to withstand different and adverse
scenarios of stressed operating environments.
Figure 6.8: Liquidity management process
The Bank’s liquidity risk is managed centrally by
Treasury and is monitored and reported by Market
Risk, allowing management to monitor and man-
age liquidity risk throughout the Bank. The Risk
& Finance Committee monitors the Bank’s liquidity
risk, while the Bank’s Internal Audit function as-
sesses whether the liquidity management process is
designed properly and is operating effectively.
The Bank’s liquidity management process entails pro-
cedures, measurements, monitoring and reporting
of both short-term and longer-term liquidity risk as
well as structural issues in the balance sheet. An in-
tegral part of the management process is conducting
forward-looking analysis to estimate future liquid-
ity position, taking the Bank’s commitments into
account.
6.4 Control and monitoring
The Bank’s Treasury Department is responsible
for day-to-day liquidity management, which entails
closely monitoring current trends and potential mar-
ket developments that may present significant and
complex challenges for the Bank’s liquidity strategy.
Liquidity risk is primarily controlled through limits
set in the Bank’s risk appetite and the Bank’s liq-
uidity management policy. Limit management is
supplemented by regular monitoring and reporting of
liquidity position under normal and stressed business
conditions.
The Risk Management Division regularly evaluates
the Bank’s liquidity position and monitors internal
and external events and factors that may affect the
liquidity position.
6.4.1 Liquidity Contingency Plan
The Bank has a contingency plan in place, which
is set to provide a framework for detecting an up-
coming liquidity event with predefined early warning
indicators and actions for preventing temporary or
longer-term liquidity disruptions.
The Liquidity Contingency Plan stipulates the ac-
tions that shall be taken to monitor the likelihood or
imminence of the occurrence of a liquidity event or
a confidence crisis. It also includes a detailed action
plan and procedures for managing a liquidity event.
The Contingency Plan includes the following items:
] A list of potential confidence crisis scenarios
66 Risk and Capital Management 2020

and their likely effects on the Bank’s liquidity
position.
] A list of potential liquidity events and their
effects on the Bank’s liquidity management.
] Various management actions aimed at resolv-
ing liquidity disruptions.
The contingency plan is supplemented by the mon-
itoring of early warning indicators along with their
defined warning and trigger levels to detect potential
liquidity problems. These early warning indicators
are either internal, such as changes in the Bank’s bal-
ance sheet composition, decreasing liquidity ratios,
deposit outflows or a downward trend in financial
ratios, or external, such as rating downgrades, third
party evaluations or market price fluctuations. The
Bank determines four levels of stress for each early
warning indicator. These four levels of stress are
risk alert levels and each level further indicates the
increasing likelihood of funds leaving and increased
likelihood of a liquidity event. The indicators are
monitored weekly by the Risk and Finance Commit-
tee and reviewed at least annually by the Board of
Directors.
6.5 Funding profile
The Bank continued to be an active issuer on the do-
mestic bond market with issuance of covered bonds
and commercial paper. Furthermore, the Bank is-
sued bonds in foreign currencies under its EMTN
programme.
In April 2020, the Bank’s credit rating was lowered
to BBB/A-2 with stable outlook.
6.5.1 Funding
The Bank’s funding rests on three main pillars. De-
posits from customers are the Bank’s primary funding
source but the Bank is also funded through bor-
rowing in the form of bond issuance, both in the
international markets in foreign currencies as well
as in the domestic market in ISK. Furthermore, the
Bank is funded with contributions from owners in
the form of equity. Figure 6.9 shows the breakdown
of the Bank’s borrowings while Figure 6.10 shows
the Bank’s funding structure as at year-end 2020
and 2019.
Figure 6.9: Borrowings and subordinated liabilities
0
20
40
60
80
100
120
140
160
180
200
220
Senior unsecured
debt
Covered bonds CPI
Covered bonds
Other unsecured
liabilities
Subordin− ated
liabilities
Commerical paper
31.12.2019 31.12.2020
ISK bn
Figure 6.10: Funding profile - ISK billions
48
708
373
1930
248
49
793
420
2122
258
0%
25%
50%
75%
100%
31.12.2019 31.12.2020
Deposits from financial institutions Deposits from customers
Borrowing Subordinated liabilities
Other liabilities Equity
6.5.2 Deposits from customers
The largest part of the Bank’s funding is in the form
of deposits from customers, which increased by 86
billion in 2020 and amounted to ISK 793 billion at
year end. Inflation-linked deposits amounted to ISK
126 billion at year-end 2020, increasing by ISK 6
billion from previous year, whereas non-indexed on
demand (up to 30 days) deposits amounted to 551
billion at year end, increasing by ISK 83 billion.
67 Risk and Capital Management 2020

6.5.3 Borrowings
6.5.3.1 EMTN Programme and other unse-
cured loans
In February, the Bank issued a 4.25-year bond for
EUR 300 million against a buy-back of bonds matur-
ing in March 2021 for EUR 300 million. In October,
the Bank issued 3-year bonds for SEK 500 million
and NOK 500 million. In November, bonds in the
amount of SEK 2,600 million and NOK 300 million
matured and the remaining outstanding principal
was paid in full on the maturity date. At year-end
2020, bond issuance in foreign currency amounted
to ISK 227 billion, increasing by ISK 4 billion during
the year. Other unsecured loans in foreign currency
amounted to ISK 19 billion at the same time.
6.5.3.2 Covered bonds
The size of the programme for covered bond issuance
is ISK 250 billion and was increased from ISK 200
billion in 2020. The covered bond issuance is primar-
ily intended to fund the Bank’s mortgage portfolio
and to mitigate interest rate risk. Regular auctions
of covered bonds were held in 2020 where previously
issued bonds were tapped and two new bond se-
ries issued, one non-indexed series, LBANK CB 25,
and one inflation-linked, LBANK CBI 26. No cov-
ered bond series matured in 2020. Agreements with
market makers in the secondary market for covered
bonds were renewed in the year. At year-end 2020,
outstanding covered bonds issuance amounted to
ISK 189 billion, increasing by ISK 49 billion during
the year.
Figure 6.11: Maturity profile
0102030405060708090
100
2020 2021 2022 2023 2024 2025 2026 2027 2028 2029
ISK FX
ISK bn
6.5.3.3 Commerical paper
No commercial paper auctions were held in 2020
under the ISK 50 billion debt issuance programme.
Two series of commercial paper matured in 2020, in
a total amount of ISK 3,640 million. There was no
outstanding issuance of commercial paper at year-
end 2020.
6.5.3.4 Subordinated bond issuance
Subordinated bond issuance under the Bank’s debt
issuance programme amounted to ISK 5.5 billion at
year end and subordinated issuance under the Bank’s
EMTN programme amounted to EUR 100 million at
the same time.
6.5.3.5 Equity
The Bank’s equity was ISK 258 billion at year-end
2020, increasing by ISK 10.5 billion over the course
of the year, and the Bank’s total capital ratio was
25.1%.
6.5.4 Asset encumbrance ratio
The Bank’s liquidity and funding risk framework in-
cludes measures of encumbered assets as a ratio
to total assets. Encumbered assets are primarily
comprised of loans and advances which are pledged
against covered bonds and secured bonds issued by
the Bank. Other encumbered assets are pledged as
collateral to the Central Bank, pledged as collateral
to secure trading lines, and credit support for GM-
RA/ISDA master agreements and other pledges of
similar nature. The Bank’s asset encumbrance ratio
remains low.
Figure 6.12: Asset encumbrance ratio
13.4% 13.9%14.7% 15.3% 15.7%
191 212 221 246 246
1,235 1,311 1,280 1,365 1,318
0200400600800
1,0001,2001,4001,6001,800
0%2%4%6%8%10%12%14%16%18%
Q4 2019 Q1 2020 Q2 2020 Q3 2020 Q4 2020
Unencumbered assets Encumbered assets
Asset encumbrance ratio (right axis)
ISK bn
68 Risk and Capital Management 2020

Table 6.3: EMTN Programme
As at 31 December 2020 Currency Finalmaturity
Outstandingprincipal
Contractualinterest rate
Senior unsecured
LBANK 1.625 03/21 EUR 15.03.2021 200 FIXED 1.625%
LBANK FLOAT 02/22 NOK 21.02.2022 1,000 NIBOR + 1.75%
LBANK FLOAT 02/22 SEK 21.02.2022 500 STIBOR + 1.75%
LBANK 1.375 03/22 EUR 14.03.2022 300 FIXED 1.375%
LBANK 1.00 5/23 EUR 30.05.2023 300 FIXED 1.0%
LBANKFL1023 NOK 19.10.2023 500 NIBOR + 1.55%
LBANKFL1023 SEK 19.10.2023 500 STIBOR + 1.55%
LBANK 0.5 5/24 EUR 20.05.2024 300 FIXED 0.5%
Subordinated
LBANK 3.125 28NC23 T2 EUR 06.09.2028 100 FIXED 3.125%
Table 6.4: Covered bonds
As at 31 December 2020 Currency Final maturity Outstandingprincipal
Contractualinterest rate
Non-indexed
LBANK CB 21 ISK 30.11.2021 5,860 5.50%
LBANK CB 23 ISK 23.11.2023 37,800 5.00%
LBANK CB 25 ISK 17.09.2025 10,240 3.40%
Indexed
LBANK CBI 22 ISK 28.04.2022 19,540 3.00%
LBANK CBI 24 ISK 15.11.2024 38,120 3.00%
LBANK CBI 26 ISK 20.11.2026 10,140 1.50%
LBANK CBI 28 ISK 04.10.2028 48,280 3.00%
69 Risk and Capital Management 2020

7 Operational risk
7.1 Control . . . . . . . . . . . . . . . 72
7.2 Measurement and mitigation . . . 72
7.3 Compliance risk . . . . . . . . . . 73
7.4 Conduct risk . . . . . . . . . . . . 74
7.5 Covid-19 . . . . . . . . . . . . . . 74
7.6 Environmental, social and gover-
nance risk . . . . . . . . . . . . . 74
7.7 Outsourcing and product governance 74
7.8 Model risk management . . . . . . 75
7.9 Cybersecurity risk . . . . . . . . . 75

Operational risk
Operational risk is defined as the risk of loss
resulting from inadequate or failed internal
processes, people and systems or from ex-
ternal events.
] There were 23% fewer operational inci-
dents in 2020 compared to 2019.
] There was an 8% increase in loss incidents
in 2020 compared to 2019.
] The Covid-19 pandemic led to the major-
ity of the Bank’s employees working from
home for a large part of 2020.
EC - Operational risk
2 2
8 8
0
2
4
6
8
10
12
2019 2020
Legal and compliance risk Operational risk
ISK bn
The Bank is exposed to operational risk through its
activities. Loss may result from inadequate or failed
internal processes, people and systems, or from exter-
nal events. This includes factors such as information
and communication technology risk (ICT), conduct
risk, model risk, compliance risk and risk involved
with outsourcing.
ICT risk is the risk of loss due to a breach of confiden-
tiality, failure of integrity of systems and data, and
unavailability of systems and data within a reason-
able time frame. This includes cyber risk. Conduct
risk involves the risk of financial loss due to human
error, neglect or fraud in relation to the Bank’s cus-
tomers. Effective model risk management involves
reducing the risk of flaws in the development, im-
plementation and use of models. Compliance risk
is the exposure of the Bank to legal penalties and
reputational damage if it fails to act in accordance
with laws and regulations, internal policies and pre-
scribed best practices. Outsourcing risk is the risk
involved in outsourcing important functions and loss
of control over those functions. These factors are
all relevant in the Bank’s current environment.
The Bank identifies the types of operational risk to
which it is exposed in order to better understand its
operational risk profile and assess its vulnerability
to these risks. The aim is to identify and assess
the operational risk inherent in all existing or new
material products, activities, processes and systems.
Effective operational risk identification and assess-
ment processes are crucial in establishing a frame-
work for operational risk monitoring and control.
In identifying operational risk, the Bank exam-
ines both internal and external factors that could
adversely affect its performance and prevent the
achievement of its objectives, such as:
] Risk culture, human resource management
practices, organisational changes and employee
turnover
] The nature of the Bank’s customers, products,
contractors and activities, including sources of
business, distribution mechanisms and volume
of transactions
] The design, implementation, review and op-
eration of the processes and systems involved
in the operating cycle of the Bank’s products
and activities
] The external operating environment and in-
dustry trends, including political, legal, tech-
nological and economic factors, as well as the
competitive environment and market structure.
71 Risk and Capital Management 2020

7.1 Control
The Board of Directors sets the Bank’s policy re-
garding operational risk and risk appetite. The oper-
ational risk rules set out the policy regarding opera-
tional risk, the roles and responsibilities of stakehold-
ers in the Bank and the operational risk tolerance in
terms of limits.
The Operational Risk Committee is responsible for
all risk relating to operational risk, including ICT
risk and physical security. All rules connected to
the remit of the Operational Risk Committee are
approved by it.
The Operational Risk Department, which is respon-
sible for developing and maintaining the framework
for managing operational risk and supporting the or-
ganisation in the implementation of the framework,
is a part of the Risk Management Division. This
framework includes the Bank’s business continuity
plans and the security system for online banking.
The Department is also responsible for the Bank’s
certification under ISO 27001.
Internal Audit is responsible for auditing the effec-
tiveness of the operational risk framework and the
work of the Operational Risk Department.
Operational risk measurements are reported to the
Board in a comprehensive manner as part of regular
reporting by Risk Management. Managing directors
receive semi-annual reports on the key risk indicators
relevant to operations under their control.
7.2 Measurement and
mitigation
In order to understand the effects of the exposures
to operational risks, the Bank continually assesses
its operational risks. A number of tools are used to
identify and assess operational risk:
] Self-assessment. The Bank assesses its opera-
tions and activities against a menu of potential
risk vulnerabilities. This is done annually, and
more often if there are material changes in the
operational risk environment of departments.
] Risk mapping. This process involves mapping
all reported incidents by risk type and to busi-
ness units.
] Risk assessments on important IT systems and
as a part of project management.
] Key risk indicators (KRIs) are statistics and/or
metrics, which can provide insight into the
Bank’s risk position.
] The Bank is certified in accordance with ISO
27001, the international standard on informa-
tion security.
‘Execution, delivery and process management’ has
the largest number of loss events; 37 in 2018, 41 in
2019 and 46 in 2020.
Figure 7.1: Number of loss incidents based on BaselII classification
0
10
20
30
40
50
Execution, delivery and process management
External fraud Internal fraud Business disruption & system
failures
2018 2019 2020
The Bank categorises operational incidents into devi-
ation from rules or processes, weakness in processes
or systems, external circumstances, or security viola-
tions.
Figure 7.2: Operational incidents
0
50
100
150
200
Deviation from rules or processes
Weakness in processes or systems
External circumstances
Security violation
2018 2019 2020
72 Risk and Capital Management 2020

7.2.1 Mitigation
The Bank utilises insurance as part of its mitigation
technique when it comes to operational risk. This is
done through a bankers’ comprehensive crime policy,
as well as a cyber liability insurance policy.
Clear procedures are in place regarding the mitigat-
ing actions that result from self-assessment. There
are separate procedures in place for how the Bank
handles operational incidents and corrective and mit-
igating actions resulting from these incidents.
The architecture of the Bank’s information systems
is based on two mirrored data centres, primary and
secondary, located in two different buildings linked
with high speed communication. This setup allows
the Bank to run its core systems with access to
mission critical data, even if one data centre (for
instance the primary data centre) becomes unusable.
In the event of a failure, core systems will automat-
ically switch from one site (the failed one) to the
other.
There are business continuity plans in place for all
operations considered to be mission critical to the
Bank. These plans are all tested on a yearly basis,
apart from the IT Department’s plan, which is tested
more frequently.
7.2.2 Control and monitoring
The Board and the CEO set detailed rules on opera-
tional risk governance and responsibilities. Day-to-
day management of operational risk is a part of every
manager’s responsibility, and they are further respon-
sible for monitoring and controlling the operational
risk in their departments. Managers evaluate oper-
ational risk through risk self-assessment, focusing
on key risks identified with top-down management
involvement.
Information security, physical security, education and
training activities are important components of the
management of operational risk, and close cooper-
ation is maintained with the relevant departments
involved in these processes. Internal Audit and Com-
pliance are key functions in the framework that the
Bank has established to monitor and control opera-
tional risk. The Bank has put strong emphasis on
ensuring full compliance with GDPR. This has been
led by a designated Data Protection Officer (DPO)
within the Bank.
Incident reporting, auditing and follow-up is an im-
portant part of operational risk management, as
the identification and remedial action helps to limit
losses resulting from inadequate and failed processes.
The Operational Risk Department is responsible for
business continuity management and for maintaining
the Bank’s disaster recovery plans.
A number of documents, policies, rules and work
procedures cover key aspects of the responsibilities of
the Operational Risk Department. These include the
Bank’s policy on information security, rules on oper-
ational risk, rules on information security, rules on
operational risk assessment, and rules on documents
and document handling.
7.3 Compliance risk
The Bank manages compliance risk in accordance
with its Compliance Policy. The Policy reduces the
Bank’s compliance risk by taking suitable measures
to mitigate it, having regard for the nature, scope
and complexity of its operation. Based on the policy,
the Bank has set in place a variety of organisational
and managerial actions, e.g.:
] A specific process to implement legal changes
by adapting the Bank’s operation to include
any amendments to laws, regulations, rules,
contracts, accepted work procedures or ethical
guidelines.
] Adopted suitable internal rules and work pro-
cesses to promote compliance.
] Mandated management to promote compli-
ance e.g. by leading by example, ensuring
that employees are familiar with policies, rules
and procedures relevant to their work and re-
sponsibilities, and take appropriate action in
response to compliance violations.
] Training of management and employees.
] Reporting incidents.
The Compliance Department monitors the efficacy
73 Risk and Capital Management 2020

of the Compliance Policy and submits a semi-annual
report to the Risk Committee and an annual report
to the Board of Directors.
7.4 Conduct risk
The Bank manages conduct risk in accordance with
its Operational Risk Policy. The policy states that
all employees shall work in a disciplined manner and
follow internal rules and procedures to reduce the
risk of losses due to human error, negligence or fraud
(conduct risk). Based on the Policy, the Bank has set
in a place variety of organisational and managerial
actions, e.g.:
] Adopted suitable internal policies and rules,
e.g. Code of Conduct, Fraud Policy, Conflict of
Interest Policy and Product Governance Rules.
] Adopted suitable work processes to minimize
conduct risk.
] Mandated management to promote a coropo-
rate culture that supports good conduct, e.g.
to have an overview over possible conduct risk
within each department and implement suit-
able measures to reduce the risk of human
error, negligence or fraud, ensuring that em-
ployees are familiar with policies, rules and
procedures relevant to their work and responsi-
bilities and take appropriate action in response
to conduct infringements.
] Training of management and employees.
] Reporting incidents.
The Compliance Department has many responsibili-
ties related to employee conduct and is responsible
for monitoring the status of conduct risk within the
Bank. However, due to its nature, monitoring con-
duct risk is not a simple matter and Compliance is
continuously working towards improving this task and
reviewing decisions on which parameters to watch
in relation to conduct risk.
7.5 Covid-19
The Bank had a robust set of continuity plans in
place when Covid-19 hit. In February of 2020, the
relevant plans were updated by the Operational Risk
Committee in preparation for the possible pandemic,
which is based on the Civil Protection Agency’s pan-
demic plans. During the onset of the pandemic, a
Crisis Management Team was asembled and its first
actions were to ensure a safe and secure work environ-
ment for the Bank’s employees. With the increased
seriousness of the pandemic in March 2020, the CMT
merged with the MD team to form a stronger, unified
front to respond to the growing crisis and its effect
on the Bank’s daily operations and ensure adher-
ence with the public health official guidelines. The
frequency of meetings was increased and subgroups
created. The Executive Board and the Operational
Risk Committee have had joint weekly meetings from
the start of the pandemic to coordinate the Bank’s
response. The Bank’s response to the pandemic has
ensured that there have been no major disruptions
to its operations.
7.6 Environmental, social and
governance risk
The Bank has assessed its credit portfolio for ESG
risk and the exposure of borrowers to such risk. The
assessment was based on analysis of ESG risk factors
sector-by-sector in the Bank’s credit portfolio and
considered diversification of the portfolio with regard
to ESG risk.
As this work progresses, the Bank will have regard for
guidelines issued by international regulators and ESG
risk reviewers, such as EBA and the Task Force for
Climate Related Disclosures (TCFD), and sharpen
its focus on climate-related risk.
7.7 Outsourcing and product
governance
In 2020, the Bank updated its product approval
process to align with updated EBA guidelines on
product governance. The updated version further
strengthens the governance of new product approvals
and has been fully implemented. The new process
includes provisons for life cycle management.
74 Risk and Capital Management 2020

A new outsourcing policy was approved by the Bank
in 2020. This sets the standard for how the Bank
manages outsourcing agreements and risks. The
new policy is in line with the EBA guidelines on
outsourcing.
7.8 Model risk management
In 2020, the Bank started developing its model risk
management framework. Interviews were conducted
with different teams in the Bank to gather informa-
tion on its models. A model inventory was created,
where models that fulfilled an interim model defini-
tion were registered.
A risk assessment scorecard was developed and will
be used to categorise the models into risk groups
that will control the level of monitoring and con-
trols applied to the models. The Bank’s model risk
management framework is being written.
The Bank bases its work on the instructions stated
in the ECB guide to internal models. Additionally,
the Federal Reserve’s supervisory guidance on model
risk management (SR 11-7) and the Polish Finan-
cial Supervision Authority’s Recommendation W on
model risk management in banks have been used for
reference.
7.9 Cybersecurity risk
Cybersecurity risk is IT security risk that affects the
confidentiality, availability or integrity of information
or information systems.
The Bank uses the National Institute of Standards
and Technology - Cyber Security framework as a
template for the Bank to build its cyber resilience
around the following five bullet points:
] Identify – Gaining the institutional understand-
ing to identify what systems need to be pro-
tected, assess priority in light of organisational
mission, and manage processes to achieve cost-
effective risk management goals, and to aim
to know vulnerability.
] Prevent – Categories of management, tech-
nical, and operational activities that enable
the organisation to decide on the appropri-
ate outcome-based actions to ensure adequate
protection against threats to business sys-
tems that support critical infrastructure com-
ponents.
] Detect – Activities that identify (through ongo-
ing monitoring or other means of observation)
the presence of undesirable cyber risk events,
and the processes to assess the potential im-
pact of those events.
] Respond – Specific risk management decisions
and activities enacted based upon previously
implemented planning (from the Prevent func-
tion) relative to estimated impact.
] Recover – Categories of management, tech-
nical, and operational activities that restore
services that have previously been impaired
through an undesirable cybersecurity risk
event.
Based on the Bank’s knowledge of cyber incidents,
the current focus is threefold. Firstly, to educate
and increase awareness among both customers (the
public) and the Bank’s staff. Secondly, intelligence
sharing is an important part of collaboration with
other FIs that helps all parties to prevent future
incidents. Thirdly, building a layered security ap-
proach on the knowledge obtained from partners and
colleagues (FIs). This is a reliable approach that
is reviewed on a regular basis to ensure the imple-
mentation of the right procedures and policies to
cope with major cybersecurity related threats. This
also allows the Bank to provide better support for
customers who experience cyber incidents.
75 Risk and Capital Management 2020

8 Regulatory
developments
8.1 New regulatory requirements in 2020 77
8.2 Regulatory requirements expected
in 2021 . . . . . . . . . . . . . . . 78
76 Risk and Capital Management 2020

Regulatory Developments
Landsbankinn monitors regulatory developments to
ensure that its operation complies with the applica-
ble laws, regulations and rules (hereafter “regulatory
requirements”). This section provides an overview of
new and expected regulatory requirements of which
the Bank has knowledge and are considered by the
Bank to be of significance to its operation. The
section firstly summarises new regulatory require-
ments that came into effect in 2020 and secondly,
regulatory requirements expected in 2021.
8.1 New regulatory
requirements in 2020
Act on Recovery and Resolution of
Credit Institutions and Investment
Firms
Act No. 70/2020 transposes into Icelandic law the
main substance of the Bank Recovery and Resolu-
tion Directive 2014/59/EU (BRRD) on resolution
procedures. This is a new, comprehensive Act on the
resolution of credit institutions and investment firms,
containing provision about preventative measures,
preparation for the resolution process, its implemen-
tation and finalisation. The Act entrusts the Central
Bank of Iceland with new administrative powers, so-
called powers of resolution. The Act also establishes
a special funding resource, the Resolution Fund, to
finance resolution proceedings. A new requirement
provides that a credit institution satisfy minimum
requirements for own funds and eligible liabilities
(MREL); i.e., demands that an institution’s capital
and other funding be sufficient to recapitalise should
it be subjected to resolution proceedings, through
write-downs of subordinated debt. The Act also pro-
vides for certain amendments to Act No. 161/2002,
on Financial Undertakings, based in part on the
BRRD and in part on the Act’s requirement for new,
comprehensive legislation to replace certain older
rules on the same subject. The Act further provides
for specific amendments to Act No. 98/1999, on
Deposit Guarantees and an Investor-Compensation
Scheme, due to interconnections with the provisions
of the Act. These amendments provide, inter alia, for
a new maximum insurance coverage in the equivalent
amount of EUR 100,000 in ISK.
Act on Central Securities Depositories,
Settlement and Electronic Registration
of Financial Instruments
Act No. 7/2020, on Central Securities Depositories,
Settlement and Electronic Registration of Financial
Instruments, transposes into Icelandic law Regula-
tion (EU) No. 909/2014, on Improving Securities
Settlement in the European Union and on Central
Securities Depositories (CSDR). CSDR alters the
framework for the operation of securities deposito-
ries to a considerable degree and involves various
increased requirements of securities depositories, the
settlement of financial instruments and securities
settlement systems. Some of the provisions of Act
No. 131/1997, on Electronic Registration of Title
to Securities, not provided for by CSDR, have been
incorporated in Act No. 7/2020, and the aforemen-
tioned Act otherwise repealed.
Act on Prospectus for Public Offering
or Admission to Trading on a Regulated
Market
A new, comprehensive law, Act No. 14/2020, on
Prospectus for Public Offering or Admission to Trad-
ing on a Regulated Market, transposes the Prospec-
tus Regulation (Regulation (EU) No. 2017/1129)
into Icelandic law. The main substance of the Act
is to transpose the Regulation and necessary related
provisions, such as scope, supervision, authorisation
for information gathering granted to regulators, en-
forceability of decisions by the EFTA Surveillance
Authority and the EFTA Court, and penalty provi-
sions. The Act also repeals certain provisions of Act
No. 108/2007, on Securities Transactions, providing
for prospectuses in Icelandic law.
77 Risk and Capital Management 2020

Act on Managers of Alternative Invest-
ment Funds (AIFs)
Act No. 45/2020, on Alternative Investment Fund
Managers, is a new, comprehensive law transposing
Directive 2011/61/EU, on Alternative Investment
Fund Managers (AIFMD), into Icelandic law. Alter-
native funds refer to all funds for collective invest-
ment other than UCITS. This refers to funds other
than UCITS, including fund divisions, that receive
funds from investors for collective investment based
on a pre-determined investment strategy with the
aim of achieving returns for the investors. This in-
cludes, inter alia, investment funds and institutional
investor funds. The Act provides for changes which
will impact managers of AIFs in Iceland, to a varying
degree depending on size. The Act also contains
provisions for organisational and operating permit
conditions, transparency, custodians and marketing.
Amendments to the Act on a Special
Tax on Financial Undertakings
Act No. 131/2019 amended the provisions of Act
No. 155/2010, on a Special Tax on Financial Under-
takings, to provide for an incremental lowering of the
special tax on financial undertakings in four steps,
from 0.376% to 0.145% in the period 2021-2024.
Act No. 25/2020, which changes various other acts
in response to the economic impact of the Covid-19
pandemic, amended Act No. 155/2010 to acceler-
ate the previously enacted incremental lowering of
the tax already in the tax assessment year 2021 by
lowering the rate to 0.145%.
Amendments to the Act on Measures
against Money Laundering and Terrorist
Financing and the Act on the Registra-
tion of Beneficial Owners
Act No. 96/2020 amends Act No. 140/2018, on
Measures against Money Laundering and Terrorist
Financing, as subsequently amended, and Act No.
82/2019, on the Registration of Beneficial Owners.
This concludes the transposition of the 5th Anti-
Money Laundering Directive 2018/843/EU (AML
V), as well as some amendments based on experience
of application of the law. Select provisions of the
Directive were introduced with Act No. 140/2018;
this new Act transposes the remaining provisions into
Icelandic law. Parties with legal recording obligations
to record beneficial owners are now obligated to take
suitable action to ensure the accuracy of information
about beneficial owners and beneficial owners are
now obligated to provide information at the behest
of a party with recording obligations.
8.2 Regulatory requirements
expected in 2021
Limitation on the extent of investment
banking activity
A Bill of legislation to amend Act No. 161/2002, on
Financial Undertakings, was submitted to the parlia-
ment Althingi in October 2020, proposing that the
investments of banks on own account be limited to a
certain percentage of equity. The aim is to limit di-
rect and indirect exposure by systemically important
commercial banks to 15% of their equity base. The
legislation is intended to minimise risk to deposit
owners and the National Treasury from the invest-
ment banking activities of commercial banks while
simultaneously ensuring that commercial banks can
receive and process appropriated assets and provide
services such as market making and underwriting.
The new legislation is expected to enter into force
on 1 January 2022.
Regular and on-going disclosure obliga-
tions for issuers of securities and flag-
ging obligations
A Bill of legislation on regular and on-going disclosure
obligations for issuers of securities was submitted
to Althingi in November 2020. The Bill proposes
a new, comprehensive legislation on transparency
in information disclosure to the issuers of securities
listed on a regulated market by repealing the rele-
vant provisions of Act No. 108/2007, on Securities
Transactions. The Bill also implements Directive
2013/50/EU, which amends the Transparency Direc-
tive 2004/109/EC, as subsequently amended.
78 Risk and Capital Management 2020

Restrictions on the use of inflation-
indexation in consumer loan agreements
A Bill of legislation amending Act No. 38/2001,
on Interest and Price Indexation, was submitted to
Althingi in January 2021. The Bill proposes changes
to the Act on interest and price indexation, based
on the government’s stated intent to systematically
remove price indexation. The statement from 3 April
2019 includes seven measure the government will
take to abolish indexation. This Bill provides for the
first two measures, i.e. the maximum and minimum
lifetime of inflation-indexed annuity loans.
Priority of claim under resolution and
winding-up proceedings
A Bill of legislation is expected to be submitted to
the spring session of Althingi, on the amendment
of Act No. 70/2020, on the Resolution of Credit
Institutions and Investment Firms, which will trans-
pose the content of Directive (EU) 2017/2399 on
the ranking of unsecured debt instruments in insol-
vency hierarchy into Icelandic law. Directive (EU)
2017/2399 is set for clarification of the provisions of
Directive (EU) 2014/59 (BRRD), and provides for
the ranking of specific claims in insolvency proceed-
ings. The Bill is connected to minimum requirements
for own funds and eligible liabilities (MREL) which
the Resolution Authority of the Central Bank of Ice-
land is responsible for determining for each company
under the scope of the Act on the Resolution of
Credit Institutions and Investment Firms. The Bill
sets out comprehensive rules on the priority rank-
ing of claims, including deposits, in resolution and
winding-up proceedings. The claim hierarchy will
clarify which claims fulfil the MREL requirement of
the Resolution Authority.
Cross-border operation and group-
oriented surveillance
Another Bill is in the pipeline for spring 2021 to
amend the Act on Financial Undertakings to mostly
finalise the transposition of Directive 2013/36/EU,
on access to the activity of credit institutions and
the prudential supervision of credit institutions and
investment firms (CRD IV), and Regulation (EU)
No. 575/2013, on prudential requirements for credit
institutions and investment firms (CRR). Expected
changes are connected to capital buffers, branches
and cross-border service, control and prudential re-
quirements on a consolidated basis, and collaboration
and exchange of information between regulators.
Markets for financial instruments
A Bill on a new, comprehensive legislation on markets
for financial instruments, which entails the transposi-
tion of the MiFID II Directive 2014/65/EU and the
accompanying MiFIR Regulation 600/2014 into Ice-
landic law, is expected to be submitted to the spring
session of Althingi. This represents considerable
modification of the current legislation, calling for
amendments to Act No. 161/2002, on Financial Un-
dertakings, Act No. 108/2007, on Securities Trans-
actions, and Act No. 110/2007, on Stock Exchanges.
The Bill involves significant changes to requirements
applying to regulated markets, multilateral trading fa-
cilities and investment firms. Enhanced requirements
will apply to transparency, investor protection and
business practices, to the management, governance
and general organisation of investment firms and
regulated markets. The Bill further proposes various
changes in response to market developments and
technological changes since Directive 2004/39/EU
(MiFID I) was transposed into Icelandic law.
Market abuse
The Althingi spring session is also expected to pro-
cess a Bill on new, comprehensive legislation on
market abuse, intended to transpose into Icelandic
law the provisions of Regulation (EU) No. 596/2014
on market abuse (MAR). The provisions of Act No.
108/2007, on the same subject, will be repealed.
MAR is more detailed than the provisions of current
laws and regulations and has a wider scope, applying
to more financial instruments than before. It con-
tains new provisions on, inter alia, insiders, insider
lists, treatment of insider information, and the obli-
gation to report insiders. Main changes from current
legislation are a wider scope, more stringent disclo-
sure rules, changes to the classification of insiders
79 Risk and Capital Management 2020

and changed rules on the trading of primary insiders
and financially connected parties. In addition, the
Bill will expand the competency of authorities to
carry out reviews and new authorisations for finan-
cial undertakings to delay information disclosure to
safeguard economic stability.
Derivative trading, central counterpar-
ties and trade repositories
Changes are planned to Act No. 15/2018, on Deriva-
tives, Central Counterparties, and Trade Repositories,
in the current session of Althingi. The Bill to amend
the Act proposes transposing Regulation (EU) No.
2019/834 (EMIR Refit) into Icelandic law. The Reg-
ulation amends Regulation (EC) No. 648/2012, on
OTC derivatives, central counterparties and trade
repositories (EMIR), transposed into Icelandic law
with the aforementioned Act on the same subject,
No. 15/2018. The Bill reduces various requirements
made of non-financial counterparties and smaller
financial counterparties in derivatives trading. In
addition, managers of alternative investment funds,
as defined in Act No. 45/2020, on Alternative In-
vestment Fund Managers, are annexed into the def-
inition of financial counterparties by the Act. The
changes are intended to uphold the goal to ensure
transparency in derivative trading and about autho-
risations of regulators while clarifying requirements
and, in some cases, ease requirements to simplify
derivative transactions, reporting on derivative trans-
actions, and reduce cost.
UCITS
The Minister of Finance and Economic Affairs plans
to submit to the current session of Althingi a Bill
to a new comprehensive Act on UCITS, transpos-
ing into Icelandic law Directive 2014/91/EU, on
the coordination of laws, regulations and admin-
istrative provisions relating to UCITS (UCITS V)
and Directive 2010/78/EU, as regards UCITS and
occupational pension funds (Omnibus I). This is a
complete review of the current Act No. 128/2011,
on UCITS, first and foremost intended to transpose
the aforementioned Directives as they include new
provision on custodians of UCITS, the remuneration
policies of operating companies, and minimum au-
thorisations of regulators. Changes are also planned
to Act No. 45/2020, on Alternative Investment Fund
Managers (AIFs), first and foremost as regards the
remuneration policies of AIFs and use of the concept
investment fund.
Key information documents for pack-
aged retail and insurance-based invest-
ment products
The spring session is also set to see the submission of
a Bill on key information documents for packaged re-
tail and insurance-based investment products for gen-
eral investors, which will transpose into Icelandic law
Regulation (EU) No. 1286/2014 on key information
documents for packaged retail and insurance-based
investment products (PRIPPs). The Regulation re-
quires parties who advise on or sell packaged retail
and insurance-based investment products for general
investors to compile and make available to general
investors key information documents. The aim is to
make it easier for general investors to compare key
information on different products and understand
their characteristics, accompanying risks and costs.
Foreign exchange
A Bill proposing a new, comprehensive legislation on
foreign exchange is expected to be submitted to the
current session of Althingi, following a complete re-
view of Act No. 87/1992, on Foreign Exchange, and
Act No. 37/2016, on Treatment of ISK-denominated
Assets Subject to Special Restrictions. While the
Bill will generally be based on the same consider-
ations as the current Act, presentation has been
thoroughly overhauled. The Bill will propose free
and unrestricted cross-border foreign currency trad-
ing, capital movement and payments, unless they
threaten stability in the FX market and monetary
stability. The Bill contains proposals for two types
of restrictions on foreign currency trading, on the
one hand macroprudential restrictions and, on the
other, capital controls to be applied under unusual
circumstances. Only parties authorised under the law
will be allowed to intermediate in FX transactions.
Parties who carry out FX transactions, cross-border
80 Risk and Capital Management 2020

capital movement and international payments will
continue to be obligated to report such transac-
tions and movements to the Central Bank. Act No.
37/2016, on Treatment of ISK-denominated Assets
Subject to Special Restrictions, will be repealed and
no restrictions will apply to off-shore ISK or their
distribution. The off-shore and on-shore markets will
merge into one.
Payment services
Finally, a Bill on a new, comprehensive pay-
ment services legislation, transposing Directive (EU)
2015/2366 (PSD2) into Icelandic law and simulta-
neously repealing Act No. 120/2011, on Payment
Service, will be submitted to the spring session. This
Bill aims to align Icelandic rules with current EEA
rules, encouraging the activities of foreign companies
in Iceland as well as domestic operation abroad. The
main purpose of the proposed Bill is to promote com-
petition in payment service, strengthen surveillance
of new parties on the payment service market and
increase data security and consumer protection. The
main changes proposed in the Bill are, firstly, the
addition of new payment service providers, payment
initiation service providers and account information
service providers, who are both payment institutions.
Secondly, banks will be obligated to provide new
payment service providers with access to customers’
payment accounts from their systems without previ-
ously concluded contracts, provided the owner of the
payment account has given express consent. Thirdly,
increased security requirements are made of payment
service providers, involving consumer protection and
safer payment transfers. Following the entry into
force of the new payment service law, the Central
Bank of Iceland will set rules by virtue of the law
to implement the versions of the Payment Service
Directive.
81 Risk and Capital Management 2020

9 Remuneration
report
9.1 Remuneration report . . . . . . . . 83

Remuneration Report
9.1 Remuneration report
Introduction
The Bank emphasises hiring and employing excep-
tional personnel. The aim of the remuneration policy
is to make the Bank a desirable workplace for quali-
fied employees to ensure the Bank’s competitiveness,
continued development and acceptable profitability.
The remuneration policy shall support sound opera-
tions in the long-term and not encourage unreason-
able risk-taking. It is the Bank’s aim that the terms
of employment of executives and other employees
are competitive but modest and not market leading.
In determining terms of employment, responsibility
and performance shall be taken into account, as
well as equal rights perspectives. The remuneration
policy applies to the Board of Directors, the Execu-
tive Board of Landsbankinn, and all Landsbankinn
employees. The subsidiary of Landsbref has its own
remuneration policy and Remuneration Committee.
Governance
The remuneration policy of the Bank is approved
by its Board of Directors. Furthermore, the remu-
neration policy is submitted to the Bank’s Annual
General Meeting for approval or rejection. The re-
muneration policy may be reviewed more than once
yearly, and any amendments shall be submitted to
a shareholders’ meeting for approval. The remu-
neration policy serves as an indicative guideline for
the Bank and the Board of Directors. The Board
of Directors shall enter any deviations from the re-
muneration policy and substantiation thereof in the
minutes. Deviations shall be presented to the Bank’s
next AGM.
The Remuneration Committee of the Bank is com-
posed of three Directors. The role of the Remunera-
tion Committee is to provide guidance to the Board
of Directors and CEO on salary and benefits for key
executives and to advise the board on the remunera-
tion policy. The Committee reviews that the terms
of employment of the Bank’s executives are within
the framework provided by the remuneration policy
and report on its implementation yearly in connec-
tion with the Bank’s AGM. The Committee shall
monitor the developments of collective bargaining
agreements, trends in salary expenses and number of
employees. The Board of Directors has issued Rules
of procedures for the Committee, within which its
role and duties are defined.
At the start of 2020, the Remuneration Commit-
tee was composed of the Chairman of the board,
which is also the Chairman of the Remuneration
Committee, Vice-Chairman of the board and one
other board member. Following the resignation of
the board member on the 19th of November 2020,
an alternate Director joined the Committee. In addi-
tion, the CEO of the Bank, Head of HR and Head of
Legal regularly attend certain parts of Remuneration
Committee meetings.
During 2020, the Remuneration Committee held 6
meetings. The Committee reviewed the remunera-
tion policy prior to the 2021 annual meeting and
made no significant changes.
Remuneration policies for the Bank’s
Board of Directors and CEO
Board members shall receive set monthly remunera-
tion in accordance with the decision of the AGM each
year, as provided for in Article 79 of Act No. 2/1995,
on Public Limited Companies. In determining the
remuneration amount, consideration shall be taken
to the hours spent on the job, the responsibilities
borne by the board members and the Company’s per-
formance. The Remuneration Committee presents
the Board of Directors with a substantiated proposal
for remuneration to Board members in the coming
operating year. The Board of Directors deliberates
on the Committee’s proposal and submits a final
proposal on remuneration to the AGM. The Bank
reimburses Directors domiciled outside the capital
83 Risk and Capital Management 2020

Table 9.1: Remuneration by business area in ISK million
Personalbanking
Corporatebanking
Markets Treasury Supportfunctions
Total
Total remuneration 3,941 1,427 1,686 176 7,537 14,767
- of which variableremuneration
0 0 0 0 0 0
region for travel expenses. Board members may not
conclude severance agreements with the Bank.
The Board of Directors appoints the Bank’s CEO
and determines the remuneration of the Bank’s CEO
in accordance with the remuneration policy.
The CEO hires the Bank’s key executives, and their
terms of employment shall be competitive, but mod-
est and not market leading. The Bank publicly
publishes the terms of employment of each of the
Directors and key executives in its annual report. For
Managing Directors, the Bank strives to maintain a
gender balance of at least 60/40. Currently there
are four male and three female Managing Directors.
Members of the management body hold a total of 5
directorships.
Most employees in the Bank receive a fixed salary,
according to position and function. The salary level
is evaluated on an annual basis. Employee benefits
are offered to all employees. All employees have
mandatory pension contributions and paid holidays
in line with general market terms and as negotiated
by the employee’s union.
The Bank does not offer variable remuneration and
has no plan to implement variable remuneration. Any
decision to implement variable remuneration has to
be presented to a shareholders’ meeting for approval.
Table 9.1 discloses information on remuneration for
all employees broken down by business area.
As further detailed in the 2014 and 2013 Remuner-
ation reports, the Bank offered a one-off employee
incentive scheme in an agreement made by the Min-
ister of Finance on behalf of the State, Landsbankinn
hf. and Landsbanki Islands hf. dated 15 December
2009. The scheme was compliant with FSA rules
on performance linked remuneration with financial
undertakings. As a result, employees appear on the
list of shareholders.
The Remuneration Committee performs an annual
comparison with market data on the Bank’s remuner-
ation to ensure remuneration is competitive, modest
and not market-leading.
84 Risk and Capital Management 2020

10 Disclosure
policy
10.1 Introduction . . . . . . . . . . . . 86
10.2 Disclosure policy . . . . . . . . . . 86
10.3 Frequency of publication . . . . . . 86
10.4 Verification . . . . . . . . . . . . . 86
10.5 Media and location of publication . 87

Disclosure Policy
10.1 Introduction
The Basel III Accord, implemented in the European
Union through the Capital Requirements Directive
(CRD 2013/36/EU (the ‘Directive’)) establishes a
revised regulatory capital framework across Europe,
governing the amount and nature of capital that
must be maintained by credit institutions. Parts of
the Directive have been implemented into Icelandic
law by amendments to the Act on Financial Under-
takings (Act. No. 57/2015 and Act No. 69/2016,
amending Act No. 161/2002 on Financial Undertak-
ings). The amendments to Icelandic law incorporate,
among other things, the CRD IV capital buffer re-
quirements, disclosure requirements, minimum lever-
age ratio, supervisory review and evaluation process
and capital definitions.
The Basel framework consists of three ‘Pillars’:
] Pillar I defines the minimum capital amount
that meets the firm’s credit, market and oper-
ational risk;
] Pillar II requires the firm to assess whether its
Pillar I capital is adequate to meet its risks
(Internal Capital / Liquidity Adequacy Assess-
ment Process, ICAAP/ILAAP) and is subject
to annual review by the FSA in the Supervisory
Review and Evaluation Process (SREP);
] Pillar III requires disclosure of specified infor-
mation about the underlying risk management
controls and capital position.
This publication, Risk and Capital Management 2020,
reviews the Bank’s organisation and processes relat-
ing the identification and management of the risk
type characteristic of a financial group with its type
of business concept. It also describes the Bank’s risk
position based on the requirements under Pillar III.
10.2 Disclosure policy
In accordance with the Directive, the Bank has
adopted a formal disclosure policy in that it will
comply with the requirement to publicly disclose
relevant information.
The rules state that one or more of the required
disclosures may be omitted if it is believed that the
information is immaterial. Materiality is based on
the criteria that the omission or misstatement of
material information would be likely to change or
influence the assessment or decision of a user rely-
ing on that information for the purposes of making
economic decisions. If a disclosure is considered
immaterial, it will be stated in the relevant section.
One or more of the required disclosures may be omit-
ted if the information is regarded as proprietary or
confidential. Proprietary information is that which,
if it were shared, would undermine a competitive po-
sition. Information is considered confidential if there
are obligations binding the Bank to confidentiality
with customers and counterparties. If information is
omitted for either of these reasons, it will be stated
in the relevant section along with the rationale. Fur-
ther general information on required disclosures will
be published where appropriate.
10.3 Frequency of publication
The disclosures are reviewed on an annual basis
and, if appropriate, more frequently. Disclosures
are published as soon as is practicable following any
revisions.
10.4 Verification
The disclosures have been put together solely to
explain the basis of preparation and disclosure of
certain capital requirements and provide information
about the management of certain risks. They do not
constitute any form of audited financial statement
and have been produced solely for the purpose of
Pillar III. They should not be relied upon in mak-
ing judgements about the Bank. The disclosures
will only be subject to external verification to the
86 Risk and Capital Management 2020

extent that they are equivalent to those made under
accounting requirements.
The disclosures are reviewed by and presented to
the Bank’s Board of Directors and Risk & Finance
Committee. The first two chapters, which contain
a declaration on the adequacy of risk management
arrangements within the Bank and a concise risk
statement, succinctly describing the Bank’s overall
risk profile are approved by the Board of Directors,
in accordance with Article 435 in CRR.
This publication, Risk and Capital Management 2020,
has not been audited by external auditors. However,
it has been appropriately verified internally and in-
cludes information from the audited Consolidated
Financial Statements 2020. There may be some dis-
crepancy between financial information in the Con-
solidated Financial Statement 2020 and information
in the Risk and Capital Management 2020, as the
report has been prepared in accordance with the Cap-
ital Requirements Directive and the Basel III capital
framework, rather than in accordance with IFRS.
10.5 Media and location
of publication
The disclosures are published on the Bank’s website.
87 Risk and Capital Management 2020