
Risk Analysis · 2016-12-28 · Risk FMEA PDPC RAID Log* Observations Focus Groups Understanding...
36
Continuous Improvement Toolkit . www.citoolkit.com Continuous Improvement Toolkit Risk Analysis
Transcript of Risk Analysis · 2016-12-28 · Risk FMEA PDPC RAID Log* Observations Focus Groups Understanding...

Continuous Improvement Toolkit . www.citoolkit.com
Continuous Improvement Toolkit
Risk Analysis
Continuous Improvement Toolkit . www.citoolkit.com
Check Sheets
DataCollection
Process MappingFlowcharting
Flow Process Charts
5S
Value Stream Mapping
Control Charts
Mistake Proofing
Tree Diagram*
UnderstandingPerformance
Fishbone Diagram
Design of Experiment
ImplementingSolutions**
Creating Ideas
Brainstorming Attribute Analysis
Deciding & Selecting
Decision Tree
Force Field Analysis Cost Benefit Analysis
Voting
Planning & Project Management*
Value Analysis
Kaizen Events
Quick Changeover
ManagingRisk
FMEA
PDPC
RAID Log*
Observations
Focus Groups
UnderstandingCause & Effect
Pareto Analysis
IDEF0
5 Whys
Matrix DiagramKano Analysis
KPIs
Lean Measures
Importance-Urgency Mapping
Waste Analysis
Fault Tree Analysis
Relationship Mapping*
Benchmarking**
SCAMPER**
C&E Matrix
Confidence Intervals
Pugh Matrix
SIPOC*
Prioritization Matrix
Stakeholder Analysis
Critical-to Tree
Paired Comparison
Improvement Roadmaps
Interviews
QFD
Graphical Analysis
Lateral Thinking
Hypothesis Testing
Visual Management
Ergonomics
Reliability Analysis
Cross Training
How-How Diagram**
Flow
Time Value Map
ANOVA
Gap Analysis*
Traffic Light Assessment
TPN Analysis
Decision Balance Sheet
Suggestion systems
Risk Analysis*
AutomationSimulation
Break-even Analysis
Service Blueprints
DMAIC
Process Redesign
Run Charts
TPM
Control Planning
Chi-Square
SWOT Analysis
Capability Indices
Policy Deployment
Data collection planner*
Affinity DiagramQuestionnaires
Probability Distributions
Bottleneck Analysis**
MSA
Descriptive Statistics
Cost of Quality*
Process Yield
Histograms & Boxplots
Just in Time
Pick Chart
Portfolio Matrix
Four Field Matrix
Root Cause Analysis Data Snooping
Morphological Analysis Sampling
Spaghetti Diagram
Pull
OEE
Mind Mapping*
Project Charter
PDCA
Designing & Analyzing Processes
CorrelationScatter PlotsRegression
Gantt Charts
Activity NetworksRACI Matrix
PERT/CPMDaily Planning
MOST
Standard work Document controlA3 Thinking
The Continuous Improvement Map
Multi vari Studies
Continuous Improvement Toolkit . www.citoolkit.com
A process that helps identify and assess potential threats that could affect the success of a business or project.
Includes means to measure, mitigate and control risks effectively.
An essential tool when the work involves threats and risks.
- Risk Analysis
Continuous Improvement Toolkit . www.citoolkit.com
Many industries have recognized the increasing importance of risk analysis such as:• Medical.
• Food and beverage.
• Automotive.
• Transportation.
• Military.
• Aerospace.
• Nuclear.
- Risk Analysis

Continuous Improvement Toolkit . www.citoolkit.com
Many companies have established risk management functions and procedures to perform risk analysis on a continual basis.
These companies may need to assess:• Their financial stability.
• The financial feasibility of an investment.
• The impact of new government policies.
• The impact of new competitors cominginto the market.
- Risk Analysis
Continuous Improvement Toolkit . www.citoolkit.com
Used to assess the potential health effects resulting from human exposures to hazardous agents or situations.
- Risk Analysis

Continuous Improvement Toolkit . www.citoolkit.com
Widely used in manufacturing environments to improve safety and manage potential risks in production lines.
- Risk Analysis

Continuous Improvement Toolkit . www.citoolkit.com
Used in all types of engineering of sophisticated systems to ensure safety and reliability of systems, processes and products.
- Risk Analysis

Continuous Improvement Toolkit . www.citoolkit.com
Project Management:
A key process area in project management.
Helps deciding whether to proceed with a project or not.
Ensures only projects with the highest chance of success are selected.
Used in project planning and duringproject implementation to evaluatehow a project can be successfullycompleted.
- Risk Analysis

Continuous Improvement Toolkit . www.citoolkit.com
Project Management:
If risks are not considered and controlled, you will not be able to minimize their impact on the schedule, scope, cost or quality.
It is possible for a project to be stopped for example if the availability of resources become an issue, or the potential benefits might not be sufficient.
- Risk Analysis

Continuous Improvement Toolkit . www.citoolkit.com
Benefits:
Saves time and money.
Reduces the level of uncertainty.
Decreases the impact of negative events.
Improves project controls.
Improves organizational learning.
- Risk Analysis

Continuous Improvement Toolkit . www.citoolkit.com
Stages of Risk Analysis:
Risk identification.
Risk assessment.
Response planning and implementation.
Risk monitoring and control.
- Risk Analysis

Continuous Improvement Toolkit . www.citoolkit.com
Risk Identification:
Determining and documenting the potentialrisk that could occur.
An iterative process:• As new risks may evolve or become known
as the project progresses.
Identified risks and their characteristics arerecorded in the risk register.
- Risk Analysis

Continuous Improvement Toolkit . www.citoolkit.com
Risk Identification Methods and Sources:
People who have gone through similar projects or events.
Expert opinions.
Failure history analysis.
SWOT analysis.
Assumption logs.
Observations and checklists.
Hazard analysis.
Scenario analysis.
Brainstorming.
- Risk Analysis

Continuous Improvement Toolkit . www.citoolkit.com
Risk Register:
Used to record and track all informationabout the identified risks.
Contains information that results fromthe risk analysis process as it is conducted.
Should be updated as new informationbecomes available.
Used to support future risk analysis processes.
High priority risks are often addressed in more details.
Low priority risks are often included in the Watch List for future monitoring.
- Risk Analysis

Continuous Improvement Toolkit . www.citoolkit.com
Each risk in a risk register may include: A brief description of the risk.
Added date.
A unique identifier code.
Causes of the risk.
Symptoms and warning signs.
Controls in place
Impacts and costs of occurrence.
Probability of occurrence.
Priority and assessment results.
The risk owner.
Potential responses.
Response approach.
- Risk Analysis

Continuous Improvement Toolkit . www.citoolkit.com
Risk Register:
- Risk Analysis
Risk Category Causes Impacts Controls in place
Risk Owner Response approach RPN (P*I) Status
Risks are often listed in a Risk Register

Continuous Improvement Toolkit . www.citoolkit.com
Risk Assessment:
Helps to evaluate the significance of each risk.
Highlight the risks that present the greatest threat on the overall objectives.
Risks should be prioritized according to their potential impact and probability of occurring.• Risk Impact is the effect the risk will cause if it occurs.
• Risk probability is a measure ofthe likelihood of the risk occurring.
- Risk Analysis
The risk score helps guiderisk responses

Continuous Improvement Toolkit . www.citoolkit.com
Qualitative vs. Quantitative:
Numeric values may be used to indicate the rating.
An ordinal scale is sometimes applied to rate the probability and impact of the risks:• 1-5 scale.
• Very likely, likely, indifferent, unlikely and very unlikely.
- Risk Analysis

Continuous Improvement Toolkit . www.citoolkit.com
Risk Response Planning and Implementation:
You need now to respond to the assessed risks by developing options and actions to reduce the probability or impact.
Here you will apply strategies to deal with them effectively.
This process should be:• Realistic.
• Cost effective.
• Agreed upon by key stakeholders.
• Owned by a responsible person.
- Risk Analysis

Continuous Improvement Toolkit . www.citoolkit.com
Risk Response Planning and Implementation:
Response Strategies:• Avoiding the risk.
• Transferring the risk.
• Mitigating the risk
• Accepting the risk altogether.
- Risk Analysis

Continuous Improvement Toolkit . www.citoolkit.com
Avoidance:
It usually involves changing in the project plan such as:• Extending the schedule.
• Reducing the scope.
• Spending money or hiring resources to eliminate the risk.
An example is when you hire a more skilledresource who is likely to get the tasks donein less time.
- Risk Analysis

Continuous Improvement Toolkit . www.citoolkit.com
Transference:
Sharing the risk with someone else.
It is simply handling off the risk to another team, organization or a third party.
Examples are:• Outsourcing a service.
• Buying an insurance.
- Risk Analysis

Continuous Improvement Toolkit . www.citoolkit.com
Mitigation:
Involves carrying out work now to reduce the probability and/or impact of a risk to be within the acceptable threshold limits.
It may include preventive, detective or testing possible ways to reduce the risk.
Examples are:• Backing up the data to an offsite location.
• Choosing a more stable supplier.
- Risk Analysis
Continuous Improvement Toolkit . www.citoolkit.com
Acceptance:
An acceptable risk is the one that is tolerated because:• There is nothing you can do to prevent or mitigate it.
• It is costly.
• It is difficult to implement.
One of the common acceptance strategies is to come up with a contingency plan to cope with its consequences.
- Risk Analysis

Continuous Improvement Toolkit . www.citoolkit.com
Controlling Risks:
Improves the efficiency of the risk analysis process.
Involves:• Monitoring and re-assessing risks overtime.
• Identifying new risks.
• Evaluating the effectiveness of the risk response strategies.
Performance information should be reviewed regularly:• Schedule progress
• Costs incurred.
- Risk Analysis
Continuous Improvement Toolkit . www.citoolkit.com
Controlling Risks:
Risks and risk response plans should be reviewed in regular meetings to ensure plans are being implemented.
In these meetings, key risks should be given more attention and new risks should be raised and discussed.
- Risk Analysis

Continuous Improvement Toolkit . www.citoolkit.com
P-I Matrix: A method that helps to identify which risks need attention most.
The combined probability and impact scores of individual risks are plotted into the two dimensional matrix.
Thresholds for low, moderate or high risks can be shown.
- Risk Analysis
P / I Insignificant Minor Moderate Major Severe
Certain 5 Moderate 10 High 15 Critical 20 Critical 25 Extreme
Likely 4 Moderate 8 Moderate 12 High 16 Critical 20 Critical
Possible 3 Low 6 Moderate 9 Moderate 12 High 15 Critical
Unlikely 2 Negligible 4 Low 6 Moderate 8 Moderate 10 High
Rare 1 Negligible 2 Negligible 3 Low 4 Moderate 5 Moderate
Risk1
Risk2
Sum all the ratings to obtain a total risk assessment value

Continuous Improvement Toolkit . www.citoolkit.com
Example:
- Risk Analysis
Risk Impact Controls RPN (P*I)
R.1 Disruption of operations in the absence of key managers
Ineffective managerial decision making and failure to meet goals
No controls 2*10 = 20
R.8 Failure to achieve targeted performance goals
Non attainment of goals and loss of profitability and market share
KPI's in place covering all business functions
3*5 = 15
R.15 Inadequate staff development programs
Entitlement of excessive operating costs and dissatisfied employees
Budget, policies covering staff development
5*2 = 10
R.21 Staff attendance data is not properly used
Entitlement of extra leave and excessive payroll costs
Attendance is captured & reviewed by business units
3*1 = 3
R.26 Inaccurate calculation of payroll
Incorrect processing of salary payments
Payroll system & manual intervention is very limited
3*2 = 6
R.28 Employee performance is not reviewed regularly
Unjustified evaluation and dissatisfied employees
No controls 2*2 = 4

Continuous Improvement Toolkit . www.citoolkit.com
Example:
- Risk Analysis
P / I Insignificant (1) Minor (2) Moderate (3) Major (5) Severe (10)
Certain(10) 10 Medium 20 High 30 Critical 50 Critical 100 Critical
Likely
(5)5 Medium 10 Medium 15 High 25 Critical 50 Critical
Possible
(3)3 Low 6 Medium 9 Medium 15 High 30 Critical
Unlikely
(2)2 Low 4 Medium 6 Medium 10 Medium 20 High
Rare
(1)1 Low 2 Low 3 Low 5 Medium 10 Medium

Continuous Improvement Toolkit . www.citoolkit.com
Example:
- Risk Analysis
P / I Insignificant (1) Minor (2) Moderate (3) Major (5) Severe (10)
Certain(10) 10 Medium 20 High 30 Critical 50 Critical 100 Critical
Likely
(5)5 Medium 15 High 25 Critical 50 Critical
Possible
(3)9 Medium 30 Critical
Unlikely
(2)2 Low 6 Medium 10 Medium
Rare
(1)1 Low 2 Low 3 Low 5 Medium 10 Medium
R.15 Inadequate staff development
programs
R.1 Disruption of operations in the
absence of key managers
R.8 Failure to achieve targeted performance
goals
R.26 Inaccurate calculation of
payroll
R.28 Employee performance is not reviewed regularly
R.21 Staff attendance data is not properly used
Continuous Improvement Toolkit . www.citoolkit.com
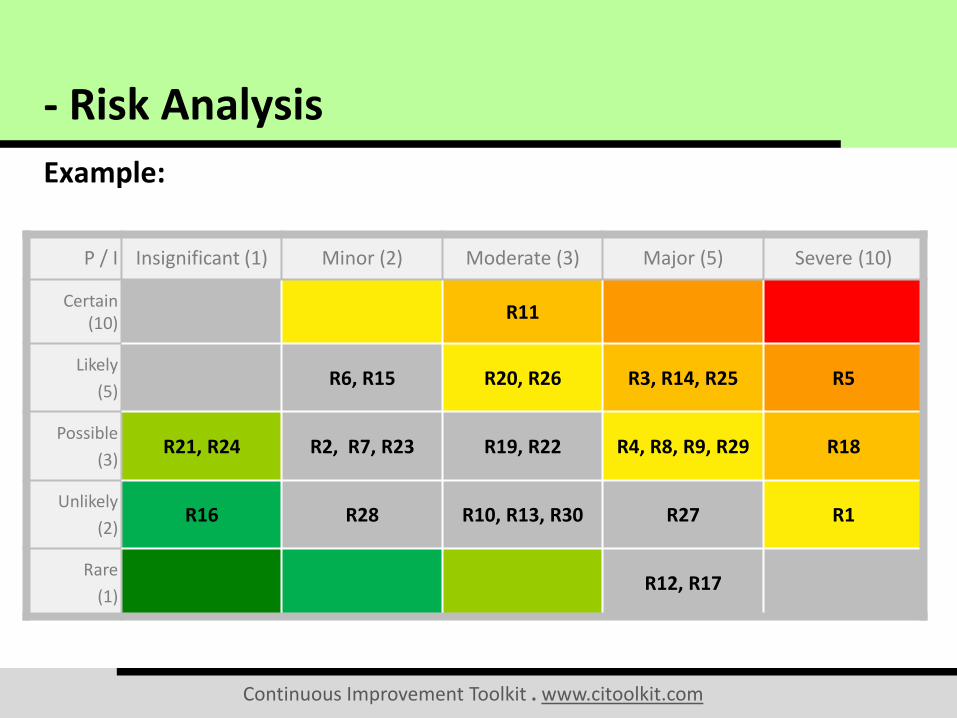
Example:
- Risk Analysis
P / I Insignificant (1) Minor (2) Moderate (3) Major (5) Severe (10)
Certain(10)
R11
Likely
(5)R6, R15 R20, R26 R3, R14, R25 R5
Possible
(3)R21, R24 R2, R7, R23 R19, R22 R4, R8, R9, R29 R18
Unlikely
(2)R16 R28 R10, R13, R30 R27 R1
Rare
(1)R12, R17

Continuous Improvement Toolkit . www.citoolkit.com
Further Information:
A Risk is an undesirable situation which has potential consequences on an investment, a business initiative or a project.
Positive risks that offer opportunities may be pursued to generate enhanced value.• Positive and negative risks are often referred to as opportunities
and threats.
Risk breakdown structure (RBS) is a hierarchical representation of risks according to the risk categories.
- Risk Analysis

Continuous Improvement Toolkit . www.citoolkit.com
Further Information:
Helpful Questions for Identifying Risks:• What do you want to achieve?
• What will stop it being achieved?
• What could go wrong?
• Will the projected benefits be achieved as predicted?
• Will the benefits be achieved at no extra costs?
• Will the necessary resources be available?
• What are the constraints, assumptions and dependencies?
• Are there any potential issues beyond local control?
- Risk Analysis

Continuous Improvement Toolkit . www.citoolkit.com
Further Information:
Examples of Risks:• Project – Going over budget or taking too long on key tasks.
• Operational – Disruption to operation or failures in distribution.
• Procedural – Failures of accountability, systems, or controls.
• Safety – Dangerous chemicals, poor lighting or falling items.
• Human – Illness, injury or death.
• Reputational – Loss of customer or employee confidence.
• Financial – Stock market fluctuations or interest rate changes.
• Technical – Advances in technology, or from technical failure.
• Natural – Weather, natural disasters, or disease.
• Political – Changes in tax, government policy, or foreign influence.
- Risk Analysis

Continuous Improvement Toolkit . www.citoolkit.com
Further Information:
Risk Assessment Tools:• Sensitivity analysis helps determining which risks have the most
potential impact.
• Tornado diagram compares relative importance of variables which have a high degree of uncertainty with those that are more stable.
• Expected monetary value (EMV) calculates the average expected outcomes including scenarios that may or may not happen.
• Decision Tree Analysis helps identify the paths and outcomes of risks which could prevent us achieving our objective. It incorporates the cost of each available choice and the probabilities of each possible scenario.
- Risk Analysis


![idef0.ppt [Sola lettura] [modalità compatibilità]damiani.inf.uniroma3.it/CORSI/MSDM/index_file/idef0-v2.pdf · What is IDEF0? An activityyg modeling method. Supports descriptions](https://static.fdocuments.in/doc/165x107/6041922fa25cca73f576f3db/idef0ppt-sola-lettura-modalit-compatibilit-what-is-idef0-an-activityyg.jpg)