Regulating electricity networks in an age of rising real ...

Ross McKitrick and Elmira Aliakbari
RISING ELECTRICITY COSTS and DECLINING EMPLOYMENT in Ontario’s Manufacturing Sector
OCT. 2017


fraserinstitute.org
2017 • Fraser Institute
Rising Electricity Costs and Declining Employment in
Ontario’s Manufacturing Sector
by Ross McKitrick and Elmira Aliakbari

fraserinstitute.org
Contents
Executive Summary / i
Introduction / 1
1 The Cost of Electricity in Ontario and Other Jurisdictions / 3
2 Ontario’s Manufacturing Sector / 9
3 The Electricity Market in Ontario and the Causes of Rising Electricity Costs / 20
4 An Econometric Analysis of the Impact of High Electricity Costs on Employment in the Manufacturing Sector / 25
Conclusion / 28
References / 30
About the authors / 35
Acknowledgments / 36
Publishing Information / 37
Supporting the Fraser Institute / 38
Purpose, Funding, and Independence / 38
About the Fraser Institute / 39
Editorial Advisory Board / 40

McKitrick and Aliakbari f Rising Electricity Costs and Declining Employment in Ontario f i
fraserinstitute.org
Executive Summary
Ontario used to be a jurisdiction with low electricity costs. This was a competitive advan-tage, helping to attract and keep business and foster economic growth. Recently, how-ever, largely as a result of the Green Energy Act and its induced inefficiencies, Ontario electricity prices have soared, threatening industrial competitiveness, in particular that of the manufacturing sector for which electricity is a major input cost.
Ontario now has the highest electricity costs across all Canadian provinces and among the highest costs in North America. In 2016, large industrial consumers in Toronto and Ottawa paid almost three times more than consumers in Montreal and Calgary and almost twice the prices paid by large consumers in Vancouver. Even some select large industrial consumers (Class A) that were granted rate reductions still paid higher rates than high-demand electricity users in Quebec, Alberta, and British Columbia.
Ontario electricity costs are also among the fastest-growing. Between 2010 and 2016, electricity costs for small industrial consumers in Ottawa increased by 50% and in Toronto, 48%, while the average rate of increase in the rest of Canada was only 15%. Increases for large industrial consumers of electricity in Ontario were likewise far above those in other provinces.
Ontario’s manufacturing sector accounts for almost 40% of Canada’s exports, so its decline is a matter of national concern. Between 2005 and 2015, Ontario’s manufactur-ing output declined by 18% and employment by 28%. Notably, the paper manufacturing and iron and steel sectors, the two most electricity-intensive sectors in Ontario prior to the big price increases, shrank the most: the paper manufacturing sector by 32% and the iron and steel sector by 25%. Manufacturing in all provinces fell during the 2008 recession but bounced back elsewhere in Canada. Only Ontario has failed to recover to pre-recession levels. The drop in employment from 2008 onwards in Ontario was 14%.
Compared to many American and Canadian jurisdictions, Ontario has exhibited the most substantial decline in its manufacturing sector over the past decade. Between 2005 and 2016, while many Northeast jurisdictions that are Ontario’s main competi-tors boosted their manufacturing sector’s share of GDP, in Ontario it declined by 5.1 percentage points. Since Ontario’s manufacturing sector is lagging behind other juris-dictions, global factors such as world demand, exchange rates, and technological change cannot explain the poor performance. What is different for Ontario is the problem of rising electricity costs, which have likely placed too large a financial burden on Ontario’s manufacturing sector and hampered its competitiveness.
Our study documents the decline of Ontario’s manufacturing sector and then seeks to evaluate the role of growing industrial electricity costs. We estimate that about 64% or two thirds of the lost manufacturing jobs from 2008 to 2015 could be attributable
ii f Rising Electricity Costs and Declining Employment in Ontario f McKitrick and Aliakbari
fraserinstitute.org
to rising electricity prices. Taking the provincial government’s claims for its green-energy job-creation initiative at face value at face value, we estimate that Ontario may have lost at least 1.8 permanent manufacturing jobs for every new job created under the green-energy initiative since 2008. This is likely a lower bound, since many of the green-energy jobs were only temporary.
The problem of rising electricity costs is a problem made in Ontario, directly tied to the provincial government’s policy choices, which include aggressively promoting renewable sources, structuring long-term contracts poorly, and phasing out coal. The significant employment losses in Ontario’s manufacturing sector and the overall stag-nant employment and economic growth rates in this province should concern policy makers. We urge the government to consider meaningful reforms aimed at significantly lowering electricity costs in the province.

McKitrick and Aliakbari f Rising Electricity Costs and Declining Employment in Ontario f 1
fraserinstitute.org
Introduction
Over the past decade, the price of electricity for most consumers has increased sub-stantially in Ontario. Between 2013 and 2015, industrial electricity rates rose by 16% (Ontario Chamber of Commerce, 2015) and, according to data from a 2016 Hydro-Québec survey, Ontario residential and industrial customers now pay the highest elec-tricity costs among all major Canadian cities, and face some of the highest costs in all of North America.
Ontario used to be a jurisdiction with low electricity costs. Low power prices were a competitive advantage for this province, helping to attract and keep business and foster economic growth. Recently, however, as a result of the Green Energy Act and its induced inefficiencies, the cost disadvantage compared to other jurisdictions has threatened industries by undermining their capacity to grow, hire new workers, and make invest-ments. A recent study by the Ontario Chamber of Commerce (2015) indicated that one out of 20 businesses in Ontario expects to close in the next five years as a result of high electricity costs. This study also found that high electricity costs crowd out investment opportunities in this province: 40% of industries and businesses were found to have cancelled or delayed their investment decisions.
Electricity is a major input cost for the manufacturing sector. Therefore, rising electricity prices and related items such as the costs of transporting and delivering the power place a financial burden on this sector, hampering its competitiveness. Since a highly competitive environment does not allow manufacturers simply to pass rising input costs on to customers, reduced profit margins can force businesses to close or move to other jurisdictions. As an industry group known as Concerned Manufacturers of Ontario recently explained, the Ontario government will face the prospect of fac-tories moving to other jurisdictions where electricity costs are lower as a result of high electricity prices (CBC News, 2017).
Given the importance of electricity prices and associated costs, and their impact on competitiveness, in this study we first evaluate the extent to which industrial electri-city costs have risen in Ontario and to examine how these cost levels compare to other Canadian and American jurisdictions. As the manufacturing sector is heavily depend-ent on electricity, we next examine the impact of rising power prices on that sector and quantify the total number of related job losses. Many factors such as labour costs, income taxes, exchange rates, global demand could affect the performance of the manufactur-ing sector in Ontario. However, by drawing on the extensive literature on the relation-ship between electricity and labour demand in manufacturing, we are able to isolate and attempt to quantify the impact of rising electricity prices on employment in this sector.

2 f Rising Electricity Costs and Declining Employment in Ontario f McKitrick and Aliakbari
fraserinstitute.org
Overall, we estimate that as many as two thirds of the lost manufacturing jobs from 2008 to 2015 are attributable to rising electricity prices. If we take the provincial gov-ernment’s claims for the green-energy job-creation initiative at face value, and assume that all the new jobs were permanent rather than temporary, we estimate that Ontario may have lost 1.8 permanent manufacturing jobs for every new job created under the green energy initiative since 2008. However, since most of the Ontario jobs attributed to green energy programs, such as building wind farms and manufacturing turbine components, have proven to be temporary, this ratio should be seen as a lower bound.
Our study proceeds as follows. The first section examines the growth of Ontario’s industrial electricity costs and compares them to other Canadian and American juris-dictions. The second section looks at the importance of the manufacturing sector in Ontario and compares it with other jurisdictions, then examines the evolution of the main performance indicators of Ontario’s manufacturing sector and its subsectors over the past few years. Section 3 discusses the electricity market in Ontario and suggests reasons for the rising electricity costs in this province. The final section seeks to iso-late the impact of electricity prices from other factors and to estimate the job losses in Ontario’s manufacturing sector as a result of higher electricity prices.

McKitrick and Aliakbari f Rising Electricity Costs and Declining Employment in Ontario f 3
fraserinstitute.org
1 TheCostofElectricityinOntario andOtherJurisdictions
This section examines the growth in electricity costs faced by industry in Ontario and compares Ontario electricity costs to those of other jurisdictions. The examination relies on a major annual survey undertaken by Hydro-Quebec, as well as data from the government of Ontario and our analysis of industrial electricity costs in Ontario for different classes of customers (Class A and Class B).
Hydro-Québec’s survey (2016) collects information from, or pertaining to, 22 Canadian and American electricity distribution companies and provides average costs of electricity in cents per kilowatt-hour (kWh). This is the delivered cost of electricity on customer bills at specified levels of consumption, including applicable rate riders. The total reported cost of electricity includes the cost of generation plus transmission and distribution service costs, and taxes. [1] Figure 1 presents the increase in electricity costs, inclusive of taxes, for medium-power electricity consumers (small industrial customers) in two major Ontario cities, compared to the rest of Canada. [2] Between 2010 and 2016, electricity costs for this selected group of medium power users increased in Ottawa by 50% and, in Toronto, by 48%, while the average cost in the rest of Canada rose by only 15%. The increases in Ottawa and Toronto are greater than in any of the other cities considered, and more than four times greater than the increase in Montreal, which was only 11%. In fact, consumers in Edmonton and Calgary enjoyed a slight cost decrease of almost 1%. In 2016, the selected group of medium power consumers in Toronto and Ottawa faced the highest all-in electricity costs among all major cities, 16.3¢ and 14.9¢ per kWh, respectively, whereas the same type of consumer in Calgary and Vancouver paid only 6.5¢ and 9.5¢ per kWh.
Data on electricity costs for large power users reveal the same pattern, indicating that electricity costs in Ontario exceed those in the rest of Canada (figure 2). As is shown, while large consumers in Ottawa and Toronto experienced spikes in overall electricity costs of 53% and 46%, respectively, between 2010 and 2016, the average increase in electricity costs in the other Canadian cities included in the survey was only 14%. In 2016, Toronto
[1] Hydro-Québec’s survey reports data based on rates that were in effect as of April 1.[2] The cost of electricity in the rest of Canada (outside Ontario) is calculated based on a population-weighted average of the following 10 cities: St. John’s, Halifax, Charlottetown, Moncton, Montreal, Winnipeg, Regina, Edmonton, Calgary, and Vancouver. These data are not adjusted for national infla-tion since we are mainly interested in the comparative interprovincial changes.

4 f Rising Electricity Costs and Declining Employment in Ontario f McKitrick and Aliakbari
fraserinstitute.org
¢/KW
h
Figure 1: Electricity costs (¢/KWh)—medium power users, 2010 and 2016
Notes: [1] Electricity cost in the rest of Canada is a weighted average of Canadian cities (excluding Ottawa and Toronto) based on 2016 census population data. [2] Medium power users have a power demand of 1,000 KW and monthly counsuption of 400,000 KWh. Source: Hydro-Québec, 2010, 2016.
0
3
6
9
12
15
18
Rest of CanadaToronto, OntarioOttawa, Ontario
20102016
¢/KW
h
Figure 2: Electricity costs (¢/KWh)—large power users, 2010 and 2016
Notes: [1] Electricity cost in the rest of Canada is a weighted average of Canadian cities (excluding Ottawa and Toronto) based on 2016 census population data. [2] Large power users have a power demand of 5,000 KW and monthly counsuption of 3,060,000 KWh. Source: Hydro-Québec, 2010, 2016.
0
3
6
9
12
15
18
Rest of CanadaToronto, OntarioOttawa, Ontario
20102016

McKitrick and Aliakbari f Rising Electricity Costs and Declining Employment in Ontario f 5
fraserinstitute.org
and Ottawa had the first and second highest all-in electricity costs for large consumers among all Canadian cities, at 14.7¢ and 14.6¢ per kWh. Large consumers in Ontario paid almost three times more than consumers in Montreal and Calgary, who paid 6.0¢ and 5.1¢ per kWh over the same year. Similarly, costs in Ontario’s cities were almost twice those paid by large consumers in Vancouver. While electricity costs in Toronto and Ottawa rose significantly, by 53% and 46%, respectively, Montreal observed a modest increase of 10%, and both Edmonton and Calgary experienced declines, of 7% and 5%, respectively.
Although electricity costs in Ontario were the highest in Canada for most businesses in 2016, some select large consumers in Ontario received relief from high electricity costs in the form of subsidies paid by other users. More specifically, in Ontario, unlike other jurisdictions, electricity customers are divided into two categories—Class A and Class B—that pay different electricity rates. Starting in 2011, select industrial electricity users (the Class A customers) were allowed to shift a portion of their electricity costs to the remaining industrial, residential, and commercial users (the Class B customers). These classifications and their differences will be fully discussed in Section 3. In a report released by the Government of Ontario (Ontario Energy Report, 2015), industrial elec-tricity rates in Ontario for large electricity consumers (Class A) were calculated and compared against other jurisdictions. Based on this report, the government claimed that in 2015 the large industrial firms in Ontario (Class A) paid 8.4¢ per kWh. [3] Even these large consumers that were granted rate reductions paid higher rates compared to the large electricity users in Quebec, Alberta, and British Columbia, which paid respect-ively 5.2¢, 5.9¢, and 7.0¢ per kWh for electricity. In other words, industrial electricity rates for Class A customers in Ontario in 2015 were 62%, 42%, and 19% higher than the rates in Quebec, Alberta and British Columbia, respectively.
A more detailed comparison of electricity costs in Ontario relative to other Canadian and American jurisdictions is shown in table 1, which lists average electricity costs (includ-ing taxes) for Toronto, Ottawa, and 14 other North American cities. In 2016, the two Ontario cities included had the highest electricity costs in Canada and among of the highest costs in North America. Out of 16 cities, Toronto and Ottawa ranked third and fourth after New York and Boston. Although New York and Boston had higher electri-city costs than Toronto and Ottawa, the cost differential has been declining over time as Ontario’s cities have been experiencing faster increases. For instance, in 2010, electricity costs for medium power users in Toronto were 85% lower than the electricity costs in New York for the same type of consumers. By 2016, the differential had declined to 51%. The same pattern exists with large consumers. While in 2010 electricity costs in Toronto were 35% lower than costs in New York, the differential had declined to only 7% by 2016.
[3] As of April 2015, only 16 companies in Ontario were registered under the Northern Industrial Electricity Rate, which would receive a rebate of 2¢ per kilowatt hour from the government and pay 6.4¢ rather than 8.4¢ per kWh (Cross, 2017).

6 f Rising Electricity Costs and Declining Employment in Ontario f McKitrick and Aliakbari
fraserinstitute.org
Table 1: Comparison of electricity costs in North American cities for medium and large consumers, 2010, 2016
2010 2016 Percentagechange%M
ediu
m p
ower
use
rsMontreal,QC 8.18 9.11 11.4
Calgary,AB 6.61 6.53 −1.2
Edmonton,AB 9.90 9.89 −0.1
Ottawa,ON 9.93 14.94 50.5
Toronto,ON 10.98 16.27 48.2
Regina,SK 10.33 12.84 24.3
Vancouver,BC 6.91 9.49 37.3
Winnipeg,MB 6.33 7.53 19.0
Boston,MA 15.00 20.25 35.0
Chicago,IL 10.09 9.35 −7.3
Detroit,MI 9.75 11.71 20.1
Miami,FL 9.74 11.54 18.5
Nashville,TN 9.20 13.28 44.3
NewYork,NY 20.35 24.65 21.1
Portland,OR 6.23 10.60 70.1
Seattle,WA 5.67 9.42 66.1
Larg
e po
wer
use
rs
Montreal,QC 5.42 5.95 9.8
Calgary,AB 5.30 5.06 −4.5
Edmonton,AB 7.65 7.12 −6.9
Ottawa,ON 9.53 14.59 53.1
Toronto,ON 10.13 14.74 45.5
Regina,SK 7.73 9.60 24.2
Vancouver,BC 5.98 8.23 37.6
Winnipeg,MB 4.56 5.43 19.1
Boston,MA 12.41 16.25 30.9
Chicago,IL 9.39 7.61 −19.0
Detroit,MI 7.74 8.69 12.3
Miami,FL 8.35 9.49 13.7
Nashville,TN 7.68 11.86 54.4
NewYork,NY 13.71 15.74 14.8
Portland,OR 5.38 8.61 60.0
Seattle,WA 5.60 9.08 62.1
Note: All figures in cents per kWh. Taxes are included. Data are as of April 1. Medium consumers=consumption of 400,000 kwh and de-mand of 1000 kw; Large consumers= consumption of 3,060,000 KWH and power demand= 5,000 KW
Source: Hydro-Québec, 2010, 2016.
McKitrick and Aliakbari f Rising Electricity Costs and Declining Employment in Ontario f 7
fraserinstitute.org
The US data shown in Hydro-Québec’s survey (2016) is at the city level, which may overstate the costs facing industrial users because costs can be lower in nearby towns. The US Energy Information Administration (EIA) publishes surveys of power costs by state and region (US-EIA, 2017). They report average industrial-power costs in June 2016 for New York State of only 6.73¢ (US) per kWh, far below the costs in New York City shown in table 1. Massachusetts’ industrial costs in the EIA survey are compar-able to the Boston costs in the Hydro-Québec survey (12.88¢ per kWh) but costs in Pennsylvania and Ohio average 6.82¢ and 6.74¢ per kWh, respectively, according to the EIA. While the survey methodologies of Hydro-Québec and the EIA differ, making direct comparison difficult, these discrepancies indicate that there may be variations within states that affect the interpretation of US city costs in table 1.
In addition to having some of the highest electricity costs in North America, electri-city costs in the two Ontario cities included in table 1 are also among the fastest growing. As discussed above, between 2010 and 2016, electricity costs faced by large consumers in Ottawa and Toronto rose by 53% and 46%, respectively, compared to 12% and 19% in Detroit and Winnipeg. Consumers in Chicago enjoyed a cost decrease of 19%. The fastest rates of increase were in Portland and Seattle but, even with their rapid rise, their average power costs in 2016 were still below those in Ottawa and Toronto in 2010. As of 2016, Portland’s and Seattle’s electricity costs for large-demand consumers were, respectively, 71% and 62% lower than those in Toronto.
Cost of electricity to class A and class B customers in OntarioThe data reported by Hydro-Québec and the Ontario government do not provide the differences in electricity costs faced by the two classes of Ontario industrial electri-city customers. For this reason, figure 3 displays our estimates of average wholesale delivered electricity costs for industry in Ontario for both Class A and Class B custom-ers from 2008 to 2015. [4] From 2008 to 2015, electricity costs for industrial Class B customers rose dramatically, from 7.7¢ to 12.3¢ per KWh, a 60% price increase. Class A customers, by contrast, paid only 8.6¢ per KWh in 2015, an increase of only 11% from 2008. By comparison, the national Gross Domestic Product deflator (a meas-ure of general production cost increases) rose by only 5.4% over this time (Statistics Canada, 2017f).
[4] The estimated electricity cost presented in figure 3 is the average wholesale delivered cost. This includes the commodity cost—(weighted Hourly Ontario Energy Price (HOEP) and Global Adjustment for Class A and Class B)—, the wholesale market service charge, transmission, the Debt Retirement Charge, and the renewable generation connection monthly compensation settlement credit (which started in 2010). Distribution charges, taxes and payments related to the Capacity-Based Demand Response (CBDR) program are excluded.

8 f Rising Electricity Costs and Declining Employment in Ontario f McKitrick and Aliakbari
fraserinstitute.org
¢/KW
h
Figure 3: Average wholesale delivered cost (¢/KWh) of electricity for industry in Ontario, 2008–2015
Note: The average wholesale delivered cost includes the commodity cost—(weighted Hourly Ontario Energy Price (HOEP) and Global Adjustment for Class A and Class B—, the wholesale market service charge, transmission, the Debt Retirement Charge, and the renewable generation connection monthly compensation settlement credit (which started in 2010). Distribution charges, taxes, and payments related to the Capacity-Based Demand Response (CBDR) program are excluded.Source: IESO, 2017d.
0
2
4
6
8
10
12
14
20152014201320122011201020092008
Class A
Class B

McKitrick and Aliakbari f Rising Electricity Costs and Declining Employment in Ontario f 9
fraserinstitute.org
2 Ontario’sManufacturingSector
The importance of the manufacturing sectorAs of 2016, Ontario accounted for almost half of the manufacturing activity in Canada, followed by Quebec (26%), Alberta (10%), and British Columbia (9%) (figure 4). While Ontario’s manufacturing sector accounted for only 5% of national real GDP and 4% of national employment (Statistics Canada, 2017b, 2017d), it was responsible for nearly 40% of national exports and therefore plays a key role in maintaining the value of our currency and international standard of living. Similarly, while manufacturing accounts for 13% of Ontario’s real GDP and 11% of employment (figure 5, figure 6), it accounts for 90% of the foreign-export revenue generated by the province’s industrial sector (figure 7).
Comparison of manufacturing in Ontario and other jurisdictionsThe manufacturing sector in Ontario, as in other industrialized economies, has faced many challenges over the past several decades as a result of rising competition from emerging markets. There has been a dramatic global shift in production from western economies to emerging markets with lower labour costs. Although Ontario is not alone in having a reduced manufacturing sector, when compared to other jurisdictions in the United States and Canada it exhibits the most substantial decline in manufacturing
Figure 4: Distribution (%) of manufacturing across Canada, 2016
Note: Distribution is calculated based on regions’ share in Canada’s manufacturing output in 2016.Source: Statistics Canada, 2017d, CANSIM table 379-0030.
British Columbia (9%) Atlantic provinces (4%)
Quebec (26%)
Ontario (46%)
Manitoba (3%)
Alberta (10%)
Saskatchewan (2%)

10 f Rising Electricity Costs and Declining Employment in Ontario f McKitrick and Aliakbari
fraserinstitute.org
Figure 7: Contribution (%) of industry to total exports from Ontario, 2016
Source: Innovation, Science and Economic Development Canada, 2017: Trade Data Online.
Mining and Oil and Gas Extraction (8%)
Agriculture, Forestry, Fishing, and Hunting (2%)
Utilities (<1%)
Manufacturing (90%)
0 10 20 30 40 50 60
Manufacturing
Other goods production
Education, health care,and social services
Public administration
Other services
0 10 20 30 40 50 60
Manufacturing
Other goods production
Education, health care,and social services
Public administration
Other services
Figure 5: Sectoral contribution (%) to real GDP in Ontario, 2016
Figure 6: Sectoral contribution (%) to employment in Ontario, 2016
Sources: Statistics Canada, 2017b, CANSIM table 282-0008.
Sources: Statistics Canada, 2017d, CANSIM table 379-0030.
58%
7%
12%
10%
13%
56%
5%
19%
10%
11%
Percentage
Percentage

McKitrick and Aliakbari f Rising Electricity Costs and Declining Employment in Ontario f 11
fraserinstitute.org
output and employment. Figure 8 displays the manufacturing sector share of real GDP across Canadian jurisdictions and the United States in 2005 and 2016. Manufacturing currently accounts for 13% of Ontario’s GDP, down from almost 18% in 2005, and above 20% in 2000. While the share of GDP of Ontario’s manufacturing sector dropped by 5.1 percentage points from 2005 to 2016, the extent of decline in the manufacturing sec-tor’s share of GDP in the United States as a whole was less than 1 percentage point. In fact, many jurisdictions in the American Northeast that are Ontario’s main competitors have boosted their manufacturing sector as a fraction of GDP: Indiana by 1.5 percent-age points, Michigan and Kentucky by almost 1 percentage point.
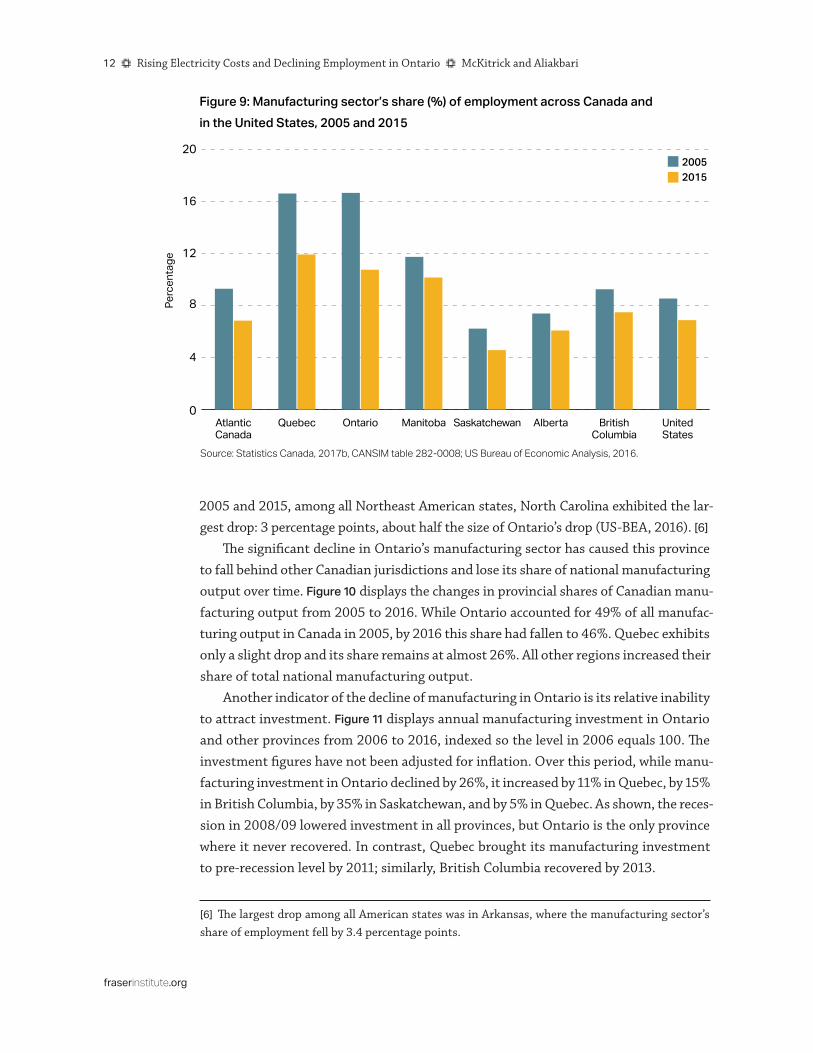
Ontario is also falling behind other jurisdictions for the manufacturing sector’s share of employment, which fell from 16.7% to 10.7% between 2005 and 2015. Although all other Canadian jurisdictions have experienced a decline, as shown in figure 9, Ontario’s was the greatest. Over the same period, the manufacturing share of employment in Quebec, Alberta, and British Columbia fell by 4.7 percentage points, 1.3 percentage points, and 1.8 percentage points, respectively. Figure 9 also displays the manufacturing sector’s share of employment in the United States in 2005 and 2015. [5] Compared to Ontario’s drastic decline of 6 percentage points, the fall in the United States was only 1.7 percentage points. More specifically, declines in Kentucky, Michigan, and Maryland, main American com-petitors to Ontario, were only 1.4, 1.6, and 1.2 percentage points, respectively. Between
[5] Note that US data are only available to 2015.
Perc
enta
ge
Figure 8: Manufacturing sector’s share (%) of real GDP in Ontario, Quebec, other Canadian jurisdictions, and the United States, 2005 and 2016
Sources: Statistics Canada, 2017d, CANSIM table 379-0030; 2017e, CANSIM table 379-0030; US BEA, 2017.
0
4
8
12
16
20
United StatesRest of CanadaQuebecOntario
20052016
12 f Rising Electricity Costs and Declining Employment in Ontario f McKitrick and Aliakbari
fraserinstitute.org
2005 and 2015, among all Northeast American states, North Carolina exhibited the lar-gest drop: 3 percentage points, about half the size of Ontario’s drop (US-BEA, 2016). [6]
The significant decline in Ontario’s manufacturing sector has caused this province to fall behind other Canadian jurisdictions and lose its share of national manufacturing output over time. Figure 10 displays the changes in provincial shares of Canadian manu-facturing output from 2005 to 2016. While Ontario accounted for 49% of all manufac-turing output in Canada in 2005, by 2016 this share had fallen to 46%. Quebec exhibits only a slight drop and its share remains at almost 26%. All other regions increased their share of total national manufacturing output.
Another indicator of the decline of manufacturing in Ontario is its relative inability to attract investment. Figure 11 displays annual manufacturing investment in Ontario and other provinces from 2006 to 2016, indexed so the level in 2006 equals 100. The investment figures have not been adjusted for inflation. Over this period, while manu-facturing investment in Ontario declined by 26%, it increased by 11% in Quebec, by 15% in British Columbia, by 35% in Saskatchewan, and by 5% in Quebec. As shown, the reces-sion in 2008/09 lowered investment in all provinces, but Ontario is the only province where it never recovered. In contrast, Quebec brought its manufacturing investment to pre-recession level by 2011; similarly, British Columbia recovered by 2013.
[6] The largest drop among all American states was in Arkansas, where the manufacturing sector’s share of employment fell by 3.4 percentage points.
Perc
enta
ge
Figure 9: Manufacturing sector’s share (%) of employment across Canada and in the United States, 2005 and 2015
Source: Statistics Canada, 2017b, CANSIM table 282-0008; US Bureau of Economic Analysis, 2016.
0
4
8
12
16
20
UnitedStates
BritishColumbia
AlbertaSaskatchewanManitobaOntarioQuebecAtlanticCanada
20052015

McKitrick and Aliakbari f Rising Electricity Costs and Declining Employment in Ontario f 13
fraserinstitute.org
Perc
enta
ge c
hang
e
Figure 10: Percentage change in provincial shares in total national manufacturing output across Canada, 2005–2016
Source: Statistics Canada, 2017d, CANSIM table 379-0030.
−3.0
−2.5
−2.0
−1.5
−1.0
−0.5
0.0
0.5
1.0
1.5
BritishColumbia
AlbertaSaskatchewanManitobaOntarioQuebecAtlanticCanada
Inde
x (2
006
= 10
0)
Figure 11: Manufacturing investment across selected Canadian provinces, 2006–2016
Source: Statistics Canada, 2017a, CANSIM table 029-0045.
50
100
150
200
250
300
20162015201420132012201120102009200820072006
Ontario
British Columbia
Saskatchewan
Quebec ManitobaAlberta

14 f Rising Electricity Costs and Declining Employment in Ontario f McKitrick and Aliakbari
fraserinstitute.org
The fact that Ontario’s manufacturing sector is lagging behind other Canadian provinces is also reflected in the level of manufacturing sales (figure 12). Between 2003 and 2016, manufacturing sales in Ontario first declined by more than any other province during the 2008/09 recession, and then recovered slowly so as to end the interval with a slight decline of almost 1% while all other provinces experienced net growth: British Columbia by 16%, Alberta by 26%, Quebec by 4%, Manitoba by 40%, and Saskatchewan by 85%.
Global factors such as world demand, exchange rates, and technological change can-not explain the poor performance of Ontario’s manufacturing sector, since it is clearly lagging behind multiple comparable Canadian and American jurisdictions. What is dif-ferent in Ontario are rising electricity costs, which have likely placed too large a finan-cial burden on Ontario’s manufacturing sector and hampered its competitiveness. In an earlier study for the Fraser Institute, McKitrick (2013) highlighted the vulnerability of the mining and manufacturing sectors in Ontario to rising electricity costs and these projections have proven consistent with subsequent events.
Further indicators of manufacturing decline in OntarioIn this section, we look at the main macroeconomic indicators of the manufacturing sector and assess their trends over the past few years to examine how rising electricity costs, compounded by other factors, have affected the economy in Ontario. Figure 13 displays real GDP and employment (number of jobs) for Ontario’s manufacturing sector since 2005. From 2005 to 2015, Ontario’s manufacturing sector experienced
Inde
x (2
003
quar
ter 1
= 1
00)
Figure 12: Manufacturing sales across selected Canadian provinces, 2003–2016
Source: Statistics Canada, 2017c, CANSIM table 304-0015.
50
100
150
200
250
20162015201420132012201120102009200820072006200520042003
Ontario
British Columbia
Saskatchewan
Quebec
Manitoba
Alberta

McKitrick and Aliakbari f Rising Electricity Costs and Declining Employment in Ontario f 15
fraserinstitute.org
declines on the order of 18% in real output and 28% in employment. The substantial job losses in manufacturing over the past decade (down from 957,875 jobs in 2005 to 688,735 jobs in 2015) offset gains from employment growth in other sectors such as construction and retail trade, resulting in a net employment growth rate of 8% for Ontario over the interval from 2005 to 2015. By comparison, over the same time span, Alberta saw employment growth rates of 25%, Saskatchewan, of 18%, Quebec, of 11% and British Columbia, of 10% (Statistics Canada, 2017g). During the same period, national employment grew by 11%.
The 18% decline in the real output of Ontario’s manufacturing sector from 2005 to 2015 occurred while the provincial economy witnessed modest growth in output of 14%. Over the same period, real output in British Columbia grew by 23%, in Alberta, by 29%, in Saskatchewan, by 23%, and in Manitoba, by 26% (Statistics Canada, 2017d). The Canadian economy as a whole grew by 18% over the same period, indicating that Ontario had been lagging behind the country.
Figure 14 displays the evolution of inflation-adjusted net imports, investment, and sales (shipments) for Ontario manufacturing over the same period against change in the exchange rate (CA$ per US$). From 2005 to 2015, inflation-adjusted net imports of manufactured goods in Ontario experienced a dramatic increase of 153%, reaching $102.3 billion (in 2015 dollars) compared to 2005’s record of $40.5 billion. The substan-tial run-up in net imports is the result of a 9% decline in manufacturing exports and a 17% rise in manufacturing imports over the same period.
The 9% decline in Ontario’s manufacturing exports occurred despite the deprecia-tion of the Canadian dollar since 2011. Data from Innovation, Science and Economic
Inde
x (2
005
= 10
0)
Figure 13: Output and employment trends of manufacturing sector in Ontario, 2005–2015
Note: Output is represented by real GDP (2007 chained dollars). Employment is based on the total number of jobs. Source: Statistics Canada, 2017d, CANSIM table 379-0030; 2017g, CANSIM table 383-0031.
60
70
80
90
100
110
120
20152014201320122011201020092008200720062005
Employment
Real GDP

16 f Rising Electricity Costs and Declining Employment in Ontario f McKitrick and Aliakbari
fraserinstitute.org
Development Canada (ISED, 2017) show clearly that the United States is the major export destination for Ontarian manufacturers, representing 87% of exports in 2016. Therefore, the movement of the Canada-US exchange rate (CA$ per US$) can play a vital role in benefiting or worsening the performance of manufacturing exports. As fig-ure 14 shows, the Canadian dollar depreciated more than 22% between 2011 and 2015, making manufactured goods in Ontario less expensive in the United States. However, despite this movement in the exchange rate favourable to exporters, foreign exports did not rebound. As exports declined and imports of manufactured goods into Ontario increased quickly, Ontario was left with a trade deficit that ran as high as $102.3 billion (in 2015 dollars).
Manufacturing sales (in real values) experienced a decline of 20%, from $30.2 bil-lion in 2005 to $24.1 billion in 2015. Although the global economic crisis in 2008, which caused demand to plummet, likely played a significant role in reducing sales, other fac-tors such as rising electricity costs have prevented them from bouncing back. From 2005 to 2009, manufacturing sales declined by 32.1%, an average annual rate of −6.4%. Between 2009 and 2015, manufacturing sales started to improve but only by an annual growth rate of 2.5%. As shown in the previous section, over the past few years, manu-facturing sales in other provinces outperformed those in Ontario. This suggests that the poor performance of Ontario’s manufacturing sector is due to reasons specific to this province, such as the sharp upward trend in electricity costs.
0
30
60
90
120
201520142013201220112010200920082007200620050.7
0.8
0.9
1.0
1.1
CA$
billio
nsFigure 14: Net imports, investment, and sales (CA$ billions) of manufacturing sector in Ontario; and exchange rate—Canadian dollar to US dollar, 2005–2015
Note: Annual sales data are calculated based on an average of monthly sales data. Inflation-adjusted so the final value in 2015 coincides with nominal.Sources: Innovation, Science and Economic Development Canada, 2017: Trade Data Online; Statistics Canada, 2017a, CANSIM table 029-0045; 2017c, CANSIM table 304-0015; 2017h, CANSIM table 383-0033; Canadian Forex, 2017.
Exch
ange
rate
—CA
$ to
one
US$
Sales
Investment
Exchange rate
Net imports

McKitrick and Aliakbari f Rising Electricity Costs and Declining Employment in Ontario f 17
fraserinstitute.org
During this time, real capital expenditure in the manufacturing sector fell by almost 27% between 2006 and 2015. [7] As discussed previously, Ontario is the only province that witnessed a significant decline in investment in manufacturing during that period. Overall, despite having benefitted from depreciation of the Canadian dollar against the US dollar, and even plunging oil and natural gas prices that would lower expenses for manufacturers, Ontario’s manufacturing sector has significantly shrunk and not rebounded to its pre-recession level.
A closer look at manufacturing sub-sectors in OntarioIn this section, we examine macroeconomic indicators of large manufacturing electri-city consumers in Ontario and assess the performance of these sub-sectors from 2005 to 2015. Table 2 shows 2007 electricity intensity (GWh per $ million output) and GDP share for six major industry groups: paper and pulp manufacturing; petroleum refin-eries; chemical manufacturing; iron and steel; motor-vehicle manufacturing; and mis-cellaneous manufacturing. As is clear, electricity intensity varies a great deal—indeed ten-fold across these sectors—which indicates that increases in energy prices will have larger effects on some sectors than others.
This is borne out by other indicators of sectoral changes. Table 3 presents changes in employment, net imports, sales, investment, [8] and electricity demand (consumption) from 2005 to 2015 for six manufacturing groups, ranked by the magnitude of the decline
[7] 2006 is the earliest year for which data is available.[8] Data on investment is based on CANSIM table 029-0045 (Statistics Canada, 2017a), which does not provide investment data on all sub-sectors of manufacturing sector.
Table 2: Electricity intensity and output share of Ontario's manufacturing subsectors, 2007Electricityintensity
(GWh/milliondollaroutput)Outputshare(%)
Pulp&Paper 1.39 3.53
Refineries 1.24 1.47
Chemicals 0.28 7.57
Iron&Steel 1.39 3.60
MotorVehicle 0.14 10.30
Miscellaneous 1.17 2.16
Sources: Independent Electricity System Operator, 2016a; Statistics Canada, 2017d, CANSIM table 379-0030.
18 f Rising Electricity Costs and Declining Employment in Ontario f McKitrick and Aliakbari
fraserinstitute.org
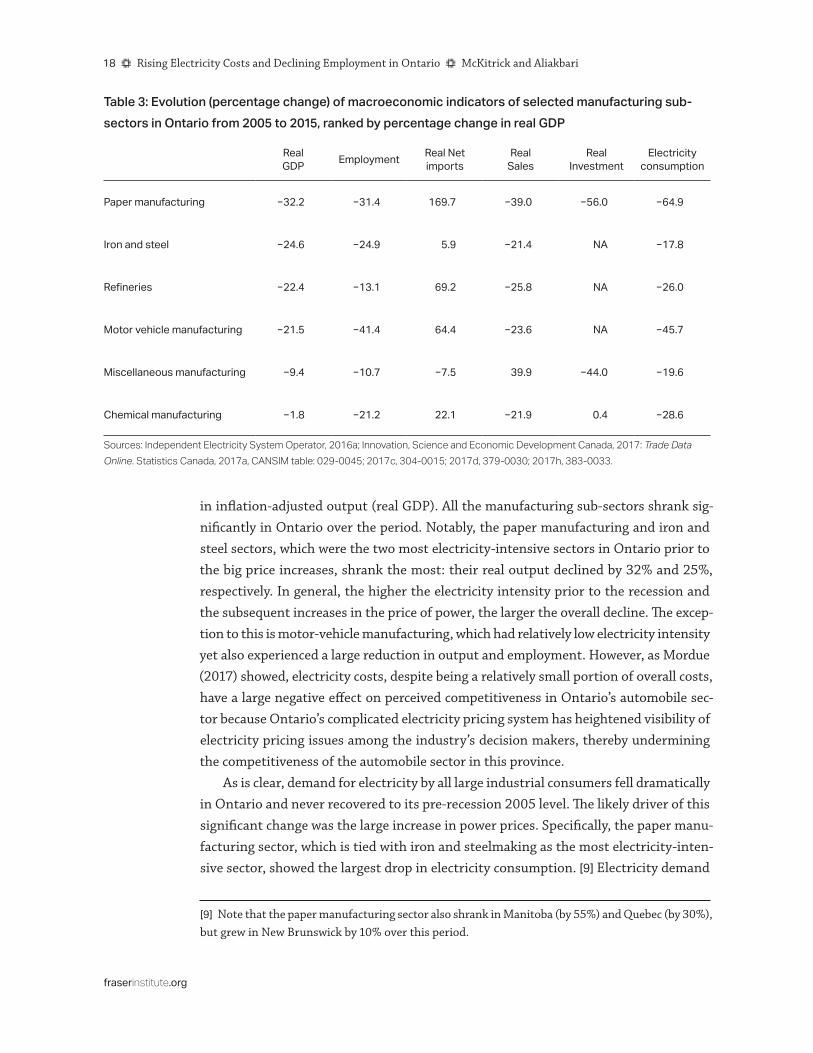
in inflation-adjusted output (real GDP). All the manufacturing sub-sectors shrank sig-nificantly in Ontario over the period. Notably, the paper manufacturing and iron and steel sectors, which were the two most electricity-intensive sectors in Ontario prior to the big price increases, shrank the most: their real output declined by 32% and 25%, respectively. In general, the higher the electricity intensity prior to the recession and the subsequent increases in the price of power, the larger the overall decline. The excep-tion to this is motor-vehicle manufacturing, which had relatively low electricity intensity yet also experienced a large reduction in output and employment. However, as Mordue (2017) showed, electricity costs, despite being a relatively small portion of overall costs, have a large negative effect on perceived competitiveness in Ontario’s automobile sec-tor because Ontario’s complicated electricity pricing system has heightened visibility of electricity pricing issues among the industry’s decision makers, thereby undermining the competitiveness of the automobile sector in this province.
As is clear, demand for electricity by all large industrial consumers fell dramatically in Ontario and never recovered to its pre-recession 2005 level. The likely driver of this significant change was the large increase in power prices. Specifically, the paper manu-facturing sector, which is tied with iron and steelmaking as the most electricity-inten-sive sector, showed the largest drop in electricity consumption. [9] Electricity demand
[9] Note that the paper manufacturing sector also shrank in Manitoba (by 55%) and Quebec (by 30%), but grew in New Brunswick by 10% over this period.
Table 3: Evolution (percentage change) of macroeconomic indicators of selected manufacturing sub-sectors in Ontario from 2005 to 2015, ranked by percentage change in real GDP
Real GDP Employment RealNet
importsReal Sales
RealInvestment
Electricityconsumption
Papermanufacturing −32.2 −31.4 169.7 −39.0 −56.0 −64.9
Ironandsteel −24.6 −24.9 5.9 −21.4 NA −17.8
Refineries −22.4 −13.1 69.2 −25.8 NA −26.0
Motorvehiclemanufacturing −21.5 −41.4 64.4 −23.6 NA −45.7
Miscellaneousmanufacturing −9.4 −10.7 −7.5 39.9 −44.0 −19.6
Chemicalmanufacturing −1.8 −21.2 22.1 −21.9 0.4 −28.6
Sources: Independent Electricity System Operator, 2016a; Innovation, Science and Economic Development Canada, 2017: Trade Data Online. Statistics Canada, 2017a, CANSIM table: 029-0045; 2017c, 304-0015; 2017d, 379-0030; 2017h, 383-0033.
McKitrick and Aliakbari f Rising Electricity Costs and Declining Employment in Ontario f 19
fraserinstitute.org
in this sector fell by 65% compared to 2005 and by 2015 was even below its 2009 level, during the worst of the recession. The substantial decrease in electricity demand in this sector was accompanied by lower employment and output and lower investment. Between 2005 and 2015, employment, real investment, and real output declined by 32%, 56%, and 32%, respectively, yet this was not apparently demand-driven since real net imports increased substantially, by approximately 170%. The substantial increase in net imports from 2005 to 2015, despite there being lower exchange rates in recent years, points to the relative loss of competitiveness of the domestic producers, which again points to a problem of high power prices.
Like paper manufacturing, the iron and steel sector also relies heavily on electricity. Most likely because of higher electricity costs, iron and steel businesses faced a large cost increase and reduced electricity consumption by almost 18% and employment by almost 25%. The substantial shrinkage in input demand resulted in output shrink-age of approximately 25% in this sector. Chemical manufacturing, which is one of the least vulnerable sectors to rising electricity prices in Ontario, experienced the smallest shrinkage from 2005 to 2015: its real output declined by approximately 2% and its real investment grew by less than 1%. Overall, all these Ontarian manufacturing sub-sectors, despite having favourable trends in the exchange rate and oil prices over the past few years, shrank significantly and as of 2016 had not rebounded to their pre-recession levels.

20 f Rising Electricity Costs and Declining Employment in Ontario f McKitrick and Aliakbari
fraserinstitute.org
3 TheElectricityMarketinOntarioandtheCausesofRisingElectricityCosts
As discussed previously, industrial electricity prices have risen dramatically in Ontario for Class B customers since 2008. This change, coupled with a substantial reduction in electricity consumption by large consumers, is a result of a supply-side shock to the Ontario electricity market. Likely in part because of higher electricity costs, the manufacturing sector reduced its power demand and shrank substantially. The fol-lowing discussion reviews the main policy shifts as they relate to rising electricity costs in Ontario.
In May 2009, the province passed the Ontario Green Energy and Green Economy Act, which sought to expand production of renewable energy, encourage energy con-servation, and create new jobs. Its centrepiece was a program called the Feed-in Tariff, designed to accelerate investment in renewable energy sources. Under this program, the province started offering long-term guaranteed contracts to generators with renew-able sources at a fixed purchase price above market electricity prices. In other words, generators using wind, solar, hydroelectric, and bio-energy plants received a fixed price without being subject to competition in the market. In fact, some of these generators were to be paid not for generating electricity, but for having generating capacity avail-able on-call (McKitrick and Adams, 2014).
The fixed prices paid to these generators were based on two components charged to electricity customers in the market: the wholesale market price, which is referred to as the Hourly Ontario Energy Price (HOEP), and the Global Adjustment (GA). The HOEP is an average market-clearing price for each hour, based on the demand and supply for electricity, and is determined by a competitive process through offers submitted by generators. The GA is a payment that makes up the difference between the wholesale price and the fixed contract rates in relation to the Feed-in-Tariff program for renew-able sources, including the costs of the Ontario conservation, gas-capacity expansion, and nuclear-power refurbishment programs. Such programs are examples of further non-market intervention by the provincial government. [10] Therefore, the GA has
[10] In an earlier study from the Fraser Institute (Jackson, Stedman, Aliakbari, and Green, 2017), the authors broke down the cost of the Global Adjustment into its components. They showed that, in 2016, the two single largest components of the GA were the results of contracts for nuclear energy, natural gas, and hydroelectric. However, combined renewable energy components—wind, solar, and biomass—made up almost 30% of the cost of the GA.

McKitrick and Aliakbari f Rising Electricity Costs and Declining Employment in Ontario f 21
fraserinstitute.org
an inverse relationship with the HOEP and can be negative or positive depending on whether the HOEP is higher or lower than the guaranteed fixed rates for generators.
The HOEP and the GA, which together constitute the commodity cost, are only a por-tion of total electricity cost. The remainder is made up of transmission and distribution charges, wholesale market services, and a tax called the Debt Retirement Charge (DRC). However, among all the components of electricity costs, the commodity portion is the largest one, accounting for 62% of the total cost of electricity in 2014 (Auditor General of Ontario, 2015). The commodity cost has also been the fastest growing segment of total electricity costs, rising by 45% (adjusted for inflation) from 2005 to 2016. Figure 15 shows this evolution of the commodity cost, along with its two components, the HOEP and the GA, from 2005 to 2016. In 2005, the GA was a credit to electricity customers of almost 1¢ per KWh; however, between 2005 and 2016 it rose dramatically to become a cost of almost 10¢ per KWh. The significant increase in the GA occurred while the wholesale electricity component declined steadily over the same period, [11] becoming a relatively small fraction of the commodity cost. Therefore, it is clear that the cause of rising Ontario electricity prices has been the drastic increase in the GA, not the wholesale price.
[11] The decline in the HOEP could to some extent be explained by strategic behaviour of renewable generators in the electricity market. As these generators were guaranteed fixed prices for generating electricity, they would bid low in the wholesale electricity market to distort the HOEP in order to ensure that electricity from their units would be dispatched. As a result of this strategic behaviour, between 2009 and 2014, the HOEP was negative for almost 2,000 hours or equivalently 83 days (Auditor General of Ontario, 2015; Fremeth, Holburn, Loudermilk, and Schaufele, 2017).
¢/KW
h
Figure 15: Real commodity cost (¢/KWh), total and by component (GA, HOEP), 2005–2016
Note: Inflation-adjusted so final value coincides with nominal.Source: Independent Electricity System Operator, 2017a.
−2
0
2
4
6
8
10
12
201620152014201320122011201020092008200720062005
Commodity cost
Hourly Ontario Energy Price (HOEP)
Global Adjustment (GA)

22 f Rising Electricity Costs and Declining Employment in Ontario f McKitrick and Aliakbari
fraserinstitute.org
Not all of the increase in the GA (and by extension in the cost of electricity) is attributable to renewable sources, but aggressively promoting renewable energies under the Feed-in-Tariff program has increased the cost of electricity more than necessary in Ontario. Based on the Ontario Auditor General’s 2015 Annual Report (2015), the 20-year guaranteed-price renewable-energy contracts have caused electricity consumers to pay $9.2 billion more than they would have paid under the previous program’s guaranteed prices. This report also found the guaranteed prices offered to wind and solar gener-ators in Ontario were double the market price for wind and three-and-a-half times the market price for solar.
The high cost associated with renewable generators becomes even more problematic when considering the contribution of these fuels to electricity generation in Ontario. In 2016, combined solar, wind, and biomass sources generated less than 7% of electricity in Ontario while accounting for almost 30% of the GA (Jackson, Stedman, Aliakbari, and Green, 2017). McKitrick and Adams (2014) also estimated that, as of 2013, renew-ables generated only 4% of Ontario’s electricity while accounting for about 20% of the average commodity cost.
A recent report of the Ontario Energy Board (2016) estimated the annual average generation costs by fuel type in Ontario, based on total payments to contracted gener-ators and contribution of different generation sources to electricity supply. Table 4 pre-sents this estimated generation cost by fuel type for the period from November 2016 to October 2017: nuclear and hydroelectric generators, despite providing the majority of electricity output in Ontario, received much lower rates than wind, solar, and biofuel generators. The rate paid to solar generators ($480 per MWh) is more than seven times the rate paid to nuclear generators ($66 per MWh) and more than eight times the rate paid to hydroelectric generators ($58 per MWh)
Table 4: Average generation costs ($/MWh) by fuel type in Ontario
Costs($/MWh) Costs($/MWh)
Wind 140 Nuclear 66
Solar 480 Hydro [1] 58
Bioenergy 131 Gas [2] 173
Notes: [1] Hydro excludes non-utility generators (NUGs) and generation not prescribed by Ontario Power Generation (OPG). [2] Gas includes Lennox, NUGs, and OPG bio-energy facilities. In spite of low natural gas prices, the antici-pated cost of power from natural gas is really high. This can likely be attributed to the low-capacity use of natural-gas generation assets (Fremeth, Holburn, Loudermilk, and Schaufele, 2017).
Sources: Ontario Energy Board, 2016.

McKitrick and Aliakbari f Rising Electricity Costs and Declining Employment in Ontario f 23
fraserinstitute.org
In addition to its aggressive promotion of renewable energy sources, Ontario under-took another major structural shift that has contributed to rising electricity costs in the province. In 2005, the provincial government started a process to phase out coal-fired plants, which was one of the least expensive and most flexible sources of gener-ating electricity. The elimination of all coal-fired plants eventually took place in 2014 when completion of new gas-fired power plants and the shrinking of domestic power demand made the phase-out possible. However, as shown previously (McKitrick and Aliakbari, 2017; McKitrick, 2013), this policy has resulted in excessive cost and little environmental benefit.
Between 2005 and 2015, in view of the stated intention to facilitate the coal phase out, the province increased its renewable capacity—solar, wind, and bio-energy—by 18% (IESO, 2016b). However, since renewable energy sources are not as reliable as trad-itional sources, over the same period, the government contracted for more natural gas capacity as a back-up to renewable sources, increasing gas capacity by 9%. As a result, the province realized a 26% increase in the total amount of installed capacity from 2005 to 2015 (IESO, 2016b) although, as shown by the Auditor General of Ontario (2011) and McKitrick (2013), increased wind and solar capacity does not translate into increased effective capacity because of its dependence on weather conditions.
While the province has increased its installed generation capacity over the past few years, the demand for electricity has declined as a result of rising electricity costs, fall-ing natural gas prices, the global recession, and other factors. Between 2005 and 2015, electricity demand declined by 13% (IESO, 2017b). The increase in the total installed capacity coupled with lower electricity demand has resulted in a significant oversupply, which must often be exported to other jurisdictions at prices below cost, but at market value. From 2009 to 2014, Ontario exported 95.1 million MWh of electricity to other jurisdictions and received about $3.1 billion less than what it had cost to generate that electricity (Auditor General of Ontario, 2015).
As a result of these structural shifts and poor governance, electricity costs have risen substantially in Ontario and the costs have been transferred to electricity customers. However, the allocation of the cost is not evenly split between customers since Class A (large industrial customers) and Class B (residual customers) are charged different rates. Class A includes eligible [12] large industrial customers that participate in the Industrial
[12] Initially, electricity consumers with average peak demand above 5 MW were eligible to partici-pate in the Industrial Conservation Initiative (ICI) program and receive rate reduction. However, the government recently reduced the threshold to include more customers. In January 2017, the ICI was expanded to electricity users with a peak demand over 1 MW. In April 2017, under Ontario’s Fair Hydro Plan, the threshold was further reduced to include certain industries with an average monthly peak demand of greater than 500 kW. However, these recent changes do not affect our analysis as the time span in this study does not include 2017.

24 f Rising Electricity Costs and Declining Employment in Ontario f McKitrick and Aliakbari
fraserinstitute.org
Conservation Initiative (ICI) program and pay the GA cost based on their percentage contribution to the top five peak Ontario demand hours over a year. Class B customers pay the GA based on their energy usage calculated on a KWh basis. Class A custom-ers can reduce their GA costs by reducing their electricity demand during peak hours, thereby shifting a portion of their GA cost to Class B customers. As shown in Section 1, as a result of this shifting of costs, electricity rates faced by Class A customers have seen a more modest rise over the past few years, increasing by about 11% from 2008 to 2015, [13] but this has come at the expense of even higher rate increases for Class B customers. According to the IESO website (2017c), approximately 300 large electricity consumers in Ontario are currently classified as Class A customers, while the majority of businesses—approximately 55,000 medium and large companies—are classified as Class B customers and have been exposed to rapid increases in electricity prices.
[13] Although Class A customers can receive rate reductions, predicting the five top peak hours in Ontario and shifting electricity consumption to off-peak hours can be challenging for industrial cus-tomers. Many industries now suffer from uncertainties on what their future electricity bills might be (Cross, 2017).

McKitrick and Aliakbari f Rising Electricity Costs and Declining Employment in Ontario f 25
fraserinstitute.org
4 AnEconometricAnalysisoftheImpactofHighElectricityCostsonEmploymentintheManufacturingSector
Ontario’s manufacturing sector has experienced a significant decline over the past dec-ade and, as discussed previously, we cannot blame global factors since other provinces and regions have not shown the same pattern, and the decline has happened despite a falling exchange rate. It is very likely that rising electricity costs in Ontario since 2008 have caused much of the damage to the manufacturing sector by increasing costs and hampering competitiveness. Between 2008 and 2015, manufacturing employment in Ontario declined by 14.4%, falling by 116,435 jobs from 805,170 to 688,735. In this section, we try to isolate the impact of rising electricity costs from other competitive factors, and to quantify the job loss in the manufacturing sector of Ontario attribut-able to high electricity costs.
In order to examine this impact, we need to look at the interrelationship between electricity and labour as input factors in the production process and estimate cross-price elasticities between electricity prices and labour demand. [14] As micro-level data on the manufacturing sector in Ontario was not publicly available, we use findings from the existing extensive literature on cross-price elasticities between electricity and labour and roughly quantify the influence of high electricity costs on Ontario employment from 2008 to 2015.
Cox, Peichl, Pestel, and Siegloch (2014) estimated labour-demand effects of rising electricity prices for the German manufacturing sector over the period from 2003 to 2007 while taking into account differentiation among skill levels. In the case where out-put levels were variable, they found negative cross-price elasticities between employ-ment and electrical energy and the magnitude of the impact differed across skill levels. They found electricity prices moderately affected the demand for high- and low-skilled workers, while the effects for medium-skilled workers were negligible. Specifically, the cross-price elasticities were found to be −0.69 for high-skilled workers, −0.48 for low-skilled workers, and −0.06 for medium-skilled workers.
Deschenes (2012) estimated employment/electricity price elasticities for the United States using data from 1976 to 2007 on 12 industries and found negative cross-price
[14] In economics, cross-price elasticity of demand measures the responsiveness of the quantity demanded for a good to a change in the price of another good, other things being equal.

26 f Rising Electricity Costs and Declining Employment in Ontario f McKitrick and Aliakbari
fraserinstitute.org
elasticities ranging from −0.10 to −0.16. Kahn and Mansur (2013) also estimated cross-price elasticity between labour and the price of electricity using US data broken down by county and industry over the period from 1998 to 2009. They estimated cross-price elasticities for specific sectors by looking at 21 manufacturing industries and 15 major non-manufacturing industries. Their findings revealed that the more electricity-intensive industries such as primary metals and paper manufacturing were more responsive in terms of employment when facing higher electricity prices. Specifically, on average, 21 manufac-turing industries had an elasticity of −0.227 while paper manufacturing had elasticity of
−0.47, and transportation equipment, elasticity of -0.80. The most electricity-intensive manufacturing industry, primary metals, had an elasticity of −1.17. [15] In this study, we use the results of Kahn and Mansur (2013), which looked at US manufacturing, to assess the impact of high electricity prices on employment in Ontario’s manufacturing sector. While there are some differences between the US and Canadian manufacturing labour markets, we deem Kahn and Mansur’s study (2013) to yield the most comparable results.
As discussed in Section 1, different industries in Ontario pay different electricity rates, classified as Class A and Class B. The Class A industrial customers are approximately 300 companies, accounting for one fifth of total electricity consumption in Ontario, and have paid reduced global adjustment rates over the past few years, experiencing a price growth of 11% from 2008 to 2015. However, Class B industrial customers make up the majority of companies in Ontario (approximately 99.5 % of total businesses) and experienced a dramatic price increase of 60% over the same period. As a result of the existence of different industrial electricity rates, we need to consider the weighted average growth in industrial electricity prices in Ontario when examining the impact on labour demand. Considering the electricity contribution of different customer types to the total industrial electricity consumption in Ontario, the weighted average growth in industrial electricity prices from 2008 to 2015 becomes roughly equal to 41%. [16]
[15] It is worth pointing out that the cross-elasticity estimates reported in the literature may be biased if there were factors in the regression models that were correlated with labour demand and electricity prices (Deschenes, 2012).[16] Based on the data provided by the Independent Electricity System Operator (IESO) at our request, we calculated that, in 2013, Class A customers consumed 2.025 terawatt hours (TWh) of electricity (based on monthly averages) while Class B customers (both industrial and non-industrial users) consumed 9.745 TWh. As data on total industrial electricity consumption in Ontario was not available, we assumed that Ontario’s industry is similar to the case of industrial consumption in Canada, which accounted for 44% of total electricity use in 2013 (Natural Resources Canada, 2016. Therefore, total industrial electricity consumption in Ontario in 2013 becomes roughly equal to 5.178 TWh. Given the total industrial electricity use and the consumption level of Class A customers in 2013, it becomes clear that Class A industrial customers accounted for 39% of total industrial electricity use in 2013 while Class B industrial customers accounted for 61% of total industrial consumption. Given the calculated weights for Class A and Class B customers, which are based on their industrial electricity consumption, the weighted average of the price growth from 2008 to 2015 is almost 41%.

McKitrick and Aliakbari f Rising Electricity Costs and Declining Employment in Ontario f 27
fraserinstitute.org
Kahn and Mansur (2013) report a range of elasticity estimates by sector. We will use the overall estimated cross-elasticity of −0.227 between labour demand and the price of electricity, which is a conservative choice because some of the dominant sectors in Ontario, such as automobiles and primary metals, have elasticities much higher than the average in their sample. Using this elasticity, the 41% increase in industrial elec-tricity prices in Ontario from 2008 to 2015 would imply a 9.3% employment loss, or 74,881 jobs, over the same period. [17] Of the lost 116,435 jobs, the remaining 41,554 over the same period can likely be attributed to other factors.
Thus we find about 64%, or two thirds, of the total loss in manufacturing jobs since 2008 can be attributed to higher electricity prices. The province claims that the Green Energy Act created about 42,000 new jobs but, as the Annual Report of the Auditor General of Ontario (2011) estimated, the majority of these were likely construction jobs and temporary positions. Supposing they were all permanent, this would imply that Ontario lost about 1.8 permanent manufacturing jobs from higher electricity prices for every new job created by the green energy initiative, [18] a result similar to that found in other jurisdictions (Alvarez et al., 2010). However, since most of the new jobs in Ontario attributed to green-energy programs, such as building wind farms and manu-facturing turbine components, have proven to be temporary (National Post, 2017, July 18), this ratio should be seen as an approximate lower bound. If only half the new jobs were permanent, the corresponding loss ratio would be 3.6 manufacturing jobs lost for every new one gained. The significant employment losses in Ontario’s manufacturing sector and the overall stagnant employment growth rate of this province over the past few years should concern policy makers in this province and those in other provinces who may be contemplating similar policies.
[17] The 74,881 job losses in this sector as a result of high electricity costs is equivalent to almost 11% of total employment of Ontario’s manufacturing sector in 2015.[18] 74,881 divided by 42,000 is approximately 1.8.

28 f Rising Electricity Costs and Declining Employment in Ontario f McKitrick and Aliakbari
fraserinstitute.org
Conclusion
Ontario has the highest electricity cost across all Canadian provinces and among the highest costs in North America. In 2016, large industrial consumers in Toronto and Ottawa paid almost three times more than consumers in Montreal and Calgary. Even some select large industrial consumers (Class A) that were granted rate reductions still paid higher rates compared to the large electricity users in Quebec, Alberta, and British Columbia. Ontario’s electricity costs are also among the fastest growing. Between 2010 and 2016, electricity costs for small industrial consumers in Ottawa increased by 50% and in Toronto, by 48%, while the average cost in the rest of Canada rose by only 15%. Large industrial consumers in Ottawa and Toronto experienced cost spikes of 53% and 46%, respectively, between 2010 and 2016, while the average increase in electricity costs for the rest of Canada was only 14%.
Rising electricity costs in Ontario have placed a great financial burden on its manu-facturing sector and hampered its competitiveness. Compared to multiple comparable American and Canadian jurisdictions, Ontario exhibits the most substantial decline in its manufacturing output and employment. Between 2005 and 2016, while many juris-dictions in the American Northeast that are Ontario’s main competitors have boosted their manufacturing sector as a fraction of GDP, Ontario’s has fallen by 5.1 percentage points. Similarly, between 2005 and 2015, the manufacturing share of employment in Ontario declined by 6 percentage points, whereas the decrease in the United States was only 1.7 points.
The rising electricity cost also contributed to the significant shrinkage of all the manufacturing sub-sectors in Ontario over the past decade. Notably, the paper manu-facturing and iron and steel sectors, which were the two most electricity-intensive sec-tors in Ontario prior to the big price increases, shrank the most: between 2005 and 2015, their real output declined by 32% and 25%, respectively.
Overall we estimate that about two thirds of the lost manufacturing jobs from 2008 to 2015 in Ontario’s manufacturing sector were likely attributable to rising elec-tricity prices. Taking the provincial government’s green energy job creation claims at face value, we nonetheless estimate that Ontario lost between 1.8 and 3.6 permanent manufacturing jobs for every permanent new job created under the green energy initia-tive since 2008.
Ontario’s economy is currently suffering from sluggish growth and is lagging behind Canada and other Canadian provinces. As the manufacturing sector is still Ontario’s second largest industry, resolving the issue of electricity prices and restoring the health

McKitrick and Aliakbari f Rising Electricity Costs and Declining Employment in Ontario f 29
fraserinstitute.org
of manufacturing sector is critical. The government has recently announced the Fair Hydro Act, which is a plan to take on more debts from future ratepayers to reduce electri-city bills in the short term. Under this plan, households, small businesses, and farms will qualify for a 25% rate reduction to their electricity bills. However, the rate reductions are going to be subsidized by future rate payers, costing them tens of billions of dollars in debt plus interest (Ontario, Ministry of Energy, 2017; Jackson, Stedman, Aliakbari, and Green, 2017). As a part of the Fair Hydro Plan, it was reported that more manufac-turing and industrial sectors would be eligible to join Class A and pay lower rates. Again, this would mean shifting more cost to Class-B customers and then financing the cost by borrowing from future rate payers. Thus, the overall effect of new policy will be to further increase the electricity rates in the long run rather than reducing them.
The significant employment losses in Ontario’s manufacturing sector and the over-all stagnant employment and economic growth rate of this province over the past few years, should concern policy makers in this province. It is time for to pursue meaning-ful reforms aimed at lowering electricity costs in the province.

30 f Rising Electricity Costs and Declining Employment in Ontario f McKitrick and Aliakbari
fraserinstitute.org
References
Álvarez, Gabriel Calzada, Raquel Merino Jara, Juan Ramón Rallo Julián, and José Ignacio García Bielsa (2010). Study of the Effects on Employment of Public Aid to Renewable Energy Sources. Procesos de Mercado: Revista Europea de Economía Politica 7, 1: 13–70.
Auditor General of Ontario (2011). 2011 Annual Report: Chapter 3, Section 3.03, Electricity Sector-Renewable Energy Initiatives. Office of the Auditor General of Ontario.
Auditor General of Ontario (2015). 2015 Annual Report: Chapter 3.05, Electricity Power System Planning. Office of the Auditor General of Ontario.
CBC News (2017, March 6). High Hydro Prices Hurt Ontario Factories, Industry Group Says. CBC. <http://www.cbc.ca/news/canada/kitchener-waterloo/kitchener-toronto-factory-industry-electricity-rates-1.4011519>.
Canadian Forex (2017). Yearly Average Exchange Rates for Currencies. <http://www.canadianforex.ca/forex-tools/historical-rate-tools/yearly-average-rates>.
Cox, Michael, Andreas Peichl, Nico Pestel, and Sebastian Siegloch (2014). Labor Demand Effects of Rising Electricity Prices: Evidence for Germany. Energy Policy 75: 266–277.
Cross, Philip (2017). Ontario’s One Cylinder Economy: Housing in Toronto and Weak Business Investment. Fraser Institute.
Deschenes, Olivier (2012). Climate Policy and Labor Markets. In Don Fullerton and Catherine Wolfram, eds., The Design and Implementation of US Climate Policy (University of Chicago Press): 37–49.
Fremeth, Adam, Guy Holburn, Margaret Loudermilk, and Brandon Schaufele (2017). The Economic Cost of Electricity Generation in Ontario. Energy Policy and Management Center, Ivey Business School, Western University. <https://www.ivey.uwo.ca/cmsmedia/3776559/the-economic-cost-of-electricity-generation-in-ontario-april-2017.pdf>.

McKitrick and Aliakbari f Rising Electricity Costs and Declining Employment in Ontario f 31
fraserinstitute.org
Hydro-Québec (2016). Comparison of Electricity Prices in Major North American Cities. Hydro-Québec.
Independent Electricity System Operator [IESO] (2016a). Module 1: State of the Electricity System: 10-Year Review. <http://www.ieso.ca/-/media/files/ieso/document-library/planning-forecasts/ontario-planning-outlook/module-1-state-of-the-electricity-system-20160901-pdf.pdf?la=en>.
Independent Electricity System Operator [IESO] (2016b). Ontario Planning Outlook.
Independent Electricity System Operator [IESO] (2017a). Data Directory. <http://www.ieso.ca/en/power-data/data-directory>.
Independent Electricity System Operator [IESO] (2017b). Demand Overview: Historical Demand. <http://www.ieso.ca/en/power-data/demand-overview/historical-demand>.
Independent Electricity System Operator [IESO] (2017c). Electricity Pricing in Ontario. <https://ieso-public.sharepoint.com/Pages/Ontario%27s-Power-System/Electricity-Pricing-in-Ontario/default.aspx>.
Independent Electricity System Operator [IESO] (2017d). Monthly Market Report (January 2008–January 2016) <http://www.ieso.ca/power-data/market-summaries-archive>.
Innovation, Science and Economic Development Canada [ISED] (2017). Search by Industry (NAICS Codes) - Trade Data Online. <https://www.ic.gc.ca/app/scr/tdst/tdo/crtr.html?&productType=NAICS&lang=eng>.
Jackson, Taylor, Ashley Stedman, Elmira Aliakbari, and Kenneth P. Green (2017). Evaluating Electricity Price Growth in Ontario. Fraser Institute. <https://www.fraserinstitute.org/studies/evaluating-electricity-price-growth-in-ontario>.
Kahn, Matthew E., and Erin T. Mansur (2013). Do Local Energy Prices and Regulation Affect the Geographic Concentration of Employment? Journal of Public Economics 101: 105–114.
McKitrick, Ross (2013). Environmental and Economic Consequences of Ontario’s Green Energy Act. Fraser Institute.
McKitrick, Ross, and Tom Adams (2014). What Goes Up: Ontario’s Soaring Electricity Prices and How to Get Them Down. Fraser Institute

32 f Rising Electricity Costs and Declining Employment in Ontario f McKitrick and Aliakbari
fraserinstitute.org
McKitrick, Ross, and Elmira Aliakbari (2017). Did the Coal Phase-out Reduce Ontario Air Pollution? Fraser Institute.
Mordue , Greig (2017). Electricity Prices and Industrial Competitiveness: A Case Study of Final Assembly Automobile Manufacturing in the United States and Canada. Energy Policy 111: 32–40.
Natural Resources Canada (2016). Energy Efficiency Trends Analysis Tables. National Energy Use Database. <https://oee.nrcan.gc.ca/corporate/statistics/neud/dpa/menus/trends/analysis/tables.cfm>.
National Post (2017, July 18). Siemens Closes Wind Turbine Plant in Tillsonburg—340 Green Energy Jobs Gone. National Post. <http://nationalpost.com/news/canada/siemens-closes-wind-turbine-plant-in-tillsonburg-340-green-energy-jobs-gone>.
Ontario Chamber of Commerce (2015). Empowering Ontario: Constraining Costs and Staying Competitive in the Electricity Market. <http://www.occ.ca/portfolio/empowering-ontario/>.
Ontario Energy Board (2016). Regulated Price Plan, Price Report November 1, 2016 to October 31, 2017. <https://www.oeb.ca/oeb/_Documents/EB-2004-0205/RPP_Price_Report_Nov2016.pdf>.
Ontario Energy Report (2015). Electricity Data: First Quarter 2017 (January–March 2017). <https://www.ontarioenergyreport.ca/index.php>.
Ontario, Ministry of Energy (2017). Ontario’s Fair Hydro Act, 2017. Backgrounder. Government of Ontario, Newsroom. <https://news.ontario.ca/mei/en/2017/05/ontarios-fair-hydro-act-2017.html>.
Statistics Canada [Statscan] (2016). CANSIM table 128-0006. Energy Fuel Consumption of Manufacturing Industries in Gigajoules, by North American Industry Classification System (NAICS). <http://www5.statcan.gc.ca/cansim/a26?lang=eng&retrLang=eng&id=1280006&&pattern=&stByVal=1&p1=1&p2=31&tabMode=dataTable&csid=>.
Statistics Canada [Statscan] (2017a). CANSIM table 029-0045. Capital and Repair Expenditure, Non-residential Tangible Assets, by North American Industry Classification System (NAICS), Canada, Provinces and Territories. <http://www5.statcan.gc.ca/cansim/a26?lang=eng&retrLang=eng&id=0290045&&pattern=&stByVal=1&p1=1&p2=31&tabMode=dataTable&csid=>.

McKitrick and Aliakbari f Rising Electricity Costs and Declining Employment in Ontario f 33
fraserinstitute.org
Statistics Canada [Statscan] (2017b). CANSIM table 282-0008. Labour Force Survey Estimates (LFS), by North American Industry Classification System (NAICS), Sex and Age Group. <http://www5.statcan.gc.ca/cansim/a26?lang=eng&id=2820008>.
Statistics Canada [Statscan] (2017c). CANSIM table 304-0015. Manufacturing Sales, by North American Industry Classification System (NAICS) and Province. <http://www5.statcan.gc.ca/cansim/a26?lang=eng&id=3040015>.
Statistics Canada [Statscan] (2017d). CANSIM table 379-0030. Gross Domestic Product (GDP) at Basic Prices, by North American Industry Classification System (NAICS), Provinces and Territories. <http://www5.statcan.gc.ca/cansim/a26?lang=eng&id=3790030>.
Statistics Canada [Statscan] (2017e). CANSIM table 379-0031. Gross Domestic Product (GDP) at Basic Prices, by North American Industry Classification System (NAICS). <http://www5.statcan.gc.ca/cansim/a26?lang=eng&id=3790031>.
Statistics Canada [Statscan] (2017f). CANSIM table 383-0008. Indexes of Labour Productivity, Unit Labour Cost and Related Variables, Seasonally Adjusted. <http://www5.statcan.gc.ca/cansim/a26?lang=eng&id=3830008>.
Statistics Canada [Statscan] (2017g). CANSIM table 383-0031. Labour Statistics Consistent with the System of National Accounts (SNS), by Province and Territory, Job Category and North American Industry Classification System (NAICS). <http://www5.statcan.gc.ca/cansim/a26?lang=eng&id=3830031>.
Statistics Canada [Statscan] (2017h). CANSIM table 383-0033. Labour Productivity and Related Measures by Business Sector Industry and by Non-commercial Activity Consistent with the Industry Accounts, Provinces and territories. <http://www5.statcan.gc.ca/cansim/a26?lang=eng&retrLang=eng&id=3830033&&pattern=&stByVal=1&p1=1&p2=31&tabMode=dataTable&csid=>.
US Bureau of Economic Analysis [US-BEA] (2016). Total Full-time and Part-Time Employment by NAICS Industry.
US Bureau of Economic Analysis [US-BEA] (2017). Real GDP by State (Millions of Chained 2009 Dollars). <https://bea.gov/iTable/iTable.cfm?reqid=70&step=1&isuri=1&acrdn=4#reqid=70&step=1&isuri=1>.
US Energy Information Administration [US-EIA] (2017). Electric Power Monthly with Data for June 2017 (August). <https://www.eia.gov/electricity/monthly/pdf/epm.pdf>

fraserinstitute.org

McKitrick and Aliakbari f Rising Electricity Costs and Declining Employment in Ontario f 35
fraserinstitute.org
Abouttheauthors
RossR.McKitrickRoss R. McKitrick is a Professor of Economics and CBE Fellow in Sustainable Commerce at the University of Guelph, where he spe-cializes in environment, energy, and climate policy; and a Senior Fellow of the Fraser Institute. He has published widely on the eco-nomics of pollution, climate change, and public policy. His book, Economic Analysis of Environmental Policy, was published by the University of Toronto Press in 2010. His background in applied statistics has also led him to collaborative work across a wide range of topics in the physical sciences including paleoclimate reconstruction, malaria transmission, surface temperature measurement, and climate model evaluation. Professor McKitrick has made many invited academic presentations around the world, and has testified before the US Congress and committees of the Canadian House of Commons and Senate. He appears frequently in the media, and his research has been discussed in many prominent outlets including the New York Times, Nature, Science, Economist, and Wall Street Journal.
ElmiraAliakbariElmira Aliakbari is a Senior Economist at the Fraser Institute. She received a Ph.D. in Economics from the University of Guelph in 2016 and a B.S. in Economics (2003) and an M.A. in Economics (2007) from the University of Tehran in Iran. She has studied public pol-icy regulating energy and the environment for nearly seven years. Prior to joining the Fraser Institute, Ms. Aliakbari was Director of Research, Energy, Ecology, and Prosperity with the Frontier Center for Public Policy. Her commentaries have appeared in major Canadian newspapers such as the Globe and Mail, National Post, Financial Post, and Edmonton Journal.

36 f Rising Electricity Costs and Declining Employment in Ontario f McKitrick and Aliakbari
fraserinstitute.org
Acknowledgments
The authors would like to acknowledge the helpful comments and insights of several anonymous reviewers. The authors, however, are alone responsible for the report itself, its conclusions, and recommendations. As the researchers have worked independently, the views and conclusions expressed in this paper do not necessarily reflect those of the Board of Directors of the Fraser Institute, the staff, or supporters.

McKitrick and Aliakbari f Rising Electricity Costs and Declining Employment in Ontario f 37
fraserinstitute.org
PublishingInformation
DistributionThese publications are available from <http://www.fraserinstitute.org> in Portable Document Format (PDF) and can be read with Adobe Acrobat® or Adobe Reader®, versions 7 or later. Adobe Acrobat Reader® DC, the most recent version, is available free of charge from Adobe Systems Inc. at <http://get.adobe.com/reader/>. Readers having trouble view-ing or printing our PDF files using applications from other manufacturers (e.g., Apple’s Preview) should use Reader® or Acrobat®.
OrderingpublicationsTo order printed publications from the Fraser Institute, please contact us via e-mail: [email protected]; telephone: 604.688.0221, ext. 580 or, toll free, 1.800.665.3558, ext. 580; or fax: 604.688.8539.
MediaFor media enquiries, please contact our communications department via e-mail: [email protected]; telephone: 604.714.4582.
CopyrightCopyright © 2017 by the Fraser Institute. All rights reserved. No part of this publica-tion may be reproduced in any manner whatsoever without written permission except in the case of brief passages quoted in critical articles and reviews.
ISBN978-0-88975-467-6
CitationRoss R. McKitrick and Elmira Aliakbari (2017). Rising Electricity Costs and Declining Employment in Ontario’s Manufacturing Sector. Fraser Institute.

38 f Rising Electricity Costs and Declining Employment in Ontario f McKitrick and Aliakbari
fraserinstitute.org
SupportingtheFraserInstitute
To learn how to support the Fraser Institute, please contact us via post: Development Department, Fraser Institute, Fourth Floor, 1770 Burrard Street, Vancouver, British Columbia, V6J 3G7, Canada; telephone: toll-free to 1.800.665.3558, ext. 548; e-mail: [email protected]; or visit our web page: <http://www.fraserinstitute.org/support-us/overview.aspx>.
Purpose,Funding,andIndependence
The Fraser Institute provides a useful public service. We report objective information about the economic and social effects of current public policies, and we offer evidence-based research and education about policy options that can improve the quality of life.
The Institute is a non-profit organization. Our activities are funded by charitable donations, unrestricted grants, ticket sales, and sponsorships from events, the licensing of products for public distribution, and the sale of publications.
All research is subject to rigorous review by external experts, and is conducted and published separately from the Institute’s Board of Directors and its donors.
The opinions expressed by authors are their own, and do not necessarily reflect those of the Institute, its Board of Directors, its donors and supporters, or its staff. This publication in no way implies that the Fraser Institute, its directors, or staff are in favour of, or oppose the passage of, any bill; or that they support or oppose any par-ticular political party or candidate.
As a healthy part of public discussion among fellow citizens who desire to improve the lives of people through better public policy, the Institute welcomes evidence-fo-cused scrutiny of the research we publish, including verification of data sources, replica-tion of analytical methods, and intelligent debate about the practical effects of policy recommendations.
McKitrick and Aliakbari f Rising Electricity Costs and Declining Employment in Ontario f 39
fraserinstitute.org
AbouttheFraserInstitute
Our mission is to improve the quality of life for Canadians, their families and future generations by studying, measuring and broadly communicating the effects of govern-ment policies, entrepreneurship and choice on their well-being.
Notre mission consiste à améliorer la qualité de vie des Canadiens et des générations à venir en étudiant, en mesurant et en diffusant les effets des politiques gouvernemen-tales, de l’entrepreneuriat et des choix sur leur bien-être.
Peerreview—validatingtheaccuracyofourresearchThe Fraser Institute maintains a rigorous peer review process for its research. New research, major research projects, and substantively modified research conducted by the Fraser Institute are reviewed by experts with a recognized expertise in the topic area being addressed. Whenever possible, external review is a blind process. Updates to previously reviewed research or new editions of previously reviewed research are not re-viewed unless the update includes substantive or material changes in the methodology.
The review process is overseen by the directors of the Institute’s research depart-ments who are responsible for ensuring all research published by the Institute passes through the appropriate peer review. If a dispute about the recommendations of the reviewers should arise during the Institute’s peer review process, the Institute has an Editorial Advisory Board, a panel of scholars from Canada, the United States, and Europe to whom it can turn for help in resolving the dispute.

40 f Rising Electricity Costs and Declining Employment in Ontario f McKitrick and Aliakbari
fraserinstitute.org
Members
Pastmembers
EditorialAdvisoryBoard
* deceased; † Nobel Laureate
Prof. Terry L. Anderson
Prof. Robert Barro
Prof. Jean-Pierre Centi
Prof. John Chant
Prof. Bev Dahlby
Prof. Erwin Diewert
Prof. Stephen Easton
Prof. J.C. Herbert Emery
Prof. Jack L. Granatstein
Prof. Herbert G. Grubel
Prof. James Gwartney
Prof. Ronald W. Jones
Dr. Jerry Jordan
Prof. Ross McKitrick
Prof. Michael Parkin
Prof. Friedrich Schneider
Prof. Lawrence B. Smith
Dr. Vito Tanzi
Prof. Armen Alchian*
Prof. Michael Bliss*
Prof. James M. Buchanan* †
Prof. Friedrich A. Hayek* †
Prof. H.G. Johnson*
Prof. F.G. Pennance*
Prof. George Stigler* †
Sir Alan Walters*
Prof. Edwin G. West*