RISING CHALLENGE - cbiz.gcs-web.com
101
2020 ANNUAL REPORT RISING TO THE CHALLENGE
Transcript of RISING CHALLENGE - cbiz.gcs-web.com

2020 ANNUAL REPORT
RISING TO THE
CHALLENGE

MISSION STATEMENT
To provide exceptional advice and solutions that help our clients achieve their goals
VISION STATEMENT
To be recognized by our clients as the premier provider of accounting, insurance and other professional business services and by our team members as their employer of choice
CORPORATE OFFICE6050 OAK TREE BLVD., SOUTH, SUITE 500CLEVELAND, OH 44131 | 216.447.9000 | www.cbiz.com
TABLE OF CONTENTS 3 | FINANCIAL HIGHLIGHTS 4 | LETTER TO SHAREHOLDERS 7 | SERVICES & LOCATIONS
FORM 10-K LAST | BOARD OF DIRECTORS & EXECUTIVE TEAM LAST | SHAREHOLDER INFORMATION
CBIZ, INC.
CORPORATE PROFILE
As a trusted adviser to small and midsized businesses across the U.S., CBIZ provides our clients with solutions that help them improvetheir operations and increase profitability. From our many serviceplatforms – in areas ranging from accounting, tax and businessadvisory services to group health benefits, payroll, property andcasualty insurance and retirement plan services – we strive toensure that our more than 82,000 clients receive the most effectiveprofessional solutions. With 4,800 associates in more than 100offices across the country, CBIZ’s resources and services areuniquely suited to support the growth and success of our clients.
CORE VALUES
We do the right thing.
Our people matter.
We are dedicated to the success of our clients.
We expect to win. We are One CBIZ.
Members of the CBIZ Young Professionals group participated in a volleyball tournament benefitting Hope House, a nonprofit that provides safety and support for those impacted by domestic violence.
2 | CBIZ, INC. ANNUAL REPORT 2020

$799.8
2016
$855.3$922.0 $948.4 $963.9
2017 2018 2019 2020
CAGR 4.8% $0.76
2016
$0.92
$1.09
$1.27
$1.42
2017 2018 2019 2020
CAGR 16.9%
This annual report to shareholders contains forward-looking statements, which by their nature involve risks and uncertainties. CBIZ’s Annual Report on Form 10-K, which is filed with the Securities and Exchange Commission, contains a detailed description of certain factors that may cause actual results to differ from results contemplated from such statements.
FINANCIAL HIGHLIGHTS
REVENUE DILUTED EARNINGS PER SHARE
FROM CONTINUING OPERATIONS (IN DOLLARS)($ IN DOLLARS)
PRE-TAX OPERATING MARGIN
% OF REVENUE
$94.8
2016
$104.0 $109.1$120.6
$132.1
2017 2018 2019 2020
CAGR 8.6%
ADJUSTED EBITDA
($ IN MILLIONS)SEE FORM 10-K FOR RECONCILIATION
ANNUAL REPORT 2020 CBIZ, INC. | 3
8.4%
2016
8.7% 8.7%9.8%
10.7%
2017 2018 2019 2020
+230 bps

4 | CBIZ, INC. ANNUAL REPORT 2020
Getting outside was a great way to volunteer in 2020. Team members from CBIZ Kansas City cleaned up and beautified a local park, all while social distancing.
2020 WAS A YEAR THAT BROUGHT
UNPRECEDENTED CHALLENGES,
BUT IT ALSO GAVE US INCREDIBLE
OPPORTUNITIES TO DEMONSTRATE
THE RESILIENCE OF OUR PEOPLE,
STABILITY OF OUR BUSINESS AND
OUR ABILITY TO INNOVATE AS
WE CONTINUED TO SUPPORT OUR
CLIENTS AND OUR TEAM.
DEAR FELLOW SHAREHOLDERS:
Jerry Grisko signing the CEO Action for Diversity and Inclusion Pledge.
Despite the uncertainty surrounding the COVID-19 pandemic, our team continued to rise to the challenge regardless of the circumstances. This resulted in overall growth for our business, deeper client relationships and lessons learned that will help us transform our business and operations as we look ahead.
OVERALL PERFORMANCE
We began the year with a solid balance sheet, low debt and ready access to capital. This position of strength, combined with the foundational characteristics of our business and our proactive response to the pandemic, drove our performance. Our ability to grow throughout last year’s business climate is a testament to those characteristics, the strength of our business model and the agility and resilience of our team.
In our Financial Services business, steady demand for our core accounting and tax services anchored our performance for the year. Despite the timing of the pandemic coming in the midst of tax busy season, our Financial Services team quickly and effectively transitioned to remote work to minimize disruption for our clients. The team likewise supported clients in navigating the new and emerging stimulus opportunities as well as the IRS tax deadline extension and changing tax regulations. As much of our client and prospect outreach shifted to digital, we also launched Accelerated Recovery, an effort to highlight how our multi-disciplinary solutions could assist clients in moving from reactive to proactive in positioning themselves for rapid recovery as the economy improves.
As expected, some of our businesses performed better than others, which is typical in a volatile environment like we experienced over the last year. Our core and essential

ANNUAL REPORT 2020 CBIZ, INC. | 5
accounting and tax services performed well while some of our more discretionary and project-based services experienced a slowdown, especially in the months immediately following the onset of the pandemic. Fortunately, demand for many of those services began to rebound later in the year, particularly for services that are tied to supporting our clients’ pursuit of acquisition opportunities.
Our Benefits and Insurance business had a similar experience in that our core, recurring services generally enjoyed strong performance while others were more impacted by pandemic conditions. Payroll is one area of our business that experienced an immediate impact from the pandemic as we saw the number of pays decline due to early layoffs and reductions in personnel among a number of our small and mid-sized businesses. After an early initial drop, the number of pays began to return as the year progressed and has remained fairly stable, though at a reduced level.
Overall, there are reasons to be optimistic that this segment of our business will thrive in 2021. Production grew across our employee benefits and property and casualty commercial insurance lines, and we continue to experience strong demand for our new up-market payroll platform. Attracting, retaining and developing producers in our Benefits and Insurance segment remains a top priority and key driver of organic growth. Our investments in producers are coming to fruition and we anticipate accelerated growth from those investments as the economy continues to recover.
Acquisitions continue to be integral to our growth strategy. In 2020, we welcomed seven companies to CBIZ, all of which provided strategic value, additional expertise and talent, increased capacity and greater access to attractive markets and client groups. We have also found that our performance throughout the pandemic has allowed us to tell a compelling story when it comes to potential partners. The challenges faced by many of our smaller competitors throughout COVID-19 shined a light on the value that CBIZ can bring to our team members and our clients. As a result, our pipeline of outstanding acquisition prospects is stronger than it has been in many years, and we have access to capital to be aggressive as we seek to take advantage of as many of these opportunities as we can.
YOUR TEAM
2020 presented opportunities for our team to bring extraordinary value to our clients by responding to their most urgent needs. Our vision has always been to offer our clients a more tailored, personalized approach supported by greater breadth and depth of valuable services and expertise than offered by many of our mono-line competitors. We witnessed the strength of our business model throughout the last year as we moved quickly to collaborate across businesses, service lines and geographies to bring our resources and expertise together seamlessly to serve our clients when they needed us most. We are excited by the value that our multidisciplinary, holistic approach brings to our clients and the opportunities it presents to further distinguish CBIZ from our competitors.
BEST WORKPLACE IN CONSULTING AND PROFESSIONAL SERVICES
by Great Place to Work – 3rd time
BEST PLACES TO WORK IN INSURANCE
by Business Insurance – 6th time
HEALTHIEST 100 WORKPLACES IN AMERICA
by Springbuk – 3rd time
BEST AND BRIGHTEST COMPANIES IN THE NATION
by National Association of Business Resources – 5th time
BEST AND BRIGHTNESS IN WELLNESS by National Association of Business Resources – 4th time
WORKPLACE EXCELLENCE SEAL OF APPROVAL, HEALTH & WELLNESS SEAL
OF APPROVAL, and CERTIFICATE OF RECOGNITION BEST PRACTICES FOR
SUPPORTING WORKERS 50+
by the Alliance for Workplace Excellence
2020 WORKPLACE AWARDS

6 | CBIZ, INC. ANNUAL REPORT 2020
During the year, we also continued to shift to digital platforms and embrace new technology. While necessity may have accelerated this shift, our clients’ positive response confirms that our digital outreach, timely thought leadership and enhanced online presence will be central to our growth as we move forward.
At CBIZ, our values-based culture is the foundation of our team members’ experience and overall engagement. From the start of the pandemic, we prioritized the health and safety of our team members by leaning into our core values. From the implementation of a multitude of health and safety measures to a comprehensive remote work strategy, we were able to bring our core values to life and use them as our guide throughout the response to the pandemic.
A key component of our culture is our dedication to the communities in which we live and work. While the pandemic changed the way we engage within our communities, our team members continued their generosity by volunteering time and through charitable giving. Our 12th annual national food drive once again collected over 1 million pounds of food for distribution. 2020 also marked the 13th year that our CBIZ Women’s Advantage Program partnered with Dress for Success (DFS) to raise funds and awareness. Recognizing that the clients of DFS were hit particularly hard by the pandemic, our team members stepped up to more than double our typical annual contribution to support DFS affiliates nationwide.
Finally, 2020 provided CBIZ an important opportunity to affirm our commitment to diversity and inclusion. We’ve taken some significant early steps in this journey, which included my signing onto the CEO Action for Diversity and Inclusion pledge, the largest CEO-driven business commitment to advance diversity and inclusion within the workplace. Our active participation with the CEO Action for Diversity and Inclusion pledge will connect us with other committed organizations and help to accelerate our work in this area. Our progress in 2020 is encouraging, but we recognize this is a journey and we still have far to go. We
have momentum and engagement from across the company to institutionalize diversity and inclusion as an essential element of our culture and to drive similar change within the professional services industry.
RISING TO THE CHALLENGE
NOW AND IN THE FUTURE
As I write this letter, uncertainty within the business environment remains and the impact of the pandemic persists. At the same time, our progress in keeping our team, clients, and business healthy and positioned for growth makes us confident of the opportunities ahead. Based on our experience in 2020 and our expectations for 2021, we anticipate revenue growth in a range of 5% to 8% and growth in fully diluted earnings per share within a range of 8% to 12% for the coming year.
Our performance and accomplishments of the last year were possible because our team continued to rise to the challenge for our clients, our business and each other. While necessity is often the most urgent catalyst for change, it is the learning we carry forward that can be most transformative. I believe what we’ve learned over the last year will continue to fuel innovation and improvement, which will allow us to emerge even stronger than before.
I remain grateful to our team members for their commitment and perseverance, to our clients for entrusting us with their most urgent and essential needs, to our shareholders for their trust and confidence, and to our Board of Directors for their guidance and support.
Sincerely,
Jerome P. Grisko Jr. President and Chief Executive Officer

ANNUAL REPORT 2020 CBIZ, INC. | 7
FINANCIAL SERVICES
Accounting & TaxGovernment Health Care ConsultingFinancial AdvisoryValuationRisk & Advisory Services
BENEFITS & INSURANCE SERVICES
Group Health Benefits ConsultingPayroll/Human Capital ManagementProperty & CasualtyRetirement Plan Services
4,800
100+
Team Members
With 4,800 team members in
more than 100 offices across the country,
CBIZ’s resources and services are
uniquely suited to support the growth
and success of our clients.
Offices
NATIONAL RESOURCES & PERSONAL SERVICE
SERVICES & LOCATIONS
Major Markets

UNITED STATESSECURITIES AND EXCHANGE COMMISSION
WASHINGTON, D.C. 20549
FORM 10-KÈ ANNUAL REPORT PURSUANT TO SECTION 13 OR 15(d) OF THE SECURITIES EXCHANGE ACT OF 1934
For the fiscal year ended December 31, 2020OR
‘ TRANSITION REPORT PURSUANT TO SECTION 13 OR 15(d) OF THE SECURITIES EXCHANGE ACT OF 1934For the transition period from to
Commission file number 1-32961
CBIZ, INC.(Exact name of registrant as specified in its charter)
Delaware 22-2769024
(State or other jurisdiction ofincorporation or organization)
(I.R.S. EmployerIdentification No.)
6050 Oak Tree Boulevard, South,Suite 500,
Cleveland, Ohio 44131
(Address of principal executive offices) (Zip Code)
(216) 447-9000(Registrant’s telephone number, including area code)
Securities registered pursuant to Section 12(b) of the Act:
Title of each classTrading
Symbol(s)Name of each exchange
on which registered
Common Stock, $0.01 Par Value CBZ New York Stock ExchangeSecurities registered pursuant to Section 12(g) of the Act: None
Indicate by check mark if the registrant is a well-known seasoned issuer, as defined in Rule 405 of the Securities Act. Yes ‘ No È
Indicate by check mark if the registrant is not required to file reports pursuant to Section 13 or Section 15(d) of the Act. Yes ‘ No È
Indicate by check mark whether the registrant (1) has filed all reports required to be filed by Section 13 or 15(d) of the Securities Exchange Act of1934 during the preceding 12 months (or for such shorter period that the registrant was required to file such reports), and (2) has been subject to suchfiling requirements for the past 90 days. Yes È No ‘
Indicate by check mark whether the registrant has submitted electronically every Interactive Data File required to be submitted pursuant to Rule 405of Regulation S-T (§ 232.405 of this chapter) during the preceding 12 months (or for such shorter period that the registrant was required to submitsuch files). Yes È No ‘
Indicate by check mark whether the registrant is a large accelerated filer, an accelerated filer, a non-accelerated filer, a smaller reporting company, oran emerging growth company. See the definitions of “large accelerated filer,” “accelerated filer,” “smaller reporting company” and “emerging growthcompany” in Rule 12b-2 of the Exchange Act.
Large accelerated filer È Accelerated filer ‘ Non-accelerated filer ‘ Smaller reporting company ‘
Emerging growth company ‘
If an emerging growth company, indicate by check mark if the registrant has elected not to use the extended transition period for complying with anynew or revised financial accounting standards provided pursuant to Section 13(a) of the Exchange Act. ‘
Indicate by check mark whether the registrant has filed a report on and attestation to its management’s assessment of the effectiveness of its internalcontrol over financial reporting under Section 404(b) of the Sarbanes-Oxley Act (15 U.S.C.7262(b)) by the registered public accounting firm thatprepared or issued the audit report. È
Indicate by check mark whether the registrant is a shell company (as defined in Rule 12b-2 of the Act). Yes ‘ No È
The aggregate market value of the common stock held by non-affiliates of the registrant, computed by reference to the last sales price of suchcommon stock as of the closing of trading on June 30, 2020, was approximately $1.2 billion.
The number of outstanding shares of the registrant’s common stock is 53,491,503 as of February 19, 2021.
DOCUMENTS INCORPORATED BY REFERENCEThe registrant incorporates by reference in Part III hereof portions of its definitive Proxy Statement for its 2021 Annual Meeting of Stockholders.

CBIZ, INC.
ANNUAL REPORT ON FORM 10-K
FOR THE FISCAL YEAR ENDED DECEMBER 31, 2020
Table of Contents
Page
PART IItem 1. Business . . . . . . . . . . . . . . . . . . . . . . . . . . . . . . . . . . . . . . . . . . . . . . . . . . . . . . . . . . . . . . . . . 4Item 1A. Risk Factors . . . . . . . . . . . . . . . . . . . . . . . . . . . . . . . . . . . . . . . . . . . . . . . . . . . . . . . . . . . . . . 10Item 1B. Unresolved Staff Comments . . . . . . . . . . . . . . . . . . . . . . . . . . . . . . . . . . . . . . . . . . . . . . . . . 17Item 2. Properties . . . . . . . . . . . . . . . . . . . . . . . . . . . . . . . . . . . . . . . . . . . . . . . . . . . . . . . . . . . . . . . . 18Item 3. Legal Proceedings . . . . . . . . . . . . . . . . . . . . . . . . . . . . . . . . . . . . . . . . . . . . . . . . . . . . . . . . . 18Item 4. Mine Safety Disclosures . . . . . . . . . . . . . . . . . . . . . . . . . . . . . . . . . . . . . . . . . . . . . . . . . . . . 18
PART IIItem 5. Market for Registrant’s Common Equity, Related Stockholder Matters and Issuer
Purchases of Equity Securities . . . . . . . . . . . . . . . . . . . . . . . . . . . . . . . . . . . . . . . . . . . . . . . 19Item 6. Selected Financial Data . . . . . . . . . . . . . . . . . . . . . . . . . . . . . . . . . . . . . . . . . . . . . . . . . . . . . 21Item 7. Management’s Discussion and Analysis of Financial Condition and Results of
Operations . . . . . . . . . . . . . . . . . . . . . . . . . . . . . . . . . . . . . . . . . . . . . . . . . . . . . . . . . . . . . . . 22Item 7A. Quantitative and Qualitative Disclosures About Market Risk . . . . . . . . . . . . . . . . . . . . . . . 35Item 8. Financial Statements and Supplementary Data . . . . . . . . . . . . . . . . . . . . . . . . . . . . . . . . . . . 36Item 9. Changes in and Disagreements with Accountants on Accounting and Financial
Disclosure . . . . . . . . . . . . . . . . . . . . . . . . . . . . . . . . . . . . . . . . . . . . . . . . . . . . . . . . . . . . . . . 36Item 9A. Controls and Procedures . . . . . . . . . . . . . . . . . . . . . . . . . . . . . . . . . . . . . . . . . . . . . . . . . . . . 36Item 9B. Other Information . . . . . . . . . . . . . . . . . . . . . . . . . . . . . . . . . . . . . . . . . . . . . . . . . . . . . . . . . 37
PART IIIItem 10. Directors, Executive Officers and Corporate Governance . . . . . . . . . . . . . . . . . . . . . . . . . . 38Item 11. Executive Compensation . . . . . . . . . . . . . . . . . . . . . . . . . . . . . . . . . . . . . . . . . . . . . . . . . . . . 42Item 12. Security Ownership of Certain Beneficial Owners and Management and Related
Stockholder Matters . . . . . . . . . . . . . . . . . . . . . . . . . . . . . . . . . . . . . . . . . . . . . . . . . . . . . . . . 43Item 13. Certain Relationships and Related Transactions, and Director Independence . . . . . . . . . . . 43Item 14. Principal Accounting Fees and Services . . . . . . . . . . . . . . . . . . . . . . . . . . . . . . . . . . . . . . . . 43
PART IVItem 15. Exhibits . . . . . . . . . . . . . . . . . . . . . . . . . . . . . . . . . . . . . . . . . . . . . . . . . . . . . . . . . . . . . . . . . 44
Signatures . . . . . . . . . . . . . . . . . . . . . . . . . . . . . . . . . . . . . . . . . . . . . . . . . . . . . . . . . . . . . . . 47
2

FORWARD-LOOKING STATEMENTS
This Annual Report on Form 10-K contains “forward-looking statements” within the meaning of Section 27A ofthe Securities Act of 1933 (the “Securities Act”) and Section 21E of the Securities Exchange Act of 1934 (“theExchange Act”). All statements other than statements of historical fact included in this Annual Report on Form10-K including, without limitation, “Business” and “Management’s Discussion and Analysis of FinancialCondition and Results of Operations” regarding our financial position, business strategy and plans and objectivesfor future performance are forward-looking statements. You can identify these statements by the fact that they donot relate strictly to historical or current facts. Forward-looking statements are commonly identified by the use ofsuch terms and phrases as “will,” “could,” “can,” “may,” “strive,” “hope,” “intend,” “believe,” “estimate,”“continue,” “plan,” “expect,” “project,” “anticipate,” “outlook,” “foreseeable future,” “seek” and words orphrases of similar import in connection with any discussion of future operating or financial performance. Inparticular, these include statements relating to future actions, future performance or results of current andanticipated services, sales efforts, expenses, and financial results.
From time to time, we may also provide oral or written forward-looking statements in other materials we releaseto the public. Any or all of our forward-looking statements in this Annual Report on Form 10-K and in any otherpublic statements that we make, are subject to certain risks and uncertainties that could cause actual results todiffer materially from those projected. Such forward-looking statements can be affected by inaccurateassumptions we might make or by known or unknown risks and uncertainties. Many factors mentioned in “Item1A. Risk Factors” will be important in determining future results. Should one or more of these risks orassumptions materialize, or should the underlying assumptions prove incorrect, actual results may varymaterially from those anticipated, estimated or projected.
Consequently, no forward-looking statement can be guaranteed. Our actual future results may vary materially,and we undertake no obligation to publicly update any forward-looking statements, whether as a result of newinformation, future events or otherwise. You are advised, however, to consult any further disclosures we make onrelated subjects in the quarterly, periodic and annual reports we file with the United States Securities andExchange Commission (the “SEC”). Also note that we provide cautionary discussion of risks, uncertainties andpossibly inaccurate assumptions relevant to our businesses as discussed in Item 1 and Item 1A. These are factorsthat we think could cause our actual results to differ materially from expected and historical results. Other factorsbesides those described here could also adversely affect operating or financial performance.
The following text is qualified in its entirety by reference to the more detailed information and consolidatedfinancial statements (including the notes thereto) appearing elsewhere in this Annual Report on Form 10-K.Unless the context otherwise requires, references in this Annual Report to “we,” “our,” “us,” “CBIZ” or the“Company” shall mean CBIZ, Inc., a Delaware corporation, and its wholly-owned subsidiaries. All references toyears, unless otherwise noted, refer to our fiscal year which ends on December 31.
3

PART I
ITEM 1. BUSINESS
Overview
CBIZ, Inc. is a leading provider of financial, insurance and advisory services tailored to help our clients and theirbusinesses grow and succeed. As a trusted advisor to businesses of varying size in numerous industries across theUnited States, our comprehensive approach enables our clients to achieve their most important goals and pursueopportunities for growth while navigating an increasingly complex business environment. With more than 100offices in 31 states and the District of Columbia, we are one of the largest accounting, insurance brokerage andrelated financial services providers in the nation. Shares of our common stock are traded on the New York StockExchange (“NYSE”) under the symbol “CBZ.”
Business Strategy
Since our founding in 1996, CBIZ’s vision was to provide our clients with a breadth of services and depth ofexpertise that is unmatched in our industries. CBIZ pursued this vision by acquiring the most highly regarded,best in class financial, insurance, and advisory firms that demonstrated a shared commitment to exceptionalclient service and strong cultural fit. We also continue to make strategic investment to support organic growthincluding the attraction, retention and development of high-performing producers and the implementation ofsystems and tools that respond to our clients’ needs.
At CBIZ, we strive to be our clients’ preferred partner for their financial, insurance and advisory needs. Whilemany of our competitors tend to be mono-line in their offerings, we offer multi-disciplinary, holistic solutionsthat are comprehensive and provide higher value to our clients while eliminating the need for coordinationbetween multiple service providers. We are also embedded in local and regional markets and build meaningfulrelationships to foster deeper understanding of our clients’ business and industry. We believe this approachenables CBIZ to “out local the nationals, and out national the locals” that ultimately creates a differentiatedexperience for the clients we serve.
Available Information — Our principal executive office is located at 6050 Oak Tree Boulevard, South, Suite500, Cleveland, Ohio 44131, and our telephone number is (216) 447-9000. Our website is located at https://www.cbiz.com. We make available, free of charge on our website, through our investor relations page, our annualreports on Form 10-K, quarterly reports on Form 10-Q, current reports on Form 8-K, and any amendments tothose reports as soon as reasonably practicable after we file (or furnish) such reports with the SEC. In addition,the SEC maintains an Internet Website that contains reports, proxy and information statements and otherinformation about us at https://www.sec.gov. Our corporate code of conduct and ethics and the charters of theAudit Committee, the Compensation and Human Capital Committee and the Nominating and GovernanceCommittee of the Board of Directors are available on the investor relations page of our website, referencedabove, and in print to any shareholder who requests them.
Business Services — We deliver our integrated services through the following three practice groups: FinancialServices, Benefits and Insurance Services, and National Practices. A general description of the services providedby each practice group is presented in the table below.
Financial Services Benefits and Insurance Services National Practices
• Accounting and Tax Government• Healthcare Consulting• Financial Advisory• Valuation• Risk & Advisory Services
• Group Health BenefitsConsulting
• Payroll• Property and Casualty• Retirement Plan Services
• Managed Networking andHardware Services
• Healthcare Consulting
4
Financial Services
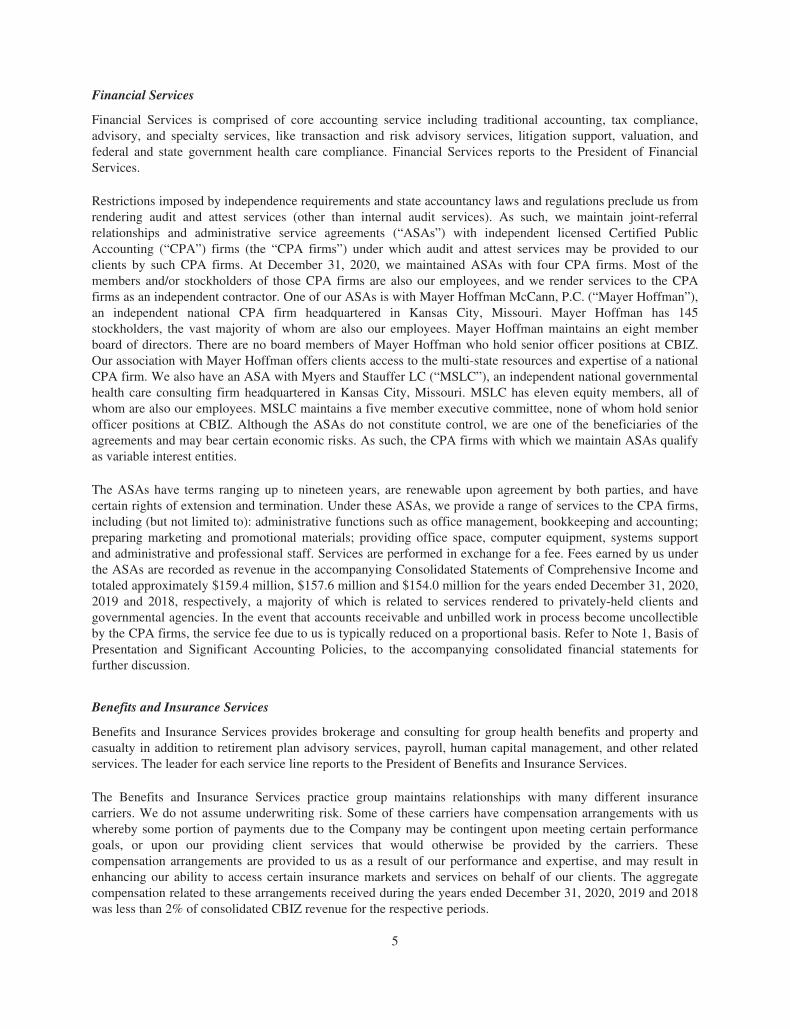
Financial Services is comprised of core accounting service including traditional accounting, tax compliance,advisory, and specialty services, like transaction and risk advisory services, litigation support, valuation, andfederal and state government health care compliance. Financial Services reports to the President of FinancialServices.
Restrictions imposed by independence requirements and state accountancy laws and regulations preclude us fromrendering audit and attest services (other than internal audit services). As such, we maintain joint-referralrelationships and administrative service agreements (“ASAs”) with independent licensed Certified PublicAccounting (“CPA”) firms (the “CPA firms”) under which audit and attest services may be provided to ourclients by such CPA firms. At December 31, 2020, we maintained ASAs with four CPA firms. Most of themembers and/or stockholders of those CPA firms are also our employees, and we render services to the CPAfirms as an independent contractor. One of our ASAs is with Mayer Hoffman McCann, P.C. (“Mayer Hoffman”),an independent national CPA firm headquartered in Kansas City, Missouri. Mayer Hoffman has 145stockholders, the vast majority of whom are also our employees. Mayer Hoffman maintains an eight memberboard of directors. There are no board members of Mayer Hoffman who hold senior officer positions at CBIZ.Our association with Mayer Hoffman offers clients access to the multi-state resources and expertise of a nationalCPA firm. We also have an ASA with Myers and Stauffer LC (“MSLC”), an independent national governmentalhealth care consulting firm headquartered in Kansas City, Missouri. MSLC has eleven equity members, all ofwhom are also our employees. MSLC maintains a five member executive committee, none of whom hold seniorofficer positions at CBIZ. Although the ASAs do not constitute control, we are one of the beneficiaries of theagreements and may bear certain economic risks. As such, the CPA firms with which we maintain ASAs qualifyas variable interest entities.
The ASAs have terms ranging up to nineteen years, are renewable upon agreement by both parties, and havecertain rights of extension and termination. Under these ASAs, we provide a range of services to the CPA firms,including (but not limited to): administrative functions such as office management, bookkeeping and accounting;preparing marketing and promotional materials; providing office space, computer equipment, systems supportand administrative and professional staff. Services are performed in exchange for a fee. Fees earned by us underthe ASAs are recorded as revenue in the accompanying Consolidated Statements of Comprehensive Income andtotaled approximately $159.4 million, $157.6 million and $154.0 million for the years ended December 31, 2020,2019 and 2018, respectively, a majority of which is related to services rendered to privately-held clients andgovernmental agencies. In the event that accounts receivable and unbilled work in process become uncollectibleby the CPA firms, the service fee due to us is typically reduced on a proportional basis. Refer to Note 1, Basis ofPresentation and Significant Accounting Policies, to the accompanying consolidated financial statements forfurther discussion.
Benefits and Insurance Services
Benefits and Insurance Services provides brokerage and consulting for group health benefits and property andcasualty in addition to retirement plan advisory services, payroll, human capital management, and other relatedservices. The leader for each service line reports to the President of Benefits and Insurance Services.
The Benefits and Insurance Services practice group maintains relationships with many different insurancecarriers. We do not assume underwriting risk. Some of these carriers have compensation arrangements with uswhereby some portion of payments due to the Company may be contingent upon meeting certain performancegoals, or upon our providing client services that would otherwise be provided by the carriers. Thesecompensation arrangements are provided to us as a result of our performance and expertise, and may result inenhancing our ability to access certain insurance markets and services on behalf of our clients. The aggregatecompensation related to these arrangements received during the years ended December 31, 2020, 2019 and 2018was less than 2% of consolidated CBIZ revenue for the respective periods.
5

National Practices
Our National Practices group provides two services: healthcare consulting and information technology. Thehealthcare consulting business, with expertise in revenue management, reimbursement optimization and managedcare contracting, serves hospitals and other healthcare providers. The information technology business has beenserving one client in the United States and Canada for more than 15 years.
Revenue
Revenue by practice group for the years ended December 31, 2020, 2019 and 2018 is provided in the table below(in thousands) along with a discussion of certain external relationships and regulatory factors that currentlyimpact those segments.
Year End December 31,
2020 2019 2018
Financial Services . . . . . . . . . . . . . . . . . . . . . . . . . . . . $629,778 65.3% $616,567 65.0% $600,926 65.2%Benefits and Insurance Services . . . . . . . . . . . . . . . . . 297,758 30.9% 296,228 31.2% 288,437 31.3%National Practices . . . . . . . . . . . . . . . . . . . . . . . . . . . . 36,361 3.8% 35,629 3.8% 32,640 3.5%
Total CBIZ revenue . . . . . . . . . . . . . . . . . . . . . . . . . $963,897 100.0% $948,424 100.0% $922,003 100.0%
Our revenue growth model includes three components; internal organic growth, cross-serving additional servicesto our existing clients, and strategic acquisitions. Each of these components is critical to our long-term growthstrategy.
• We capitalize on organic growth opportunities by offering our clients a high-touch, tailored serviceexperience that is backed by national resources. This approach enables our clients to access a breadth anddepth of services and expertise typically not available through smaller, regional professional servicesproviders but with a better client experience than what is delivered by many national firms. Our ability tocoordinate services and offer more comprehensive solutions eliminates the need to work with multipleservice providers and creates opportunities to increase both value and efficiency.
• Cross-serving provides us with the opportunity to offer and deliver multiple services to our existingclients. Cross-serving opportunities are identified by our professionals as they provide services to ourexisting clients. Being our clients’ preferred partner allows us the opportunity to respond to our clients’needs with diverse and integrated services and solutions.
• We seek to acquire businesses that strengthen our existing service offerings, enhance our expertise orintroduce new specialties to better serve our clients and enter or expand in desirable geographies andgrowing markets. When evaluating acquisition opportunities, we prioritize positive market reputation,shared values and alignment of culture, commitment to exceptional client service, and strong leadership.In 2020, we completed seven business acquisitions and purchased four client lists. From time to time, wedivest, through sale or closure, business operations that do not contribute to our long-term objectives forgrowth or are not critical to our service offerings or markets. For further discussion regarding acquisitionsand divestitures, refer to Note 18, Business Combinations and Note 19, Divestitures, to the accompanyingconsolidated financial statements.
Clients
We provide multi-disciplinary and comprehensive solutions and professional services to over 82,000 clients. Ourclient base is made up of approximately 48,000 business clients and 34,000 individual clients. Our business clientbase is geographically dispersed across the country and represents over 25 different industries. Our clientsinclude small, middle market, and large businesses and organizations ranging from less than 10 to more than
6

1,000 employees. Our largest client comprised approximately 2.7% of our consolidated revenue in 2020 and isincluded in the National Practices group. Management believes that the diversity of our client base helps insulateus from a downturn in a particular industry or geographic market. Nevertheless, economic conditions amongselect clients and groups of clients may have an impact on the demand for the services that we provide.
Regulation
Our operations are subject to regulation by federal, state, local and professional governing bodies. Accordingly,our business services may be impacted by legislative changes by these bodies, particularly with respect toprovisions relating to payroll, benefits administration and insurance services, pension plan administration and taxand accounting. We remain abreast of regulatory changes affecting our business, as these changes often affectclients’ activities with respect to employment, taxation, benefits, and accounting. For instance, changes inincome, estate, or property tax laws may require additional consultation with clients subject to these changes toassist these clients to comply with revised regulations.
We are subject to industry regulation and changes, including changes in laws, regulations, and codes of ethicsgoverning our accounting, insurance, valuation, registered investment advisory and broker-dealer operations, aswell as in other industries, the interpretation of which may impact our operations.
We are subject to certain privacy and information security laws and regulations, including, but not limited tothose under the Health Insurance Portability and Accountability Act of 1996, Financial Modernization Act of1999 (the Gramm-Leach-Bliley Act), the Health Information Technology for Economic and Clinical Health Act,and other provisions of federal and state laws which may restrict our operations and give rise to expenses relatedto compliance.
As a public company, we are subject to the provisions of the Sarbanes-Oxley Act of 2002 to reform the oversightof public company auditing, improve the quality and transparency of financial reporting by those companies andstrengthen the independence of auditors.
With respect to CPA firm clients that are required to file audited financial statements with the SEC, the SEC staffviews us and the CPA firms with which we have contractual relationships as a single entity in applyingindependence rules established by the accountancy regulators and the SEC. Accordingly, we do not hold anyfinancial interest in an SEC-reporting attest client of an associated CPA firm, enter into any business relationshipwith an SEC-reporting attest client that the CPA firm performing an audit could not maintain, or sell anynon-audit services to an SEC-reporting attest client that the CPA firm performing an audit could not sell, underthe auditor independence limitations set out in the Sarbanes-Oxley Act of 2002 and other professionalaccountancy independence standards. Applicable professional standards generally permit us to provide additionalservices to privately-held companies in addition to those services which may be provided to SEC-reporting attestclients of an associated CPA firm. We and the CPA firms with which we are associated have implementedpolicies and procedures designed to enable us and the CPA firms to maintain independence and freedom fromconflicts of interest in accordance with applicable standards. Given the policies set by us on our relationshipswith SEC-reporting attest clients of associated CPA firms, and the limited number and size of such clients, theSarbanes-Oxley Act of 2002 independence limitations do not, and are not expected to, materially affect ourrevenues.
The CPA firms with which we maintain ASAs may operate as limited liability companies, limited liabilitypartnerships or professional corporations. The firms are separate legal entities with separate governing bodiesand officers. Neither the existence of the ASAs nor the providing of services thereunder constitutes control of theCPA firms by us. The Company and the CPA firms maintain their own respective liability and risk of loss inconnection with the performance of their respective services. Attest services are not permitted to be performed byany individual or entity that is not licensed to do so. We are not permitted to perform audits, reviews,compilations, or other attest services, do not contract to perform them and do not provide the associated attest
7

reports. Given this legal prohibition and course of conduct, we do not believe it is likely that we would bear therisk of litigation losses related to attest services provided by the CPA firms. Although the ASAs do not constitutecontrol, we are one of the beneficiaries of the agreements and may bear certain economic risks. As such, the CPAfirms with which we maintain ASAs qualify as variable interest entities. Refer to Note 1, Basis of Presentationand Significant Accounting Policies, to the accompanying consolidated financial statements for furtherdiscussion.
As of December 31, 2020, we are in compliance with all governmental and professional organizations regulationsrelevant to the services we provide.
Liability Insurance
We carry insurance policies, including those for commercial general liability, automobile liability, property,crime, professional liability, directors’ and officers’ liability, fiduciary liability, employment practices liabilityand workers’ compensation, subject to prescribed state mandates. Excess liability coverage is carried over theunderlying limits provided by the commercial general liability, directors’ and officers’ liability, professionalliability and automobile liability policies.
Seasonality
Core financial services (traditional tax and accounting services) are impacted by seasonality given the nature oftax season due to a heavier volume of activity during the first four months of the year. Seasonality is mostevident in the quarterly earnings per share (EPS) as most of the annual EPS is earned during the first half of theyear. Like most professional service companies, a large portion of our operating costs are relatively fixed in theshort term, which generally results in higher operating margins in the first half of the year.
Competition
The professional business services industry is highly fragmented and competitive. We compete with national,regional and local professional services firms including accounting and tax firms, insurance brokers, payrolladvisors and consulting firms. The majority of industry participants offers only a limited number of services. Wedifferentiate ourselves from competitors through the quality and diversity of our service offerings.
We believe that our strong client relationships, high quality of professional services, range of service offerings,industry expertise, geographic proximity, as well as our ability to provide national expertise on a local level giveus a competitive advantage.
Human Capital
At CBIZ, our value proposition to our clients is the breadth and depth of our services including our unique abilityto provide multi-disciplinary, coordinated solutions that respond to the complexity and uncertainty of today’sbusiness environment. CBIZ brings value because of the talent, expertise and commitment of approximately4,800 professionals that make up our team nationwide.
Throughout 2020 in our ongoing response to the COVID-19 pandemic, we prioritized the health and safety of ourteam members and clients. Our efforts included the implementation of a multitude of health and safety measuresto protect our work environments, a data-driven approach to remote work and rigorous protocols for ongoingreporting and contact tracing. Our ability to maintain operations with minimal disruption to our clients over thelast year is a direct reflection of the determination, resilience and commitment of our team.
We are diligent in our efforts to attract, retain and develop talent and all recruitment is managed through anational team of experts based on a process that consistently and fairly utilizes best practices and various
8

recruiting tools to source top talent. CBIZ recruiters build relationships through personal connections, and arefull life-cycle recruiters who stay with their candidates from first contact through their first 60 days as a CBIZassociate. These professionals are focused on building outreach networks with community agencies, websites andsocial media networks, as well as schools, universities and institutions with a special emphasis on those entitiesthat attract a diverse population. CBIZ is an equal opportunity employer and does not discriminate in hiring oremployment in accordance with the requirements of all applicable state and federal laws, including race, religion,national origin, ancestry, age, gender identity, marital status, military status, sexual orientation, disability, ormedical condition. The CBIZ Human Rights Policy demonstrates our commitment to respecting human rightsthroughout CBIZ. We believe the protection of human rights is fundamental to conducting great business, andbelieve we have both the ability and responsibility to drive positive change through our culture and businesspractices.
CBIZ is proud of its efforts to be a learning organization that provides opportunities for education, technicaltraining, professional development, leadership development, and coaching and awareness at every step in anassociate’s career. These opportunities are offered in both in-person and on-demand virtual programs. Mostrecently, CBIZ expanded and enhanced our diversity and inclusion training and education for all associates andcontinues to introduce additional resources as we accelerate our own efforts in this area.
At CBIZ, our values-based culture is central in our approach to employee experience and engagement. Wemeasure employee engagement on an ongoing basis to gather feedback and identify opportunities to strengthenour culture and improve our work environments. CBIZ continues to be recognized for our intentional efforts toenhance employee engagement and to position CBIZ as our team’s employer of choice. In 2020, CBIZ wasawarded 68 workplace awards including seven national awards and four national health and wellness awards. Asample of the awards won include:
• Best Workplace in Consulting and Professional Services — We were named one of the “2020 BestWorkplaces in Consulting and Professional Services” by Great Place to Work.
• Alliance for Workplace Excellence — We were recognized for three awards in 2020 by the Alliance forWorkplace Excellence; (i) Workplace Excellence Seal of Approval, (ii) Health & Wellness Seal ofApproval and (iii) Certificate of Recognition – Best Practices for Supporting Works 50+.
• Best Places to Work — We were selected and honored for the sixth consecutive year as a “Best Places toWork in Insurance” by Business Insurance magazine based on our commitment to attracting, developingand retaining great talent through employee benefits and other programs. We were recognized for thisaward based on core focus areas such as leadership and planning, corporate culture, communications,work environment and overall engagement.
• 2020 Healthiest 100 Workplaces in America — Springbuk evaluated over 1,000 applicants across sixkey categories: Culture and Leadership Commitment, Foundational Components, Strategic Planning,Marketing and Communications, Programming and Interventions, and Reporting and Analytics. We werehonored to be named one of the top 100 winners for the third time.
• 2020 Best and Brightest Companies in the Nation Top 101 — For the fifth year in a row, we werehonored as a “Best and Brightest Company” by National Association of Business Resources (“NABR”)based on our commitment to human resource practices and employee enrichment.
• 2020 Best and Brightness in Wellness — We were honored by NABR, for the fourth consecutive time,as an organization that promotes a culture of wellness.
At CBIZ, we believe Diversity and Inclusion is a business imperative and we are working together towardmaking it an essential and valued part of our culture. We strive to create an environment that welcomes, values,respects, leverages and develops our individual differences and similarities and this commitment includesidentifying and actively combating racism and discrimination in any form.
9

In 2020, CBIZ renewed our commitment to improving diversity and inclusion across the company and in theindustries and communities where we work. We are in the process of accelerating our efforts with a focus onactionable steps in the short-term to engage our team members and build momentum. These short-term actionscombined with CBIZ’s existing efforts and assets will form the foundation of a more comprehensive and long-term diversity and inclusion strategy. In the last year, CBIZ joined CEO Action for Diversity and Inclusion, thelargest CEO-driven business commitment to advance diversity and inclusion within the workplace. Jerry Griskosigned onto to the CEO Action Pledge and joined leaders from more than 1,000 of the world’s most wellrecognized companies and organizations representing over 85 industries.
ITEM 1A. RISK FACTORS.
The following factors may affect our actual operating and financial results and could cause results to differmaterially from those in any forward-looking statements. You should carefully consider the followinginformation.
Risk Factors Related to Our Business and Industry
Payments on accounts receivable may be slower than expected, or amounts due on receivables or notes maynot be fully collectible. Professional services firms often experience higher average accounts receivable daysoutstanding compared to many other industries, which may be magnified if the general economy worsens. If ourcollections become slower, our liquidity may be adversely impacted. We monitor the aging of receivablesregularly and make assessments of the ability of customers to pay amounts due. We provide for potential baddebts and recognize additional reserves against bad debts as we deem it appropriate. Notwithstanding thesemeasures, our customers may face unexpected circumstances that adversely impact their ability to pay their tradereceivables or note obligations to us and we may face unexpected losses as a result.
We are dependent on the services of our executive officers and other key employees, the loss of any of whommay have a material adverse effect on our business, financial condition and results of operations. Our successdepends in large part upon the abilities and continued services of our executive officers and other key employees,such as those who generate substantial client revenue and our business unit presidents. In the course of businessoperations, employees may retire, resign and seek employment elsewhere. Certain key employees, however, arebound in writing to agreements containing non-compete and other restrictive covenants barring competitiveemployment, client acceptance, and solicitation of employees for a period of between one and ten yearsfollowing their resignation. We cannot assure you that we will be able to retain the services of our key personnel.If we cannot retain the services of key personnel, there could be a material adverse effect on our business,financial condition and results of operations. While we generally have contractual arrangements with keypersonnel that contain restrictive covenants, courts are at times reluctant to enforce such covenants. In addition,many of our executive officers and other key personnel are either participants in our 2019 Stock OmnibusIncentive Plan, holders of a significant amount of our common stock, or receive other incentive-basedcompensation. We believe that these interests provide additional incentives for these key employees to remainwith us. In order to support our growth, we intend to continue to effectively recruit, hire, train and retainadditional qualified management personnel. Our inability to attract and retain necessary personnel could have amaterial adverse effect on our business, financial condition and results of operations.
Restrictions imposed by independence requirements and conflict of interest rules may limit our ability toprovide services to clients of the attest firms with which we have contractual relationships and the ability ofsuch attest firms to provide attestation services to our clients. Restrictions imposed by independencerequirements and state accountancy laws and regulations preclude us from rendering audit and other attestservices (other than internal audit services). As such, we and our subsidiaries maintain joint-referral relationshipsand ASAs with independent licensed CPA firms under which audit and other attest services may be provided toour clients by such CPA firms. The CPA firms are owned by licensed CPAs, a vast majority of whom areemployed by us.
10

Under these ASAs, we provide a range of services to the CPA firms, including: administrative functions such asprofessional staff, office management, bookkeeping, and accounting; preparing marketing and promotionmaterials; and providing office space, computer equipment, systems support and administrative support. Servicesare performed in exchange for a fee. Fees earned by us under the ASAs are recorded as revenue in theaccompanying Consolidated Statements of Comprehensive Income. In the event that accounts receivable andunbilled work in process become uncollectible by the CPA firms, the service fee due to us is typically reduced ona proportional basis.
With respect to CPA firm clients that are required to file audited financial statements with the SEC, the SEC staffviews us and the CPA firms with which we have contractual relationships as a single entity in applyingindependence rules established by the accountancy regulators and the SEC. Accordingly, we do not hold anyfinancial interest in, nor do we enter into any business relationship with, an SEC-reporting attest client that theCPA firm performing an audit could not maintain; further, we do not provide any non-audit services to anSEC-reporting attest client that the CPA firm performing an audit could not sell under the auditor independencelimitations set out in the Sarbanes-Oxley Act of 2002 and other professional accountancy independencestandards. SEC staff informed us that independence rules that apply to clients that receive attest services underSEC and Public Company Accounting Oversight Board (“PCAOB”) standards from such CPA firms wouldprohibit such clients from holding any common stock of CBIZ. However, applicable professional standardsgenerally permit us to provide additional services to privately-held companies, in addition to those serviceswhich may be provided to SEC-reporting attest clients of a CPA firm. We and the CPA firms have implementedpolicies and procedures designed to enable us to maintain independence and freedom from conflicts of interest inaccordance with applicable standards. Given the pre-existing limits set by us on our relationships withSEC-reporting attest clients of associated CPA firms, and the limited number and size of such clients, theimposition of independence limitations under the Sarbanes-Oxley Act of 2002, SEC rule or interpretation, orPCAOB standards do not and are not expected to materially affect our revenues.
There can be no assurance that following the policies and procedures implemented by us and the CPA firms willenable us and the CPA firms to avoid circumstances that would cause us and them to lack independence from anSEC-reporting attest client; nor can there be any assurance that state, United States Government AccountabilityOffice or United States Department of Labor accountancy authorities will not impose additional restrictions onthe profession. To the extent that the CPA firms for whom we provide staffing, administrative and other servicesare affected, we may experience a decline in fee revenue from these businesses as well as expenses related toaddressing independence concerns. To date, revenues derived from providing services in connection withattestation engagements of the attest firms performed for SEC-reporting clients have not been material.
Our goodwill and other intangible assets could become impaired, which could lead to material non-cashcharges against earnings and a material impact on our results of operations and statement of financialposition. At December 31, 2020, the net carrying value of our goodwill and other intangible assets totaled$683.1 million and $73.7 million, respectively. In accordance with Financial Accounting Standards Board(“FASB”) Accounting Standards Codification (“ASC”) Topic 350, Intangibles—Goodwill and Other, we assessthese assets, including client lists, to determine if there is any indication of impairment. Significant negativeindustry or economic trends, disruptions to our business, adverse changes resulting from new governmentalregulations, divestitures and sustained market capitalization declines may result in recognition of impairments.Any impairment of goodwill or intangible assets would result in a non-cash charge against current earnings,which could lead to a material impact on our results of operations and statements of financial position.
Certain liabilities resulting from acquisitions are estimated and could lead to a material impact on our resultsof operations. Through our acquisition activities, we record liabilities for future contingent earnout payments thatare settled in cash or through the issuance of common stock. The fair value of these liabilities is assessed on aquarterly basis and changes in assumptions used to determine the amount of the liability or a change in the fairvalue of our common stock could lead to an adjustment that may have a material impact, favorable orunfavorable, on our results of operations.
11

Governmental regulations and interpretations are subject to changes, which could have a material adverseeffect on our financial condition. Changes in laws and regulations, or the interpretation and application thereof,could result in changes in the amount or the type of business services required by businesses and individuals,which could have a material adverse effect on our financial condition. We cannot be sure that future laws andregulations will provide the same or similar opportunities for us to provide business consulting and managementservices to businesses and individuals.
Changes in the United States healthcare environment, including new healthcare legislation, may adverselyaffect the revenue and margins in our healthcare benefit businesses. Our employee benefits business,specifically our group health consulting and brokerage businesses, receives commissions for brokering employer-sponsored healthcare policies with insurance carriers on behalf of the client. In many cases, these commissionsconsist of a ratable portion of the insurance premiums on those policies, based upon a sliding scale pertaining tothe dollar volume of premiums and/or the number of participants in the plan.
Changes in the healthcare environment, including, but not limited to, any legislated changes in the United States’national healthcare system, that affect the methods by which insurance carriers remunerate brokers, couldadversely impact our revenues and margins in this business. Specifically, legislation or other changes couldafford our clients and their employees the ability to seek insurance coverage through other means, including, butnot limited to, direct access with insurance carriers or other similar avenues, which could eliminate or adverselyalter the remuneration brokers receive from insurance carriers for their services. Furthermore, statutory orregulatory changes may result in establishing alternatives to employer-sponsored healthcare insurance or replaceit with government-sponsored health insurance programs. These changes could materially alter the healthcare inthe United States and our ability to provide effective services in these areas may be substantially limited andadversely affect revenue and margins in our healthcare benefit business.
Higher rates of unemployment in the United States could result in a general reduction in the number ofindividuals with employer-sponsored healthcare coverage. This decline in employee participation in healthcareinsurance plans at our clients could result in a reduction in the commissions we receive from insurance carriersfor our brokerage services, which could have an adverse impact on revenues and margins in this business.
We are subject to risks relating to processing customer transactions for our payroll and other transactionprocessing businesses. The high volume of client funds and data processed by us, or by our out-sourcedresources abroad, in our transaction related businesses entails risks for which we may be held liable if theaccuracy or timeliness of the transactions processed is not correct. In addition, related to our payroll andemployee benefits businesses, we store personal information about some of our clients and their employees forwhich we may be liable under the Health Insurance Portability and Accountability Act or other governmentalregulations if the security of this information is breached. We could incur significant legal expense to defend anyclaims against us, even those claims without merit. While we carry insurance against these potential liabilities,we cannot be certain that circumstances surrounding such an error or breach of security would be entirelyreimbursed through insurance coverage. We believe we have controls and procedures in place to address ourfiduciary responsibility and mitigate these risks. However, if we are not successful in managing these risks, ourbusiness, financial condition and results of operations may be harmed.
Cyber-attacks or other security breaches involving our computer systems or the systems of one or more of ourvendors could materially and adversely affect our business. Our systems, like others in the industries we serve,are vulnerable to cyber security risks, and we are subject to potential disruption caused by such activities.Corporations such as ours are subject to frequent attacks on their systems. Such attacks may have various goals,from seeking confidential information to causing operational disruption. Although to date such activities have notresulted in material disruptions to our operations or, to our knowledge, a material breach of any security orconfidential information, no assurance can be provided that such disruptions or breach will not occur in thefuture. Any significant violations of data privacy could result in the loss of business, litigation, regulatoryinvestigations, penalties, ongoing expenses related to client credit monitoring and support, and other expenses,
12
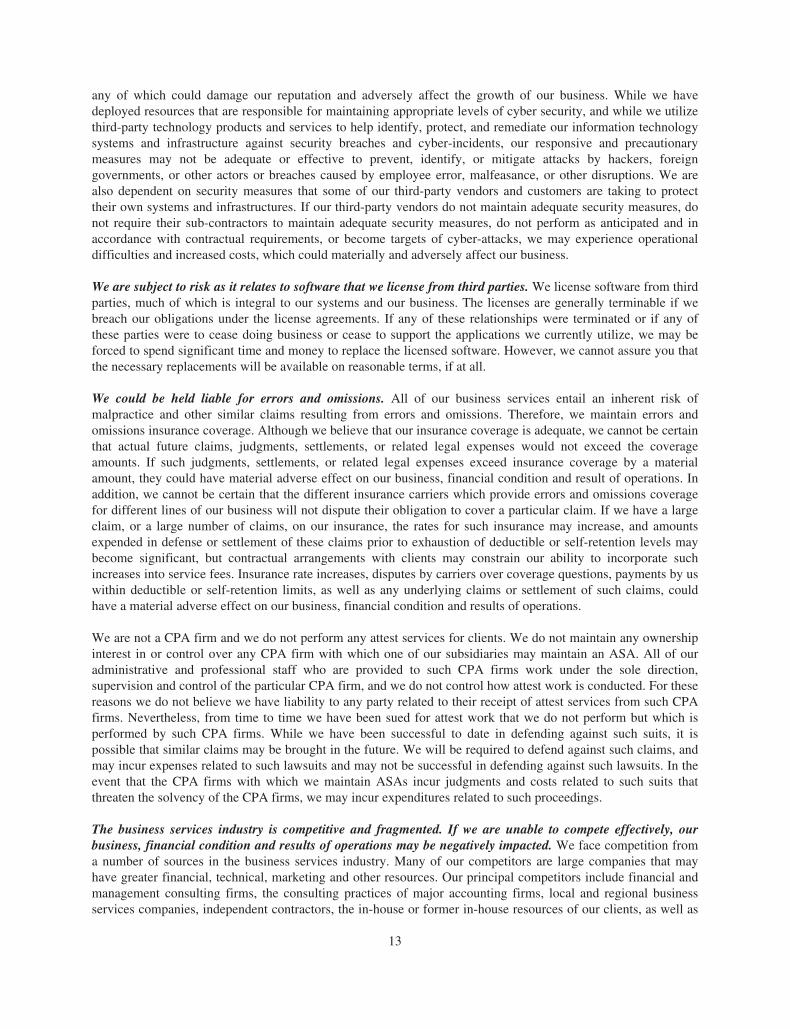
any of which could damage our reputation and adversely affect the growth of our business. While we havedeployed resources that are responsible for maintaining appropriate levels of cyber security, and while we utilizethird-party technology products and services to help identify, protect, and remediate our information technologysystems and infrastructure against security breaches and cyber-incidents, our responsive and precautionarymeasures may not be adequate or effective to prevent, identify, or mitigate attacks by hackers, foreigngovernments, or other actors or breaches caused by employee error, malfeasance, or other disruptions. We arealso dependent on security measures that some of our third-party vendors and customers are taking to protecttheir own systems and infrastructures. If our third-party vendors do not maintain adequate security measures, donot require their sub-contractors to maintain adequate security measures, do not perform as anticipated and inaccordance with contractual requirements, or become targets of cyber-attacks, we may experience operationaldifficulties and increased costs, which could materially and adversely affect our business.
We are subject to risk as it relates to software that we license from third parties. We license software from thirdparties, much of which is integral to our systems and our business. The licenses are generally terminable if webreach our obligations under the license agreements. If any of these relationships were terminated or if any ofthese parties were to cease doing business or cease to support the applications we currently utilize, we may beforced to spend significant time and money to replace the licensed software. However, we cannot assure you thatthe necessary replacements will be available on reasonable terms, if at all.
We could be held liable for errors and omissions. All of our business services entail an inherent risk ofmalpractice and other similar claims resulting from errors and omissions. Therefore, we maintain errors andomissions insurance coverage. Although we believe that our insurance coverage is adequate, we cannot be certainthat actual future claims, judgments, settlements, or related legal expenses would not exceed the coverageamounts. If such judgments, settlements, or related legal expenses exceed insurance coverage by a materialamount, they could have material adverse effect on our business, financial condition and result of operations. Inaddition, we cannot be certain that the different insurance carriers which provide errors and omissions coveragefor different lines of our business will not dispute their obligation to cover a particular claim. If we have a largeclaim, or a large number of claims, on our insurance, the rates for such insurance may increase, and amountsexpended in defense or settlement of these claims prior to exhaustion of deductible or self-retention levels maybecome significant, but contractual arrangements with clients may constrain our ability to incorporate suchincreases into service fees. Insurance rate increases, disputes by carriers over coverage questions, payments by uswithin deductible or self-retention limits, as well as any underlying claims or settlement of such claims, couldhave a material adverse effect on our business, financial condition and results of operations.
We are not a CPA firm and we do not perform any attest services for clients. We do not maintain any ownershipinterest in or control over any CPA firm with which one of our subsidiaries may maintain an ASA. All of ouradministrative and professional staff who are provided to such CPA firms work under the sole direction,supervision and control of the particular CPA firm, and we do not control how attest work is conducted. For thesereasons we do not believe we have liability to any party related to their receipt of attest services from such CPAfirms. Nevertheless, from time to time we have been sued for attest work that we do not perform but which isperformed by such CPA firms. While we have been successful to date in defending against such suits, it ispossible that similar claims may be brought in the future. We will be required to defend against such claims, andmay incur expenses related to such lawsuits and may not be successful in defending against such lawsuits. In theevent that the CPA firms with which we maintain ASAs incur judgments and costs related to such suits thatthreaten the solvency of the CPA firms, we may incur expenditures related to such proceedings.
The business services industry is competitive and fragmented. If we are unable to compete effectively, ourbusiness, financial condition and results of operations may be negatively impacted. We face competition froma number of sources in the business services industry. Many of our competitors are large companies that mayhave greater financial, technical, marketing and other resources. Our principal competitors include financial andmanagement consulting firms, the consulting practices of major accounting firms, local and regional businessservices companies, independent contractors, the in-house or former in-house resources of our clients, as well as
13

new entrants into our markets. We cannot assure you that, as our industry continues to evolve, additionalcompetitors will not enter the industry or that our clients will not choose to conduct more of their businessservices internally or through alternative business services providers. Although we intend to monitor industrytrends and respond accordingly, we cannot assure you that we will be able to anticipate and successfully respondto such trends in a timely manner. We cannot be certain that we will be able to effectively compete againstcurrent and future competitors, or that competitive pressure will not have a material adverse effect on ourbusiness, financial condition and results of operations.
Given our levels of share-based compensation, our tax rate may vary significantly depending on our stockprice. We apply FASB Accounting Standards Codification 718, Compensation—Stock Compensation underwhich the tax effects of the accounting for share-based compensation may significantly impact our effective taxrate from period to period. In periods in which our stock price is higher than the grant date fair value of the share-based compensation vesting or exercises in that period, we will recognize excess tax benefits that will decreaseour effective tax rate. In future periods in which our stock price is lower than the grant price of the share-basedcompensation vesting in that period, our effective tax rate may increase. The amount and value of share-basedcompensation issued relative to our earnings in a particular period will also affect the magnitude of the impact ofshare-based compensation on our effective tax rate. These tax effects are dependent on our stock price andexercise activity, which we do not control, and a decline in our stock price could significantly increase oureffective tax rate and adversely affect our financial results.
We may be subject to the actions of activist shareholders. Our Board of Directors and management team arecommitted to acting in the best interest of all of our shareholders. We value constructive input from investors andregularly engage in dialogue with our shareholders regarding strategy and performance. Activist shareholderswho disagree with the composition of the Board of Directors, our strategy or the way the Company is managedmay seek to effect change through various strategies and channels. Responding to shareholder activism can becostly and time-consuming, disrupt our operations, and divert the attention of management and our employeesfrom our strategic initiatives. Activist campaigns can create perceived uncertainties as to our future direction,strategy, or leadership and may result in the loss of potential business opportunities, harm our ability to attractnew employees, investors, and customers, and cause our stock price to experience periods of volatility orstagnation.
Changes in accounting policies, standards, and interpretations could materially affect how we report ourfinancial condition, results of operations, and cash flows. The FASB, regulatory agencies, and other bodies thatestablish accounting standards periodically change the financial accounting and reporting standards governingthe preparation of our consolidated financial statements. Additionally, those bodies that establish and interpretthe accounting standards (such as the FASB and the SEC) may change prior interpretations or positions on howthese standards should be applied. These changes can be difficult to predict and can materially affect how werecord and report our financial condition, results of operations, and cash flows. In unusual circumstances, wecould be required to retroactively apply a new or revised standard, resulting in changes to previously reportedfinancial results.
Rapid technological changes could significantly impact our competitive position, client relationships andoperating results. The professional business services industry has been and continues to be impacted bysignificant technological changes, enabling companies to offer services competitive with ours. Thosetechnological changes may (i) reduce demand for our services, (ii) enable the development of competitiveproducts or services, or (iii) enable our current customers to reduce or bypass the use of our services.Additionally, rapid changes in artificial intelligence and block chain-based technology are increasing thecompetitiveness landscape. We may not be successful in anticipating or responding to these changes and demandfor our services could be further reduced by advanced technologies being deployed by our competitors. Theeffort to gain technological expertise and develop new technologies in our business may require us to incursignificant expenses. In some cases, we depend on key vendors and partners to provide technology and othersupport. If these third parties fail to perform their obligations or cease to work with us, our ability to execute onour strategic initiatives could be adversely affected.
14
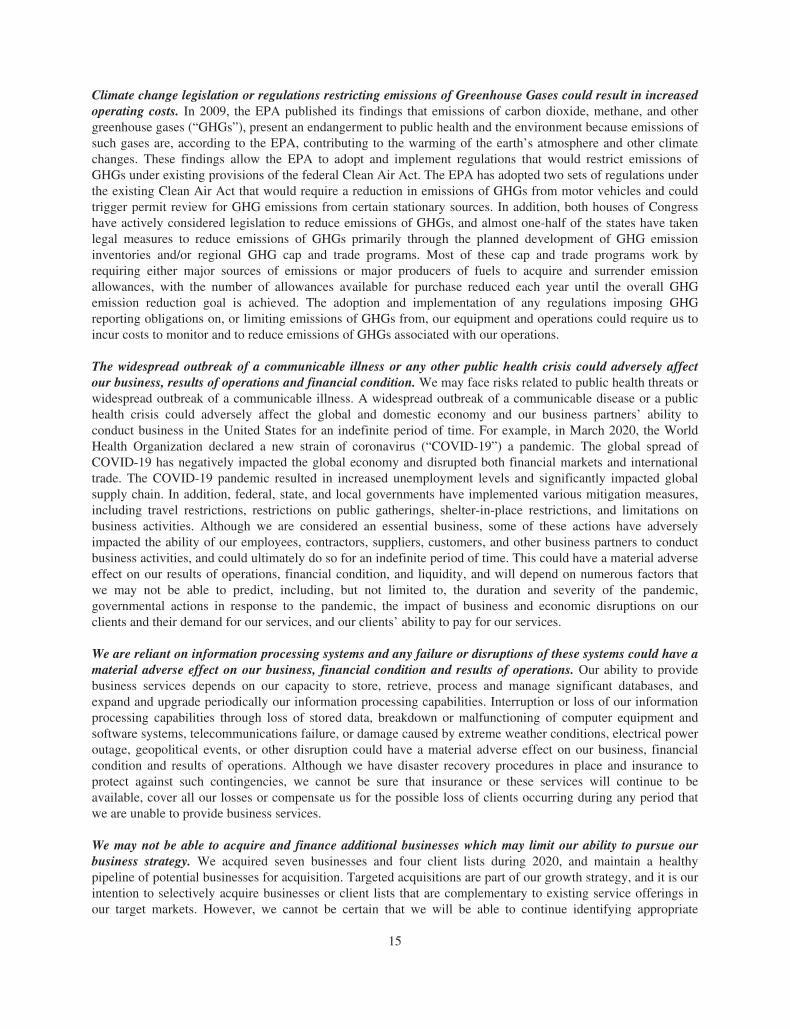
Climate change legislation or regulations restricting emissions of Greenhouse Gases could result in increasedoperating costs. In 2009, the EPA published its findings that emissions of carbon dioxide, methane, and othergreenhouse gases (“GHGs”), present an endangerment to public health and the environment because emissions ofsuch gases are, according to the EPA, contributing to the warming of the earth’s atmosphere and other climatechanges. These findings allow the EPA to adopt and implement regulations that would restrict emissions ofGHGs under existing provisions of the federal Clean Air Act. The EPA has adopted two sets of regulations underthe existing Clean Air Act that would require a reduction in emissions of GHGs from motor vehicles and couldtrigger permit review for GHG emissions from certain stationary sources. In addition, both houses of Congresshave actively considered legislation to reduce emissions of GHGs, and almost one-half of the states have takenlegal measures to reduce emissions of GHGs primarily through the planned development of GHG emissioninventories and/or regional GHG cap and trade programs. Most of these cap and trade programs work byrequiring either major sources of emissions or major producers of fuels to acquire and surrender emissionallowances, with the number of allowances available for purchase reduced each year until the overall GHGemission reduction goal is achieved. The adoption and implementation of any regulations imposing GHGreporting obligations on, or limiting emissions of GHGs from, our equipment and operations could require us toincur costs to monitor and to reduce emissions of GHGs associated with our operations.
The widespread outbreak of a communicable illness or any other public health crisis could adversely affectour business, results of operations and financial condition. We may face risks related to public health threats orwidespread outbreak of a communicable illness. A widespread outbreak of a communicable disease or a publichealth crisis could adversely affect the global and domestic economy and our business partners’ ability toconduct business in the United States for an indefinite period of time. For example, in March 2020, the WorldHealth Organization declared a new strain of coronavirus (“COVID-19”) a pandemic. The global spread ofCOVID-19 has negatively impacted the global economy and disrupted both financial markets and internationaltrade. The COVID-19 pandemic resulted in increased unemployment levels and significantly impacted globalsupply chain. In addition, federal, state, and local governments have implemented various mitigation measures,including travel restrictions, restrictions on public gatherings, shelter-in-place restrictions, and limitations onbusiness activities. Although we are considered an essential business, some of these actions have adverselyimpacted the ability of our employees, contractors, suppliers, customers, and other business partners to conductbusiness activities, and could ultimately do so for an indefinite period of time. This could have a material adverseeffect on our results of operations, financial condition, and liquidity, and will depend on numerous factors thatwe may not be able to predict, including, but not limited to, the duration and severity of the pandemic,governmental actions in response to the pandemic, the impact of business and economic disruptions on ourclients and their demand for our services, and our clients’ ability to pay for our services.
We are reliant on information processing systems and any failure or disruptions of these systems could have amaterial adverse effect on our business, financial condition and results of operations. Our ability to providebusiness services depends on our capacity to store, retrieve, process and manage significant databases, andexpand and upgrade periodically our information processing capabilities. Interruption or loss of our informationprocessing capabilities through loss of stored data, breakdown or malfunctioning of computer equipment andsoftware systems, telecommunications failure, or damage caused by extreme weather conditions, electrical poweroutage, geopolitical events, or other disruption could have a material adverse effect on our business, financialcondition and results of operations. Although we have disaster recovery procedures in place and insurance toprotect against such contingencies, we cannot be sure that insurance or these services will continue to beavailable, cover all our losses or compensate us for the possible loss of clients occurring during any period thatwe are unable to provide business services.
We may not be able to acquire and finance additional businesses which may limit our ability to pursue ourbusiness strategy. We acquired seven businesses and four client lists during 2020, and maintain a healthypipeline of potential businesses for acquisition. Targeted acquisitions are part of our growth strategy, and it is ourintention to selectively acquire businesses or client lists that are complementary to existing service offerings inour target markets. However, we cannot be certain that we will be able to continue identifying appropriate
15

acquisition candidates and acquire them on satisfactory terms, and we cannot be assured that such acquisitions,even if completed, will perform as expected or will contribute significant synergies, revenues or profits. Inaddition, we may also face increased competition for acquisition opportunities, which may inhibit our ability tocomplete transactions on terms that are favorable to us. As discussed above, there are certain provisions underour credit facility that may limit our ability to acquire additional businesses. In the event that we are not incompliance with certain covenants as specified in our credit facility, we could be restricted from makingacquisitions, restricted from borrowing funds from our credit facility for other uses, or required to pay down theoutstanding balance on the line of credit. However, management believes that funds available under the creditfacility, along with cash generated from operations, will be sufficient to meet our liquidity needs, includingplanned acquisition activity in the foreseeable future. To the extent we are unable to find suitable acquisitioncandidates, an important component of our growth strategy may not be realized.
We require a significant amount of cash for interest payments on our debt and to expand our business asplanned. At December 31, 2020, our debt consisted primarily of $108.0 million in principal amount outstandingunder our $400 million unsecured credit facility (the “2018 credit facility” or the “credit facility”). Our debtrequires us to dedicate a portion of our cash flow from operations to pay interest on our indebtedness, therebyreducing the funds available to use for acquisitions, capital expenditures and general corporate purposes. Ourability to make interest payments on our debt, and to fund acquisitions, will depend upon our ability to generatecash in the future. Insufficient cash flow could place us at risk of default under our debt agreements or couldprevent us from expanding our business as planned. Our ability to generate cash is subject to general economic,financial, competitive, legislative, regulatory and other factors that are beyond our control. Our business may notgenerate sufficient cash flow from operations and future borrowings may not be available to us under our creditfacility in an amount sufficient to enable us to fund our other liquidity needs. Volatility in interest rates frommonetary policy or economic conditions could increase expenses, cause uncertainty and impact our ability to payinterest on our indebtedness. Refer to Item 7A, Quantitative and Qualitative Disclosures about Market Risk, forfurther information regarding interest rate risk.
The interest rates under our 2018 credit facility and related interest rate swaps may be impacted by thephase-out of LIBOR. The London Interbank Offered Rate (“LIBOR”), is the basic rate of interest used in lendingbetween banks on the London interbank market and is widely used as a reference for setting the interest rates onloans globally. We generally use LIBOR as a reference rate to calculate interest rates under our credit facility. In2017, the United Kingdom’s Financial Conduct Authority, which regulates LIBOR, announced that it intends tophase out LIBOR by the end of 2021. It is unclear if LIBOR will cease to exist at that time or if new methods ofcalculating LIBOR will be established such that it continues to exist after 2021. The U.S. Federal Reserve, inconjunction with the Alternative Reference Rates Committee, a steering committee comprised of large U.S.financial institutions, is considering replacing U.S. dollar LIBOR with a new index, the Secured OvernightFinancing Rate (“SOFR”), calculated using short-term repurchase agreements backed by Treasury securities.SOFR is observed and backward looking, unlike LIBOR under the current methodology, which is an estimatedforward-looking rate and relies, to some degree, on the expert judgment of submitting panel members. Given thatSOFR is a secured rate backed by government securities, it will be a rate that does not take into account bankcredit risk (as is the case with LIBOR). SOFR also may be more volatile than LIBOR. Whether or not SOFR, oranother alternative reference rate, attains market traction as a LIBOR replacement tool remains in question. IfLIBOR ceases to exist, we may need to amend our 2018 credit facility and related interest rate swaps to replaceLIBOR with an agreed upon replacement index, and certain of the interest rates under our 2018 credit facilitymay change. The new rates may not be as favorable to us as those in effect prior to any LIBOR phase-out. Wemay also find it desirable to engage in more frequent interest rate hedging transactions.
Terms of our credit facility may adversely affect our ability to run our business and/or reduce stockholderreturns. The terms of our credit facility, as well as the guarantees of our subsidiaries, could impair our ability tooperate our business effectively and may limit our ability to take advantage of business opportunities. Forexample, our credit facility may (i) restrict our ability to repurchase or redeem our capital stock or debt, or mergeor consolidate with another entity; (ii) limit our ability to borrow additional funds or to obtain other financing in
16

the future for working capital, capital expenditures, acquisitions, investments and general corporate purposes;(iii) limit our ability to dispose of our assets, to create liens on our assets, to extend credit or to issue dividends toour stockholders; and (iv) make us more vulnerable to economic downturns and reduce our flexibility inresponding to changing business and economic conditions.
Our failure to satisfy covenants in our debt instruments could cause a default under those instruments. Ourdebt instruments include a number of covenants relating to financial ratios and tests. Our ability to comply withthese covenants may be affected by events beyond our control, including prevailing economic, financial andindustry conditions. The breach of any of these covenants could result in a default under these instruments. Anevent of default would permit our lenders and other debt holders to declare all amounts borrowed from them tobe due and payable, together with accrued and unpaid interest. If the lenders accelerate the repayment ofborrowings, we may not have sufficient assets to repay our debt.
Risk Factors Related to Ownership of Our Common Stock
We may be more sensitive to revenue fluctuations than other companies, which could result in fluctuations inthe market price of our common stock. A substantial majority of our operating expenses, such as personnel andrelated costs and occupancy costs, are relatively fixed in the short term. As a result, we may not be able to
quickly reduce costs in response to any decrease in revenue. This factor could cause our quarterly results to belower than expectations of securities analysts and stockholders, which could result in a decline in the price of ourcommon stock.
The future issuance of additional shares could adversely affect the price of our common stock. Future sales orissuances of common stock, including those related to the uses described below, or the perception that salescould occur, could adversely affect the market price of our common stock and dilute the percentage ownershipheld by our stockholders. We have authorized 250 million shares of common stock, and have approximately55.7 million shares of common stock outstanding at January 31, 2021. A substantial number of these shares havebeen issued in connection with acquisitions. As part of many acquisition transactions, shares are contractuallyrestricted from sale for a one-year period, and as of January 31, 2021, approximately 0.3 million shares of ourcommon stock were under lock-up contractual restrictions that expire by December 31, 2021. We cannot be surewhen sales by holders of our stock will occur, how many shares will be sold or the effect that sales may have onthe market price of our common stock.
Our principal stockholders may have substantial control over our operations. Our stockholders thatbeneficially own (within the meaning of Rule 13d-3 of the Exchange Act) significant percentages of our commonstock relative to other individual stockholders may exert substantial influence over actions that require theconsent of a majority of our outstanding shares, including the election of directors. Our share repurchaseactivities may result in increased ownership percentages of these individuals and therefore increase the influencethey may exert, if they do not participate in these share repurchase transactions or otherwise dispose of theircommon stock.
There is volatility in our stock price. The market for our common stock has, from time to time, experienced priceand volume fluctuations. Factors such as announcements of variations in our quarterly financial results andfluctuations in revenue, as well as the expectations of stockholders and securities analysts regarding the ability ofour business to grow and achieve certain revenue or profitability targets, could cause the market price of ourcommon stock to fluctuate significantly. In addition, the stock market in general has experienced volatility thatoften has been unrelated to the operating performance of companies such as ours. These broad market andindustry fluctuations may adversely affect the price of our stock, regardless of our operating performance.
ITEM 1B. UNRESOLVED STAFF COMMENTS.
None.
17

ITEM 2. PROPERTIES.
Our corporate headquarters are located at 6050 Oak Tree Boulevard, South, Suite 500, Cleveland, Ohio 44131, inleased premises. We lease more than 100 offices in 31 states and the District of Columbia and believe that ourcurrent facilities are sufficient for our current needs.
ITEM 3. LEGAL PROCEEDINGS.
Refer to Note 11, Commitments and Contingencies, to the accompanying consolidated financial statements forinformation on legal proceedings, which is incorporated by reference herein.
ITEM 4. MINE SAFETY DISCLOSURES.
Not applicable.
18

PART II
ITEM 5. MARKET FOR REGISTRANT’S COMMON EQUITY, RELATED STOCKHOLDERMATTERS AND ISSUER PURCHASES OF EQUITY SECURITIES.
Market Information for Common Stock - Our common stock is traded on the NYSE under the trading symbol“CBZ.”
Holders of Record — The number of holders of our common stock based on record ownership as ofDecember 31, 2020 was approximately 2,200.
Dividends — Historically, we have not paid cash dividends on our common stock and do not anticipate payingcash dividends in the foreseeable future. Refer to Note 9, Debt and Financing Arrangements, to theaccompanying consolidated financial statements for information relating to restrictions on declaring or makingdividend payments under our 2018 credit facility.
Recent Sales of Unregistered Securities — During the year ended December 31, 2020, we issuedapproximately 429.2 thousand shares of our common stock as payment for contingent consideration for currentyear and previous acquisitions. The above referenced shares were issued in transactions not involving a publicoffering in reliance on the exemption from registration afforded by Section 4(a)(2) of the Securities Act. Thepersons to whom the shares were issued had access to full information about the Company and represented thatthey acquired the shares for their own account and not for the purpose of distribution. The certificates for theshares contain a restrictive legend advising that the shares may not be offered for sale, sold, or otherwisetransferred without having first been registered under the Securities Act or pursuant to an exemption from theSecurities Act.
Issuer Purchases of Equity Securities — Shares repurchased during the three months ended December 31,2020 (reported on a trade-date basis) are summarized in the table below (in thousands, except per share data).Average price paid per share includes fees and commissions.
Issuer Purchases of Equity Securities
Fourth Quarter Purchases
TotalNumber of
SharesPurchased
AveragePrice Paid
PerShare
Total Number ofShares
Purchased asPart of PubliclyAnnounced Plan
MaximumNumber of
Shares ThatMay Yet BePurchased
Under the Plan
October 1 – October 31, 2020 . . . . . . . . . . 211 $23.43 211 4,554November 1 – November 30, 2020 . . . . . . 348 $24.67 348 4,206December 1 – December 31, 2020 . . . . . . . 440 $25.61 440 3,766
999 $24.82 999
Refer to Note 13, Common Stock, to the accompanying consolidated financial statements for future discussion onthe Share Repurchase Program.
Performance Graph — The graph below matches the cumulative five-year total return of holders of CBIZ,Inc.’s common stock with the cumulative total returns of the S&P 500 index, the Russell 2000 index and acustomized peer group of five companies that includes: Brown & Brown, Inc., H & R Block, Inc., Paychex, Inc.,Resources Connection, Inc. and Willis Towers Watson Plc. The graph assumes that the value of the investment inour common stock, in each index, and in the peer group (including reinvestment of dividends) was $100 onDecember 31, 2015 and tracks it through December 31, 2020.
19

COMPARISON OF 5 YEAR CUMULATIVE TOTAL RETURN*
Among CBIZ, Inc., the S&P 500 Index, the Russell 2000 Index, and a Peer Group
$100
$150
$200
$250
CBIZ, Inc. S&P 500 Russell 2000 Peer Group
202020192018201720162015
*$100 invested on December 31, 2015 in stock or index, including reinvestment of dividends.Fiscal year ending December 31.
Copyright© 2021 Standard & Poor’s, a division of S&P Global. All rights reserved.Copyright© 2021 Russell Investment Group. All rights reserved.
$300
* $100 invested on December 31, 2015 in stock or index, including reinvestment of dividends.
Fiscal year ending December 31.
Copyright© 2021 Standard & Poor’s, a division of S&P Global. All rights reserved.
Copyright© 2021 Russell Investment Group. All rights reserved.
2015 2016 2017 2018 2019 2020
CBIZ, Inc. $100.00 $138.95 $156.69 $199.80 $273.43 $269.88
S&P 500 100.00 111.96 136.40 130.42 171.49 203.04
Russell 2000 100.00 121.31 139.08 123.76 155.35 186.36
Peer Group 100.00 107.62 127.65 129.45 171.35 186.69
The stock price performance included in this graph is not necessarily indicative of future stock priceperformance.
20

ITEM 6. SELECTED FINANCIAL DATA.
The following table presents our selected historical financial data. The information set forth below should be readin conjunction with Management’s Discussion and Analysis of Financial Condition and Results of Operationsand the accompanying consolidated financial statements and notes thereto, which are included elsewhere in thisAnnual Report.
Year Ended December 31,
2020 2019 2018 2017 2016
(In thousands, except per share data)Results of Operations DataRevenue . . . . . . . . . . . . . . . . . . . . . . . . . . . . . . . . . $ 963,897 $ 948,424 $ 922,003 $ 855,340 $ 799,832
Income from continuing operations before incometax expense . . . . . . . . . . . . . . . . . . . . . . . . . . . . 103,488 92,889 79,840 74,320 67,006
Income tax expense . . . . . . . . . . . . . . . . . . . . . . . . 25,141 21,840 18,267 23,288 26,399
Income from continuing operations . . . . . . . . . . . . 78,347 71,049 61,573 51,032 40,607
Net income . . . . . . . . . . . . . . . . . . . . . . . . . . . . . . $ 78,299 $ 70,714 $ 61,570 $ 50,377 $ 40,065
Basic weighted average common shares . . . . . . . . 54,288 54,299 54,561 53,862 52,321Diluted weighted average common shares . . . . . . 55,359 55,895 56,487 55,689 53,513Diluted earnings per share:
Continuing operations . . . . . . . . . . . . . . . . . . $ 1.42 $ 1.27 $ 1.09 $ 0.92 $ 0.76Net income . . . . . . . . . . . . . . . . . . . . . . . . . . $ 1.41 $ 1.26 $ 1.09 $ 0.91 $ 0.75
Balance Sheet DataTotal assets . . . . . . . . . . . . . . . . . . . . . . . . . . . . . . $1,513,754 $1,400,774 $1,183,031 $1,176,231 $1,118,588Long-term debt . . . . . . . . . . . . . . . . . . . . . . . . . . . $ 108,000 $ 105,500 $ 135,500 $ 178,500 $ 191,400Total liabilities . . . . . . . . . . . . . . . . . . . . . . . . . . . . $ 811,134 $ 741,536 $ 589,368 $ 645,352 $ 638,567Total stockholders’ equity . . . . . . . . . . . . . . . . . . . $ 702,620 $ 659,238 $ 593,663 $ 530,879 $ 480,021Adjusted EBITDA (1) . . . . . . . . . . . . . . . . . . . . . . $ 132,119 $ 120,582 $ 109,135 $ 104,011 $ 94,842
(1) We report our financial results in accordance with United States generally accepted accounting principles (“GAAP”). Adjusted EBITDA,a Non-GAAP measure, represents income from continuing operations before income tax expense, interest expense, gain on sale ofoperations, net, and depreciation and amortization expense. We have included Adjusted EBITDA because such data is commonly used asa performance measure by analysts and investors and as a measure of our ability to service debt. Adjusted EBITDA should not beregarded as an alternative or replacement to any measurement of performance under generally accepted accounting principles. Refer tothe GAAP Reconciliation table in Part II—Item 7, Management’s Discussion and Analysis of Financial Condition and Results ofOperations, which reconciles the Non-GAAP financial measure to the nearest GAAP financial measure, “Income from continuingoperations.”
21

ITEM 7. MANAGEMENT’S DISCUSSION AND ANALYSIS OF FINANCIAL CONDITION ANDRESULTS OF OPERATIONS.
This Management’s Discussion and Analysis of Financial Condition and Results of Operations relates to, andshould be read in conjunction with, our consolidated financial statements included elsewhere in this report. Inaddition to historical information, this discussion and analysis contains forward-looking statements that involverisks, uncertainties and assumptions, which could cause actual results to differ materially from management’sexpectations. Please see the sections of this report entitled “Forward-Looking Statements” and “Risk Factors.”
EXECUTIVE SUMMARY
Financial Year in Review — Revenue of $963.9 million in 2020 grew $15.5 million, or 1.6%, from revenue of$948.4 million in 2019. Same-unit revenue decreased by $3.5 million, or 0.4%, while acquisitions, net ofdivestitures, contributed $18.9 million to revenue, or 2.0%. A detailed discussion of revenue by practice group isincluded under “Operating Practice Groups.” Income from continuing operations in 2020 increased $7.3 million,or 10.3%, to $78.3 million from $71.0 million in 2019. Refer to “Results of Operations - Continuing Operations”for a detailed discussion of the components of income from continuing operations. Earnings per diluted sharefrom continuing operations were $1.42 in 2020, compared to $1.27 in 2019, with a fully diluted weighted averageshare count of 55.4 million shares in 2020, compared to 55.9 million shares in 2019.
Strategic Use of Capital — Our first priority for the use of capital is to make strategic acquisitions. Wecompleted the following seven acquisitions in 2020:
• Effective February 1, 2020, we acquired substantially all the assets of Alliance Insurance Services, Inc., aprovider of insurance and advisory services based in Washington DC.
• Effective February 1, 2020, we acquired substantially all the assets of Pension Dynamics, LLC, a fullservice retirement and benefits plan advisor based in Pleasant Hill, California.
• Effective February 1, 2020, we acquired substantially all the assets of Sunshine Systems, a payrollsolutions provider based in Massachusetts.
• Effective July 1, 2020, we acquired substantially all the assets of Prince-Wood Insurance, L.L.C., aprovider of financial insurance and advisory services based in Woodbridge, Virginia.
• Effective September 1, 2020, we acquired substantially all the assets of ARC Consulting LLC and ARCPlacement Group LLC (collectively “ARC”). ARC is a provider of financial, insurance and advisoryservices based in San Francisco, California.
• Effective December 1, 2020, we acquired substantially all the assets of BeyondPay, a full service humancapital management and payroll service provider based in Clinton, New Jersey.
• Effective December 31, 2020, we acquired substantially all the assets of Borden Perlman InsuranceAgency, Inc., a leading provider of financial, insurance and advisory services located in Ewing, NewJersey.
Refer to Note 18, Business Combinations, to the accompanying consolidated financial statements for furtherdiscussion on acquisitions.
We also have the financing flexibility and the capacity to actively repurchase shares of our common stock. Webelieve that repurchasing shares of our common stock is a prudent use of our financial resources, and thatinvesting in our stock is an attractive use of capital and an efficient means to provide value to our shareholders.On February 11, 2021, the CBIZ Board of Directors authorized the purchase of up to 5.0 million shares of ourcommon stock under our Share Repurchase Program (the “Share Repurchase Program”), which may besuspended or discontinued at any time and expires on March 31, 2022. The shares may be purchased (i) in theopen market, (ii) in privately negotiated transactions, or (iii) under Rule 10b5-1 trading plans, which may include
22

purchases from our employees, officers and directors, in accordance with SEC rules. CBIZ management willdetermine the timing and amount of the transaction based on its evaluation of market conditions and otherfactors.
Pursuant to previously authorized share repurchase programs, we repurchased 2.3 million shares of our commonstock at a total cost of approximately $57.6 million in 2020, 1.2 million shares at a total cost of approximately$25.3 million in 2019 and 0.8 million shares at a total cost of approximately $15.6 million in 2018. Refer to Note13, Common Stock, to the accompanying consolidated financial statements for further discussion on the ShareRepurchase Program.
Recent Accomplishments and Other Events
Workplace Awards — In 2020, we were honored and recognized for 68 various national and local marketawards. A sample of the awards won include:
• Best Workplace in Consulting and Professional Services — We were named one of the “2020 BestWorkplaces in Consulting and Professional Services” by Great Place to Work.
• Alliance for Workplace Excellence — We were recognized for three awards in 2020 by the Alliance forWorkplace Excellence; (i) Workplace Excellence Seal of Approval, (ii) Health & Wellness Seal ofApproval and (iii) Certificate of Recognition – Best Practices for Supporting Works 50+.
• Best Places to Work — We were selected and honored for the sixth consecutive year as a “Best Places toWork in Insurance” by Business Insurance magazine based on our commitment to attracting, developingand retaining great talent through employee benefits and other programs. We were recognized for thisaward based on core focus areas such as leadership and planning, corporate culture, communications,work environment and overall engagement.
• 2020 Healthiest 100 Workplaces in America — Springbuk evaluated over 1,000 applicants across sixkey categories: Culture and Leadership Commitment, Foundational Components, Strategic Planning,Marketing and Communications, Programming and Interventions, and Reporting and Analytics. We werehonored to be named one of the top 100 winners for the third time.
• 2020 Best and Brightest Companies in the Nation Top 101 — For the fifth year in a row, we werehonored as a “Best and Brightest Company” by NABR based on our commitment to human resourcepractices and employee enrichment.
• 2020 Best and Brightness in Wellness — We were honored by NABR, for the fourth consecutive time,as an organization that promotes a culture of wellness.
RESULTS OF OPERATIONS — CONTINUING OPERATIONS
We provide professional business services that help clients manage their finances and employees. We deliver ourintegrated services through the following three practice groups: Financial Services, Benefits and InsuranceServices and National Practices. A description of these groups’ operating results and factors affecting theirbusinesses is provided below.
Same-unit revenue represents total revenue adjusted to reflect comparable periods of activity for acquisitions anddivestitures. For example, for a business acquired on July 1, 2019, revenue for the period January 1, 2020through June 30, 2020 would be reported as revenue from acquired businesses; same-unit revenue would includerevenue for the periods July 1 through December 31 of both years. Divested operations represent operations thatdid not meet the criteria for treatment as discontinued operations. Those businesses that have met therequirements to be treated as a discontinued operation are eliminated from continuing operations for all periodspresented below.
23

Revenue
The following table summarizes total revenue for the years ended December 31, 2020, 2019 and 2018:
Year Ended December 31,
2020 Percent 2019 Percent 2018 Percent
(Dollars in thousands)
Financial Services . . . . . . . . . . . . . . . . . . . . . . . . . . $629,778 65.3% $616,567 65.0% $600,926 65.2%Benefits and Insurance Services . . . . . . . . . . . . . . . 297,758 30.9% 296,228 31.2% 288,437 31.3%National Practices . . . . . . . . . . . . . . . . . . . . . . . . . . 36,361 3.8% 35,629 3.8% 32,640 3.5%
Total CBIZ revenue . . . . . . . . . . . . . . . . . . . . $963,897 100.0% $948,424 100.0% $922,003 100.0%
A detailed discussion of same-unit revenue by practice group is included under “Operating Practice Groups.”
Non-qualified Deferred Compensation Plan — We sponsor a non-qualified deferred compensation plan, underwhich a CBIZ employee’s compensation deferral is held in a rabbi trust and invested accordingly as directed bythe employee. Income and expenses related to the deferred compensation plan are included in “Operatingexpenses,” “Gross margin” and “Corporate General & Administrative expenses” and are directly offset bydeferred compensation gains or losses in “Other income (expense), net” in the accompanying ConsolidatedStatements of Comprehensive Income. The deferred compensation plan has no impact on “Income fromcontinuing operations before income tax expense” or diluted earnings per share from continuing operations.
Operating Expenses
The following table presents our operating expenses for the years ended December 31, 2020, 2019 and 2018:
Year Ended December 31,
2020 2019 2018
(Dollars in thousands)
Operating expenses . . . . . . . . . . . . . . . . . . . . . . . . . . . . . . . . . . . . . . . . . . . . . . $825,351 $823,496 $790,283Operating expenses % of revenue . . . . . . . . . . . . . . . . . . . . . . . . . . . . . . . . . . . 85.6% 86.8% 85.7%
2020 compared to 2019 — Our operating expenses increased by $1.9 million. Operating expense as apercentage of revenue decreased to 85.6% of revenue from 86.8% of revenue for the prior year. The deferredcompensation plan increased operating expenses by $13.8 million and $17.2 million in 2020 and 2019,respectively. Excluding the impact of the deferred compensation plan, operating expenses would have been$811.5 million, or 84.2% of revenue, in 2020 compared to $806.3 million, or 85.0% of revenue, in 2019.
The majority of our operating expenses relate to personnel costs, which includes (i) salaries and benefits,(ii) commissions paid to producers (iii) incentive compensation and (iv) share-based compensation. Personnelcosts increased $24.2 million, or 3.8%. Acquisitions contributed approximately $12.1 million to personnel costs.The increase in personnel costs was offset by approximately $20.1 million lower travel and entertainment andother discretionary spending in 2020 due to COVID-19. Personnel costs and other operating expenses arediscussed in further detail under “Operating Practice Groups.”
2019 compared to 2018 — Our operating expenses increased by $33.2 million in 2019 as compared to 2018, andincreased to 86.8% of revenue in 2019 from 85.7% of revenue for the prior year. The deferred compensation planincreased operating expenses by $17.2 million in 2019, but decreased operating expenses by $4.5 million in2018. Excluding the impact of the deferred compensation plan, operating expenses would have been$806.3 million, or 85.0% of revenue, in 2019 compared to $794.7 million, or 86.2% of revenue, in 2018.Personal costs increased $11.1 million, or 1.8%, in 2019 to support our growth in revenue, with acquisitionscontributing approximately $5.7 million to personnel costs.
24

Corporate General & Administrative Expenses
The following table presents our Corporate General & Administrative (“G&A”) expenses for the years endedDecember 31, 2020, 2019 and 2018:
Year Ended December 31,
2020 2019 2018
(Dollars in thousands, except percentages)
G&A expenses . . . . . . . . . . . . . . . . . . . . . . . . . . . . . . . . . . . . . . . $46,066 $44,406 $39,173G&A expenses % of revenue . . . . . . . . . . . . . . . . . . . . . . . . . . . . 4.8% 4.7% 4.2%
2020 compared to 2019 — Our G&A expenses increased by approximately $1.7 million, or 3.7%, in 2020compared to 2019, and increased to 4.8% of revenue from 4.7% of revenue for the prior year. The deferredcompensation plan increased G&A expenses by $1.6 million in 2020, and by $2.0 million in 2019. Excluding theimpact of the deferred compensation plan, G&A expenses would have been $44.5 million, or 4.6% of revenue, in2020 compared to $42.4 million, or 4.5% of revenue, in 2019. Personnel costs, including stock-basedcompensation, increased by $1.3 million, or 5.7% in 2020 as compared to 2019.
2019 compared to 2018 — Our G&A expenses increased by approximately $5.2 million, or 13.4%, in 2019compared to 2018, and increased to 4.7% of revenue in 2019 from 4.2% of revenue for the prior year. Thedeferred compensation plan decreased G&A expenses by $2.0 million in 2019, but decreased G&A expenses by$0.4 million in 2018. Excluding the impact of the deferred compensation plan, G&A expenses would have been$42.4 million, or 4.5% of revenue, in 2019 compared to $39.6 million, or 4.3% of revenue, in 2018. Personnelcosts, including stock-based compensation, increased $1.1 million, or 5.1%.
Other Income (Expense), net
The following table presents our Other income (expense), net for the years ended December 31, 2020, 2019 and2018:
Year Ended December 31,
2020 2019 2018
(Dollars in thousands)
Interest expense . . . . . . . . . . . . . . . . . . . . . . . . . . . . . . . . . . . . . . . . . (4,983) (5,765) (6,645)(Loss) gain on sale of operations, net . . . . . . . . . . . . . . . . . . . . . . . . (509) 417 1,025Other income (expense), net (1) . . . . . . . . . . . . . . . . . . . . . . . . . . . . 16,500 17,715 (7,087)
Total other income (expense), net . . . . . . . . . . . . . . . . . . . . . . . . . . . $11,008 $12,367 $(12,707)
(1) Other income (expense), net includes a net gain of $15.4 million in 2020, a net gain of $19.2 million in2019, and a net loss of $4.9 million in 2018, associated with the value of investments held in a rabbi trustrelated to the deferred compensation plan. The adjustments to the investments held in a rabbi trust related tothe deferred compensation plan are offset by a corresponding increase or decrease to compensation expense,which is recorded as “Operating expenses” and “G&A expenses” in the accompanying ConsolidatedStatements of Comprehensive Income. The deferred compensation plan has no impact on “Income fromcontinuing operations before income tax expense” or diluted earnings per share from continuing operations.
Interest Expense — Our primary financing arrangement is the 2018 credit facility. Interest expense was$5.0 million in 2020, compared to $5.8 million in 2019. Our average debt balance and weighted average interestrate was $152.3 million and 2.45%, respectively, in 2020, compared to $158.3 million and 3.09%, respectively,in 2019. Interest expense was $6.6 million in 2018 with an average debt balance and interest rate of$182.3 million and 3.08%, respectively. Our debt is further discussed in Note 9, Debt and FinancingArrangements, to the accompanying consolidated financial statements.
25

Gain on Sale of Operations, net — We sold a small book of business in the Benefit and Insurance practicegroup and two small accounting firms in the Financial Services practice group during 2020. We sold a smalloffice in the Financial Services practice group during 2019, and we sold a small office in the Financial Servicespractice group, along with two small books of business, both in the Benefits and Insurance practice group in2018.
Other Income (Expense), net — The majority of “Other income (expense), net” consists of net gains and lossesassociated with the value of the deferred compensation plan as discussed above, as well as net adjustments to thefair value of our contingent purchase price liability related to prior acquisitions. Other income of $16.5 million in2020 included a $15.4 million net gain related to the deferred compensation plan and a $0.6 million net decreaseadjustment to the fair value of our contingent purchase price liability. Other income of $17.7 million in 2019consisted of a net gain of $19.2 million related to the deferred compensation plan, partially offset by a$1.6 million net adjustment increase to the fair value of our contingent purchase price liability. Other expense of$7.1 million in 2018 consisted of a net loss of $4.9 million related to the deferred compensation plan, as well as a$2.6 million net adjustment increase to the fair value of our contingent purchase price liability.
Income Tax Expense
The following table presents our income tax expense for the years ended December 31, 2020, 2019 and 2018:
Year Ended December 31,
2020 2019 2018
(Dollars in thousands, except percentages)
Income tax expense . . . . . . . . . . . . . . . . . . . . . . . . . . . . . . . . . . . . . . $25,141 $21,840 $18,267Effective tax rate . . . . . . . . . . . . . . . . . . . . . . . . . . . . . . . . . . . . . . . . 24.3% 23.5% 22.9%
The increase in income tax expense from 2019 to 2020 was primarily driven by higher pre-tax income. Theincrease in the effective tax rate from 2019 to 2020 was primarily attributable to a reduction in the tax benefitrecognized in 2020 compared to 2019 related to stock-based compensation, which was partially offset by a largerreversal in 2020 compared to 2019 of estimated tax reserves due to the expiration of certain statutes of limitation.The increase in income tax expense from 2018 to 2019 was primarily driven by higher pre-tax income. Theincrease in the effective tax rate from 2018 to 2019 was primarily attributable to a larger reversal of estimated taxreserves due to the expiration of certain statutes of limitation in 2018 compared to 2019.
GAAP RECONCILIATIONIncome from Continuing Operations to Non-GAAP Financial Measure (1)
Year Ended December 31,
2020 2019 2018 2017 2016
(Dollars in thousands)
Income from continuing operations . . . . . . . . . . . . . . . . $ 78,347 $ 71,049 $ 61,573 $ 51,032 $40,607Interest expense . . . . . . . . . . . . . . . . . . . . . . . . . . . . . 4,983 5,765 6,645 6,675 6,593Income tax expense . . . . . . . . . . . . . . . . . . . . . . . . . . 25,141 21,840 18,267 23,288 26,399Gain on sale of operations, net . . . . . . . . . . . . . . . . . . 509 (417) (1,025) (45) (855)Depreciation . . . . . . . . . . . . . . . . . . . . . . . . . . . . . . . . 9,568 8,283 6,140 5,274 5,378Amortization . . . . . . . . . . . . . . . . . . . . . . . . . . . . . . . . 13,571 14,062 17,535 17,787 16,720
Adjusted EBITDA . . . . . . . . . . . . . . . . . . . . . . . . . . . . . $132,119 $120,582 $109,135 $104,011 $94,842
(1) We report our financial results in accordance with GAAP. This table reconciles Adjusted EBITDA, aNon-GAAP financial measure to the nearest GAAP financial measure, “Income from continuingoperations.” Adjusted EBITDA is not defined by GAAP, is not based on any comprehensive set of
26

accounting rules or principles, and should not be considered in isolation from, or regarded as an alternativeor replacement to, any measurement of performance or cash flow under GAAP. Adjusted EBITDA iscommonly used by us, our shareholders, and debt holders to evaluate, assess, and benchmark our operatingresults and to provide an additional measure with respect to our ability to meet future debt obligations.Because of these limitations, Adjusted EBITDA should be considered alongside our financial resultspresented in accordance with GAAP.
Operating Practice Groups
We deliver our integrated services through three practice groups: Financial Services, Benefits and InsuranceServices and National Practices. A description of these groups’ operating results and factors affecting theirbusinesses is provided below.
Financial ServicesYear Ended December 31,
2020 2019 $ Change % Change
(Dollars in thousands)
RevenueSame-unit . . . . . . . . . . . . . . . . . . . . . . . . . . . . . . . . $620,188 $615,537 $ 4,651 0.8%Acquired businesses . . . . . . . . . . . . . . . . . . . . . . . . 9,590 — 9,590Divested operation . . . . . . . . . . . . . . . . . . . . . . . . . — 1,030 (1,030)
Total revenue . . . . . . . . . . . . . . . . . . . . . . . . . . . 629,778 616,567 13,211 2.1%Operating expenses . . . . . . . . . . . . . . . . . . . . . . . . . . 525,209 515,240 9,969 1.9%
Gross margin . . . . . . . . . . . . . . . . . . . . . . . . . . . . . . . $104,569 $101,327 $ 3,242 3.2%
Gross margin percentage . . . . . . . . . . . . . . . . . . . . . . 16.6% 16.4%
2020 compared to 2019 — The Financial Services practice group revenue in 2020 grew by 2.1% to$629.8 million from $616.6 million in 2019, reflecting same-unit growth of $4.7 million, or 0.8%, driven bythose units that provide traditional accounting and tax-related services, which increased by $6.8 million, or 1.9%as compared to 2019. Traditional accounting and tax-related services growth was primarily attributable tofavorable pricing and moderate increase in services to large clients. Same-unit revenue also benefited from$4.3 million, or 2.9%, increase in government healthcare compliance business. The same-unit revenue growth intraditional accounting and tax-related services and government healthcare compliance business lines was offsetby approximately $6.4 million net decrease in project work and other service lines that are discretionary innature. The acquisition of businesses provided incremental revenue of $9.6 million. We provide a range ofservices to affiliated CPA firms under ASAs. Fees earned under the ASAs are recorded as revenue in theaccompanying Consolidated Statements of Comprehensive Income and were $159.4 million and $157.6 millionin 2020 and 2019, respectively.
27

Operating expenses increased by $10.0 million in 2020 as compared to 2019, primarily as a result of$20.9 million, or 5.0%, higher personnel costs, of which acquisitions contributed approximately $6.0 million.The increase in personnel costs was partially offset by approximately $11.0 million reduction in travel andentertainment and other discretionary spending primarily due to the impact of the COVID-19 pandemic.Operating expense as a percentage of revenue remained relatively flat at 83.4% in 2020 and 83.6% in 2019.
Year Ended December 31,
2019 2018 $ Change % Change
(Dollars in thousands)
RevenueSame-unit . . . . . . . . . . . . . . . . . . . . . . . . . . . . . . . . $611,539 $596,549 $14,990 2.5%Acquired businesses . . . . . . . . . . . . . . . . . . . . . . . . 5,028 — 5,028Divested operation . . . . . . . . . . . . . . . . . . . . . . . . . — 4,377 (4,377)
Total revenue . . . . . . . . . . . . . . . . . . . . . . . . . . . 616,567 600,926 15,641 2.6%Operating expenses . . . . . . . . . . . . . . . . . . . . . . . . . . 515,240 508,653 6,587 1.3%
Gross margin . . . . . . . . . . . . . . . . . . . . . . . . . . . . . . . $101,327 $ 92,273 $ 9,054 9.8%
Gross margin percentage . . . . . . . . . . . . . . . . . . . . . . 16.4% 15.4%
2019 compared to 2018 — The Financial Services practice group revenue in 2019 grew by 2.6% to$616.6 million from $600.9 million in 2018, reflecting same-unit growth of $15.0 million, or 2.5%, driven bythose units that provide traditional accounting and tax-related services, which increased by $15.1 million, or4.3%. Traditional accounting and tax-related services growth was attributable to favorable pricing and anincrease in billable hours. Same-unit revenue also benefited from moderate growth in government healthcarecompliance business and project work. The acquisition of businesses provided incremental revenue of$5.0 million. We provide a range of services to affiliated CPA firms under ASAs. Fees earned under the ASAsare recorded as revenue in the accompanying Consolidated Statements of Comprehensive Income and were$157.6 million and $154.0 million in 2019 and 2018, respectively.
Operating expenses increased by $6.6 million in 2019, but decreased to 83.6% of revenue from 84.6% of revenuefor the prior year, primarily due to leveraging personnel costs and other operating expenses with the increase inrevenue. Personnel costs increased by $6.9 million, or 1.7%, with acquisitions contributing approximately$3.1 million to personnel costs in 2019.
Benefits and Insurance Services
Year Ended December 31,
2020 2019 $ Change % Change
(Dollars in thousands)
RevenueSame-unit . . . . . . . . . . . . . . . . . . . . . . . . . . . . . . . . $286,678 $295,530 $ (8,852) (3.0)%Acquired businesses . . . . . . . . . . . . . . . . . . . . . . . . 11,080 — 11,080Divested operation . . . . . . . . . . . . . . . . . . . . . . . . . — 698 (698)
Total revenue . . . . . . . . . . . . . . . . . . . . . . . . . . . 297,758 296,228 1,530 0.5%Operating expenses . . . . . . . . . . . . . . . . . . . . . . . . . . 248,357 246,245 2,112 0.9%
Gross margin . . . . . . . . . . . . . . . . . . . . . . . . . . . . . . . $ 49,401 $ 49,983 $ (582) (1.2)%
Gross margin percentage . . . . . . . . . . . . . . . . . . . . . . 16.6% 16.9%
28

2020 compared to 2019 — The Benefits and Insurance Services practice group revenue in 2020 grew by 0.5% to$297.8 million from $296.2 million in 2019, primarily driven by $11.1 million of incremental revenue from theacquisition of businesses. Same-unit revenue decreased by $8.9 million, or 3.0% in 2020, primarily driven bydecreased revenue from payroll services, property and casualty insurance, and retirement plan servicesbusinesses that were impacted by COVID-19 related factors. Operating expenses increased by $2.1 million in2020 primarily due to $7.2 million, or 3.9%, in higher personnel costs as result of acquisitions, which contributedapproximately $6.2 million to the e increase in 2020 as well as an increase in the hiring of sales production staff.The increase in personnel costs was partially offset by approximately $4.4 million savings from decreased traveland other discretionary spending in 2020 as compared to 2019 primarily due to the impact of COVID-19pandemic.
Year Ended December 31,
2019 2018 $ Change % Change
(Dollars in thousands)
RevenueSame-unit . . . . . . . . . . . . . . . . . . . . . . . . . . . . . . . . $288,447 $288,243 $ 204 0.1%Acquired businesses . . . . . . . . . . . . . . . . . . . . . . . . 7,781 — 7,781Divested operation . . . . . . . . . . . . . . . . . . . . . . . . . — 194 (194)
Total revenue . . . . . . . . . . . . . . . . . . . . . . . . . . . 296,228 288,437 7,791 2.7%Operating expenses . . . . . . . . . . . . . . . . . . . . . . . . . . 246,245 239,646 6,599 2.8%
Gross margin . . . . . . . . . . . . . . . . . . . . . . . . . . . . . . . $ 49,983 $ 48,791 $1,192 2.4%
Gross margin percentage . . . . . . . . . . . . . . . . . . . . . . 16.9% 16.9%
2019 compared to 2018 — The Benefits and Insurance Services practice group revenue in 2019 grew by 2.7% to$296.2 million from $288.4 million in 2018, primarily driven by $7.8 million of incremental revenue from theacquisition of businesses. Same-unit revenue increased slightly by $0.2 million, or 0.1%, in 2019 driven bygrowth in property and casualty insurance and retirement plan services, offset by year over year declines innon-recurring project based revenue, which is transactional in nature. Operating expenses increased by$6.6 million in 2019 due to personnel costs, which increased by $5.1 million, or 2.8%, primarily due toacquisitions, as well as an increase in the hiring of sales production staff.
National Practices
Year Ended December 31,
2020 2019 2018
(Dollars in thousands)
RevenueSame-unit . . . . . . . . . . . . . . . . . . . . . . . . . . . . . . . . . . . . . . . . . . . . $36,361 $35,629 $32,640
Operating expenses . . . . . . . . . . . . . . . . . . . . . . . . . . . . . . . . . . . . . . 32,637 32,474 30,003
Gross margin . . . . . . . . . . . . . . . . . . . . . . . . . . . . . . . . . . . . . . . . . . . $ 3,724 $ 3,155 $ 2,637
Gross margin percentage . . . . . . . . . . . . . . . . . . . . . . . . . . . . . . . . . . 10.2% 8.9% 8.1%
Revenue growth in this practice group was primarily driven by our cost-plus contract with a single client, whichhas existed since 1999. The cost-plus contract is a five year contract with the most recent renewal throughDecember 31, 2023. Revenues from this single client accounted for more than 70% of the National Practicegroup’s revenue. Operating expenses have increased mainly due to an increase in salaries and benefits.
29

LIQUIDITY AND CAPITAL RESOURCES
The following table is derived from our Consolidated Statements of Cash Flows (in thousands):
Year Ended December 31,
2020 2019 2018
Net cash provided by operating activities . . . . . . . . . . . . . . . . . . $146,845 $ 98,185 $ 105,248Net cash used in investing activities . . . . . . . . . . . . . . . . . . . . . . (46,406) (27,685) (47,576)Net cash used in financing activities . . . . . . . . . . . . . . . . . . . . . . (76,609) (54,549) (109,380)
We generate strong cash flows from operations and have access to a $400.0 million credit facility, which enablesus to fund investments and operating projects that are designed to optimize shareholder return. Cash flows fromoperations and available capital resources allow us to make strategic acquisitions, repurchase shares of ourcommon stock when accretive to shareholders, meet working capital needs, and service our debt. Generally, wemaintain low levels of cash and apply any available cash to pay down our outstanding debt balance. Due to theseasonal nature of the Financial Services practice group’s accounting and tax services in the first four months ofthe fiscal year, we historically generate much of our cash flows during the last three quarters of the fiscal year.
Our working capital management primarily relates to trade accounts receivable, accounts payable, incentive-based compensation and other assets, which consists of other receivables and prepaid assets typically related toactivities in the normal course of our business operations. At any specific point in time, working capital is subjectto many variables, including seasonality and the timing of cash receipts and payments, most notably in the timingof insurance premiums to the carriers within our Benefits and Insurance practice group. We have restricted cashon deposit from clients in connection with the pass-through of insurance premiums to the carrier with the relatedliability for these funds recorded in “Accounts payable” in the accompanying Consolidated Balance Sheets.
Accounts receivable balances increase in response to the increase in revenue generated by the Financial Servicespractice group during the first four months of the year. A significant amount of this revenue is billed andcollected in subsequent quarters. Days sales outstanding (“DSO”) from continuing operations represent accountsreceivable and unbilled revenue (net of realization adjustments) at the end of the period, divided by trailingtwelve months daily revenue. DSO was 72 days as of December 31, 2020 and 75 days as of December 31, 2019.We provide DSO data because such data is commonly used as a performance measure by analysts and investorsand as a measure of our ability to collect on receivables in a timely manner.
Cash Provided by Operating Activities
2020 compared to 2019 — Operating activities generated cash of $146.8 million during 2020 and consisted ofnet income of $78.3 million, adjusted for certain non-cash items, such as depreciation and amortization expenseof $23.1 million, share-based compensation expense of $8.9 million, bad debt expense of $4.4 million, as well as$35.0 million of cash generated from working capital management. The $48.7 million increase in cash providedby operating activities in 2020 as compared to 2019 was primarily due to a net increase of $46.4 million in cashgenerated from working capital of which approximately $16.3 million related to the deferral of payroll taxdeposit and payment, as well as an increase of $7.6 million in net income, offset by $5.3 million decrease innon-cash items.
2019 compared to 2018 — Cash flow from operating activities generated cash of $98.2 million during 2019 andconsisted of net income of $70.7 million, adjusted for certain non-cash items, such as depreciation andamortization expense of $22.3 million, deferred income taxes of $9.7 million, and share-based compensationexpense of $7.3 million, as well as a working capital use of cash of $11.4 million. The $7.1 million decrease incash provided by operating activities in 2019 compared to 2018 was primarily due to a net decrease in cash fromworking capital of $16.5 million, which was offset by the increase in net income of $9.1 million.
30

Investing Activities
The majority of our investing activities relate to acquisitions, capital expenditures and net activity related tofunds held for clients. Refer to Note 1, Basis of Presentation and Significant Accounting Policies, and Note 18,Business Combinations, to the accompanying consolidated financial statements for further discussion on ouracquisitions and a further description of funds held for clients and client fund obligations.
2020 — Net cash used in investing activities in 2020 consisted primarily of $71.4 million related to businessacquisitions and $11.6 million in capital expenditures, offset by $34.0 million net proceeds from sales andmaturities of client funds.
2019 — Net cash used in investing activities in 2019 consisted primarily of $11.7 million related to businessacquisitions, as well as $13.9 million in capital expenditures. Net activity related to funds held for clients alsocontributed $3.3 million to cash used in investing activities.
2018 — Net cash used in investing activities in 2018 consisted primarily of $29.1 million related to the businessacquisitions, as well as $14.6 million of capital expenditures. Net activity related to funds held for clients of$6.2 million also contributed to cash used in investing activities.
Financing Activities
The majority of our financing activities relate to our 2018 credit facility, share repurchases, net client fundobligation activity, as well as contingent consideration payments for prior acquisitions. Refer to Note 9, Debt andFinancing Arrangements, and Note 13, Common Stock, to the accompanying consolidated financial statementsfor further discussion on our 2018 credit facility and Share Repurchase Program.
2020 — Net cash used in financing activities in 2020 consisted primarily of $58.5 million of share repurchases, anet decrease of $13.7 million in client fund obligations, and $12.9 million of contingent consideration paymentsfor prior acquisitions, partially offset by $6.5 million in proceeds from the exercise of stock options and$2.5 million net proceeds from borrowings under our 2018 credit facility.
2019 — Net cash used in financing activities in 2019 consisted primarily of net payments on our 2018 creditfacility of $30.0 million, $27.2 million of share repurchases, and $17.5 million of contingent considerationpayments for prior acquisitions, offset partially by a net increase of $10.1 million in client fund obligations and$10.6 million in proceeds from the exercise of stock options.
2018 — Net cash used in financing activities in 2018 consisted primarily of net payments on our 2018 creditfacility of $43.0 million, a net decrease of $41.5 million in client fund obligations, $17.5 million of sharerepurchases, and $11.8 million of contingent consideration payments for prior acquisitions, partially offset by$6.3 million in proceeds from the exercise of stock options.
CAPITAL RESOURCES
The following table presents our capital structure (in thousands):
December 31,
2020 2019
Bank debt . . . . . . . . . . . . . . . . . . . . . . . . . . . . . . . . . . . . . . . . . . . . . . . . . . . . . . $108,000 $105,500Stockholders’ equity . . . . . . . . . . . . . . . . . . . . . . . . . . . . . . . . . . . . . . . . . . . . . 702,620 659,238
Total capital . . . . . . . . . . . . . . . . . . . . . . . . . . . . . . . . . . . . . . . . . . . . . . . . . . . . $810,620 $764,738
31

Credit Facility — Our primary financing arrangement is the $400.0 million unsecured credit facility, by andamong CBIZ Operations, Inc., CBIZ, Inc. and Bank of America, N.A., as administrative agent and bank, andother participating banks, which provides us with the capital necessary to meet our working capital needs as wellas the flexibility to continue with our strategic initiatives, including business acquisitions and share repurchasesand matures in 2023. At December 31, 2020, we had $108.0 million outstanding under the credit facility, as wellas letters of credit and performance guarantees totaling $4.0 million. Available funds under the credit facility,based on the terms of the commitment, were approximately $286.4 million at December 31, 2020. The weightedaverage interest rate under the credit facility was 2.45% in 2020 and 3.09% in 2019. The credit facility allows forthe allocation of funds for future strategic initiatives, including acquisitions and the repurchase of our commonstock, subject to the terms and conditions of the credit facility.
Debt Covenant Compliance — We are required to meet certain financial covenants with respect to (i) totalleverage ratio and (ii) a minimum fixed charge coverage ratio. We were in compliance with our covenants as ofDecember 31, 2020. Our ability to service our debt and to fund future strategic initiatives will depend upon ourability to generate cash in the future. For further discussion regarding our credit facility, refer to Note 9, Debt andFinancing Arrangements, to the accompanying consolidated financial statements.
Use of Capital — Our first priority for the use of capital is to make strategic acquisitions. We completed sevenbusiness acquisitions and four client list acquisitions in 2020. Refer to Note 18, Business Combinations, to theaccompanying consolidated financial statements for further discussion on acquisitions. We also have thefinancing flexibility and the capacity to actively repurchase shares of our common stock. We believe thatrepurchasing shares of our common stock is a prudent use of our financial resources, and that investing in ourstock is an attractive use of capital and an efficient means to provide value to our shareholders. We repurchased2.4 million shares of our common stock at a total cost of approximately $59.6 million in 2020, 1.3 million sharesat a total cost of approximately $27.2 million in 2019 and 0.9 million shares at a total cost of approximately$17.5 million in 2018. Refer to Note 13, Common Stock, to the accompanying consolidated financial statementsfor further discussion on the Share Repurchase Program.
Cash Requirements for 2021 — Cash requirements for 2021 will include acquisitions, interest payments ondebt, seasonal working capital requirements, contingent earnout payments for previous acquisitions, sharerepurchases and capital expenditures. We believe that cash provided by operations, as well as available fundsunder our credit facility will be sufficient to meet cash requirements for the next 12 months.
OBLIGATIONS AND COMMITMENTS
Our aggregate amount of future obligations for the next five years and thereafter is set forth below (inthousands):
Total 2021 2022-2023 2024-20252026 and
Thereafter
Credit facility (1) . . . . . . . . . . . . . . . . . . . . . . . . . . . . . . . $113,954 $ 2,646 $111,308 $ — $ —Operating leases (2) . . . . . . . . . . . . . . . . . . . . . . . . . . . . . 193,828 36,270 58,063 47,063 52,432Contingent purchase price liabilities (3) . . . . . . . . . . . . . 57,381 14,027 27,805 15,549 —Other liabilities (4) . . . . . . . . . . . . . . . . . . . . . . . . . . . . . . 7,681 5,574 358 1,153 596
Total . . . . . . . . . . . . . . . . . . . . . . . . . . . . . . . . . . . . . $372,844 $58,517 $197,534 $63,765 $53,028
(1) Our credit facility matures on April 3, 2023. Interest on the credit facility is not determinable due to the revolving nature of the creditfacility and the variability of the related interest rate. Dollar amounts are estimates based on applying the 2.45% weighted average rate ofthe credit facility at December 31, 2020 to the $108.0 million outstanding balance of the credit facility at December 31, 2020.
(2) Operating leases include the minimum rent commitments under non-cancelable operating leases. Amount excludes cash expected to bereceived under subleases and impact of future renewals.
32

(3) Represents the contingent purchase price liability that is expected to be paid over the next five years resulting from business acquisitions.For the years ended December 31, 2021, 2022, 2023, 2024, and 2025, the cash portions of the contingent purchase price liability are$12.2 million, $15.4 million, $9.0 million, $13.0 million, and $0.8 million, respectively, with the remaining balance representing thestock portions.
(4) Other liabilities include letters of credit and license bonds, contingencies related to the purchase of client lists and federal and stateincome taxes. For further discussion regarding commitments and contingencies, refer to Note 11, Commitments and Contingencies, tothe accompanying consolidated financial statements. The liability for unrecognized tax benefits of $1.5 million under FASB ASC Topic740, Income Taxes, is excluded, since we are unable to reasonably estimate the timing of cash settlements with the respective taxauthorities.
Off-Balance Sheet Arrangements — We maintain ASAs with independent CPA firms (as described more fullyunder “Business — Financial Services” and in Note 1, Basis of Presentation and Significant Accounting Policies,to the accompanying consolidated financial statements), which qualify as variable interest entities. Theaccompanying consolidated financial statements do not reflect the operations or accounts of variable interestentities as the impact is not material to the consolidated financial condition, results of operations, or cash flows ofCBIZ.
We provide letters of credit for insurance needs as well as to landlords (lessors) of our leased premises in lieu ofcash security deposits. Letters of credit totaled $1.7 million and $1.3 million at December 31, 2020 and 2019. Inaddition, we provide license bonds to various state agencies to meet certain licensing requirements. The amountof license bonds outstanding was $2.2 million and $2.3 million at December 31, 2020 and 2019, respectively.
We have various agreements under which we may be obligated to indemnify the other party with respect tocertain matters. Generally, these indemnification clauses are included in contracts arising in the normal course ofbusiness under which we customarily agree to hold the other party harmless against losses arising from a breachof representations, warranties, covenants or agreements, related to matters such as title to assets sold and certaintax matters. Payment by us under such indemnification clauses are generally conditioned upon the other partymaking a claim. Such claims are typically subject to challenge by us and to dispute resolution proceduresspecified in the particular contract. Further, our obligations under these agreements may be limited in terms oftime and/or amount and, in some instances, we may have recourse against third parties for certain paymentsmade by us. It is not possible to predict the maximum potential amount of future payments under theseindemnification agreements due to the conditional nature of our obligations and the unique facts of eachparticular agreement. Historically, we have not made any payments under these agreements that have beenmaterial individually or in the aggregate. As of December 31, 2020, we were not aware of any obligations arisingunder indemnification agreements that would require material payments.
Interest Rate Risk Management — We do not purchase or hold any derivative instruments for trading orspeculative purposes. We utilize interest rate swaps to manage interest rate risk exposure associated with ourfloating-rate debt under the credit facility. Under these interest rate swap contracts, we receive cash flows fromcounterparties at variable rates based on the London Interbank Offered Rate (“LIBOR”) and pay thecounterparties a fixed rate. To mitigate counterparty credit risk, we only enter into contracts with selected majorfinancial institutions with investment grade ratings and continually assess their creditworthiness. There are nocredit risk-related contingent features in our interest rate swaps nor do the swaps contain provisions under whichwe would be required to post collateral.
As of December 31, 2020, the notional value of all of our interest rate swaps was $95.0 million, with maturitydates ranging from February, 2021 to April, 2025. For further details on our interest rate swaps, refer to Note 6,Financial Instruments, to the accompanying consolidated financial statements.
In connection with payroll services provided to clients, we collect funds from our clients’ accounts in advance ofpaying these client obligations. These funds held for clients are segregated and invested in accordance with ourinvestment policy, which requires that all investments carry an investment grade rating at the time of initialinvestment. The interest income on these investments mitigates the interest rate risk for the borrowing costs of
33

our credit facility, as the rates on both the investments and the outstanding borrowings against the credit facilityare based on market conditions. Refer to Note 6, Financial Instruments, and Note 9, Debt and FinancingArrangements, to the accompanying consolidated financial statements for further discussion regardinginvestments and our debt and financing arrangements.
CRITICAL ACCOUNTING POLICIES AND ESTIMATES
The preparation of our consolidated financial statements in accordance with GAAP is based on the selection andapplication of accounting policies that require us to make significant estimates and assumptions that in certaincircumstances affect amounts reported in the accompanying consolidated financial statements. In preparing thesefinancial statements, we have made our best estimates and judgments of certain amounts included in theconsolidated financial statements, giving due consideration to materiality. We consider the accounting policiesdiscussed below to be critical to the understanding of our consolidated financial statements. Actual results coulddiffer from our estimates and assumptions, and any such difference could be material to our consolidatedfinancial statements. Significant accounting policies, including Revenue Recognition, are described more fully inNote 1, Basis of Presentation and Significant Accounting Policies, to the accompanying consolidated financialstatements.
Accounts Receivable and Notes Receivable — We determine the net amount expected to be collected on ouraccounts receivable, both billed and unbilled, and notes receivable, based on a combination of factors, includingbut not limited to our historical incurred loss experience, credit-worthiness of our clients, the age of accountsreceivable balance, current economic conditions that may affect a client’s ability to pay, and reasonable andsupportable forecasts. Significant management judgments and estimates must be made and used in connectionwith establishing the allowance for doubtful accounts for each accounting period. Material differences may resultif facts and circumstances change in relation to the original estimation.
Business Combinations — We recognize and measure identifiable assets acquired and liabilities assumed as ofthe acquisition date at fair value. Fair value measurements require extensive use of estimates and assumptions,including estimates of future cash flows to be generated by the acquired assets. In addition, we recognize andmeasure contingent consideration at fair value as of the acquisition date using a probability-weighted discountedcash flow model. The fair value of contingent consideration obligations that are classified as liabilities arereassessed each reporting period. Any change in the fair value estimate is recorded in the earnings of that period.
Goodwill and Other Intangible Assets — Goodwill represents the difference between the purchase price of theacquired business and the related fair value of the net assets acquired. A significant portion of our assets in theaccompanying Consolidated Balance Sheets is goodwill. At December 31, 2020, the carrying value of goodwilltotaled $683.1 million, compared to total assets of $1.5 billion and total shareholders’ equity of $702.6 million.Intangible assets consist of identifiable intangibles other than goodwill. Identifiable intangible assets other thangoodwill include client lists and non-compete agreements, which require significant judgments in determiningthe fair value. We carry client lists and non-compete agreements at cost, less accumulated amortization, in theaccompanying Consolidated Balance Sheets.
Goodwill is not amortized, but rather is tested for impairment annually during the fourth quarter. In addition toour annual goodwill test, on a periodic basis, we are required to consider whether it is more likely than not(defined as a likelihood of more than 50%) that the fair value has fallen below its carrying value, thus requiringus to perform an interim goodwill impairment test. Intangible assets with definite lives, such as client lists andnon-compete agreements, are amortized using the straight-line method over their estimated useful lives(generally ranging from two to fifteen years). We review these assets for impairment whenever events or changesin circumstances indicate an asset’s carrying value may not be recoverable. Recoverability is assessed based on acomparison of the undiscounted cash flows to the recorded value of the asset. If impairment is indicated, the assetis written down to its estimated fair value based on a discounted cash flow analysis or market comparablemethod.
34

The goodwill impairment test is performed at a reporting unit level. A reporting unit is an operating segment of abusiness or one level below an operating segment. At December 31, 2020, we had five reporting units. We mayuse either a qualitative or quantitative approach when testing a reporting unit’s goodwill for impairment. Underthe qualitative assessment, we are not required to calculate the fair value of a reporting unit unless we determinethat it is more likely than not that its fair value is less than its carrying amount. If under the quantitativeassessment the fair value of a reporting unit is less than its carrying amount, then the amount of the impairmentloss, if any, must be measured. Any such impairment charge would reduce earnings and could be material.
After considering changes to assumptions used in our most recent quantitative testing for each reporting unit,including the capital market environment, economic and market conditions, industry competition and trends, ourweighted average cost of capital, changes in management and key personnel, the price of our common stock,changes in our results of operations, the magnitude of the excess of fair value over the carrying amount of eachreporting unit as determined in our most recent quantitative testing, and other factors, we concluded that it wasmore likely than not that the fair values of each of our reporting units were more than their respective carryingvalues and, therefore, did not perform a quantitative impairment analysis. For further information regarding ourgoodwill balances, refer to Note 5, Goodwill and Other Intangible Assets, net, to the accompanying consolidatedfinancial statements.
Loss Contingencies — Loss contingencies, including litigation claims, are recorded as liabilities when it isprobable that a liability has been incurred and the amount of the loss is reasonably estimable. Contingentliabilities are often resolved over long time periods. Estimating probable losses requires analysis that oftendepends on judgment about potential actions by third parties. Refer to Note 11, Commitments and Contingencies,to the accompanying consolidated financial statements for further information.
Other Significant Policies — Other significant accounting policies, not involving the same level of managementjudgment and uncertainty as those discussed above, are also critical in understanding the consolidated financialstatements. Those policies are described in Note 1, Basis of Presentation and Significant Accounting Policies, tothe accompanying consolidated financial statements.
Recent Accounting Pronouncements — Refer to Note 1, Basis of Presentation and Significant AccountingPolicies, to the accompanying consolidated financial statements for a description of recent accountingpronouncements, which is incorporated herein by reference.
ITEM 7A. QUANTITATIVE AND QUALITATIVE DISCLOSURES ABOUT MARKET RISK.
We do not purchase or hold any derivative instruments for trading or speculative purposes. We utilize interestrate swaps to manage interest rate risk exposure associated with our floating-rate debt under the credit facility.Under these interest rate swap contracts, we receive cash flows from counterparties at variable rates based onLIBOR and pay the counterparties a fixed rate. To mitigate counterparty credit risk, we only enter into contractswith selected major financial institutions with investment grade ratings and continually assess theircreditworthiness. There are no credit risk-related contingent features in our interest rate swaps nor do the swapscontain provisions under which we would be required to post collateral.
The notional value, fixed rate of interest and expiration date of each interest rate swap is (i)$10 million – 1.120%— February, 2021, (ii) $20 million – 1.770% — May, 2022, (iii) $15 million – 2.640% — June, 2023 and (iv)$50 million – 0.885% — April, 2025. Refer to Note 6, Financial Instruments, to the accompanying consolidatedfinancial statements for further discussion regarding interest rate swaps.
Interest rate risk results when the maturity or repricing intervals of interest-earning assets and interest-bearingliabilities are different. A change in the Federal Funds Rate, or the reference rate set by Bank of America, N.A.,would affect the rate at which we could borrow funds under our credit facility. Our balance outstanding under thecredit facility at December 31, 2020 was $108.0 million, of which $13.0 million is subject to rate risk. If marketrates were to increase or decrease 100 basis points from the levels at December 31, 2020, interest expense wouldincrease or decrease approximately $0.1 million annually.
35

In connection with our payroll business, funds held for clients are segregated and invested in short-terminvestments, such as corporate and municipal bonds. In accordance with our investment policy, all investmentscarry an investment grade rating at the time of the initial investment. At each respective balance sheet date, theseinvestments are adjusted to fair value with fair value adjustments being recorded to other comprehensive incomeor loss for the respective period. Refer to Notes 6, Financial Instruments, and Note 7, Fair Value Measurements,to the accompanying consolidated financial statements for further discussion regarding these investments and therelated fair value assessments.
ITEM 8. FINANCIAL STATEMENTS AND SUPPLEMENTARY DATA.
The Financial Statements, together with the notes thereto and the report of KPMG LLP dated February 26, 2021thereon, and the Supplementary Data required hereunder, are included in this Annual Report as set forth in Item15(a) hereof and are incorporated herein by reference.
ITEM 9. CHANGES IN AND DISAGREEMENTS WITH ACCOUNTANTS ON ACCOUNTING ANDFINANCIAL DISCLOSURE.
None.
ITEM 9A. CONTROLS AND PROCEDURES.
Evaluation of Disclosure Controls and Procedures — Management has evaluated the effectiveness of ourdisclosure controls and procedures (“Disclosure Controls”) as of the end of the period covered by this report.This evaluation (“Controls Evaluation”) was done with the participation of our Chief Executive Officer (“CEO”)and Chief Financial Officer (“CFO”). Disclosure Controls are controls and other procedures that are designed toensure that information required to be disclosed by us in the reports that we file or submit under the ExchangeAct is recorded, processed, summarized and reported within the time periods specified in the SEC’s rules andforms. Disclosure Controls include, without limitation, controls and procedures designed to ensure thatinformation required to be disclosed by us in the reports that we file under the Exchange Act is accumulated andcommunicated to management, including the CEO and CFO, as appropriate to allow timely decisions regardingrequired disclosure.
Limitations on the Effectiveness of Controls — Management, including the Company’s CEO and CFO, doesnot expect that its Disclosure Controls or its internal control over financial reporting (“Internal Controls”) willprevent all errors and all fraud. Although our Disclosure Controls are designed to provide reasonable assuranceof achieving their objective, a control system, no matter how well conceived and operated, can provide onlyreasonable, but not absolute, assurance that the objectives of a control system are met. Further, any controlsystem reflects limitations on resources, and the benefits of a control system must be considered relative to itscosts. Because of the inherent limitations in all control systems, no evaluation of controls can provide absoluteassurance that all control issues and instances of fraud, if any, within the Company have been detected. Theseinherent limitations include the realities that judgments in decision-making can be faulty and that breakdownscan occur because of simple error or mistake. Additionally, controls can be circumvented by the individual actsof some persons, by collusion of two or more people, or by management override of a control. A design of acontrol system is also based upon certain assumptions about the likelihood of future events, and there can be noassurance that any design will succeed in achieving its stated goals under all potential future conditions; overtime, controls may become inadequate because of changes in conditions, or the degree of compliance with thepolicies or procedures may deteriorate. Because of the inherent limitations in a cost-effective control system,misstatements due to error or fraud may occur and may not be detected.
36

Conclusions — Based upon the Controls Evaluation, our CEO and CFO have concluded that as of the end of theperiod covered by this report, our Disclosure Controls are effective at the reasonable assurance level describedabove. There were no changes in our Internal Controls that occurred during the quarter ended December 31, 2020that have materially affected, or are reasonably likely to materially affect, our Internal Controls.
Management’s Report on Internal Control Over Financial Reporting — Management is responsible forestablishing and maintaining adequate internal control over financial reporting, as such term is defined in Rule13a-15(f) and 15d-15(f) under the Exchange Act. Under the supervision of management, including our CEO andCFO, we conducted an evaluation of our internal control over financial reporting based on the frameworkprovided in Internal Control — Integrated Framework (2013) issued by the Committee of SponsoringOrganizations of the Treadway Commission. Based on this evaluation, management has concluded that ourinternal control over financial reporting was effective as of December 31, 2020.
Our independent auditor, KPMG LLP, an independent registered public accounting firm, has issued an auditreport on the effectiveness of our internal control over financial reporting which appears in Item 8 of this AnnualReport.
ITEM 9B. OTHER INFORMATION.
None.
37

PART III
ITEM 10. DIRECTORS, EXECUTIVE OFFICERS AND CORPORATE GOVERNANCE.
Information with respect to this item not included below is incorporated by reference from our Definitive ProxyStatement for the 2021 Annual Stockholders’ Meeting to be filed with the SEC no later than 120 days after theend of CBIZ’s fiscal year.
We have adopted a Code of Professional Conduct and Ethics Guide that applies to our principal executiveofficer, principal financial officer, principal accounting officer or controller, or persons performing similarfunctions. Our Code of Professional Conduct and Ethics Guide is available on the investor information page ofour website, located at https://www.cbiz.com, and in print to any shareholder who requests them. Any waiver oramendment to the code will be posted on our website.
Information about our Executive Officers, Directors and Key Employees — The following table sets forthcertain information regarding the directors, executive officers and certain key employees of CBIZ. Eachexecutive officer and director of CBIZ named in the following table has been elected to serve until his/hersuccessor is duly appointed or elected or until his/her earlier removal or resignation from office. No arrangementor understanding exists between any executive officer of CBIZ and any other person pursuant to which he or shewas selected as an officer.
Name Age Position(s)
Executive Officers and Directors:Steven L. Gerard (1) . . . . . . . . . . . . . 75 ChairmanJerome P. Grisko, Jr. (1) . . . . . . . . . . 59 President & Chief Executive Officer, DirectorRick L. Burdick (1)(3)(4) . . . . . . . . . 69 Lead Director and Vice ChairmanMichael H. DeGroote (3) . . . . . . . . . 60 DirectorJoseph S. DiMartino (3)(4) . . . . . . . . 77 DirectorGina D. France (2)(3) . . . . . . . . . . . . 62 DirectorSherrill W. Hudson (2)(4) . . . . . . . . . 77 DirectorTodd J. Slotkin (2)(4) . . . . . . . . . . . . 67 DirectorA. Haag Sherman (2) . . . . . . . . . . . . 55 DirectorBenaree Pratt Wiley (3)(4) . . . . . . . . 74 DirectorWare H. Grove . . . . . . . . . . . . . . . . . 70 Senior Vice President and Chief Financial OfficerChris Spurio . . . . . . . . . . . . . . . . . . . 55 President, Financial ServicesMichael P. Kouzelos . . . . . . . . . . . . . 52 President, Benefits and Insurance ServicesOther Key Employees:Richard E. Mills . . . . . . . . . . . . . . . . 65 Chief Operating Officer, Financial ServicesMichael W. Gleespen . . . . . . . . . . . . 62 Secretary and General CounselJohn A. Fleischer . . . . . . . . . . . . . . . 59 Senior Vice President and Chief Information OfficerMark M. Waxman . . . . . . . . . . . . . . . 62 Senior Vice President and Chief Marketing OfficerBruce J. Kowalski . . . . . . . . . . . . . . . 60 Vice President, TaxCynthia L. Sobe . . . . . . . . . . . . . . . . 53 TreasurerPhilip P. Noftsinger . . . . . . . . . . . . . . 50 Vice President of Finance and Corporate Controller
(1) Member of Executive Management Committee
(2) Member of Audit Committee
(3) Member of Nominating & Governance Committee
(4) Member of Compensation & Human Capital Committee
38

Steven L. Gerard was elected by the Board to serve as its Chairman in October 2002. He was appointed ChiefExecutive Officer and Director in October 2000, and served as CEO until March 2016. Mr. Gerard continues toserve as non-executive Chairman. Mr. Gerard was Chairman and Chief Executive Officer of Great Point Capital,Inc., a provider of operational and advisory services from 1997 to October 2000. From 1991 to 1997, he wasChairman and Chief Executive Officer of Triangle Wire & Cable, Inc. and its successor Ocean View Capital, Inc.Mr. Gerard’s prior experience includes 16 years with Citibank, N.A. in various senior corporate finance andbanking positions. Further, Mr. Gerard served seven years with the American Stock Exchange, where he lastserved as Vice President of the Securities Division. Mr. Gerard also serves on the Boards of Directors of LennarCorporation and AutoNation, Inc. He previously served on the Board of the Las Vegas Sands Corporation andwas a member of the Board of Directors of Joy Global, Inc. until its acquisition by Komatsu Limited in 2017.
Jerome P. Grisko, Jr. was appointed to the CBIZ Board in November, 2015. Mr. Grisko was appointed ChiefExecutive Officer in March 2016, and has served as President since February 2000. He was also Chief OperatingOfficer from February 2000 until his appointment as Chief Executive Officer. Mr. Grisko joined CBIZ as VicePresident, Mergers & Acquisitions in September 1998 and was promoted to Senior Vice President, Mergers &Acquisitions and Legal Affairs in December of 1998. Prior to joining CBIZ, Mr. Grisko was associated with thelaw firm of Baker & Hostetler LLP, where he practiced from September 1987 until September 1998, serving as apartner of such firm from January 1995 to September 1998. While at Baker & Hostetler, Mr. Grisko concentratedhis practice in the area of mergers and acquisitions and general corporate law.
Rick L. Burdick has served as a Director of CBIZ since October 1997, when he was elected as an independentdirector. On May 17, 2007, Mr. Burdick was elected by the Board to be its Lead Director, a non-officer position.Previously, in October 2002, he was elected by the Board as Vice Chairman, a non-officer position. Mr. Burdickis a Partner Emeritus at the law firm of Akin Gump Strauss Hauer & Feld LLP, and was a Partner in the firmfrom 1988 until 2019. Mr. Burdick serves as Lead Director on the Board of Directors of AutoNation, Inc.
Michael H. DeGroote, son of CBIZ founder Michael G. DeGroote, was appointed a Director of CBIZ inNovember 2006. Mr. DeGroote currently serves as President of Westbury International, a full-service real estatedevelopment company, specializing in commercial/industrial land, residential development and propertymanagement. Prior to joining Westbury, Mr. DeGroote was Vice President of MGD Holdings and previouslyheld a management position with Cooper Corporation, and previously served on the Board of Directors ofProgressive Waste Solutions Ltd. He served on the Board of Governors of McMaster University in Hamilton,Ontario.
Joseph S. DiMartino has served as a Director of CBIZ since November 1997, when he was elected as anindependent director. Mr. DiMartino has been Chairman of the Boards of the funds in the BNY MellonCorporation (formerly The Dreyfus Corporation) since January 1995. Mr. DiMartino served as President, ChiefOperating Officer and Director of The Dreyfus Corporation from October 1982 until December 1994 and alsoserved as a director of Mellon Bank Corporation.
Gina D. France was appointed to the CBIZ Board in February, 2015. Ms. France founded France StrategicPartners, LLC, a strategy and transaction advisory firm, and has served as its President and Chief ExecutiveOfficer since 2003. Ms. France has over 40 years of experience in strategy, investment banking and corporatefinance. Prior to founding France Strategic Partners, Ms. France was a Managing Director with Ernst & Young,LLP and directed the Firm’s Center for Strategic Transactions. Prior to her work with Ernst & Young,Ms. France was a Senior Vice President with Lehman Brothers, Inc. Ms. France serves on the boards ofHuntington Bancshares, Inc., Cedar Fair, L.P. and on the boards of the BNY Mellon Family of Funds. Ms. Francehas previously served on the boards of FirstMerit Corporation, Dawn Food Products, Inc. and Mack Industries.
Sherrill W. Hudson was appointed to the CBIZ Board in February, 2015. Until July 2016, upon the sale of theCompany, Mr. Hudson was Chairman of the Board of TECO Energy, Inc. and was a member of its board sinceJanuary 2003. He was executive chairman from August 2010 to December 2012, after having served as
39

Chairman and Chief Executive Officer since July 2004. Mr. Hudson also serves on the boards of LennarCorporation and United Insurance Holdings Corporation. He served on the Publix Super Markets, Inc. boardfrom January 2003 until April 2015. Mr. Hudson is also Chairman Emeritus of the Florida Chapter of theNational Association of Corporate Directors. Mr. Hudson retired from Deloitte & Touche, LLP in August 2002,after 37 years of service.
Todd J. Slotkin has served as a Director of CBIZ since September 2003, when he was elected as an independentdirector. Mr. Slotkin is President & COO of KMP Music LLC, a music publishing firm. He is also currently aSenior Advisor at Alvarez & Marsal, and between 2014 and 2020 he served as the Global Business Head ofAlvarez & Marsal’s Asset Management Services. Mr. Slotkin is also an independent director of the ApolloClosed End Fund Complex (Apollo Floating Rate Fund, Apollo Tactical Income Fund). In 2011, Mr. Slotkin wasappointed the Managing Partner of Newton Pointe LLC, an advisory firm, a position he also held during theperiod 2007-2008. Mr. Slotkin served on the Board of Martha Stewart Living Omnimedia from 2008 to 2012,and was head of its Audit Committee and Special Committee. Between 2008 and 2010, Mr. Slotkin was a SeniorManaging Director of Irving Place Capital. From 2006 to 2007 Mr. Slotkin served as a Managing Director ofNatixis Capital Markets. From 1992 to 2006, Mr. Slotkin served as a SVP (1992-1998) and EVP and ChiefFinancial Officer (1998-2006) of MacAndrews & Forbes Holdings Inc. Additionally, he was the Executive VicePresident and Chief Financial Officer of publicly owned M&F Worldwide (1998-2006). Prior to 1992,Mr. Slotkin spent 17 years with Citigroup, ultimately serving as Senior Managing Director and Senior CreditOfficer. He was the Global Head of Citigroup’s Leveraged Capital Group. Mr. Slotkin is a co-founder of theFood Allergy Research & Education, Inc., formerly known as the Food Allergy Initiative.
A. Haag Sherman has served as a Director of CBIZ since August 2020, when he was elected as an independentdirector. Mr. Sherman has served as the Chief Executive Officer and a director of Tectonic Financial, Inc. (andits predecessor), a banking and financial holding company, since February 2015. Prior thereto, Mr. Shermanco-founded Salient Partners, LP, a Huston-based investment firm, in 2002 and served in various executivepositions, including Chief Executive Officer and Chief Investment Officer, through October 2011. In addition, hepreviously served as an executive officer and partner of The Redstone Companies from 1998 to 2002 where he,among other things, managed a private equity portfolio. Mr. Sherman has served as a director of HilltopHoldings, Inc. since its acquisition of PlainsCapital Corporation in November 2012. He previously served as adirector of PlainsCapital from September 2009 to November 2012. He previously served as a member of theboard of directors of Salient MLP & Energy Infrastructure Fund, Blue Dolphin Energy Company, Miller EnergyResources, Inc. and ZaZa Energy Corp. Mr. Sherman has served as an adjunct professor of law at The Universityof Texas School of Law. Mr. Sherman previously practiced corporate law at Akin Gump Strauss Hauer & FeldLLP from 1992 to 1996 and was an auditor at Price Waterhouse, a public accounting firm, from 1988 to 1989.Mr. Sherman is an attorney and certified public accountant.
Benaree Pratt Wiley has served as a Director of CBIZ since May 2008, when she was elected as an independentdirector. Ms. Wiley is a Principal of The Wiley Group, a firm specializing in personnel strategy, talentmanagement, and leadership development primarily for global insurance and consulting firms. Ms. Wiley servedas the President and Chief Executive Officer of The Partnership, Inc., a talent management organization formulticultural professionals in the greater Boston region for fifteen years before retiring in 2005. Ms. Wiley iscurrently a director on the boards of the BNY Mellon Family of Funds and Blue Cross and Blue Shield ofMassachusetts. Her civic activities include serving on the boards of the Efficacy Institute, Howard UniversityDress for Success Boston, Partners Continuing Care and Spaulding Hospital.
Ware H. Grove has served as Senior Vice President and Chief Financial Officer of CBIZ since December 2000.Before joining CBIZ, Mr. Grove served as Senior Vice President and Chief Financial Officer of BridgestreetAccommodations, Inc., which he joined in early 2000 to restructure financing, develop strategic operatingalternatives, and assist with merger negotiations. Prior to joining Bridgestreet, Mr. Grove served for three years
40
as Vice President and Chief Financial Officer of LESCO, Inc. Since beginning his career in corporate finance in1972, Mr. Grove has held various financial positions with large companies representing a variety of industries,including Revco D.S., Inc., Computerland/Vanstar, Manville Corporation, The Upjohn Company, and First ofAmerica Bank. Mr. Grove served on the Board of Directors for Applica, Inc. (NYSE: APN) from September2004 through January 2007, at which time the company was sold to a private equity firm.
Chris Spurio was appointed Senior Vice President of CBIZ and President of CBIZ’s Financial Services practicegroup, effective January 1, 2014. Mr. Spurio joined CBIZ in January 1998 and served as Corporate Controlleruntil July 1999. He then served as Vice President of Finance from July 1999 until September 2008. Mr. Spurioserved as Executive Managing Director of the Financial Services Group’s Midwest Region from September 2008through March 2010, and as the Group’s Chief Operating Officer from March 2010 through December 2013.Mr. Spurio was associated with KPMG LLP, an international accounting firm, from July 1988 to January 1998.Mr. Spurio is a CPA, CGMA and a member of the American Institute of Certified Public Accountants and theOhio Society of Certified Public Accountants.
Michael P. Kouzelos joined CBIZ in June 1998 and has held several positions in the Company. He was appointedPresident of the Benefits & Insurance practice group in May 2015, and was appointed Senior Vice President ofStrategic Initiatives in September 2005. Mr. Kouzelos also served as the Chief Operating Officer of theBenefits & Insurance division between April 2007 and May 2015, as Vice President of Strategic Initiatives fromApril 2001 through August 2005, as Vice President of Shared Services from August 2000 to March 2001, and asDirector of Business Integration from June 1998 to July 2000. Mr. Kouzelos was associated with KPMG LLP, aninternational accounting firm, from 1990 to September 1996 and received his Master of Business Administrationdegree from The Ohio State University in May of 1998.
Other Key Employees:
Richard E. Mills has served as the Chief Operating Officer of CBIZ’s Financial Services practice group sinceJanuary 2014. Prior to this appointment, Mr. Mills was President of CBIZ MHM, LLC — Kansas City, andresponsible for offices in St. Louis, Topeka, Wichita and Tulsa. His responsibilities at a corporate level includebusiness development, marketing, strategic planning, national training and organizational efficiency. Mr. Millshas also served as the Kansas City and Midwest Regional Attest Leader, and for many years consulted withclients on a variety of topics, including acquisitions, strategic planning, succession planning and improvingprofitability. His clients included not-for-profit organizations, construction companies, manufacturing anddistribution companies. Mr. Mills began his career with Mayer Hoffman McCann in 1978.
Michael W. Gleespen has served as Corporate Secretary since April 2001 and General Counsel since June 2001.Mr. Gleespen is an attorney and has served as CBIZ’s Vice President of Regulatory Compliance andAccountancy Compliance Officer and Technical Director since February 1998. Prior to joining CBIZ,Mr. Gleespen was an Assistant Ohio Attorney General in the Business & Government Regulation Section and theCourt of Claims Defense Section from 1988 until 1998, during which time he was counsel to the OhioAccountancy Board, the Ohio State Teachers Retirement System and represented many other state departmentsand agencies. Mr. Gleespen also held the post of Associate Attorney General for Pension, Disability and AnnuityPlans and was the Co-Chairman of the Public Pension Plan Working Group.
John A. Fleischer has served as Senior Vice President and Chief Information Officer of CBIZ since August 2014.Prior to joining CBIZ, Mr. Fleischer held CIO roles at TTT Holdings (a Talisman Capital Partners company),Ferro Corporation, The Goodyear Tire & Rubber Company, and T-Systems. Prior to these, he held senior ITroles at Volkswagen and Federal-Mogul Corporation. While at T-Systems, Mr. Fleischer also ran the U.S.consulting practice, which provided IT services to clients in a variety of industries. He began his career as acommissioned officer in the United States Army and served twelve years on active duty in numerous roles, which
41

included directing large-scale systems development and integration projects in communications and computing.He is a Distinguished Military Graduate of Princeton University and received his Master of BusinessAdministration degree from The Ohio State University. Mr. Fleischer serves on the Board of Trustees of theLakeside Chautauqua Association.
Mark M. Waxman has served as Chief Marketing Officer since 2001. Mr. Waxman has over thirty years ofexperience in marketing and branding. Prior to joining CBIZ, he was Chief Executive Officer/Creative Directorof one of Silicon Valley’s most well-known advertising agencies, Carter Waxman. He was also a foundingpartner of SK Consulting (acquired by CBIZ in 1998) providing strategic marketing and branding services to awide range of companies and industries. Mr. Waxman has been a featured marketing columnist and contributorto many business and trade publications, and currently serves on the Advisory Board of several Silicon Valleystart-ups. He serves on the Board of Silicon Valley Creates, the Institute of Contemporary Art and the WestValley Mission Foundation. He has served as the Chairman of the Board for organizations including the SiliconValley Chamber of Commerce, Artsopolis.com, the Silicon Valley Ad Club, and The San Jose RepertoryTheatre.
Bruce J. Kowalski joined CBIZ in December 2003 as Corporate Tax Manager and was appointed Vice President— Tax in April 2008. Mr. Kowalski has more than thirty years of corporate tax experience, beginning his careerin 1982 with Price Waterhouse and holding various corporate tax positions with The Scott Fetzer Company andUCAR Carbon Company Inc. Mr. Kowalski is a CPA (inactive) and received his Masters of Taxation degreefrom the University of Akron.
Cynthia L. Sobe joined CBIZ in August 2016 as Treasurer. Prior to joining CBIZ, Ms. Sobe served as VicePresident, Corporate Treasurer for Crowne Group, LLC from November 2014 through January 2016. Prior tojoining Crowne Group, LLC, Ms. Sobe was Vice President, Chief Financial Officer of AMRESCO, LLC (adivision of VWR) from October 2012 to October 2014. Prior to joining AMRESCO, LLC, Ms. Sobe held variousfinancial and accounting positions with companies representing a variety of industries, including AssociatedMaterials, LLC, Jo-Ann Stores, LLC, Revco D.S., Inc., and Ernst & Young, LLP. Ms. Sobe is a CPA (inactive),and she received a Master of Business Administration from Case Western Reserve University in May 2000.Ms. Sobe is a member of the American Institute of Certified Public Accountants and the Association forFinancial Professionals.
Philip P. Noftsinger was appointed Vice President of Finance and Corporate Controller for CBIZ in March 2020.Prior to his current role, Mr. Noftsinger has served in various leadership positions within CBIZ organizations,particularly as President of CBIZ’s Employee Service Organization and President of CBIZ Payroll.Mr. Noftsinger also created the CBIZ Small Business Employment Index, which is a metric designed to gaugehiring in companies with less than 300 employees across the United States. Mr. Noftsinger can be seen on FoxBusiness, CNBC and Bloomberg on occasion to discuss the state of small business hiring and employment. Hiscomments on the state of small businesses have also been carried in multiple print and web outlets includingSmart Money, Accounting Today and The Wall Street Journal. Prior to joining CBIZ in September of 2004,Mr. Noftsinger was controller of Fortegra, Incorporated, a highly specialized IT consultation and integration firmin the energy and health-care industries. Mr. Noftsinger is a CPA and a member of the American Institute ofCertified Public Accountants.
ITEM 11. EXECUTIVE COMPENSATION.
Information with respect to this item is incorporated by reference from our Definitive Proxy Statement for the2021 Annual Stockholders’ Meeting to be filed with the SEC no later than 120 days after the end of our fiscalyear.
42

ITEM 12. SECURITY OWNERSHIP OF CERTAIN BENEFICIAL OWNERS AND MANAGEMENTAND RELATED STOCKHOLDER MATTERS.
Information with respect to this item is incorporated by reference from our Definitive Proxy Statement for the2021 Annual Stockholders’ Meeting to be filed with the SEC no later than 120 days after the end of our fiscalyear.
ITEM 13. CERTAIN RELATIONSHIPS AND RELATED TRANSACTIONS, AND DIRECTORINDEPENDENCE.
Information with respect to this item is incorporated by reference from our Definitive Proxy Statement for the2021 Annual Stockholders’ Meeting to be filed with the SEC no later than 120 days after the end of our fiscalyear.
ITEM 14. PRINCIPAL ACCOUNTING FEES AND SERVICES.
Information with respect to this item is incorporated by reference from our Definitive Proxy Statement for the2021 Annual Stockholders’ Meeting to be filed with the SEC no later than 120 days after the end of our fiscalyear.
43

PART IV
ITEM 15. EXHIBITS.
(a) The following documents are filed as part of this Annual Report or incorporated by reference:
1. Financial Statements.
As to financial statements and supplementary information, reference is made to “Index to FinancialStatements” on page F-1 of this Annual Report.
2. Exhibits.
The following documents are filed as exhibits to this Form 10-K pursuant to Item 601 of Regulation S-K.Since its incorporation, CBIZ has operated under various names including: Republic EnvironmentalSystems, Inc.; International Alliance Services, Inc.; Century Business Services, Inc.; and CBIZ, Inc.Exhibits listed below refer to these names collectively as the “Company”.
ExhibitNo. Description
3.1 Amended and Restated Certificate of Incorporation of the Company (filed as Exhibit 3.1 to theCompany’s Registration Statement on Form S-8, File No. 333-197284, and incorporated herein byreference).
3.2 Certificate of Amendment of the Certificate of Incorporation of the Company, effective August 1,2005 (filed as Exhibit 3.5 to the Company’s Annual Report on Form 10-K for the year endedDecember 31, 2005, File No. 000-25890, dated March 16, 2006, and incorporated herein byreference).
3.3 Amended and Restated Bylaws of the Company (filed as Exhibit 3.3 to the Company’s RegistrationStatement on Form S-8, File No. 333-197284, and incorporated herein by reference).
3.4 Amendment to Amended and Restated Bylaws of the Company dated November 1, 2007 (filed asExhibit 3.1 to the Company’s Report on Form 8-K, File No. 001-32961, dated November 1, 2007,and incorporated herein by reference).
4.1 Form of Stock Certificate of Common Stock of the Company (filed as Exhibit 4.1 to the Company’sAnnual Report Form 10-K for the year ended December 31, 1998, File No. 000-25890, datedMarch 4, 1999, and incorporated herein by reference).
4.2 Employee Stock Investment Plan (filed as Exhibit 4.4 to the Company’s Report on Form S-8, FileNo. 000-333-62148, dated June 1, 2001, and incorporated herein by reference).
4.3 Description of the Registrant’s Securities Registered Pursuant to Section 12 of the SecuritiesExchange Act of 1934 (filed as Exhibit 4.3 to the Company’s Annual Report Form 10-K for the yearended December 31, 2019, File No. 001-32961, dated February 26, 2020, and incorporated hereinby reference).
10.1† 2002 Stock Incentive Plan (filed as Appendix A to the Company’s Proxy Statement for the 2002Annual Meeting of Stockholders, File No. 000-25890, dated April 1, 2002, and incorporated hereinby reference).
10.2† Severance Protection Agreement by and between the Company and Jerome P. Grisko, Jr. (filed asExhibit 10.11 to the Company’s Annual Report on Form 10-K for the year ended December 31,2000, File No. 000-25890, dated April 2, 2001, and incorporated herein by reference).
10.3† CBIZ, Inc. 2002 Amended and Restated Stock Incentive Plan (Amended and Restated as of May 12,2011), (filed as Exhibit 10.1 to the Company’s Report on Form 10-Q, File No. 001-32961, datedAugust 9, 2011, and incorporated herein by reference).
44

ExhibitNo. Description
10.4† 2014 Stock Incentive Plan and 2002 Amended and Restated Stock Incentive Plan (filed as Exhibit4.2 to Form S-8, dated July 7, 2014, and incorporated herein by reference).
10.5† Consulting Agreement by and between the Company and Steven L. Gerard, dated March 9, 2016(filed as Exhibit 10.1 to the Company’s Report on Form 10-Q, File No. 001-32961, dated March 3,2016, and incorporated herein by reference).
10.6† Employment Agreement by and between the Company and Jerome P. Grisko, Jr., datedSeptember 1, 2016 (filed as Exhibit 10.1 to the Company’s Report on Form 8-K, FileNo. 001-32961, dated September 8, 2016, and incorporated herein by reference).
10.7† Amended and Restated Employment Agreement by and between the Company and Ware H. Grove,dated March 30, 2017 (filed as Exhibit 10.1 to the Company’s Report on Form 8-K, File No.001-32961, dated April 4, 2017, and incorporated herein by reference).
10.8 Loan Agreement dated as of August 16, 2018 by and among CBIZ Benefits and Insurance, Inc. andThe Huntington Bank (filed as Exhibit 10.1 to the Company’s Quarterly Report on Form 10-Q, FileNo. 001-32961, on November 1, 2018, and incorporated herein by reference).
10.9 Amended and Restated Credit Agreement by and among CBIZ Operations, Inc., CBIZ, Inc., andBank of America, N.A., as administrative agent, and the other financial institutions from time totime party thereto, dated April 3, 2018 (filed as Exhibit 10.1 to the Company’s Report on Form 8-K,File No. 001-32961, on April 5, 2018, and incorporated herein by reference).
10.10† 2019 CBIZ, Inc. Omnibus Incentive Plan (filed as Exhibit 4.2 to the Company’s RegistrationStatement on Form S-8, File No. 333-197284, and incorporated herein by reference).
10.11 First Amendment to Loan Agreement by and among CBIZ Benefit and Insurance, Inc. and theHuntington National Bank (filed as Exhibit 10.1 to the Company’s Quarterly Report on Form 10-Q,File No. 001-32961, on November 1, 2019, and incorporated herein by reference).
10.12 Second Amendment to Loan Agreement by and among CBIZ Benefit and Insurance, Inc. and theHuntington National Bank (filed as Exhibit 10.1 to the Company’s Quarterly Report on Form 10-Q,File No. 001-32961, on November 1, 2020, and incorporated herein by reference).
21.1* List of Subsidiaries of CBIZ, Inc.
23* Consent of KPMG LLP
24* Powers of attorney (included on the signature page hereto).
31.1* Certification of Chief Executive Officer Pursuant to Section 302 of the Sarbanes-Oxley Act of 2002
31.2* Certification of Chief Financial Officer Pursuant to Section 302 of the Sarbanes-Oxley Act of 2002
32.1** Certification of Chief Executive Officer Pursuant to Section 906 of the Sarbanes-Oxley Act of 2002
32.2** Certification of Chief Financial Officer Pursuant to Section 906 of the Sarbanes-Oxley Act of 2002
101.INS XBRL Instance Document- the instance document does not appear in the Interactive Data Filebecause its XBRL tags are embedded within the Inline XBRL document*
101.SCH Inline XBRL Taxonomy Extension Schema Document*
101.DEF Inline XBRL Taxonomy Extension Definition Linkbase Document*
45

ExhibitNo. Description
101.CAL Inline XBRL Taxonomy Extension Calculation Linkbase Document*
101.LAB Inline XBRL Taxonomy Extension Label Linkbase Document*
101.PRE Inline XBRL Taxonomy Extension Presentation Linkbase Document*
104 Cover Page Interactive Data File (formatted as Inline XBRL and contained in the Exhibit 101attachments)*
* Indicates documents filed herewith.
** Indicates documents furnished herewith.
† Management contract or compensatory plan contract or arrangement filed pursuant to Item 601 ofRegulation S-K.
46

SIGNATURES
Pursuant to the requirements of Section 13 or 15(d) of the Securities Exchange Act of 1934, the registrant hasduly caused this Annual Report to be signed on its behalf by the undersigned, thereunto duly authorized.
CBIZ, INC.(REGISTRANT)
By /s/ WARE H. GROVE
Ware H. GroveChief Financial OfficerFebruary 26, 2021
KNOW ALL MEN AND WOMEN BY THESE PRESENTS that each person whose signature appears below onthis Annual Report hereby constitutes and appoints Jerome P. Grisko, Jr. and Ware H. Grove, and each of them,with full power to act without the other, his true and lawful attorney-in-fact and agent, with full power ofsubstitution for him and her and his and her name, place and stead, in all capacities (until revoked in writing), tosign any and all amendments to this Annual Report of CBIZ, Inc. and to file the same, with all exhibits thereto,and other documents in connection therewith, with the Securities and Exchange Commission, granting unto eachattorney-in-fact and agent, full power and authority to do and perform each and every act and thing requisite andnecessary fully to all intents and purposes as he might or could do in person, thereby ratifying and confirming allthat each attorney-in-fact and agent, or their or his substitute or substitutes, may lawfully do or cause to be doneby virtue hereof.
Pursuant to the requirements of the Securities Exchange Act of 1934, this Annual Report has been signed belowby the following persons on behalf of the registrant and in the capacities and on the date indicated above.
Signature Title Date
/s/ JEROME P. GRISKO, JR.
Jerome P. Grisko, Jr.
President & Chief Executive Officer, Director(Principal Executive Officer)
February 26, 2021
/s/ WARE H. GROVE
Ware H. Grove
Chief Financial Officer(Principal Financial and Accounting Officer)
February 26, 2021
/s/ STEVEN L. GERARD
Steven L. Gerard
Chairman February 26, 2021
/s/ RICK L. BURDICK
Rick L. Burdick
Lead Director and Vice Chairman February 26, 2021
/s/ MICHAEL H. DE GROOTE
Michael H. DeGroote
Director February 26, 2021
/s/ JOSEPH S. DI MARTINO
Joseph S. DiMartino
Director February 26, 2021
/s/ GINA D. FRANCE
Gina D. France
Director February 26, 2021
/s/ SHERRILL W. HUDSON
Sherrill W. Hudson
Director February 26, 2021
47

Signature Title Date
/s/ TODD J. SLOTKIN
Todd J. Slotkin
Director February 26, 2021
/s/ A. HAAG SHERMAN
A.Haag Sherman
Director February 26, 2021
/s/ BENAREE PRATT WILEY
Benaree Pratt Wiley
Director February 26, 2021
48

CBIZ, INC. AND SUBSIDIARIES
INDEX TO FINANCIAL STATEMENTS
Page
Report of Independent Registered Public Accounting Firm . . . . . . . . . . . . . . . . . . . . . . . . . . . . . . . . . . . . . . F-2Consolidated Balance Sheets as of December 31, 2020 and 2019 . . . . . . . . . . . . . . . . . . . . . . . . . . . . . . . . . . F-5Consolidated Statements of Comprehensive Income for the years ended December 31, 2020, 2019 and
2018 . . . . . . . . . . . . . . . . . . . . . . . . . . . . . . . . . . . . . . . . . . . . . . . . . . . . . . . . . . . . . . . . . . . . . . . . . . . . . . . F-6Consolidated Statements of Stockholders’ Equity for the years ended December 31, 2020, 2019 and
2018 . . . . . . . . . . . . . . . . . . . . . . . . . . . . . . . . . . . . . . . . . . . . . . . . . . . . . . . . . . . . . . . . . . . . . . . . . . . . . . . F-7Consolidated Statements of Cash Flows for the years ended December 31, 2020, 2019 and 2018 . . . . . . . . . F-8Notes to the Consolidated Financial Statements . . . . . . . . . . . . . . . . . . . . . . . . . . . . . . . . . . . . . . . . . . . . . . . F-9
F-1

Report of Independent Registered Public Accounting Firm
To the Stockholders and Board of DirectorsCBIZ, Inc.:
Opinions on the Consolidated Financial Statements and Internal Control Over Financial Reporting
We have audited the accompanying consolidated balance sheets of CBIZ, Inc. and subsidiaries (the Company) asof December 31, 2020 and 2019, the related consolidated statements of comprehensive income, stockholders’equity, and cash flows for each of the years in the three-year period ended December 31, 2020, and the relatednotes (collectively, the consolidated financial statements). We also have audited the Company’s internal controlover financial reporting as of December 31, 2020, based on criteria established in Internal Control – IntegratedFramework (2013) issued by the Committee of Sponsoring Organizations of the Treadway Commission.
In our opinion, the consolidated financial statements referred to above present fairly, in all material respects, thefinancial position of the Company as of December 31, 2020 and 2019, and the results of its operations and itscash flows for each of the years in the three-year period ended December 31, 2020, in conformity with U.S.generally accepted accounting principles. Also in our opinion, the Company maintained, in all material respects,effective internal control over financial reporting as of December 31, 2020 based on criteria established inInternal Control – Integrated Framework (2013) issued by the Committee of Sponsoring Organizations of theTreadway Commission.
Change in Accounting Principle
As discussed in Note 1 to the consolidated financial statements, the Company has changed its method ofaccounting for leases as of January 1, 2019 due to the adoption of Financial Accounting Standards BoardAccounting Standards Codification Topic 842, Leases.
Basis for Opinions
The Company’s management is responsible for these consolidated financial statements, for maintaining effectiveinternal control over financial reporting, and for its assessment of the effectiveness of internal control overfinancial reporting, included in the accompanying Management’s Report on Internal Control Over FinancialReporting. Our responsibility is to express an opinion on the Company’s consolidated financial statements and anopinion on the Company’s internal control over financial reporting based on our audits. We are a publicaccounting firm registered with the Public Company Accounting Oversight Board (United States) (PCAOB) andare required to be independent with respect to the Company in accordance with the U.S. federal securities lawsand the applicable rules and regulations of the Securities and Exchange Commission and the PCAOB.
We conducted our audits in accordance with the standards of the PCAOB. Those standards require that we planand perform the audits to obtain reasonable assurance about whether the consolidated financial statements arefree of material misstatement, whether due to error or fraud, and whether effective internal control over financialreporting was maintained in all material respects.
Our audits of the consolidated financial statements included performing procedures to assess the risks of materialmisstatement of the consolidated financial statements, whether due to error or fraud, and performing proceduresthat respond to those risks. Such procedures included examining, on a test basis, evidence regarding the amountsand disclosures in the consolidated financial statements. Our audits also included evaluating the accountingprinciples used and significant estimates made by management, as well as evaluating the overall presentation ofthe consolidated financial statements. Our audit of internal control over financial reporting included obtaining anunderstanding of internal control over financial reporting, assessing the risk that a material weakness exists, andtesting and evaluating the design and operating effectiveness of internal control based on the assessed risk. Ouraudits also included performing such other procedures as we considered necessary in the circumstances. Webelieve that our audits provide a reasonable basis for our opinions.
F-2

Definition and Limitations of Internal Control Over Financial Reporting
A company’s internal control over financial reporting is a process designed to provide reasonable assuranceregarding the reliability of financial reporting and the preparation of financial statements for external purposes inaccordance with generally accepted accounting principles. A company’s internal control over financial reportingincludes those policies and procedures that (1) pertain to the maintenance of records that, in reasonable detail,accurately and fairly reflect the transactions and dispositions of the assets of the company; (2) provide reasonableassurance that transactions are recorded as necessary to permit preparation of financial statements in accordancewith generally accepted accounting principles, and that receipts and expenditures of the company are being madeonly in accordance with authorizations of management and directors of the company; and (3) provide reasonableassurance regarding prevention or timely detection of unauthorized acquisition, use, or disposition of thecompany’s assets that could have a material effect on the financial statements.
Because of its inherent limitations, internal control over financial reporting may not prevent or detectmisstatements. Also, projections of any evaluation of effectiveness to future periods are subject to the risk thatcontrols may become inadequate because of changes in conditions, or that the degree of compliance with thepolicies or procedures may deteriorate.
Critical Audit Matter
The critical audit matter communicated below is a matter arising from the current period audit of theconsolidated financial statements that was communicated or required to be communicated to the audit committeeand that: (1) relates to accounts or disclosures that are material to the consolidated financial statements and(2) involved our especially challenging, subjective, or complex judgments. The communication of a critical auditmatter does not alter in any way our opinion on the consolidated financial statements, taken as a whole, and weare not, by communicating the critical audit matter below, providing a separate opinion on the critical auditmatter or on the accounts or disclosures to which it relates.
Evaluation of the estimation of losses for certain billed and unbilled receivables
As discussed in Note 1 to the consolidated financial statements, the Company maintains allowances for doubtfulaccounts and unbilled services for estimated losses. As of December 31, 2020, the allowance for doubtfulaccounts was $14.9 million, or 6.4% of total accounts receivable. The allowance for doubtful accounts andunbilled services is recorded based on the Company’s historical experience, client credit-worthiness, the age ofaccounts receivable, and economic trends and conditions.
We have identified the evaluation of the Company’s estimation of losses related to the Financial Servicespractice for billed and unbilled receivables as a critical audit matter. There is a high degree of subjectivity inassessing the assumptions, which are used in estimating losses related to billed and unbilled receivables. Theassumptions include the probability of the Company’s collection of receivables based on historical experience,the consideration of economic conditions that may affect the ability of clients to pay billed and unbilled fees, andthe Company’s ability to successfully execute the contracts in line with the current estimated level of effort.
The following are the primary procedures we performed to address the critical audit matter. We evaluated thedesign and tested the operating effectiveness of certain internal controls over the Company’s process to developthe assumptions used to estimate losses related to billed and unbilled receivables. For specific clients, weevaluated the established allowance for doubtful accounts and unbilled services by inquiring of relevantCompany personnel. For a selection of clients, we evaluated the Company’s cash collections and billingssubsequent to December 31, 2020. We assessed the Company’s loss estimation by inspecting relevant underlying
F-3

documentation, including contractual documents, historical trends, age of accounts receivable, and contractrealization analyses. We performed the following analyses over billed and unbilled receivables and relatedaccounts:
• Compared actual incurred bad debt for certain billed and unbilled receivables to the correspondingpreviously established allowance for doubtful accounts and unbilled services, and
• Compared the age of the current billed and unbilled receivables as of December 31, 2020, whichrepresents the days outstanding for the current billed and unbilled receivables to the age of theCompany’s billed and unbilled receivables in prior periods.
/s/ KPMG LLPWe have served as the Company’s auditor since 1996.
Cleveland, OhioFebruary 26, 2021
F-4

CBIZ, INC. AND SUBSIDIARIES
CONSOLIDATED BALANCE SHEETS
DECEMBER 31, 2020 AND 2019
(In thousands, except per share data)
2020 2019
ASSETSCurrent assets:
Cash and cash equivalents . . . . . . . . . . . . . . . . . . . . . . . . . . . . . . . . . . . . . . . . . . . . . . . . . . . . . . . $ 4,652 $ 567Restricted cash . . . . . . . . . . . . . . . . . . . . . . . . . . . . . . . . . . . . . . . . . . . . . . . . . . . . . . . . . . . . . . . . 23,951 29,595Accounts receivable, net . . . . . . . . . . . . . . . . . . . . . . . . . . . . . . . . . . . . . . . . . . . . . . . . . . . . . . . . . 216,175 222,031Other current assets . . . . . . . . . . . . . . . . . . . . . . . . . . . . . . . . . . . . . . . . . . . . . . . . . . . . . . . . . . . . . 24,213 24,325
Current assets before funds held for clients . . . . . . . . . . . . . . . . . . . . . . . . . . . . . . . . . . . . . . . . 268,991 276,518Funds held for clients . . . . . . . . . . . . . . . . . . . . . . . . . . . . . . . . . . . . . . . . . . . . . . . . . . . . . . . . . . . . . 167,440 179,502
Total current assets . . . . . . . . . . . . . . . . . . . . . . . . . . . . . . . . . . . . . . . . . . . . . . . . . . . . . . . . . . . 436,431 456,020Non-current assets:Property and equipment, net . . . . . . . . . . . . . . . . . . . . . . . . . . . . . . . . . . . . . . . . . . . . . . . . . . . . . . . . 41,346 39,412Goodwill and other intangible assets, net . . . . . . . . . . . . . . . . . . . . . . . . . . . . . . . . . . . . . . . . . . . . . . 756,750 654,671Assets of deferred compensation plan . . . . . . . . . . . . . . . . . . . . . . . . . . . . . . . . . . . . . . . . . . . . . . . . 127,332 106,851Operating lease right-of-use asset, net . . . . . . . . . . . . . . . . . . . . . . . . . . . . . . . . . . . . . . . . . . . . . . . . 147,843 140,831Other non-current assets . . . . . . . . . . . . . . . . . . . . . . . . . . . . . . . . . . . . . . . . . . . . . . . . . . . . . . . . . . . 4,052 2,989
Total non-current assets . . . . . . . . . . . . . . . . . . . . . . . . . . . . . . . . . . . . . . . . . . . . . . . . . . . . . . . 1,077,323 944,754
Total assets . . . . . . . . . . . . . . . . . . . . . . . . . . . . . . . . . . . . . . . . . . . . . . . . . . . . . . . . . . . . . . . . . $1,513,754 $1,400,774
LIABILITIESCurrent liabilities:
Accounts payable . . . . . . . . . . . . . . . . . . . . . . . . . . . . . . . . . . . . . . . . . . . . . . . . . . . . . . . . . . . . . . $ 64,119 $ 68,510Income taxes payable . . . . . . . . . . . . . . . . . . . . . . . . . . . . . . . . . . . . . . . . . . . . . . . . . . . . . . . . . . . 2,788 57Accrued personnel costs . . . . . . . . . . . . . . . . . . . . . . . . . . . . . . . . . . . . . . . . . . . . . . . . . . . . . . . . . 79,978 59,898Contingent purchase price liability . . . . . . . . . . . . . . . . . . . . . . . . . . . . . . . . . . . . . . . . . . . . . . . . . 20,288 16,193Operating lease liability . . . . . . . . . . . . . . . . . . . . . . . . . . . . . . . . . . . . . . . . . . . . . . . . . . . . . . . . . 30,483 29,030Other current liabilities . . . . . . . . . . . . . . . . . . . . . . . . . . . . . . . . . . . . . . . . . . . . . . . . . . . . . . . . . . 13,629 13,218
Current liabilities before client fund obligations . . . . . . . . . . . . . . . . . . . . . . . . . . . . . . . . . . . . 211,285 186,906Client fund obligations . . . . . . . . . . . . . . . . . . . . . . . . . . . . . . . . . . . . . . . . . . . . . . . . . . . . . . . . . . 166,989 179,020
Total current liabilities . . . . . . . . . . . . . . . . . . . . . . . . . . . . . . . . . . . . . . . . . . . . . . . . . . . . . . . . 378,274 365,926Non-current liabilities:Bank debt . . . . . . . . . . . . . . . . . . . . . . . . . . . . . . . . . . . . . . . . . . . . . . . . . . . . . . . . . . . . . . . . . . . . . . 108,000 105,500Debt issuance costs . . . . . . . . . . . . . . . . . . . . . . . . . . . . . . . . . . . . . . . . . . . . . . . . . . . . . . . . . . . . . . . (808) (1,167)
Total long-term debt . . . . . . . . . . . . . . . . . . . . . . . . . . . . . . . . . . . . . . . . . . . . . . . . . . . . . . . . . . 107,192 104,333Income taxes payable . . . . . . . . . . . . . . . . . . . . . . . . . . . . . . . . . . . . . . . . . . . . . . . . . . . . . . . . . . . . . 1,775 3,053Deferred income taxes, net . . . . . . . . . . . . . . . . . . . . . . . . . . . . . . . . . . . . . . . . . . . . . . . . . . . . . . . . . 8,752 11,720Deferred compensation plan obligations . . . . . . . . . . . . . . . . . . . . . . . . . . . . . . . . . . . . . . . . . . . . . . 127,332 106,851Contingent purchase price liability . . . . . . . . . . . . . . . . . . . . . . . . . . . . . . . . . . . . . . . . . . . . . . . . . . . 34,103 15,896Operating lease liability . . . . . . . . . . . . . . . . . . . . . . . . . . . . . . . . . . . . . . . . . . . . . . . . . . . . . . . . . . . 142,020 132,018Other non-current liabilities . . . . . . . . . . . . . . . . . . . . . . . . . . . . . . . . . . . . . . . . . . . . . . . . 11,686 1,739
Total non-current liabilities . . . . . . . . . . . . . . . . . . . . . . . . . . . . . . . . . . . . . . . . . . . . . . . . . . . . 432,860 375,610
Total liabilities . . . . . . . . . . . . . . . . . . . . . . . . . . . . . . . . . . . . . . . . . . . . . . . . . . . . . . . . . . . . . . 811,134 741,536
STOCKHOLDERS’ EQUITYCommon stock, par value $0.01 per share; shares authorized 250,000; shares issued 134,144 and
133,056; shares outstanding 54,099 and 55,419 . . . . . . . . . . . . . . . . . . . . . . . . . . . . . . . . . . . . . . . 1,341 1,331Additional paid-in capital . . . . . . . . . . . . . . . . . . . . . . . . . . . . . . . . . . . . . . . . . . . . . . . . . . . . . . . . . . 740,970 714,704Retained earnings . . . . . . . . . . . . . . . . . . . . . . . . . . . . . . . . . . . . . . . . . . . . . . . . . . . . . . . . . . . . . . . . 557,875 479,576Treasury stock, 80,045 and 77,637 shares . . . . . . . . . . . . . . . . . . . . . . . . . . . . . . . . . . . . . . . . . . . . . (595,297) (535,693)Accumulated other comprehensive loss . . . . . . . . . . . . . . . . . . . . . . . . . . . . . . . . . . . . . . . . . . . . . . . (2,269) (680)
Total stockholders’ equity . . . . . . . . . . . . . . . . . . . . . . . . . . . . . . . . . . . . . . . . . . . . . . . . . . . . . 702,620 659,238
Total liabilities and stockholders’ equity . . . . . . . . . . . . . . . . . . . . . . . . . . . . . . . . . . . . . . . . . . $1,513,754 $1,400,774
See the accompanying notes to the consolidated financial statements
F-5

CBIZ, INC. AND SUBSIDIARIES
CONSOLIDATED STATEMENTS OF COMPREHENSIVE INCOME
YEARS ENDED DECEMBER 31, 2020, 2019 AND 2018
(In thousands, except per share data)
2020 2019 2018
Revenue . . . . . . . . . . . . . . . . . . . . . . . . . . . . . . . . . . . . . . . . . . . . . . . . . . . . . . . $963,897 $948,424 $922,003Operating expenses . . . . . . . . . . . . . . . . . . . . . . . . . . . . . . . . . . . . . . . . . . . . . . 825,351 823,496 790,283
Gross margin . . . . . . . . . . . . . . . . . . . . . . . . . . . . . . . . . . . . . . . . . . . . . . . . . . . 138,546 124,928 131,720Corporate general and administrative expenses . . . . . . . . . . . . . . . . . . . . . . . . . 46,066 44,406 39,173
Operating income . . . . . . . . . . . . . . . . . . . . . . . . . . . . . . . . . . . . . . . . . . . . . . . . 92,480 80,522 92,547Other income (expense):
Interest expense . . . . . . . . . . . . . . . . . . . . . . . . . . . . . . . . . . . . . . . . . . . . . (4,983) (5,765) (6,645)(Loss) gain on sale of operations, net . . . . . . . . . . . . . . . . . . . . . . . . . . . . . (509) 417 1,025Other income (expense), net . . . . . . . . . . . . . . . . . . . . . . . . . . . . . . . . . . . . 16,500 17,715 (7,087)
Total other income (expense), net . . . . . . . . . . . . . . . . . . . . . . . . . . . . . 11,008 12,367 (12,707)
Income from continuing operations before income tax expense 103,488 92,889 79,840Income tax expense . . . . . . . . . . . . . . . . . . . . . . . . . . . . . . . . . . . . . . . . . . . . . . 25,141 21,840 18,267
Income from continuing operations 78,347 71,049 61,573Loss from operations of discontinued operations, net of tax . . . . . . . . . . . . . . . (48) (335) (3)
Net income . . . . . . . . . . . . . . . . . . . . . . . . . . . . . . . . . . . . . . . . . . . . . . . . . . . . . $ 78,299 $ 70,714 $ 61,570
Earnings (loss) per share:Basic:
Continuing operations . . . . . . . . . . . . . . . . . . . . . . . . . . . . . . . . . . . . . . . . $ 1.44 $ 1.31 $ 1.13Discontinued operations . . . . . . . . . . . . . . . . . . . . . . . . . . . . . . . . . . . . . . . — (0.01) —
Net income . . . . . . . . . . . . . . . . . . . . . . . . . . . . . . . . . . . . . . . . . . . . . . . . . $ 1.44 $ 1.30 $ 1.13
Diluted:Continuing operations . . . . . . . . . . . . . . . . . . . . . . . . . . . . . . . . . . . . . . . . $ 1.42 $ 1.27 $ 1.09Discontinued operations . . . . . . . . . . . . . . . . . . . . . . . . . . . . . . . . . . . . . . . (0.01) (0.01) —
Net income . . . . . . . . . . . . . . . . . . . . . . . . . . . . . . . . . . . . . . . . . . . . . . . . . $ 1.41 $ 1.26 $ 1.09
Basic weighted average common shares outstanding . . . . . . . . . . . . . . . . . . . . 54,288 54,299 54,561
Diluted weighted average common shares outstanding . . . . . . . . . . . . . . . . . . . 55,359 55,895 56,487
Comprehensive income:Net income . . . . . . . . . . . . . . . . . . . . . . . . . . . . . . . . . . . . . . . . . . . . . . . . . . . . . $ 78,299 $ 70,714 $ 61,570Other comprehensive income:
Net unrealized (loss) gain on available-for-sale securities, net of incometax (benefit) expense of $(14), $351 and $(96) . . . . . . . . . . . . . . . . . . . . . (42) 940 (259)
Net unrealized (loss) on interest rate swaps, net of income tax (benefit) of$(494), $(380) and $(8) . . . . . . . . . . . . . . . . . . . . . . . . . . . . . . . . . . . . . . . (1,525) (1,222) (17)
Foreign currency translation . . . . . . . . . . . . . . . . . . . . . . . . . . . . . . . . . . . . . . . (22) (17) (24)
Total other comprehensive loss . . . . . . . . . . . . . . . . . . . . . . . . . . . . . . . . . . . . . (1,589) (299) (300)
Total comprehensive income . . . . . . . . . . . . . . . . . . . . . . . . . . . . . . . . . . . . . . . $ 76,710 $ 70,415 $ 61,270
See the accompanying notes to the consolidated financial statements
F-6
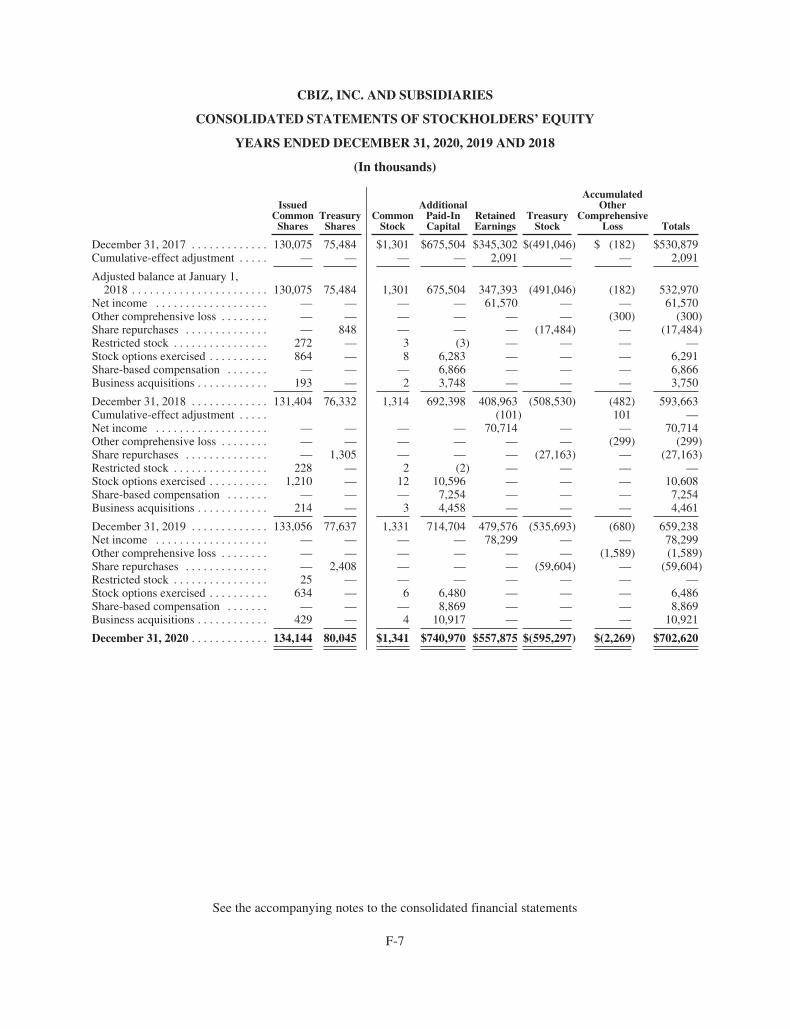
CBIZ, INC. AND SUBSIDIARIES
CONSOLIDATED STATEMENTS OF STOCKHOLDERS’ EQUITY
YEARS ENDED DECEMBER 31, 2020, 2019 AND 2018
(In thousands)
IssuedCommon
SharesTreasury
SharesCommon
Stock
AdditionalPaid-InCapital
RetainedEarnings
TreasuryStock
AccumulatedOther
ComprehensiveLoss Totals
December 31, 2017 . . . . . . . . . . . . . 130,075 75,484 $1,301 $675,504 $345,302 $(491,046) $ (182) $530,879Cumulative-effect adjustment . . . . . — — — — 2,091 — — 2,091
Adjusted balance at January 1,2018 . . . . . . . . . . . . . . . . . . . . . . . 130,075 75,484 1,301 675,504 347,393 (491,046) (182) 532,970
Net income . . . . . . . . . . . . . . . . . . . — — — — 61,570 — — 61,570Other comprehensive loss . . . . . . . . — — — — — — (300) (300)Share repurchases . . . . . . . . . . . . . . — 848 — — — (17,484) — (17,484)Restricted stock . . . . . . . . . . . . . . . . 272 — 3 (3) — — — —Stock options exercised . . . . . . . . . . 864 — 8 6,283 — — — 6,291Share-based compensation . . . . . . . — — — 6,866 — — — 6,866Business acquisitions . . . . . . . . . . . . 193 — 2 3,748 — — — 3,750
December 31, 2018 . . . . . . . . . . . . . 131,404 76,332 1,314 692,398 408,963 (508,530) (482) 593,663Cumulative-effect adjustment . . . . . (101) 101 —Net income . . . . . . . . . . . . . . . . . . . — — — — 70,714 — — 70,714Other comprehensive loss . . . . . . . . — — — — — — (299) (299)Share repurchases . . . . . . . . . . . . . . — 1,305 — — — (27,163) — (27,163)Restricted stock . . . . . . . . . . . . . . . . 228 — 2 (2) — — — —Stock options exercised . . . . . . . . . . 1,210 — 12 10,596 — — — 10,608Share-based compensation . . . . . . . — — — 7,254 — — — 7,254Business acquisitions . . . . . . . . . . . . 214 — 3 4,458 — — — 4,461
December 31, 2019 . . . . . . . . . . . . . 133,056 77,637 1,331 714,704 479,576 (535,693) (680) 659,238Net income . . . . . . . . . . . . . . . . . . . — — — — 78,299 — — 78,299Other comprehensive loss . . . . . . . . — — — — — — (1,589) (1,589)Share repurchases . . . . . . . . . . . . . . — 2,408 — — — (59,604) — (59,604)Restricted stock . . . . . . . . . . . . . . . . 25 — — — — — — —Stock options exercised . . . . . . . . . . 634 — 6 6,480 — — — 6,486Share-based compensation . . . . . . . — — — 8,869 — — — 8,869Business acquisitions . . . . . . . . . . . . 429 — 4 10,917 — — — 10,921
December 31, 2020 . . . . . . . . . . . . . 134,144 80,045 $1,341 $740,970 $557,875 $(595,297) $(2,269) $702,620
See the accompanying notes to the consolidated financial statements
F-7

CBIZ, INC. AND SUBSIDIARIES
CONSOLIDATED STATEMENTS OF CASH FLOWS
YEARS ENDED DECEMBER 31, 2020, 2019 AND 2018
(In thousands)
2020 2019 2018
Cash flows from operating activities:Net income . . . . . . . . . . . . . . . . . . . . . . . . . . . . . . . . . . . . . . . . . . . . . . . . . . . . . . . . . . . . $ 78,299 $ 70,714 $ 61,570Adjustments to reconcile net income to net cash provided by operating activities:
Gain on sale of operations, net of tax . . . . . . . . . . . . . . . . . . . . . . . . . . . . . . . . . . . . . . 509 (417) (1,025)Depreciation and amortization expense . . . . . . . . . . . . . . . . . . . . . . . . . . . . . . . . . . . . 23,139 22,345 23,675Bad debt expense, net of recoveries . . . . . . . . . . . . . . . . . . . . . . . . . . . . . . . . . . . . . . . 4,409 2,415 3,665Adjustment to contingent earnout liability, net . . . . . . . . . . . . . . . . . . . . . . . . . . . . . . . (629) 1,599 2,617Deferred income taxes . . . . . . . . . . . . . . . . . . . . . . . . . . . . . . . . . . . . . . . . . . . . . . . . . . (770) 9,695 5,775Employee stock awards . . . . . . . . . . . . . . . . . . . . . . . . . . . . . . . . . . . . . . . . . . . . . . . . . 8,869 7,254 6,866Excess tax benefits from share based payment arrangements . . . . . . . . . . . . . . . . . . . . (2,394) (4,773) (3,260)Other, net . . . . . . . . . . . . . . . . . . . . . . . . . . . . . . . . . . . . . . . . . . . . . . . . . . . . . . . . . . . . 485 1,077 400
Changes in assets and liabilities, net of acquisitions and divestitures:Accounts receivable, net . . . . . . . . . . . . . . . . . . . . . . . . . . . . . . . . . . . . . . . . . . . . . . . . 6,714 (15,529) (10,668)Other assets . . . . . . . . . . . . . . . . . . . . . . . . . . . . . . . . . . . . . . . . . . . . . . . . . . . . . . . . . . 1,472 907 (3,344)Accounts payable . . . . . . . . . . . . . . . . . . . . . . . . . . . . . . . . . . . . . . . . . . . . . . . . . . . . . (8,800) 9,829 974Income taxes payable . . . . . . . . . . . . . . . . . . . . . . . . . . . . . . . . . . . . . . . . . . . . . . . . . . 2,158 (687) 426Accrued personnel costs . . . . . . . . . . . . . . . . . . . . . . . . . . . . . . . . . . . . . . . . . . . . . . . . 19,788 (4,093) 17,901Other liabilities . . . . . . . . . . . . . . . . . . . . . . . . . . . . . . . . . . . . . . . . . . . . . . . . . . . . . . . 13,667 (1,813) (140)
Net cash provided by continuing operations . . . . . . . . . . . . . . . . . . . . . . . . . . . . . . . . . . . 146,916 98,523 105,432Operating cash flows used in discontinued operations . . . . . . . . . . . . . . . . . . . . . . . . . (71) (338) (184)
Net cash provided by operating activities . . . . . . . . . . . . . . . . . . . . . . . . . . . . . . . . . 146,845 98,185 105,248
Cash flows from investing activities:Business acquisitions and purchases of client lists, net of cash acquired . . . . . . . . . . . . . (71,430) (11,744) (29,080)Purchases of client fund investments . . . . . . . . . . . . . . . . . . . . . . . . . . . . . . . . . . . . . . . . (3,447) (27,216) (18,426)Proceeds from the sales and maturities of client fund investments . . . . . . . . . . . . . . . . . . 37,487 23,958 12,238Additions to property and equipment . . . . . . . . . . . . . . . . . . . . . . . . . . . . . . . . . . . . . . . . (11,576) (13,873) (14,624)Other, net . . . . . . . . . . . . . . . . . . . . . . . . . . . . . . . . . . . . . . . . . . . . . . . . . . . . . . . . . . . . . . 2,560 1,190 2,316
Net cash used in investing activities . . . . . . . . . . . . . . . . . . . . . . . . . . . . . . . . . . . . . (46,406) (27,685) (47,576)
Cash flows from financing activities:Proceeds from bank debt . . . . . . . . . . . . . . . . . . . . . . . . . . . . . . . . . . . . . . . . . . . . . . . . . . 592,354 648,648 690,173Payment of bank debt . . . . . . . . . . . . . . . . . . . . . . . . . . . . . . . . . . . . . . . . . . . . . . . . . . . . (589,854) (678,648) (733,173)Payment for acquisition of treasury stock . . . . . . . . . . . . . . . . . . . . . . . . . . . . . . . . . . . . . (58,536) (27,163) (17,484)(Decrease) increase in client funds obligations . . . . . . . . . . . . . . . . . . . . . . . . . . . . . . . . . (13,747) 10,069 (41,509)Payment of contingent consideration of acquisitions . . . . . . . . . . . . . . . . . . . . . . . . . . . . (12,859) (17,457) (11,787)Proceeds from exercise of stock options . . . . . . . . . . . . . . . . . . . . . . . . . . . . . . . . . . . . . . 6,486 10,608 6,291Other, net . . . . . . . . . . . . . . . . . . . . . . . . . . . . . . . . . . . . . . . . . . . . . . . . . . . . . . . . . . . . . . (453) (606) (1,891)
Net cash used in financing activities . . . . . . . . . . . . . . . . . . . . . . . . . . . . . . . . . . . . . (76,609) (54,549) (109,380)
Net increase (decrease) in cash, cash equivalents and restricted cash . . . . . . . . . . . . . 23,830 15,951 (51,708)Cash, cash equivalents and restricted cash at beginning of year . . . . . . . . . . . . . . . . . . . . 146,505 130,554 182,262
Cash, cash equivalents and restricted cash at end of year . . . . . . . . . . . . . . . . . . . . . . . . . $ 170,335 $ 146,505 $ 130,554
Reconciliation of cash, cash equivalents and restricted cash to the ConsolidatedBalance Sheets
Cash and cash equivalents . . . . . . . . . . . . . . . . . . . . . . . . . . . . . . . . . . . . . . . . . . . . . . . . . $ 4,652 $ 567 $ 640Restricted cash . . . . . . . . . . . . . . . . . . . . . . . . . . . . . . . . . . . . . . . . . . . . . . . . . . . . . . . . . . 23,951 29,595 27,481Cash equivalents included in funds held for clients . . . . . . . . . . . . . . . . . . . . . . . . . . . . . 141,732 116,343 102,433
Cash, cash equivalents and restricted cash at end of year . . . . . . . . . . . . . . . . . . . . . . . . . $ 170,335 $ 146,505 $ 130,554
Supplemental disclosures of cash flow information:Cash paid for interest . . . . . . . . . . . . . . . . . . . . . . . . . . . . . . . . . . . . . . . . . . . . . . . . . . . . . $ 4,739 $ 5,556 $ 6,340
Cash paid for income taxes, net of income tax refunds . . . . . . . . . . . . . . . . . . . . . . . . . . $ 25,939 $ 17,497 $ 15,327
See the accompanying notes to the consolidated financial statements
F-8

CBIZ, INC. AND SUBSIDIARIES
NOTES TO THE CONSOLIDATED FINANCIAL STATEMENTS
NOTE 1. BASIS OF PRESENTATION AND SIGNIFICANT ACCOUNTING POLICIES
Selected Terms Used in Notes to Consolidated Financial Statements
ASA — Administrative Service Agreement.
ASC — Accounting Standards Codification.
ASU — Accounting Standards Update.
CECL — Current expected credit losses.
CPA firm — Certified Public Accounting firm.
FASB — The Financial Accounting Standards Board.
GAAP — United States Generally Accepted Accounting Principles.
LIBOR — London Interbank Offered Rate.
Legacy ASC Topic 840 — ASC Topic 840, Leases
New Lease Standard — ASC Topic 842, Leases
ROU- Right of Use.
SEC — United States Securities & Exchange Commission.
Topic 326 — ASU No. 2016-13, Financial Instruments — Credit Losses.
Organization — CBIZ, Inc. is a leading provider of financial, insurance and advisory services to businessesthroughout the United States and parts of Canada. Acting through its subsidiaries, it has been serving small andmedium-sized businesses, as well as individuals, governmental entities, and not-for-profit enterprises. CBIZ, Inc.manages and reports its operations along three practice groups: Financial Services, Benefits and InsuranceServices and National Practices. A further description of products and services offered by each of the practicegroups is provided in Note 21, Segment Disclosures, to the accompanying consolidated financial statements.
Basis of Presentation — The accompanying consolidated financial statements reflect the operations of CBIZ,Inc. and all of its wholly-owned subsidiaries (“CBIZ,” the “Company,” “we,” “us” or “our”), after elimination ofall intercompany accounts and transactions. We have prepared the accompanying consolidated financialstatements in accordance with GAAP and pursuant to the rules and regulations of the SEC.
We have determined that our relationship with certain CPA firms with whom we maintain ASAs qualify asvariable interest entities. The accompanying consolidated financial statements do not reflect the operations oraccounts of variable interest entities as the impact is not material to our consolidated financial condition, resultsof operations or cash flows.
Fees earned by us under the ASAs are recorded at net realizable value as a component of “Revenue” in theaccompanying Consolidated Statements of Comprehensive Income and were approximately $159.4 million,$157.6 million and $154.0 million for the years ended December 31, 2020, 2019 and 2018, respectively, the
F-9

CBIZ, INC. AND SUBSIDIARIES
NOTES TO THE CONSOLIDATED FINANCIAL STATEMENTS — (continued)
majority of which was related to services rendered to privately-held clients. In the event that accounts receivableand unbilled work in process become uncollectible by the CPA firms, the service fee due to us is typicallyreduced on a proportional basis. Although the ASAs do not constitute control, we are one of the beneficiaries ofthe agreements and may bear certain economic risks. Refer to Note 17, Related Parties, for further discussionregarding the ASAs.
Significant Accounting Policies — We consider the following policies to be beneficial in understanding thejudgments that are involved in the preparation of our consolidated financial statements and the uncertainties thatcould impact our financial condition, results of operations and cash flows.
Use of Estimates — The preparation of consolidated financial statements in conformity with GAAP andpursuant to the rules and regulations of the SEC requires management to make estimates and assumptions thataffect the amounts reported in the consolidated financial statements and accompanying notes. Management’sestimates and assumptions are derived from and are continually evaluated based upon available information,judgment and experience. Actual results may differ materially from these estimates.
Revenue Recognition — We account for revenue in accordance with Topic 606, Revenue from Contracts withCustomers. We recognize revenue based on the five-step model; (i) identify the contract with the customer;(ii) identify the performance obligation in the contract; (iii) determine the contract price; (iv) allocate thetransaction price; and (v) recognize revenue as each performance obligation is satisfied. If we determine that acontract with enforceable rights and obligations does not exist, revenues are deferred until all criteria for anenforceable contract are met. For further information on our various streams of revenue, refer to Note 2,Revenue, to the accompanying consolidated financial statements.
Operating Expenses — Operating expenses represent costs of service and other costs incurred to operate ourbusiness units and are primarily comprised of personnel costs and occupancy related expenses. Personnel costsinclude (i) salaries and benefits; (ii) commissions paid to producers; (iii) incentive compensation; and (iv) share-based compensation. Incentive compensation costs and share-based compensation are estimated and accrued. Thefinal determination of incentive compensation is made after year-end results are finalized. The largestcomponents of occupancy costs are rent expense and utilities. Base rent expense is recognized over respectivelease terms, while utilities and common area maintenance charges are recognized as incurred.
Share-Based Compensation — The measurement of all share-based compensation arrangements is based ontheir respective grant date fair value. The grant date fair value of stock options is based on the Black-Scholes-Merton pricing model, which incorporates assumptions regarding the expected volatility, the expected option life,the risk-free interest rate and the expected dividend yield. The grant date fair value of restricted stock andrestricted stock unit is based on the closing price of the underlying stock on the date of issuance. The grant datefair value of the performance share unit is based on the closing price of the underlying stock on the date ofissuance and recorded based on achievement of target performance metrics. The expense related to stock options,restricted stock, and restricted stock units is recognized over the requisite service period which is generally threeto four years. The expense related to performance share units is recorded over the three-year performance periodbased on the fair value on the grant date and adjusted each reporting period for the achievement of theperformance metrics, based on our best estimate using available information.
Share-based compensation expense is recorded in the accompanying Consolidated Statements of ComprehensiveIncome as “Operating expenses” or “Corporate general and administrative expenses,” depending on where therespective individual’s compensation is recorded. For additional discussion regarding share-based awards, referto Note 14, Employee Share Plans, to the accompanying consolidated financial statements.
F-10

CBIZ, INC. AND SUBSIDIARIES
NOTES TO THE CONSOLIDATED FINANCIAL STATEMENTS — (continued)
Operating Leases — We determine if a contract is a lease at inception. We have leases for office space andfacilities, automobiles, and certain information technology equipment. Certain of these leases include options toextend the lease and some include options to terminate the lease early. Effective January 1, 2019, we adopted theNew Lease Standard using the modified retrospective method of applying the new standard at the adoption date.Under the New Lease Standard, all of our leases are classified as operating leases and the majority of which arefor office space and facilities. The ROU assets and lease liabilities are recognized as of the commencement datebased on the present value of the lease payments over the lease term. The lease term may include the options toextend or terminate the lease when it is reasonably certain that we will exercise the applicable option. Relatedrent expense under such leases is recognized evenly throughout the term of the lease when the total leasecommitment is a known amount, and recorded on an as incurred basis when future rent payment increases underthe obligation are unknown due to rent escalations being tied to factors that are not currently measurable (such asincreases in the consumer price index). Differences between rent expense recognized and the cash paymentsrequired under these leases are recorded as a component of “Operating lease liability” in the Non-currentliabilities section of the accompanying Consolidated Balance Sheets. We may receive incentives to lease officefacilities in certain areas. Such incentives are recorded as a change in lease payments and may require us toremeasure the lease liability to reflect the change in lease payments.
Cash and Cash Equivalents — Cash and cash equivalents consist of cash on hand and investments with anoriginal maturity of three months or less when purchased.
Restricted Cash — Restricted cash consists of funds held by us in relation to our capital and investmentadvisory services as those funds are restricted in accordance with applicable Financial Industry RegulatoryAuthority regulations. Restricted cash also consists of funds on deposit from clients in connection with the pass-through of insurance premiums to the carrier with the related liability for these funds recorded in “Accountspayable” in the accompanying Consolidated Balance Sheets.
Accounts Receivable and Allowance for Doubtful Accounts — Accounts receivable, less allowances fordoubtful accounts, reflects the net realizable value of receivables and approximates fair value. Unbilled revenuesare recorded at estimated net realizable value. Assessing the collectability of receivables (billed and unbilled)requires management judgment based on a combination of factors. When evaluating the adequacy of theallowance for doubtful accounts and the overall probability of collecting on receivables, we analyze historicalexperience, client credit-worthiness, the age of the trade receivable balances, current economic conditions thatmay affect a client’s ability to pay and current and projected economic trends and conditions at the balance sheetdate. At December 31, 2020 and 2019, the allowance for doubtful accounts was $14.9 million and $14.4 million,respectively, in the accompanying Consolidated Balance Sheets.
Funds Held for Clients and Client Fund Obligations — Services provided by our payroll operations includethe preparation of payroll checks, federal, state, and local payroll tax returns, and flexible spending accountadministration. In relation to these services, as well as other similar service offerings, we collect funds from ourclients’ accounts in advance of paying client obligations. These funds, collected before they are due, aresegregated and invested in accordance with our investment policy, which requires all investments carry aninvestment grade rating at the time of initial investment. These investments, primarily consisting of corporate andmunicipal bonds and U.S. treasury bills, are classified as available-for-sale and are included in the “Funds heldfor clients” line item on the accompanying Consolidated Balance Sheets. The underlying obligation is recordedas “Client fund obligation” on the Consolidated Balance Sheets. The balances in these accounts fluctuate with thetiming of cash receipts and the related cash payments and may vary significantly during the year based on thetiming of client’s payroll periods. Other than certain federal and state regulations pertaining to flexible spendingaccount administration, there are no regulatory or other contractual restrictions placed on these funds. Refer to
F-11

CBIZ, INC. AND SUBSIDIARIES
NOTES TO THE CONSOLIDATED FINANCIAL STATEMENTS — (continued)
Note 6, Financial Instruments, to the accompanying consolidated financial statements for further discussion ofinvestments related to funds held for clients.
Property and Equipment — Property and equipment are recorded at cost less accumulated depreciation andamortization. Depreciation and amortization are provided on a straight-line basis over the following estimateduseful lives:
Buildings . . . . . . . . . . . . . . . . . . . . . . . . . . . . . . . . . . . . . . . . . . . . . . . . . . . . . . . . . . . . . 25 to 40 yearsFurniture and fixtures . . . . . . . . . . . . . . . . . . . . . . . . . . . . . . . . . . . . . . . . . . . . . . . . . . . 5 to 10 yearsCapitalized software . . . . . . . . . . . . . . . . . . . . . . . . . . . . . . . . . . . . . . . . . . . . . . . . . . . . 2 to 7 yearsEquipment . . . . . . . . . . . . . . . . . . . . . . . . . . . . . . . . . . . . . . . . . . . . . . . . . . . . . . . . . . . . 3 to 7 years
Leasehold improvements are amortized using the straight-line method over the shorter of their estimated usefullives or the remaining respective lease term. The cost of software purchased or developed for internal use iscapitalized and amortized using the straight-line method over an estimated useful life not to exceed seven years.We periodically review long-lived assets for impairment whenever events or changes in business circumstancesindicate that the carrying value of the assets may not be recoverable. Under those circumstances, if the fair valuewere less than the carrying amount of the asset, we would recognize a loss for the difference.
Goodwill and Other Intangible Assets — Goodwill represents the excess of the purchase price of the acquiredbusinesses and the related fair value of the net assets acquired. At December 31, 2020, the carrying value ofgoodwill totaled $683.1 million, compared to total assets of $1.5 billion and total shareholders’ equity of$702.6 million. Intangible assets consist of identifiable intangibles other than goodwill. Identifiable intangibleassets other than goodwill include client lists and non-compete agreements which require significant judgmentsin determining the fair value. We carry client lists and non-compete agreements at cost, less accumulatedamortization, in the accompanying Consolidated Balance Sheets.
Goodwill is reviewed for impairment annually during the fourth quarter or more frequently in the event of animpairment indicator. We are required to consider whether it is more likely than not (defined as a likelihood ofmore than 50%) that the fair value of each reporting unit has fallen below its carrying value, thus requiring us toperform an interim goodwill impairment test. Intangible assets with definite lives, such as client lists andnon-compete agreements, are amortized using the straight-line method over their estimated useful lives(generally ranging from two to fifteen years). We review these assets for impairment whenever events or changesin circumstances indicate an asset’s carrying value may not be recoverable. Recoverability is assessed based on acomparison of the undiscounted cash flows to the recorded value of the asset. If impairment is indicated, the assetis written down to its estimated fair value determined by a discounted cash flow analysis or market comparablemethod.
The goodwill impairment test is performed at a reporting unit level. A reporting unit is an operating segment of abusiness or one level below an operating segment. At December 31, 2020, we had five reporting units. We mayuse either a qualitative or quantitative approach when testing a reporting unit’s goodwill for impairment. Underthe qualitative assessment, we are not required to calculate the fair value of a reporting unit unless we determinethat it is more likely than not that its fair value is less than its carrying amount. If under the quantitativeassessment the fair value of a reporting unit is less than its carrying amount, then the amount of the impairmentloss, if any, must be measured. Any such impairment charge would reduce earnings and could be material.
After considering changes to assumptions used in our most recent quantitative testing for each reporting unit,including the capital market environment, economic and market conditions, industry competition and trends, our
F-12

CBIZ, INC. AND SUBSIDIARIES
NOTES TO THE CONSOLIDATED FINANCIAL STATEMENTS — (continued)
weighted average cost of capital, changes in management and key personnel, the price of our common stock,changes in our results of operations, the magnitude of the excess of fair value over the carrying amount of eachreporting unit as determined in our most recent quantitative testing, and other factors, we concluded that it wasmore likely than not that the fair values of each of our reporting units exceeded their respective carrying valuesand, therefore, did not perform a quantitative impairment analysis. For further information regarding ourgoodwill balances, refer to Note 5, Goodwill and Other Intangible Assets, net, to the accompanying consolidatedfinancial statements.
Income Taxes — Income taxes are provided for the tax effects of transactions reported in the consolidatedfinancial statements and consist of taxes currently payable and deferred taxes. Deferred tax assets and liabilitiesare recognized for the future tax consequences attributable to differences between the financial statementcarrying amounts of existing assets and liabilities and their respective tax basis, and operating losses and taxcredit carryforwards. State income tax credits are accounted for using the flow-through method.
A valuation allowance is provided when it is more-likely-than-not that all or some portion of a deferred tax assetwill not be realized. We determine valuation allowances based on all available evidence. Such evidence includeshistorical results, the reversal of deferred tax liabilities, expectations of future consolidated and/or separatecompany profitability and the feasibility of tax-planning strategies. Determining valuation allowances includessignificant judgment by management, and different judgments could yield different results.
Accounting for uncertain tax positions requires a more-likely-than-not threshold for recognition in theconsolidated financial statements. We recognize a tax benefit based on whether it is more-likely-than-not that atax position will be sustained. We record a liability to the extent that a tax position taken or expected to be takenon a tax return exceeds the amount recognized in the consolidated financial statements.
Business Combinations — We recognize and measure identifiable tangible and intangible assets acquired andliabilities assumed as of the acquisition date at fair value. Fair value measurements require extensive use ofestimates and assumptions, including estimates of future cash flows to be generated by the acquired assets. Theoperating results of acquired businesses are included in our consolidated financial statements beginning on thedate of acquisition. The purchase price is equivalent to the fair value of consideration transferred. Goodwill isrecognized for the excess of purchase price over the net fair value of assets acquired and liabilities assumed.
Contingent Purchase Price Liabilities — Contingent purchase price liabilities consisting of cash payments andcommon stock issuances result from our business acquisitions and are recorded at fair value at the time ofacquisition as “Contingent purchase price liability — current” and “Contingent purchase price liability —non-current” in the accompanying Consolidated Balance Sheets. We estimate the fair value of our contingentpurchase price liabilities using a probability-weighted discounted cash flow model. We probability weight risk-adjusted estimates of future performance of acquired businesses, then calculate the contingent purchase pricebased on the estimates and discount them to present value representing management’s best estimate of fair value.The fair value of the contingent purchase price liabilities, which is considered a Level 3 unobservable input, isreassessed on a quarterly basis based on assumptions provided by practice group leaders and business unitcontrollers together with our corporate finance department. Any change in the fair value estimate, including therevaluation of common stock, is recorded in the earnings of that period. For the years ended December 31, 2020,2019 and 2018, we recorded other income (expense) of $0.6 million, ($1.6) million and $(2.6) million,respectively, related to net changes in the fair value of contingent consideration.
Refer to Note 7, Fair Value Measurements, and Note 18, Business Combinations, for further discussion of ourcontingent purchase price liabilities and acquisitions.
F-13

CBIZ, INC. AND SUBSIDIARIES
NOTES TO THE CONSOLIDATED FINANCIAL STATEMENTS — (continued)
Interest Rate Derivative Instruments — We maintain interest rate swaps that are designated as cash flowhedges to manage the market risk from changes in interest rates on our floating-rate debt under our$400.0 million unsecured credit facility, by and among CBIZ Operations, Inc., CBIZ, Inc. and Bank of America,N.A., as administrative agent and bank, and other participating banks (the “2018 credit facility”). The designationof a derivative instrument as a hedge and its ability to meet the hedge accounting criteria determine how wereflect the change in fair value of the derivative instrument. A derivative qualifies for hedge accounting treatmentif, at inception, it meets defined correlation and effectiveness criteria. These criteria require that the anticipatedcash flows and/or changes in fair value of the hedging instrument substantially offset those of the position beinghedged.
We utilize derivative instruments to manage interest rate risk associated with our floating-rate debt under thecredit facility. Interest rate swap contracts mitigate the risk associated with the underlying hedged item. If thecontract is designated as a cash flow hedge, the mark-to-market gains or losses on the swap are deferred andincluded as a component of accumulated other comprehensive loss, net of tax, to the extent effective, andreclassified to interest expense in the same period during which the hedged transaction affects earnings. Forfurther discussion regarding derivative financial instruments, refer to Note 6, Financial Instruments, to theaccompanying consolidated financial statements.
Recent Accounting Pronouncements — The FASB ASC is the sole source of authoritative GAAP other thanthe SEC issued rules and regulations that apply only to SEC registrants. The FASB issues an ASU tocommunicate changes to the FASB codification. We assess and review the impact of all ASUs. ASUs not listedbelow were reviewed and determined to be either not applicable or are not expected to have a material impact onthe consolidated financial statements.
Accounting Standards Adopted in 2020
Credit Losses: Effective January 1, 2020, we adopted Topic 326, which replaces the incurred loss model with anexpected loss model that is referred to as the current expected credit loss model. The CECL model requires theCompany to immediately recognize an estimate of credit losses that are expected to occur over the life offinancial instruments recorded at amortized cost, including trade receivables.
Topic 326 also amends the other-than-temporary impairment model for available-for-sale securities by requiringthe recognition of credit loss impairments as an allowance rather than a write-down on available-for-salesecurities. The length of time a security has been in an unrealized loss position will no longer impact thedetermination of whether a credit loss exists.
For financial instruments recorded at amortized cost, we did not recognize a cumulative-effect adjustment toretained earnings as the adoption of Topic 326 did not have a material impact on our consolidated financialstatements. For available-for-sale securities, the updated guidance was applied prospectively.
Fair Value Measurement: On January 1, 2020, we adopted ASU No. 2018-13, Fair Value Measurement (Topic820): Disclosure Framework-Changes to the Disclosure Requirements for Fair Value Measurement. Thisstandard amends existing fair value measurement disclosure requirements by adding, changing, or removingcertain disclosures. The adoption of this guidance did not have a material impact on our consolidated financialstatements.
Income Taxes: On January 1, 2020, we adopted ASU No. 2019-12, Income Taxes (Topic 740): Simplifying theAccounting for Income Taxes, which simplifies the accounting for income taxes by removing certain exceptions
F-14
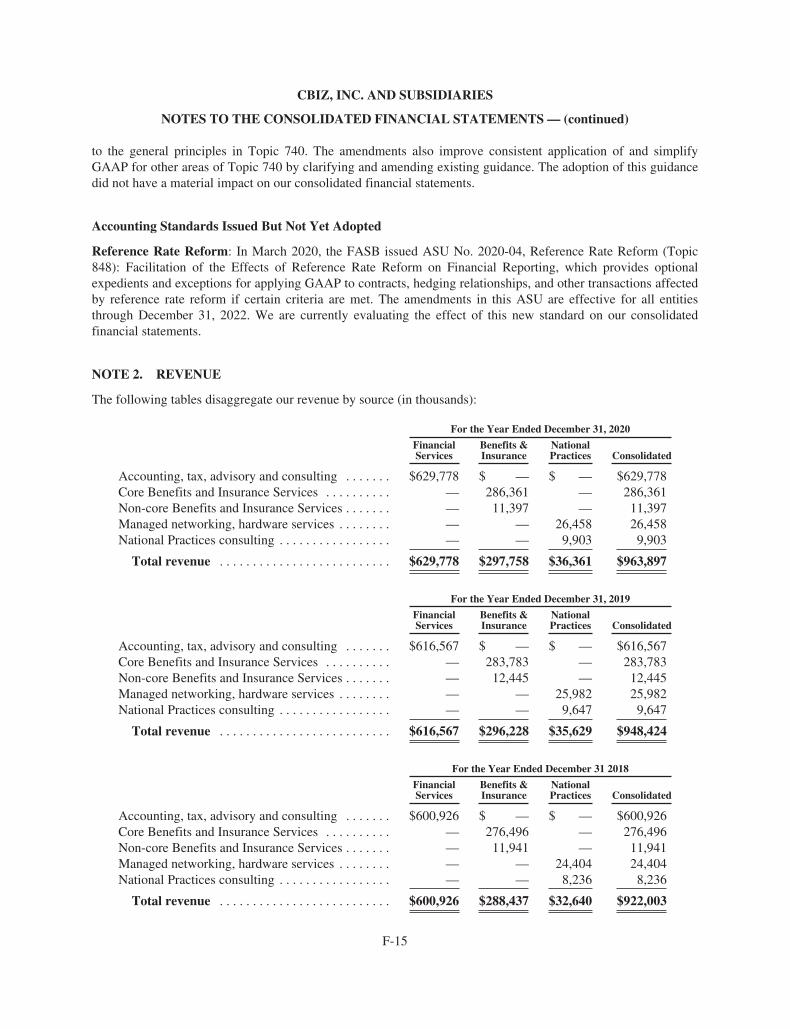
CBIZ, INC. AND SUBSIDIARIES
NOTES TO THE CONSOLIDATED FINANCIAL STATEMENTS — (continued)
to the general principles in Topic 740. The amendments also improve consistent application of and simplifyGAAP for other areas of Topic 740 by clarifying and amending existing guidance. The adoption of this guidancedid not have a material impact on our consolidated financial statements.
Accounting Standards Issued But Not Yet Adopted
Reference Rate Reform: In March 2020, the FASB issued ASU No. 2020-04, Reference Rate Reform (Topic848): Facilitation of the Effects of Reference Rate Reform on Financial Reporting, which provides optionalexpedients and exceptions for applying GAAP to contracts, hedging relationships, and other transactions affectedby reference rate reform if certain criteria are met. The amendments in this ASU are effective for all entitiesthrough December 31, 2022. We are currently evaluating the effect of this new standard on our consolidatedfinancial statements.
NOTE 2. REVENUE
The following tables disaggregate our revenue by source (in thousands):
For the Year Ended December 31, 2020
FinancialServices
Benefits &Insurance
NationalPractices Consolidated
Accounting, tax, advisory and consulting . . . . . . . $629,778 $ — $ — $629,778Core Benefits and Insurance Services . . . . . . . . . . — 286,361 — 286,361Non-core Benefits and Insurance Services . . . . . . . — 11,397 — 11,397Managed networking, hardware services . . . . . . . . — — 26,458 26,458National Practices consulting . . . . . . . . . . . . . . . . . — — 9,903 9,903
Total revenue . . . . . . . . . . . . . . . . . . . . . . . . . . $629,778 $297,758 $36,361 $963,897
For the Year Ended December 31, 2019
FinancialServices
Benefits &Insurance
NationalPractices Consolidated
Accounting, tax, advisory and consulting . . . . . . . $616,567 $ — $ — $616,567Core Benefits and Insurance Services . . . . . . . . . . — 283,783 — 283,783Non-core Benefits and Insurance Services . . . . . . . — 12,445 — 12,445Managed networking, hardware services . . . . . . . . — — 25,982 25,982National Practices consulting . . . . . . . . . . . . . . . . . — — 9,647 9,647
Total revenue . . . . . . . . . . . . . . . . . . . . . . . . . . $616,567 $296,228 $35,629 $948,424
For the Year Ended December 31 2018
FinancialServices
Benefits &Insurance
NationalPractices Consolidated
Accounting, tax, advisory and consulting . . . . . . . $600,926 $ — $ — $600,926Core Benefits and Insurance Services . . . . . . . . . . — 276,496 — 276,496Non-core Benefits and Insurance Services . . . . . . . — 11,941 — 11,941Managed networking, hardware services . . . . . . . . — — 24,404 24,404National Practices consulting . . . . . . . . . . . . . . . . . — — 8,236 8,236
Total revenue . . . . . . . . . . . . . . . . . . . . . . . . . . $600,926 $288,437 $32,640 $922,003
F-15

CBIZ, INC. AND SUBSIDIARIES
NOTES TO THE CONSOLIDATED FINANCIAL STATEMENTS — (continued)
Financial Services
Revenue primarily consists of professional service fees derived from traditional accounting services, tax returnpreparation, administrative services, financial and risk advisory, consulting and valuation services. Clients arebilled for these services based upon a fixed-fee, an hourly rate, or an outcome-based fee. Time related to theperformance of all services is maintained in a time and billing system.
Revenue for fixed-fee arrangements is recognized over time with the performance obligation measured in hoursworked and anticipated realization. Anticipated realization is defined as the fixed fee divided by the product ofthe hours anticipated to complete a performance obligation and the standard billing rate. Anticipated realizationrates are applied to hours charged to a contract when recognizing revenue. At the end of each reporting period,we evaluate the work performed to date to ensure that the amount of revenue recognized in each reporting periodfor the client arrangement is equal to the performance obligations met.
Time and expense arrangement revenue is recognized over time with progress measured towards completion withvalue being transferred through our hourly fee arrangement at expected net realizable rates per hour, plus agreed-upon out-of-pocket expenses. The cumulative impact on any subsequent revision in the estimated realizablevalue of unbilled fees for a particular client project is reflected in the period in which the change becomesknown.
Prior to recognizing revenue for outcome-based arrangement, we estimate the transaction price, includingvariable consideration that is subject to a constraint based on risks specific to the arrangement. We evaluate theestimate in each reporting period and recognize revenue to the extent it is probable that a significant reversal ofrevenue will not occur. Revenue is recognized when the constraint is lifted at a point in time when the value isdetermined and verified by a third party.
Benefits and Insurance Services
Benefits and Insurance Services provides brokerage and consulting along lines of service which include grouphealth benefits consulting and brokerage, property and casualty brokerage, retirement plan advisory, payroll,human capital management, actuarial, life insurance and other related services. Revenue consists primarily of feeincome for administering health and retirement plans and brokerage commissions. Revenue also includesinvestment income related to client payroll funds that are held in CBIZ accounts, as is industry practice. Wecapitalize the cost to obtain a contract unless the contract period is one year or less. We pay commissionsmonthly and require the recipient of the commission to be employed by us at the time of the payment. Failure toremain employed at the date the commission is payable results in the forfeiture of commissions that wouldotherwise be due. Therefore, we have determined that the requirement of continued employment is substantiveand accordingly, do not consider the commissions to be incremental costs of obtaining the customer contract andconsequently a contract acquisition cost is not recognized for those commissions.
Revenue related to group health benefits consulting consists of (i) commissions, (ii) fee income which can befixed or variable based on a price per participant and (iii) contingent revenue.
• Commission revenue and fee income are recognized over the contract period as these services areprovided to clients continuously throughout the term of the arrangement. Our customers benefit fromeach month of service on its own and although volume and the number of participants may differ monthto month, our obligation to perform substantially remains the same.
• Contingent revenue arrangements are related to carrier-based performance targets. Due to the uncertaintyof the outcome and the probability that a change in estimate would result in a significant reversal of
F-16

CBIZ, INC. AND SUBSIDIARIES
NOTES TO THE CONSOLIDATED FINANCIAL STATEMENTS — (continued)
revenue, we have applied a constraint on recording contingent revenue. Revenue is recognized when theconstraint has been lifted which is the earlier of written notification from a carrier that the target has beenachieved or cash collection. Contingent revenue is not a significant revenue stream to our consolidatedfinancial position or results of operations.
Revenue related to property and casualty consists of (i) commissions and (ii) contingent revenue.
• Commissions relating to agency billing arrangements (pursuant to which we bill the insured, collect thefunds and forward the premium to the insurance carrier less our commission) and direct billingarrangements (pursuant to which the insurance carrier bills the insured directly and forwards thecommission to us) are both recognized on the effective date of the policy. Commission revenue isreported net of reserves for estimated policy cancellations and terminations. The cancellation andtermination reserve is based upon estimates and assumptions using historical cancellation and terminationexperience and other current factors to project future experience.
• Contingent revenue arrangements related to carrier-based performance targets include claim lossexperience and other factors. Due to the uncertainty of the outcome and the probability that a change inestimate would result in a significant reversal of revenue, we have applied a constraint on recordingcontingent revenue. Revenue is recognized when the constraint has been lifted which is the earlier ofwritten notification from a carrier that the target has been achieved or cash collection. Contingent revenueis not a significant revenue stream to our consolidated financial position or results of operations.
Revenue related to retirement plan services consist of advisory, third party administration and actuarial services.
• Advisory revenue is based on the value of assets under management, as provided by a third party,multiplied by an agreed upon rate. Advisory services revenue is calculated monthly or quarterly based onthe estimated value of assets under management, as it is earned over the duration of the reporting periodand relates to performance obligations satisfied during that period. The variability related to the estimatedasset values used to recognize revenue during the reporting period is resolved and the amount of relatedrevenue recognized is adjusted when the actual value of assets under management is known.
• Third party administration revenue is recognized over the contract period as these services are provided toclients continuously throughout the term of the arrangement. Our clients benefit from each month ofservice on its own, and although the volume of tasks may differ month to month, our obligation toperform substantially remains the same.
• Actuarial revenue is recognized over the contract period with performance measured in hours in relationto the expected total hours. Under certain defined benefit plan administration arrangements, we chargenew clients an initial, non-refundable, set-up fee as part of a multi-year service agreement. Revenue andcosts related to the set-up fees are deferred and recognized over the life of the contract or the expectedcustomer relationship, whichever is longer.
Revenue related to payroll processing consists of a (i) fixed fee or (ii) variable fee based on a price per employeeor check processed. Revenue is recognized when the actual payroll processing occurs. Our customers benefitfrom each month of service on its own and although volume and the variability may differ month to month, ourobligation to perform substantially remains the same.
Non-core Benefits and Insurance Services consists of transactional businesses that tend to fluctuate. Theseinclude life insurance, wholesale benefits agency and talent and compensation services.
F-17

CBIZ, INC. AND SUBSIDIARIES
NOTES TO THE CONSOLIDATED FINANCIAL STATEMENTS — (continued)
National Practices
Managed networking, hardware services revenue consists of installation, maintenance and repair of computerhardware. These services are charged to a single customer based on cost plus an agreed-upon markup percentage,which has existed since 1999.
National Practices consulting revenue is based upon a fixed fee, an hourly rate, or outcome-based. Revenue forfixed fee and time and expense arrangements is recognized over the performance period based upon actual hoursincurred, while revenue for outcome-based arrangements is recognized similar to the outcome-basedarrangements in the Financial Services practice group.
Transaction Price Allocated to Future Obligations — The revenue recognition standard requires thedisclosure of the aggregate amount of transaction price allocated to performance obligations that have not yetbeen satisfied as of the reporting date. The guidance provides certain practical expedients that limit thisrequirement, including performance obligations that are part of a contract that is one year or less. Since themajority of our contracts are one year or less, we have applied this practical expedient related to quantifyingremaining performance obligations. In regards to contracts with terms in excess of one year, certain contractperiods related to our government healthcare consulting, group health and benefits consulting, and property andcasualty insurance businesses have an original specified contract duration in excess of one year, however, theagreements provide CBIZ and the client with the right to cancel or terminate the contract with no substantialpenalty. We have applied the provisions of Topic 606 and the FASB Transition Resource Group memo number10-14, and note that the definition of contract duration does not extend beyond the goods and services alreadytransferred for contracts that provide both the Company and the client with the right to cancel or terminate thecontract with no substantial penalty.
NOTE 3. ACCOUNTS RECEIVABLE, NET
Accounts receivable, net balances at December 31, 2020 and 2019 were as follows (in thousands):
2020 2019
Trade accounts receivable . . . . . . . . . . . . . . . . . . . . . . . . . . . . . . . . . . . . . . . . . $167,575 $176,375Unbilled revenue, at net realizable value . . . . . . . . . . . . . . . . . . . . . . . . . . . . . 63,494 60,035
Total accounts receivable . . . . . . . . . . . . . . . . . . . . . . . . . . . . . . . . . . . . . . . 231,069 236,410Allowance for doubtful accounts . . . . . . . . . . . . . . . . . . . . . . . . . . . . . . . . . . . (14,894) (14,379)
Accounts receivable, net . . . . . . . . . . . . . . . . . . . . . . . . . . . . . . . . . . . . . . . . $216,175 $222,031
Changes in the allowance for doubtful accounts on accounts receivable are as follows (in thousands):
2020 2019 2018
Balance at beginning of period . . . . . . . . . . . . . . . . . . . . . . . . . . . $(14,379) $(13,389) $(13,827)Provision . . . . . . . . . . . . . . . . . . . . . . . . . . . . . . . . . . . . . . . . . . . . . (9,323) (8,433) (7,052)Charge-offs, net of recoveries . . . . . . . . . . . . . . . . . . . . . . . . . . . . 8,808 7,443 7,490
Balance at end of period . . . . . . . . . . . . . . . . . . . . . . . . . . . . . . . . . $(14,894) $(14,379) $(13,389)
F-18

CBIZ, INC. AND SUBSIDIARIES
NOTES TO THE CONSOLIDATED FINANCIAL STATEMENTS — (continued)
NOTE 4. PROPERTY AND EQUIPMENT, NET
Property and equipment, net at December 31, 2020 and 2019 consisted of the following (in thousands):
2020 2019
Buildings and leasehold improvements . . . . . . . . . . . . . . . . . . . . . . . . . . . . . . $ 37,022 $ 33,284Furniture and fixtures . . . . . . . . . . . . . . . . . . . . . . . . . . . . . . . . . . . . . . . . . . . . 28,006 27,560Capitalized software . . . . . . . . . . . . . . . . . . . . . . . . . . . . . . . . . . . . . . . . . . . . . 34,503 37,203Equipment . . . . . . . . . . . . . . . . . . . . . . . . . . . . . . . . . . . . . . . . . . . . . . . . . . . . . 23,467 21,088
Total property and equipment . . . . . . . . . . . . . . . . . . . . . . . . . . . . . . . . . . . . 122,998 119,135Accumulated depreciation . . . . . . . . . . . . . . . . . . . . . . . . . . . . . . . . . . . . . . . . . (81,652) (79,723)
Property and equipment, net . . . . . . . . . . . . . . . . . . . . . . . . . . . . . . . . . . . . . $ 41,346 $ 39,412
Depreciation expense for property and equipment was $9.6 million, $8.3 million and $6.1 million in 2020, 2019and 2018, respectively.
NOTE 5. GOODWILL AND OTHER INTANGIBLE ASSETS, NET
A summary of changes in the carrying amount of goodwill by operating segment for the years endedDecember 31, 2020 and 2019 were as follows (in thousands):
FinancialServices
Benefits andInsuranceServices
NationalPractices
TotalGoodwill
December 31, 2018 . . . . . . . . . . . . . . . . . . . . . . . . . $329,626 $233,008 $1,666 $564,300Additions . . . . . . . . . . . . . . . . . . . . . . . . . . . . . . . . . 5,077 19,292 — 24,369Divestitures and other adjustment . . . . . . . . . . . . . . (456) — — (456)
December 31, 2019 . . . . . . . . . . . . . . . . . . . . . . . . . $334,247 $252,300 $1,666 $588,213
Additions . . . . . . . . . . . . . . . . . . . . . . . . . . . . . . . . . 34,785 62,654 — 97,439Divestitures and other adjustment . . . . . . . . . . . . . . (993) (1,576) — (2,569)
December 31, 2020 . . . . . . . . . . . . . . . . . . . . . . . . . $368,039 $313,378 $1,666 $683,083
We review goodwill at the reporting unit level at least annually, as of November 1, for impairment. We had fivereporting units at November 1, 2020. No goodwill impairment was recognized as a result of the annualevaluation.
F-19

CBIZ, INC. AND SUBSIDIARIES
NOTES TO THE CONSOLIDATED FINANCIAL STATEMENTS — (continued)
The components of goodwill and other intangible assets, net at December 31, 2020 and 2019 were as follows (inthousands):
2020 2019
Goodwill . . . . . . . . . . . . . . . . . . . . . . . . . . . . . . . . . . . . . . . . . . . . . . . . . . . . . $ 683,083 $ 588,213Intangibles :
Client lists . . . . . . . . . . . . . . . . . . . . . . . . . . . . . . . . . . . . . . . . . . . . . . . . . . 207,084 188,898Other intangibles . . . . . . . . . . . . . . . . . . . . . . . . . . . . . . . . . . . . . . . . . . . . . 11,244 9,882
Total intangibles . . . . . . . . . . . . . . . . . . . . . . . . . . . . . . . . . . . . . . . . . . . 218,328 198,780
Total goodwill and other intangibles assets . . . . . . . . . . . . . . . . . . . . 901,411 786,993Accumulated amortization:
Client lists . . . . . . . . . . . . . . . . . . . . . . . . . . . . . . . . . . . . . . . . . . . . . . . . . . (137,284) (125,887)Other intangibles . . . . . . . . . . . . . . . . . . . . . . . . . . . . . . . . . . . . . . . . . . . . . (7,377) (6,435)
Total accumulated amortization . . . . . . . . . . . . . . . . . . . . . . . . . . . . . . . (144,661) (132,322)
Goodwill and other intangible assets, net . . . . . . . . . . . . . . . . . . . . . . $ 756,750 $ 654,671
Amortization expense for client lists and other intangible assets was $13.6 million, $14.1 million and$17.5 million in 2020, 2019 and 2018, respectively. The weighted-average useful lives of total intangible assets,client lists and other intangible assets were 6.8 years, 6.5 years and 6.8 years, respectively. Other intangibleassets are amortized over periods ranging from 2 to 10 years. Based on the amount of intangible assets subject toamortization at
December 31, 2020, the estimated amortization expense is $14.0 million for 2021, $12.3 million for 2022,$11.1 million for 2023, $9.6 million for 2024 and $8.2 million for 2025.
NOTE 6. FINANCIAL INSTRUMENTS
The carrying amounts of our cash and cash equivalents, accounts receivable and accounts payable approximatefair value because of the short maturity of these instruments and are classified as Level 1 in the fair valuehierarchy. The carrying value of bank debt approximates fair value, as the interest rate on the bank debt isvariable and approximates current market rates. As a result, the fair value measurement of our bank debt isclassified as Level 2 in the fair value hierarchy.
Concentrations of Credit Risk — Financial instruments that may subject us to concentration of credit riskconsist primarily of cash and cash equivalents and accounts receivable. We place our cash and cash equivalentswith highly-rated financial institutions, limiting the amount of credit exposure with any one financial institution.Our client base consists of large numbers of geographically diverse customers dispersed throughout the UnitedStates; thus, concentration of credit risk with respect to accounts receivable is not significant.
Available-For-Sale Debt Securities — Available-for-sale debt securities consist primarily of corporate andmunicipal bonds and US treasury bills. The net par values of these securities total $24.9 million and$58.9 million at December 31, 2020 and 2019, respectively. The bonds have maturity dates or callable datesranging from January 2021 through November 2024, and are included in “Funds held for clients — current” inthe accompanying Consolidated Balance Sheets based on our intent and ability to sell these investments at anytime under favorable conditions.
At December 31, 2020, unrealized losses on the securities totaling approximately $0.1 million have not beenrecognized as a credit loss because the bonds are investment grade quality and management is not required or
F-20

CBIZ, INC. AND SUBSIDIARIES
NOTES TO THE CONSOLIDATED FINANCIAL STATEMENTS — (continued)
does not intend to sell prior to an expected recovery in value. The bond issuers continue to make timely principaland interest payments.
The following table summarizes our bond activity for the years ended December 31, 2020 and 2019 (inthousands):
2020 2019
Fair value at January 1 . . . . . . . . . . . . . . . . . . . . . . . . . . . . $ 60,659 $ 56,556Purchases . . . . . . . . . . . . . . . . . . . . . . . . . . . . . . . . . . . . 3,447 27,216Sales . . . . . . . . . . . . . . . . . . . . . . . . . . . . . . . . . . . . . . . . (22,078) (1,686)Maturities and calls . . . . . . . . . . . . . . . . . . . . . . . . . . . . . (15,409) (22,272)Decrease in bond premium . . . . . . . . . . . . . . . . . . . . . . . (857) (460)Fair market value adjustment . . . . . . . . . . . . . . . . . . . . . (54) 1,305
Fair value at December 31 . . . . . . . . . . . . . . . . . . . . . . . . . $ 25,708 $ 60,659
In addition to the available-for-sale securities discussed above, we also held certified deposits and otherdepository assets in the amount of $2.5 million at December 31, 2019. We did not have any depository items atDecember 31, 2020.
Interest Rate Swaps — We utilize interest rate swaps to manage interest rate risk exposure associated with ourfloating-rate debt under the 2018 credit facility, or the forecasted acquisition of such liability. Under theseinterest rate swap contracts, we receive cash flows from counterparties at variable rates based on LIBOR and paythe counterparties a fixed rate. To mitigate counterparty credit risk, we only enter into contracts with selectedmajor financial institutions with investment grade ratings and continually assess their creditworthiness. There areno credit risk-related contingent features in our interest rate swaps nor do the swaps contain provisions underwhich we would be required to post collateral. We do not purchase or hold any derivative instruments for tradingor speculative purposes.
The designation of a derivative instrument as a hedge and its ability to meet the hedge accounting criteriadetermine how we reflect the change in fair value of the derivative instrument. A derivative qualifies for hedgeaccounting treatment if, at inception, it meets defined correlation and effectiveness criteria. These criteria requirethat the anticipated cash flows and/or changes in fair value of the hedging instrument substantially offset those ofthe position being hedged.
We had no fair value hedging instruments at December 31, 2020 or 2019. Our interest rate swaps are designatedas cash flow hedges. Accordingly, the interest rate swaps are recorded as either an asset or liability in theaccompanying Consolidated Balance Sheets at fair value. The mark-to-market gains or losses on the swaps aredeferred and included as a component of accumulated other comprehensive loss (“AOCL”), net of tax, to theextent the hedge is determined to be effective, and reclassified to interest expense in the same period duringwhich the hedged transaction affects earnings. The interest rate swaps are assessed for effectiveness andcontinued qualification for hedge accounting on a quarterly basis. For the years ended December 31, 2020 and2019, the interest rate swaps were deemed to be highly effective.
F-21

CBIZ, INC. AND SUBSIDIARIES
NOTES TO THE CONSOLIDATED FINANCIAL STATEMENTS — (continued)
The following table summarizes our outstanding interest rate swaps and their classification in the accompanyingConsolidated Balance Sheets at December 31, 2020 and 2019 (in thousands). Refer to Note 7, Fair ValueMeasurements, to the accompanying consolidated financial statements for additional disclosures regarding fairvalue measurements.
December 31, 2020
NotionalAmount
FairValue
Balance SheetLocation
Interest rate swap . . . . . . . . . . . . . . . . . . . . . . . . . $10,000 $ (13) Other current liabilityInterest rate swaps . . . . . . . . . . . . . . . . . . . . . . . . $85,000 $(2,552) Other non-current liabilities
December 31, 2019
NotionalAmount
FairValue
Balance SheetLocation
Interest rate swaps . . . . . . . . . . . . . . . . . . . . . . . . $45,000 $ (591) Other non-current liabilitiesInterest rate swap . . . . . . . . . . . . . . . . . . . . . . . . . $25,000 $ 66 Other current assets
During 2020, we entered into a new 5-year interest rate swap with a notional value of $50.0 million andterminated one interest rate swap with a notional value of $25.0 million. As of December 31, 2020, we have fourinterest rate swaps outstanding. Under the terms of the interest rate swaps, we pay interest at a fixed rate ofinterest plus applicable margin as stated in the agreement, and receive interest that varies with the one-monthLIBOR. The notional value, fixed rate of interest and expiration date of each interest rate swap as ofDecember 31, 2020 is (i) $10 million — 1.120% — February, 2021, (ii) $20 million — 1.770% — May, 2022,(iii) $15 million — 2.640% — June, 2023 and (iv) $50.0 million — 0.885% — April, 2025.
During the next twelve months, the amount of the December 31, 2020 AOCL balance that will be reclassified toearnings is expected to be immaterial. The following table summarizes the effects of the interest rate swap on ouraccompanying Consolidated Statements of Comprehensive Income for the years ended December 31, 2020 and2019 (in thousands):
Loss recognizedin AOCL, net of tax
(Loss) Gain reclassifiedfrom AOCL into expense
Location
Twelve Months EndedDecember 31,
Twelve Months EndedDecember 31,
2020 2019 2020 2019
Interest rate swaps . . . . . . . . . $(1,525) $(1,222) $(974) $399 Interest expense
NOTE 7. FAIR VALUE MEASUREMENTS
FASB ASC Topic 820, Fair Value Measurements and Disclosures, establishes a fair value hierarchy that requiresus to maximize the use of observable inputs and minimize the use of unobservable inputs when measuring fairvalue. Fair value is defined as the price that would be received on the sale of an asset or paid to transfer a liabilityin an orderly transaction between market participants at the measurement date (exit price). The inputs used tomeasure fair value are classified into the following hierarchy:
• Level 1 — Unadjusted quoted prices in active markets for identical assets or liabilities
• Level 2 — Unadjusted quoted prices in active markets for similar assets or liabilities, or unadjustedquoted prices for identical or similar assets or liabilities in markets that are not active, or inputs other thanquoted prices that are observable for the asset or liability
• Level 3 — Unobservable inputs for the asset or liability
F-22

CBIZ, INC. AND SUBSIDIARIES
NOTES TO THE CONSOLIDATED FINANCIAL STATEMENTS — (continued)
We endeavor to utilize the best available information in measuring fair value. Financial assets and liabilities areclassified in their entirety based on the lowest level of input that is significant to the fair value measurement. Ascircumstances change, we will reassess the level in which the inputs are included in the fair value hierarchy.
For the years ended December 31, 2020 and 2019, there were no transfers between the valuation hierarchy Levels1, 2 and 3. The following table summarizes our assets and liabilities at December 31, 2020 and 2019 that aremeasured at fair value on a recurring basis subsequent to initial recognition and indicates the fair value hierarchyof the valuation techniques utilized by us to determine such fair value (in thousands):
LevelDecember 31,
2020December 31,
2019
Deferred compensation plan assets . . . . . . . . . . . . . . . . . . . . . . . . . . . . . . . . . . 1 127,332 106,851Available-for-sale debt securities . . . . . . . . . . . . . . . . . . . . . . . . . . . . . . . . . . . . 1 25,708 60,659Deferred compensation plan liabilities . . . . . . . . . . . . . . . . . . . . . . . . . . . . . . . . 1 (127,332) (106,851)Interest rate swaps, net . . . . . . . . . . . . . . . . . . . . . . . . . . . . . . . . . . . . . . . . . . . . 2 (2,565) (525)Contingent purchase price liabilities . . . . . . . . . . . . . . . . . . . . . . . . . . . . . . . . . 3 (54,391) (32,089)
Contingent Purchase Price Liabilities — During the years ended December 31, 2020 and 2019, we recordedincome of $0.6 million and expense of $1.6 million, respectively, due to accretion, adjusting for expected resultsof acquired businesses and the revaluation of stock related to contingent payments. These changes are included inOther income (expense), net in the accompanying Consolidated Statements of Comprehensive Income. Refer toNote 18, Business Combinations, for further discussion of our acquisitions and contingent purchase priceliabilities.
The following table summarizes the change in fair value of our contingent purchase price liabilities identified asLevel 3 for the years ended December 31, 2020 and 2019 (pre-tax basis, in thousands):
ContingentPurchase Price
Liabilities
Beginning balance — January 1, 2019 . . . . . . . . . . . . . . . . . . . . . . . . . . . . . . . . . . . . . . . $(39,708)Additions from business acquisitions . . . . . . . . . . . . . . . . . . . . . . . . . . . . . . . . . . . . . . (10,150)Settlement of contingent purchase price payable . . . . . . . . . . . . . . . . . . . . . . . . . . . . . 19,368Change in fair value of contingency . . . . . . . . . . . . . . . . . . . . . . . . . . . . . . . . . . . . . . . (865)Change in net present value of contingency . . . . . . . . . . . . . . . . . . . . . . . . . . . . . . . . . (734)
Balance — December 31, 2019 . . . . . . . . . . . . . . . . . . . . . . . . . . . . . . . . . . . . . . . . . . . . $(32,089)Additions from business acquisitions . . . . . . . . . . . . . . . . . . . . . . . . . . . . . . . . . . . . . . (37,617)Settlement of contingent purchase price payable . . . . . . . . . . . . . . . . . . . . . . . . . . . . . 14,686Change in fair value of contingency . . . . . . . . . . . . . . . . . . . . . . . . . . . . . . . . . . . . . . . 1,396Change in net present value of contingency . . . . . . . . . . . . . . . . . . . . . . . . . . . . . . . . . (767)
Balance — December 31, 2020 . . . . . . . . . . . . . . . . . . . . . . . . . . . . . . . . . . . . . . . . . . . . $(54,391)
F-23

CBIZ, INC. AND SUBSIDIARIES
NOTES TO THE CONSOLIDATED FINANCIAL STATEMENTS — (continued)
NOTE 8. INCOME TAXES
For financial reporting purposes, income from continuing operations before income taxes includes the followingcomponents (in thousands):
2020 2019 2018
United States . . . . . . . . . . . . . . . . . . . . . . . . . . . . . . . . . . . . . . . . . . $103,306 $92,710 $79,669Foreign (Canada) . . . . . . . . . . . . . . . . . . . . . . . . . . . . . . . . . . . . . . . 182 179 171
Total . . . . . . . . . . . . . . . . . . . . . . . . . . . . . . . . . . . . . . . . . . . . . . . $103,488 $92,889 $79,840
Income tax expense (benefit) included in the accompanying Consolidated Statements of Comprehensive Incomefor the years ended December 31, 2020, 2019 and 2018 was as follows (in thousands):
2020 2019 2018
Continuing operations:Current:
Federal . . . . . . . . . . . . . . . . . . . . . . . . . . . . . . . . . . . . . . . . . . . . $21,926 $12,776 $12,626Foreign . . . . . . . . . . . . . . . . . . . . . . . . . . . . . . . . . . . . . . . . . . . . 78 48 45State and local . . . . . . . . . . . . . . . . . . . . . . . . . . . . . . . . . . . . . . 5,584 4,110 2,808
Total . . . . . . . . . . . . . . . . . . . . . . . . . . . . . . . . . . . . . . . . . . . . 27,588 16,934 15,479Deferred:
Federal . . . . . . . . . . . . . . . . . . . . . . . . . . . . . . . . . . . . . . . . . . . . (1,968) 3,685 2,047State and local . . . . . . . . . . . . . . . . . . . . . . . . . . . . . . . . . . . . . . (479) 1,221 741
Total . . . . . . . . . . . . . . . . . . . . . . . . . . . . . . . . . . . . . . . . . . . . (2,447) 4,906 2,788
Total income tax expense from continuing operations . . . 25,141 21,840 18,267Discontinued operations:
Operations of discontinued operations:Current . . . . . . . . . . . . . . . . . . . . . . . . . . . . . . . . . . . . . . . . . . . . (11) (107) 2Deferred . . . . . . . . . . . . . . . . . . . . . . . . . . . . . . . . . . . . . . . . . . . — (1) (1)
Total income tax expense from discontinued operations . . . . (11) (108) 1
Total income tax expense . . . . . . . . . . . . . . . . . . . . . . . . . . $25,130 $21,732 $18,268
F-24

CBIZ, INC. AND SUBSIDIARIES
NOTES TO THE CONSOLIDATED FINANCIAL STATEMENTS — (continued)
The provision for income taxes attributable to income from continuing operations differed from the amountobtained by applying the federal statutory income tax rate to income from continuing operations before incometaxes, as follows (in thousands, except percentages):
2020 2019 2018
Tax at U.S. federal statutory rates . . . . . . . . . . . . . . . . . . . . . . . . . . . $21,733 $19,507 $16,766State taxes (net of federal benefit) . . . . . . . . . . . . . . . . . . . . . . . . . . . 5,354 4,774 3,745Business meals and entertainment — non-deductible . . . . . . . . . . . . 458 987 915Change in valuation allowance . . . . . . . . . . . . . . . . . . . . . . . . . . . . . 176 932 264Reserves for uncertain tax positions . . . . . . . . . . . . . . . . . . . . . . . . . (1,290) (263) (1,124)Share-based compensation . . . . . . . . . . . . . . . . . . . . . . . . . . . . . . . . . (2,394) (4,773) (3,260)Non-deductible expenses . . . . . . . . . . . . . . . . . . . . . . . . . . . . . . . . . . 787 713 785Other, net . . . . . . . . . . . . . . . . . . . . . . . . . . . . . . . . . . . . . . . . . . . . . . 317 (37) 176
Provision for income taxes from continuing operations . . . . . . . . . . $25,141 $21,840 $18,267
Effective income tax rate . . . . . . . . . . . . . . . . . . . . . . . . . . . . . . . . . . 24.3% 23.5% 22.9%
The tax effects of temporary differences that gave rise to significant portions of the deferred tax assets anddeferred tax liabilities at December 31, 2020 and 2019, were as follows (in thousands):
2020 2019
Deferred tax assets:Net operating loss carryforwards . . . . . . . . . . . . . . . . . . . . . . . . . . . . . . . . . . . $ 1,249 $ 1,594Allowance for doubtful accounts . . . . . . . . . . . . . . . . . . . . . . . . . . . . . . . . . . . 3,288 3,156Employee benefits and compensation . . . . . . . . . . . . . . . . . . . . . . . . . . . . . . . 30,151 26,442Lease costs . . . . . . . . . . . . . . . . . . . . . . . . . . . . . . . . . . . . . . . . . . . . . . . . . . . . 6,291 4,889State tax credit carryforwards . . . . . . . . . . . . . . . . . . . . . . . . . . . . . . . . . . . . . 1,291 1,322Deferral of employer FICA taxes . . . . . . . . . . . . . . . . . . . . . . . . . . . . . . . . . . 3,983 —Other deferred tax assets . . . . . . . . . . . . . . . . . . . . . . . . . . . . . . . . . . . . . . . . . 424 30
Total gross deferred tax assets . . . . . . . . . . . . . . . . . . . . . . . . . . . . . . . . . . . 46,677 37,433Less: valuation allowance . . . . . . . . . . . . . . . . . . . . . . . . . . . . . . . . . . . . . . (2,663) (2,799)
Total deferred tax assets, net . . . . . . . . . . . . . . . . . . . . . . . . . . . . . . . . . . 44,014 34,634Deferred tax liabilities:
Client list intangible assets . . . . . . . . . . . . . . . . . . . . . . . . . . . . . . . . . . . . . . . 524 846Goodwill and other intangibles . . . . . . . . . . . . . . . . . . . . . . . . . . . . . . . . . . . . 49,680 42,496Property and equipment . . . . . . . . . . . . . . . . . . . . . . . . . . . . . . . . . . . . . . . . . . 2,071 2,291Other deferred tax liabilities . . . . . . . . . . . . . . . . . . . . . . . . . . . . . . . . . . . . . . 491 721
Total gross deferred tax liabilities . . . . . . . . . . . . . . . . . . . . . . . . . . . . . . . . 52,766 46,354
Net deferred tax liability . . . . . . . . . . . . . . . . . . . . . . . . . . . . . . . . . . . . . $ (8,752) $(11,720)
We have established valuation allowances for deferred tax assets related to certain employee benefits andcompensation, state net operating loss (“NOL”) carryforwards and state income tax credit carryforwards atDecember 31, 2020 and December 31, 2019. The net decrease in the valuation allowance of $0.1 million for theyear ended December 31, 2020 primarily related to changes in the valuation allowance for NOLs.
In assessing the realization of deferred tax assets, management considers all available positive and negativeevidence, including projected future taxable income, scheduled reversal of deferred tax liabilities, historical
F-25

CBIZ, INC. AND SUBSIDIARIES
NOTES TO THE CONSOLIDATED FINANCIAL STATEMENTS — (continued)
financial operations and tax planning strategies. Based upon review of these items, management believes it ismore-likely-than-not that the Company will realize the benefits of these deferred tax assets, net of the existingvaluation allowances.
We file income tax returns in the United States, Canada, and most state jurisdictions. With limited exceptions,our state and local income tax returns and non-U.S. income tax returns are no longer subject to tax authorityexaminations for years ending prior to January 1, 2016 and January 1, 2015, respectively.
The availability of NOLs and state tax credits are reported as deferred tax assets, net of applicable valuationallowances, in the accompanying Consolidated Balance Sheets. At December 31, 2020, we had state netoperating loss carryforwards of $34.4 million and state tax credit carryforwards of $1.3 million. The state netoperating loss carryforwards expire on various dates between 2021 and 2040 and the state tax creditcarryforwards expire on various dates between 2021 and 2029.
A reconciliation of the beginning and ending amount of unrecognized tax benefits is as follows (in thousands):
2020 2019 2018
Balance at January 1 . . . . . . . . . . . . . . . . . . . . . . . . . . . . . . . . . . . . . . . $ 2,536 $2,819 $ 3,882Additions for tax positions of the current year . . . . . . . . . . . . . . . . . 150 145 119Settlements of prior year positions . . . . . . . . . . . . . . . . . . . . . . . . . . — (282) (16)Lapse of statutes of limitation . . . . . . . . . . . . . . . . . . . . . . . . . . . . . . (1,150) (146) (1,166)
Balance at December 31 . . . . . . . . . . . . . . . . . . . . . . . . . . . . . . . . . . . . $ 1,536 $2,536 $ 2,819
Included in the balance of unrecognized tax benefits at December 31, 2020 are $0.9 million of unrecognized taxbenefits that, if recognized, would affect the effective tax rate. We believe it is reasonably possible that certain ofthese unrecognized tax benefits could change in the next twelve months. We expect reductions in the liability forunrecognized tax benefits of approximately $0.5 million within the next twelve months due to expiration ofstatutes of limitation. Given the number of years that are currently subject to examination, we are unable toestimate the range of potential adjustments to the remaining balance of unrecognized tax benefits at this time.
We recognize interest expense, and penalties related to unrecognized tax benefits as a component of income taxexpense. During 2020, we recorded an immaterial decrease in accrued interest, and, as of December 31, 2020, wehad recognized a liability for interest expense and penalties of $0.4 million and $0.2 million, respectively,relating to unrecognized tax benefits. During 2019, we accrued interest expense of less than $0.1 million and, asof December 31, 2019, had recognized a liability for interest expense and penalties of $0.7 million and$0.2 million, respectively, relating to unrecognized tax benefits.
F-26

CBIZ, INC. AND SUBSIDIARIES
NOTES TO THE CONSOLIDATED FINANCIAL STATEMENTS — (continued)
NOTE 9. DEBT AND FINANCING ARRANGEMENTS
2018 credit facility
Our primary financing arrangement is the 2018 credit facility, which provides us with the capital necessary tomeet our working capital needs as well as the flexibility to continue with our strategic initiatives, includingbusiness acquisitions and share repurchases. The 2018 credit facility matures on April 3, 2023. The balanceoutstanding under the 2018 credit facility was $108.0 million and $105.5 million at December 31, 2020 and2019, respectively. Effective interest rates, including the impact of interest rate swaps associated with the 2018credit facility, were as follows:
2020 2019
Weighted average rates . . . . . . . . . . . . . . . . . . . . . . . . . . . . . . . . . . 2.45% 3.09%
Range of effective rates . . . . . . . . . . . . . . . . . . . . . . . . . . . . . . . . . . 1.10% - 4.75% 2.12% - 5.50%
We have approximately $286.4 million of available funds under the 2018 credit facility at December 31, 2020,based on the terms of the commitment. Available funds under the credit facility are based on a multiple ofearnings before interest, taxes, depreciation and amortization as defined in the credit facility, and are reduced byletters of credit, performance guarantees, other indebtedness and outstanding borrowings under the credit facility.Under the 2018 credit facility, loans are charged an interest rate consisting of a base rate or Eurodollar rate plusan applicable margin, letters of credit are charged based on the same applicable margin, and a commitment fee ischarged on the unused portion of the credit facility.
The 2018 credit facility contains certain restrictive covenants customary for facilities of this type, includingrestrictions on indebtedness, liens or other encumbrances, making certain payments, investments, or to sell orotherwise dispose of a substantial portion of assets, or to merge or consolidate with an unaffiliated entity. The2018 credit facility also limits our ability to make dividend payments. Historically, we have not paid cashdividends on our common stock and do not anticipate paying cash dividends in the foreseeable future. Our Boardof Directors has discretion over the payment and level of dividends on common stock, subject to the limitationsof the credit facility and applicable law. The credit facility contains a provision that, in the event of a definedchange in control, the credit facility may be terminated. In addition, the 2018 credit facility contains financialcovenants that require us to meet certain requirements with respect to (i) a total leverage ratio and (ii) minimumfixed charge coverage ratio which may limit our ability to borrow up to the total commitment amount. As ofDecember 31, 2020, we are in compliance with all covenants.
Other line of credit
We have an unsecured $20 million line of credit by and among CBIZ Benefits and Insurance, Inc., our whollyowned subsidiary, and the Huntington Bank. We utilize this line of credit to support our short-term fundingrequirements of payroll client fund obligations due to the investment of client funds, rather than liquidating clientfunds that have already been invested in available-for-sale securities. Refer to Note 6, Financial Instruments, forfurther discussion regarding these investments. The line of credit, which was renewed on August 6, 2020 and willterminate on August 5, 2021, did not have a balance outstanding at December 31, 2020 and 2019. Borrowingsunder the line of credit bear interest at the prime rate.
F-27

CBIZ, INC. AND SUBSIDIARIES
NOTES TO THE CONSOLIDATED FINANCIAL STATEMENTS — (continued)
Interest expense
Interest expense, including amortization of deferred financing costs, commitment fees, line of credit fees, andother applicable bank charges, was as follows (in thousands):
2020 2019 2018
2018 credit facility . . . . . . . . . . . . . . . . . . . . . . . . . . . . . . . . . . . . . . . . . . $4,919 $5,672 $6,509Other line of credit . . . . . . . . . . . . . . . . . . . . . . . . . . . . . . . . . . . . . . . . . . 1 22 1Other . . . . . . . . . . . . . . . . . . . . . . . . . . . . . . . . . . . . . . . . . . . . . . . . . . . . . 63 71 135
$4,983 $5,765 $6,645
NOTE 10. ACCUMULATED OTHER COMPREHENSIVE LOSS
The components of accumulated other comprehensive loss at December 31, 2020 and 2019 were as follows (inthousands):
2020 2019
Net unrealized gain on available-for-sale securities, net of income tax expense of$128 and $220, respectively . . . . . . . . . . . . . . . . . . . . . . . . . . . . . . . . . . . . . . . . . $ 351 $ 393
Net unrealized loss on interest rate swap, net of income tax benefit of $618 and$320, respectively . . . . . . . . . . . . . . . . . . . . . . . . . . . . . . . . . . . . . . . . . . . . . . . . . (1,900) (375)
Foreign currency translation . . . . . . . . . . . . . . . . . . . . . . . . . . . . . . . . . . . . . . . . . . . (720) (698)
Accumulated other comprehensive loss . . . . . . . . . . . . . . . . . . . . . . . . . . . . . . . . . . $(2,269) $(680)
NOTE 11. COMMITMENTS AND CONTINGENCIES
Acquisitions — The purchase price that we normally pay for businesses and client lists consists of twocomponents: an up-front non-contingent portion, and a portion which is contingent upon the acquired businessesor client lists’ future performance. The fair value of the contingent purchase price consideration is recorded at thedate of acquisition and re-measured each reporting period until the liability is settled. Shares of our commonstock that are issued in connection with acquisitions may be contractually restricted from sale for periods up toone year. Acquisitions are further disclosed in Note 18, Business Combinations.
Indemnifications — We have various agreements in which we may be obligated to indemnify the other partywith respect to certain matters. Generally, these indemnification clauses are included in contracts arising in thenormal course of business under which the Company customarily agrees to hold the other party harmless againstlosses arising from a breach of representations, warranties, covenants or agreements, related to matters such astitle to assets sold and certain tax matters. Payment by us under such indemnification clauses are generallyconditioned upon the other party making a claim. Such claims are typically subject to challenge by us and todispute resolution procedures specified in the particular contract. Further, our obligations under these agreementsmay be limited in terms of time and/or amount and, in some instances, we may have recourse against third partiesfor certain payments made by us. It is not possible to predict the maximum potential amount of future paymentsunder these indemnification agreements due to the conditional nature of our obligations and the unique facts ofeach particular agreement. Historically, we have not made any payments under these agreements that have beenmaterial individually or in the aggregate. As of December 31, 2020, we were not aware of any obligations arisingunder indemnification agreements that would require material payments, and therefore have not recorded aliability.
F-28
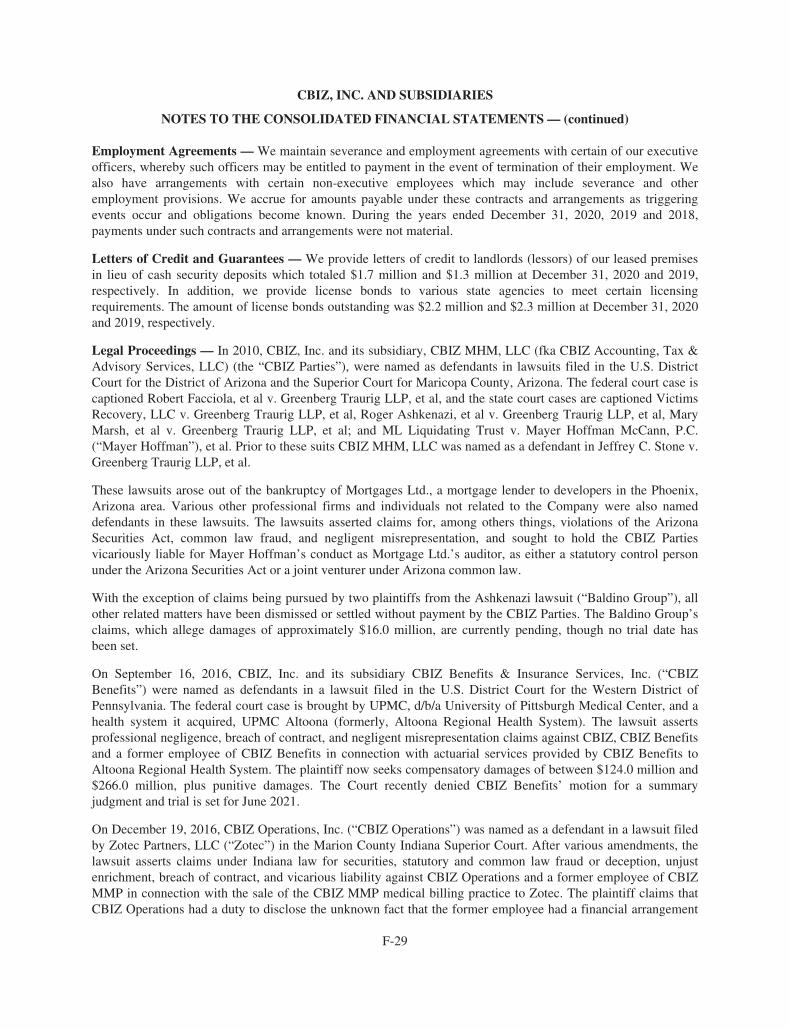
CBIZ, INC. AND SUBSIDIARIES
NOTES TO THE CONSOLIDATED FINANCIAL STATEMENTS — (continued)
Employment Agreements — We maintain severance and employment agreements with certain of our executiveofficers, whereby such officers may be entitled to payment in the event of termination of their employment. Wealso have arrangements with certain non-executive employees which may include severance and otheremployment provisions. We accrue for amounts payable under these contracts and arrangements as triggeringevents occur and obligations become known. During the years ended December 31, 2020, 2019 and 2018,payments under such contracts and arrangements were not material.
Letters of Credit and Guarantees — We provide letters of credit to landlords (lessors) of our leased premisesin lieu of cash security deposits which totaled $1.7 million and $1.3 million at December 31, 2020 and 2019,respectively. In addition, we provide license bonds to various state agencies to meet certain licensingrequirements. The amount of license bonds outstanding was $2.2 million and $2.3 million at December 31, 2020and 2019, respectively.
Legal Proceedings — In 2010, CBIZ, Inc. and its subsidiary, CBIZ MHM, LLC (fka CBIZ Accounting, Tax &Advisory Services, LLC) (the “CBIZ Parties”), were named as defendants in lawsuits filed in the U.S. DistrictCourt for the District of Arizona and the Superior Court for Maricopa County, Arizona. The federal court case iscaptioned Robert Facciola, et al v. Greenberg Traurig LLP, et al, and the state court cases are captioned VictimsRecovery, LLC v. Greenberg Traurig LLP, et al, Roger Ashkenazi, et al v. Greenberg Traurig LLP, et al, MaryMarsh, et al v. Greenberg Traurig LLP, et al; and ML Liquidating Trust v. Mayer Hoffman McCann, P.C.(“Mayer Hoffman”), et al. Prior to these suits CBIZ MHM, LLC was named as a defendant in Jeffrey C. Stone v.Greenberg Traurig LLP, et al.
These lawsuits arose out of the bankruptcy of Mortgages Ltd., a mortgage lender to developers in the Phoenix,Arizona area. Various other professional firms and individuals not related to the Company were also nameddefendants in these lawsuits. The lawsuits asserted claims for, among others things, violations of the ArizonaSecurities Act, common law fraud, and negligent misrepresentation, and sought to hold the CBIZ Partiesvicariously liable for Mayer Hoffman’s conduct as Mortgage Ltd.’s auditor, as either a statutory control personunder the Arizona Securities Act or a joint venturer under Arizona common law.
With the exception of claims being pursued by two plaintiffs from the Ashkenazi lawsuit (“Baldino Group”), allother related matters have been dismissed or settled without payment by the CBIZ Parties. The Baldino Group’sclaims, which allege damages of approximately $16.0 million, are currently pending, though no trial date hasbeen set.
On September 16, 2016, CBIZ, Inc. and its subsidiary CBIZ Benefits & Insurance Services, Inc. (“CBIZBenefits”) were named as defendants in a lawsuit filed in the U.S. District Court for the Western District ofPennsylvania. The federal court case is brought by UPMC, d/b/a University of Pittsburgh Medical Center, and ahealth system it acquired, UPMC Altoona (formerly, Altoona Regional Health System). The lawsuit assertsprofessional negligence, breach of contract, and negligent misrepresentation claims against CBIZ, CBIZ Benefitsand a former employee of CBIZ Benefits in connection with actuarial services provided by CBIZ Benefits toAltoona Regional Health System. The plaintiff now seeks compensatory damages of between $124.0 million and$266.0 million, plus punitive damages. The Court recently denied CBIZ Benefits’ motion for a summaryjudgment and trial is set for June 2021.
On December 19, 2016, CBIZ Operations, Inc. (“CBIZ Operations”) was named as a defendant in a lawsuit filedby Zotec Partners, LLC (“Zotec”) in the Marion County Indiana Superior Court. After various amendments, thelawsuit asserts claims under Indiana law for securities, statutory and common law fraud or deception, unjustenrichment, breach of contract, and vicarious liability against CBIZ Operations and a former employee of CBIZMMP in connection with the sale of the CBIZ MMP medical billing practice to Zotec. The plaintiff claims thatCBIZ Operations had a duty to disclose the unknown fact that the former employee had a financial arrangement
F-29

CBIZ, INC. AND SUBSIDIARIES
NOTES TO THE CONSOLIDATED FINANCIAL STATEMENTS — (continued)
with a Zotec vendor at the time CBIZ Operations sold CBIZ MMP to Zotec. The plaintiff is now seekingdamages of up to $177.0 million out of the $200.0 million transaction price. Trial is scheduled for August 2021.
We cannot predict the outcome of the above matters or estimate the possible loss or range of possible loss, if any.Although the proceedings are subject to uncertainties inherent in the litigation process and the ultimatedisposition of these proceedings is not presently determinable, we intend to vigorously defend these cases and webelieve we have meritorious defenses to these claims. In addition to those items disclosed above, we are, fromtime to time, subject to claims and suits arising in the ordinary course of business.
NOTE 12. EMPLOYEE BENEFITS
Employee Savings Plan — We sponsor a qualified 401(k) defined contribution plan that covers substantially allof our employees. Participating employees may elect to contribute, on a tax-deferred basis, up to 80% of theirpre-tax annual compensation (subject to a maximum permissible contribution under Section 401(k) of theInternal Revenue Code). Matching contributions by us are 50% of the first 6% of base compensation that theparticipant contributes, and additional amounts may be contributed at the discretion of the Board of Directors.Participants may elect to invest their contributions in various funds including: equity, fixed income, stable value,and balanced-lifecycle funds. Employer contributions (net of forfeitures) made to the plan during the years endedDecember 31, 2020, 2019 and 2018 were approximately $12.2 million, $11.1 million and $10.8 million,respectively.
Non-qualified Deferred Compensation Plan — We sponsor a non-qualified deferred compensation plan, underwhich certain members of management and other highly compensated employees may elect to defer receipt of aportion of their annual compensation, subject to maximum and minimum percentage limitations. The amount ofcompensation deferred under the plan is credited to each participant’s deferral account and a non-qualifieddeferred compensation plan obligation is established by us. An amount equal to each participant’s compensationdeferral is transferred into a rabbi trust and invested in various debt and equity securities as directed by theparticipants. The assets of the rabbi trust are held by us and recorded as “Assets of deferred compensation plan”in the accompanying Consolidated Balance Sheets.
Assets of the non-qualified deferred compensation plan consist primarily of investments in mutual funds, moneymarket funds and equity securities. The values of these investments are based on published market prices at theend of the period. Adjustments to the fair value of these investments are recorded in “Other income, net,” offsetby the same adjustments to compensation expense (recorded as “Operating expenses” or “G&A expenses” in theaccompanying Consolidated Statements of Comprehensive Income).
We recorded income of $15.4 million for the year ended December 31, 2020 and income of $19.2 million for theyear ended December 31, 2019 and expense of $4.9 million for the year ended December 31, 2018, related tothese investments. These investments are specifically designated as available to us solely for the purpose ofpaying benefits under the non-qualified deferred compensation plan. However, the investments in the rabbi trustswould be available to all unsecured general creditors in the event that we become insolvent.
Deferred compensation plan obligations represent amounts due to plan participants and consist of accumulatedparticipant deferrals and changes in fair value of investments thereon since the inception of the plan, net ofwithdrawals. This liability is an unsecured general obligation of ours and is recorded as “Deferred compensationplan obligations” in the accompanying Consolidated Balance Sheets.
The assets and liabilities related to the non-qualified deferred compensation plan at December 31, 2020 and 2019were $127.3 million and $106.9 million, respectively.
F-30

CBIZ, INC. AND SUBSIDIARIES
NOTES TO THE CONSOLIDATED FINANCIAL STATEMENTS — (continued)
NOTE 13. COMMON STOCK
Share Repurchase Program — Our Board of Directors approved various share repurchase programs that wereeffective during the years ended December 31, 2020, 2019 and 2018. Under these programs, shares may bepurchased in the open market or in privately negotiated transactions according to SEC rules.
The Share Repurchase Program does not obligate us to acquire any specific number of shares and may besuspended at any time. Repurchased shares are held in treasury and may be reserved for future use in connectionwith acquisitions, employee share plans and other general purposes. Under our credit facility, described in Note9, Debt and Financing Arrangements, share repurchases are unlimited when total leverage is less than 3.0. Whenleverage is greater than 3.0, the annual share repurchase is limited to $35.0 million.
Under the Share Repurchase Program, we repurchased 2.3 million and 1.2 million shares on the open market at acost (including fees and commissions) of $57.6 million and $25.3 million during the years ended December 31,2020 and 2019, respectively. Shares repurchased to settle statutory employee withholding related to vesting ofstock awards were 0.1 million shares at a cost of $2.0 million during the year ended December 31, 2020 and0.1 million shares at a cost of $1.9 million during the year ended December 31, 2019.
NOTE 14. EMPLOYEE STOCK PLANS
Employee Stock Purchase Plan — The 2007 Employee Stock Purchase Plan (“ESPP”), which has a terminationdate of June 30, 2022, allows qualified employees to purchase shares of common stock through payrolldeductions up to a limit of $25,000 of stock per calendar year. The price an employee pays for shares is 85% ofthe fair market value of our common stock on the last day of the purchase period. Purchase periods begin on thesixteenth day of the month and end on the fifteenth day of the subsequent month. Other than a one-year holdingperiod from the date of purchase, there are no vesting or other restrictions on the stock purchased by employeesunder the ESPP. The total number of shares of common stock that can be purchased under the ESPP shall notexceed 2.0 million shares.
Stock Awards — Effective May 9, 2019, the CBIZ shareholders approved CBIZ, Inc. 2019 Stock OmnibusIncentive Plan (“2019 Plan”), which amended and restated the CBIZ, Inc. 2014 Stock Incentive Plan (“2014Plan”), of which we have granted various stock-based awards through the year ended December 31, 2020.Effective January 1, 2020, the 2019 Plan replaced and superseded the 2014 Plan. The operating terms of the 2019Plan are substantially similar to those of the 2014 Plan. Under the 2019 Plan, which expires in 2029, a maximumof 3.1 million stock options, restricted stock or other stock based compensation awards may be granted. Sharessubject to award under the 2019 Plan may be either authorized but unissued shares of our common stock ortreasury shares. The terms and vesting schedules for the share-based awards vary by type and date of grant. AtDecember 31, 2020, approximately 2.7 million shares were available for future grant under the 2019 Plan.
During the years ended December 31, 2020, 2019 and 2018, we recognized compensation expense (beforeincome tax expense) for these awards as follows (in thousands):
2020 2019 2018
Stock options . . . . . . . . . . . . . . . . . . . . . . . . . . . . . . . . . . . . . . . . . . . . . . $1,878 $1,848 $2,609Restricted stock units and awards . . . . . . . . . . . . . . . . . . . . . . . . . . . . . . 4,960 4,375 4,257Performance share units . . . . . . . . . . . . . . . . . . . . . . . . . . . . . . . . . . . . . . 2,031 1,031 —
Total share-based compensation expense . . . . . . . . . . . . . . . . . . . . . . . . $8,869 $7,254 $6,866
F-31

CBIZ, INC. AND SUBSIDIARIES
NOTES TO THE CONSOLIDATED FINANCIAL STATEMENTS — (continued)
Stock Options — Certain employees and non-employee directors were granted stock options. Stock optionsawarded to non-employee directors have generally been granted with immediate vesting. Stock options awardedto employees are generally subject to a 25% incremental vesting schedule over a four-year period commencingfrom the date of grant. At the discretion of the Compensation Committee of the Board of Directors, optionsawarded under the 2019 Plan may vest in a time period shorter than four years. Stock options expire six yearsfrom the date of grant and are awarded with an exercise price equal to the market value of our common stock onthe date of grant. Stock options may be granted alone or in addition to other awards and may be of two types:incentive stock options and non-qualified stock options. During the year ended December 31, 2020, we granted50 thousand stock options to a non-employee director. We did not grant any stock options during the year endedDecember 31, 2019.
Stock option activity during the year ended December 31, 2020 was as follows (number of options in thousands):
Number ofOptions
WeightedAverageExercisePrice Per
Share
WeightedAverage
RemainingContractual
Term
AggregateIntrinsicValue (inmillions)
Outstanding at December 31, 2019 . . . . . . . . . . . . . 2,412 $13.58Granted . . . . . . . . . . . . . . . . . . . . . . . . . . . . . . . . . . . 50 $24.62Exercised . . . . . . . . . . . . . . . . . . . . . . . . . . . . . . . . . . (634) $10.23Expired or canceled . . . . . . . . . . . . . . . . . . . . . . . . . (8) $18.15
Outstanding at December 31, 2020 . . . . . . . . . . . . . 1,820 $15.02 2.28 years $21.1
Vested and exercisable at December 31, 2020 . . . . . 1,375 $14.00 2.04 years $17.3
• The weighted-average grant-date fair value of stock options granted during the years ended December 31,2020 and 2018 was $0.3 million and $3.0 million, respectively.
• The aggregate intrinsic value of stock options exercised during each of the years ended December 31,2020, 2019 and 2018 was $8.9 million, $18.8 million and $10.9 million, respectively. The intrinsic valueis calculated as the difference between our stock price on the exercise date and the exercise price of eachoption exercised.
• At December 31, 2020, we had unrecognized compensation cost for non-vested stock options of$1.1 million to be recognized over a weighted average period of approximately 0.97 years.
We utilized the Black-Scholes-Merton option-pricing model to determine the fair value of stock options on thedate of grant. The fair value of stock options granted during the years ended December 31, 2020 and 2018 were$5.79 and $4.73, respectively. The following weighted average assumptions were utilized:
2020 2018
Expected volatility (1) . . . . . . . . . . . . . . . . . . . . . . . . . . . . . . . . . . . . . . . . . . . . . . . . . . 27.27% 22.04%Expected option life (years) (2) . . . . . . . . . . . . . . . . . . . . . . . . . . . . . . . . . . . . . . . . . . . 4.67 4.62Risk-free interest rate (3) . . . . . . . . . . . . . . . . . . . . . . . . . . . . . . . . . . . . . . . . . . . . . . . 0.19% 2.80%Expected dividend yield (4) . . . . . . . . . . . . . . . . . . . . . . . . . . . . . . . . . . . . . . . . . . . . . —% —%
(1) The expected volatility assumption was determined based upon the historical volatility of our stock price,using daily price intervals. (2) The expected option life was determined based upon our historical data usinga midpoint scenario, which assumes all options are exercised halfway between the expiration date and theweighted average time it takes the option to vest.
F-32

CBIZ, INC. AND SUBSIDIARIES
NOTES TO THE CONSOLIDATED FINANCIAL STATEMENTS — (continued)
(3) The risk-free interest rate assumption was upon zero-coupon U.S. Treasury bonds with a termapproximating the expected life of the respective options.
(4) The expected dividend yield assumption was determined in view of our historical and estimated dividendpayouts. We do not expect to change our dividend payout policy in the foreseeable future.
Restricted Stock Units and Awards — Under the 2019 Plan, certain employees and non-employee directorswere granted restricted stock units and awards. Restricted stock units and awards are independent of optiongrants and vest at no cost to the recipients. Restricted stock units and awards are subject to forfeiture ifemployment terminates prior to the release of restrictions, generally one to four years from the date of grant.Recipients of restricted stock units and awards are entitled to the same dividend and voting rights as holders ofother CBIZ common stock, subject to certain restrictions during the vesting period, and these are considered tobe issued and outstanding from the date of grant. Shares granted under the 2019 Plan cannot be sold, pledged,transferred or assigned during the vesting period.
Restricted stock units and awards activity during the year ended December 31, 2020 was as follows (inthousands, except per share data):
Number ofShares
WeightedAverage
Grant-DateFair Value (1)
Non-vested at December 31, 2019 . . . . . . . . . . . . . . . . . . . . . . . . . . . . . . . . . 577 $17.87Granted . . . . . . . . . . . . . . . . . . . . . . . . . . . . . . . . . . . . . . . . . . . . . . . . . . . . . . 178 $24.48Vested . . . . . . . . . . . . . . . . . . . . . . . . . . . . . . . . . . . . . . . . . . . . . . . . . . . . . . . (276) $16.74Forfeited . . . . . . . . . . . . . . . . . . . . . . . . . . . . . . . . . . . . . . . . . . . . . . . . . . . . . (18) $19.56
Non-vested at December 31, 2020 . . . . . . . . . . . . . . . . . . . . . . . . . . . . . . . . . 461 $21.03
(1) Represents weighted average market value of the shares as the awards are granted at no cost to therecipients.
• At December 31, 2020, we had unrecognized compensation cost for restricted stock units and awards of$6.2 million to be recognized over a weighted average period of approximately 1.20 years.
• The total fair value of shares vested during the years ended December 31, 2020, 2019 and 2018 wasapproximately $4.6 million, $3.9 million and $4.1 million, respectively.
• The market value of shares awarded during the years ended December 31, 2020, 2019 and 2018 was$4.3 million, $4.5 million and $5.1 million, respectively. This market value was recorded as unearnedcompensation and is recognized as expense ratably over the periods which the restrictions lapse.
• Awards outstanding at December 31, 2020 will be released from restrictions at dates ranging fromFebruary, 2021 through February, 2023.
Performance Share Units (“PSUs”) — PSUs are earned based on our financial performance over a contractualterm of three years and the associated expense is recognized over that period based on the fair value of the award.A three-year cliff vesting schedule of the PSUs is dependent upon the Company’s performance relative topre-established goals based on earnings per share target (weighted 70%) and total growth in revenue (weighted30%). The fair value of PSUs is calculated using the market value of our common stock on the date of grant. Forperformance achieved above specified levels, the recipient may earn additional shares of stock, not to exceed200% of the number of PSUs initially granted.
F-33

CBIZ, INC. AND SUBSIDIARIES
NOTES TO THE CONSOLIDATED FINANCIAL STATEMENTS — (continued)
The following table presents our PSU award activity during the twelve months ended December 31, 2020 (inthousands, except per share data):
Number ofPSUs
(in thousands)
Grant-DateFair ValuePer Unit
Outstanding at December 31, 2019 . . . . . . . . . . . . . . . . . . . . . . . . . . . . . . . 200 $19.82Granted . . . . . . . . . . . . . . . . . . . . . . . . . . . . . . . . . . . . . . . . . . . . . . . . . . . . . 132 $25.75Expired or cancelled . . . . . . . . . . . . . . . . . . . . . . . . . . . . . . . . . . . . . . . . . . . (25) $22.14
Outstanding at December 31, 2020 . . . . . . . . . . . . . . . . . . . . . . . . . . . . . . . 307 $22.18
NOTE 15. EARNINGS PER SHARE
The following table sets forth the reconciliation of the numerator and the denominator of basic earnings per shareand diluted earnings per share from continuing operations for the years ended December 31, 2020, 2019 and2018 (in thousands, except per share data):
Year Ended December 31,
2020 2019 2018
Numerator:Income from continuing operations . . . . . . . . . . . . . . . . . . . . . . . . . . . . . . . . . . . $78,347 $71,049 $61,573
Denominator:Basic
Weighted average common shares outstanding . . . . . . . . . . . . . . . . . . . . . . . . 54,288 54,299 54,561
DilutedStock options (1) . . . . . . . . . . . . . . . . . . . . . . . . . . . . . . . . . . . . . . . . . . . . . . . 802 1,288 1,542Restricted stock awards . . . . . . . . . . . . . . . . . . . . . . . . . . . . . . . . . . . . . . . . . . 195 234 302Contingent shares (2) . . . . . . . . . . . . . . . . . . . . . . . . . . . . . . . . . . . . . . . . . . . . 74 74 82
Diluted weighted average common shares outstanding (3) . . . . . . . . . . . . . . . 55,359 55,895 56,487
Earnings Per Share:Basic earnings per share from continuing operations . . . . . . . . . . . . . . . . . . . . . $ 1.44 $ 1.31 $ 1.13
Diluted earnings per share from continuing operations . . . . . . . . . . . . . . . . . . . . $ 1.42 $ 1.27 $ 1.09
(1) For the years ended December 31, 2020, 2019 and 2018, a total of 0.3 million, 0.5 million and 0.4 millionstock based awards, respectively, were excluded from the calculation of diluted earnings per share as theirexercise prices would render them anti-dilutive.
(2) Contingent shares represent additional shares to be issued for purchase price earned by former owners ofbusinesses acquired by us once future conditions have been met. For further details, refer to Note 18,Business Combinations.
(3) The denominator used in calculating diluted earnings per share did not include 0.3 million and 0.2 millionperformance share units for the twelve months ended December 31, 2020 and 2019, respectively. Theperformance conditions associated with these performance share units were not met and consequently noneof these performance share units were considered as issuable for the years ended December 31, 2020 and2019.
F-34

CBIZ, INC. AND SUBSIDIARIES
NOTES TO THE CONSOLIDATED FINANCIAL STATEMENTS — (continued)
NOTE 16. LEASES
We determine if a contract is a lease at inception. We have leases for office space and facilities, automobiles andcertain information technology equipment. All of our leases are classified as operating leases and the majority ofwhich are for office space and facilities.
Supplemental balance sheet information related to the Company’s operating leases as of December 31, 2020 and2019 was as follows (in thousands):
December 31,2020
December 31,2019
Weighted-average remaining lease term . . . . . . . . . . . . . . . . . . . . . . . . . . 6.7 years 6.9 yearsWeighted-average discount rate . . . . . . . . . . . . . . . . . . . . . . . . . . . . . . . . . 3.6% 3.6%
The components of lease cost and other lease information as of and during the year ended December 31, 2020and 2019 are as follows (in thousands):
December 31,2020
December 31,2019
Operating lease cost . . . . . . . . . . . . . . . . . . . . . . . . . . . . . . . . . . . . . . . . . . $34,781 $37,275Cash paid for amounts included in measurement of lease liabilities
Operating cash flows for operating leases . . . . . . . . . . . . . . . . . . . . . . . $35,426 $37,667
Our leases have remaining lease terms ranging from 1 to 10 years. These leases generally contain renewaloptions for periods ranging from two to five years. Because the Company is not reasonably certain to exercisethese renewal options, the options are not included in the lease term, and associated potential option paymentsare excluded from lease payments. Lease expense, as accounted for under Legacy ASC Topic 840, was$38.0 million for the year ended December 31, 2018.
Maturities of operating lease liabilities at December 31, 2020 and minimum cash commitments under operatingleases at December 31, 2019 were as follows (in thousands):
December 31,2020
2021 . . . . . . . . . . . . . . . . . . . . . . . . . . . . . . . . . . . . . . . . . . . . . . . . . . . . . . . . . . . . . . . . . . $ 36,2702022 . . . . . . . . . . . . . . . . . . . . . . . . . . . . . . . . . . . . . . . . . . . . . . . . . . . . . . . . . . . . . . . . . . 30,3542023 . . . . . . . . . . . . . . . . . . . . . . . . . . . . . . . . . . . . . . . . . . . . . . . . . . . . . . . . . . . . . . . . . . 27,7092024 . . . . . . . . . . . . . . . . . . . . . . . . . . . . . . . . . . . . . . . . . . . . . . . . . . . . . . . . . . . . . . . . . . 24,4012025 . . . . . . . . . . . . . . . . . . . . . . . . . . . . . . . . . . . . . . . . . . . . . . . . . . . . . . . . . . . . . . . . . . 22,662Thereafter . . . . . . . . . . . . . . . . . . . . . . . . . . . . . . . . . . . . . . . . . . . . . . . . . . . . . . . . . . . . . . 52,432
Total undiscounted lease payments . . . . . . . . . . . . . . . . . . . . . . . . . . . . . . . . . . . . . . . . 193,828
Less: imputed interest . . . . . . . . . . . . . . . . . . . . . . . . . . . . . . . . . . . . . . . . . . . . . . . . . . . . . (21,325)
Total lease liabilities . . . . . . . . . . . . . . . . . . . . . . . . . . . . . . . . . . . . . . . . . . . . . . . . . . . . $172,503
F-35

CBIZ, INC. AND SUBSIDIARIES
NOTES TO THE CONSOLIDATED FINANCIAL STATEMENTS — (continued)
December 31,2019
2020 . . . . . . . . . . . . . . . . . . . . . . . . . . . . . . . . . . . . . . . . . . . . . . . . . . . . . . . . . . . . . . . . . . $ 34,7752021 . . . . . . . . . . . . . . . . . . . . . . . . . . . . . . . . . . . . . . . . . . . . . . . . . . . . . . . . . . . . . . . . . . 32,3712022 . . . . . . . . . . . . . . . . . . . . . . . . . . . . . . . . . . . . . . . . . . . . . . . . . . . . . . . . . . . . . . . . . . 26,1122023 . . . . . . . . . . . . . . . . . . . . . . . . . . . . . . . . . . . . . . . . . . . . . . . . . . . . . . . . . . . . . . . . . . 24,2732024 . . . . . . . . . . . . . . . . . . . . . . . . . . . . . . . . . . . . . . . . . . . . . . . . . . . . . . . . . . . . . . . . . . 21,578Thereafter . . . . . . . . . . . . . . . . . . . . . . . . . . . . . . . . . . . . . . . . . . . . . . . . . . . . . . . . . . . . . . 67,025
Total undiscounted lease payments . . . . . . . . . . . . . . . . . . . . . . . . . . . . . . . . . . . . . . . . 206,134
Less: imputed interest . . . . . . . . . . . . . . . . . . . . . . . . . . . . . . . . . . . . . . . . . . . . . . . . . . . . . (45,086)
Total lease liabilities . . . . . . . . . . . . . . . . . . . . . . . . . . . . . . . . . . . . . . . . . . . . . . . . . . . . $161,048
NOTE 17. RELATED PARTIES
The following is a summary of certain agreements and transactions between or among us and certain relatedparties. Management reviews these transactions as they occur and monitors them for compliance with our Codeof Conduct, internal procedures and applicable legal requirements. The Audit Committee reviews and ratifiessuch transactions annually, or as they are more frequently brought to the attention of the Audit Committee by ourDirector of Internal Audit, General Counsel or other members of Management.
A number of the businesses acquired by us are located in properties owned indirectly by and leased from personsemployed by us, none of whom are members of our senior management. In the aggregate, we paid approximately$2.2 million, $2.4 million and $3.0 million during the years ended December 31, 2020, 2019 and 2018,respectively, under such leases.
We maintain joint-referral relationships and administrative service agreements with independent licensed CPAfirms under which we provide administrative services in exchange for a fee. Fees earned by us under the ASAsare recorded as “Revenue” (at net realizable value) in the accompanying Consolidated Statements ofComprehensive Income and were approximately $159.4 million in 2020, $157.6 million in 2019 and$154.0 million in 2018. These firms are owned by licensed CPAs who are employed by our subsidiaries andprovide audit and attest services to clients including our clients. The CPA firms with which we maintainadministrative service agreements operate as limited liability companies, limited liability partnerships orprofessional corporations. The firms are separate legal entities with separate governing bodies and officers. Wehave no ownership interest in any of these CPA firms, and neither the existence of the administrative serviceagreements nor the providing of services thereunder is intended to constitute control of the CPA firms by us.CBIZ and the CPA firms maintain their own respective liability and risk of loss in connection with performanceof each of its respective services, and we do not believe that our arrangements with these CPA firms result inadditional risk of loss.
NOTE 18. BUSINESS COMBINATIONS
Our acquisition strategy focuses on businesses with a leadership team that is committed to best in class culture,extraordinary client service and cross-serving potential. CBIZ has a long history of acquiring businesses thatshare common cultural values with us and provide value-added services to the small and midsize businessmarket. The valuation of any business is a subjective process and includes industry, geography, profit margins,expected cash flows, client retention, nature of recurring or non-recurring project-based work, growth rateassumptions and competitive market conditions.
F-36

CBIZ, INC. AND SUBSIDIARIES
NOTES TO THE CONSOLIDATED FINANCIAL STATEMENTS — (continued)
During the year ended December 31, 2020, we completed the following acquisitions:
• Effective February 1, 2020, we acquired substantially all the assets of Alliance Insurance Services, Inc.(“Alliance”), a provider of insurance and advisory services based in Washington DC. Alliance is includedas a component of our Benefits and Insurance Services practice group.
• Effective February 1, 2020, we acquired substantially all the assets of Pension Dynamics, LLC (“PD”), afull service retirement and benefits plan advisor based in Pleasant Hill, California. PD is included as acomponent of our Benefits and Insurance Services practice group.
• Effective February 1, 2020, we acquired substantially all the assets of Sunshine Systems, Inc.(“Sunshine”), a payroll solutions provider based in Massachusetts.Sunshine is included as a component ofour Benefits and Insurance Services practice group.
• Effective July 1, 2020, we acquired substantially all the assets of Prince-Wood Insurance, L.L.C.(“PWI”), a provider of financial insurance and advisory services based in Woodbridge, Virginia. PWI isincluded as a component of our Benefits and Insurance practice group.
• Effective September 1, 2020, we acquired substantially all the assets of ARC Consulting LLC and ARCPlacement Group LLC (collectively “ARC”), a provider of financial, insurance and advisory servicesbased in San Francisco, California. ARC is included as a component of our Financial Services practicegroup.
• Effective December 1, 2020, we acquired substantially all the assets of BeyondPay, Inc., a full servicehuman capital management and payroll service provider based in Clinton, New Jersey. BeyondPay isincluded as a component of our Benefits and Insurance practice group.
• Effective December 31, 2020, we acquired substantially all the assets of Borden Perlman InsuranceAgency, Inc. (“BP”), a leading provider of financial, insurance and advisory services located in Ewing,New Jersey. BP is included as a component of our Benefits and Insurance practice group.
Aggregated consideration for these seven acquisitions consisted of approximately $73.4 million in cash(including $1.7 million acquired client funds and $0.5 million cash acquired), $8.7 million in our common stock,and $38.9 million in contingent consideration. The maximum potential undiscounted amount of all futurepayments that we could be required to make under the contingent arrangement is $43.0 million. As ofDecember 31, 2020, the aggregated fair value of the contingent consideration related to these acquisitions was$38.0 million, of which $10.9 million was recorded in “Contingent purchase price liability — current” and$27.1 million was recorded in “Contingent purchase price liability — non-current” in the accompanyingConsolidated Balance Sheets. Refer to Note 7, Fair Value Measurements, for additional information regardingcontingent purchase price liability fair value and fair value adjustments.
Annualized aggregated revenue for these acquisitions is estimated to be approximately $45.2 million. Pro formaresults of operations for these acquisitions are not presented because the effects of these acquisitions were notsignificant either individually or in aggregate to our consolidated “Income from continuing operations beforeincome taxes.”
During the year ended December 31, 2019, we acquired substantially all of the assets of the following businesses.
• Effective January 1, 2019, we acquired substantially all of the assets of Wenner Group, LLC (“Wenner”),located in Denver, Colorado. Wenner is a full service accounting, tax, compliance and financialconsulting firm. Wenner is included as a component of our Financial Services practice group.
F-37

CBIZ, INC. AND SUBSIDIARIES
NOTES TO THE CONSOLIDATED FINANCIAL STATEMENTS — (continued)
• Effective July 1, 2019, we acquired substantially all of the assets of Paydayta, Inc. (d.b.a. Paytime)(“Paytime”), an Ohio-based payroll service provider. Paytime is included as a component of our Benefitand Insurance Services practice group.
• Effective July 1, 2019, we acquired substantially all of the assets of Gavion, LLC (“Gavion”), a registeredinvestment advisor based in Memphis, Tennessee. Gavion provides investment consulting services to adiverse base of institutional clients. Gavion is included as a component of our Benefit and InsuranceServices practice group.
• Effective August 1, 2019, we acquired substantially all of the assets of QBA Benefits, LLC. (“QBA”), anemployee benefits agency based in Cleveland, Ohio. QBA provides employee benefits related services tosmall and mid-sized clients across multiple industries such as services, technology, energy, andmanufacturing. QBA is included as a component of our Benefit and Insurance Services practice group.
• Effective August 1, 2019, we acquired substantially all of the assets of Ericson CPAs (“Ericson”), anaccounting firm based in San Luis Obispo, California. Ericson provides tax compliance, consulting, andplanning services to a diverse base of clients. Ericson is included as a component of our FinancialServices practice group.
• Effective September 1, 2019, we acquired substantially all of the assets of Brinig Taylor Zimmer, Inc.(“BTZ”), a specialized financial consulting firm based in San Diego, California. BTZ provides forensicaccounting, litigation consulting and business valuation services to a wide range of clients fromindividual to small business and large public traded entities. BTZ is included as a component of ourFinancial Services practice group.
Aggregated consideration for these six acquisitions consisted of approximately $19.4 million in cash (including$6.9 million acquired client funds and $0.8 million cash acquired), $2.0 million in our common stock, and$11.2 million in contingent consideration. The maximum potential undiscounted amount of all future paymentsthat we could be required to make under the contingent arrangement is $11.5 million . As of December 31, 2019,the aggregated fair value of the contingent consideration related to these acquisitions was $10.3 million, of which$2.8 million was recorded in “Contingent purchase price liability — current” and $7.5 million was recorded in“Contingent purchase price liability — non-current” in the accompanying Consolidated Balance Sheets. Refer toNote 7. Fair Value Measurements, for additional information regarding contingent purchase price liability fairvalue and fair value adjustments.
Annualized aggregated revenue for these acquisitions is estimated to be approximately $17.4 million. Pro formaresults of operations for these acquisitions are not presented because the effects of these acquisitions were notsignificant either individually or in aggregate to our consolidated “Income from continuing operations beforeincome taxes.”
F-38
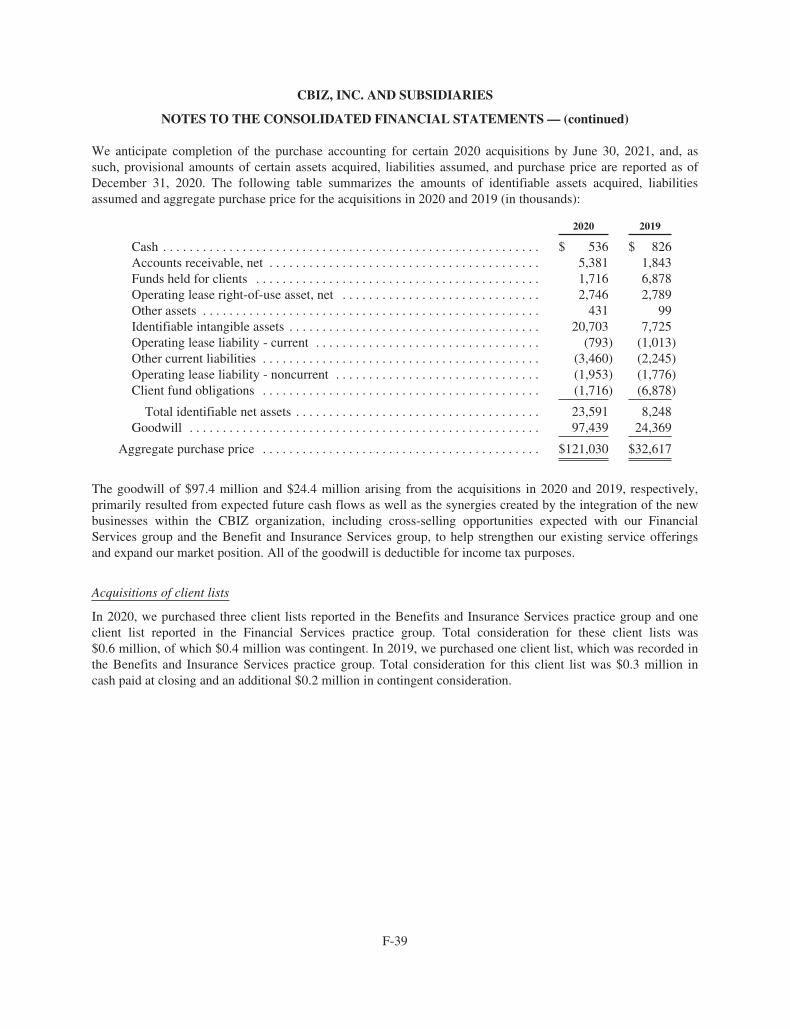
CBIZ, INC. AND SUBSIDIARIES
NOTES TO THE CONSOLIDATED FINANCIAL STATEMENTS — (continued)
We anticipate completion of the purchase accounting for certain 2020 acquisitions by June 30, 2021, and, assuch, provisional amounts of certain assets acquired, liabilities assumed, and purchase price are reported as ofDecember 31, 2020. The following table summarizes the amounts of identifiable assets acquired, liabilitiesassumed and aggregate purchase price for the acquisitions in 2020 and 2019 (in thousands):
2020 2019
Cash . . . . . . . . . . . . . . . . . . . . . . . . . . . . . . . . . . . . . . . . . . . . . . . . . . . . . . . . . $ 536 $ 826Accounts receivable, net . . . . . . . . . . . . . . . . . . . . . . . . . . . . . . . . . . . . . . . . . 5,381 1,843Funds held for clients . . . . . . . . . . . . . . . . . . . . . . . . . . . . . . . . . . . . . . . . . . . 1,716 6,878Operating lease right-of-use asset, net . . . . . . . . . . . . . . . . . . . . . . . . . . . . . . 2,746 2,789Other assets . . . . . . . . . . . . . . . . . . . . . . . . . . . . . . . . . . . . . . . . . . . . . . . . . . . 431 99Identifiable intangible assets . . . . . . . . . . . . . . . . . . . . . . . . . . . . . . . . . . . . . . 20,703 7,725Operating lease liability - current . . . . . . . . . . . . . . . . . . . . . . . . . . . . . . . . . . (793) (1,013)Other current liabilities . . . . . . . . . . . . . . . . . . . . . . . . . . . . . . . . . . . . . . . . . . (3,460) (2,245)Operating lease liability - noncurrent . . . . . . . . . . . . . . . . . . . . . . . . . . . . . . . (1,953) (1,776)Client fund obligations . . . . . . . . . . . . . . . . . . . . . . . . . . . . . . . . . . . . . . . . . . (1,716) (6,878)
Total identifiable net assets . . . . . . . . . . . . . . . . . . . . . . . . . . . . . . . . . . . . . 23,591 8,248Goodwill . . . . . . . . . . . . . . . . . . . . . . . . . . . . . . . . . . . . . . . . . . . . . . . . . . . . . 97,439 24,369
Aggregate purchase price . . . . . . . . . . . . . . . . . . . . . . . . . . . . . . . . . . . . . . . . . . $121,030 $32,617
The goodwill of $97.4 million and $24.4 million arising from the acquisitions in 2020 and 2019, respectively,primarily resulted from expected future cash flows as well as the synergies created by the integration of the newbusinesses within the CBIZ organization, including cross-selling opportunities expected with our FinancialServices group and the Benefit and Insurance Services group, to help strengthen our existing service offeringsand expand our market position. All of the goodwill is deductible for income tax purposes.
Acquisitions of client lists
In 2020, we purchased three client lists reported in the Benefits and Insurance Services practice group and oneclient list reported in the Financial Services practice group. Total consideration for these client lists was$0.6 million, of which $0.4 million was contingent. In 2019, we purchased one client list, which was recorded inthe Benefits and Insurance Services practice group. Total consideration for this client list was $0.3 million incash paid at closing and an additional $0.2 million in contingent consideration.
F-39

CBIZ, INC. AND SUBSIDIARIES
NOTES TO THE CONSOLIDATED FINANCIAL STATEMENTS — (continued)
Change in Contingent Purchase Price Liability for Previous Acquisitions
We are required to evaluate in subsequent reporting periods the fair value of contingent consideration related toprevious acquisitions. We decreased the fair value of the contingent purchase price liability related to prioracquisitions in 2020 by $0.6 million due to expected results of acquired businesses and the revaluation of stockrelated to contingent payments. We increased the fair value of the contingent purchase price liability related toprior acquisitions in 2019 by $1.6 million, due to expected results of acquired businesses and the revaluation ofstock related to contingent payments. The changes are included in “Other income (expense), net” in theaccompanying Consolidated Statements of Comprehensive Income. For further discussion on contingentpurchase price liabilities, refer to Note 7, Fair Value Measurements, to the accompanying consolidated financialstatements.
Contingent Payments for Previous Business Acquisitions and Client Lists
Under the terms of the acquisition agreements, we pay cash consideration and issue shares of our common stockas contingent earnout for previous acquisitions. In the years ended December 31, 2020 and 2019, we paid cash of$12.5 million and $16.9 million respectively, and issued shares of our common stock of approximately0.1 million shares in each year. In the years ended December 31, 2020 and 2019, we paid $0.4 million and$0.9 million, respectively, in cash for previous client list purchases.
NOTE 19. DIVESTITURES
Divested operations and assets that do not qualify for treatment as discontinued operations are recorded as“(Loss) gain on sale of operations, net” in the accompanying Consolidated Statements of ComprehensiveIncome. In 2020, we sold a small book of business in the Benefit and Insurance practice group and two smallaccounting firms in the Financial Services practice group and recorded a loss of $0.5 million. In 2019, we sold asmall office in the Financial Services practice group and recorded a gain of $0.4 million.
F-40

CBIZ, INC. AND SUBSIDIARIES
NOTES TO THE CONSOLIDATED FINANCIAL STATEMENTS — (continued)
NOTE 20. QUARTERLY FINANCIAL DATA (UNAUDITED)
The following is a summary of the unaudited quarterly results of operations for the years ended December 31,2020 and 2019 (in thousands, except per share amounts).
2020
March 31, June 30, September 30, December 31,
Revenue . . . . . . . . . . . . . . . . . . . . . . . . . . . . . . $277,455 $236,943 $238,389 $211,110Operating expenses . . . . . . . . . . . . . . . . . . . . . 199,827 209,016 204,760 211,748
Gross margin . . . . . . . . . . . . . . . . . . . . . . . . . . 77,628 27,927 33,629 (638)Corporate general and administrative
expenses . . . . . . . . . . . . . . . . . . . . . . . . . . . 10,489 11,160 11,339 13,078
Operating income (loss) . . . . . . . . . . . . . . . . . 67,139 16,767 22,290 (13,716)Other (expense) income:
Interest expense . . . . . . . . . . . . . . . . . . . . . . (1,119) (2,074) (974) (816)Gain (loss) on sale of operations, net . . . . . 95 57 (74) (587)Other (expense) income, net . . . . . . . . . . . . (15,800) 13,336 5,914 13,050
Total other (expense) income, net . . . . . . (16,824) 11,319 4,866 11,647
Income (loss) from continuing operationsbefore income tax expense . . . . . . . . . . . . . 50,315 28,086 27,156 (2,069)
Income tax expense (benefit) . . . . . . . . . . . . . 13,453 6,607 7,060 (1,979)
Income (loss) from continuing operations . . . 36,862 21,479 20,096 (90)Loss from operations of discontinued
operations, net of tax . . . . . . . . . . . . . . . . . . (14) (11) (19) (4)
Net income (loss) . . . . . . . . . . . . . . . . . . . . . . $ 36,848 $ 21,468 $ 20,077 $ (94)
Earnings (loss) per share:Basic:
Continuing operations . . . . . . . . . . . . . . . . . $ 0.68 $ 0.40 $ 0.37 $ —Discontinued operations . . . . . . . . . . . . . . . — — — —
Net income (loss) . . . . . . . . . . . . . . . . . . . . $ 0.68 $ 0.40 $ 0.37 $ —
Diluted:Continuing operations . . . . . . . . . . . . . . . . . $ 0.66 $ 0.39 $ 0.36 $ —Discontinued operations . . . . . . . . . . . . . . . — — — —
Net income (loss) . . . . . . . . . . . . . . . . . . . . $ 0.66 $ 0.39 $ 0.36 $ —
Basic weighted average common shares . . . . . 54,571 54,142 54,403 54,039
Diluted weighted average common shares . . . 55,945 55,116 55,360 54,039
F-41
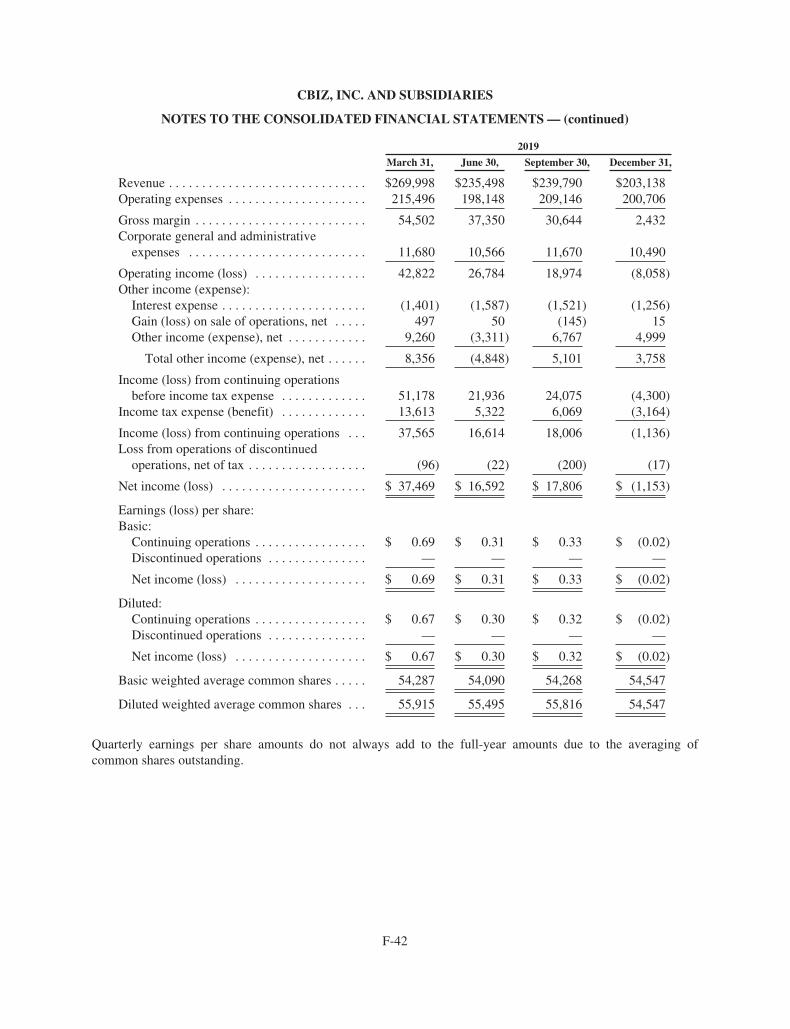
CBIZ, INC. AND SUBSIDIARIES
NOTES TO THE CONSOLIDATED FINANCIAL STATEMENTS — (continued)
2019
March 31, June 30, September 30, December 31,
Revenue . . . . . . . . . . . . . . . . . . . . . . . . . . . . . . $269,998 $235,498 $239,790 $203,138Operating expenses . . . . . . . . . . . . . . . . . . . . . 215,496 198,148 209,146 200,706
Gross margin . . . . . . . . . . . . . . . . . . . . . . . . . . 54,502 37,350 30,644 2,432Corporate general and administrative
expenses . . . . . . . . . . . . . . . . . . . . . . . . . . . 11,680 10,566 11,670 10,490
Operating income (loss) . . . . . . . . . . . . . . . . . 42,822 26,784 18,974 (8,058)Other income (expense):
Interest expense . . . . . . . . . . . . . . . . . . . . . . (1,401) (1,587) (1,521) (1,256)Gain (loss) on sale of operations, net . . . . . 497 50 (145) 15Other income (expense), net . . . . . . . . . . . . 9,260 (3,311) 6,767 4,999
Total other income (expense), net . . . . . . 8,356 (4,848) 5,101 3,758
Income (loss) from continuing operationsbefore income tax expense . . . . . . . . . . . . . 51,178 21,936 24,075 (4,300)
Income tax expense (benefit) . . . . . . . . . . . . . 13,613 5,322 6,069 (3,164)
Income (loss) from continuing operations . . . 37,565 16,614 18,006 (1,136)Loss from operations of discontinued
operations, net of tax . . . . . . . . . . . . . . . . . . (96) (22) (200) (17)
Net income (loss) . . . . . . . . . . . . . . . . . . . . . . $ 37,469 $ 16,592 $ 17,806 $ (1,153)
Earnings (loss) per share:Basic:
Continuing operations . . . . . . . . . . . . . . . . . $ 0.69 $ 0.31 $ 0.33 $ (0.02)Discontinued operations . . . . . . . . . . . . . . . — — — —
Net income (loss) . . . . . . . . . . . . . . . . . . . . $ 0.69 $ 0.31 $ 0.33 $ (0.02)
Diluted:Continuing operations . . . . . . . . . . . . . . . . . $ 0.67 $ 0.30 $ 0.32 $ (0.02)Discontinued operations . . . . . . . . . . . . . . . — — — —
Net income (loss) . . . . . . . . . . . . . . . . . . . . $ 0.67 $ 0.30 $ 0.32 $ (0.02)
Basic weighted average common shares . . . . . 54,287 54,090 54,268 54,547
Diluted weighted average common shares . . . 55,915 55,495 55,816 54,547
Quarterly earnings per share amounts do not always add to the full-year amounts due to the averaging ofcommon shares outstanding.
F-42

CBIZ, INC. AND SUBSIDIARIES
NOTES TO THE CONSOLIDATED FINANCIAL STATEMENTS — (continued)
NOTE 21. SEGMENT DISCLOSURES
Our business units have been aggregated into three practice groups: (i) Financial Services, (ii) Benefits andInsurance Services and (iii) National Practices, based on the following factors: similarity of the products andservices provided to clients, similarity of the regulatory environment and similarity of economic conditionsaffecting long-term performance. The business units are managed along these segment lines. A generaldescription of services provided by practice group is provided in the table below.
Financial Services Benefits and Insurance Services National Practices
• Accounting and Tax• Government Healthcare
Consulting• Financial Advisory• Valuation• Risk & Advisory Services
• Group Health Benefits Consulting• Payroll• Property and Casualty• Retirement Plan Services
• Managed Networking andHardware Services
• Healthcare Consulting
Corporate and Other — Included in Corporate and Other are operating expenses that are not directly allocatedto the individual business units. These expenses are primarily comprised of certain healthcare costs, gains orlosses attributable to assets held in our non-qualified deferred compensation plan, share-based compensation,consolidation and integration charges, certain professional fees, certain advertising costs and other variousexpenses.
Upon consolidation, intercompany accounts and transactions are eliminated, thus inter-segment revenue is notincluded in the measure of profit or loss for the practice groups. Performance of the practice groups is evaluatedon operating income excluding those costs listed above, which are reported in the “Corporate and Other”segment.
We operate in the United States and Canada and revenue generated from such operations during the years endedDecember 31, 2020, 2019 and 2018 was as follows (in thousands):
Year Ended December 31,
2020 2019 2018
United States . . . . . . . . . . . . . . . . . . . . . . . . . . . . . . . . . . . . . . . . $962,272 $946,801 $920,481Canada . . . . . . . . . . . . . . . . . . . . . . . . . . . . . . . . . . . . . . . . . . . . . 1,625 1,623 1,522
Total revenue . . . . . . . . . . . . . . . . . . . . . . . . . . . . . . . . . . . . $963,897 $948,424 $922,003
There is no one customer that represents a significant portion of our revenue.
Segment information for the years ended December 31, 2020, 2019 and 2018 is presented below (in thousands).We do not manage our assets on a segment basis, therefore segment assets are not presented below.
F-43

CBIZ, INC. AND SUBSIDIARIES
NOTES TO THE CONSOLIDATED FINANCIAL STATEMENTS — (continued)
For the Year Ended December 31, 2020
FinancialServices
Benefits andInsuranceServices
NationalPractices
Corporateand Other Total
Revenue . . . . . . . . . . . . . . . . . . . . . . . . . . . . . . . . . . . . . $629,778 $297,758 $36,361 $ — $963,897Operating expenses . . . . . . . . . . . . . . . . . . . . . . . . . . . . 525,209 248,357 32,637 19,148 825,351
Gross margin . . . . . . . . . . . . . . . . . . . . . . . . . . . . . . . . . 104,569 49,401 3,724 (19,148) 138,546Corporate general and administrative expenses . . . . . . — — — 46,066 46,066
Operating income (loss) . . . . . . . . . . . . . . . . . . . . . . . . 104,569 49,401 3,724 (65,214) 92,480Other income (expense):
Interest expense . . . . . . . . . . . . . . . . . . . . . . . . . . . . . — (34) — (4,949) (4,983)(Loss) gain on sale of operations, net . . . . . . . . . . . . (612) 103 — — (509)Other income, net . . . . . . . . . . . . . . . . . . . . . . . . . . . 262 196 1 16,041 16,500
Total other (expense) income . . . . . . . . . . . . . . . . (350) 265 1 11,092 11,008
Income (loss) from continuing operations beforeincome tax expense . . . . . . . . . . . . . . . . . . . . . . . . . . $104,219 $ 49,666 $ 3,725 $(54,122) $103,488
For the Year Ended December 31, 2019
FinancialServices
Benefits andInsuranceServices
NationalPractices
Corporateand Other Total
Revenue . . . . . . . . . . . . . . . . . . . . . . . . . . . . . . . . . . . . . $616,567 $296,228 $35,629 $ — $948,424Operating expenses . . . . . . . . . . . . . . . . . . . . . . . . . . . . 515,240 246,245 32,474 29,537 823,496
Gross margin . . . . . . . . . . . . . . . . . . . . . . . . . . . . . . . . . 101,327 49,983 3,155 (29,537) 124,928Corporate general and administrative expenses . . . . . . — — — 44,406 44,406
Operating income (loss) . . . . . . . . . . . . . . . . . . . . . . . . 101,327 49,983 3,155 (73,943) 80,522Other income (expense):
Interest expense . . . . . . . . . . . . . . . . . . . . . . . . . . . . . — (57) — (5,708) (5,765)Gain (loss) on sale of operations, net . . . . . . . . . . . . 578 — — (161) 417Other (expense) income, net . . . . . . . . . . . . . . . . . . . (121) 238 1 17,597 17,715
Total other income . . . . . . . . . . . . . . . . . . . . . . . . 457 181 1 11,728 12,367
Income (loss) from continuing operations beforeincome tax expense . . . . . . . . . . . . . . . . . . . . . . . . . . $101,784 $ 50,164 $ 3,156 $(62,215) $ 92,889
F-44

CBIZ, INC. AND SUBSIDIARIES
NOTES TO THE CONSOLIDATED FINANCIAL STATEMENTS — (continued)
For the Year Ended December 31, 2018
FinancialServices
Benefits andInsuranceServices
NationalPractices
Corporateand Other Total
Revenue . . . . . . . . . . . . . . . . . . . . . . . . . . . . . . . . . . . . . $600,926 $288,437 $32,640 $ — $922,003Operating expenses . . . . . . . . . . . . . . . . . . . . . . . . . . . . 508,653 239,646 30,003 11,981 790,283
Gross margin . . . . . . . . . . . . . . . . . . . . . . . . . . . . . . . . . 92,273 48,791 2,637 (11,981) 131,720Corporate general and administrative expenses . . . . . . — — — 39,173 39,173
Operating income (loss) . . . . . . . . . . . . . . . . . . . . . . . . 92,273 48,791 2,637 (51,154) 92,547Other income (expense):
Interest expense . . . . . . . . . . . . . . . . . . . . . . . . . . . . . — (102) — (6,543) (6,645)Gain on sale of operations, net . . . . . . . . . . . . . . . . . — — — 1,025 1,025Other (expense) income, net . . . . . . . . . . . . . . . . . . . (263) 493 3 (7,320) (7,087)
Total other (expense) income . . . . . . . . . . . . . . . . (263) 391 3 (12,838) (12,707)
Income (loss) from continuing operations beforeincome tax expense . . . . . . . . . . . . . . . . . . . . . . . . . . $ 92,010 $ 49,182 $ 2,640 $(63,992) 79,840
NOTE 22. SUBSEQUENT EVENTS
Subsequent to December 31, 2020 up to February 16, 2021, we repurchased approximately 0.6 million shares ofour common stock in the open market at a total cost of approximately $16.2 million.
On February 11, 2021, our Board of Directors authorized the continuation of the Share Repurchase Program,which has been renewed annually for the past seventeen years. It is effective beginning March 31, 2021, to whichthe amount of shares to be purchased will be reset to 5.0 million, and expires one year from the respectiveeffective date. This authorization allows us to purchase shares of our common stock (i) in the open market, (ii) inprivately negotiated transactions, or (iii) under Rule 10b5-1trading plans.
Effective January 1, 2021, we acquired substantially all the assets of the Middle Market Advisory Group(“MMA”). MMA, based in Englewood, CO, is a provider of tax compliance and consulting services to middlemarket companies and family groups in the real estate, automotive, technology and SAAS, construction, andmanufacturing industries. Annualized revenue is estimated to be approximately $3.6 million. MMA will beincluded as a component of our Financial Services practice group.
F-45

CBIZ, INC.
© Copyright 2021. CBIZ, Inc. All rights reserved. • CBIZ-000, Rev. 26
EXECUTIVE OFFICE
CBIZ, Inc.6050 Oak Tree Blvd., South, Suite 500Cleveland, OH 44131 | 216.447.9000
SECURITY MARKETS
Shares of CBIZ, Inc. are listed on the New York Stock Exchange under the ticker symbol “CBZ.”
STOCK TRANSFER AGENT AND REGISTRAR
Computershare PO BOX 505000Louisville, KY 40233-5000 USA
1.888.726.8085 (U.S., Canada, Puerto Rico) 1.781.575.3120 (non-U.S.)Investor Portal: www.computershare.com/investor
By overnight delivery: Computershare 462 South 4th Street, Suite 1600Louisville, KY 40202 USA
SHAREHOLDER INFORMATION
Copies of reports filed with the Securities and Exchange Commission are available online at www.sec.gov, www.cbiz.com or by written request to:
CBIZ, Inc.Attn: Investor Relations6050 Oak Tree Blvd., South, Suite 500Cleveland, OH 44131
ANNUAL MEETING
Thursday, May 13, 2021, 8:00 a.m. 6050 Oak Tree Blvd., South, Lower Level Independence, OH 44131
INDEPENDENT PUBLIC ACCOUNTANTS
KPMG, LLP
BOARD OF DIRECTORS
Steven L. Gerard – Chairman
Rick L. Burdick – Lead Director and Vice Chairman
Michael H. DeGroote
Joseph S. DiMartino
Gina D. France
Jerome P. Grisko Jr.
Sherrill W. Hudson
A. Haag Sherman
Todd J. Slotkin
Benaree Pratt Wiley
EXECUTIVE TEAM
Jerome P. Grisko Jr. President and Chief Executive Officer
John A. Fleischer Senior Vice President and Chief Information Officer
Michael W. Gleespen Secretary and General Counsel
Ware H. Grove Senior Vice President and Chief Financial Officer
Michael P. Kouzelos President, Benefits and Insurance Services
Chris Spurio President, Financial Services
Mark M. Waxman Senior Vice President and Chief Marketing Officer