
Rise Aussie Mine November 2010 and Shine - pwc.com.au · PDF fileTotal borrowings 5,475 6,602...
44
What would you like to grow? pwc.com.au/industry/energy-resources Rise and Shine Aussie Mine November 2010
Transcript of Rise Aussie Mine November 2010 and Shine - pwc.com.au · PDF fileTotal borrowings 5,475 6,602...
What would you like to grow?
pwc.com.au/industry/energy-resources
Rise and Shine
Aussie MineNovember 2010

2 PwC
Michael HappellEnergy and Resources Leader
Tim GoldsmithGlobal Mining Leader
Foreword
Welcome to Aussie Mine for 2010. This year’s analysis presents an interesting foundation for what is anticipated as a return to form as Australian mid-tier miners Rise and Shine. Many mid-tier miners are currently enjoying bullet proof balance sheets, commodity price strength and a responsive and optimistic equity market, perhaps tempered by a strong Australian dollar (A$) and uncertainty around changes to the tax regime. Our analysis will provide further understanding of these key factors.
Many have bemoaned the loss of the Australian mid-tier miners through consolidation and takeover during the boom years of the past decade. We are seeing the rise of a new group of companies, now positioned to take the mantle of leaders in this sector and drive the re-emergence of a vibrant and commodity diverse Australian mid-tier.
Australia’s mining sector now has a strong and unprecedented opportunity at its doorstep. Our proximity to the growth of the emerging Asian giants and our abundance of in-demand resources to fuel that growth will continue to drive our economy, support employment and drive infrastructure development over the medium and long-term. As a nation it is up to us to support this development.
The mid-tier 50 are cashed up and poised for growth. Executives and Boards have weathered the storm, successfully raised capital and re-financed debt and are now ready to take the next step. We will see the deployment of the significant cash resources held by these companies, both through organic project development and mergers & acquisition activity. While current market conditions suggest short-term volatility will persist, investors should be poised and ready to be taken on a ride as the mid-tier Australian mining sector is ready to rise and shine.
We trust you will enjoy…
Michael Happell
Tim Goldsmith

Aussie Mine November 2010 3
Table of contents
1 Mid-tier50summaryfinancialinformation 4
2 Executive summary 5
3 Mid-tier industry in perspective 6
3.1 Market capitalisation 6
3.2 Comparison of the mid-tier 50 to other performance measures 9
3.3 M&A - from necessity to opportunity 10
3.4 Movementsinthemid-tier50 14
4 ThewayIseeit–NicoleHollows 15
5 Aggregated industry income statement 18
5.1 Focus–Accountingchanges:Rockyroadaheadforminingsector 26
6 Aggregated industry balance sheet 28
6.1 Focus - A tax on iron ore and coal, but encouraging for exploration 30
7 Aggregatedindustrycashflowstatement 32
7.1 Focus-Don’tletyourcapitalprojectbiteback 34
8 Looking ahead 36
9 Glossary 37
10 Mid-tier 50 companies analysed 38
11 Explanatorynotes 40
12 ContactingPwC 41
13 OtherMiningPublications 42

4 PwC
Mid-tier 50 summary financial information
2010 A$m
2009 A$m
Change %
Profit and Loss
Revenue 11,317 8,561 32%
Operating expenses (8,639) (6,108) 41%
Adjusted EBITDA 2,355 2,512 (6%)
Gain / (loss) on sale of investment (354) 487 (173%)
Impairment (111) (1,738) (94%)
Net profit/(loss) (26) (622) 96%
Cash Flow
Proceeds from ordinary share issues 3,794 2,410 57%
Distributions to shareholders (1,023) (966) 6%
Net operating cash inflow 1,922 2,112 (9%)
Net financing cash inflow 3,246 2,857 14%
Net borrowing inflows/(outflows) (840) 677 (224%)
Balance Sheet
Cash 7,373 3,658 102%
Property, plant and equipment and capitalised exploration 20,175 18,435 9%
Total borrowings 5,475 6,602 (17%)
Net assets 28,402 24,034 18%
Market Capitalisation
Market capitalisation 63,942 47,202 35%
Market capitalisation to net assets ratio 2.25 1.96 15%
1
Aussie Mine November 2010 5
Executive summary
Financial year 2010 saw strong growth for the mid-tier 50 as commodity prices continued to strengthen on the back of growing demand from Asia’s industrialising economies and a number of othersinthedevelopingworld.ItistimetoshineforAustralia’s mid-tier miners.
Revenue jumped by 32% largely underpinned by the strong performance of copper, gold and the unexpected star, platinum. The strong performance in these commodities has been driven by production growth as a result of the increase in the number of operating mines both locally and offshore. The increase in revenue has also been compounded by the rise in the commodity prices for copper, gold and platinum.
Whilst there has been some uncertainty surrounding the political arena in Australia and the impact of the Minerals Resource Rent Tax (MRRT) and its doomed precursor, the Resource Super Profits Tax (RSPT), the mid-tier 50 remain strong and poised for growth, with cash balances climbing to a remarkable 19% of total assets during 2010, to be in excess of $7 billion.
Equity markets have opened once again, with 10% of the market capitalisation of the mid-tier 50 at June 2010 having been raised over the past two years. While investors were willing to put their hands in their pockets, the mid-tier 50 were reluctant to spend their fortunes with capital investment falling 70% during 2010. The outcome of the Australian Federal Election and the MRRT negotiations appeared to have played a role in cautious investment decision.
On the deals front, Chinese investors continue to target Australian resource companies and projects, however the strengthening A$ no longer favours the foreign investor; as it is increasingly expensive for them to engage in M&A activity in Australia. We have noted a recent trend of Chinese entities seeking control of ASX listed vehicles with African assets, or the ability to spin African assets into these entities as Chinese companies look to leverage off in-country experience and relationships to African projects.
From a cash flow perspective, a focus on debt financing continued to be a key theme, as some companies in the mid-tier 50 rationalised investments or looked to the market for funds to reduce borrowings. By the end of 2010, the mid-tier 50 experienced ‘net zero’ gearing as cash exceeded total borrowings by $1.9 billion.
A significant challenge for the mid-tier 50 over the next 12 months is to balance the expectation of shareholders with the objectives of the companies to ensure that they look to invest in projects that give them ‘bang for their buck’.
In our 2009 publication we asked each company whether they are on the road to recovery. Now that the global financial crisis is behind us and the political arena in Australia is stabilising, the boards of the mid-tier 50 should have growth aspirations at front of mind, as it is time to Rise and Shine.
2
6 PwC
3.1 Market capitalisationBack to where we started
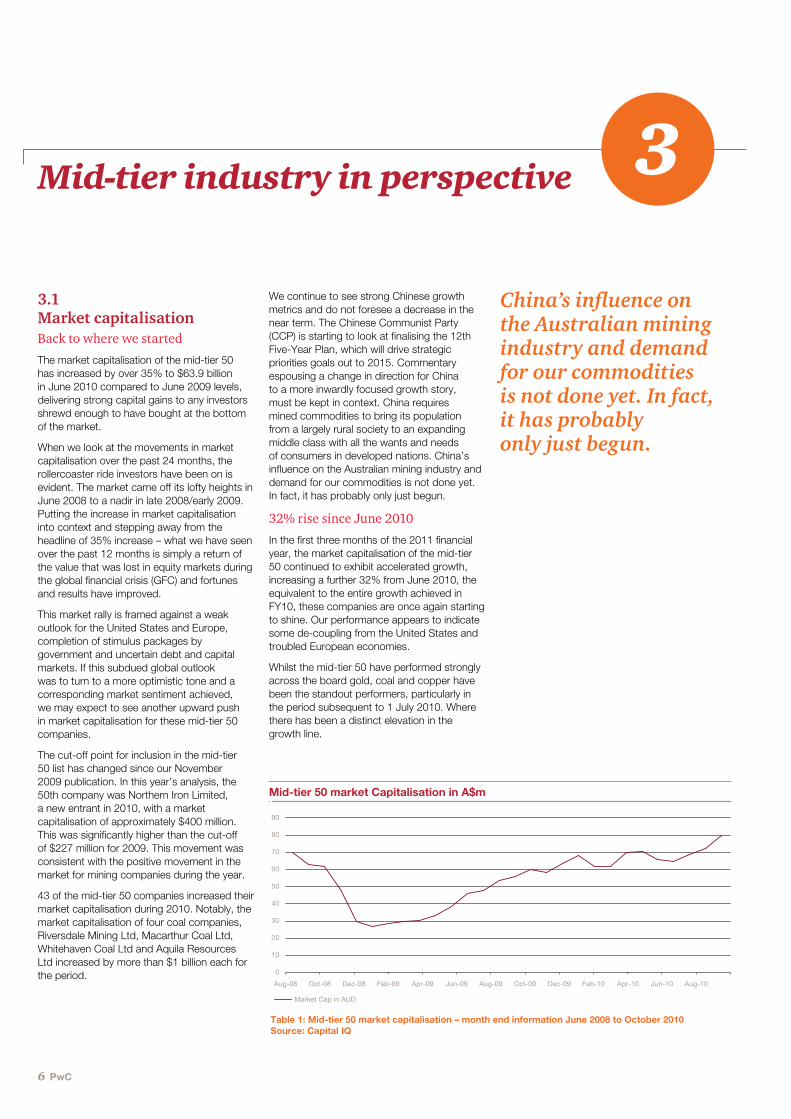
The market capitalisation of the mid-tier 50 has increased by over 35% to $63.9 billion in June 2010 compared to June 2009 levels, delivering strong capital gains to any investors shrewd enough to have bought at the bottom of the market.
When we look at the movements in market capitalisation over the past 24 months, the rollercoaster ride investors have been on is evident. The market came off its lofty heights in June 2008 to a nadir in late 2008/early 2009. Putting the increase in market capitalisation into context and stepping away from the headline of 35% increase – what we have seen over the past 12 months is simply a return of the value that was lost in equity markets during the global financial crisis (GFC) and fortunes and results have improved.
This market rally is framed against a weak outlook for the United States and Europe, completion of stimulus packages by government and uncertain debt and capital markets. If this subdued global outlook was to turn to a more optimistic tone and a corresponding market sentiment achieved, we may expect to see another upward push in market capitalisation for these mid-tier 50 companies.
The cut-off point for inclusion in the mid-tier 50 list has changed since our November 2009 publication. In this year’s analysis, the 50th company was Northern Iron Limited, a new entrant in 2010, with a market capitalisation of approximately $400 million. This was significantly higher than the cut-off of $227 million for 2009. This movement was consistent with the positive movement in the market for mining companies during the year.
43 of the mid-tier 50 companies increased their market capitalisation during 2010. Notably, the market capitalisation of four coal companies, Riversdale Mining Ltd, Macarthur Coal Ltd, Whitehaven Coal Ltd and Aquila Resources Ltd increased by more than $1 billion each for the period.
We continue to see strong Chinese growth metrics and do not foresee a decrease in the near term. The Chinese Communist Party (CCP) is starting to look at finalising the 12th Five-Year Plan, which will drive strategic priorities goals out to 2015. Commentary espousing a change in direction for China to a more inwardly focused growth story, must be kept in context. China requires mined commodities to bring its population from a largely rural society to an expanding middle class with all the wants and needs of consumers in developed nations. China’s influence on the Australian mining industry and demand for our commodities is not done yet. In fact, it has probably only just begun.
32% rise since June 2010
In the first three months of the 2011 financial year, the market capitalisation of the mid-tier 50 continued to exhibit accelerated growth, increasing a further 32% from June 2010, the equivalent to the entire growth achieved in FY10, these companies are once again starting to shine. Our performance appears to indicate some de-coupling from the United States and troubled European economies.
Whilst the mid-tier 50 have performed strongly across the board gold, coal and copper have been the standout performers, particularly in the period subsequent to 1 July 2010. Where there has been a distinct elevation in the growth line.
Mid-tier industry in perspective 3
China’s influence on the Australian mining industry and demand for our commodities is not done yet. In fact, it has probably only just begun.
Market Cap in AUD
0
10
20
30
40
50
60
70
80
90
Aug-08 Oct-08 Dec-08 Feb-09 Apr-09 Jun-09 Aug-09 Oct-09 Dec-09 Feb-10 Apr-10 Jun-10 Aug-10
Mid-tier 50 market Capitalisation in A$m
Table 1: Mid-tier 50 market capitalisation – month end information June 2008 to October 2010Source: Capital IQ
Aussie Mine November 2010 7
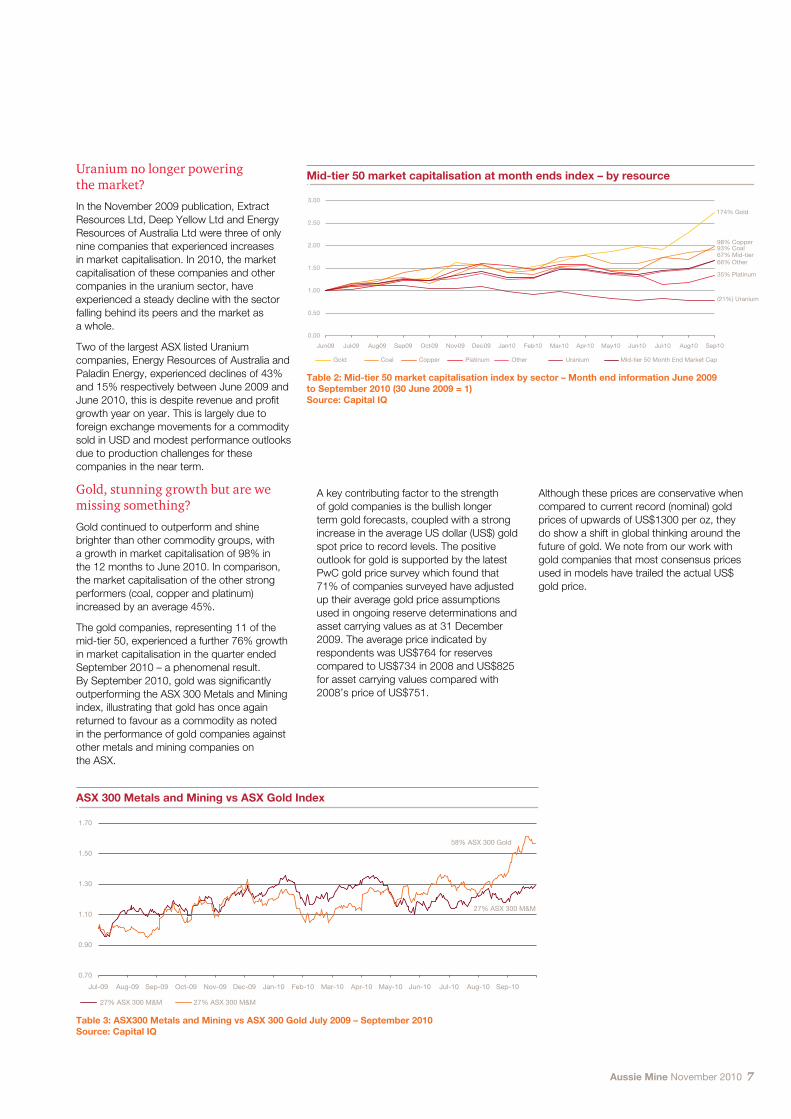
Uranium no longer powering the market?
In the November 2009 publication, Extract Resources Ltd, Deep Yellow Ltd and Energy Resources of Australia Ltd were three of only nine companies that experienced increases in market capitalisation. In 2010, the market capitalisation of these companies and other companies in the uranium sector, have experienced a steady decline with the sector falling behind its peers and the market as a whole.
Two of the largest ASX listed Uranium companies, Energy Resources of Australia and Paladin Energy, experienced declines of 43% and 15% respectively between June 2009 and June 2010, this is despite revenue and profit growth year on year. This is largely due to foreign exchange movements for a commodity sold in USD and modest performance outlooks due to production challenges for these companies in the near term.
Gold, stunning growth but are we missing something?
Gold continued to outperform and shine brighter than other commodity groups, with a growth in market capitalisation of 98% in the 12 months to June 2010. In comparison, the market capitalisation of the other strong performers (coal, copper and platinum) increased by an average 45%.
The gold companies, representing 11 of the mid-tier 50, experienced a further 76% growth in market capitalisation in the quarter ended September 2010 – a phenomenal result. By September 2010, gold was significantly outperforming the ASX 300 Metals and Mining index, illustrating that gold has once again returned to favour as a commodity as noted in the performance of gold companies against other metals and mining companies on the ASX.
0.00
0.50
1.00
1.50
2.00
2.50
3.00
Jun-09 Jul-09 Aug-09 Sep-09 Oct-09 Nov-09 Dec-09 Jan-10 Feb-10 Mar-10 Apr-10 May-10 Jun-10 Jul-10 Aug-10 Sep-10
Gold Coal Copper Platinum Other Uranium Mid-tier 50 Month End Market Cap
174% Gold
(21%) Uranium
35% Platinum
98% Copper93% Coal67% Mid-tier66% Other
Mid-tier 50 market capitalisation at month ends index – by resource
27% ASX 300 M&M 27% ASX 300 M&M
58% ASX 300 Gold
27% ASX 300 M&M
Jul-09 Aug-09 Sep-09 Oct-09 Nov-09 Dec-09 Jan-10 Feb-10 Mar-10 Apr-10 May-10 Jun-10 Jul-10 Aug-10 Sep-10
0.70
0.90
1.10
1.30
1.50
1.70
ASX 300 Metals and Mining vs ASX Gold Index
A key contributing factor to the strength of gold companies is the bullish longer term gold forecasts, coupled with a strong increase in the average US dollar (US$) gold spot price to record levels. The positive outlook for gold is supported by the latest PwC gold price survey which found that 71% of companies surveyed have adjusted up their average gold price assumptions used in ongoing reserve determinations and asset carrying values as at 31 December 2009. The average price indicated by respondents was US$764 for reserves compared to US$734 in 2008 and US$825 for asset carrying values compared with 2008’s price of US$751.
Although these prices are conservative when compared to current record (nominal) gold prices of upwards of US$1300 per oz, they do show a shift in global thinking around the future of gold. We note from our work with gold companies that most consensus prices used in models have trailed the actual US$ gold price.
Table 2: Mid-tier 50 market capitalisation index by sector – Month end information June 2009 to September 2010 (30 June 2009 = 1)Source: Capital IQ
Table 3: ASX300 Metals and Mining vs ASX 300 Gold July 2009 – September 2010Source: Capital IQ
8 PwC
But A$ gold…
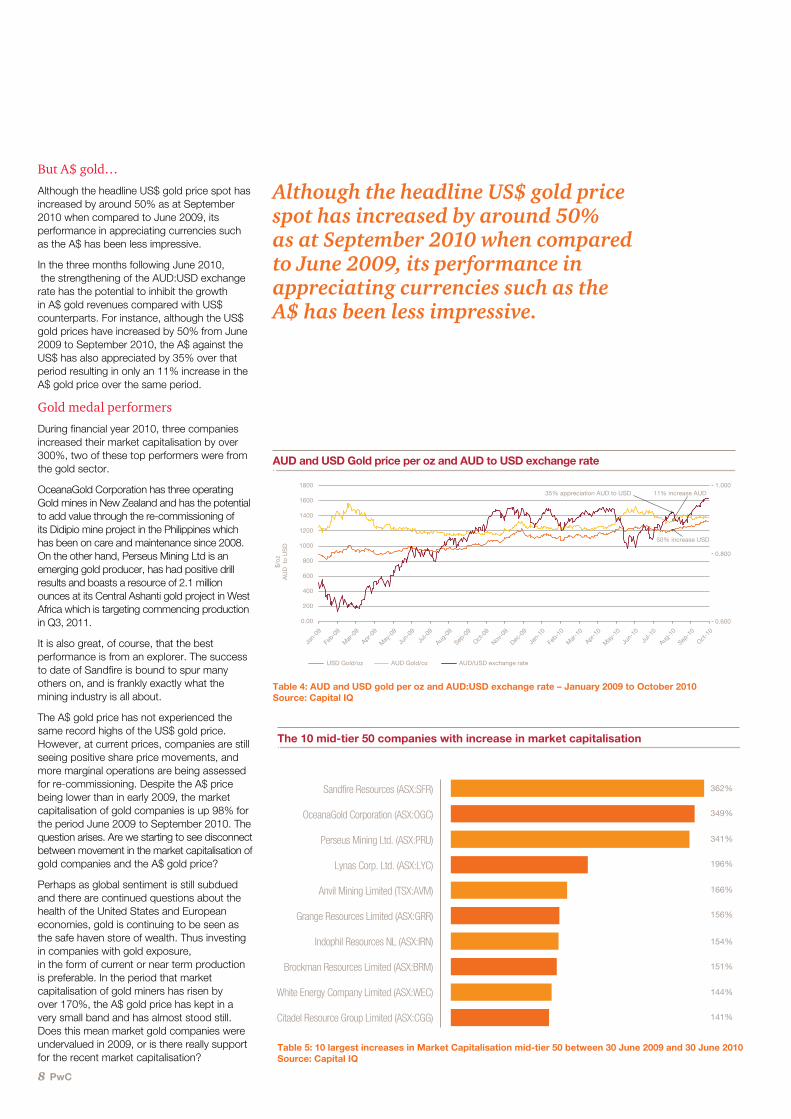
Although the headline US$ gold price spot has increased by around 50% as at September 2010 when compared to June 2009, its performance in appreciating currencies such as the A$ has been less impressive.
In the three months following June 2010, the strengthening of the AUD:USD exchange rate has the potential to inhibit the growth in A$ gold revenues compared with US$ counterparts. For instance, although the US$ gold prices have increased by 50% from June 2009 to September 2010, the A$ against the US$ has also appreciated by 35% over that period resulting in only an 11% increase in the A$ gold price over the same period.
Gold medal performers
During financial year 2010, three companies increased their market capitalisation by over 300%, two of these top performers were from the gold sector.
OceanaGold Corporation has three operating Gold mines in New Zealand and has the potential to add value through the re-commissioning of its Didipio mine project in the Philippines which has been on care and maintenance since 2008. On the other hand, Perseus Mining Ltd is an emerging gold producer, has had positive drill results and boasts a resource of 2.1 million ounces at its Central Ashanti gold project in West Africa which is targeting commencing production in Q3, 2011.
It is also great, of course, that the best performance is from an explorer. The success to date of Sandfire is bound to spur many others on, and is frankly exactly what the mining industry is all about.
The A$ gold price has not experienced the same record highs of the US$ gold price. However, at current prices, companies are still seeing positive share price movements, and more marginal operations are being assessed for re-commissioning. Despite the A$ price being lower than in early 2009, the market capitalisation of gold companies is up 98% for the period June 2009 to September 2010. The question arises. Are we starting to see disconnect between movement in the market capitalisation of gold companies and the A$ gold price?
Perhaps as global sentiment is still subdued and there are continued questions about the health of the United States and European economies, gold is continuing to be seen as the safe haven store of wealth. Thus investing in companies with gold exposure, in the form of current or near term production is preferable. In the period that market capitalisation of gold miners has risen by over 170%, the A$ gold price has kept in a very small band and has almost stood still. Does this mean market gold companies were undervalued in 2009, or is there really support for the recent market capitalisation?
Although the headline US$ gold price spot has increased by around 50% as at September 2010 when compared to June 2009, its performance in appreciating currencies such as the A$ has been less impressive.
Sandfire Resources (ASX:SFR) 362%
349%
341%
196%
166%
156%
154%
151%
144%
141%
OceanaGold Corporation (ASX:OGC)
Perseus Mining Ltd. (ASX:PRU)
Lynas Corp. Ltd. (ASX:LYC)
Anvil Mining Limited (TSX:AVM)
Grange Resources Limited (ASX:GRR)
Indophil Resources NL (ASX:IRN)
Brockman Resources Limited (ASX:BRM)
White Energy Company Limited (ASX:WEC)
Citadel Resource Group Limited (ASX:CGG)
The 10 mid-tier 50 companies with increase in market capitalisation
Table 5: 10 largest increases in Market Capitalisation mid-tier 50 between 30 June 2009 and 30 June 2010Source: Capital IQ
USD Gold/oz AUD Gold/oz AUD/USD exchange rate
0.00
200
400
600
800
1000
1200
1400
1600
1800
0.600
0.800
$/oz
AU
D t
o U
SD
1.00011% increase AUD
50% increase USD
35% appreciation AUD to USD
Jan-
09
Feb-0
9
Mar
-09
Apr-09
May
-09
Jun-
09
Jul-0
9
Aug-0
9
Sep-0
9
Oct-0
9
Nov-0
9
Dec-0
9
Jan-
10
Feb-1
0
Mar
-10
Apr-10
May
-10
Jun-
10
Jul-1
0
Aug-1
0
Sep-1
0
Oct-1
0
AUD and USD Gold price per oz and AUD to USD exchange rate
Table 4: AUD and USD gold per oz and AUD:USD exchange rate – January 2009 to October 2010Source: Capital IQ

Aussie Mine November 2010 9
3.2 Comparison of the mid-tier 50 to other performance measures In our November 2009 publication we investigated whether the significant fluctuations in mid-tier 50 market capitalisations were anomalies specific to the Australian economy. We noted that flailing market conditions and poor commodity prices for base metals resulting from the global economic downturn impacted resource companies across the world, with the three comparative indices (ASX 300 Metals and Mining, FTSE 350 Mining Index and TSX Global Mining Index) all virtually mirroring each other in a downward trend, finishing approximately 20% below June 2008 levels.
In 2010, this downward trend has been reversed, with all three key indexes increasing by more than 15% as commodity prices have bounced back towards pre-global economic downturn levels and optimism has crept back into the mining sector globally. The resilience of the Chinese economy and continued potential of Brazil, Russia, India and developing nations, has maintained or increased demand for our commodities to record levels, and this demand side influence has helped to pull the mining markets out of the price depression caused by the global economic downturn.
Recent data reveals that the best performing market over the 12 months to June 2010 has been the FTSE 350 Mining index (FTSE 350), which has increased 32% compared to 27% and 15% for the TSX Global Mining Index (GMI) and ASX 300 Metals and Mining (ASX 300 M&M) respectively.
In the three months post June 2010, these markets have continued to rally with the FTSE 350 and GMI both increasing a further 25%. This compares to only a 13% increase for the ASX300 M&M. Australian listed mining companies are lagging when compared to their global peers. The question is, ‘Why is this the case when we consider that headline commodity prices are strong and we are a commodity supplier’? Is it the strength of the A$? Or is it the fact that other markets have become more attractive to investors given the lack of certainty around key issues in the Australian mining industry such as the resource tax and emissions reduction?
One possible issue that may have had an impact on the performance the Australian Market in 2010 has been the controversial plan to impose a new tax regime on Australian mining operations. The media coverage the RSPT generated was astounding. Indeed the political landscape from the time it was announced has been fascinating.
As already stated, the Australian mining index has lagged behind that of Canada and the UK over the past 18 months. This is not what Australian investors want to see. We also note that foreign investors view Australia as having blotted its copy book this year by announcing the RSPT. Clearly investors do not like uncertainty and question marks over taxes, carbon prices and industrial relations policy may keep a lid on some of the ambitions of the miners and their share price.
With the growth in commodity prices and strong continued demand from Asia’s industrialising economies we can expect to see demand for investment in the mid-tier 50 continue to rise. The Australian miners and the market look set to benefit if a suitable resolution with respect to the MRRT can be brokered, despite the challenge of a minority government to effect change within this parliamentary term.
All of this points to the Australian mid-tier being undervalued against the global counterparts, indicating there is a long way further to rise and shine.
S&P/ASX 300 Metals and Mining - Index Value FTSE 350 Mining Index S&P/TSX Global Mining Index - Index Value
57% FTSE
32% FTSE 35027% TSX GMI15% ASX M&M
52% TSX GMI
28% ASX M&M
0.80
1.00
1.20
1.40
1.60
1.80
Jul-09 Aug-09 Sep-09 Oct-09 Nov-09 Dec-09 Jan-10 Feb-10 Mar-10 Apr-10 May-10 Jun-10 Jul-10 Aug-10 Sep-10
Comparison of key mining indices
S&P/ASX 300 Metals & Mining - Index Value
2 weeks prior to RSPT announcement RSPT announcement
MRRT announcement
Australian election
2500
3000
3500
4000
4500
5000
5500
Jul-09 Aug-09 Sep-09 Oct-09 Nov-09 Dec-09 Jan-10 Feb-10 Mar-10 Apr-10 May-10 Jun-10 Jul-10 Aug-10 Sep-10
S&P/ASX 300 Metals and Mining – Index Value
Table 6: Comparison of key mining indices July 2009 – September 2010 (July 2009 =1)Source: Capital IQ
Table 7: S&P/ASX 300 Metals and Mining index July 2009 to September 2010Source: Capital IQ

10 PwC
3.3 M&A–fromnecessityto opportunityM&A activity in the mid-tier 50 shifted focus from being a necessity in the latter part of 2008 and the early half of 2009, to opportunity in 2010. The necessity was driven by declining commodity prices and lack of access to debt and equity markets forcing a number of companies to transact to survive. M&A activity became an alternative means of accessing cash in order to ensure survival during the GFC.
Since then, commodity prices have rebounded, credit is more forthcoming as optimism slowly returns to the market and companies have sured up their balance sheets through capital raisings totalling $29.7 billion. The mid-tier 50 holds $7.3 billion of cash on hand, indicating that there is an opportunity for many companies to capitalise on investment opportunities as they arise both in transactions and through funding organic growth. Mid-tier 50 must learn the lessons of the high impairment charges incurred last year in consideration of future opportunities.
There is still strong demand from overseas investors, notably China, however there have been two pivotal changes to the M&A environment since early 2009. Firstly, the strengthening A$ has made Australian assets more expensive. Secondly, there is now competition from within Australia. In late 2008 and early 2009, there was very limited M&A price tension from within the mid-tier 50 (as reported in our November 2009 publication). By contrast, in the current climate, with significant cash reserves and lower debt levels that now characterise many mid-tier 50 companies, M&A activity is back on the agenda.
Deals since June 2009
Since June 2009, the mid-tier 50 companies were named in 35 potential transactions, totalling $30.9 billion; of which approximately 30% have been completed. The average deal value since June 2009 is $875 million, largely consistent with our November 2009 publication where the average was $890m. The more notable difference is that the number of transactions have increased significantly from 10 in our November 2009 publication to 35 in the current year. This increase has been driven by two significant shifts in the M&A activity.
The first is that there are more Australian based companies entering into M&A transactions. The M&A activity by mid-tier companies was not evident in our November 2009 publication which is in stark contrast against the current year where the deal value of M&A activity by Australian mid-tier companies, in their capacity as bidders, and not targets, is $6.8 billion. This alone represents approximately 75% of all M&A activity (by value) across the mid-tier 50 in the previous year.
The second important factor is that M&A activity continued unabated post the announcement on 2 May 2010 of the Resource Super Profits Tax (RSPT), now rebranded as the Mineral Resource Rent Tax (MRRT). Acquiring entities compensated for the uncertainty surrounding changes to the tax regime by reflecting the additional risk in the bid price; thereby reducing it. The most significant example of this was Peabody Energy’s bid for Macarthur Coal. Peabody Energy announced a $16 per share bid for Macarthur Coal in April 2010, which was rejected by the target. Following this failed bid, a second attempt was launched at $15 per share in May 2010 on the claim that uncertainty surrounding the RSPT had impacted the bid price. This offer was rejected by Macarthur’s board and major shareholders.
The most significant completed acquisition of a mid-tier 50 company since June 2009 was Yanzhou’s $3.4 billion acquisition of Felix Resources in August 2009.
M&A activity continued unabated post the announcement on 2 May 2010 of the Resource Super Profits Tax (RSPT), now rebranded as the Mineral Resource Rent Tax (MRRT). Acquiring entities compensated for the uncertainty surrounding changes to the tax regime by reflecting the additional risk in the bid price; thereby reducing it.
The most significant completed acquisition of a mid-tier 50 company since June 2009 was Yanzhou’s $3.4 billion acquisition of Felix Resources in August 2009.

Aussie Mine November 2010 11
Completed M&A activity in the mid-tier 50, greater than A$15 million.
Target Acquirer Acquirer countryof origin
Ownership interest
Approximate deal value (A$m)
Announcement date
Status
Felix Resources Limited Yanzhou Coal Mining Co Ltd
China 100.0% 3,393 13/08/2009 Completed
Aquila Resources Limited Vale Belvedere Pty Ltd Brazil 24.5% 1,991 4/06/2010 Completed
Centennial Coal Company Limited
Banpu Minerals (Singapore) Pte Ltd
Thailand 100.0% 1,958 5/07/2010 Completed
Middlemount JV Gloucester Coal Limited Australia unknown interest 472 4/08/2010 Completed
Aquila Resources Limited Baoshan Iron & Steel Company Ltd
China 14.3% 289 28/08/2009 Completed
Riversdale Mining Limited Companhia Siderurgica Nacional (CSN)
Brazil 16.3% 190 24/11/2009 Completed
Mt Gibson Iron Limited Fushan International Energy Group Ltd
Hong Kong 14.3% 178 22/09/2009 Completed
Aurox Resources Limited Atlas Iron Limited Australia Merger 143 10/03/2010 Completed
Polaris Metals NL Mineral Resources Limited
Australia 100.0% 136 20/08/2009 Completed
Dioro Exploration NL Avoca Resources Australia 100.0% 115 29/12/2009 Completed
Sandfire Resources NL Oz Minerals Limited Australia 19.0% 100 2/07/2010 Completed
Warwick Resources Limited
Atlas Iron Limited Australia Merger 56 8/09/2009 Completed
Medusa Mining Limited
Metalloinvest Holding Russia 10.0% 54 11/11/2009 Completed
Indophil Resources NL
San Miguel Corp Philippines 10.0% 41 8/10/2010 Completed
Barrick (PD) Australia Ltd
Ivanhoe Australia Limited
Australia Osborne Copper Gold Asset
17 25/05/2010 Completed
Total 9,133
Table 8: Completed M&A activity in the mid-tier 50 between June 2009 and October 2010 greater than A$15 millionSource: mergermarkets
12 PwC
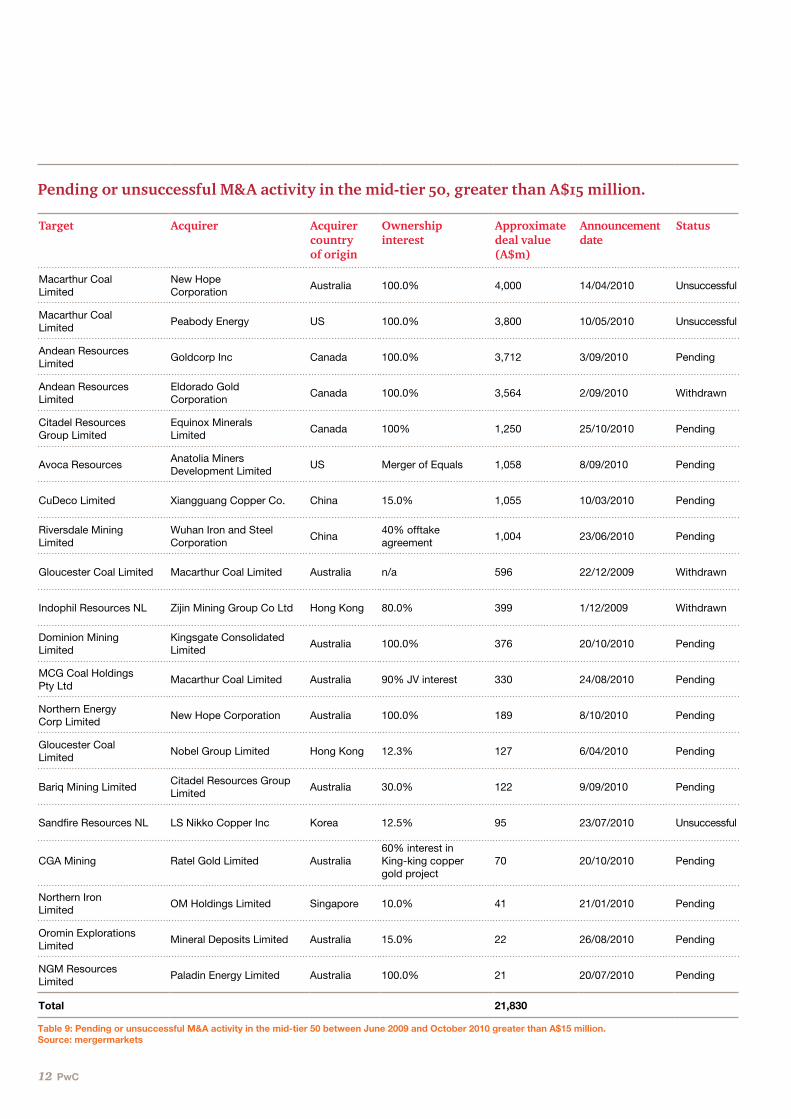
Pending or unsuccessful M&A activity in the mid-tier 50, greater than A$15 million.
Target Acquirer Acquirer countryof origin
Ownership interest
Approximate deal value (A$m)
Announcement date
Status
Macarthur Coal Limited
New Hope Corporation
Australia 100.0% 4,000 14/04/2010 Unsuccessful
Macarthur Coal Limited
Peabody Energy US 100.0% 3,800 10/05/2010 Unsuccessful
Andean Resources Limited
Goldcorp Inc Canada 100.0% 3,712 3/09/2010 Pending
Andean Resources Limited
Eldorado Gold Corporation
Canada 100.0% 3,564 2/09/2010 Withdrawn
Citadel Resources Group Limited
Equinox Minerals Limited
Canada 100% 1,250 25/10/2010 Pending
Avoca Resources Anatolia Miners Development Limited
US Merger of Equals 1,058 8/09/2010 Pending
CuDeco Limited Xiangguang Copper Co. China 15.0% 1,055 10/03/2010 Pending
Riversdale Mining Limited
Wuhan Iron and Steel Corporation
China 40% offtake agreement
1,004 23/06/2010 Pending
Gloucester Coal Limited Macarthur Coal Limited Australia n/a 596 22/12/2009 Withdrawn
Indophil Resources NL Zijin Mining Group Co Ltd Hong Kong 80.0% 399 1/12/2009 Withdrawn
Dominion Mining Limited
Kingsgate Consolidated Limited
Australia 100.0% 376 20/10/2010 Pending
MCG Coal Holdings Pty Ltd
Macarthur Coal Limited Australia 90% JV interest 330 24/08/2010 Pending
Northern Energy Corp Limited
New Hope Corporation Australia 100.0% 189 8/10/2010 Pending
Gloucester Coal Limited
Nobel Group Limited Hong Kong 12.3% 127 6/04/2010 Pending
Bariq Mining Limited Citadel Resources Group Limited
Australia 30.0% 122 9/09/2010 Pending
Sandfire Resources NL LS Nikko Copper Inc Korea 12.5% 95 23/07/2010 Unsuccessful
CGA Mining Ratel Gold Limited Australia 60% interest in King-king copper gold project
70 20/10/2010 Pending
Northern Iron Limited
OM Holdings Limited Singapore 10.0% 41 21/01/2010 Pending
Oromin Explorations Limited
Mineral Deposits Limited Australia 15.0% 22 26/08/2010 Pending
NGM Resources Limited
Paladin Energy Limited Australia 100.0% 21 20/07/2010 Pending
Total 21,830
Table 9: Pending or unsuccessful M&A activity in the mid-tier 50 between June 2009 and October 2010 greater than A$15 million.Source: mergermarkets

Aussie Mine November 2010 13
Completed: Yanzhou Coal Mining Co Ltd acquired Felix Resources Limited for
A$3.4bn Completed: Vale Belvedere Pty Ltd acquired 24% of Aquila Resources Limited for
Completed: Banpu Minerals (Singapore) Pte Ltd acquired Centennial Coal Company Limited for
Pending: Xiangguang Copper Co. acquiring CuDeco Limited forPending:
Wuhan Iron and Steel Corporation acquiring Riversdale Mining Limited for
A$2bn A$2bn
A$1.1bn
Pending: Goldcorp Inc acquiring Andean Resources Limited for
Pending: Anatolia Miners Development Limited merging with Avoca Resources for
A$3.7bn
A$1.1bn
A$1bn
Pending: Equinox Minerals Limited acquiring Citadel Resources Group Limited for
A$1.3bn

14 PwC
3.4Movements in the mid-tier 50Mixed bag of new entrants – growth across the board
The new entrants into this year’s analysis represent a diverse range of commodity groups including gold, copper, iron ore and coal. There has been strong growth across the sector and gold plays stand-out. Companies such as Perseus Mining Ltd, OceanaGold Corporation, Sandfire Resources and Resolute Mining Ltd have all entered our list – as strong growth in market cap has been delivered following further exploration of deposits and a surge in underlying gold prices. All up there were 11 new entrants in 2010.
Exits from the mid-tier are primarily driven by volatility in market capitalisations of the smaller end of the list. However, three significant exits for other reasons are noteworthy. The takeover of Felix Resources by Yanzhou Coal and the takeover of Sino Gold by Eldorado Gold Corp continues the theme of foreign interest which was noted in last year’s publication. The third exit is by Centamin Egypt who chose to de-list from the ASX and maintain LSE and TSX listing.
Despite market capitalisation for the mid-tier 50 increasing in aggregate by over 35% from June 2009 over the course of the 2010 financial year none of the companies included in last year’s publication have grown beyond our $5 billion ceiling for inclusion in the mid-tier 50. There continues to be a pronounced separation between the big end of town and the largest company by market capitalisation in our analysis, which is Alumina Ltd at $3.7 billion. BHP Billiton, Rio Tinto, Newcrest, Coal & Allied and Fortescue Metals continue to be excluded from the list on the basis that their market capitalisation exceeded the $5 billion threshold.
The new entrants into this year’s analysis represent a diverse range of commodity groups including gold, copper, iron ore and coal.
Aussie Mine November 2010 15
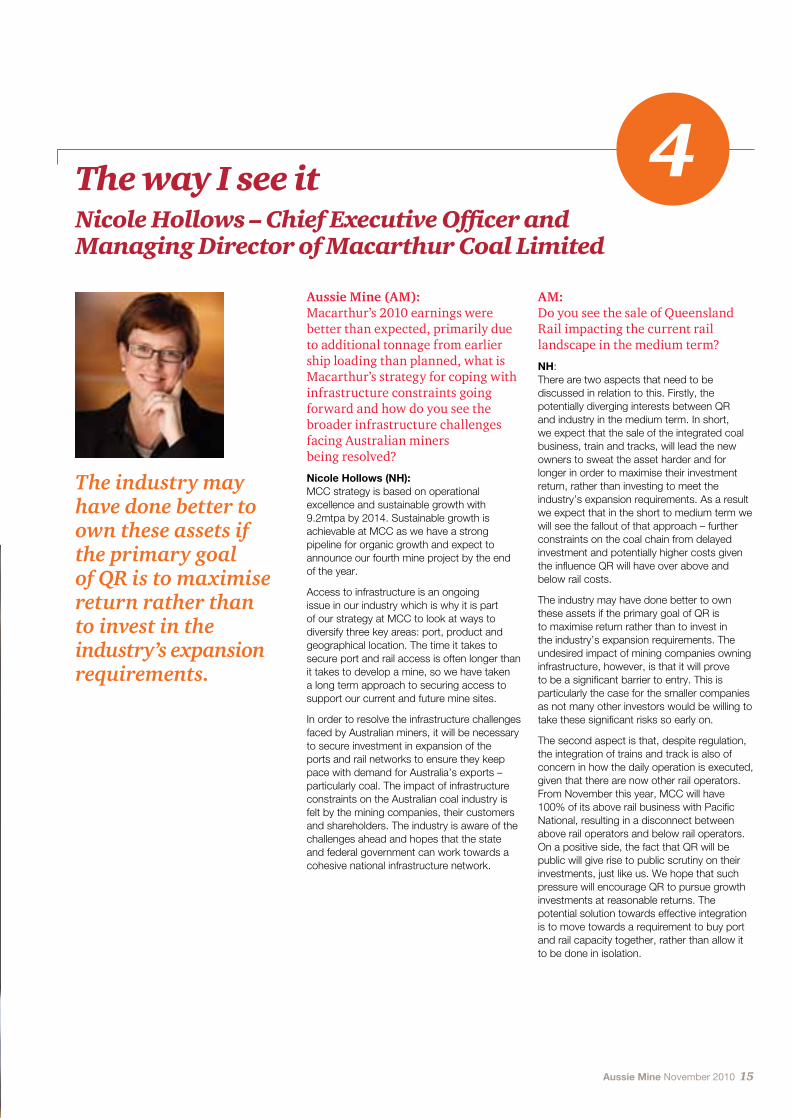
The way I see itNicole Hollows – Chief Executive Officer andManaging Director of Macarthur Coal Limited
4
The industry may have done better to own these assets if the primary goal of QR is to maximise return rather than to invest in the industry’s expansion requirements.
AussieMine(AM): Macarthur’s 2010 earnings were better than expected, primarily due to additional tonnage from earlier ship loading than planned, what is Macarthur’s strategy for coping with infrastructure constraints going forward and how do you see the broader infrastructure challenges facing Australian miners being resolved?
Nicole Hollows (NH): MCC strategy is based on operational excellence and sustainable growth with 9.2mtpa by 2014. Sustainable growth is achievable at MCC as we have a strong pipeline for organic growth and expect to announce our fourth mine project by the end of the year.
Access to infrastructure is an ongoing issue in our industry which is why it is part of our strategy at MCC to look at ways to diversify three key areas: port, product and geographical location. The time it takes to secure port and rail access is often longer than it takes to develop a mine, so we have taken a long term approach to securing access to support our current and future mine sites.
In order to resolve the infrastructure challenges faced by Australian miners, it will be necessary to secure investment in expansion of the ports and rail networks to ensure they keep pace with demand for Australia’s exports – particularly coal. The impact of infrastructure constraints on the Australian coal industry is felt by the mining companies, their customers and shareholders. The industry is aware of the challenges ahead and hopes that the state and federal government can work towards a cohesive national infrastructure network.
AM: Do you see the sale of Queensland Rail impacting the current rail landscape in the medium term?
NH: There are two aspects that need to be discussed in relation to this. Firstly, the potentially diverging interests between QR and industry in the medium term. In short, we expect that the sale of the integrated coal business, train and tracks, will lead the new owners to sweat the asset harder and for longer in order to maximise their investment return, rather than investing to meet the industry’s expansion requirements. As a result we expect that in the short to medium term we will see the fallout of that approach – further constraints on the coal chain from delayed investment and potentially higher costs given the influence QR will have over above and below rail costs.
The industry may have done better to own these assets if the primary goal of QR is to maximise return rather than to invest in the industry’s expansion requirements. The undesired impact of mining companies owning infrastructure, however, is that it will prove to be a significant barrier to entry. This is particularly the case for the smaller companies as not many other investors would be willing to take these significant risks so early on.
The second aspect is that, despite regulation, the integration of trains and track is also of concern in how the daily operation is executed, given that there are now other rail operators. From November this year, MCC will have 100% of its above rail business with Pacific National, resulting in a disconnect between above rail operators and below rail operators. On a positive side, the fact that QR will be public will give rise to public scrutiny on their investments, just like us. We hope that such pressure will encourage QR to pursue growth investments at reasonable returns. The potential solution towards effective integration is to move towards a requirement to buy port and rail capacity together, rather than allow it to be done in isolation.

16 PwC
AM: Talk of carbon tax has recently returned to the political arena, Keith De Lacy (Macarthur Chairman) has recently expressed some concern over reducing the competitiveness of efficiently mined, high calorific Australian coal compared with less efficient foreign sources, what is your view of the best way forward on emissions?
NH: First of all it should be noted that the industry, as a whole, is supportive of reducing emissions. The key issue has become how this should be done. We believe that an approach towards an effective emissions reduction scheme should be transitional, practical and internationally competitive. Companies should be incentivised, by way of an offset, to invest in technologies that reduce emissions because currently the only method for reducing emissions is to reduce output. Reducing output is not only unpractical and devastating to the Australian economy, but there is no evidence to indicate this method would lessen emissions on a global scale. This is because Australia, in general, exports high quality coal which allows lower quantities to be used in a blast furnace to manufacture steel. If an emissions reduction scheme were imposed and output in Australia were to be cut back, the developing countries would simply source additional coal to fill the supply gap from other countries with a lower quality coal, thereby increasing the quantity required to make the same amount of steel. This would ultimately increase the intensity of emissions on a global scale.
AM: What do you see as the main challenges and unresolved areas of MRRT in its current form?
NH: I think we can all agree that the MRRT is an improvement from the previously disastrous RSPT. Having said that, it is critical not to underestimate the complexity of a resources rent tax. The petroleum industry tax still has issues that require attention and they have had twenty years to hammer out the detail. The issues that we face with the MRRT can be split into two components:
1. The lack of clarity. Importantly there is no clarity over the definition of a project, including the ability to transfer profits and costs, the taxation point or valuation methodologies. Furthermore there is no real clarity as to whether this is a resource rent tax or a profits tax. We currently pay around 42-43% effective tax and it is important for the government to realise that we need to remain internationally competitive if the industry is to continue to provide a revenue
stream for government and fund future growth and jobs. The discussions around the detail of the tax are showing some inconsistencies around the point at which the value of the product is determined compared to the point at which costs are eligible as deductions
2. The additional administration burden. This will particularly be felt by the smaller companies who do not initially fall under the MRRT but need to keep records in the event that their profits reach a level where they are required to pay.
AM: There has been a large amount of M&A activity impacting Macarthur and your competitors this past year. Do you expect this to continue and do you see any change to the types of buyers involved in these transactions?
AM: International demand for coal has been particularly strong, are there any particular trends emerging or shifts in demand that you see?
NH: We continue to see growth in demand from the developing countries particularly China, Brazil and India. Steel production is now at pre-GFC levels, with over half the increase in demand stemming from China to fuel their urbanisation and infrastructure programs. Incidentally China has now become a net importer rather than exporter of metcoal, importing 40 mtpa (whilst the whole seaborne metcoal trade is approximately 250 mtpa).
Globally, steel industry customers are increasingly able to take PCI coal as a cost effective means of reducing the amount of coking coal required for the blast furnaces and this will result in ongoing growth in the PCI coal market. We expect ageing coke ovens and blast furnace expansions to create stronger differential growth for LV PCI coal.
NH: Our focus is on organic growth, but we will consider acquisitions where they align with the business strategy and our focus on sustainable growth. MCC would now consider offshore investment if aligned to strategy. This decision has primarily been driven by the increased regulation and approval process in Australia. There is nothing wrong with the regulation, the issue becomes how it is rolled out from a cost and time perspective. Currently in Australia, the process to obtain a mining licence can take between four to five years which is quite significant. There has also been a shift of costs in Australia, previously Australia was considered a low cost area, currently with the increasing infrastructure and labour costs, this is no longer the case.
In terms of the buyers involved in the M&A transactions, we expect to see more users and sovereign type investors. Examples of these at MCC are POSCO and the CITIC group respectively. The reasons behind the increased interest are to secure supply and to gain better access to the Australian market. Mining companies will also need size and scale to marry up with the large infrastructure commitments required to get product from the mine to the market.
AM: There has recently been a push by the Australian Institute of Company Directors to boost female board representation. Do you think more should be done in this area and how do you think more balance may be achieved?
NH: I am an advocate of creating a pipeline for talent rather than relying on quotas at the end point. At MCC we have 33% female executives and over 40% female managers and that makes it easier to achieve diversity at the senior levels of the organisation.
Lifestyle choices have previously played a significant part in the low levels of female representations at the board level. In the age of high cost and inflexible childcare costs it was generally accepted for a parent, usually the female, to stay at home and care for their children. This mindset, however, is slowly changing and the choice to stay at home is now an economic decision; with the parent with the best earning capacity continuing to work.
NH: If an emissions reduction scheme were imposed and output in Australia were to be cut back, the developing countries would simply source additional coal to fill the supply gap from other countries with a lower quality coal, thereby increasing the quantity required to make the same amount of steel.

Aussie Mine November 2010 17
We currently pay around 42-43% effective tax and it is important for the government to realise that we need to remain internationally competitive if the industry is to continue to provide a revenue stream for government and fund future growth and jobs.
Lastly, in order to address this lack of female board representation, it is important for women to learn to be less cautious in taking on new opportunities. There is some evidence that suggest women wait until they feel 100% capable of stepping up rather than accepting that some of the skills needed will be learnt on the job.
AM: In your role as the President of the QRC what are the big issues on your radar - aside from infrastructure and MRRT?
NH: There are several national priorities currently on our radar. Firstly, the national health and safety harmonisation agenda is a key issue. Locally, the challenge is that the Queensland Government is determined to retain local mine safety laws. There are clearly also local concerns relating to the inadequacies of the current industry input to governance of the health and safety system. Secondly, energy and climate change policy has previously been an issue on our radar. While possibly on the backburner at present, it is an issue that is expected to loom large on the national agenda after the next federal election. Lastly, skills, education and training is a core issue. The national context is the impending report of the National Resource Sector Employment Taskforce.
AM: What do you see as the main opportunities and challenges facing the wider Australian mid-tier mining industry?
NH: The main challenge facing this industry is the cost and access to skilled labour. If all projects are given the green light (the CSG projects in Gladstone, LNG projects in North Western Shelf and the Rio Tinto project in Pilbara) there would be a further and significant tightening in skilled labour availability. The key here is to ensure appropriate education and training for young Australians. This can be done through various channels such as increased trade based education in schools in conjunction with practical industry training. Not only would this assist to alleviate the skills shortage, but it also means that the young Australians are better equipped for the workforce as a result of their education gained at school and their practical experience gained from the industry.
Other challenges in the industry relate to access to capital, securing infrastructure and being able to make the financial commitments to secure long term access. Managing the continuous increase in costs (as a result of carbon taxes, MRRT, regulatory changes, labour costs, the list continues!).
At MCC we have 33%
female executives and over 40% female managers and that makes it easier to achieve diversity at the senior levels of the organisation.
The key opportunity that faces this industry is the strong long term demand for Australian products. Furthermore, the investment in the infrastructure at Wiggins Island Port and the rail development will ensure continued growth in this industry.
The key opportunity that faces this industry is the strong long term demand for Australian products. Furthermore, the investment in the infrastructure at Wiggins Island Port and the rail development will ensure continued growth in this industry.

18 PwC
2010 A$m
2009 A$m
Change %
Revenue from ordinary activities
- Operating revenue 11,317 8,561 32%
- Non-operating revenue 197 391 (50%)
Total Revenue 11,513 8,952 29%
Less expenses from ordinary activities (8,639) (6,108) 41%
Exploration expenses (378) (456) (17%)
Operating Expenses (9,018) (6,564) 37%
Gross Profit 2,496 2,388 5%
Other income/ (expenses) (141) 124 (214%)
Adjusted EBITDA 2,355 2,512 (6%)
Gain / (loss) on sale of investments (354) 487 (173%)
Impairment (111) (1,738) (94%)
EBITDA 1,890 1,262 50%
Depreciation and amortisation (1,134) (796) 43%
EBIT 756 466 62%
Net interest expense (359) (382) (6%)
Profit from ordinary activities before tax 397 84 373%
Income tax expense (423) (706) (40%)
Net Profit / (Loss) (26) (622) 96%
RevenueTop five mid-tier companies by revenue:
CompanyName 2010 A$m
2009 A$m
Change %
1 Centennial Coal 808 895 (10%)
2 Energy Resources Australia 773 685 13%
3 New Hope 745 701 6%
4 Macarthur Coal 681 762 (11%)
5 OZ Minerals / Oxiana 609 01 100%
1) Nil revenue recognised in 2009 as a result of the sale of certain assets to Minmetals. The assets have been classified as discontinued operations and therefore not included in the revenue from continuing operations result. 2010 revenue is from Prominent Hill.
Aggregated industry income statement
5
Aussie Mine November 2010 19
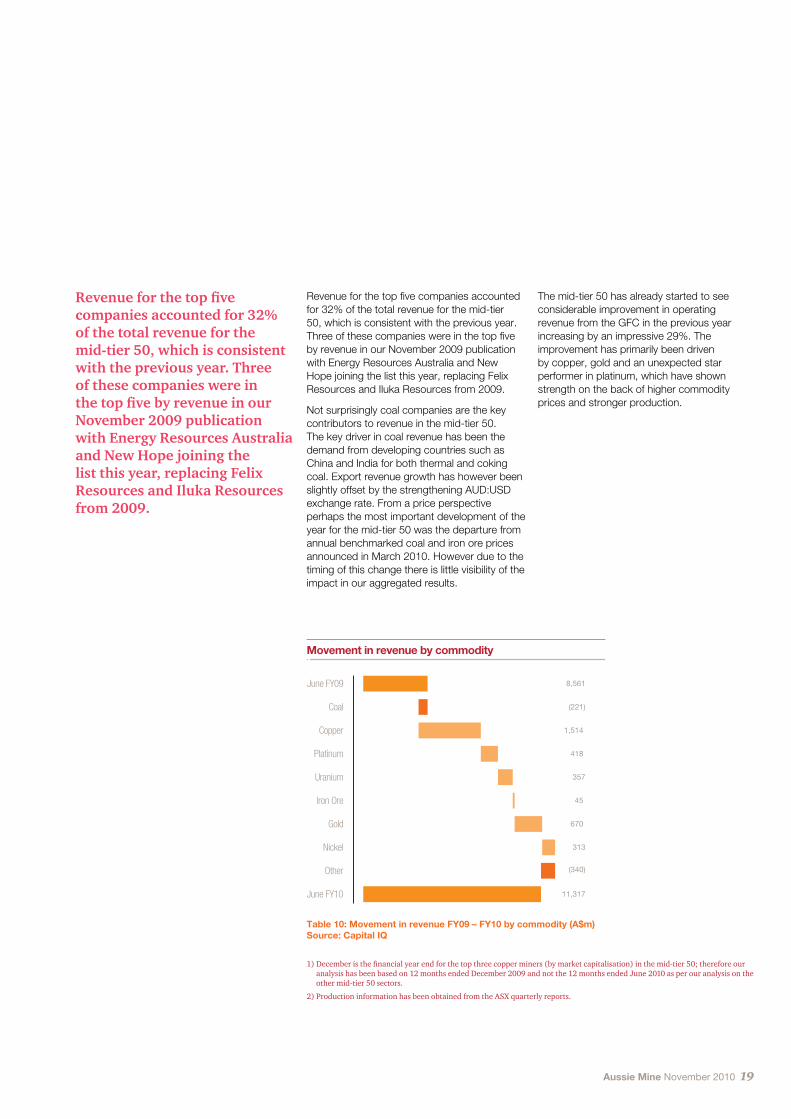
Revenueforthetopfivecompanies accounted for 32% of the total revenue for the mid-tier 50, which is consistent with the previous year. Three of these companies were in thetopfivebyrevenueinourNovember2009publication withEnergyResourcesAustraliaandNewHopejoiningthelist this year, replacing Felix ResourcesandIlukaResources from 2009.
Revenue for the top five companies accounted for 32% of the total revenue for the mid-tier 50, which is consistent with the previous year. Three of these companies were in the top five by revenue in our November 2009 publication with Energy Resources Australia and New Hope joining the list this year, replacing Felix Resources and Iluka Resources from 2009.
Not surprisingly coal companies are the key contributors to revenue in the mid-tier 50. The key driver in coal revenue has been the demand from developing countries such as China and India for both thermal and coking coal. Export revenue growth has however been slightly offset by the strengthening AUD:USD exchange rate. From a price perspective perhaps the most important development of the year for the mid-tier 50 was the departure from annual benchmarked coal and iron ore prices announced in March 2010. However due to the timing of this change there is little visibility of the impact in our aggregated results.
8,561
(221)
1,514
418
45
357
670
313
(340)
11,317
June FY09
Coal
Copper
Platinum
Uranium
Iron Ore
Gold
Nickel
Other
June FY10
Movement in revenue by commodity
The mid-tier 50 has already started to see considerable improvement in operating revenue from the GFC in the previous year increasing by an impressive 29%. The improvement has primarily been driven by copper, gold and an unexpected star performer in platinum, which have shown strength on the back of higher commodity prices and stronger production.
Table 10: Movement in revenue FY09 – FY10 by commodity (A$m) Source: Capital IQ
1) December is the financial year end for the top three copper miners (by market capitalisation) in the mid-tier 50; therefore our analysis has been based on 12 months ended December 2009 and not the 12 months ended June 2010 as per our analysis on the other mid-tier 50 sectors.
2) Production information has been obtained from the ASX quarterly reports.
20 PwC
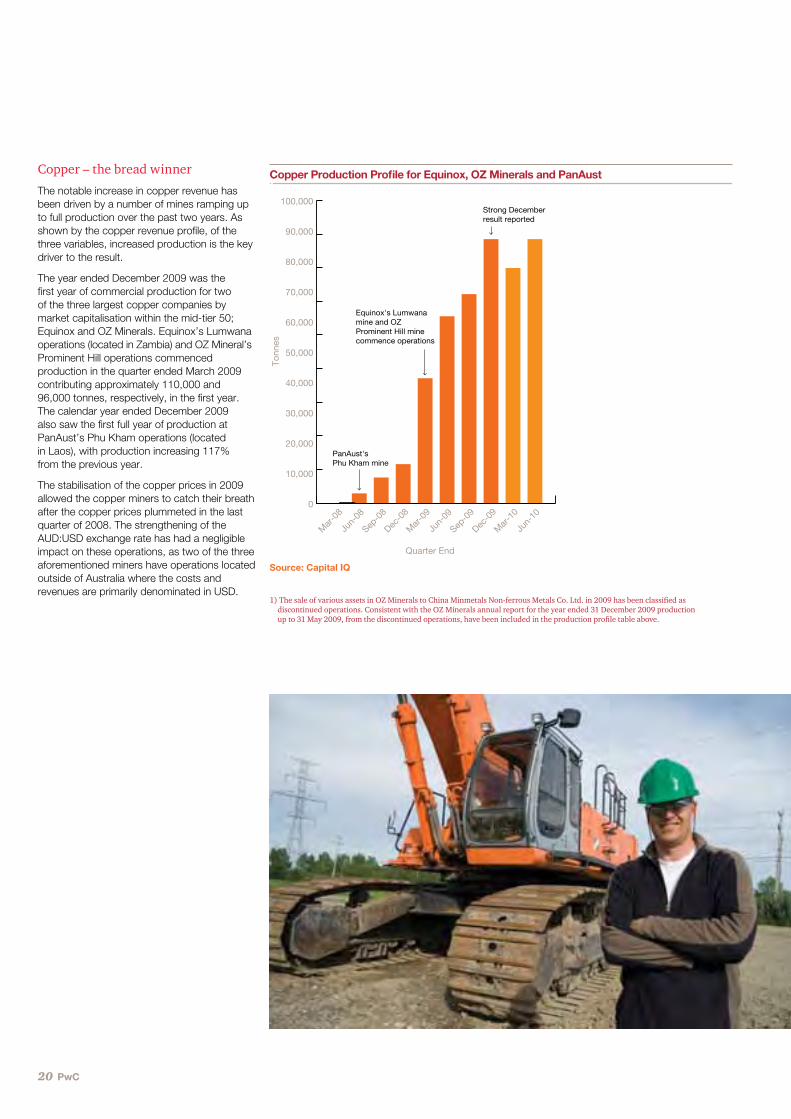
Copper – the bread winner
The notable increase in copper revenue has been driven by a number of mines ramping up to full production over the past two years. As shown by the copper revenue profile, of the three variables, increased production is the key driver to the result.
The year ended December 2009 was the first year of commercial production for two of the three largest copper companies by market capitalisation within the mid-tier 50; Equinox and OZ Minerals. Equinox’s Lumwana operations (located in Zambia) and OZ Mineral’s Prominent Hill operations commenced production in the quarter ended March 2009 contributing approximately 110,000 and 96,000 tonnes, respectively, in the first year. The calendar year ended December 2009 also saw the first full year of production at PanAust’s Phu Kham operations (located in Laos), with production increasing 117% from the previous year.
The stabilisation of the copper prices in 2009 allowed the copper miners to catch their breath after the copper prices plummeted in the last quarter of 2008. The strengthening of the AUD:USD exchange rate has had a negligible impact on these operations, as two of the three aforementioned miners have operations located outside of Australia where the costs and revenues are primarily denominated in USD.
0
10,000
20,000
30,000
40,000
50,000
60,000
70,000
80,000
90,000
100,000
Mar
-08
Jun-
08
Sep-0
8
Dec-0
8
Mar
-09
Jun-
09
Sep-0
9
Dec-0
9
Mar
-10
Jun-
10
Quarter End
Tonn
es
PanAust'sPhu Kham mine
Equinox's Lumwanamine and OZProminent Hill minecommence operations
Strong Decemberresult reported
Copper Production Profile for Equinox, OZ Minerals and PanAust
1) The sale of various assets in OZ Minerals to China Minmetals Non-ferrous Metals Co. Ltd. in 2009 has been classified as discontinued operations. Consistent with the OZ Minerals annual report for the year ended 31 December 2009 production up to 31 May 2009, from the discontinued operations, have been included in the production profile table above.
Source: Capital IQ
Aussie Mine November 2010 21
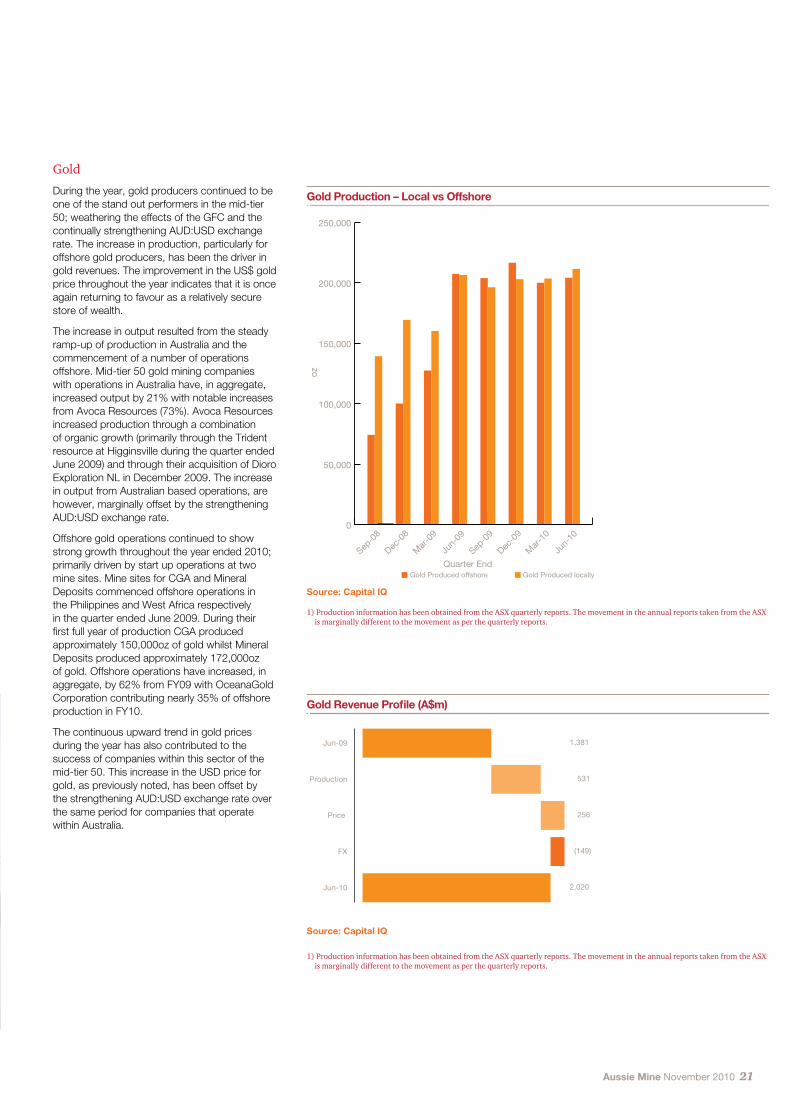
Gold
During the year, gold producers continued to be one of the stand out performers in the mid-tier 50; weathering the effects of the GFC and the continually strengthening AUD:USD exchange rate. The increase in production, particularly for offshore gold producers, has been the driver in gold revenues. The improvement in the US$ gold price throughout the year indicates that it is once again returning to favour as a relatively secure store of wealth.
The increase in output resulted from the steady ramp-up of production in Australia and the commencement of a number of operations offshore. Mid-tier 50 gold mining companies with operations in Australia have, in aggregate, increased output by 21% with notable increases from Avoca Resources (73%). Avoca Resources increased production through a combination of organic growth (primarily through the Trident resource at Higginsville during the quarter ended June 2009) and through their acquisition of Dioro Exploration NL in December 2009. The increase in output from Australian based operations, are however, marginally offset by the strengthening AUD:USD exchange rate.
Offshore gold operations continued to show strong growth throughout the year ended 2010; primarily driven by start up operations at two mine sites. Mine sites for CGA and Mineral Deposits commenced offshore operations in the Philippines and West Africa respectively in the quarter ended June 2009. During their first full year of production CGA produced approximately 150,000oz of gold whilst Mineral Deposits produced approximately 172,000oz of gold. Offshore operations have increased, in aggregate, by 62% from FY09 with OceanaGold Corporation contributing nearly 35% of offshore production in FY10.
The continuous upward trend in gold prices during the year has also contributed to the success of companies within this sector of the mid-tier 50. This increase in the USD price for gold, as previously noted, has been offset by the strengthening AUD:USD exchange rate over the same period for companies that operate within Australia.
1,381
531
256
(149)
2,020
Jun-09
Production
Price
FX
Jun-10
Gold Revenue Profile (A$m)
1) Production information has been obtained from the ASX quarterly reports. The movement in the annual reports taken from the ASX is marginally different to the movement as per the quarterly reports.
Source: Capital IQ
Quarter End
oz
50,000
0
100,000
150,000
200,000
250,000
Sep-0
8
Dec-0
8
Mar
-09
Jun-
09
Sep-0
9
Dec-0
9
Mar
-10
Jun-
10
Gold Produced offshore Gold Produced locally
Gold Production – Local vs Offshore
1) Production information has been obtained from the ASX quarterly reports. The movement in the annual reports taken from the ASX is marginally different to the movement as per the quarterly reports.
Source: Capital IQ
22 PwC
The unexpected star performer
Platinum has been spurred on by the consistently improving price, compounded by the increase in production by the two largest platinum producers in the mid-tier 50. Aquarius Platinum (operations located in South Africa and Zimbabwe) and Zimplats (operations located in Zimbabwe) both showed strong revenue growth, increasing 29% and 185% respectively. The surge in revenue at Zimplats saw it catapult to third position in the top five mid-tier 50 performers based on net profit. Platinum production increased at Zimplats by 84% whilst the price of platinum increased 86% from FY09, contributing to its success during the year. The revenues recognised from the increased output and the improving US$ price was not affected by the strengthening A$ as both companies have operations outside Australia.
Commodity AUD average spot price
movement (July2009–
June 2010)
AUD average spot price
movement (July2010–
Sept 2010)
USD average spot price
movement (July2009–
June 2010)
USD average spot price
movement (July2010–
Sept 2010)
Copper 17% 6% 35% 8%
Gold 4% 10% 25% 12%
Nickel 24% 7% 45% 9%
Table 12: Commodity price movementsSource: Capital IQ
0.50
0.60
0.70
0.80
0.90
1.00
1.10
Jul-0
8
Aug-0
8
Sep-0
8
Oct-0
8
Nov-0
8
Dec-0
8
Jan-
09
Feb-0
9
Mar
-09
Apr-09
May
-09
Jun-
09
Jul-0
9
Aug-0
9
Sep-0
9
Oct-0
9
Nov-0
9
Dec-0
9
Jan-
10
Feb-1
0
Mar
-10
Apr-10
May
-10
Jun-
10
Jul-1
0
Aug-1
0
Sep-1
0
Average rate FY09 is 0.7473Average rate for quarter ended
September 2010 is 0.9046
Average rate for FY10 is 0.8824
AU
D
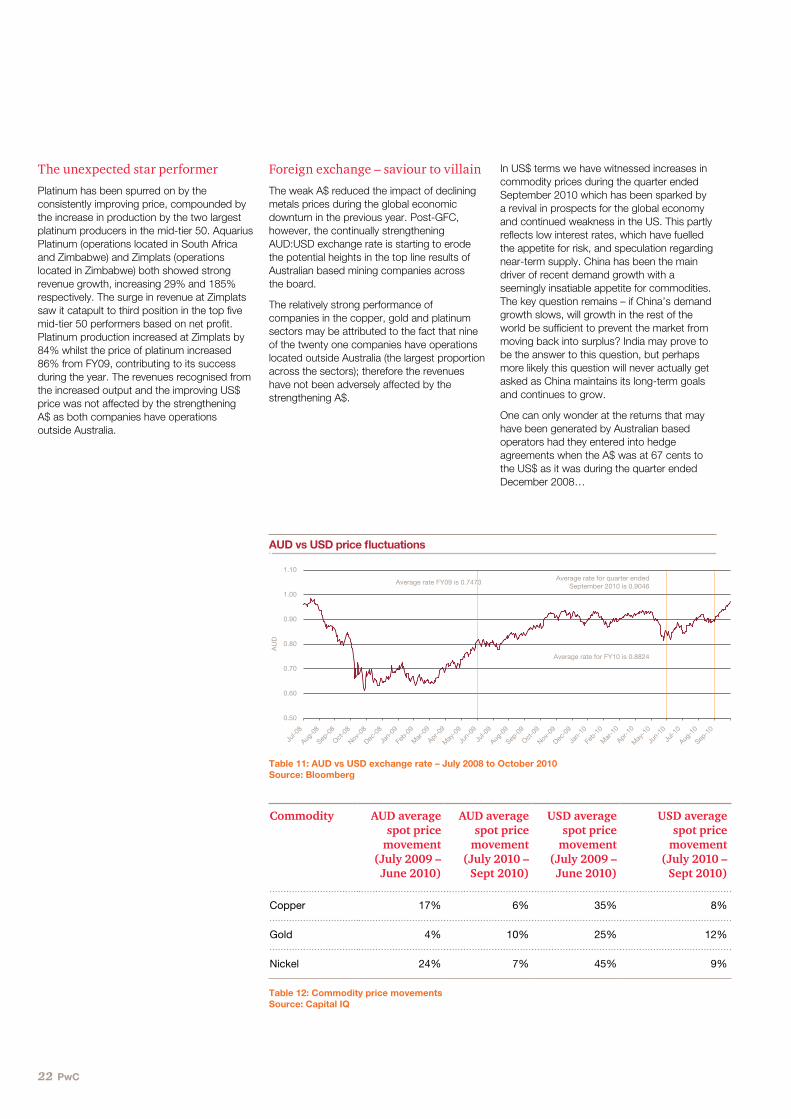
AUD vs USD price fluctuations
Table 11: AUD vs USD exchange rate – July 2008 to October 2010Source: Bloomberg
Foreign exchange – saviour to villain
The weak A$ reduced the impact of declining metals prices during the global economic downturn in the previous year. Post-GFC, however, the continually strengthening AUD:USD exchange rate is starting to erode the potential heights in the top line results of Australian based mining companies across the board.
The relatively strong performance of companies in the copper, gold and platinum sectors may be attributed to the fact that nine of the twenty one companies have operations located outside Australia (the largest proportion across the sectors); therefore the revenues have not been adversely affected by the strengthening A$.
In US$ terms we have witnessed increases in commodity prices during the quarter ended September 2010 which has been sparked by a revival in prospects for the global economy and continued weakness in the US. This partly reflects low interest rates, which have fuelled the appetite for risk, and speculation regarding near-term supply. China has been the main driver of recent demand growth with a seemingly insatiable appetite for commodities. The key question remains – if China’s demand growth slows, will growth in the rest of the world be sufficient to prevent the market from moving back into surplus? India may prove to be the answer to this question, but perhaps more likely this question will never actually get asked as China maintains its long-term goals and continues to grow.
One can only wonder at the returns that may have been generated by Australian based operators had they entered into hedge agreements when the A$ was at 67 cents to the US$ as it was during the quarter ended December 2008…

Aussie Mine November 2010 23
Margin Squeeze
Consistent with the revenue analysis, the increase in costs from ordinary activities have primarily been driven by the copper and gold sectors within the mid-tier 50. The rising input and labour costs have placed additional pressure on the margins.
It would, however, be unfair to draw a broad stroke across the entire mid-tier 50 and conclude that margins are decreasing in each sector. There are several sectors within the mid-tier 50 that, despite rising production, have managed to maintain and, in some instances, improve the margin from the previous year. Platinum and gold were the best performers with 46% and 17% improvements in margin respectively from FY09, whilst copper producers have seen a considerable squeeze on their margins.
Of the $1.5 billion increase in costs from FY09, $700 million relates to the commencement or ramp-up of production, whilst the remaining $843 million relates to financial instrument losses (approximately $730m) and foreign exchange losses (approximately $110 million). This sector has been significantly adversely affected by the revaluations in financial instruments, more so than any other mid-tier 50 sector (the coal sector had the second largest financial instrument impact with a gain of $26 million). The financial instrument and foreign exchange impacts have been analysed in conjunction with copper operating costs below. If the impact of the derivative instruments are “normalised”, the margins in the copper sector would improve considerably from 13% to 43%.
The gross margin across the coal sector reduced to 22% in FY10, down from 33% in FY09, attributable to both revenue and cost squeezes. Revenue was impacted as a result of the lower export sales prices. Operating costs increased as a result of increased rail and haulage costs for transport of product coal to the ports. The best coal performers, based on gross margins, were New Hope, Macarthur Coal and Whitehaven Coal with margins of 33%, 24% and 24% respectively. The ability of these companies to maintain margins is as a result of a higher portion of domestic sales.
Extract from the income statement
FY10 FY09
Operating Revenue 11,317 8,561
Operating Costs (8,639) (6,108)
Gross Profit 2,677 2,453
Margin 24% 29%
Table 13: Commodity price movementsSource: Capital IQ
6,108
232
154
1,545
10
141
124
258
123
(55)
8,639
June FY09
Bauxite
Coal
Copper
Platinum
Uranium
Iron ore
Gold
Nickel
Other
June FY10
Movement in operating costs
Table 14: Movement in operating costs FY09 – FY10 (A$m)Source: Capital IQ
Operating costs
The increase in operating costs from the previous year have been separated out into the respective sectors below in order to highlight key movements.
24 PwC
Copper – to hedge or not to hedge?
Of the total increase in operating costs from the previous year, $700 million relates primarily to the commencement of production at two mines and a further one ramping up production. This increase is expected given the higher costs of mining during the ramp-up phase. Equinox’s Lumwana operation commenced production in the quarter ended March 2009 and ramped up to 20 mtpa in the second half of the 2010 financial year. OZ Minerals’ operation at Prominent Hill also commenced production in the quarter ended March 2009 and achieved full production levels at the end of the 2009 calendar year. Lastly, PanAust’s Phu Kham operations ramped up operations during FY10, with operating costs increasing from the prior year as the mine continued to increase throughput.
The remaining $843 million increase in costs from the previous year relate to financial instrument and net foreign exchange losses. The financial instrument losses (approximately $730 million) were realised as a result of movements in the mark-to-market valuations of copper put options and forwards primarily in Equinox Minerals. Equinox Minerals realised hedge losses of approximately $415 million in 2009 compared to the previous year where it recognised hedge gains of approximately $320 million. The loss in 2009 was due to revaluing the hedge book to the current market prices and the strengthening copper price from US$1.38/lb at December 2008 to US$3.33/lb at December 2009. The net foreign exchange losses (approximate $110 million) related to OZ Minerals. The majority of the losses were recorded on US$ denominated assets (cash and debtors) net of the US$ denominated liability for convertible bonds.
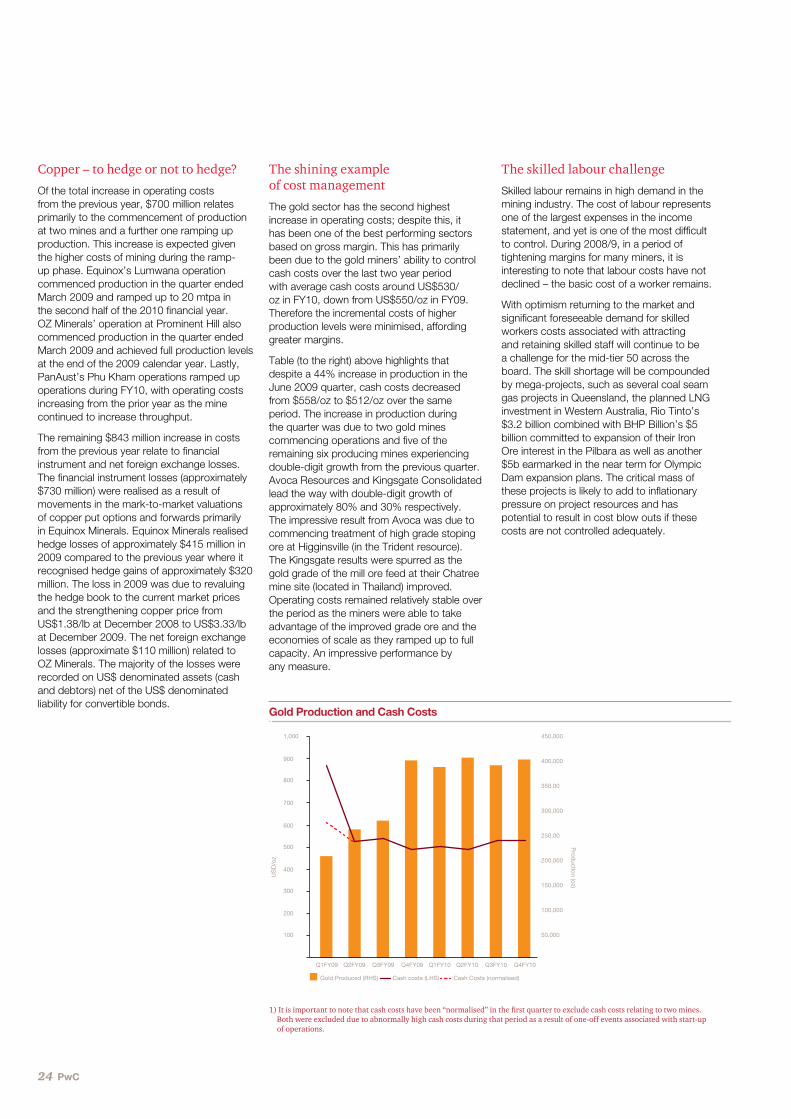
The shining example of cost management
The gold sector has the second highest increase in operating costs; despite this, it has been one of the best performing sectors based on gross margin. This has primarily been due to the gold miners’ ability to control cash costs over the last two year period with average cash costs around US$530/oz in FY10, down from US$550/oz in FY09. Therefore the incremental costs of higher production levels were minimised, affording greater margins.
Table (to the right) above highlights that despite a 44% increase in production in the June 2009 quarter, cash costs decreased from $558/oz to $512/oz over the same period. The increase in production during the quarter was due to two gold mines commencing operations and five of the remaining six producing mines experiencing double-digit growth from the previous quarter. Avoca Resources and Kingsgate Consolidated lead the way with double-digit growth of approximately 80% and 30% respectively. The impressive result from Avoca was due to commencing treatment of high grade stoping ore at Higginsville (in the Trident resource). The Kingsgate results were spurred as the gold grade of the mill ore feed at their Chatree mine site (located in Thailand) improved. Operating costs remained relatively stable over the period as the miners were able to take advantage of the improved grade ore and the economies of scale as they ramped up to full capacity. An impressive performance by any measure.
The skilled labour challenge
Skilled labour remains in high demand in the mining industry. The cost of labour represents one of the largest expenses in the income statement, and yet is one of the most difficult to control. During 2008/9, in a period of tightening margins for many miners, it is interesting to note that labour costs have not declined – the basic cost of a worker remains.
With optimism returning to the market and significant foreseeable demand for skilled workers costs associated with attracting and retaining skilled staff will continue to be a challenge for the mid-tier 50 across the board. The skill shortage will be compounded by mega-projects, such as several coal seam gas projects in Queensland, the planned LNG investment in Western Australia, Rio Tinto’s $3.2 billion combined with BHP Billion’s $5 billion committed to expansion of their Iron Ore interest in the Pilbara as well as another $5b earmarked in the near term for Olympic Dam expansion plans. The critical mass of these projects is likely to add to inflationary pressure on project resources and has potential to result in cost blow outs if these costs are not controlled adequately.
Gold Produced (RHS) Cash costs (LHS) Cash Costs (normalised)
Prod
uction (oz)
US
D/o
z
Q1FY09 Q2FY09 Q3FY09 Q4FY09 Q1FY10 Q2FY10 Q3FY10 Q4FY10
800
700
1,000
900
600
500
400
300
200
100
350,00
300,000
450,000
400,000
250,00
200,000
150,000
100,000
50,000
Gold Production and Cash Costs
1) It is important to note that cash costs have been “normalised” in the first quarter to exclude cash costs relating to two mines. Both were excluded due to abnormally high cash costs during that period as a result of one-off events associated with start-up of operations.

Aussie Mine November 2010 25
Gain / (loss) on sale of investments
During FY10 approximately 30% of companies in the mid-tier 50 had some form of capital restructure by way of asset sale which resulted in a number of small losses. The prior year gain on sale of investments is primarily driven by two significant transactions representing 95% of the total value of the asset sales during the year - New Hope Coal’s $2.4 billion pre-GFC sale of New Saraji to BHP Mitsubishi Alliance (BMA) and OZ Minerals’ $1.7 billion sale of selected assets to Minmetals.
Impairments
With the improvement in commodity prices, there has been a marked reduction in impairment write-downs from the previous year. Many of the mid-tier 50 companies, unsurprisingly, booked impairments during 2009 as a result of declining commodity prices which characterised the global economic downturn. Notably the impairment charges in FY10 have reduced by approximately 94% from the prior year, with OZ Minerals and Paladin Energy accounting for the majority of the prior year write-down, which was not repeated.
Depreciation and Amortisation
The effects of the increase in operations can also be noted in the depreciation and amortisation charges which have also increased as mines continue to depreciate their assets on a units-of-production basis.
Interest
Interest expense has eased slightly from the previous year as a result of the debt repayments and improved gearing ratios, although the full impact of these debt repayments and stronger balance sheets is likely to be seen in the coming year.
Income tax expense
Income tax expense and cash tax outflows have been skewed in 2009 by New Hope’s $2.4 billion, pre-GFC sale of New Saraj to BHP Mitsubishi Alliance (BMA). The capital gain was recorded in the 2009 accounts, but the tax payment did not fall due until the 2010 year, as reflected in the 2010 cash flow statement.
Similar to the top five by revenue, three of the companies in the November 2009 publication have retained their place in 2010. Zimplats and Mt Gibson Iron have joined the list this year with Felix Resources and Whitehaven Coal being replaced. Divestments and take-overs have played a part in the movement as Felix was taken over during the year by Yanzhou Coal Mining Company and Whitehaven Coal had a higher profit figure in the prior year following divestment of its 15% interest in Narrabri.
Adjusted EBITDA and NPAT2010 A$m
2009 A$m
Adjusted EBITDA 2,355 2,512
Gain/(loss) on sale of investments (354) 487
Impairment (111) (1,738)
EBITDA 1,890 1,262 Depreciation and amortisation (1,134) (796)
EBIT 756 466 Net interest expense (359) (382)
Profit from ordinary activities before tax 397 84
Income tax expense (423) (706)
Net Profit / (Loss) (26) (623)
Top five mid-tier companies by profit
CompanyName 2010 A$m
2009 A$m
Change %
1 Energy Resources Australia 273 223 23%
2 New Hope 184 1,950 (91%)
3 Zimplats 138 (33) 521%
4 Mt Gibson Iron 132 42 212%
5 Macarthur Coal 125 169 (26%)
26 PwC
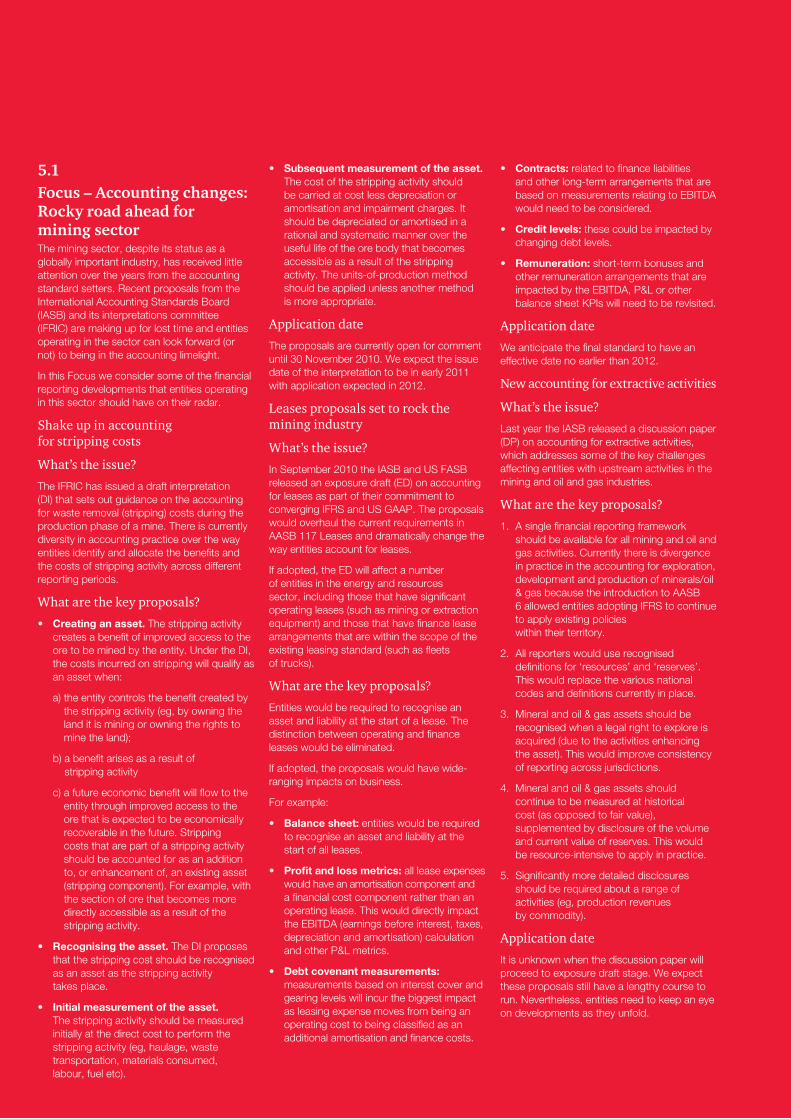
5.1 Focus–Accountingchanges:Rockyroadaheadfor mining sector The mining sector, despite its status as a globally important industry, has received little attention over the years from the accounting standard setters. Recent proposals from the International Accounting Standards Board (IASB) and its interpretations committee (IFRIC) are making up for lost time and entities operating in the sector can look forward (or not) to being in the accounting limelight.
In this Focus we consider some of the financial reporting developments that entities operating in this sector should have on their radar.
Shake up in accounting for stripping costs
What’s the issue?
The IFRIC has issued a draft interpretation (DI) that sets out guidance on the accounting for waste removal (stripping) costs during the production phase of a mine. There is currently diversity in accounting practice over the way entities identify and allocate the benefits and the costs of stripping activity across different reporting periods.
What are the key proposals?
• Creating an asset. The stripping activity creates a benefit of improved access to the ore to be mined by the entity. Under the DI, the costs incurred on stripping will qualify as an asset when:
a) the entity controls the benefit created by the stripping activity (eg, by owning the land it is mining or owning the rights to mine the land);
b) a benefit arises as a result of stripping activity
c) a future economic benefit will flow to the entity through improved access to the ore that is expected to be economically recoverable in the future. Stripping costs that are part of a stripping activity should be accounted for as an addition to, or enhancement of, an existing asset (stripping component). For example, with the section of ore that becomes more directly accessible as a result of the stripping activity.
• Recognising the asset. The DI proposes that the stripping cost should be recognised as an asset as the stripping activity takes place.
• Initial measurement of the asset. The stripping activity should be measured initially at the direct cost to perform the stripping activity (eg, haulage, waste transportation, materials consumed, labour, fuel etc).
• Subsequent measurement of the asset. The cost of the stripping activity should be carried at cost less depreciation or amortisation and impairment charges. It should be depreciated or amortised in a rational and systematic manner over the useful life of the ore body that becomes accessible as a result of the stripping activity. The units-of-production method should be applied unless another method is more appropriate.
Application date
The proposals are currently open for comment until 30 November 2010. We expect the issue date of the interpretation to be in early 2011 with application expected in 2012.
Leases proposals set to rock the mining industry
What’s the issue?
In September 2010 the IASB and US FASB released an exposure draft (ED) on accounting for leases as part of their commitment to converging IFRS and US GAAP. The proposals would overhaul the current requirements in AASB 117 Leases and dramatically change the way entities account for leases.
If adopted, the ED will affect a number of entities in the energy and resources sector, including those that have significant operating leases (such as mining or extraction equipment) and those that have finance lease arrangements that are within the scope of the existing leasing standard (such as fleets of trucks).
What are the key proposals?
Entities would be required to recognise an asset and liability at the start of a lease. The distinction between operating and finance leases would be eliminated.
If adopted, the proposals would have wide-ranging impacts on business.
For example:
• Balance sheet: entities would be required to recognise an asset and liability at the start of all leases.
• Profit and loss metrics: all lease expenses would have an amortisation component and a financial cost component rather than an operating lease. This would directly impact the EBITDA (earnings before interest, taxes, depreciation and amortisation) calculation and other P&L metrics.
• Debt covenant measurements: measurements based on interest cover and gearing levels will incur the biggest impact as leasing expense moves from being an operating cost to being classified as an additional amortisation and finance costs.
• Contracts: related to finance liabilities and other long-term arrangements that are based on measurements relating to EBITDA would need to be considered.
• Credit levels: these could be impacted by changing debt levels.
• Remuneration: short-term bonuses and other remuneration arrangements that are impacted by the EBITDA, P&L or other balance sheet KPIs will need to be revisited.
Application date
We anticipate the final standard to have an effective date no earlier than 2012.
New accounting for extractive activities
What’s the issue?
Last year the IASB released a discussion paper (DP) on accounting for extractive activities, which addresses some of the key challenges affecting entities with upstream activities in the mining and oil and gas industries.
What are the key proposals?
1. A single financial reporting framework should be available for all mining and oil and gas activities. Currently there is divergence in practice in the accounting for exploration, development and production of minerals/oil & gas because the introduction to AASB 6 allowed entities adopting IFRS to continue to apply existing policies within their territory.
2. All reporters would use recognised definitions for ‘resources’ and ‘reserves’. This would replace the various national codes and definitions currently in place.
3. Mineral and oil & gas assets should be recognised when a legal right to explore is acquired (due to the activities enhancing the asset). This would improve consistency of reporting across jurisdictions.
4. Mineral and oil & gas assets should continue to be measured at historical cost (as opposed to fair value), supplemented by disclosure of the volume and current value of reserves. This would be resource-intensive to apply in practice.
5. Significantly more detailed disclosures should be required about a range of activities (eg, production revenues by commodity).
Application date
It is unknown when the discussion paper will proceed to exposure draft stage. We expect these proposals still have a lengthy course to run. Nevertheless, entities need to keep an eye on developments as they unfold.

Aussie Mine November 2010 27
Accounting for joint arrangements
What’s the issue?
The IASB’s proposed changes to joint arrangements would significantly impact entities in the resources sector. Joint arrangements are commonplace because they allow entities to share the risk and expense of projects, facilitate access to new geographies, and ensure retention of tax benefits.
What are the key proposals?
Under the new rules we expect the accounting focus to shift to the contractual rights and obligations agreed by parties. This would require different accounting treatments depending on the type of joint arrangement the entity holds (a joint operation or a joint venture).
For example, a mining or oil & gas entity with an interest in a joint operation would recognise on its balance sheet the assets they control (or their share of the assets jointly controlled), and separately recognise the liabilities it has (or its share of the liabilities). In the income statement, entities would recognise the expenses incurred (or its share of the expenses incurred) and the revenues it has earned (or its share of revenues earned).
In contrast, an entity that is party to a joint venture does not have rights to individual assets or obligations for expenses of the joint venture. Instead the entity shares in the outcome (profit or loss) of the activity undertaken by joint venture. These arrangements would be accounted for using the equity method.
Application date
The standard is expected to have a mandatory implementation date of 2013. This seems like plenty of time, but management of mining entities should be looking at their current joint arrangements today to see if structural changes are necessary and possible to maintain their preferred accounting.
New provisions rules on the horizon
What’s the issue?
The IASB has proposed changing the rules associated with measuring non financial liabilities (formerly known as provisions). The proposals would affect the measurement of most provisions, including asset decommissioning, rehabilitation liabilities and environmental restoration.
What are the key proposals?
• Nonfinancialliabilitieswouldbemeasuredat the present value of the amount that an entity would rationally pay to take on the liability, as opposed to being measured at management’s best estimate, which may be the single most likely outcome.
• Inthecaseofthecostofundertakingdecommissioning and rehabilitation activities, the provision would typically be measured using the amounts that an entity would pay a contractor to undertake the service on its behalf.
• Whenestimatingtheexpectedvalueofnon-financial liabilities, entities would continue to consider likely future events (eg, advances in technology) that may reduce site clean-up costs.
• Estimatingthevalueofnonfinancialliabilities would also require assessments of risk that would need to be reflected in underlying cash flows or discount rates.
The proposals are likely to result in an immediate increase to the provisions recognised on balance sheets, together with increases in non-current assets (where costs can be included as an element of property, plant and equipment under AASB 116). Income statements would most likely see high borrowing costs as the provisions unwind.
Application date
The International Accounting Standards Board (IASB) has received extensive feedback from respondents. On the basis of this feedback, the release of a revised exposure draft (ED) could be some time away. The IASB expect to release a revised ED in late 2011.
For further information contact:Debbie Smith – Partner Tel: +61 (3) 8603 2249 Email: [email protected]

28 PwC
Aggregated industry balance sheet
6
2010 A$m
2009 A$m
Change%
Current Assets
Cash 7,373 3,658 102%
Investments held to maturity 1,313 2,487 (47%)
Debtors 1,816 1,447 26%
Inventories 1,684 1,605 5%
Other 1,243 3,354 (63%)
Total Current Assets 13,429 12,551 7%
Non Current Assets
Investments in associates and joint ventures 4,336 4,418 (2%)
Deferred taxation assets 309 479 (35%)
Property, plant and equipment 13,912 12,364 13%
Intangible assets 286 293 (2%)
Other 1,269 1,683 (25%)
Total Non Current Assets 26,375 25,308 4%
Total Assets 39,804 37,859 5%
Current Liabilities
Accounts payable & accrued liabilities 2,107 2,008 5%
Taxes payable 198 1,165 (83%)
Borrowings 936 2,210 (58%)
Other 716 1,118 (36%)
Total Current Liabilities 3,957 6,501 (39%)
Non Current Liabilities
Borrowings 4,538 4,392 3%
Deferred taxation liabilities 1,207 1,142 6%
Provision for environmental rehabilitation 519 606 (14%)
Other 1,181 1,184 (0%)
Total Non Current Liabilities 7,446 7,324 2%
Total Liabilities 11,403 13,825 (18%)
Net Assets 28,402 24,034 18%

Aussie Mine November 2010 29
‘Cash is King’ for the mid-tier 50
Having raised capital and not commenced investing activities, cash remained on the mid-tier 50’s balance sheet. Many took the opportunity to reduce gearing by repaying short-term debts.
Cash climbed to a staggering 19% of total assets during 2010, as the cash balances in the mid-tier 50 increased by 102% to $7.4 billion, representing the highest dollar value and percentage increase since our analysis began. This compares with the next highest increases in cash reserves of $1.5 billion or 60% in June 2008 and $1.4 billion or 43% in May 2009 respectively.
Consistent with global mining trends, equity raisings, stronger operating cash flows and reduced investing activities contributed to improve the cash positions during 2010. Many miners have taken advantage of improved market conditions to raise capital despite an unwillingness to ‘flick the switch’ on projects and transactions. With large cash reserves and liquid balance sheets, the use of funds will undoubtedly be a story to follow in the coming years.
Key balance sheet ratios
Ratio 2010 2009
Debt-to-equity ratio 19.3% 27.5%
Net debt to equity ratio (6.7%) 12.2%
Current ratio (times) 3.39 1.93
Quick ratio (times) 2.97 1.68
Net borrowings ($ billion) (1,898) 2,944
Cash as a percentage of total assets 19% 10%
Net assets of the mid-tier 50 increased to $28 billion, an 18% increase from 2009, attributed largely to a significant increase in cash reserves following capital raising, a profitable year and the repayment of short-term debt.
‘Net Zero’ Gearing
Short-term borrowings within the mid-tier 50 decreased by $1.3 billion during FY10 as OZ Minerals Ltd, Alumina and PanAust refinanced or repaid debt. This, coupled with a modest increase in long-term borrowings, resulted in a ‘net zero’ gearing position for the mid-tier 50, as cash exceeded total borrowings at June 2010 by $1.9 billion. A remarkable position for any sector to achieve.
Equity raisings – No Gold in the Top 5
The mid-tier 50 continued to look to investors as its preferred source of funding, with an additional $3.8 billion in share capital raised in 2010. Lynas Corp, PanAust, Aquilla Resources, Citadel and Whitehaven, raised $1.6 billion in 2010, representing 42% of the total equity raised, as shown below:
Interestingly given the strength of the gold sector and success achieved by gold companies elsewhere during FY10, they were under-represented in capital raised. We note that OceanaGold, which have a December year end raised A$85 million in February 2010 to close out its hedge book.
However, as at October 2010, gold players started to go to the market to raise capital. The most significant equity raising announcements post year end, included OceanaGold’s announcement that it was hoping to raise a further C$115.5 million ($152 million) in a Canadian bought deal to help fund the development of its Philippino gold and copper mine and Andean Resources’ $250 million share offering to fund the exploration and development of the Cerro Negro project in Argentina and for general working capital purposes.
Property, plant and equipment and capitalised exploration expenditure
Total property, plant and equipment (PPE), including capitalised exploration and development expenditure, for the mid-tier 50 increased by 9% to $20.2 billion in 2010.
The increase in PP&E was driven by the move into production by Whitehaven’s Narrabri mine, Northern Iron’s Sydvaranger Iron Ore project, Avoca Resources’ Higginsville Gold project and Mirabella’s Santa Rita Nickel mine.
Capitalised development expenditure also increased during 2010, following the acquisition of the Ridge Group by Aquarius Platinum, Resolute’s Golden Pride mine and Citadel Resource Group’s Jabel Sayid Project transitioning to development.
Given the time it takes to turn exploration success into production, the 25% decline in exploration expenditure by the mid-tier 50 during 2010 to $884 million, will present challenges for the mid-tier 50 in finding tomorrow’s production. This prompts the catch phrase ‘you’ve gotta spend money to make money’.
58%
11%
10%
8%
7%
6%
Lynas
Other
Whitehaven (P)
Citadel
Aquila (P)
PanAust (P)
Total equity raisings in 2010 (A$m)
Source: PwC analysis
Cash climbed to a staggering 19% of total assets during 2010, as the cash balances in the mid-tier 50 increased by 102% to $7.4 billion...

30 PwC
6.1 Focus–Ataxonironoreandcoal, but encouraging for exploration Tax has been propelled into the public spotlight more than any other issue for the mining industry in 2010.
A furious debate has entered everyday Australia’s living rooms through television advertising campaigns and strong political lobbying. The mining tax ultimately was one of the contributors to the closest Federal election in living memory.
The Henry Review set off this chain of events with its recommendation for a more efficient system for charging an economic rent for the exploitation of Australia’s non-renewable resources. The Government’s initial response in May 2010 of a “Resource Super Profits Tax” that was to impact all onshore non-renewable resources was scrapped in July and replaced with a relatively less controversial “Minerals Resource Rent Tax” (MRRT). Only iron ore and coal miners are in the scope of the MRRT.
As part of its announcement in July, the Government formed the “Policy Transition Group” (PTG) and charged it with the responsibility for recommending the technical design features of the proposed tax, as well determining “the best way to promote future exploration”. The PTG released its Issues Paper on 1 October 2010 as the starting basis for consultation. During the consultation process, the PTG is meeting with interested parties and taking written submissions, to formulate its response which is due by the end of 2010. The Government will then provide draft legislation in the second quarter of calendar 2011.
While many of the following aspects are subject to consultation, the most important features of the MRRT as currently announced are:
• ItwillapplytoironoreandcoalprojectsinAustralia from 1 July 2012.
• AtaxthresholdofA$50mperannumofMRRT assessable profits is proposed.
• TheeffectiverateforMRRTis22.5%(being a headline rate of 30% reduced by a 25% “extraction allowance”). The MRRT is calculated on the value of minerals at a “taxing point” which is intended to be set as close as possible to the extraction point for the minerals.
• Allrevenueandcapitalexpenditureassociated with development and operation of the mine after 1 July 2012 will be immediately deductible in the MRRT calculation. However, there are a range of other costs, including financing costs such as interest, that will not be deductible in calculating the MRRT liability.
• Existingprojectsaretobetransitionedintothe MRRT, with taxpayers having the choice of using book or market value to determine their starting base at 1 May 2010 (which will then be deductible over time).
• Carriedforwardcostsandlossesareuplifted at the Government Long Term Bond Rate plus 7%, and are transferrable between certain projects where certain conditions are met.
• Stateroyaltieswillcontinuetobeleviedbutwill be creditable against MRRT payable – royalties will not be cash refundable and royalty credits carried forward are not transferable between projects. However credits carried forward will be uplifted at the allowance rate.
• MRRTwillbedeductibleforincometax purposes.
Some of the key uncertainties for the PTG to consider are:
• Whatisthedefinitionofaprojectand what is the definition of an MRRT group? This is likely to dictate which projects are held by the same group, and which project expenditure and losses can be transferred between entities.
• Isitappropriatetotaxthemineralsontheirvalue after primary crushing and grinding, and how do integrated projects calculate a price at the taxing point when there is no observable or comparable price?
• Whatexpenditurewillbedeductiblefor MRRT purposes (eg. hedging gains and losses, closing down / rehabilitation expenditure, native title payments and private royalties)?
• Howwillmergerandacquisitionactivityaffect the calculation of the MRRT (and how will the MRRT affect investment structures)?
• Whatstartingbasewillgiveexistingprojects a better MRRT outcome, and how will market value be calculated at 1 May 2010? Will losses attributable to the starting base be transferable?
• Howwillthe$50mperannumthresholdapply, and will those excluded in a particular year still need to calculate their MRRT profits to confirm their exclusion?
• WhathappensifStatesraisetheroyaltyrate and is this increment deductible for MRRT purposes?
At this stage there are as many questions as answers, however, if the PTG and the Government stick to their deadlines, we should have growing clarity by the middle of next year.
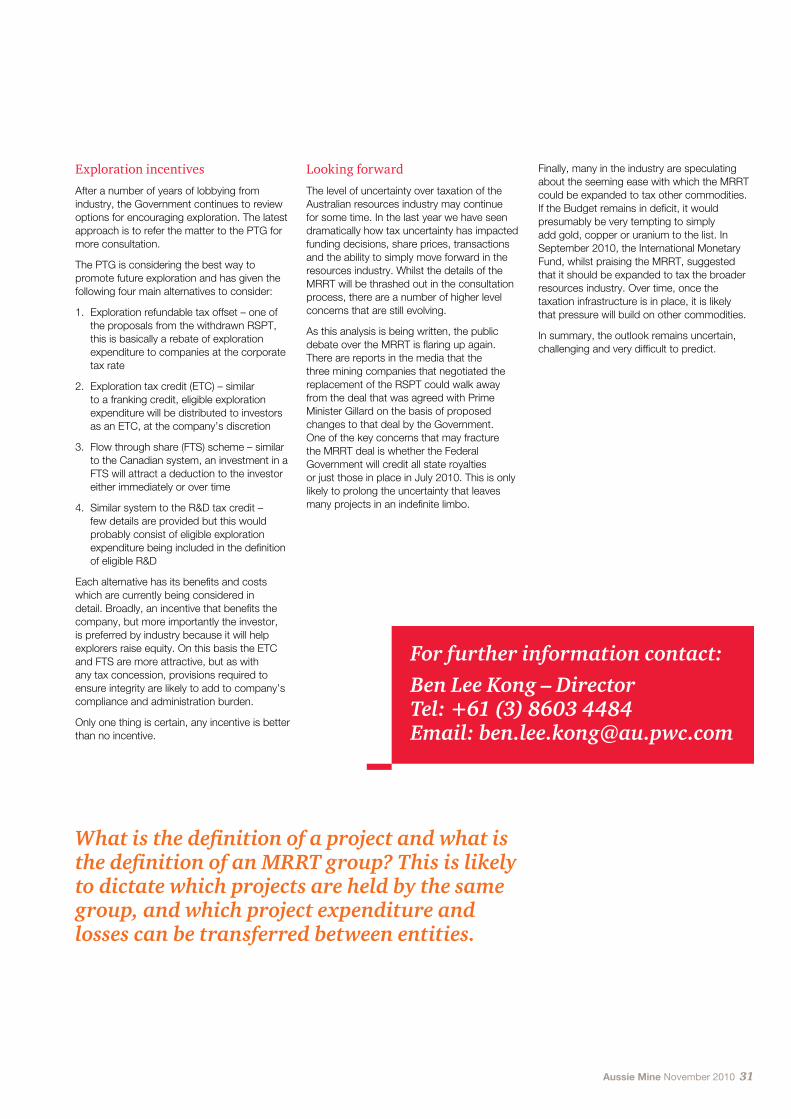
Aussie Mine November 2010 31
Looking forward
The level of uncertainty over taxation of the Australian resources industry may continue for some time. In the last year we have seen dramatically how tax uncertainty has impacted funding decisions, share prices, transactions and the ability to simply move forward in the resources industry. Whilst the details of the MRRT will be thrashed out in the consultation process, there are a number of higher level concerns that are still evolving.
As this analysis is being written, the public debate over the MRRT is flaring up again. There are reports in the media that the three mining companies that negotiated the replacement of the RSPT could walk away from the deal that was agreed with Prime Minister Gillard on the basis of proposed changes to that deal by the Government. One of the key concerns that may fracture the MRRT deal is whether the Federal Government will credit all state royalties or just those in place in July 2010. This is only likely to prolong the uncertainty that leaves many projects in an indefinite limbo.
Finally, many in the industry are speculating about the seeming ease with which the MRRT could be expanded to tax other commodities. If the Budget remains in deficit, it would presumably be very tempting to simply add gold, copper or uranium to the list. In September 2010, the International Monetary Fund, whilst praising the MRRT, suggested that it should be expanded to tax the broader resources industry. Over time, once the taxation infrastructure is in place, it is likely that pressure will build on other commodities.
In summary, the outlook remains uncertain, challenging and very difficult to predict.
Exploration incentives
After a number of years of lobbying from industry, the Government continues to review options for encouraging exploration. The latest approach is to refer the matter to the PTG for more consultation.
The PTG is considering the best way to promote future exploration and has given the following four main alternatives to consider:
1. Exploration refundable tax offset – one of the proposals from the withdrawn RSPT, this is basically a rebate of exploration expenditure to companies at the corporate tax rate
2. Exploration tax credit (ETC) – similar to a franking credit, eligible exploration expenditure will be distributed to investors as an ETC, at the company’s discretion
3. Flow through share (FTS) scheme – similar to the Canadian system, an investment in a FTS will attract a deduction to the investor either immediately or over time
4. Similar system to the R&D tax credit – few details are provided but this would probably consist of eligible exploration expenditure being included in the definition of eligible R&D
Each alternative has its benefits and costs which are currently being considered in detail. Broadly, an incentive that benefits the company, but more importantly the investor, is preferred by industry because it will help explorers raise equity. On this basis the ETC and FTS are more attractive, but as with any tax concession, provisions required to ensure integrity are likely to add to company’s compliance and administration burden.
Only one thing is certain, any incentive is better than no incentive.
What is the definition of a project and what is the definition of an MRRT group? This is likely to dictate which projects are held by the same group, and which project expenditure and losses can be transferred between entities.
For further information contact:Ben Lee Kong – Director Tel: +61 (3) 8603 4484 Email: [email protected]

32 PwC
2010 A$m
2009 A$m
Change %
Cash flows generated from operations
Cash generated from operations 3,243 2,520 29%
Net borrowing costs (279) (308) (9%)
Other 85 311 (73%)
Income taxes (paid)/refunded (1,126) (411) 174%
Net operating cash flows 1,922 2,112 (9%)
Cash flows related to investing activities
Purchases of property, plant and equipment (2,956) (4,677) (37%)
Exploration expenditure (884) (1,181) (25%)
Purchases of investments and intangibles (871) (2,003) (56%)
Other (163) (294) (45%)
Proceeds from sale of property, plant and equipment 1,764 2,506 (30%)
Proceeds from sale of investments 1,569 466 236%
Net investing cash flows (1,542) (5,183) (70%)
Cash flows related to financing activities
Proceeds from ordinary share issues 3,794 2,410 57%
Net borrowings (829) 677 (222%)
Distribution to shareholders (1,034) (966) 7%
Other 1,315 735 79%
Net financing cash flows 3,246 2,857 14%
Net increase/(decrease) in cash and cash equivalents 3,626 (214) (1796%)
Note: The reconciling item between the above cash flow statement and the balance sheet movement in cash is the effect of foreign exchange.
Aggregated industry cash flow statement
7

Aussie Mine November 2010 33
Note: The graph has been adjusted to exclude the effect of the special dividend paid by New Hope amounting to $602 million.
Investing cash flows – caution vs confidence
Net investing cash flows by the mid-tier 50 decreased by 70% in 2010. Although operating performance was strong, the mid-tier 50 have sat cautiously during 2010, waiting for stability and more certainty to return to commodity prices and markets. Whilst this represents a significant decrease in capital expenditure from 2009, there have been a number of contributing factors including market uncertainty driven by international economic volatility, commodity price movements and the strengthening of the A$ making many projects more expensive. The proposed MRRT clearly also had an impact during the year. Until a more sustainable point is reached, it appears the mid-tier 50 companies have taken a conservative approach to spending and will carefully consider future investment decisions.
Of the increase in proceeds from the sale of investments, $1,066 million reflects proceeds received by New Hope from its investments. The decrease in proceeds from the sale of property, plant and equipment is also due to New Hope who in 2009 sold the New Saraji Project to the BHP Billiton Mitsubishi Alliance for $2,451 million. In the current year $1,731 million was proceeds from the sale of the majority of its assets by OZ Minerals to China Minmetals.
With the currently strong mid-tier 50 balance sheet and market conditions improving, the future outlook necessitates the need for increased capital and exploration expenditure investments to ensure growth is continually caught and utilised.
The growth in demand for minerals from the developing world, led by China, is expected to ensure demand for commodities remains strong over the long-term. Therefore we expect to see an increase in investment outflows over the coming years.
Operating cash flows – climbing the ladder
Cash generated from operations increased by 29% due to stronger commodity prices and improved performances, particularly in the copper and gold sectors. The unusually high tax paid was by New Hope as a result of the sale of New Saraji during 2009. Excluding this transaction, net operating cash flows were up by 30%.
The increase in net operating cash flows is considered to be a relatively strong performance compared to a number of other industries. Growth in copper and gold prices significantly contributed to the increase in operational performance in 2010. As noted earlier, copper production increased significantly during the period due to new projects coming on stream. Gold producers also saw positive cash flows attributable to price improvements and the successful
management of cash costs. Of the mid-tier 50, coal companies also contributed to positive operating cash flows as shown by both New Hope and Macarthur forming part of the top 5 companies by operating profit.
Looking forward, operating cash flows in the industry are threatened by the weak US dollar. The continual challenge of managing costs, particularly rising labour costs, will also place pressure on cash margins. However, prices have returned to almost pre-financial downturn levels – a move which largely drops straight through to the bottom line.
Financing cash flows – show me the money!
Net financing cash flows of the mid-tier 50 increased by 14% to $3.2 billion in 2010 as companies strengthen their financial position through share issues and the repaying of short-term debts.
Access to debt finance, and company appetite for gearing continued to push cash flows from borrowings down in 2010. Equity remained the key funding source tapped by the mid-tier 50.
Proceeds from share issues increased by 57% on 2009 – a remarkable outcome given the uncertainty during the year. The largest equity raisings during the year were called on by Lynas, PanAust, Aquila, Citadel and Whitehaven Coal, who accounted for 42%
of the total equity raised in 2010 (refer graph on page 29). The success of these issues illustrated increasing market confidence, as shareholders took advantage of the opportunity available.
Overall payments to shareholders have increased by 7% in 2010 due to dividend payments amounting to $935 million. 11 of the mid-tier 50 paid dividends during 2010, of which New Hope accounted for 73% of the total. This was due to a special dividend of $602 million relating to the company’s asset sales. Excluding the special dividend, a 63% decrease in dividends paid compared to 2009 was identified, supporting the mid-tier 50 efforts to retain cash and enter into survival mode over the year. Look for this to change in 2011.
Energy stocks have been the best payers of dividends due to the status of projects of these companies in the mining life cycle. Although gold companies have been high performers, it was noted that the majority have paid minimal or no dividends in 2010.
While shareholders benefited from gains in stock prices, aggregate distributions received decreased as a proportion of total investment. This decline was due to both a small number of large companies reducing or cancelling altogether their dividends as a result of declining profits and the marked increase in the denominator – market capitalisation.
2010 2009
Dividends paid 333 894
Average market capitalisation 61,016 39,528
Dividend yield 0.55% 2.26%
Note: New Hope’s special dividend has been excluded from the dividend yield calculation.
New Hope
Energy Resources
Macarthur
Whitehaven
Kingsgate
Panoramic
Centennial
Aquarius
Independence
Western Areas
Iluka
Special dividend Dividend
78
65
53
42
25
25
22
11
6
5
2
Dividends paid in 2010 (A$m)

34 PwC
7.1 Focus–Don’tletyourcapitalproject bite back Is your capital project spend fully protected?
As the mining industry moves steadily away from the ramifications of the global economic downturn a new wave of cautious optimism is fuelling an increase in capital expenditure. There are now $157 billion of announced mining capital projects in Australia, $71 billion in WA alone. These are vast sums of money in play. At the bigger end of town, the capex focus is on the expansion of mature projects as companies seek low risk strategies and short-term gains. For the mid-tier it is more commonly a mine upgrade after a prolonged period of care and maintenance or the development of a new ore body. As such there are a large range of capital projects on the go which vary significantly both in terms of spend and complexity.
At this year’s Diggers & Dealers Conference in Kalgoorlie the excitement of significant development activities and emerging players was abundant. This is great news for the industry, but also poses significant risk that must be managed for these players to succeed. Throw in the uncertainty around the Australian government’s proposed MRRT and carbon tax, and you have mining project economics (such as NPV’s and life of mine models) changing every week.
A look back at previously completed capital projects highlights the minefield of potential pitfalls and inherent risks that they present. Every week we see press releases highlighting cost blow-outs on major capital projects. At a time when the shadow of the global economic downturn still looms large, companies can ill afford to make the same mistakes again and squander hard to find cash. Failure inevitably leads to a low return on investment, cashflow issues and ultimately irretrievable falls in the share price.
Six key lessons to support capital project success
1. Projects can only succeed when they align with the company strategy
The strategic planning process is fundamental to any mining business and is particularly important to inform the capital expenditure decision making process. A major capital project implemented in a strategic vacuum is doomed to failure and is likely to have a significantly adverse impact on the company’s position in the marketplace.
Senior management should already be engaged in a continual process to define and embed strategic objectives such as growth rates, targeted production run rates and the development of new resources. Capital projects should be appraised by the same means, ultimately through the use of robust valuation models and an approved internal rate of return. Internal controls surrounding the approval of capital projects and a comprehensive set of policies and procedures can help to strengthen and support this process.
2. Each project is unique and therefore has a unique set of risks – you must be all over them!
Each capital project is unique and will take place in unique market conditions. A complete and well structured risk assessment up front is therefore the only way to capture and act on the complexities of each project undertaken. This process can often be disparate and poorly communicated, with risks not being adequately assessed and not feeding into the project decision making process.
The risk assessment will ultimately define the project approach and should inform management’s go / no-go decision. It will also set the control framework within which the project will be completed. Operational, compliance and financial risks should be considered and from this the mechanisms in place to mitigate these risks should be assessed. Not every company is well versed in completing major capital projects and therefore at this point an honest appraisal of the existing skillset should be undertaken. Additional risk mitigation strategies and controls should be supplemented as required.
3. The project structure must be meticulously planned and defined
A significant proportion of capital projects fail due to poor up-front planning and inadequate consideration of the structural changes that might be required for such an undertaking. This often takes the lead from a poor risk assessment process.
Critical decisions need to made at this stage, including the contracting strategy and whether the company will manage the project in–house. The team structure needs to be fully defined, with key responsibilities, accountabilities and reporting lines established. Decisions over where project control will reside and the governance structure that is adopted should be made, communicated and embedded into the project. Central processing facilities, if they exist, need to be appraised for project suitability. These are just a few examples, but poor structural analysis and therefore decision making at this stage can lead to significant problems during later project phases.
4. Systems must be capable of supporting a capital project
Too often project systems are considered at the last gasp before project commencement or even worse during project implementation. Inevitably in these cases the system does not meet project requirements and project personnel resort to manual work rounds and laborious data manipulation. At best, this leads to inefficiency and at worse it leads to bad project decisions from inaccurate or incomplete management information.
Ideally, project system requirements should be drawn up after the project risks, structure and reporting requirements have been defined. This enables informed management decisions, including whether it is worth configuring existing software or to implement bespoke project software. It also enables a clear vision of the management reporting that is required, including meaningful KPI’s upon which value based decisions can be made, and how the system can be used to support this.
5. Contractors must be well chosen and controlled
Contracting risk is high on the agenda of any capital project, the severity of which depends on the contracting strategy that has been adopted. Contractors can be the root cause of project delays and overruns, which typically do not become visible until the project is close to completion.
Prior to any contract being signed, the project should have a well defined project contracting execution plan in place and have designed mechanisms to manage key contractors. Appropriate change management procedures are critical and suitable contractor reporting should be enforced so that there are no back-end surprises.
6. Project assurance activities should be well integrated
Often there can be a major disconnect between projects and the assurance services within a company that are in place across other operations. QA have a role to play, as do Internal Audit, but these roles can become confused and poorly communicated with the result being the project team do not buy-in or support the services to help the project succeed.
Project assurance should be undertaken with an integrated approach from the project outset. The most effective form of assurance / comfort to the Board is when Quality Assurance (QA), Health Safety Environment and Community (HSEC) and Internal Audit (IA) work in parallel and harmony. This enables the best possible risk based outcome without compromising on technical know-how.
1ABARE, Minerals and Energy, Major Development Projects October 2010
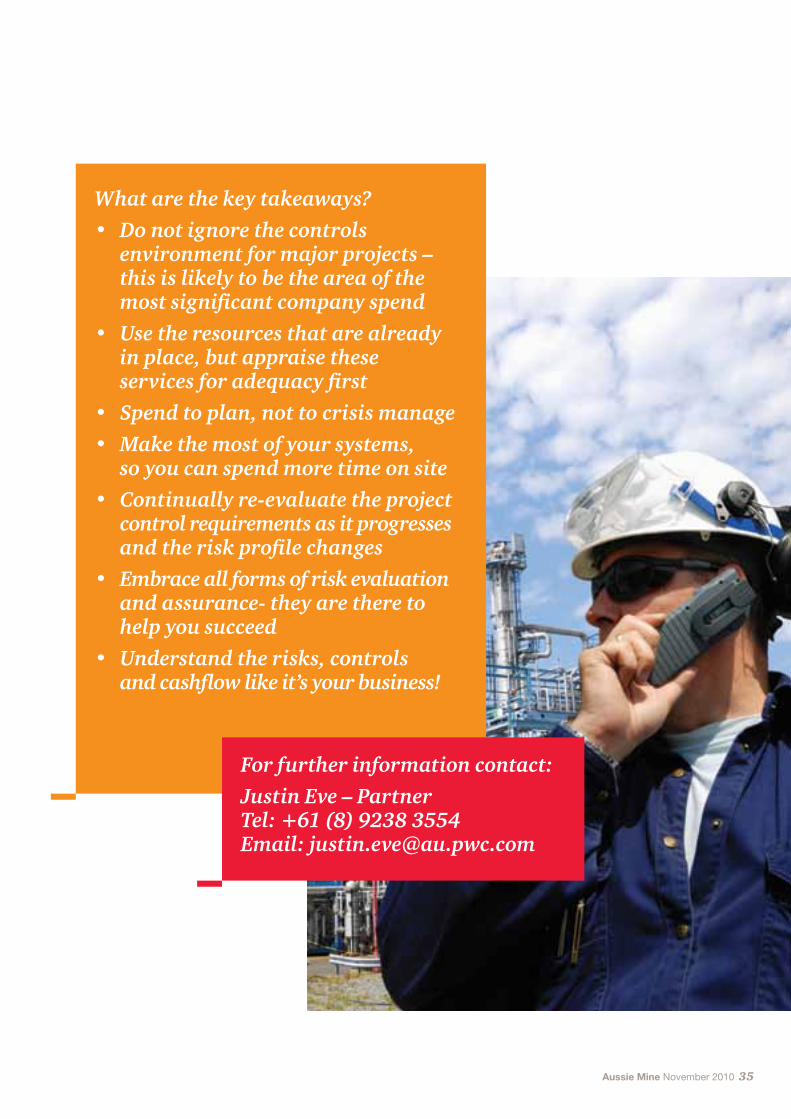
Aussie Mine November 2010 35
What are the key takeaways?• Do not ignore the controls
environment for major projects – this is likely to be the area of the most significant company spend
• Use the resources that are already in place, but appraise these services for adequacy first
• Spend to plan, not to crisis manage• Make the most of your systems, so you can spend more time on site• Continually re-evaluate the project
control requirements as it progresses and the risk profile changes
• Embrace all forms of risk evaluation and assurance- they are there to help you succeed
• Understand the risks, controls and cashflow like it’s your business!
For further information contact:Justin Eve – Partner Tel: +61 (8) 9238 3554 Email: [email protected]

36 PwC
Looking ahead 8
Whilst there has been some uncertainty in the political arena in Australia, particularly associated with the impact of theMRRT,themid-tier50 remain strong and poised to rise and shine with cash balances in excess of $7 billion.
Commodity prices continue to strengthen on the back of strong demand from China, India and the developing world, while the United States and Europe continue to show a lack of real growth. Gold has pushed through the US$1,400 barrier and may continue this upward trend. Other base metals and iron ore prices have strengthened and look set to firm as demand continues to grow.
The fundamentals driving gold, including the decline in US$ against a number of traded currencies and domestic weakness in the United States and European economies, point to gold investment as a safe haven and store of wealth. Therefore while this uncertainty and currency weakness remains, gold may continue to glitter over at least the short to medium-term.
A key concern for Australian exporters is the AUD:USD exchange rate. In mid October 2010, the A$ reached parity with the Greenback. While holiday makers are enjoying “Parity Parties”, the strength of the A$ takes away much of the US$ commodity price upside that has been experienced over the past 3 – 6 months.
A key theme from this year’s publication is the significant increase in cash reserves generated through equity raisings and operational cash flows over the past two years. The equity raisings over the past two years represent 10% of the market capitalisation of the mid-tier 50 at June 2010. These companies are clearly geared for growth, and are waiting for the next big project to continue their story.
Australian resource deals have recently been across all sections of the industry, reflecting the strong demand for these commodities. Offshore investors, particularly from China, have emerged as a significant new force in Australian resources M&A activity as they strive to secure supply of resources that are becoming scarce and more costly to develop. We expect to see more Chinese and others taking strategic stakes in producing or near production miners or arranging alternative funding, such as an off-take agreement accompanied by large project based debt funding package.
Equity markets have opened once again and strategic offshore investment remains strong. Debt is still tight, with a recent trend of Australian companies agreeing to strategic alliances with offshore companies with access to cheap debt from the partners’ local banks rather than sourcing more traditional forms of debt financing.
The global IPO market suffered significantly during the global economic downturn. There has been a recent return as market sentiment has improved. Of particular note is the increase in IPO activity as companies spin off non-core assets into new entities and the move by Hong Kong to position itself as the major mining exchange of the future.
With significant free cash currently sitting on the balance sheets, the mid-tier 50 need to be careful to fully assess future potential M&A activity. Empirical evidence collated by PwC suggests that 50% of deals erode shareholder value, 33% provide marginal return and only 17% provide substantial return to shareholders. Notwithstanding the number of value-destroying/failed mergers that have been well documented, they are inevitable and will continue, in the rush to obtain future projects.
Chinese entities continue to target Australian resource companies and projects. However deal closure and integration are still an area of concern for many organisations. We have noted a recent trend of Chinese entities seeking control of an ASX listed vehicle with African assets, or the ability to spin African assets into them. Chinese companies will hope to leverage off in-country African experience to make African projects work.
Traditionally Australian investors have turned away from Australian companies with African assets. This is changing, with a more mature investment outlook, better understanding of the African mining environment and greater stability in many African nations. China, as well as the big miners, have recognised the riches available in Africa and are leading the pack. We expect to see more activity and investment into Africa by Australia companies, following the lead forged by the big players. These projects will require major investment, particularly in infrastructure to get them off the ground. However West Africa is not the only new address. As resources become scarce companies are looking to non-traditional mining locations for the next world class mines. Interest in Mongolia has been particularly strong.
Now that the global economic downturn is behind us, the boards of the mid-tier 50 should have growth aspirations at front of mind. Investment strategies should be re-visited and viable and researched opportunities should be capitalised on to secure the long-term sustainability of their organisations.
Traditionally Australian investors have turned away from Australian companies with African assets. This is changing...

Aussie Mine November 2010 37
$x/oz Dollars per ounce
$x/lbDollars per pound
ABAREThe Australian Bureau of Agricultural and Resource Economics
AIFRSAustralian equivalent to International Financial Reporting Standards
Adjusted EBITDAEBITDA excluding impairment charges and gain / (loss) on sale of investments
Current ratioCurrent assets divided by Current liabilities
EBITDAEarnings before interest, tax, depreciation and amortisation
Debt to equityBorrowings divided by Borrowings plus shareholders equity
Gross profitRevenue minus expenses from ordinary activities and exploration
Gross marginGross profit divided by revenue
Market capitalisationThe market value of the equity of the company, calculated as the share price multiplied by the number of shares outstanding
MRRTMineral Resource Rent Tax
Net borrowingsTotal borrowings less cash and cash equivalents
Net debt to equityNet borrowings divided by Net borrowings plus shareholders equity
Quick ratioCurrent assets less inventories divided by Current liabilities
Return on equityNet profit divided by total closing equity
RSPTResource Super Profits Tax
Glossary 9

38 PwC
Mid-tier 50 companies analysed 10
Symbol EntityName Year end Market Capitalisation
as at 30/06/2010 A$m
Rankby Market
Capitalisation
Producer (P)/ Non-Producer
(N)
AWC Alumina Ltd 31-Dec-09 3,721 1 N
AND Andean Resources Ltd 30-Jun-10 1,588 15 N
AVM Anvil Mining Limited 31-Dec-09 421 48 P
AQP Aquarius Platinum 30-Jun-10 2,737 6 P
AQA Aquila Resources Ltd 30-Jun-10 2,533 9 P
AGO Atlas Iron Limited 30-Jun-10 999 20 P
AVO Avoca Resources Ltd 30-Jun-10 795 26 P
BRM Brockman Resources Limited 30-Jun-10 422 46 N
CEY Centennial Coal Co. Ltd 30-Jun-10 1,766 13 P
CGX CGA Mining Limited 30-Jun-10 739 30 P
CGG Citadel Resource Group Limited 30-Jun-10 617 37 N
CDU CuDeco Ltd 30-Jun-10 640 36 N
ERA Energy Resources of Australia Ltd 31-Dec-09 2,537 8 P
EQN Equinox Minerals Ltd 31-Dec-09 3,015 4 P
EXT Extract Resources Ltd 30-Jun-10 1,580 16 N
GBG Gindalbie Metals Ltd 30-Jun-10 733 32 N
GCL Gloucester Coal Ltd 30-Jun-10 1,018 19 P
GRR Grange Resources Limited 30-Jun-10 576 39 P
GNM Gujarat NRE Coking Coal Limited 31-Mar-10 578 38 P
ILU Iluka Resources Ltd 31-Dec-09 1,938 12 P
IGO Independence Gold NL 30-Jun-10 537 42 P
IRN Indophil Resources NL 31-Dec-09 464 43 N
IVA Ivanhoe Australia Limited 31-Dec-09 883 24 N
KCN Kingsgate Consolidated Limited 30-Jun-10 947 22 P
LYC Lynas Corp. Ltd 30-Jun-10 902 23 N
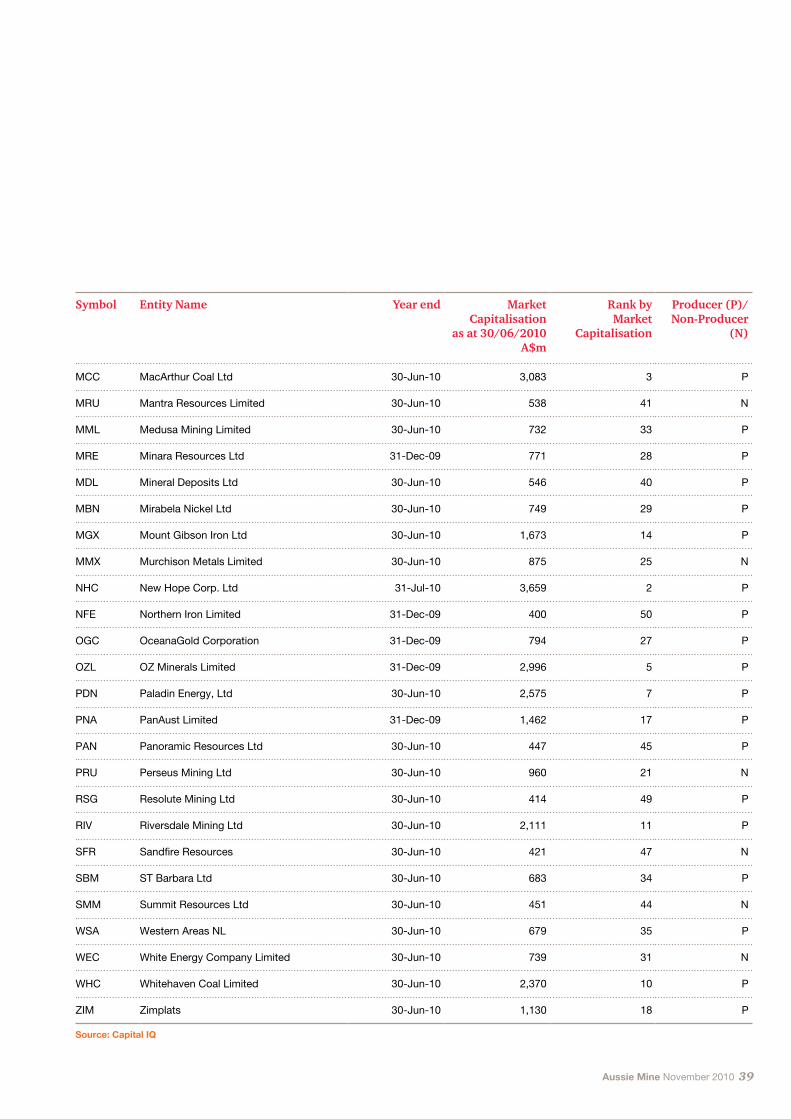
Aussie Mine November 2010 39
Symbol EntityName Year end Market Capitalisation
as at 30/06/2010 A$m
Rankby Market
Capitalisation
Producer (P)/ Non-Producer
(N)
MCC MacArthur Coal Ltd 30-Jun-10 3,083 3 P
MRU Mantra Resources Limited 30-Jun-10 538 41 N
MML Medusa Mining Limited 30-Jun-10 732 33 P
MRE Minara Resources Ltd 31-Dec-09 771 28 P
MDL Mineral Deposits Ltd 30-Jun-10 546 40 P
MBN Mirabela Nickel Ltd 30-Jun-10 749 29 P
MGX Mount Gibson Iron Ltd 30-Jun-10 1,673 14 P
MMX Murchison Metals Limited 30-Jun-10 875 25 N
NHC New Hope Corp. Ltd 31-Jul-10 3,659 2 P
NFE Northern Iron Limited 31-Dec-09 400 50 P
OGC OceanaGold Corporation 31-Dec-09 794 27 P
OZL OZ Minerals Limited 31-Dec-09 2,996 5 P
PDN Paladin Energy, Ltd 30-Jun-10 2,575 7 P
PNA PanAust Limited 31-Dec-09 1,462 17 P
PAN Panoramic Resources Ltd 30-Jun-10 447 45 P
PRU Perseus Mining Ltd 30-Jun-10 960 21 N
RSG Resolute Mining Ltd 30-Jun-10 414 49 P
RIV Riversdale Mining Ltd 30-Jun-10 2,111 11 P
SFR Sandfire Resources 30-Jun-10 421 47 N
SBM ST Barbara Ltd 30-Jun-10 683 34 P
SMM Summit Resources Ltd 30-Jun-10 451 44 N
WSA Western Areas NL 30-Jun-10 679 35 P
WEC White Energy Company Limited 30-Jun-10 739 31 N
WHC Whitehaven Coal Limited 30-Jun-10 2,370 10 P
ZIM Zimplats 30-Jun-10 1,130 18 P
Source: Capital IQ

40 PwC
We have analysed the largest 50 mining companies listed on the ASX with a market capitalisation of less than $5 billion at 30 June 2010. The results aggregated in this report have been sourced from publicly available information, primarily annual reports and financial reports available to shareholders. Companies have different year-ends and report under different accounting regimes.
Information has been aggregated for the financial years of individual companies and no adjustments have been made to take into account different reporting requirements and year-ends. As such, the financial information shown for 2010 covers periods between and 1 January 2009 and 30 June 2010, with each company’s results included for the 12-month financial reporting period that falls into this timeframe.
All figures in this publication are reported in A$, except where specifically stated. The results of companies that report in currencies other than the A$ have been translated at the average A$ exchange rate for the financial year, with balance sheet items translated at the closing A$ exchange rate.
Some diversified companies undertake part of their activities outside of the mining industry. No attempt has been made to exclude such non-mining activities from the aggregated financial information.
Explanatory notes 11

Aussie Mine November 2010 41
PwC provides industry-focused assurance, tax and advisory services to build public trust and enhance value for its clients and their stakeholders. More than 130,000 people in 148 countries work collaboratively using connected thinking to develop fresh perspectives and practical advice.
PwC is a leading advisor to the mining industry, working with more explorers, producers and related service providers than any other professional services firm to ensure we meet the challenges of the global mining industry in the future.
Our strength in serving the mining industry comes from our skills, experience and seamless network of dedicated professionals who focus their time on understanding the industry and working on solutions to mining industry issues.
For more information on this publication or how PwC can assist you in managing value and reporting, please speak to your current PwC contact or telephone/e-mail the individuals below who will put you in contact with the right person.
AustraliaEnergy and Resources Industry Leader
Michael Happell, Melbourne Telephone: +61 3 8603 6016 Email: [email protected]
Australian Mining Leader
Tim Goldsmith, Melbourne Telephone: +61 3 8603 2016 Email: [email protected]
Contacting PwC 12
GlobalGlobal Mining Leader
Tim Goldsmith, Melbourne Telephone: +61 3 8603 2016 Email: [email protected]
Global Knowledge Manager
Ben Gargett, Melbourne Telephone: +61 3 8603 2539 Email: [email protected]
Russia and Central and Eastern Europe
John Campbell, Moscow Telephone: +7 (405) 967 6279 Email: [email protected]
South Africa
Hein Boegman, Johannesburg Telephone: +27 11 797 4335 Email: [email protected]
United Kingdom
Jason Burkitt, London Telephone: +44 (20) 7213 2515 Email: [email protected]
United States
Steve Ralbovsky, Phoenix Telephone: +1 (602) 364 8193 Email: [email protected]
New South Wales
Marc Upcroft, Sydney Telephone: +61 2 8266 6133 Email: [email protected]
Queensland
Brian Gillespie, Brisbane Telephone: +61 7 325 75656 Email: [email protected]
South Australia
Andrew Forman, Adelaide Telephone: +61 8 8218 7401 Email: [email protected]
Victoria
Tim Goldsmith, Melbourne Telephone: +61 3 8603 2016 Email: [email protected]
Western Australia
Doug Craig, Perth Telephone: +61 8 9238 3262 Email: [email protected]
Brazil
Ronaldo Valino, Rio de Janeiro Telephone: +55 (21) 3232-6015 Email: [email protected]
Canada
John Gravelle, Toronto Telephone: +1 (416) 869 8727 Email: [email protected]
Chile
Colin Becker, Santiago Telephone: +56 (2) 940 0016 Email: [email protected]
China
Ken Su, Beijing Telephone: +86 (10) 6533 7290 Email: [email protected]
India
Kameswara Rao, Hyderabad Telephone: +91 40 6624 6688 Email: [email protected]

42 PwC
Other Mining Publications
Our commitment to the industry goes beyond our services. As industry leaders, we are nationally as well as globally recognised for our broad knowledge of the mining industry and the laws that govern it.
Set out on this page are examples of recent mining thought leadership publications.
JuniorMine:TrendsintheTSX-V2010 October 2010
PricewaterhouseCoopers Canada’s review of trends in the TSX-V mining industry includes a snapshot of 20 mining companies on the TSX Venture Exchange with market capitalisations of $500-700 million.
Contact:John Gravelle, Toronto T: +1 (416) 869 8727 E: [email protected]
Global Mine Bulletin
This occasional bulletin highlights a number of mining industry topics and a number of reports and surveys recently issued by the PwC global mining team.
Contact:Tim Goldsmith, Melbourne T: +61 (3) 8603 2016 E: [email protected]
Ben Gargett, Melbourne T: +61 (3) 8603 2539 E: [email protected]
OurResourcesExperience–Consulting
In this document PwC Australia outlines its Consulting experience with such organisations as BHP Billiton, Rio Tinto, Xstrata, Vale, Santos, Anglo American and BG. We have also worked closely with small and mid-tier operators to provide business solutions and to help to deliver on growth aspirations.
Contact:Michael Happell, Melbourne T: +61 (3) 8603 6016 E: [email protected]
Brian Gillespie, Brisbane T: +61 (7) 3257 5656 E: [email protected]
MiningDeals–NoStoneUnturned September 2010
The global mining sector is awash in M&A announcements, with 1,324 deals worth an aggregate $104 billion announced globally year to date. At this pace, the year is set to close at, or near 2007 peak levels. PwC experts comment on the key trends that are set to dominate the global mining sector for the remainder of this year.
Contact:Tim Goldsmith, Melbourne T: +61 (3) 8603 2016 E: [email protected]
John Gravelle, Toronto T: +1 (416) 869 8727 E: [email protected]
DiggingintoIFRS
A monthly Australian newsletter that focuses on topical accounting issues relevant to the energy and resources industry.
Contact:Debbie Smith, Melbourne T: +61 (3) 8603 2249 E: [email protected]
Jason Burkitt, London T: +44 (20) 7213 2515 E: [email protected]
5 October 2010
Acc
ount
ing
issu
esaf
fect
ing
the
ener
gyan
dre
sour
ces
sect
or
Digging into IFRSLeases proposals set to rock the mining industryWhat’s the issue?Last month the International Accounting Standards Board (IASB) and the US Financial Accounting Standards Board (FASB)released an Exposure Draft (ED) on Leases as part of their commitment to converging US IFRS and US GAAP. Theproposals would overhaul the current requirements in AASB 117 Leases and dramatically change the way entities accountfor leases.
Who is affected?If adopted, almost all entities will be affected because leases are abundant in the resources sector. It will affect entities that:
• have acquired significant operating leases (such as mining or extraction equipment);
• have finance lease arrangements that are within the scope of the existing leasing standard (such as fleets of trucks);
• are planning on entering into new leasing arrangements; and
• have operating leases which are likely to extend beyond 2012, which is when we expect the new standard to be issued.
Note: Leases relating to the exploration or extraction of natural resources, including minerals, oil and gas have beenexcluded from the proposals. Entities that use long-term contract mining services (including fleet equipment) will need toconsider the principles in AASB Interpretation 4 Determining whether an arrangement contains a lease. The interpretationrequires certain dedicated services to be classified as lease arrangements and the principles have been incorporated in theproposed new standard.
How would current practice change?The current standard requires entities to evaluate lease arrangements at the beginning of a lease and determine if they are afinance lease or an operating lease. However, the proposals adopt the ‘right of use’ concept to replace the existing ‘risks andrewards’ concept. Entities would be required to recognise an asset and liability at the start of the lease and the distinctionbetween operating leases and finance leases will be eliminated.
It’s important to note that lessees will be required to reassess the lease term, contingent rentals and residual valueobligations at each reporting date. This differs to current obligations, where entities must include and estimate contingentrentals and residual value guarantees at the start of the lease.
What are the broader impacts of the ED on lessees?If adopted, the proposals would have wide-ranging impacts on business. For example:
• Balance sheet: entities would be required to recognise a right of use (asset) and an obligation to pay (liability) at the start ofall leases.
• Profit and loss metrics: lease expenses would have an amortisation component and a financial cost component. Thiswould directly impact the EBITDA (earnings before interest, taxes, depreciation and amortisation) calculation and otherP&L metrics.
• Debt covenant measurements: measurements based on interest cover and gearing levels will incur the biggest impact.This is because the obligation to pay liability will be recognised at the start of the lease and the leasing expense moves frombeing an operating cost to being classified as additional amortisation and a finance cost.
• Contracts: related to finance facilities and other long-term arrangements that are based on measures relating to EBITDA.
• Credit ratings: these could be impacted by changing debt levels.
• Remuneration: short-term bonuses and other remuneration arrangements (such as employee shared options) that areimpacted by EBITDA, P&L or balance sheet KPIs will need to be revisited.
Future balance sheet could be hard for entities to manage. Insight from an industry expert.
“The leases proposals are significant for the many sectors (including resources) and I know that a number of businesses areconcerned about how the final standard might affect them. From my experience at PwC and in the world of business,knowledge is power and I encourage entities to consider the implications of the proposals now if they haven’t already doneso. Based on a recent PwC benchmarking survey, entities (across sectors) can expect:
What are the next steps?
Entities will have until 15 December 2010 to comment on the ED. The IASB and US FASB have indicated they expect toissue the final standard in 2011. An effective date could be as early as 2014, which means an entity with a 30 June 2014year-end would need to apply the standard to all leases in place from 1 July 2012. For more information, please talk toyour usual PwC representative or one of the industry experts listed overleaf.
With such a significant standard on the horizon, it’s important to prepare for the change as early as possible.” Debbie Smith,partner, PwC.
• an average increase in interest-bearing debt of around 30%;• an average increase in EBITDA of around 10%; and• an average increase in debt generally, which will vary from entity to entity.
*connectedthinking
Mining Industry
Global Mine* BulletinSeptember 2010
ProposedResource Rent taxRegime forAustralia
Mine* 2010
A region in focus:Metals and Miningin Russia and theCIS
Total TaxContribution – Astudy of theeconomiccontribution miningcompanies maketo public finances
PI Corner:Managing creditrisk for globalcommodityproducers
Contacting PwC
Back to the Boom! Short-term volatility will give way to long-term growth
My role as global mining leader for PricewaterhouseCoopers sees me travelling extensively across theglobe. In the past six months I have visited Africa, Central Asia, Russia and China. The common themeacross these regions was both the intensity of mass-scale developments and the need for it to happenquickly. For example, the speed and magnitude of growth in China has continued on an unprecedentedscale. By the end of 2011 China is expected to overtake North America as the world's largest consumer ofmineral commodities - the first time since the Industrial Revolution.
The ongoing industrialisation of the world's key emerging economies will dramatically increase futuredemand for mineral commodities. Many nations that supply minerals view this demand as a tremendousopportunity to increase the footprint of their mining industry. There are substantial benefits for countriesthat are prepared to seize this opportunity by developing a whole-of-industry mining strategy.
As the majors have released their June quarter results over recent weeks, there has been a commontheme of including warnings of short-term volatility in metals prices and demand, followed by strongconviction in the long-term fundamental strength of the industry. This confidence in the future is supportedby the industrialisation highlighted above, but also a pending shortage in the supply of minerals to meetthis growing demand.
The Global Financial Crisis, and subsequent step away from the industry by the banking sector at large,has only served to heighten the supply challenges. Miners have already had to shift focus to new frontiers,such as Russia and the CIS states we have featured in this edition, to find the next world scale mines.Restrictions in funding and capital expenditure over the past two years as cash has been tight will serve tofurther delay future discoveries.
On top of the supply challenge comes the rise of mining as a political issue. This has been demonstratedmost clearly in Australia, with the announcement of a “Resources Super Profits Tax”, subsequentbacklash from the industry, the removal of an incumbent Prime Minster by his own party, fundamentaladjustment to the tax workings, and an election which, at this stage, remains in the balance – all of whichhad taxation of the mining industry as a key element in the mix. Our flagship publication Mine 2010, Backto the Boom!, emphasises the need for CEOs of the industry to increasingly have significant diplomaticskills to address this focus as well as looking in detail at the performance of the industry in 2009.
As always, I trust you will find this informative and useful. I welcome any feedback on comments on areascovered or on which you would like to focus in the future.
Tim GoldsmithGlobal Mining LeaderPricewaterhouseCoopers
Consulting November 2010
pwc.com.au
Resources Experience
Mining Deals No Stone Unturned
pwc.com/mining
2010 Mid-year update
September 2010
Prepared in conjunction with the 14th annual PwC America’s School of Mines
Optimising extended mining operations through value driver modeling November 2010
This paper seeks to demonstrate that robust modelling of operational cost and value drivers across the extended life of mining operation is a key requirement for maximising value, regardless of the economic cycle.
Contact:Brian Gillespie, Brisbane T: +61 (7) 3257 5656 E: [email protected]
13

Aussie Mine November 2010 43
Respondingtoclimatechange August 2010
Challenges and solutions on the road ahead This publication shows how PwC can assist EU&M companies in the areas of Strategy, Risk, Regulation and Reporting to optimise operations and deliver leading practice. Our goal is to help companies deliver on their climate change ambitions in a way that brings maximum value and competitive advantage.
Contact:Liza Moimone T: +61 (3) 8603 4150 E: [email protected]
MetalsandMininginRussiaandCIS April 2010
This inaugural edition of Metals & Mining in Russia and CIS focuses on the state of the mining sector in this region and the major trends in its development. It analyses the financial results of 20 major mining companies in Russia, Ukraine and Kazakhstan.
Contact:John Campbell, Moscow T +7 (495) 967 6279 E: [email protected]
South Africa Mine December 2009
This inaugural edition of SA Mine focuses on the state of the mining sector in South Africa. It aggregates the financial results of mining companies with a primary listing on the Johannesburg Stock Exchange (JSE) and mining companies with a secondary listing on the JSE whose main operations are in Africa.
Contact:Hein Boegman, Johannesburg T: +27 11 797 4335 E: [email protected]
Findingcostefficienciesinminingoperations through effective value driver modelling February 2009
This paper highlights Australian mining best practice in both operations cost management and production value maximisation through robust modelling of operational value drivers.
Contact:Brian Gillespie, Brisbane T: +61 (7) 3257 5656 E: [email protected]
Mine:BacktotheBoom… May 2010
Our seventh annual survey of the Top 40 mining companies by market capitalisation, provides a comprehensive analysis of the financial performance and position of the global mining industry and also discusses current trends in the global mining industry.
Contact:Tim Goldsmith, Melbourne T: +61 (3) 8603 2016 E: [email protected]
Ben Gargett, Melbourne T: +61 (3) 8603 2539 E: [email protected]
Managing credit risk for global commodity producers March 2010
This paper describes the credit risk issues faced by global commodity producers and highlights examples of best practice in the areas of the assessment and management of credit risk.
Contact:Brian Gillespie, Brisbane T: +61 (7) 3257 5656 E: [email protected]
Gold Medal Performance - 2009 GlobalGoldPriceSurveyReport December 2009
This survey covers 45 gold mining and development companies with global operations, which together reported expected production of 33,343,385 ounces in 2009.
Contact:John Gravelle, Toronto T: +1 (416) 869 8727 E: [email protected]
IndustriesEnergy, Utilities & MiningCapability statement
Responding toclimate changeChallenges and solutions on the road ahead
Metals and MiningReview of trends in the metals and mining industry – 2010
Metals and Mining in Russia and the CIS
SA MineReview of trends in the South African mining industry
December 2009
Energy, Utilities & Mining
Finding cost effi ciencies in mining operations through effective value driver modellingAaron Carter, Brian Gillespie and Chris GilbertPerformance Improvement Group, Brisbane
February 2009
Managing credit risk for global commodity producers Brian Gillespie, John Hackwood and Chris Mihos
March 2010
Gold Medal Performance 2009 Global Gold Price Survey Report
December 2009
Mining
Financial reporting in the mining industry 2007 (new release February 2011)
This provides a comprehensive analysis of financial reporting in the global mining industry. It sets out the major accounting practices adopted by the mining industry under IFRS in respect of issues of particular relevance to the mining sector. We are currently updating this publication to address all recent changes and developments in IFRS and industry practice.
Contact:Debbie Smith, Melbourne T: +61 (3) 8603 2249 E: [email protected]
Jason Burkitt, London T: +44 (20) 7213 2515 E: [email protected]
Energy, Utilities & Mining
Financial reporting in the mining industry*International Financial Reporting StandardsJune 2007

44 PwC
Key contributors to this reportBen Gargett Director
Malcolm Reid Associate Director
Michael Johns Manager
David Ray Senior Accountant
Brett Wright Senior Consultant
Tamara Measor Senior Accountant
Charlie Li Accountant
For copies of this report,contact:Jacqui Thurlow Tel: +61 (3) 8603 3267 Email: [email protected]
Key Contributors
pwc.com.au
Printed on ecoStar, a recycled, environmentally responsible paper manufactured from 100% post-consumer waste. It is Forest Stewardship Council (FSC) chain of custody (CoC)certified and bleached process chlorine free. The mill’s certified environmental management scheme ISO14001 ensures continuous improvement across all manufacturing areas to reduce their effect on the environment.
© 2010 PricewaterhouseCoopers. All rights reserved. In this document, “PwC” refers to PricewaterhouseCoopers, which is a member firm of PricewaterhouseCoopers International Limited, each member firm of which is a separate legal entity.
This document is provided by PwC as general guidance only and does not constitute the provision of accounting, legal advice, tax services, investment advice, or professional consulting of any kind. The information is provided “as is” with no assurance or guarantee of completeness, accuracy or timeliness of the information and without warranty of any kind, express or implied, including but not limited to warranties of performance, merchantability and fitness for a particular purpose. In no event will PwC or its professionals be liable in any way to you or to anyone else for any decision made or action taken in reliance on the information or for any direct, indirect, consequential, special or other damages related to you or your use of information, even if advised of the possibility of such damages. Before making any decision or taking any action, you should consult a professional adviser who has been provided with all the pertinent facts relevant to your particular situation.
WL169365


![· PDF fileTotal comprehensive income attributable to: Owners of the parent Minority interest [statement of comprehensive income] Created Date: 20080117130458Z](https://static.fdocuments.in/doc/165x107/5a788f627f8b9ae91b8c1411/comprehensive-income-attributable-to-owners-of-the-parent-minority-interest-statement.jpg)