RIOCAN - s1.q4cdn.coms1.q4cdn.com/847730316/files/documents_presentations/2015/Q2/Q2... · RioCan...
58
RIOCAN PRESENTATION 2015 Xxxxxxx Xxxxxx February 25, 2015 RioCan Investor Presentation Second Quarter 2015 September 4, 2015
Transcript of RIOCAN - s1.q4cdn.coms1.q4cdn.com/847730316/files/documents_presentations/2015/Q2/Q2... · RioCan...

RIOCAN PRESENTATION 2015 Xxxxxxx Xxxxxx February 25, 2015
RioCan Investor Presentation Second Quarter 2015 September 4, 2015
2
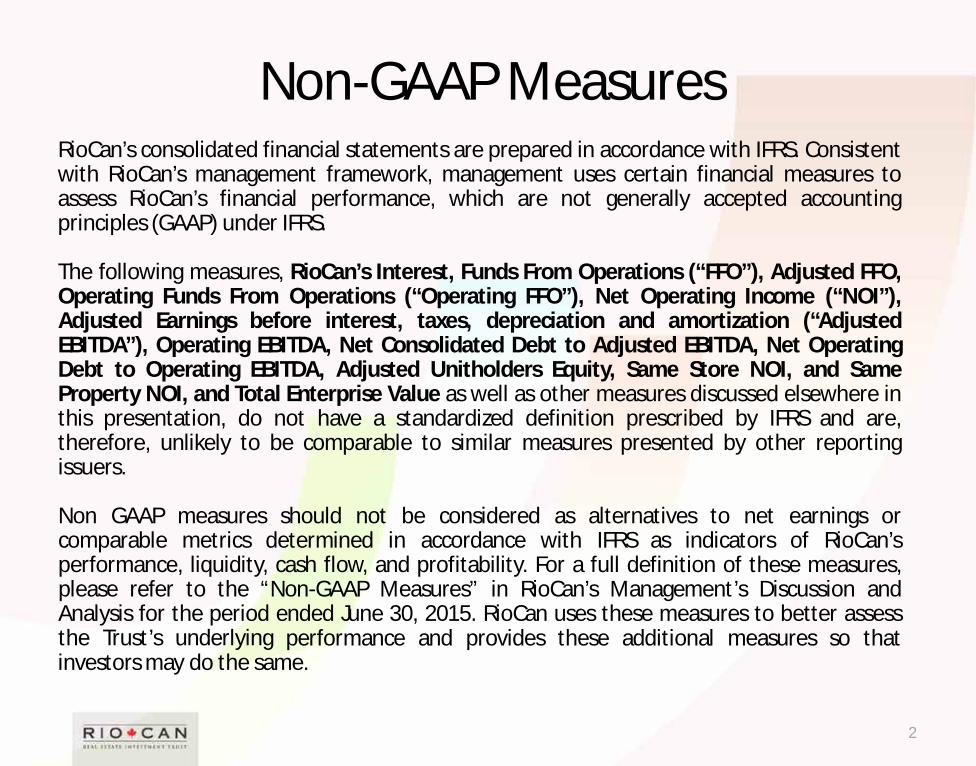
Non-GAAP Measures RioCan’s consolidated financial statements are prepared in accordance with IFRS. Consistent with RioCan’s management framework, management uses certain financial measures to assess RioCan’s financial performance, which are not generally accepted accounting principles (GAAP) under IFRS. The following measures, RioCan’s Interest, Funds From Operations (“FFO”), Adjusted FFO, Operating Funds From Operations (“Operating FFO”), Net Operating Income (“NOI”), Adjusted Earnings before interest, taxes, depreciation and amortization (“Adjusted EBITDA”), Operating EBITDA, Net Consolidated Debt to Adjusted EBITDA, Net Operating Debt to Operating EBITDA, Adjusted Unitholders Equity, Same Store NOI, and Same Property NOI, and Total Enterprise Value as well as other measures discussed elsewhere in this presentation, do not have a standardized definition prescribed by IFRS and are, therefore, unlikely to be comparable to similar measures presented by other reporting issuers. Non GAAP measures should not be considered as alternatives to net earnings or comparable metrics determined in accordance with IFRS as indicators of RioCan’s performance, liquidity, cash flow, and profitability. For a full definition of these measures, please refer to the “Non-GAAP Measures” in RioCan’s Management’s Discussion and Analysis for the period ended June 30, 2015. RioCan uses these measures to better assess the Trust’s underlying performance and provides these additional measures so that investors may do the same.

Forward Looking Statements
3
Certain information included in this presentation contains forward-looking statements within the meaning of applicable securities laws including, among others, statements concerning our objectives, our strategies to achieve those objectives, as well as statements with respect to management's beliefs, plans, estimates, and intentions, and similar statements concerning anticipated future events, results, circumstances, performance or expectations that are not historical facts. Certain material factors, estimates or assumptions were applied in drawing a conclusion or making a forecast or projection as reflected in these statements and actual results could differ materially from such conclusions, forecasts or projections. Additional information on the material risks that could cause our actual results to differ materially from the conclusions, forecast or projections in these statements and the material factors, estimates or assumptions that were applied in drawing a conclusion or making a forecast or projection as reflected in the forward-looking information can be found in our annual information form and annual report that are available on our website and at www.sedar.com. Except as required by applicable law, RioCan undertakes no obligation to publicly update or revise any forward-looking statement, whether as a result of new information, future events or otherwise.
3

One of North America’s Largest Retail REITS
4
353 retail properties in Canada & U.S.
79 million sqft total portfolio
$8.6 billion market cap
54 million sqft owned
$15.6 billion enterprise value
~84% revenue generated by national and anchor tenants
~7,600 tenancies
This slide contains references to non-GAAP Measures. For a definition of such measures please refer to RioCan’s June 30, 2015 MD&A.
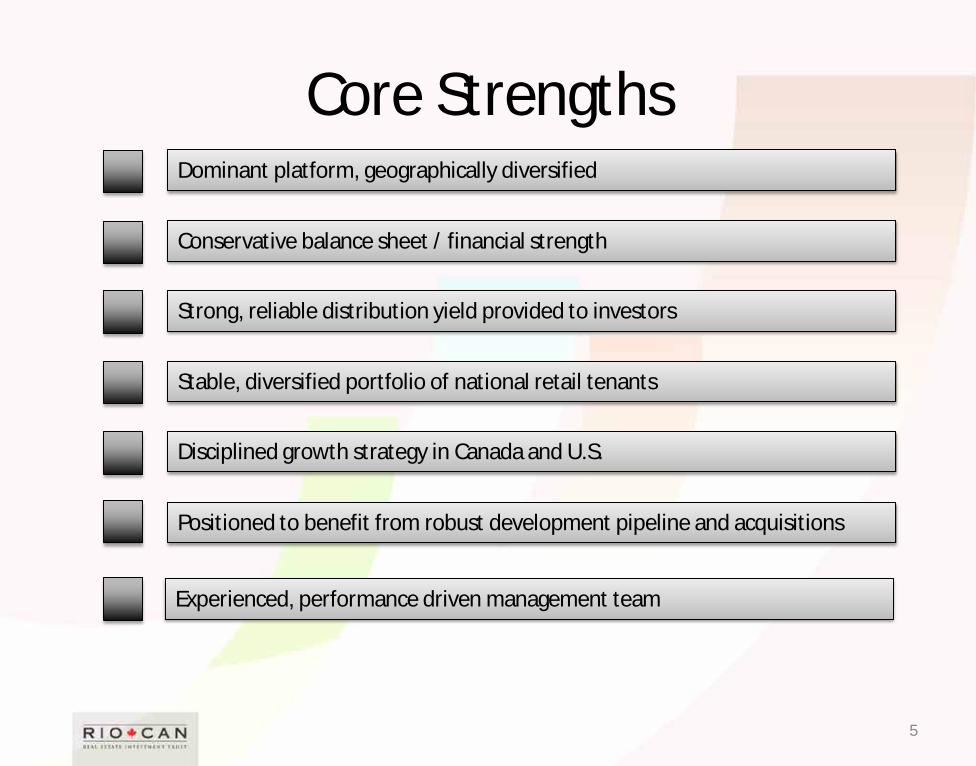
Core Strengths
5
Strong, reliable distribution yield provided to investors
Stable, diversified portfolio of national retail tenants
Disciplined growth strategy in Canada and U.S.
Positioned to benefit from robust development pipeline and acquisitions
Experienced, performance driven management team
Dominant platform, geographically diversified
Conservative balance sheet / financial strength

QC
PA
VA
Property Portfolio
As at June 30, 2015 at RioCan’s interest
CT MA
BC
AB
ON
SA MB
NB
NFLD
305 retail properties
44 million sqft
82.4% annualized rental revenue
TX
48 retail properties
10 million sqft
17.6% annualized rental revenue
6
Ontario 57%
Quebec 8%
Alberta 10%
British Columbia 5%
Other Canada 2%
N.E. United States 8%
Texas 10%
Annualized Rental Revenue by Region

Property Portfolio – Canada
7
Calgary
Edmonton
Vancouver
Toronto
Montreal Ottawa
BC
AB
ON
QC
Annualized Rental Revenue by Major Market
11.0%
Major markets
combined, 74.4%
Rest of Canada, 25.6%
6.6%
3.7% 4.0%
6.4%
42.7%
7

Strong Tenant Relationships
8 8
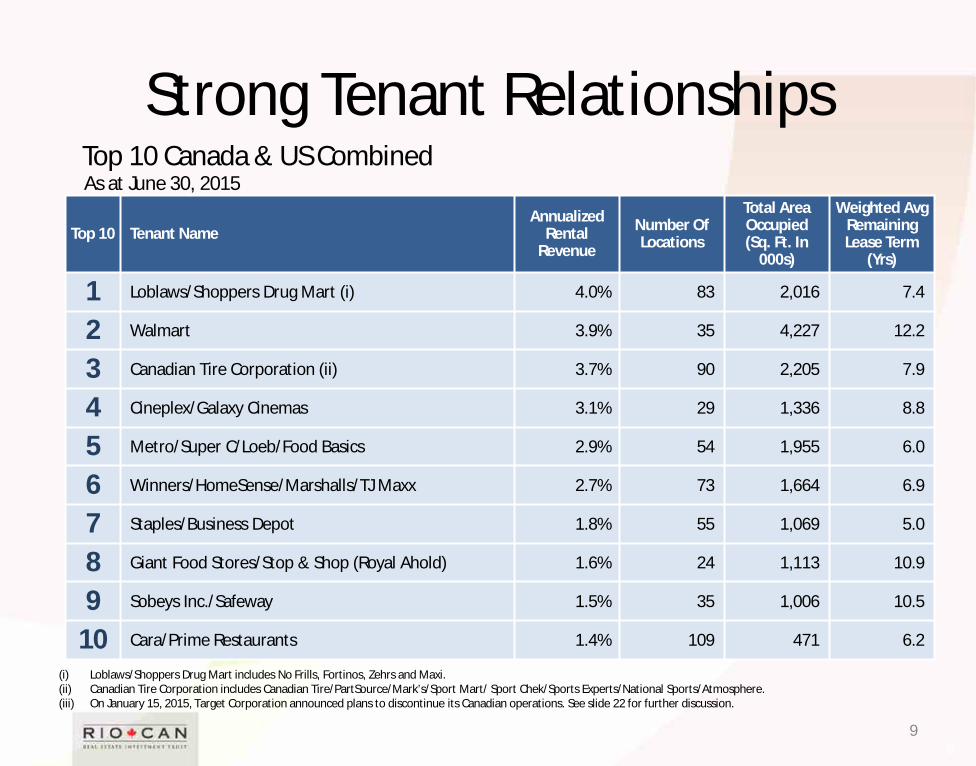
Strong Tenant Relationships
9
Top 10 Canada & US Combined
Top 10 Tenant Name Annualized
Rental Revenue
Number Of Locations
Total Area Occupied (Sq. Ft. In
000s)
Weighted Avg Remaining Lease Term
(Yrs)
1 Loblaws/Shoppers Drug Mart (i) 4.0% 83 2,016 7.4
2 Walmart 3.9% 35 4,227 12.2
3 Canadian Tire Corporation (ii) 3.7% 90 2,205 7.9
4 Cineplex/Galaxy Cinemas 3.1% 29 1,336 8.8
5 Metro/Super C/Loeb/Food Basics 2.9% 54 1,955 6.0
6 Winners/HomeSense/Marshalls/TJ Maxx 2.7% 73 1,664 6.9
7 Staples/Business Depot 1.8% 55 1,069 5.0
8 Giant Food Stores/Stop & Shop (Royal Ahold) 1.6% 24 1,113 10.9
9 Sobeys Inc./Safeway 1.5% 35 1,006 10.5
10 Cara/Prime Restaurants 1.4% 109 471 6.2
(i) Loblaws/Shoppers Drug Mart includes No Frills, Fortinos, Zehrs and Maxi. (ii) Canadian Tire Corporation includes Canadian Tire/PartSource/Mark’s/Sport Mart/ Sport Chek/Sports Experts/National Sports/Atmosphere. (iii) On January 15, 2015, Target Corporation announced plans to discontinue its Canadian operations. See slide 22 for further discussion.
As at June 30, 2015
9
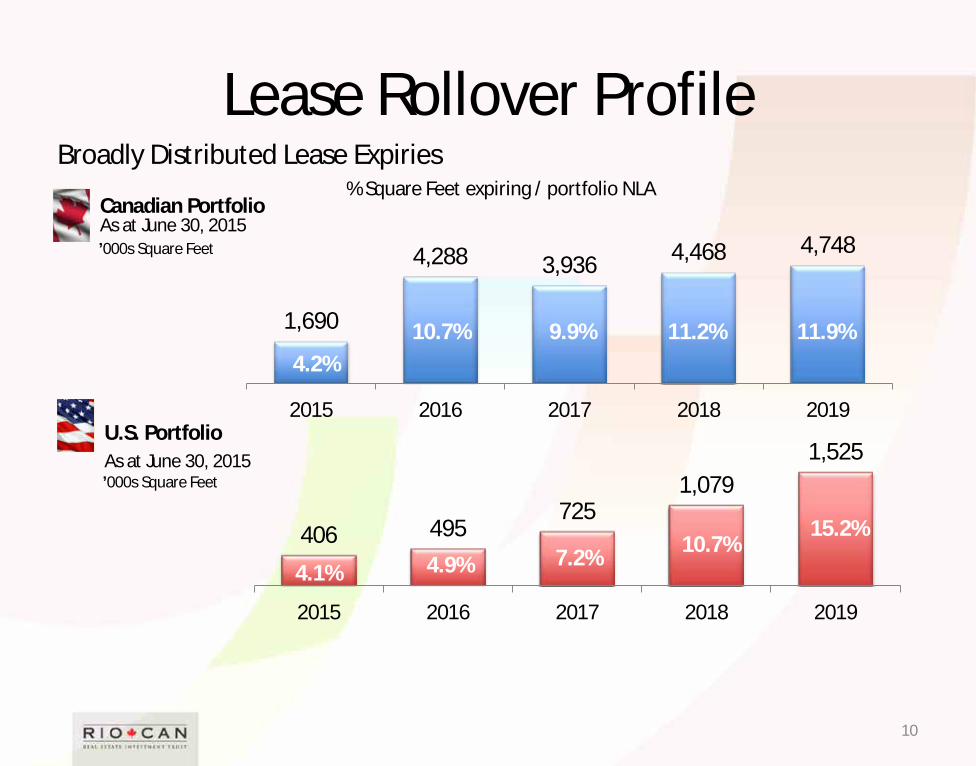
Lease Rollover Profile Broadly Distributed Lease Expiries
10
1,690
4,288 3,936 4,468 4,748
2015 2016 2017 2018 2019
406 495 725
1,079 1,525
2015 2016 2017 2018 2019
% Square Feet expiring / portfolio NLA Canadian Portfolio As at June 30, 2015
U.S. Portfolio As at June 30, 2015
’000s Square Feet
’000s Square Feet
4.2% 10.7% 9.9% 11.2% 11.9%
4.9% 7.2% 10.7% 15.2%
4.1%

Occupancy since 1996 Historical Committed Occupancy Rates 1996 to Q2 2015
96.9% 95.0% 95.0% 95.4% 96.1% 95.6% 95.8% 96.3% 96.3% 97.1% 97.7% 97.6% 96.9% 97.4% 97.4% 97.6% 97.4% 96.9% 97.0%
93.9%
1996 1997 1998 1999 2000 2001 2002 2003 2004 2005 2006 2007 2008 2009 2010 2011 2012 2013 2014 Q22015*
11
* RioCan’s committed occupancy rate as at June 30, 2015 reflects the 18 disclaimed leases by Target Canada in properties owned by RioCan.
Corporate Developments • RioCan announced with its second quarter results that the Trust has engaged
advisors to conduct a strategic review of its U.S. Operations
• RioCan began acquiring assets in the U.S. in the fourth quarter of 2009 and since has seen strong gains in the value of the portfolio from cap rate compression and appreciation of the U.S. dollar
• With an abundance of capital and greater number of investors it has become increasingly difficult to continue to grow through acquisition and the Trust does not have the infrastructure to support development activities in the U.S.
• Review is in early stages and will consider a wide range of options, which include but are not limited to:
– Status quo – continue to operate the U.S. Portfolio – Sale of some or all of the Trust’s U.S. Assets – Other strategic joint venture alternatives
• Expectation is to update the market in late 2015, early 2016
12 This slide contains references to non-GAAP Measures. For a definition of such measures please refer to RioCan’s June 30, 2015 MD&A.

Property Portfolio – U.S. High quality assets with a focus towards grocery anchored centres
13
Riverpark, Houston Alamo Ranch, San Antonio
Stop N Shop Plaza, Bridgeport, CT
Town Square Plaza, Reading, PA
Shaw’s Plaza, Raynham, MA
Loyal Plaza, Williamsport, PA
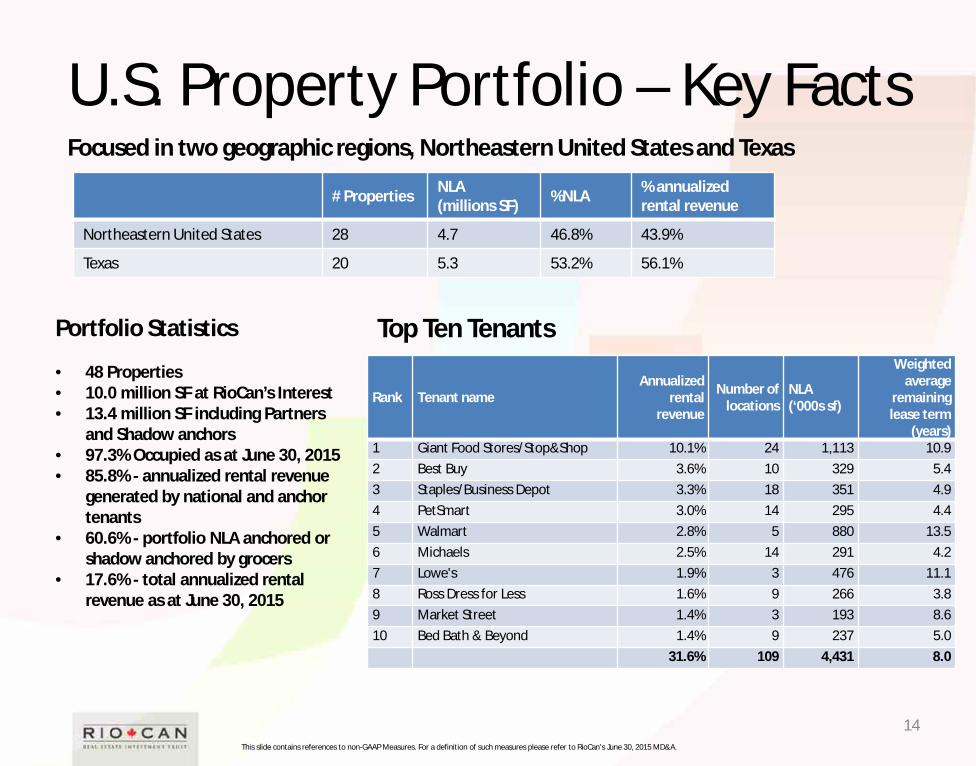
U.S. Property Portfolio – Key Facts Focused in two geographic regions, Northeastern United States and Texas
14 This slide contains references to non-GAAP Measures. For a definition of such measures please refer to RioCan’s June 30, 2015 MD&A.
# Properties NLA (millions SF) %NLA % annualized
rental revenue
Northeastern United States 28 4.7 46.8% 43.9%
Texas 20 5.3 53.2% 56.1%
Rank Tenant name Annualized
rental revenue
Number of locations
NLA (‘000s sf)
Weighted average
remaining lease term
(years) 1 Giant Food Stores/Stop&Shop 10.1% 24 1,113 10.9 2 Best Buy 3.6% 10 329 5.4 3 Staples/Business Depot 3.3% 18 351 4.9 4 PetSmart 3.0% 14 295 4.4 5 Walmart 2.8% 5 880 13.5 6 Michaels 2.5% 14 291 4.2 7 Lowe's 1.9% 3 476 11.1 8 Ross Dress for Less 1.6% 9 266 3.8 9 Market Street 1.4% 3 193 8.6 10 Bed Bath & Beyond 1.4% 9 237 5.0 31.6% 109 4,431 8.0
Portfolio Statistics • 48 Properties • 10.0 million SF at RioCan’s Interest • 13.4 million SF including Partners
and Shadow anchors • 97.3% Occupied as at June 30, 2015 • 85.8% - annualized rental revenue
generated by national and anchor tenants
• 60.6% - portfolio NLA anchored or shadow anchored by grocers
• 17.6% - total annualized rental revenue as at June 30, 2015
Top Ten Tenants
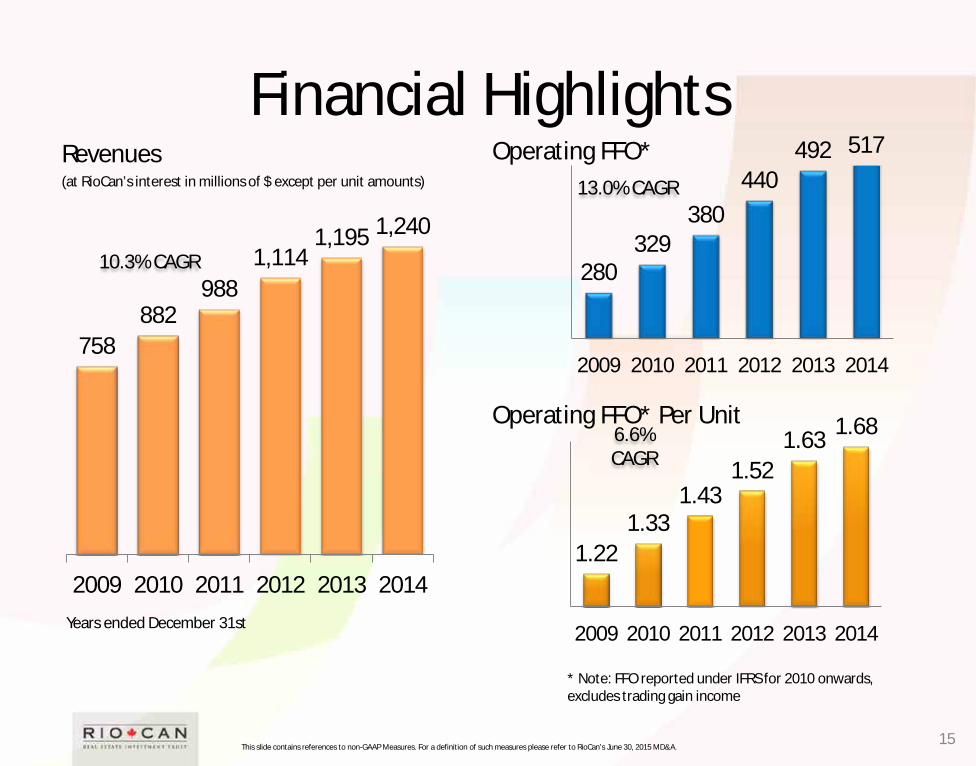
Financial Highlights (at RioCan’s interest in millions of $ except per unit amounts)
Revenues
758 882
988 1,114
1,195 1,240
2009 2010 2011 2012 2013 2014
Operating FFO*
280 329
380 440
492
2009 2010 2011 2012 2013 2014
517
Operating FFO* Per Unit
1.22 1.33
1.43 1.52
1.63 1.68
2009 2010 2011 2012 2013 2014
15
Years ended December 31st
* Note: FFO reported under IFRS for 2010 onwards, excludes trading gain income
13.0% CAGR
6.6% CAGR
10.3% CAGR
This slide contains references to non-GAAP Measures. For a definition of such measures please refer to RioCan’s June 30, 2015 MD&A.
Q2 Financial Highlights • RioCan's Operating Funds From Operations ("Operating FFO") for the three months ended
June 30, 2015 ("Second Quarter") was $136 million or $0.43 per Unit compared to $127 million or $0.42 per Unit for the second quarter in 2014, representing an increase of $8.8 million or 6.9%. On a per Unit basis, Operating FFO increased by $0.01 per Unit or 2.4%;
• RioCan's Operating FFO increased 7.9% to $274 million for the six months ended June 30, 2015 compared to $254 million for the same period in 2014. On a per unit basis, Operating FFO increased by $0.03 or 3.6% to $0.86 compared to $0.83 for 2014;
• RioCan's development pipeline achieved a number of milestones this past quarter. RioCan and its partners received an Official Plan Amendment from The City of Toronto on The Well, zoning approval for the redevelopment proposal at RioCan Yonge Sheppard Centre, and subsequent to the quarter end received zoning approval at its development project at King Street & Portland Street; and
• Subsequent to the quarter end, RioCan and Hudson's Bay Company ("HBC") completed the first tranche in a strategic joint venture focused on retail real estate growth opportunities in Canada. The joint venture will enable RioCan and HBC to build on the strength of existing real estate assets through potential future redevelopment, as well as identify retail and enclosed mall acquisitions.
16 This slide contains references to non-GAAP Measures. For a definition of such measures please refer to RioCan’s June 30, 2015 MD&A.

Q2 Financial Highlights
$ per unit Payout Ratio $ per unit Payout Ratio
Quarter % Change Q2 2015 Q2 2014 Q2 2015 Q2 2014 % Change Six
Months 2015
Six Months
2014
Six Months
2015
Six Months
2014
Distribution 0.0% 0.3525 0.3525 n/a n/a 0.0% 0.705 0.705 n/a n/a
FFO 2.4% 0.42 0.41 83.9% 86.0% 3.7% 0.85 0.82 82.9% 86.0%
OFFO 2.4% 0.43 0.42 82.0% 83.9% 3.6% 0.86 0.83 82.0% 84.9%
AFFO 5.4% 0.39 0.37 90.4% 95.3% 4.0% 0.78 0.75 90.4% 94.0%
Canada United States
Q2 2015 Q2 2014 Q2 2015 Q2 2014
Same Store NOI Growth (1.4%) 2.0% 2.0% 1.4%
Same Property NOI Growth (1.1%) 1.7% 1.6% 1.4%
17 This slide contains references to non-GAAP Measures. For a definition of such measures please refer to RioCan’s June 30, 2015 MD&A.
($ millions) % Change Q2 2015 Q2 2014 % Change Six Months 2015 Six Months
2014 Revenue (at RioCan’s interest) 6.7% 325.1 304.8 7.4% 659.4 614.2
FFO 7.6% 134.7 125.2 4.8% 261.7 249.8
OFFO 6.9% 136.3 127.5 7.9% 274.3 254.3
AFFO 7.3% 122.9 114.5 7.5% 246.7 229.2

Financial Highlights (in millions)
Distributions to Unitholders
228 261 281 285 293 316 315 313
297 318 343 367 401
426 434 448
0.99 1.04 1.13 1.14 1.07 1.01 1.04 1.02 0.98
1.3275 1.36 1.38 1.38 1.38 1.38 1.41 1.41 1.41
2007 2008 2009 2010 2011 2012 2013 2014 Q22015
Rolling12
mos.
Distributions to Unitholders per Unit
18
Distributions to Unitholders net of DRIP Distributions per Unit net of DRIP

Organic Growth
19
Occupancy and Leasing Profile – Last eight quarters
2015 2014 2013
Second Quarter
First Quarter
Fourth Quarter
Third Quarter
Second Quarter
First Quarter
Fourth Quarter
Third Quarter
Committed occupancy 93.9% 96.7% 97.0% 97.0% 96.9% 96.8% 96.9% 97.0%
Economic occupancy 92.8% 95.5% 96.0% 96.0% 95.9% 95.7% 95.8% 95.5%
NLA leased but not paying rent (thousands of square feet) 544 623 512 488 520 519 542 716
Annualized rental impact (thousands) $16,763 $17,580 $15,696 $15,588 $15,336 $12,912 $14,004 $16,668
Retention rate – Canada 89.9% 90.0% 85.0% 91.7% 88.8% 91.2% 97.0% 91.1%
% increase in average net rent per sq ft –Canada 9.8% 9.8% 11.8% 12.9% 13.9% 7.0% 8.8% 11.2%
Retention rate – US 91.7% 64.3% 78.3% 92.2% 97.3% 86.4% 98.2% 98.4%
% increase in average net rent per sq ft – US 10.6% 8.3% 7.8% 9.3% 7.0% 8.3% 4.8% 3.8%
This slide contains references to non-GAAP Measures. For a definition of such measures please refer to RioCan’s June 30, 2015 MD&A.

Target’s Departure from Canada
• On January 15, 2015, Target Corporation (Target) announced plans to discontinue its Canadian operations through its indirect wholly-owned subsidiary, Target Canada, and that it was utilizing the Companies’ Creditors Arrangement Act (Canada) (“CCAA”) to wind down its operations.
• Pursuant to IFRS, effective July 1, 2015 RioCan is no longer recognizing rental revenue on the leases that were disclaimed by Target Canada.
• RioCan is actively in discussion with potential retailers to backfill the vacant premises.
• Unlikely to find a single user for most locations due to size and existing tenant restrictions at certain centres.
• Estimated 18 to 24 months to break-up the former Target spaces and a new tenant to commence paying rent in these reconfigured spaces taking into consideration lease negotiations, construction approvals, construction time and fitting out of such space.
• When complete re-tenanting should result in a more diversified revenue stream and potentially a better draw for consumers.
20

Target’s Departure from Canada
21
As at June 30, 2015, Target Canada had disclaimed 18 leases in properties owned by RioCan with annualized net rental revenue of approximately $11 million, estimated common area maintenance costs and taxes of $7.5 million and NLA of 1,602,000 square feet at an average lease rate of $6.67 per square foot (all figures at RioCan's interest). One of the disclaimed locations has reverted to Walmart Canada through a pre-existing covenant and Walmart Canada has presently assumed payment of the annual rent obligation. Subsequent to the quarter end, one additional lease was disclaimed by Target Canada representing approximately 61,000 square feet and annualized net rental revenue and estimated maintenance costs and taxes of $0.3 million at RioCan's interest
Site City Province
RioCan % ownership GLA (100%)
GLA (RioCan %)
Burlington Mall Burlington Ontario 50% 121,523 60,762 Charlottetown Mall Charlottetown PEI 50% 107,806 53,903 County Fair Mall Smiths Falls Ontario 100% 92,989 92,989 Desserte Ouest Laval Quebec 50% 116,147 58,074 Five Points Mall Oshawa Ontario 100% 102,444 102,444 Flamborough Power Centre Flamborough Ontario 100% 116,493 116,493 Gates of Fergus Fergus Ontario 50% 95,978 47,989 Lawrence Square Toronto Ontario 100% 89,432 89,432 Mill Woods Town Centre Edmonton Alberta 40% 122,804 49,539 Millcroft Shopping Centre Burlington Ontario 50% 115,566 57,783 Orillia Square Mall Orillia Ontario 100% 91,440 91,440 RioCan Durham Centre Ajax Ontario 100% 121,280 121,280 RioCan Niagara Falls Niagara Falls Ontario 100% 106,103 106,103 RioCan Scarborough Centre Scarborough Ontario 100% 116,241 116,241 Shopper's World Brampton Brampton Ontario 100% 121,490 121,490 South Hamilton Square Hamilton Ontario 100% 93,125 93,125 Stratford Centre Stratford Ontario 100% 88,935 88,935 The Stockyards Toronto Ontario 50% 153,456 76,728 Trinity Common Brampton Brampton Ontario 100% 118,228 118,228 TOTAL 2,091,480 1,662,978

Target’s Departure from Canada
22
Site City Province RioCan % ownership GLA (100%)
GLA (RioCan %)
Abbotsford Power Centre Abbotsford British Columbia 50% 115,407 57,704
RioCan Shoppes At Shawnessy Calgary Alberta 50% 124,216 62,108
RioCan St. Laurent Ottawa Ontario 50% 103,568 51,784
Shopper's World Danforth Toronto Ontario 50% 134,845 67,423
Signal Hill Centre Calgary Alberta 100% 116,288 116,288
Sudbury Place Sudbury Ontario 100% 109,554 109,554
Tillicum Centre Victoria British Columbia 50% 120,684 60,432
Total 824,562 525,293
Through the CCAA process eight Target leases have been assigned to Canadian Tire and Lowe’s.
The seven leases above that were not disclaimed have been assigned to new tenants (six to Lowes Canada, one to Canadian Tire) with annualized net rental revenue of $3.4 million at RioCan's interest and GLA of 525,000 square feet. The new tenants assumed all obligations including the rental obligations on the closing date of the respective assignments.

Conservative Debt Profile
• Debt-to-Total Assets of 44.5% at June 30, 2015. • Total operating lines $724 million, $572 available as at June 30, 2015 • Unencumbered pool has a fair value of $3.0 billion • Floating rate debt 8.2% of aggregate debt • Strong coverage ratios (based on rolling 12 months to June 30, 2015):
• EBITDA interest coverage of 3.0x • Debt service coverage of 2.3x and • Fixed charge coverage of 1.1x
23 * At RioCan’s interest This slide contains references to non-GAAP Measures. For a definition of such measures please refer to RioCan’s June 30, 2015 MD&A.

RioCan Capital Structure
32.3%
13.5% 1.8%
52.3%
0%
25%
50%
75%
100%
Book Value*Common Units - 319 million units outstanding, $8.6 billion market capitalizationPreferred Units - $232 million market capitalizationDebentures - $2.0 billionMortgages & Lines of Credit - $4.8 billion
24
30.7%
12.9% 1.5%
55.0%
0%
25%
50%
75%
100%
Market Value
Total Assets* – $15.2 Billion Total Enterprise Value* – $15.6 Billion
* At RioCan’s interest
This slide contains references to non-GAAP Measures. For a definition of such measures please refer to RioCan’s June 30, 2015 MD&A.

Conservative Debt Structure Growth in Asset vs Debt
25
In millions, at RioCan’s Interest. Debt
Assets
20082009
2010
2011
2012
2013
2014
Q2 2015
3,260
6,773
5,338
15,152
Debt
Assets
CAGR – 17.4%
CAGR – 11.9%
This slide contains references to non-GAAP Measures. For a definition of such measures please refer to RioCan’s June 30, 2015 MD&A.

Modest Leverage, Strong Interest Coverage
• RioCan has consistently adhered to a conservative debt policy even through periods of considerable growth
• 60% max permitted under covenant • Interest coverage well in excess of the 1.65x maintenance covenant
47.3% 48.2% 51.9% 53.1% 53.8% 53.9% 56.6% 56.3% 54.9% 55.6% 49.1% 46.4% 43.6% 44.0% 43.8% 44.5%
2.9x 2.9x 2.6x 2.6x 2.7x 2.8x 2.9x
2.7x 2.6x 2.2x
2.5x 2.5x 2.7x 2.8x 2.9x 3.0x
2000 2001 2002 2003 2004 2005 2006 2007 2008 2009 2010 2011 2012 2013 2014 Q2 2015
Leverage Interest Coverage
26
* At RioCan’s interest
This slide contains references to non-GAAP Measures. For a definition of such measures please refer to RioCan’s June 30, 2015 MD&A.

Debt Maturity Schedule
27
• Long-term, staggered debt maturity profile. • RioCan has successfully lowered overall borrowing costs and extended the weighted average term to maturity on
its debt since Dec. 31, 2014. The weighted average interest rate at June 30, 2015 was 3.94% with a 4.13 year weighted avg. term to maturity at RioCan’s interest as compared to 4.12% and 3.95 years at Dec. 31, 2014.
• Low floating rate debt exposure (8.2% of total debt) at RioCan’s interest.
3.48%
4.36%
3.63% 3.55% 3.70% 4.22%
0.0%
1.0%
2.0%
3.0%
4.0%
5.0%
6.0%
0
500
1,000
1,500
2,000
2,500
3,000
2015 2016 2017 2018 2019 Thereafter
Scheduled principal amortization Mortgages payable
Floating Rate Mortgages and Lines of Credit Debentures payable
Weighted average interest rate
$ Millions
Weighted Avg. Interest Rate on M
aturing Debt
532 704
1,123 889
791
2,723

28
Leverage and Coverage Ratios & Targets
Rolling 12 Months Ended
At RioCan’s interest
June 30/15
Dec. 31/14
Interest coverage ratio 3.00x 2.89x
Debt service coverage ratio 2.30x 2.20x
Fixed charge coverage ratio 1.10x 1.08x
Net operating debt to operating EBITDA ratio 7.77x 7.67x
Distributions as a percentage of AFFO 94.5% 94.5%
Unencumbered Assets to Unsecured Debt 149% 149%
This slide contains references to non-GAAP Measures. For a definition of such measures please refer to RioCan’s June 30, 2015 MD&A.
Targeted Ratios
>3.00X
>2.25X
>1.10X
<6.50X
<90%
>200%
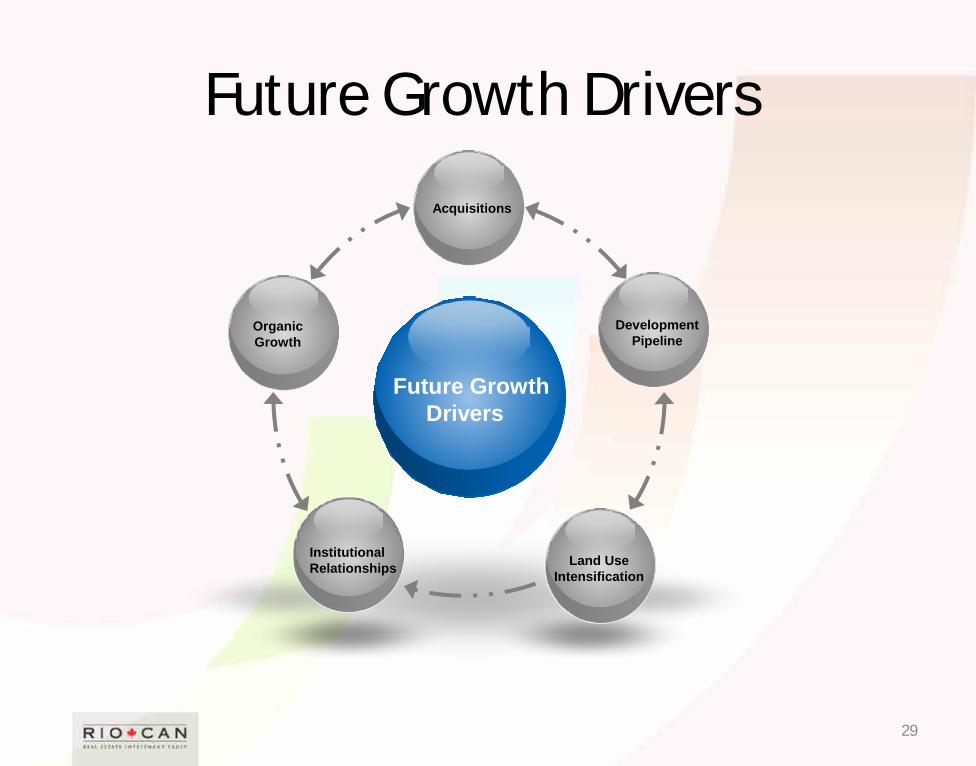
Future Growth Drivers
29
Future Growth Drivers
Institutional Relationships
Organic Growth
Acquisitions
Development Pipeline
Land Use Intensification

Organic Growth Canadian Portfolio
30
Lease Expiries
(thousands except psf and % amounts) Portfolio NLA 2015 remaining 2016 2017 2018 2019
Total 39,926 1,690 4,288 3,936 4,468 4,748
Square Feet expiring/portfolio NLA 4.2% 10.7% 9.9% 11.2% 11.9%
Total average net rent psf $17.02 $18.23 $17.72 $18.70 $17.94 $18.08
Ability to add growth through rental renewals with 48% of leases renewing over next five years. • In Q2 2015 achieved renewal rent increases of 9.8% or $1.61 psf with an average renewal rate of $18.07 psf. YTD achieved renewal rent increases of 9.8% or
$1.66 psf with an average renewal rate of $18.60 psf. • Retention rate of 89.9% in Q2 2015 (89.8% YTD).
$10
$11
$12
$13
$14
$15
$16
$17
$18
$19
$20
0
500
1,000
1,500
2,000
2,500
3,000
3,500
4,000
4,500
5,000
2008 2009 2010 2011 2012 2013 2014 2015 2016 2017 2018 2019
Rent
PSF
Squa
re fe
et ('
000s
)
RioCan Lease Maturity Schedule and Renewal History
Square feet expiring (left axis) Square feet renewed (left axis) Achieved Renewal Rent PSF Expired Rent PSF Expiring Rent PSF

Organic Growth U.S. Portfolio
31
Lease Expiries
(thousands except % amounts) Portfolio NLA 2015 remaining 2016 2017 2018 2019
Total 10,038 406 495 725 1,079 1,525
Square Feet expiring/portfolio NLA 4.1% 4.9% 7.2% 10.7% 15.2%
0%
20%
40%
60%
80%
100%
2014 2015 2016 2017 2018
Leases Expiring Total Portfolio Cumulative
Square Feet expiring/portfolio NLA
Ability to add growth through rental renewals and leasing of vacant space. • 42% of US Leases will expire over the next five years creating the potential for organic rental growth in the US portfolio • In Q2 2015, achieved renewal rent increases of 10.6% or $2.18 psf with an average renewal rental rate of $22.72 psf. YTD RioCan
achieved renewal rent increases of 9.7% or $1.94 psf with an average renewal rental rate of $21.97 psf • Achieved same store rent growth of 2.0% in Q2 2015
Organic Growth
32
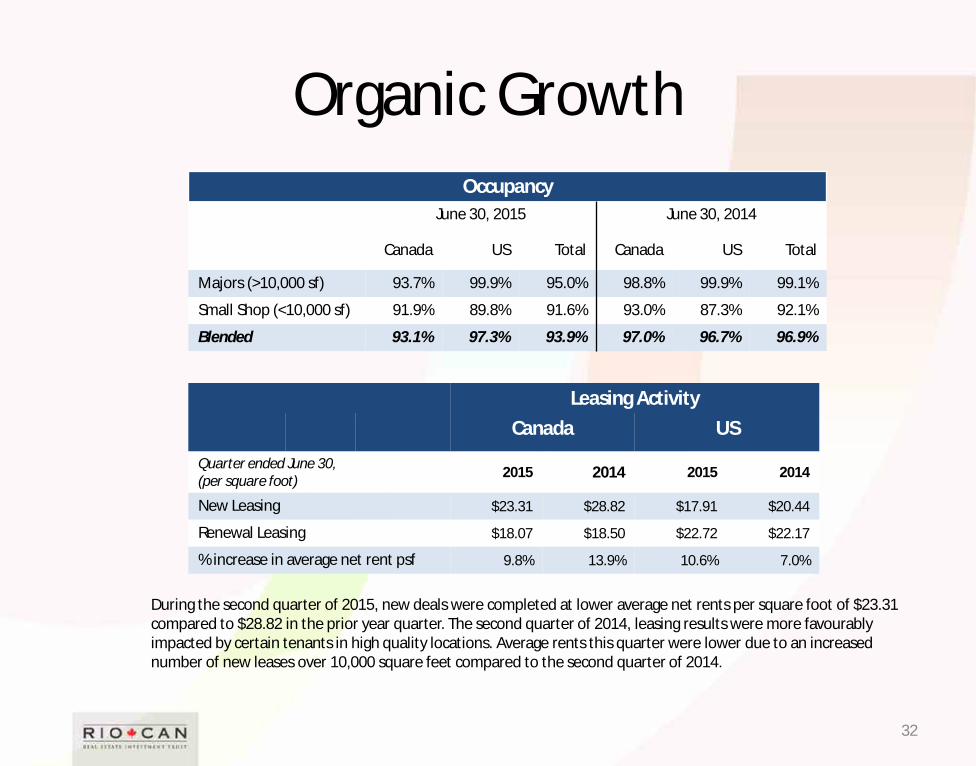
Occupancy June 30, 2015 June 30, 2014
Canada US Total Canada US Total
Majors (>10,000 sf) 93.7% 99.9% 95.0% 98.8% 99.9% 99.1%
Small Shop (<10,000 sf) 91.9% 89.8% 91.6% 93.0% 87.3% 92.1%
Blended 93.1% 97.3% 93.9% 97.0% 96.7% 96.9%
Leasing Activity Canada US
Quarter ended June 30, (per square foot) 2015 2014 2015 2014
New Leasing $23.31 $28.82 $17.91 $20.44
Renewal Leasing $18.07 $18.50 $22.72 $22.17
% increase in average net rent psf 9.8% 13.9% 10.6% 7.0%
During the second quarter of 2015, new deals were completed at lower average net rents per square foot of $23.31 compared to $28.82 in the prior year quarter. The second quarter of 2014, leasing results were more favourably impacted by certain tenants in high quality locations. Average rents this quarter were lower due to an increased number of new leases over 10,000 square feet compared to the second quarter of 2014.
Joint Venture Agreement with Hudson’s Bay Company
33
• On February 25, 2015, RioCan announced that it has agreed to form a joint venture (“JV Entity”) focused on real estate growth opportunities in Canada with Hudson’s Bay Company (“HBC”).
• The joint venture will enable RioCan and HBC to build on the strength of existing real estate assets through potential future redevelopment, as well as identify new real estate acquisition and redevelopment opportunities.
• The transaction is structured to facilitate an IPO or other monetization of the joint venture at a yet to be determined future date.
• On July 9, 2015, the parties completed the first tranche of the joint venture: • RioCan contributed a 50% interest in two mall properties in Ontario (Oakville Place and Georgian Mall), resulting
in an initial equity stake of $147 million or 13.4% in the joint venture entity. HBC contributed 7 owned or ground-leased properties (including Hudson's Bay flagship properties in downtown Vancouver, Calgary, Ottawa, and Montreal) with approximately 2.6 million square feet.
• RioCan has committed to contribute a total of $325 million to the JV for an eventual pro forma equity stake of approximately 25% based on the first tranche closing to be made by the third anniversary of the closing date..
• The balance of RioCan’s contributions will consist of $53 million in tenant allowances, and $125 million in cash to be used to fund future property acquisitions to increase the value and diversify the tenant base of the JV.
33

Extracting Value by Recycling Capital • RioCan continues to evaluate its portfolio in order to selectively dispose of assets as a means of recycling
capital, and also to increase the portfolio weighting to the six major markets in Canada. • Since the start of 2013 to June 30, 2015, the Trust disposed of $789 million of properties in Canada. • These asset sales will further enhance RioCan’s strategy to shift the portfolio’s geographic allocation away
from low growth markets to Canada’s high population, high growth markets;
– RioCan’s concentration in Canada’s six high growth markets is now 74.4% (Year end 2004 57.7%) – Capital from asset sales redeployed into acquisitions and development activities. – Markets with highest population growth will outperform smaller markets with little growth or negative population
statistics.
34
RioCan’s plan to recycle capital into higher growth assets will provide for enhanced returns to unitholders and a reduced need for access to public equity markets to raise capital.
2004 2005 2006 2007 2008 2009 2010 2011 2012 2013 2014 Q22015
57.7%
74.4%

Development Activity - Current Portfolio
35
Alberta 17%
Suburban GTA 27%
Toronto 49%
Other Ontario 7%
Development Portfolio by Geographic Diversification
(thousands of square feet) NLA - 100% NLA - RioCan%
Greenfield Development 2,872 1,833
Urban Intensification 4,223 2,142
Sub-total 7,095 3,975
Expansion & Redevelopment 1,664 1,123
Total 8,759 5,098
(thousands of dollars) 2015 remainder 2016 2017+ Future
Development Total
Greenfield Development 21,819 22,446 8,758 221,894 274,917
Urban Intensification 19,941 76,080 122,493 779,218 997,732
Expansion & Redevelopment 40,492 126,201 114,320 — 281,013
Total Construction Expenditures Funded by RioCan (i) 82,252 224,727 245,571 1,001,112 1,553,662
Mezzanine Funding Obligation (ii) 73 149 — (2,111) (1,889)
Total RioCan Funding Requirements 82,325 224,876 245,571 999,001 1,551,773
(i) Includes project costs funded by RioCan construction lines. (ii) Credits reflect proceeds from potential land parcel sale.

Toronto Development Projects and Recent Completions
Key Development Projects Eglinton & Warden (completed) The Stockyards (completed) 1860 Bayview Ave Bathurst & College Yonge & Eglinton Northeast Corner College and Manning Dupont Street The Well King & Portland
Properties not mapped: Westney Road and Taunton, RioCan Centre Vaughan, Windfield Farms
36

Calgary Development Projects Greenfield Developments
East Hills Sage Hill
Urban Intensification Calgary East village (CPA Lands)
37

Ottawa Development Projects and Recent Completions
Key Development Projects Grant Crossing (completed) Herongate Mall (completed) Tanger Outlets – Kanata (Phase I completed)
38

Land Use Intensification – Residential Potential Transit Oriented Development
• RioCan’s Urban Platform holds a number of sites where the possibility for additional density through residential exist: – Properties with the greatest potential for residential intensification are located on or near transit lines
• Capitalize on trend in Canada’s six high growth markets towards “densifying” existing urban locations, driven by: – Prohibitive costs of expanding infrastructure beyond urban boundaries – Maximizing use of mass transit – Generate higher yields as land is already owned
• RioCan has a number of potential sites located in other major markets such as, Tillicum Centre in Victoria, BC and Brentwood Village Mall in Calgary Alberta
39
Toronto
Development Activities - Residential Intensification Investment Rationale
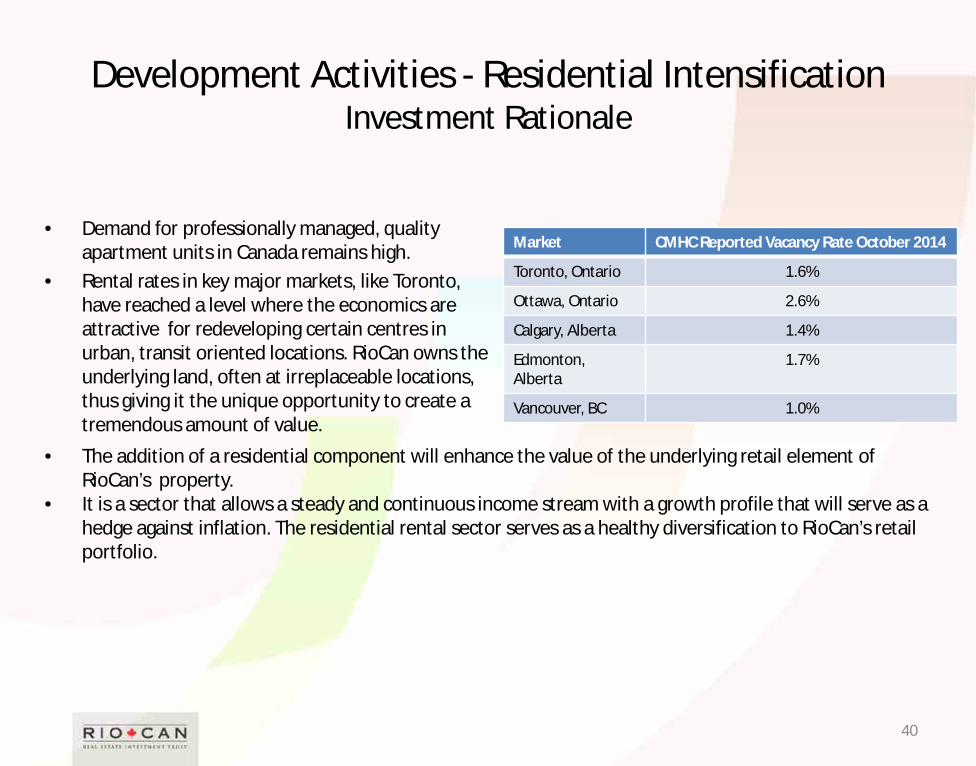
• Demand for professionally managed, quality apartment units in Canada remains high.
• Rental rates in key major markets, like Toronto, have reached a level where the economics are attractive for redeveloping certain centres in urban, transit oriented locations. RioCan owns the underlying land, often at irreplaceable locations, thus giving it the unique opportunity to create a tremendous amount of value.
Market CMHC Reported Vacancy Rate October 2014
Toronto, Ontario 1.6%
Ottawa, Ontario 2.6%
Calgary, Alberta 1.4%
Edmonton, Alberta
1.7%
Vancouver, BC 1.0%
• The addition of a residential component will enhance the value of the underlying retail element of RioCan’s property.
• It is a sector that allows a steady and continuous income stream with a growth profile that will serve as a hedge against inflation. The residential rental sector serves as a healthy diversification to RioCan’s retail portfolio.
40

Favourable demographic trends
• Demand for rental residential spaces has strengthened as home prices have increased dramatically. Average price of a detached home in Toronto now exceeds $1 million
Land Use Intensification – Residential Potential Transit Oriented Development
17% 14%
4%
16%
1991-2006 2006-2011 1991-2006 2006-2011
Gro
wth
%
Population Growth Rates Suburban GTA Downtown Toronto
41

Land Use Intensification – Residential Potential Greater Toronto Area Case Study
42
N
12 1. 2955 Bloor Street 2. 740 Dupont Ave 3. College & Manning 4. 491 College Street 5. Dufferin Plaza 6. King & Portland 7. Lawrence Square 8. Markington Square 9. Queensway Cineplex 10. RioCan Hall 11. RioCan Leaside 12. RioCan Marketplace 13. RioCan Scarborough 14. Yonge Sheppard Centre 15. Sunnybrook Plaza 16. The Well 17. Northeast Yonge & Eglinton Properties where zoning applications have been filed.
Favourable barriers to entry: – Land is already owned aiding overall project yields – Intensification replaces old stock with dynamic retail. High demand space that attracts the
highest class of tenants and attracts the highest rents

Land Use Intensification – Residential Potential Greater Toronto Area Case Study
43

Land Use Intensification – Residential Potential
• RioCan’s Residential development plans include amenities that meet or exceed offerings in current condominium developments providing a competitive advantage over that of existing residential stock.
• Given the extent of this initiative, RioCan will possess a scale that will result in numerous efficiencies going forward. Residential rental properties will typically attract favourable financing terms based on the availability of CMHC insurance.
• RioCan is committed to ensuring that the individual properties in its portfolio are utilized to their highest and best use. RioCan has focused on mixed use projects containing predominantly multi-residential rental buildings. RioCan has identified 47 properties that it deems to be strong intensification opportunities all located in Canada’s six major markets.
44
Development Activities Residential Intensification
Potential GLA (square feet at 100%)
Property Location
Application Submission
Date RioCan Ownership %
(Partner) Commercial Residential Rental (i) Condominium Total
Residential Rental Units
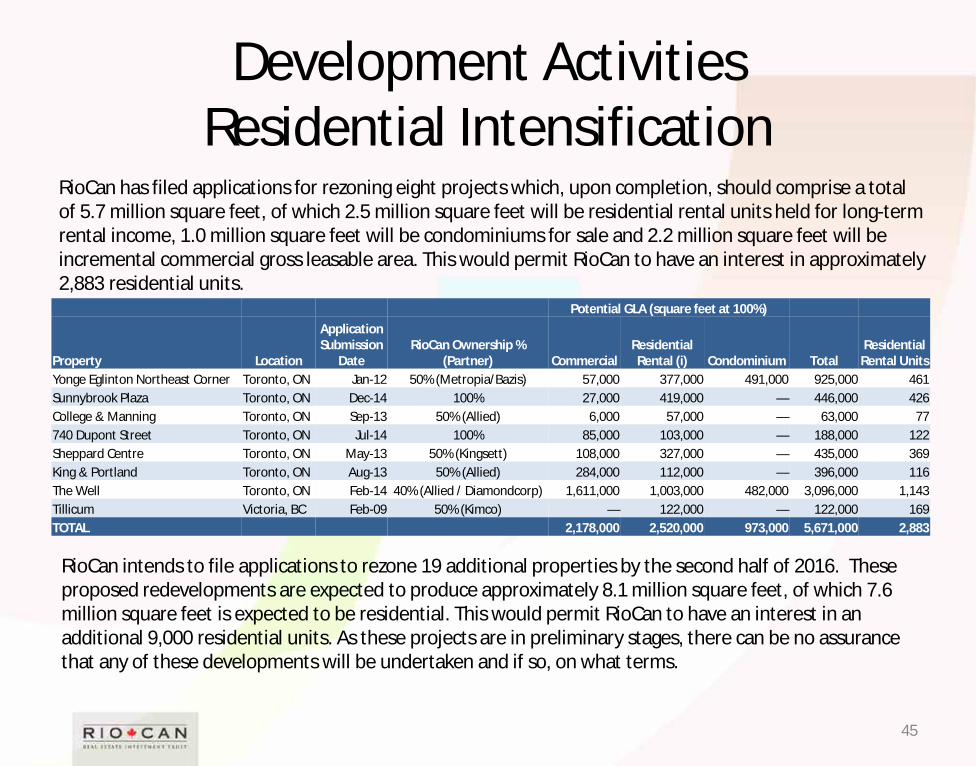
Yonge Eglinton Northeast Corner Toronto, ON Jan-12 50% (Metropia/Bazis) 57,000 377,000 491,000 925,000 461 Sunnybrook Plaza Toronto, ON Dec-14 100% 27,000 419,000 — 446,000 426 College & Manning Toronto, ON Sep-13 50% (Allied) 6,000 57,000 — 63,000 77 740 Dupont Street Toronto, ON Jul-14 100% 85,000 103,000 — 188,000 122 Sheppard Centre Toronto, ON May-13 50% (Kingsett) 108,000 327,000 — 435,000 369 King & Portland Toronto, ON Aug-13 50% (Allied) 284,000 112,000 — 396,000 116 The Well Toronto, ON Feb-14 40% (Allied / Diamondcorp) 1,611,000 1,003,000 482,000 3,096,000 1,143 Tillicum Victoria, BC Feb-09 50% (Kimco) — 122,000 — 122,000 169 TOTAL 2,178,000 2,520,000 973,000 5,671,000 2,883
RioCan has filed applications for rezoning eight projects which, upon completion, should comprise a total of 5.7 million square feet, of which 2.5 million square feet will be residential rental units held for long-term rental income, 1.0 million square feet will be condominiums for sale and 2.2 million square feet will be incremental commercial gross leasable area. This would permit RioCan to have an interest in approximately 2,883 residential units.
RioCan intends to file applications to rezone 19 additional properties by the second half of 2016. These proposed redevelopments are expected to produce approximately 8.1 million square feet, of which 7.6 million square feet is expected to be residential. This would permit RioCan to have an interest in an additional 9,000 residential units. As these projects are in preliminary stages, there can be no assurance that any of these developments will be undertaken and if so, on what terms.
45

46
Location: Toronto, Ontario
Intersection: Yonge & Eglinton
Total Proposed Retail GLA: 57,000 square feet*
Proposed Rental Residential Units: 461 Units
Design Concept: Urban Retail
Anticipated Completion: 2018
RioCan Interest 50%
Yonge & Eglinton Northeast Corner - Toronto, Ontario
• Located across the street from RioCan’s head office
• 1.1 acre site has been approved for redevelopment by the city of Toronto with a 58 storey tower at corner of Yonge and Eglinton and a 36 storey tower fronting Roehampton Avenue (first street north of Eglinton).
• Condominium portion of the project is 100% pre-sold.
• North tower to be developed as rental residential. Current plans are for a 461 unit residential apartment building.
• Construction commenced in Q2 2014.
* RioCan will purchase 100% of the retail space at a 7% capitalization rate upon completion of the project.
Investing for the Future Creating New Cash Flow Sources
Residential Intensification
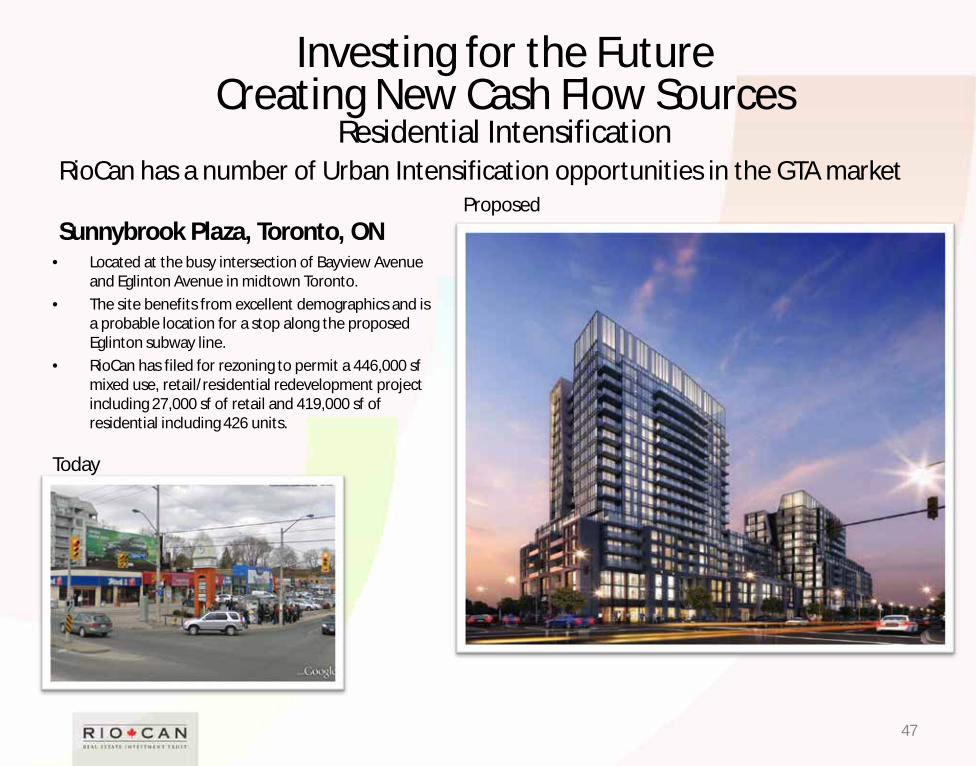
• Located at the busy intersection of Bayview Avenue and Eglinton Avenue in midtown Toronto.
• The site benefits from excellent demographics and is a probable location for a stop along the proposed Eglinton subway line.
• RioCan has filed for rezoning to permit a 446,000 sf mixed use, retail/residential redevelopment project including 27,000 sf of retail and 419,000 sf of residential including 426 units.
47
RioCan has a number of Urban Intensification opportunities in the GTA market
Sunnybrook Plaza, Toronto, ON
Today
Proposed
Investing for the Future Creating New Cash Flow Sources
Residential Intensification
48
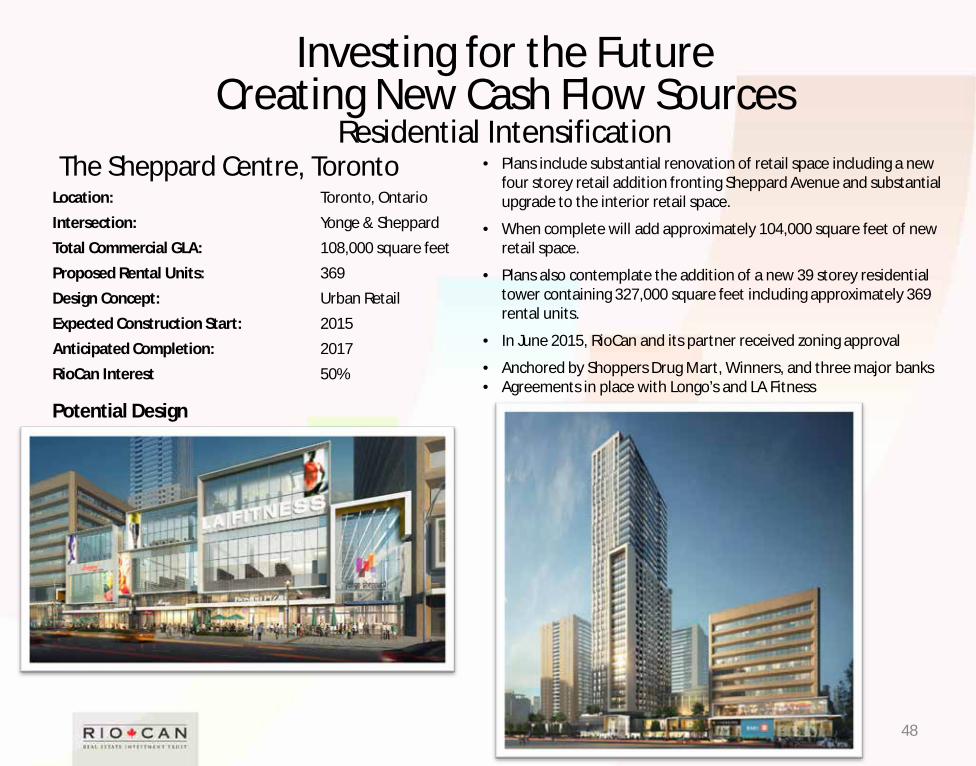
The Sheppard Centre, Toronto Location: Toronto, Ontario Intersection: Yonge & Sheppard Total Commercial GLA: 108,000 square feet Proposed Rental Units: 369 Design Concept: Urban Retail Expected Construction Start: 2015 Anticipated Completion: 2017 RioCan Interest 50%
• Plans include substantial renovation of retail space including a new four storey retail addition fronting Sheppard Avenue and substantial upgrade to the interior retail space.
• When complete will add approximately 104,000 square feet of new retail space.
• Plans also contemplate the addition of a new 39 storey residential tower containing 327,000 square feet including approximately 369 rental units.
• In June 2015, RioCan and its partner received zoning approval
• Anchored by Shoppers Drug Mart, Winners, and three major banks • Agreements in place with Longo’s and LA Fitness
Potential Design
Investing for the Future Creating New Cash Flow Sources
Residential Intensification

Development Pipeline
49
• RioCan, Allied Properties and Diamond Corp entered into a joint venture arrangement to acquire the Globe and Mail site in downtown The site is approximately 7.7 acres.
• During the quarter, RioCan and its partners received an Official Plan Amendment from The City of Toronto for approximately 3.1 million square feet of Gross Floor Area.
• Project is expected to be approximately 3.1 million square feet of mixed use space including approximately 1.6 million sf of retail and office space and 1.5 million sf of residential space (1.0 million sf rental and 0.5 million sf as condominium space) that will be built out in phases.
• The joint venture is structured on a 40/40/20 basis between RioCan, Allied and Diamond. RioCan and Allied will act as joint development and construction managers. Upon completion of any projects RioCan will act as property manager for any retail portion of the property and Allied will act as property manager for any office portion.
RioCan, Allied Properties REIT, & Diamond Corporation Joint Venture

Development Pipeline
50
RioCan, Allied Properties REIT, & Diamond Corporation Joint Venture
THE WELL – Potential Layout and Vision
Current vision for the site includes a mixed use of office, retail and residential uses with inspiration drawn from other open air mixed retail properties in Europe.

Development Pipeline
51
• RioCan and Allied Properties announced in July 2012 that they had entered into a joint venture arrangement on a non exclusive basis to acquire sites in the urban areas of major Canadian cities that are suitable for mixed use intensification.
• The joint venture is structured on a 50/50 basis between RioCan and Allied. Upon completion of any projects RioCan will act as property manager for any retail portion of the property and Allied will act as property manager for any office portion.
• First two sites to be developed are: – King and Portland which will be developed into a mixed use
complex with approx. 396,000 square feet including 116 residential units in Toronto, Ontario. RioCan and its partner received zoning approval in July 2015 for this project.
– College and Manning will be developed into a mixed use complex with approx. 63,000 square feet. The site, which received zoning approval in the third quarter of 2014, will include 6,000 square feet of retail and 77 residential units in an eight-storey mixed-use building.
RioCan & Allied Properties REIT Joint Venture King & Portland
College and Manning
Development Pipeline
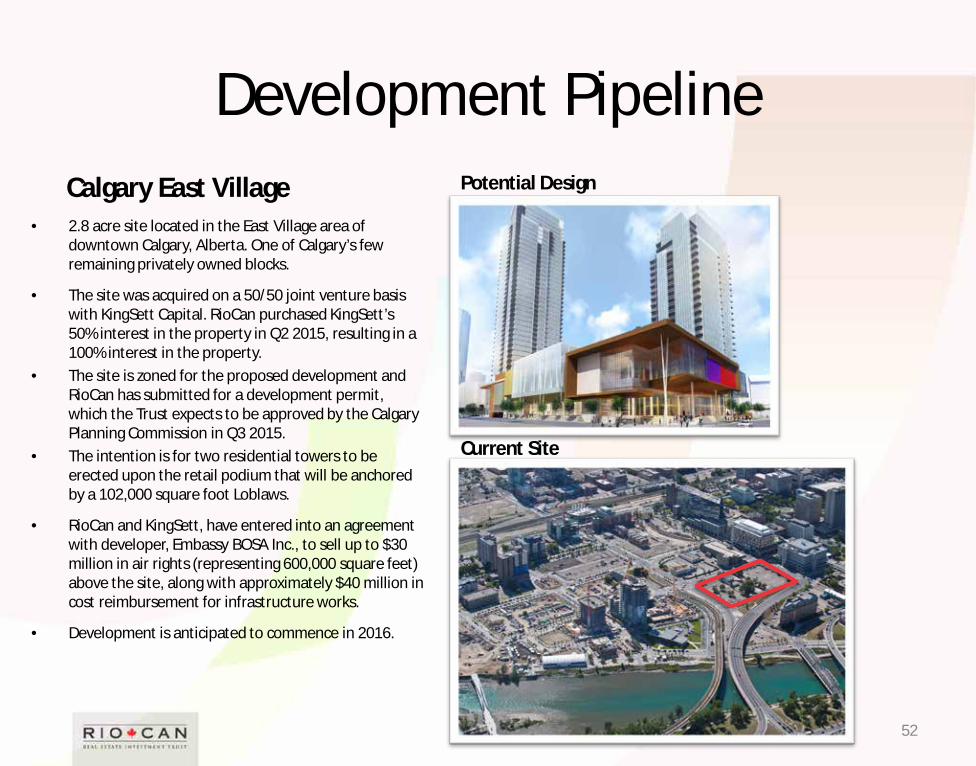
• 2.8 acre site located in the East Village area of downtown Calgary, Alberta. One of Calgary’s few remaining privately owned blocks.
• The site was acquired on a 50/50 joint venture basis with KingSett Capital. RioCan purchased KingSett’s 50% interest in the property in Q2 2015, resulting in a 100% interest in the property.
• The site is zoned for the proposed development and RioCan has submitted for a development permit, which the Trust expects to be approved by the Calgary Planning Commission in Q3 2015.
• The intention is for two residential towers to be erected upon the retail podium that will be anchored by a 102,000 square foot Loblaws.
• RioCan and KingSett, have entered into an agreement with developer, Embassy BOSA Inc., to sell up to $30 million in air rights (representing 600,000 square feet) above the site, along with approximately $40 million in cost reimbursement for infrastructure works.
• Development is anticipated to commence in 2016.
52
Calgary East Village Potential Design
Current Site

Development Pipeline Greenfield Development
53
Sage Hill, Calgary
• Sage Hill Crossing, a 32 acre greenfield development site in Northwest Calgary.
• RioCan owns the development on a 50/50 basis with KingSett Capital.
• Development commenced in 2013.
• Once completed, the anticipated gross leasable area is 394,000 square feet of retail use.
• The property is 80% preleased with Walmart and Loblaws slated to be the anchor tenants. Walmart commenced operations in January 2015.
• Other major tenants include, RBC, Scotiabank, McDonalds, Liquor Depot and London Drugs.
• Loblaws is slated to open in Q4 2015 with the remainder of the tenants opening over the course of 2016.
• RioCan is responsible for the development, management and leasing of the property.
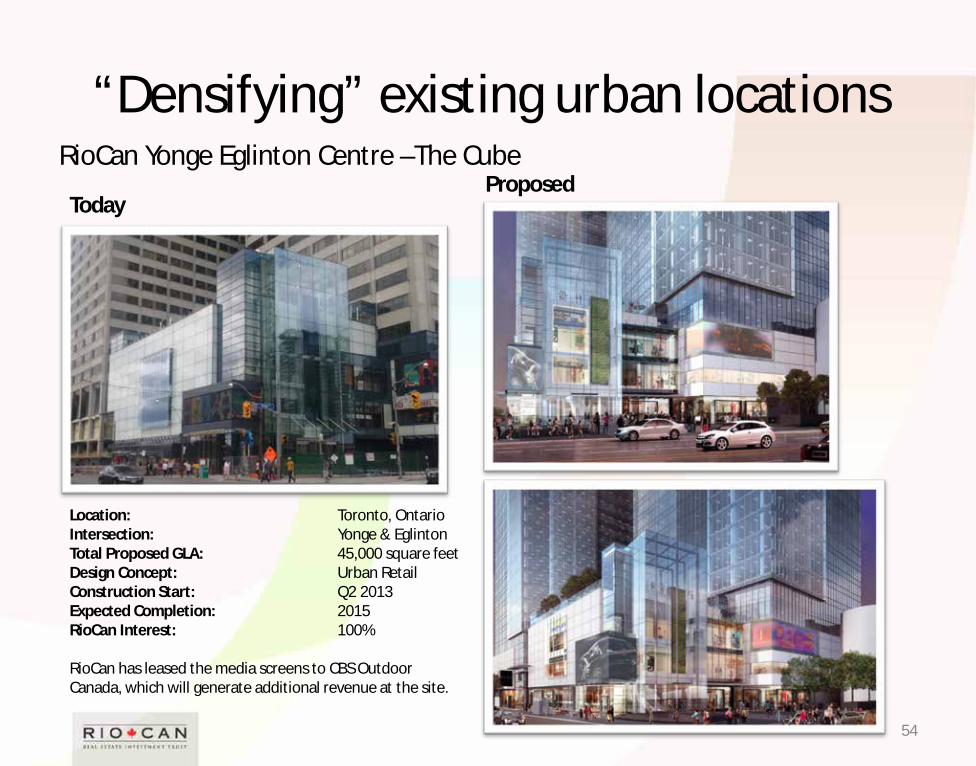
“Densifying” existing urban locations
54
RioCan Yonge Eglinton Centre –The Cube
Location: Toronto, Ontario Intersection: Yonge & Eglinton Total Proposed GLA: 45,000 square feet Design Concept: Urban Retail Construction Start: Q2 2013 Expected Completion: 2015 RioCan Interest: 100% RioCan has leased the media screens to CBS Outdoor Canada, which will generate additional revenue at the site.
Today Proposed

Urban Intensification
55
420 Bathurst Street, Toronto
Location: Toronto, Ontario
Intersection: Bathurst & College
Total Proposed GLA: 145,000 square feet
Design Concept: Urban Retail/Office
Anticipated Completion: 2017
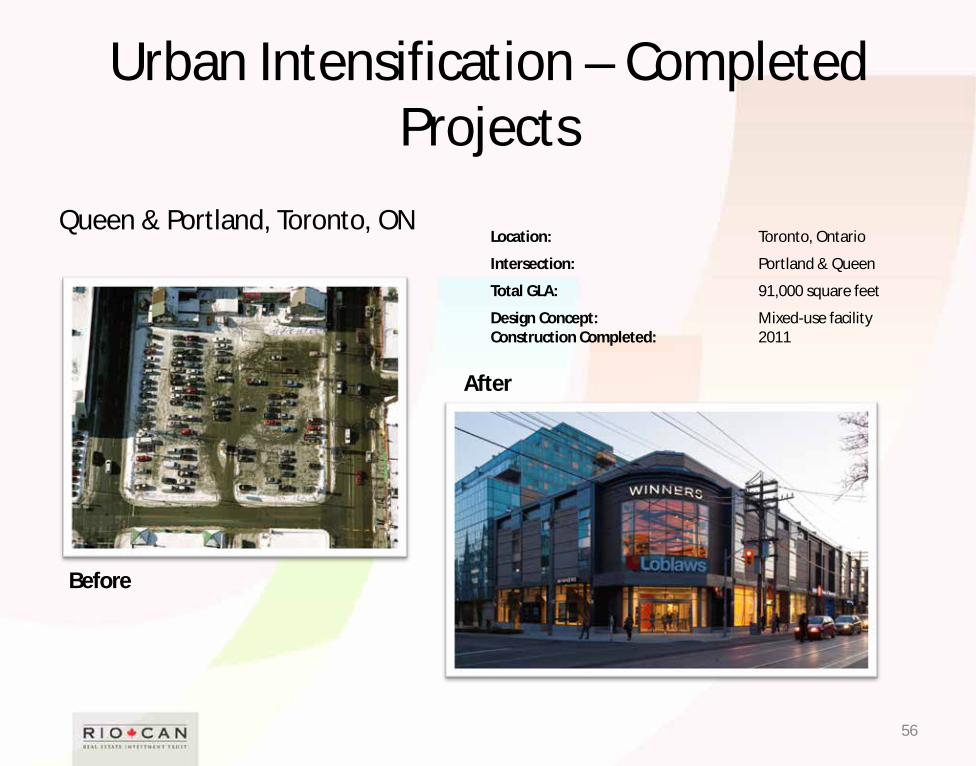
Urban Intensification – Completed Projects
56
Queen & Portland, Toronto, ON
Before
After
Location: Toronto, Ontario
Intersection: Portland & Queen
Total GLA: 91,000 square feet
Design Concept: Mixed-use facility Construction Completed: 2011
Urban Intensification – Completed Projects
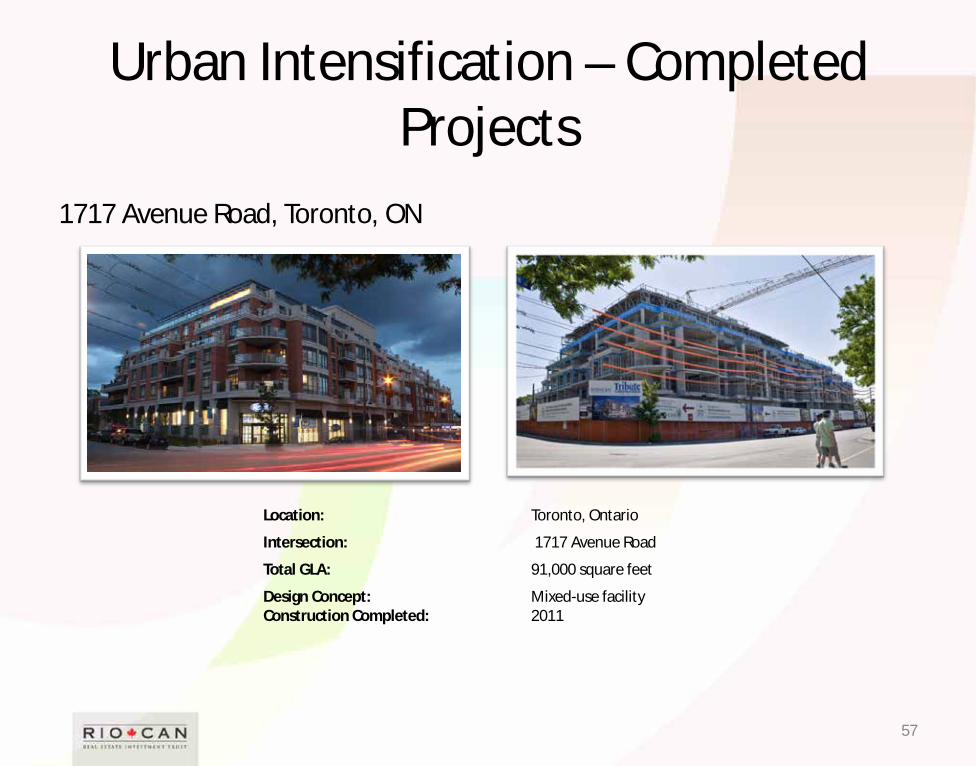
57
1717 Avenue Road, Toronto, ON
Location: Toronto, Ontario
Intersection: 1717 Avenue Road
Total GLA: 91,000 square feet
Design Concept: Mixed-use facility Construction Completed: 2011

• 52.5 acre site, approximately 20 kilometres west of Ottawa • Construction was completed on the initial phase comprising 299,000 square foot in Q4 2014. • The grand opening on October 17, 2014 was very well received with tenants reporting sales above expectations. • Saks Off Fifth, part of the phase two development on the site, is currently under construction and anticipates commencing operations in
the second quarter of 2016. The third phase featuring 51,000 square feet will commence construction in 2016.
58
Tanger Outlets - Kanata
Outlet Centre Development