Rights / License: Research Collection In Copyright - Non ... · Chapter 2 Definition of Concepts...
49
Research Collection Report Congestion management in liberalized electricity markets Theoretical concepts and international application Author(s): Krause, Thilo Publication Date: 2005 Permanent Link: https://doi.org/10.3929/ethz-a-005276613 Rights / License: In Copyright - Non-Commercial Use Permitted This page was generated automatically upon download from the ETH Zurich Research Collection . For more information please consult the Terms of use . ETH Library
Transcript of Rights / License: Research Collection In Copyright - Non ... · Chapter 2 Definition of Concepts...

Research Collection
Report
Congestion management in liberalized electricity marketsTheoretical concepts and international application
Author(s): Krause, Thilo
Publication Date: 2005
Permanent Link: https://doi.org/10.3929/ethz-a-005276613
Rights / License: In Copyright - Non-Commercial Use Permitted
This page was generated automatically upon download from the ETH Zurich Research Collection. For moreinformation please consult the Terms of use.
ETH Library

eeh power systemslaboratory
Thilo [email protected]
EEH - Power Systems LaboratoryEidgenossische Technische Hochschule Zurich
Congestion Management in LiberalizedElectricity Markets - Theoretical
Concepts and International Application
Zurich, May 2005
Contents
Table of Contents . . . . . . . . . . . . . . . . . . . . . . . . . . . . . . iList of Figures . . . . . . . . . . . . . . . . . . . . . . . . . . . . . . . iiiList of Acronyms . . . . . . . . . . . . . . . . . . . . . . . . . . . . . . iv
1 Introduction 1
2 Definition of Concepts 22.1 Bilateral and Centralized Electricity Trading . . . . . . . . . . . 22.2 Spot Markets, Pool Markets and Power Exchanges . . . . . . . . 3
2.2.1 Spot Markets . . . . . . . . . . . . . . . . . . . . . . . . . 32.2.2 Pool Markets . . . . . . . . . . . . . . . . . . . . . . . . . 42.2.3 Power Exchanges . . . . . . . . . . . . . . . . . . . . . . . 52.2.4 Conclusion . . . . . . . . . . . . . . . . . . . . . . . . . . 5
2.3 Transmission Pricing, Congestion Management, TransCo and ISO 52.4 Conclusion . . . . . . . . . . . . . . . . . . . . . . . . . . . . . . 6
3 Congestion Management and Generic Market Structures 73.1 Generic Market Structures . . . . . . . . . . . . . . . . . . . . . . 7
3.1.1 Power Pool and Financial Bilateral Trading . . . . . . . . 73.1.2 Power Pool and Physical Bilateral Trading . . . . . . . . 83.1.3 Decentralized Market Structures . . . . . . . . . . . . . . 93.1.4 Conclusion . . . . . . . . . . . . . . . . . . . . . . . . . . 10
3.2 Introduction to Congestion Management . . . . . . . . . . . . . . 103.3 Capacity Allocation Methods . . . . . . . . . . . . . . . . . . . . 11
3.3.1 Nodal Pricing . . . . . . . . . . . . . . . . . . . . . . . . . 113.3.2 Zonal Pricing . . . . . . . . . . . . . . . . . . . . . . . . . 163.3.3 Uniform Pricing . . . . . . . . . . . . . . . . . . . . . . . 183.3.4 Interarea Capacity Allocation . . . . . . . . . . . . . . . . 19
3.4 Capacity Alleviation Methods . . . . . . . . . . . . . . . . . . . . 233.4.1 Introduction . . . . . . . . . . . . . . . . . . . . . . . . . 233.4.2 Redispatching . . . . . . . . . . . . . . . . . . . . . . . . . 233.4.3 Countertrade or Buy-Back Procedure . . . . . . . . . . . 23
3.5 Conclusion . . . . . . . . . . . . . . . . . . . . . . . . . . . . . . 23
4 Implementation of Congestion Management Concepts in Dif-ferent Markets 254.1 Nodal Pricing Models . . . . . . . . . . . . . . . . . . . . . . . . 25
4.1.1 Introduction . . . . . . . . . . . . . . . . . . . . . . . . . 254.1.2 Pennsylvania-New-Jersey-Maryland Interconnection (PJM) 254.1.3 FERC Standard Market Design . . . . . . . . . . . . . . . 264.1.4 New York (NYPOOL) and New England (NEPOOL) . . 274.1.5 California . . . . . . . . . . . . . . . . . . . . . . . . . . . 284.1.6 Singapore and Ireland . . . . . . . . . . . . . . . . . . . . 314.1.7 Conclusion . . . . . . . . . . . . . . . . . . . . . . . . . . 32
4.2 Zonal Pricing Models . . . . . . . . . . . . . . . . . . . . . . . . . 324.2.1 Introduction . . . . . . . . . . . . . . . . . . . . . . . . . 324.2.2 Norway and Nord Pool . . . . . . . . . . . . . . . . . . . . 32
i

4.2.3 Australia . . . . . . . . . . . . . . . . . . . . . . . . . . . 334.2.4 Conclusions . . . . . . . . . . . . . . . . . . . . . . . . . . 34
4.3 Uniform Pricing Models . . . . . . . . . . . . . . . . . . . . . . . 344.3.1 Introduction . . . . . . . . . . . . . . . . . . . . . . . . . 344.3.2 England and Wales (Pool Design) . . . . . . . . . . . . . 344.3.3 Sweden . . . . . . . . . . . . . . . . . . . . . . . . . . . . 354.3.4 Conclusion . . . . . . . . . . . . . . . . . . . . . . . . . . 35
4.4 Auctioning of Transmission Capacity . . . . . . . . . . . . . . . . 354.5 Conclusion . . . . . . . . . . . . . . . . . . . . . . . . . . . . . . 36
5 Comparison of Congestion Management Concepts 37
ii

List of Figures
2.1 Comparison Future and Spot Markets . . . . . . . . . . . . . . . 32.2 Pricing in a Spot Market . . . . . . . . . . . . . . . . . . . . . . . 3
3.1 Mandatory Power Pool . . . . . . . . . . . . . . . . . . . . . . . . 73.2 Contracts for Differences . . . . . . . . . . . . . . . . . . . . . . . 83.3 Power Pool with Physical Bilateral Contracts . . . . . . . . . . . 83.4 Decentralized Market Design . . . . . . . . . . . . . . . . . . . . 93.5 Phases of Network Access with Respect to Congestion . . . . . . 113.6 Example Nodal Pricing . . . . . . . . . . . . . . . . . . . . . . . 143.7 Example Market Splitting . . . . . . . . . . . . . . . . . . . . . . 173.8 Example Uniform Pricing . . . . . . . . . . . . . . . . . . . . . . 19
5.1 Market Design and Congestion Management . . . . . . . . . . . . 37
iii

List of Acronyms
Acronym Full NameAPX Amsterdam Power ExchangeATC Available Transmission CapacityCAISO California Independent System OperatorCCGT Combined Cycle Gas TurbineCfD Contract for DifferencesCM Congestion ManagementEEX European Energy Exchange (Leipzig)EuroPEX Association of European Power ExchangesERCOT Electric Reliability Council of TexasETSO Association of European Transmission System OperatorsFERC The Federal Energy Regulatory CommissionFMC Flow-based Market CouplingFTR Financial Transmission RightsIEM Internal European MarketIGO Independent Grid OperatorISO Independent System OperatorLMP Locational Marginal PricingMO Market OperatorNECA National Electricity Code Administrator (Australia)NEMMCO The National Electricity Market Management Company Limited (Australia)NEPOOL New England Power PoolNETA New Electricity Trading Arrangements (England)NGC National Grid Company (England)NYPOOL New York Power PoolPJM Pennsylvania-New Jersey-MarylandPX Power ExchangeSMD Standard Market DesignSO System OperatorTransCo Transmission CompanyTSO Transmission System OperatorUMP Uniform Marginal PricingZMP Zonal Marginal Pricing
iv

Chapter 1
Introduction
In the early 1990’s the power supply industries worldwide started to undergoa period of extensive changes. Electricity markets moved away from verticallyintegrated monopolies towards liberalized structures with power delivery beinga bundle of several services mainly including generation, transmission and dis-tribution. One reason for restructuring lied in the expectation that competitioncould lead to a reduction of electricity prices and could stimulate the emergenceof new technologies. The liberalization process was driven by several reasons,where the introduction of the Combined Cycle Gas Turbine (CCGT) provided atechnological justification for competition in energy markets. The CCGT tech-nology allowed for smaller plant sizes, nevertheless being at least as economicaland efficient as thermal plants with their large economies of scale.[1] Thus, itwas believed that new players may easily enter the market forming a competitivemarket structure.
However, transmission networks are still regarded as natural monopolies.Fixed costs are high while variable costs are comparably low. The monopolytransmits energy at significantly lower total cost than a competitive market.“Electricity grids exhibit large economies of scale and must be physically inter-connected for maximum trading efficiency, making the grid a natural monopolywithin a defined region.”[2] Under such conditions, conventional wisdom sug-gests that government regulation must substitute for competition to disciplinethe behavior of firms. Deregulation of the transmission grid would not be suit-able.
Although, the pricing mechanism of competitive markets does not provideefficient results for natural monopolies, and thus, transmission access and tariffsare subject to regulation, there is a growing need for market-based pricing con-cepts in transmission networks.[3] Ideally, these pricing concepts give not onlycorrect economic incentives, but will also facilitate the physical operation of thenetwork. In this regard especially congestion management and pricing method-ologies received attention, as these methodologies are crucial for the efficientoperation of electricity markets. This report intends to give an overview of con-gestion management and pricing concepts. As different market designs allow fordifferent congestion management approaches the comparison and description isdone in conjunction with overall market structures.
The report is structured as follows. Chapter 2 defines the concepts andterms as used in this report. Chapter 3 provides an overview on generic mar-ket structures and describes market-based congestion management and pricingapproaches, such as capacity allocation and capacity alleviation methods. Theoverview is complemented by chapter 4 focussing on the implementation of therespective methods in electricity markets worldwide. Chapter 5 concludes thereport by comparing the different concepts.
1

Chapter 2
Definition of Concepts
Since the early 1990’s electricity markets worldwide started to undergo a periodof extensive changes and are still subject of redesign and restructuring. Withthe process of re-organization various design concepts evolved. Although, con-cepts may have similar features or may to some extend be identical they may bereferred to different notions. As there is no unified “vocabulary” of electricitymarkets, this chapter aims at defining the terms and concepts as used through-out this report. If possible, definitions are made according to the common useof the respective term.
2.1 Bilateral and Centralized Electricity Trad-ing
With the ongoing liberalization of electricity markets various design conceptsevolved. Although, market rules in different national markets may exhibit dif-ferent features, at least two main approaches for market organization can bedistinguished: a) direct or bilateral trading of electrical energy and b) central-ized electricity trading.
According to the bilateral trade of electricity, market participants independentlyarrange power transactions with each other according to their own financialterms. Economic efficiency is promoted by consumers choosing the least expen-sive generators.[4] The bilateral approach gives a great latitude for decentralizeddecision making. It is motivated by the concept of free market competition pro-viding the customers with “direct access” to the producer of choice. Therefore,the model is also referred to ‘direct access method’.[5]
Whereas bilateral trade relies on the direct interaction of market participants,this is not the case for centralized trading models, where a common marketplacefor energy trade is established. Market participants use this marketplace, whichis mostly organized as closed-order-book auctioning system. In conjunction withcentralized trading approaches the terms spot market, pool market and powerexchange are frequently used. The following section defines the three conceptsas used throughout this report.
2

2.2 Spot Markets, Pool Markets and Power Ex-changes
2.2.1 Spot Markets
The term spot market origins from investment science, where a spot marketis defined as a market where commodities are sold and bought for immedi-ate delivery. This differs from a futures market, where the delivery will bemade at a future date.[6] Thus, a crucial criterion to distinguish spot marketsfrom other market types is the time horizon. The term spot market in con-junction with liberalized electricity markets is generally used in the context ofday-ahead, hour-ahead and real-time markets, although the use of the termi-nology might differ slightly. Several authors refer day-ahead markets alreadyto as futures markets[7, 8] Hence, they only consider real-time markets as spotmarkets, whereas e.g. the European Power Exchange, Nord Pool and Amster-dam Power Exchange refer day-ahead trade to as spot trade (see for instance[9, 10, 11]). In this section the common procedure of spot trade is described,where the focus is on the operation of day-ahead markets. Specific featuresconcerning the operation of hour-ahead and real-time market are neglected inthis section.
yearly, monthly,weekly contracts
future markets spot markets
day-ahead hour-ahead real-time
Figure 2.1: Comparison Future and Spot Markets
Spot markets for electricity are usually organized as closed-order-book auction-ing systems, where the market players submit demand bids (load serving en-tities) and supply offers (generation companies). The marketplace operatorreceives these price and quantity bids (offers) and subsequently clears the mar-ket, where the equilibrium point of supply and demand determines the marketclearing price1 (figure 2.2).
price
quantity
demand curve
supply curve
pm
qm
Figure 2.2: Pricing in a Spot Market[16]
For the operation of spot markets four single stages can be figured out:[17]1A system where one clearing price applies to all participants is called a uniform auction,
as there exists only one uniform system price. In the context of strategic behavior and marketpower mitigation alternative clearing rules have been discussed, e.g. second-bid auctions,where the second-highest bid determines the clearing price. In contrast to uniform auctions,in pay-as-bid auctions participants pay (are paid) the prices of their actual bids (offers). Such asystem is referred to as discriminatory auction, as prices are discriminated among the players.See references [12, 13, 14, 15]
3

Bidding The time period for which the bidding is made, is usually sched-uled in hour or half-hour sections. For every interval bids (offers) can betransferred to the operator until a fixed deadline. Generators place theirproduction offers in terms of price and quantity. Consumers submit theirbids relating to the demanded load (resp. energy) and the maximum pricethey are willing to pay.
Clearing When the orderbook is closed the market operator calculates themarket clearing price (pm) and the market clearing quantity (qm) for ev-ery scheduled interval. The market solution or equilibrium is set by theintersection of the supply and demand curves, where the last unit pro-duced sets the market clearing price also referred to the system marginalprice (SMP ), which is applied to every dispatched unit (figure 2.2).
Physical Delivery After all trade has been settled, physical delivery takesplace. Generators and loads produce (consume) energy according to theoutcome of the market clearing process.
Financial Transactions The last stage of the centralized trading approachrefers to financial transactions. The buyers pay the market operator theconsumed energy, whereas the market operator pays the generators theinjected energy. To all dispatched participants the system marginal priceis applied.
The above stages characterize spot markets in general. For the time being is-sues related to the operation of hour-ahead and real-time markets have beenneglected. Section 2.2.2 introduces the pool market concept and describes itsrelationship to spot markets. In 2.2.3 section the operation principles of a powerexchange are outlined. These two concepts can be seen as effective implemen-tations of spot markets, where the term spot market is generic to both.
2.2.2 Pool Markets
The term power pool historically evolved from the first U.S. power pool in thePennsylvania-New Jersey area, which was founded in 1927 by three members.1956 five signatories agreed to coordinate operations and planning as the PJM(Pennsylvania-New Jersey-Maryland) Interconnection.[18] The main functionsof a power pool are unit commitment, dispatch and transaction scheduling. Thepower pool concept offers an organizational alternative to a merger that wouldestablish a single vertically integrated company.[19] The term power pool gainedfurther attention through the liberalization process of the UK electricity market,where in 1990 a pool structure was introduced. All suppliers had to sell theirgeneration resources through the national wholesale pool,[20] subsequently, theNational Grid Company (NGC) cleared the market by dispatching generation.2
While the bidding process in pool markets may follow the general procedure,which has been characterized in section 2.2.1, the distinct feature of power poolsis the unit commitment and dispatch function. In pool markets the market op-erator, in charge of clearing the spot market(s), is also responsible for networkaccess and operation. Thus, the market is cleared with explicitly taking gen-eration and network constraints into account. This concept is also referred toas tight pool.[19] It is different from the operation of power exchanges, where asimple merit-order clearing is done without considering network constraints.
Section 3.1 discusses the relationship of pool and bilateral markets, the roleof independent system and market operators.
2see section 4.3.2 for a detailed treatment of the England and Wales pool market.
4

2.2.3 Power Exchanges
Above a power pool was described as an organization, which offers several ser-vices to its members ranging from unit commitment to expansion and reinforce-ment planning. Power exchanges differ from this concept as they rather facilitateshort-term energy trade, but “do not include economic unit commitment anddispatch, nor do they provide for coordinated long-term planning.”[19] Thus,the power exchange operator is not necessarily concerned with network accessand operation. Power Exchanges are established in several European Countries,such as the European Energy Exchange (EEX) in Leipzig (Germany), Powernextin Paris (France), Amsterdam Power Exchange (APX) in the Netherlands etc.The market is cleared through a merit-order dispatch as described in the spotmarket section 2.2.1. Power Exchanges can be run as automated platforms asdone in the Netherlands.
2.2.4 Conclusion
The above sections described pool markets and power exchanges as two ap-proaches of organizing spot trade in electricity markets (among hour-ahead andreal-time markets). It was outlined that in pool markets the market operatoris also assigned the function of an independent system operator, thus the ISOexplicitly takes network operation into account for energy trade. In contrast topool markets power exchanges facilitate short-term energy trade without nec-essarily obeying network constraints. The power exchange operator and theISO are distinct organizations. Nevertheless, mutual coordination of activitiesis essential.
2.3 Transmission Pricing, Congestion Manage-
ment, TransCo and ISO
When discussing transmission pricing, it is necessary to define what is meantby or included in the transmission service. Generally, the transmission functionwill facilitate a competitive electricity market by impartially providing energytransportation services to all energy buyers and sellers, while fairly recoveringthe cost of providing those services. According to [21] the structure of networkcharges should encourage:
• the efficient short-run use of the network (dispatch order and congestionmanagement)
• efficient investment in expanding the network
• efficient signals to guide investment decision
• fairness and political feasibility; and
• cost recovery
The term transmission pricing incorporates congestion management as one es-sential feature. Thus, transmission pricing may be seen as embracing term,covering the pricing of all network related costs, whereas congestion manage-ment and pricing is a subtask. This report focusses on congestion management(CM), issues related to investment planning, system expansion and full cost re-covery are not discussed. The reader may be referred to references [22, 23, 24].
To ensure efficient network use in most liberalized electricity markets a specialentity the so called system operator exists. “This monopoly can be either anon-profit or a for-profit-entity.”[25] The for-profit-entity in the US is calledTransCo (short for transmission company). It owns, operates and manages the
5

transmission system as a natural monopolist. A TransCo could maximize itsprofit by withholding transmission capacities, thus it is heavily regulated.3
The other choice is to introduce a non-profit-entity which is usually calledIndependent System Operator (ISO) or Independent Grid Operator (IGO). Incontrast to the TransCo the ISO does not own - but manage - the transmissionnetwork. It does not have a motive to withhold transmission capacities in orderto maximize its profit. Thus it is only slightly regulated.
In the following, the term TransCo will be used for an institution whichowns and operates the network, whereas ISO refers to an independent systemoperator.
2.4 Conclusion
The above sections described various terms related to electricity markets as usedin this report. Bilateral and centralized electricity trading have been character-ized as two approaches for organizing liberalized markets. The term spot markethas been introduced and distinguished from future markets, where spot mar-kets may be organized as power pools or power exchanges. A further distinctionmay be made according to the time horizon, such as day-ahead, hour-ahead andreal-time markets. In most liberalized markets a system operator is in charge ofnetwork operation and pricing. Depending on the organizational form this mayeither be a TransCo (often found in Europe) or an ISO (predominantly in theUS)[21].
Chapter 3 discusses congestion management methodologies in conjunctionwith specific market structures, as certain designs advantage respectively dis-advantage specific CM schemes.
3In general there are two approaches for the regulating of natural monopolies, while thetwo approaches mark the extremes of the regulatory spectrum. On the one hand there iscost-of-service regulation (COS), on the other hand there is perfect price-cap regulation.
6

Chapter 3
Congestion Managementand Generic MarketStructures
Transmission pricing and congestion management are distinct elements of elec-tricity market design. In contrast to solutions configured to match the uniquestructural and historical features of specific national markets this chapter aims atproviding a conceptual overview on congestion management methods. It is em-phasized that transmission pricing and congestion management have to be eval-uated in conjunction with overall market design, where different generic marketorganizations allow for different congestion management methodologies. Thedescription follows the evolution from uniform to zonal to nodal pricing models.
3.1 Generic Market Structures
In [26, 27] the interdependency of general market design and CM concepts isoutlined. Thus, in the following characteristic market structures are described.The overview is organized according to concepts derived from a power pool(sections 3.1.1 and 3.1.2) and concepts rather relying on decentralized tradingapproaches (section 3.1.3).
3.1.1 Power Pool and Financial Bilateral Trading
Figure 3.1 depicts a market structure where physical energy trade is allowedonly through a mandatory power pool.
seller 1 seller i seller m
buyer 1 buyer j buyer m
power pool
MWhMWh
MWh
MWhMWh$
$$
$ $ $
Figure 3.1: Mandatory Power Pool[16]
7

No direct transactions between sellers and customers are possible. The systemprice is calculated based on the bids from generators and loads the pool operatorreceives, where Hogan claims the pool dispatch and the transmission wires to bedistinct essential facilities.[28] The pool operator carries out all functions relat-ing to the centralized marketplace (the pool) and beyond fulfills objectives as asystem operator by obeying generation and network constraints, i.e. performingunit commitment and dispatch.
In a mandatory pool model no physical, bilateral transactions are allowedbesides the pool. One common method of hedging price risks is the use of con-tracts for differences (CFDs). This instrument is of complete financial nature.“If two traders wish to make a bilateral transaction for some quantity q at aprice p at some future time, they may enter into a CFD.”[29] The buyer paysthe seller q(p − ps) where ps is the system price and p the contract price. Thenet payment involved amounts to pq. Figure 3.2 shows the financial transac-tions between the buyer, the seller and the pool operator.1 Crucial to CFDs isthe underlying spot market, where the purpose is to eliminate uncertainty intemporal spot price variations.[29]
s s
s
seller buyer
refund of spot price payment
pool
qp
qp
qpqp
Figure 3.2: Contracts for Differences[16]
Mandatory power pools are implemented in Singapore and Australia. In Irelandthe concept is proposed to be introduced in the near future.
3.1.2 Power Pool and Physical Bilateral Trading
Figure 3.1 depicts a market structure where generators and loads may eithersettle into bilateral contracts or trade energy through the pool.
bilateralcontracts
transmissionnotification
generators
power pool
loads
short-termpower purchases
short-termpower purchases
Figure 3.3: Power Pool with Physical Bilateral Contracts[16]
In contrast to the above described market design physical bilateral contractsare explicitly allowed. If generators opt for self-scheduling according to theirbilateral transactions, they have to notify the pool operator about the points ofinjection/withdrawal of energy. In case generators bid to the pool’s spot marketsthe pool operator will carry out unit commitment and dispatch functions.
1The system was implemented under the old England and Wales pool design.
8

This structure is suggested by the US Federal Energy Regulatory Com-mission (FERC) as standard market design (SMD). It is implemented in thePennsylvania-New Jersey-Maryland (PJM) Interconnection, in New York andNew England and scheduled for introduction in California.
3.1.3 Decentralized Market Structures
The structures in sections 3.1.1 and 3.1.2 premised the existence of a pool oper-ator whose main objectives are to make the pool market work and to ensure thereliability of the transmission network by scheduling network services. Althoughboth functions are strongly connected and Hogan concludes in [28] that they arevery likely to be carried out by one entity, a different approach is conceivable.The operation of a day-ahead spot market may be separated from network oper-ation (see figure 3.4). Although, the ISO may still run hour-ahead and real-timespot markets to keep the system in balance and relieve congestion, day-aheadspot markets may be run by different entities. Scheduling coordinators (SC)“pool” a variety of generating resources to meet the combined loads of multi-ple customers.[30] Additionally, they are in charge of balancing generation anddemand of market participants in a certain area and submitting the preferredschedules to the ISO. Employing coordinators for a number of loads and gen-erators means improving efficiency of the regional network usage, whereas theISO is responsible for optimizing the grid as a whole. Thus, both entities areassociated with the coordinating of the transmission services.
Generally, electricity trade in a decentralized market structure allows thefollowing transactions:
1. Generators (Gi) and loads (Li) may settle into physical bilateral con-tracts (1) and subsequently notify scheduling coordinators (SC) abouttheir physical portfolios.
2. Generators (Gi) and loads (Li) may trade energy through the day-aheadmarket at the power exchange (2).
3. Generators (Gi) and loads (Li) may participate in the balancing (real-time) market of the ISO (3).
In order to ensure efficient network use a mutual information exchange is nec-essary between scheduling coordinators, the power exchange and the ISO.
SCSC power exch.
ISO
11
22
33
GiGiGi Li LiLi
Figure 3.4: Decentralized Market Design
A similar decentralized market design is to be found in Germany and was pro-posed for California2 before the energy crisis in 2000/20001. Additionally, the
2Eventually, all incumbent generators had to sell their energy through the power exchange.As a result the Californian model became known as power pool, although the structure wasnot a pool in the sense, that the system operator provided unit commitment and dispatch ofgeneration.
9
Nordic system may be regarded as following a decentralized approach, as there isno central scheduling/dispatching entity. Scheduling is the responsibility of in-dividual generating companies. There is only a common power exchange (NordPool).[26]
3.1.4 Conclusion
The above described models may be seen as specific implementations of fourgeneral design principles for electricity markets:[31]
1. Wholesale competitive generators bid to supply power to a single pool.Load-serving companies buy wholesale power from the pool at a regulatedprice and resell it to the retail loads
2. Wholesale competitive generators bid to supply power to a single pool,while load-serving companies then compete to buy wholesale power fromthe pool and resell it to the retail loads.
3. Combinations of (1) and (2) with bilateral wholesale contracts betweengenerators and load-serving entities.
4. Combinations of all previous plus contracts between all entities and retailloads.
In the next sections CM concepts are described, where the interdependencies ofmarket design and CM methodologies are pointed out. Section 3.2 provides anintroduction to CM. Section 3.3 details the methodologies ranging from uniform,zonal and nodal pricing to the auctioning of transmission capacity.
3.2 Introduction to Congestion Management
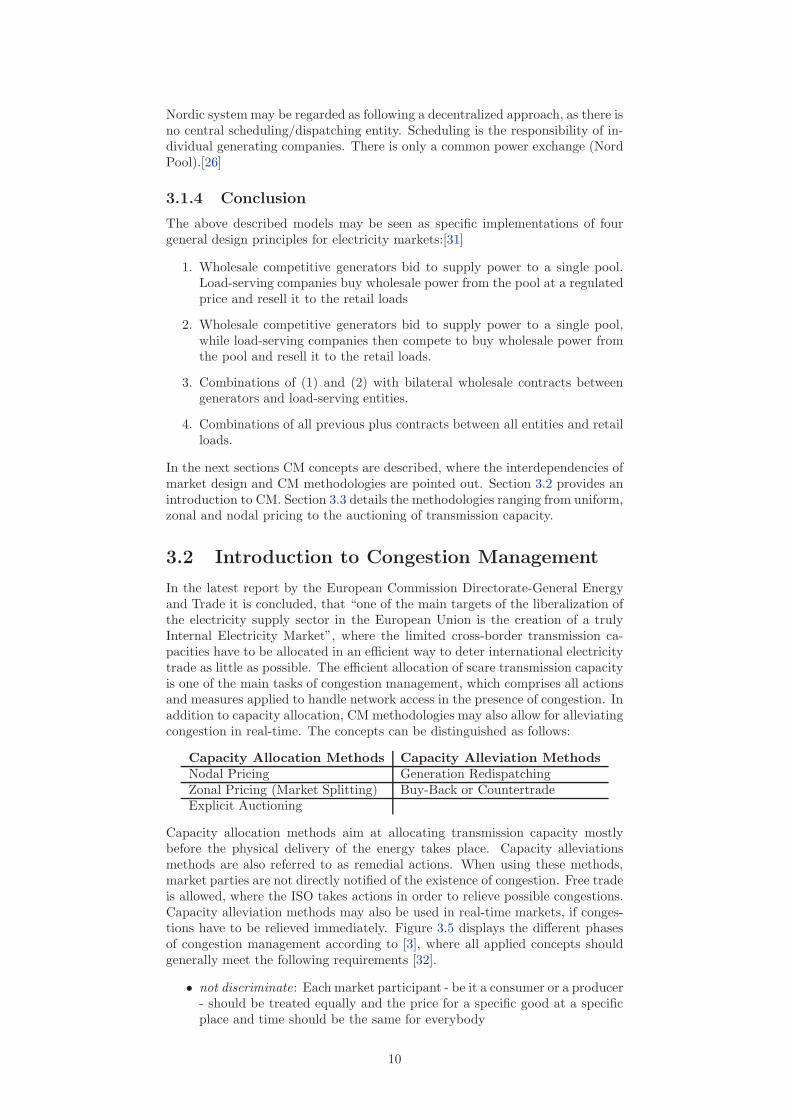
In the latest report by the European Commission Directorate-General Energyand Trade it is concluded, that “one of the main targets of the liberalization ofthe electricity supply sector in the European Union is the creation of a trulyInternal Electricity Market”, where the limited cross-border transmission ca-pacities have to be allocated in an efficient way to deter international electricitytrade as little as possible. The efficient allocation of scare transmission capacityis one of the main tasks of congestion management, which comprises all actionsand measures applied to handle network access in the presence of congestion. Inaddition to capacity allocation, CM methodologies may also allow for alleviatingcongestion in real-time. The concepts can be distinguished as follows:
Capacity Allocation Methods Capacity Alleviation MethodsNodal Pricing Generation RedispatchingZonal Pricing (Market Splitting) Buy-Back or CountertradeExplicit Auctioning
Capacity allocation methods aim at allocating transmission capacity mostlybefore the physical delivery of the energy takes place. Capacity alleviationsmethods are also referred to as remedial actions. When using these methods,market parties are not directly notified of the existence of congestion. Free tradeis allowed, where the ISO takes actions in order to relieve possible congestions.Capacity alleviation methods may also be used in real-time markets, if conges-tions have to be relieved immediately. Figure 3.5 displays the different phasesof congestion management according to [3], where all applied concepts shouldgenerally meet the following requirements [32].
• not discriminate: Each market participant - be it a consumer or a producer- should be treated equally and the price for a specific good at a specificplace and time should be the same for everybody
10

• give economic signals: The method should give incentives to producers,consumers and the network operator to improve the systems in order torelieve transmission constraints.
• be transparent : The implementation should be well defined and transpar-ent for all participants.
• be feasible: The available resources (information, computer systems) needto be capable of producing the necessary quantitative results in the timeframe available.
• be able to interact with other systems : In a real system the surroundingTSOs and their specific methodologies have to be taken into account. Theimplemented system needs to interact with other systems.
determinationof availabletransmission
capacity
capacityallocation
congestionforecast
if requiredcongestionalleviation
bidsreservations
dispatchschedules
Figure 3.5: Phases of Network Access with Respect to Congestion[3]
The requirements above comply with the criteria outlined in [3]. Special em-phasis is put on the claim for market-based congestion management. Thus,two currently used CM methods are excluded from assessment as done in [3].First come first served and pro-rata methods fail to meet the above listed cri-teria.3 For further evaluation the following capacity allocation methodologiesremain: nodal pricing, zonal pricing (market splitting), uniform pricing, explicitand coordinated auctioning for interarea CM. The main characteristics of theseapproaches are outlined in section 3.3. Section 3.4 focusses on capacity allevi-ation methods, such as buy-back, redispatch and curtailment procedures. Themethodologies are evaluated taking into account the above described genericmarket structures, with regard to implementation issues and feasibility in con-junction with specific market rules.
3.3 Capacity Allocation Methods
3.3.1 Nodal Pricing
The general idea of nodal pricing is to 1) model an electricity market with itsvarious economical and technical specifications, such as generators’ cost func-tions, demand elasticity, generation limits (individual and overall), power flowlimits etc. and 2) optimize the system which is synonymous to maximizing so-cial welfare. One crucial outcome of the optimization procedure is the price ateach node, the so called nodal or spot prices. It reflects the temporal and localvariations of the energy price relating to the energy demand. The methodologycomprehends, that electricity has not only to be generated, but also has to bedelivered to a particular node, taking into account transmission constraints andelectrical losses.
3Neither first come first serve nor pro-rata methods take into account the willingness to pay.Thus, it can not be ensured that market participants with a high valuation for transmissioncapacity will indeed be scheduled.
11

Nodal pricing can be seen as fully coordinated implicit auction.[21] Genera-tors and loads do not explicitly participate into auctions for transmission capac-ity. Capacity is implicitly allocated through bids for production/consumptionat a specific location (bus). Nodal pricing is often used in conjunction witha pool-based market design. The ISO collects all bids and is then in chargeof clearing the market by maximizing social welfare while satisfying networkconstraints. To realize this objective, the ISO solves the following optimizationproblem:
maximise =∑
k
B(dk) −∑
j
C(gj) (3.1)
subject to:
∑k
dk + losses −∑j
(gj) = 0 (a)
|zi| ≤ zmaxi (b)
gj ≤ gmaxj (c)
with:
dk demand at node kgj generation at node jB(dk) consumers’ benefitC(gk) producers’ generation costgmax
j maximum generation capacity at node jzi flow along line izmax
i maximum permissible flow along line i
As seen in the first part of equation 3.1 the social welfare is equal to the benefitfrom consuming electricity less the cost of generation. This gives the objectivefunction which is subject to four sets of constraints. Constraint a) describes theenergy balance. The total generation must not be less than the sum of the de-mand and the losses. Equation 3.1b gives the line flow constraints and equation3.1c the generation constraints. For the optimization problem the Lagrangeanwith the Langrangean multipliers µe, µQS
i and µmaxj can be formulated as fol-
lows:4
maximize∑k
B(dk) −∑j
C(gj)
−µe
(∑k
dk + losses −∑j
(gj)
)
−µQSi (|zi| − zmax
i )
−µmaxj
(gj − gmax
j
)
From the Langrangean the following expression for the nodal price can be de-rived:5
pk = µe
[1 +
δlosses
δdk
]+
∑i
µQSi
δzi
δdk(3.2)
The scarcity of transmission capacity is reflected by the multiplier µQSi . General
optimization theory states, that the Lagrangean multipliers define, how the4For a detailed description on optimization methods see [33]:5A stepwise description of the nodal price derivation can be found in [34]. In this paper
only the implications for transmission pricing are relevant.
12
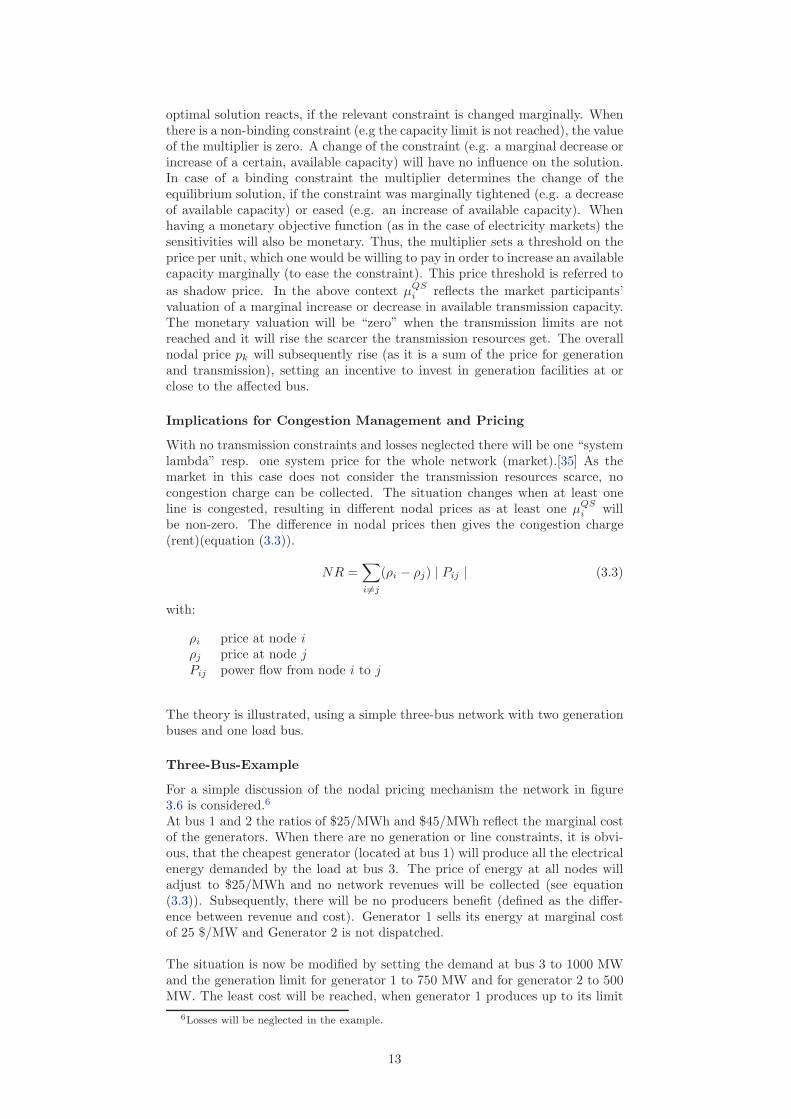
optimal solution reacts, if the relevant constraint is changed marginally. Whenthere is a non-binding constraint (e.g the capacity limit is not reached), the valueof the multiplier is zero. A change of the constraint (e.g. a marginal decrease orincrease of a certain, available capacity) will have no influence on the solution.In case of a binding constraint the multiplier determines the change of theequilibrium solution, if the constraint was marginally tightened (e.g. a decreaseof available capacity) or eased (e.g. an increase of available capacity). Whenhaving a monetary objective function (as in the case of electricity markets) thesensitivities will also be monetary. Thus, the multiplier sets a threshold on theprice per unit, which one would be willing to pay in order to increase an availablecapacity marginally (to ease the constraint). This price threshold is referred toas shadow price. In the above context µQS
i reflects the market participants’valuation of a marginal increase or decrease in available transmission capacity.The monetary valuation will be “zero” when the transmission limits are notreached and it will rise the scarcer the transmission resources get. The overallnodal price pk will subsequently rise (as it is a sum of the price for generationand transmission), setting an incentive to invest in generation facilities at orclose to the affected bus.
Implications for Congestion Management and Pricing
With no transmission constraints and losses neglected there will be one “systemlambda” resp. one system price for the whole network (market).[35] As themarket in this case does not consider the transmission resources scarce, nocongestion charge can be collected. The situation changes when at least oneline is congested, resulting in different nodal prices as at least one µQS
i willbe non-zero. The difference in nodal prices then gives the congestion charge(rent)(equation (3.3)).
NR =∑i�=j
(ρi − ρj) | Pij | (3.3)
with:
ρi price at node iρj price at node jPij power flow from node i to j
The theory is illustrated, using a simple three-bus network with two generationbuses and one load bus.
Three-Bus-Example
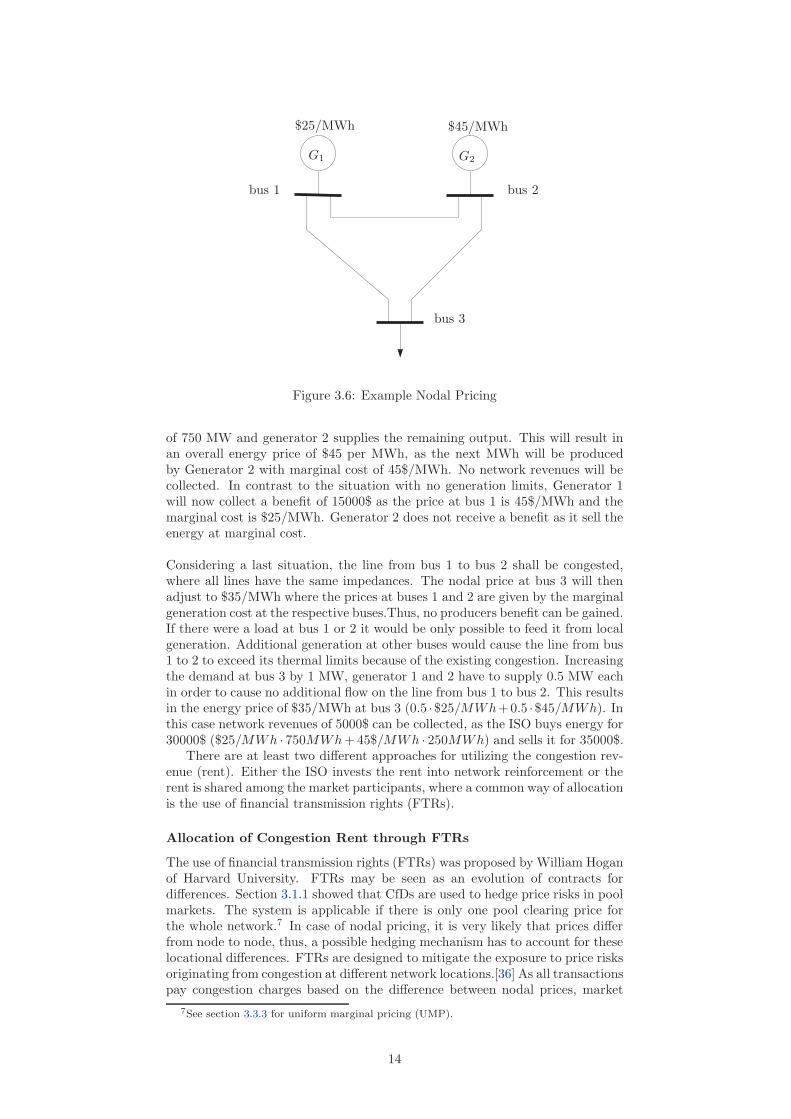
For a simple discussion of the nodal pricing mechanism the network in figure3.6 is considered.6
At bus 1 and 2 the ratios of $25/MWh and $45/MWh reflect the marginal costof the generators. When there are no generation or line constraints, it is obvi-ous, that the cheapest generator (located at bus 1) will produce all the electricalenergy demanded by the load at bus 3. The price of energy at all nodes willadjust to $25/MWh and no network revenues will be collected (see equation(3.3)). Subsequently, there will be no producers benefit (defined as the differ-ence between revenue and cost). Generator 1 sells its energy at marginal costof 25 $/MW and Generator 2 is not dispatched.
The situation is now be modified by setting the demand at bus 3 to 1000 MWand the generation limit for generator 1 to 750 MW and for generator 2 to 500MW. The least cost will be reached, when generator 1 produces up to its limit
6Losses will be neglected in the example.
13
G1 G2
bus 1 bus 2
bus 3
$25/MWh $45/MWh
Figure 3.6: Example Nodal Pricing
of 750 MW and generator 2 supplies the remaining output. This will result inan overall energy price of $45 per MWh, as the next MWh will be producedby Generator 2 with marginal cost of 45$/MWh. No network revenues will becollected. In contrast to the situation with no generation limits, Generator 1will now collect a benefit of 15000$ as the price at bus 1 is 45$/MWh and themarginal cost is $25/MWh. Generator 2 does not receive a benefit as it sell theenergy at marginal cost.
Considering a last situation, the line from bus 1 to bus 2 shall be congested,where all lines have the same impedances. The nodal price at bus 3 will thenadjust to $35/MWh where the prices at buses 1 and 2 are given by the marginalgeneration cost at the respective buses.Thus, no producers benefit can be gained.If there were a load at bus 1 or 2 it would be only possible to feed it from localgeneration. Additional generation at other buses would cause the line from bus1 to 2 to exceed its thermal limits because of the existing congestion. Increasingthe demand at bus 3 by 1 MW, generator 1 and 2 have to supply 0.5 MW eachin order to cause no additional flow on the line from bus 1 to bus 2. This resultsin the energy price of $35/MWh at bus 3 (0.5 ·$25/MWh+0.5 ·$45/MWh). Inthis case network revenues of 5000$ can be collected, as the ISO buys energy for30000$ ($25/MWh · 750MWh + 45$/MWh · 250MWh) and sells it for 35000$.
There are at least two different approaches for utilizing the congestion rev-enue (rent). Either the ISO invests the rent into network reinforcement or therent is shared among the market participants, where a common way of allocationis the use of financial transmission rights (FTRs).
Allocation of Congestion Rent through FTRs
The use of financial transmission rights (FTRs) was proposed by William Hoganof Harvard University. FTRs may be seen as an evolution of contracts fordifferences. Section 3.1.1 showed that CfDs are used to hedge price risks in poolmarkets. The system is applicable if there is only one pool clearing price forthe whole network.7 In case of nodal pricing, it is very likely that prices differfrom node to node, thus, a possible hedging mechanism has to account for theselocational differences. FTRs are designed to mitigate the exposure to price risksoriginating from congestion at different network locations.[36] As all transactionspay congestion charges based on the difference between nodal prices, market
7See section 3.3.3 for uniform marginal pricing (UMP).
14

players may hedge against this payment by buying FTRs along the path fromsource to sink. “An FTR’s economic value is based on the MW reservation levelmultiplied by the difference between the LMPs of the source and sink points.”FTRs are directional, and thus, may be either a benefit (in direction with thecongested flow) or a liability (opposite direction as congested flow). The useof FTRs makes a Simultaneous Feasibility Test (SFT) necessary, which ensuresthat all subscribed FTRs are within the capability of the transmission system.
A congestion management and pricing system based on nodal pricing andthe use of FTRs are essential features of FERCs standard market design. Thesystem is in use within the PJM Interconnection, New England and New York.
Cost Recovery Problem
As stated in section 3.3.1 no congestion in the network result in zero networkrevenues, which may be not acceptable for a network owning or operating com-pany. To overcome this problem a complementary charge can be defined (equa-tion (3.4)):
CCl = max{annual costl − NRl , 0} (3.4)
with:
NRl marginal annual revenue line lCCl complementary charge line lannualcostl annual cost line l
Without the definition of a complementary charge, spot pricing theory fails torecover the total incurred network cost, in case the installed system capacity isnot optimal[35], although “the farther away the network is from the single nodeideal situation, the larger is the network revenue”[35]. For the allocation of thecomplementary charge three methods have been proposed:[37]
Adjustment of marginal prices Spot prices are modified according to somecriterion(an additive term, a multiplicative term, Ramsey prices, etc. inorder to match the marginal network revenues and the total network cost
Extent of use allocation The complementary charge is allocated among theagents depending on their “extent of use” of the network.
Benefit allocation The complementary charge is assigned among the agentsdepending on the economic “benefit” that each one of them obtains fromeach network facility.
Theory and implementation of the above methods are extensively described in[37].
Nodal Pricing and Generic Market Structures
The above section introduced nodal pricing according to the initial definition bySchweppe et.al. [38]. Nodal prices are the ‘outcome’ of an optimization process,where the objective is to maximize social welfare according to generation andnetwork constraints. For the implementation of the concept this data has tobe known to the central entity concerned with the optimization. The informa-tion needs can by easily satisfied in an vertically integrated industry structure,where in a liberalized environment auctions are common way of providing therelevant data. Generators and loads bid their willingness to produce (consume)in an auction supervised by the ISO. The procedure follows the previously out-lined spot market rules. The ISO then performs a security constrained unitcommitment (SCUC) and dispatch. Thus, nodal (spot) pricing as well as othermarginal pricing methods are above all suitable for integrated market struc-tures, such as pool markets. Only in pool market the specific information needs
15

for the optimization process can be satisfied. If there are generation as well asnetwork owning companies, the spot price has to be decomposed in order toallocate the different components to the relevant entities,[39] which may be acomplex and strenuous task. Furthermore, in [31] it is stated, that “a mix ofbilateral and spot markets creates difficulties in applying methods based solelyon nodal transmission pricing [...].”
Conclusion
“At a given node k of the transmission network and at an instant of time t,the spot price of electricity ρk(t) is the derivative of the system operation costwith respect to the demand at node k and time t, i.e the short term marginalcost of electricity with spatial discrimination.”[35] Marginally network revenuesimplicitly result from this spatial discrimination of spot prices[40], where in [35]it is shown, that the network costs can only be recovered when the installedcapacity is optimal. For full cost recovery the introduction of a complementarycharge is proposed.[37] To satisfy the information needs of nodal pricing central-ized market designs are required, such as pool-based concepts. Nodal pricingis proposed as FERC standard market design in the US, it is implemented inthe PJM-Interconnection, in New York, New England, New Zealand and it isproposed for California and Ireland (see section 4.1).
3.3.2 Zonal Pricing
Introduction
Zonal pricing8 - in accordance with nodal pricing - establishes different electric-ity prices for different locations in the network. In contrast to nodal pricingwhere prices in the case of congestion might differ for every node, for zonal pric-ing a group of nodes is aggregated to one zone.9 These zones are mostly defineda priori as the concept focusses on certain flowgates, which might be subject tocongestion. An example is the Norwegian system, where the system operatorsplits the national transmission system into two zones (North and South) inthe case of congestion. If the demand for transmission services does not exceedsystem capabilities, different network zones are not established, and thus, thereis only one clearing price for the whole network. In the following the marketsplitting procedure is described.
Market Splitting Procedure
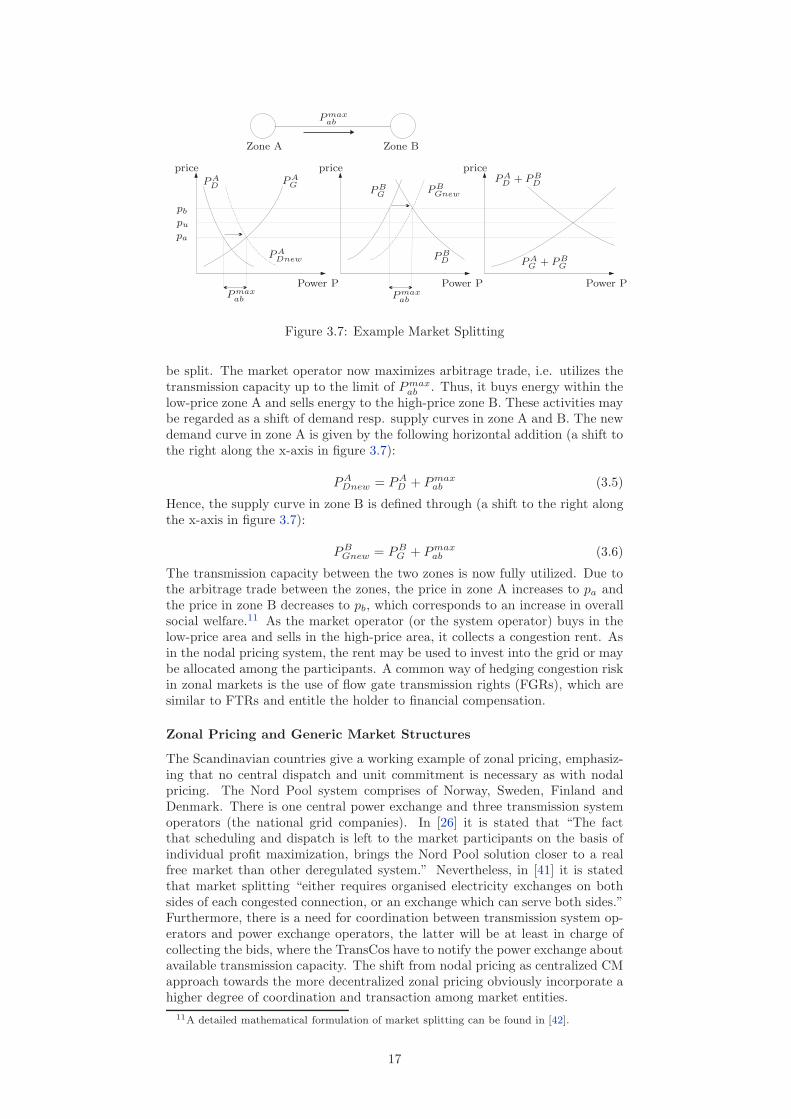
Although, for market splitting a central dispatch or unit commitment is notnecessary[26], it “requires organised electricity exchanges on both sides of eachcongested connection, or an exchange which can serve both sides.”[41] Genera-tors and loads in each zone bid into the power exchange(s), the system opera-tor(s) and the market operator(s) are then in charge of coordinating actions forthe market splitting procedure, which is explained using the topology in figure3.7.10
Within the network two zones have been identified, as the transmission line (theflowgate) connecting the zones may be subject to congestion. The transmissionline has a maximum capacity of Pmax
ab . In zone A generation facilities with lowmarginal cost are located (e.g. hydro plants), whereas in zone B there are majorload centers with little excess supply. Generators and load bids in each zoneare given by PA
G , PAD , PB
G and PBD . For the first step of the market splitting
procedure, the market is cleared as if there was no transmission constraint.Thus, there will be one price pu for the whole market. If the lineflow in thisunconstrained case Pu
ab exceeds the maximum lineflow Pmaxab , the market will
8Zonal pricing in the Scandinavian context is also referred to as area pricing9A group of nodes might be also be referred to as super-node.[32]
10The example is taken from [26].
16
Power P Power P Power P
P AD + P B
D
pricepriceprice
P AG + P B
G
P maxab
P maxab
P maxab
Zone A Zone B
P AD
P AG
P ADnew
P BGnew
pb
pa
pu
P BD
P BG
Figure 3.7: Example Market Splitting
be split. The market operator now maximizes arbitrage trade, i.e. utilizes thetransmission capacity up to the limit of Pmax
ab . Thus, it buys energy within thelow-price zone A and sells energy to the high-price zone B. These activities maybe regarded as a shift of demand resp. supply curves in zone A and B. The newdemand curve in zone A is given by the following horizontal addition (a shift tothe right along the x-axis in figure 3.7):
PADnew = PA
D + Pmaxab (3.5)
Hence, the supply curve in zone B is defined through (a shift to the right alongthe x-axis in figure 3.7):
PBGnew = PB
G + Pmaxab (3.6)
The transmission capacity between the two zones is now fully utilized. Due tothe arbitrage trade between the zones, the price in zone A increases to pa andthe price in zone B decreases to pb, which corresponds to an increase in overallsocial welfare.11 As the market operator (or the system operator) buys in thelow-price area and sells in the high-price area, it collects a congestion rent. Asin the nodal pricing system, the rent may be used to invest into the grid or maybe allocated among the participants. A common way of hedging congestion riskin zonal markets is the use of flow gate transmission rights (FGRs), which aresimilar to FTRs and entitle the holder to financial compensation.
Zonal Pricing and Generic Market Structures
The Scandinavian countries give a working example of zonal pricing, emphasiz-ing that no central dispatch and unit commitment is necessary as with nodalpricing. The Nord Pool system comprises of Norway, Sweden, Finland andDenmark. There is one central power exchange and three transmission systemoperators (the national grid companies). In [26] it is stated that “The factthat scheduling and dispatch is left to the market participants on the basis ofindividual profit maximization, brings the Nord Pool solution closer to a realfree market than other deregulated system.” Nevertheless, in [41] it is statedthat market splitting “either requires organised electricity exchanges on bothsides of each congested connection, or an exchange which can serve both sides.”Furthermore, there is a need for coordination between transmission system op-erators and power exchange operators, the latter will be at least in charge ofcollecting the bids, where the TransCos have to notify the power exchange aboutavailable transmission capacity. The shift from nodal pricing as centralized CMapproach towards the more decentralized zonal pricing obviously incorporate ahigher degree of coordination and transaction among market entities.
11A detailed mathematical formulation of market splitting can be found in [42].
17

Conclusion
The above sections introduced zonal or area pricing as CM concept that splitsthe network in different prices zones in the case of congestion. In the central Eu-ropean context market splitting provided a basis for the evolution of the marketcoupling approach. The concept is put forward by the forum of the EuropeanTransmission System Operators (ETSO).12 Zonal pricing as nodal pricing is animplicit auctioning concept, as no explicit bids for transmission capacity aremade. Capacity is allocated implicitly by the bids of the generators/loads intheir respective zones and by the system operator maximizing arbitrage trade.
3.3.3 Uniform Pricing
Introduction
The sections above have shown that for zonal pricing certain areas in a net-work are aggregated to predefined price-zones. In these zones, prices are notdistinguished node by node, but are unified. Concluding this evolution one mayregard the whole network as one price-zone. This concept is referred to as uni-form marginal pricing (UMP). It was implemented in the pool-based Englandand Wales market, in the 1997 PJM market and the phase-1 ISO New Englandmarket.[43] The characteristics of UMP are described in the following section.The description follows the structure outlined in [43], where it becomes obvi-ous that uniform marginal pricing is only efficient in the absence of congestion.Otherwise an uplift payment13 is necessary, which is not regarded to provideeconomic efficiency. This uplift payment will not be used as market-based signalto relieve congestion, but it is intended to cover the cost of congestion relief.Congestion relief in this model may be achieved by curtailment and redispatchmethods.
Uncongested Network
For the description of uniform marginal pricing (UMP) figure 3.8 is used. First,we will not impose any transfer limit. According to [42] in a UMP-model twostages can be distinguished: market dispatch (MD) and congestion redispatch(CR). In the MD phase only one zone exists, and thus, no constraint interfacesare considered, whereas in the CR phase generation is redispatched followingthe adjustment rules of the ISO. This CM approach may also be characterizedas capacity alleviation method, as in the MD stage market participants are notnotified of congestion, but in a subsequent step the ISO takes remedial actions(such as redispatching) for congestion relief.14
For the example given in figure 3.8 in the MD phase, the ISO will purchaseall energy from generator 1 at a price of $10/MW. This conforms with a leastcost dispatch. As there is no active line limits, and thus no congestion, a CRphase is not necessary. All participants pay (are paid) the same system marginalprice. The system faces no physical difficulties and the dispatch is regarded tobe efficient.
Congested Network
For the description of UMP in a congested network again figure 3.8 is used, wherethe transfer limit of the transmission line is set to 100 MW. The outcome of theMD phase for the congested system matches the outcome in the uncongestedcase. The market clearing will deliver a solution, where all energy is purchased
12Whereas market splitting separates different areas, the direction of market coupling isopposite. Different regions (countries), which originally existed as isolated (national) marketswill now be linked.
13In the England & Wales pool market, the uplift payment also included other components.14In this section only a short example is provided to exemplify UMP. For a detailed descrip-
tion of capacity alleviation methods see section 3.4.
18

G1G1 G2
200 MW @ $10/MW 50 MW @ $20/MW
50 MW 150 MWTransfer Limit
Figure 3.8: Example Uniform Pricing
from generator 1 at a price of $10/MW. This dispatch leads to congestion andmakes the CR phase necessary. The ISO may relieve congestion by ‘constrainingoff’ generator 1 by 50 MW and ‘constraining on’ Generator 2 by 50 MW. Due tothe difference between the unconstrained and the constrained schedule the ISOfaces additional cost of 500$ (50MW · ($20/MW − $10/MW )). This additionalcost (payments) are also referred to as operational outturn [44]. Generally,“stations in an ‘export constraint’ region will have to produce less, while thosein an ‘import constrained’ region will have to produce more.”[44] A unifiedmathematical framework for both the MD and the CR phase is presented in [42].The optimization problem is not outlined here as UMP has several shortcomings,which make it less suitable for practical implementation.15 The drawbacks arepresented in the subsequent sections.
Uniform Pricing and Generic Market Structures
While the MD phase in the UMP model does not differ from the general op-eration principles of spot markets, according to [43] the CR phase makes “thefrequent exercise of command and control” necessary, where these actions “areregarded to “deprive the choices promised to participate and goes against fun-damental principles of competitive markets.”[43] A common way of introducingmarket principles is the use of incremental/decremental bids to resolve con-gestion. In that case market participants will submit their valuation of beingredispatched. An incremental bid represents the participants’ valuation to bescheduled up (more power output), a decremental bid represents the valuationto be scheduled down (less output). These principles may also applied to thedemand side. According to the submitted bids the ISO will solve the correspond-ing optimization problem. Nevertheless, the inc/dec bids system is suspectedto allow for gaming, as “participants may first over-schedule to create conges-tion, and then submit incremental and decremental bids for additional benefits[...]”[43]
Conclusion
For a network without congestion the UMP model delivers the same results asnodal and zonal pricing. The solution is supposed to be efficient and does notcause physical problems. Nevertheless, in a network where congestion is likely tooccur, UMP fails to deliver an efficient solution. The common practice of com-mand and control in UMP models is not compatible with the principles of com-petitive markets. A modification towards the use of incremental/decrementalbids appears problematic.[43]
3.3.4 Interarea Capacity Allocation
Introduction
In the above sections different CM concepts were presented, which aimed mainlyat capacity allocation in a certain region or network. This network may be
15For the optimization problem of the CR phase different objective functions are possible,ranging from minimum shifts in power generation to a cost minimization of dispatch activities.
19

regarded as one control area, with one ISO being responsible for efficient networkuse, i.e. congestion management and pricing, balancing of the system as wellas ancillary services. In the context of the liberalization of European electricitymarkets the role of the transmission system and particular the role of cross-border interconnections has changed. As networks and markets ‘grow’ togetherthere is a need for congestion management between certain areas or countries.Especially, the allocation of scarce cross-border transmission capacity has beenunder discussion recently.[3] In contrast to the above present CM concepts thesemethods may involve more than one ISO. The following sections summarize themain concepts.
Explicit Auctioning
For capacity allocation at several European borders explicit auctioning is used.This applies to the tie lines between e.g. Germany and the Netherlands, Ger-many and Denmark, France and the United Kingdom, the United Kingdomand Ireland.16 In [45] explicit auctioning is characterized as follows: “The seller(TSO) determines ex ante the available transmission capacity (ATC) consideringsecurity analysis, accepts bids from potential buyers and allocates the capacityto the ones that value it most.” Thus, explicit auctioning is a market-basedconcept, which provides economic signals. The main features of the auctioncan be explained using the example for zonal pricing, with zone A being a low-price area and zone B being a high-price area. Loads from zone B might beinterested in settling contracts with generators in zone A to benefit from theprice difference between the two regions. Hence, the valuation of, e.g. loads inzone B, corresponds exactly to the energy price difference between the zones. Ifthe loads in zone B (resp. any market participant) bid higher than the energyprice difference, the benefit they gain from cross-border trading will not makeup for the payment for transmission capacity. Thus, “with perfect foresight,bidders for transmission capacity would predict the electricity market outcomewith efficient use of the transmission”[3] - or in other words - “the price reflectsthe cost of using capacity to the social welfare.”[45]
Auctions for capacity may be designed as uniform or discriminatory auc-tions, where “the price of the interconnector is set equal to the lowest acceptedbid.”[41] In contrast to implicit auctions, where capacity is implicity allocatedby the energy bid at a specific location, explicit auctioning separates the en-ergy from the transmission market. According to [41] this might be consideredas advantage as well as disadvantage. The separation reflects the unbundlingof energy and transmission networks, but it makes two separate transactionnecessary. This increased complexity may hinder trade or complicate tradingactivities of market participants. Another drawback, outlined in [46] is, thatcurrent auctions fail to account for parallel flows in meshed networks. In thiscontext a new method has been proposed called Coordinated Auctioning.
Coordinated Auctioning
In compliance with explicit auctioning, coordinated auctioning splits electricitytrading into two markets, one for transmission capacity and one for energy. Par-ticipants have to ensure to ‘own’ sufficient transmission rights to conclude theirenergy exchanges. However, coordinated auctioning tries to overcome the prob-lems associated with explicit auctioning, by accounting for the effects of loopflows in the network. A central auctioneer is introduced, which manages capac-ity allocation at all borders included in the Internal European Market (IEM).The coordinated auction concept was suggested by the Association of Euro-pean Transmission System Operators (ETSO) in April 2001. For coordinatedauctioning three steps can be identified[21]:
16All currently used cross-border capacity allocation and CM methods can be found in [45].
20

1. Each (national) system operator informs the central auctioneer about theavailable transmission capacity
2. Market participants submit bids to the central auctioneer
3. The auctioneer allocates transmission capacity using a model similar tonodal pricing
Similar to flow-based market coupling, coordinated auctioning tries to link dif-ferent zones rather than merging them. Market participants may value theirwillingness to pay for transmission rights by comparing the different zonal prices.Hence, ‘rational’ bidders for transmission rights will submit bids equal to thezonal difference in energy prices, as the savings for ‘cheaper’ energy are tradedoff against the transmission cost. With perfect foresight and all informationavailable a coordinated auction, will lead to the same allocation as the nodalpricing approach. However, in [47] it is pointed out, that this “perfect antic-ipation assumption” under certain conditions may not seem appropriate. Ifmarginal cost and willingness to pay are not constant, traders can only valuetheir bids with solving a full nodal pricing problem and “this is certainly notwhat ETSO wanted to assume when it submitted its proposal”[47]. For a de-tailed description of the underlying argumentation the reader is referred to [47],where also the impact of an aggregated network is discussed. For coordinatedauctioning several issues remain to be discussed, such as algorithm formulationand the development of an aggregated network model and its influences.
Flow-based Market Coupling (FMC)
In section 3.3.2 zonal pricing was explained as CM resp. capacity allocationconcept, where the network is split into price-zones in the case of congestionon certain flowgates. The proposal of flow-based market coupling (FMC) bythe Association of European Power Exchanges (EuroPex) evolved from thismarket splitting concept. FMC’s objective is to coordinate market operationat the day-ahead stage.[48] Despite the assumption, that with market splittingthe establishment of different zones is only necessary in the case of congestion,EuroPEX assumes, that the European system can be operated as a number ofsingle-price regions, which will be linked through market coupling. Thus, marketsplitting and market coupling share to some extend the same principles, onlythe pre-conditions are different, with the European system being historically‘split’ and now evolving towards a coupled system. Nonetheless, from this pre-condition a crucial difference arises. FMC “does not have an integrated marketto start with, but only a set of independent markets [...]”[47]. FMC includestwo clearing processes. First, the energy market clearing, where the powerexchanges in each zone establish a clearing price dependent on net imports, andsecond, the import and export trades via the interconnections.[47] Nonetheless,market coupling is an implicit auctioning concept as there is no separate bidfor transmission capacity. The characteristics of FMC are outlined in [48].FMC is designed to be able to coexist with forward energy markets and explicittransmission capacity markets.
Although, ETSO and EuroPEX agreed on FMC as one way of cross-bordercongestion management, the proposal provides a list of still outstanding issues,such as the development of a simplified transmission model and its consequences,the development of the coordinating algorithms, the definition of performancemeasure etc.[48]
A discussion on the formulation of algorithms and the adaption of marketsplitting in the highly meshed European network can be found in [49]. Specialattention is paid to the integration of transmission bids into the concept, as “atshort term time horizon, day-ahead for instance, energy spot market and bilat-eral trade compete to use the short term slice of transmission facilities throughcongested networks.”[49] The report concludes, that “Transmission bids can
21

be included in a market splitting process17.”[49] The report also provides analgorithm formulation of market splitting (coupling) using a centralized opti-mization routine. The objective is to maximize social welfare, subject to zonalpower balance constraints, interface power flows and generation limits. A de-scription can be found in [49]. The algorithm is derived from the assumption ofa centralized process with all data being available and one entity being responsi-ble for operation. As in [48] the implementation of the algorithm as distributedprocess remains an outstanding issue. For the implementation of the concept incontinental Europe remain, “a number of physical, structural and market basedobstacles”[49], such as a highly meshed network where the location of congestedlines may change, the interdependency of net transmission capacities and mar-ket participants trading bilaterally (OTC-trade). Furthermore, the general roleof power exchanges and transmission system operators has to be clarified.
In [48] the need for a regulatory/contractual framework is pointed out, whichincludes “multilateral arrangements between power exchanges to govern the useof cross-border capacity”, as well as, “multilateral arrangements between TSOsto calculate the capacities and flow distribution factors (including the setting upof any central service providers)”. The proposed framework allows the coexis-tence of power exchanges and transmission system operators, which is differentfrom the restructuring developments of the US East Cost, where a pool opera-tor fulfils both functions. A market design with coexisting power exchange andtransmission system operator was to be found in the initial Californian market.Both entities were limited in their interactions to a few iterations “in a more orless ad hoc way”[47]. If the interaction between PXs and TSOs are carried outin a similar manner, “then the same difficulties with congestion managementthat occurred in California might also happen in Europe.”[47] Thus, the authorsin [47] conclude: “The vagueness of the current text from EuroPEX [...] makeit impossible to conclude. Europeans can still choose to go one or the otherdirection.”
Conclusion
The three above presented interarea CM concepts all assume that the electric-ity markets of the Member States are different in a way that integration is notpossible.[47] The proposals try to account for this situation by explicitly con-sidering these structural differences. Nonetheless, to the best knowledge of theauthor, precise information on implementation, such as algorithm formulation,the specification of market rules, transactions involved and necessary mutualagreements is not available so far.
Explicit auctioning is currently used at several European borders, but isclaimed to not incorporate parallel flows in the highly meshed European system.[46] Auction practice is diverse[45] and forces market participants to considervarious separate transactions in energy and transmission markets.
Coordinate auctions and flow-based market coupling are intended to over-come the drawbacks of explicit auctioning, as both methods head towards aunified CM regime in Europe, and thus, may facilitate the creation of the Inter-nal Electricity Market (IEM). However, the European proposals for CM departfrom the nodal pricing concept, which is suggested by FERC as standard marketdesign, and may be considered “as benchmark system in the United States”.[47]A detailed assessment of coordinated auctions and flow-based market couplingappears difficult as long as the approaches remain specified in a rather con-ceptual way. Nonetheless, in [50] it is noted that markets, where energy andtransmission markets, such as Texas and California were not integrated conges-tion cost appeared to be high. This argument may be used in favor of implicitapproaches, such as nodal pricing and market coupling (splitting). Future re-search may incorporate the formalization of the ETSO and EuroPEX proposals,
17By the time of publication in 2002, the proposed concept was referred to as marketsplitting
22

i.e. the formulation of possible algorithms and the simulation of these algorithmswith respect to different network topologies and market structures.
3.4 Capacity Alleviation Methods
3.4.1 Introduction
In section 3.2 capacity alleviation methods and allocation methods were distin-guished. Whereas the latter aim at ex-ante capacity allocation in the day-aheadstage, alleviation methods are often used to relieve congestion in real-time andare also referred to as remedial actions. As the focus of this report is ratheron allocation methods than on capacity alleviation, the analysis is restricted toredispatching and counter-trading, as considered in [41].
3.4.2 Redispatching
Above it was outlined that redispatching may be used in conjunction with uni-form marginal pricing. In a first phase, market participants are not notifiedof congestion and energy is traded as if there were no network constraints. Ifcongestion occurs, the system operator alters the generation (load) pattern inorder to relieve congestion. Redispatching is exercised as command and controlscheme, i.e. the ISO curtails or increase injections without market-based incen-tives. Redispatching may also be used among different TSOs, which makes closecoordination necessary. As generators have to be reimbursed, the ISO has anincentive to keep redispatch cost low. An algorithm formulation can be foundin [42].
3.4.3 Countertrade or Buy-Back Procedure
“Countertrading is based upon the same principles as redispatching”[41], butmay be considered market-oriented. Rather than applying command and controlthe ISO will buy and sell electricity at prices determined by a bidding process.“The principle of counter-trading is thus a buy-back principle which consistsin replacing the generation of one generator ‘ill-placed’ on the grid as regardsthe congestion by the generation of one ‘better-placed’ producer.”[51]. Differentfrom market splitting, within the countertrade or buy-back model the marketparticipants only see one uniform price (apart from the participants involved inthe countertrade procedure). Equilibrium points of the day-ahead phase remainunchanged. As the ISO has to buy electricity downstream of the congestion athigher cost and sell it upstream, there is no congestion rent, but congestion costfor the ISO. This cost exposure is also regarded as in incentive for investmentinto grid capacity.[52] Countertrading is used for real-time congestion relief inthe Norwegian system and is used as exclusive CM concept in the Swedishmarket.
3.5 Conclusion
This chapter provided an overview of generic market structures and conceptsfor congestion management. CM concepts were distinguished into capacity allo-cation and alleviation concept, where the latter are mainly applied for real-timecongestion relief. Allocation methods may be differentiated in several ways18,
18CM concepts may be also grouped into explicit and implicit approaches. Explicit ap-proaches establish two markets, one for energy and one for transmission. Hence, marketparticipants have to take transactions in both markets. Implicit auctions integrate the mar-kets for energy and transmission. Thus, capacity is allocated implicitly by energy bids at aspecific location within the network.
23

above an organization into nodal pricing, zonal (area) pricing and uniform pric-ing was proposed. The characteristics of the concepts have been outlined to-gether with their possible implementation in conjunction with certain marketdesigns. All CM concepts are currently used in electricity markets worldwide.Thus, the next chapter aims at providing an overview of international electricitymarkets focussing on congestion management.
24

Chapter 4
Implementation ofCongestion ManagementConcepts in DifferentMarkets
This chapter aims at providing an overview of congestion management method-ologies implemented in various electricity markets worldwide. The structurefollows the organization of the previous (conceptual) chapter. At first the im-plementation of nodal pricing models is discussed followed by a section on zonalpricing systems. A summary of uniform pricing models and auction implemen-tation concludes the survey.
4.1 Nodal Pricing Models
4.1.1 Introduction
A prerequisite for the implementation of nodal pricing models is the integrationof functions related to market and network operation. Thus, nodal pricingmodels are connected to market designs derived from the pool concept. A centralauthority (the ISO) operates day-ahead, real-time and financial markets byobeying network constraints. However, a mandatory pool, where only financialbilateral transactions are allowed is not compulsory. Within the markets ofthe US East coast it is possible to settle into physical bilateral contracts (self-scheduling) and/or to trade through the pool, as long as the ISO is notified ofthe agreed physical bilateral transactions. The FERC standard market designis based upon this structure. Currently, the PJM, the New York, the NewEngland and the new Californian market rely on this structure. These marketsare described briefly below.
4.1.2 Pennsylvania-New-Jersey-Maryland Interconnection(PJM)
Structural Data
In [7] it is claimed “that PJM operates the world’s largest competitive electric-ity wholesale market.” The PJM market covers all or parts of Pennsylvania(PA), New Jersey (NJ), Maryland (MD), DE, OH, VA, WV and the District ofColumbia.[7] According to [36] there are 2400 buses and 4000 branches. Morethan 140 market participants and 80 transmission service customers trade about8 TWh per month. Energy is produced by 540 sources, consisting of 31% Gas,
25

21% Oil, 37% Coal, 21% Nuclear, 5% Hydro - 1% of the energy originates fromother sources.[53] The PJM market operates as power pool which offers unitcommitment and dispatching services to its members. Nonetheless, biddinginto the pool is voluntary. Market participants may also opt for self-scheduling.
Historical Development
1956 five signatories agreed to coordinate operations and planning as the PJM(Pennsylvania-New Jersey-Maryland) Interconnection.[18] This organization maybe regarded as an early example of a power pool. In 1997 PJM started the“first regional bid-based energy market in the US”.[36] At this time a uniformmarginal pricing system was introduced, which was soon replaced by a nodal orlocational marginal pricing system, which is still operational. In April 2002 PJMWest joined the marketplace. Thus, two separate control areas now operate un-der a single energy market.[7] These areas are the largest centrally dispatchedcontrol areas in North America.[36]
Market Operation and Congestion Management
PJM operates two markets: a day-ahead market and a real-time balancingmarket. The day-ahead market is voluntary and offers unit-commitment anddispatching services to its participants. Nonetheless, participants may also optfor self-scheduling, and thus, only notify the pool operator about their physicaltransactions. Transactions in the day-ahead market are binding. This appliesalso to bilateral transactions which thus can be scheduled at binding congestioncharges1. A system of financial transmission rights (FTRs) provides hedgingopportunities in order to manage the risk imposed by the volatility of nodalprices.
The real-time market as the day-ahead market relies on nodal prices. LMPsare calculated based on the system operating conditions as described by the PJMstate estimator.[7] Since the implementation of the current market structure in2000 there was a strong connection between day-ahead and real-time prices. Inthe last years the difference has been constantly narrowing. The convergencebetween day-ahead and real-time prices may serve to some degree as indicatorfor an adequate market performance. The average day-ahead LMP in 2001 wasU.S. $32.75/MWh and the average real-time LMP was U.S. $32.28/MWh.
Conclusion
The PJM market may be claimed as performing adequately since the implemen-tation of the current LMP-based market structure.[7, 36] In [54] it is stated, that“Almost everyone agrees that experiences with LMP-based congestion man-agement, in markets where it has been implemented, have been fairly suc-cessful.” This performance may have influenced other East Cost markets toimplement nodal pricing systems, such as New York and New England. Infact, the standard market design of the Federal Energy Regulatory Commission(FERC)2relies to a great extend on the PJM design.
4.1.3 FERC Standard Market Design
In 2002 FERC published a white paper on a proposed standard market design(SMD) for electricity markets in the US. This SMD is close to the market designof the PJM interconnection[55], although it features distinct elements. The listbelow is extracted from [54] and [55] and specifies the most important designelements of the SMD.
1The congestion charge is defined by the difference in nodal prices2FERC is an independent agency that regulates the interstate transmission of natural gas,
oil, and electricity. FERC also regulates natural gas and hydropower projects.
26

• Market participation is voluntary
• Provides ability for self-scheduling
• Mandated day-ahead markets for energy using centralized unit commit-ment
• Locational marginal pricing (LMP)-based congestion management withfinancial rights to hedge transmission price risks
• Rules for market power mitigation
All elements listed above can be found in the markets in New York, New Englandand PJM. Additionally, the following design features are proposed for SMD:
• Spinning reserve market
• Marginal losses included in prices
• Electronic dispatch signals sent every 5 minutes
• Automated market power mitigation procedures
The above design elements may be “viewed as a guide on how to establish awholesale market mechanism that can bring the benefits of competition to allconsumers.”[54] Furthermore, “SMD should not be viewed as prescription fromFERC but rather a reflection of collective wisdom in the industry based onexperiences in real markets that have been operating for some time.”[54] Thisviewpoint on SMD explains why the market design relies on the key elements ofthe PJM market. Thus, the intention of SMD is rather to use knowledge gainedby market operation in the past, than to develop a completely new scheme. Thetransition of the California market from a zonal to a nodal pricing approach maybe viewed as a sign that SMD has been influential for market developments inthe US. Additionally, ERCOT - the Texas interconnection formed the so calledTexas Nodal Team in order to design a nodal market that adheres to SMD.
4.1.4 New York (NYPOOL) and New England (NEPOOL)
The above section outlined the main characteristics of the PJM market andthe standard market design (SMD) proposal of FERC which is - in its centralelements - build around the PJM concept. This concept was also influential forother US markets, such as New York and New England. As the concepts arevery similar, a comparison of the markets is provided in the following , featuringtwo main sections: a) structural data and b) market design.
Structural Data
Table 4.2 provides an overview of the generation mix in different US markets.PJM, NEPOOL, NYPOOL and California (will) operate a market close to theSMD recommendations. The fuel mixes in all four markets differ significantly.In this regard one may conclude that the fuel mix can not be identified as keydriver for the introduction of locational marginal pricing.
Table 4.1 summarizes the key facts of the NYPOOL, NEPOOL and PJM.While NEPOOL and NYPOOL are rather similar in size, PJM covers an areawith a population twice as large. Furthermore, the number of generationsources, the installed capacity exceeds by far the numbers of NYPOOL andNEPOOL. Thus, it appears difficult to identify key drivers from a structuralviewpoint. Market size, i.e. installed capacity as well as the total length oftransmission lines vary significantly. Nonetheless, LMP was identified as ef-ficient congestion management scheme in all three markets. From the PJMexperience one may conclude that even in a system with 2400 buses and 4000branches the computational requirements can be met to allow for an efficientmarket operation.
27

New York PJM New England
Population 19 million 51 million 14 million
Market Participants 200+ 200 200+
Generators 350+ 1082 350+
Installed Capacity 36 GW 163 GW 32 GW
Peak Demand 31 GW 131 GW 26 GW
Transmission Lines 11000 miles 56070 miles 8000 miles
Table 4.1: Market Key Facts
PJM NEPOOL NYPOOL California
Gas 31% 32% 90% 46%
Oil 21% 28% 74% 1%
Coal 37% 9% 0% 0%
Nuclear 21% 16% 0% 9%
Hydro 5% 12% 1% 23%
Other 1% 2% 0% 21%
Table 4.2: Fuel Mix in Some NERC Regions [53]
Market Operation and Congestion Management
Table 4.3 summarizes the key design elements of NEPOOL, NYPOOL and PJM.As outlined above the markets exhibit similar characteristics as all are builtaround the SMD proposal. One main difference in congestion management andpricing is that in NEPOOL and NYPOOL loads are aggregated into zones,whereas generators are paid nodal prices. Additionally, in the New York areathe ISO operates an hour-ahead market which is not present in the PJM andNew England area. However, the differences in market design can - to the bestknowledge of the author - not be referred to structural features.
4.1.5 California
The Californian electricity market has received worldwide attention, especiallythe energy crisis in 2000 and 2001 has been subject to numerous publica-tions.(See for example [57, 58, 59, 60, 61, 62, 63]) During the energy crisisprices rose to levels ten times higher than usual, so called ‘rolling blackouts’were experienced and one major utility filed for bankruptcy. For the energycrisis several factors have been identified which are extensively discussed in[57, 58, 59, 60, 61, 62, 63]. This report focussed on factors related to marketdesign, as “the decentralized and zonal market design was perceived as one ofthe factors that contributed to the energy crisis.”[58] Although, a zonal CMconcept was initially applied, the Californian market is discussed within thenodal pricing models as California is soon to transition from a zonal to a nodalframework.[58] Thus, this section describes the key facts related to market de-sign and development, it provides major structural data and summarizes theefforts for the implementation of a nodal pricing system.
Historical Development
The early 1990’s in California are characterized as a period of economic recessionwith electricity prices being 50 percent higher than the national average.[62] Cal-
28

New York PJM New England
Number of Markets Day-ahead,hour-ahead and
real-time
Day-ahead andreal-time
Day-ahead andreal-time
Market Products Locational energyplus four ancillary
services
Locational energyplus regulation and
spinning reserve
Locational energy plusregulation and spinning
reserve
Locational ReservePricing
Yes No No
Energy bids 3-part 3-part 3-part
Day-ahead unitcommitment
Voluntary, central Voluntary, central Voluntary, central
CongestionManagement
Nodal for generation,zonal for load
Nodal for generationand load
Nodal for generation,zonal for load
Losses Marginal Average Marginal
Integration of Markets Yes Partial Partial
Installed CapacityRequirements
Yes Yes Yes
Table 4.3: Comparison of Markets among Northeastern ISOs [56]
ifornia was lacking new significant generation investment proposals and “largecustomers were complaining” about price levels.[62] Furthermore, “other sectorsof the economy like trucking and telecommunications, appeared to be benefitingfrom less reliance on traditional regulation in favor of more reliance on marketforces.[57] Thus, the state was “looking for opportunities to bolster its compet-itive climate [...], it seemed eminently sensible to at least consider the idea ofelectricity restructuring at this time.”[57]
In 1992 California initiated a planning period, with the so called Yellow Bookand Blue Book phases. The Yellow Book was intended to serve as basis for di-alogue between all involved parties and did not specify market implementationissues in detail. The Yellow Book included four different strategies, with onestrategy named ‘D’ proposing a “Restructured Utility Industry”. This strategyserved as basis for the blue book “to lead to direct access of Californian elec-tricity consumers to generation suppliers, marketers, brokers and other serviceproviders in the competitive marketplace for energy services.”[57] Influencedby a commissioners’ visit to the UK, the blue-book proposal was favoring aspot-market pool, forcing all generators to sell their power into this pool. Theproposal stimulated a strong opposition, with advocates of free markets votingfor a more decentralized system relying on bilateral trade. The discussion endedin a compromise with all utilities being forced to sell their power via a centralpower exchange (PX) and the formation of a Californian Independent SystemOperator (CAISO) which would operate a market for ancillary services and abalancing market. In contrast with, e.g. the PJM system, CAISO would notbe responsible to centrally commit and dispatch units. Spot market operationwas the responsibility of the PX, whereas functions related to system operationwere carried out by CAISO. This separation of market and system operationmay be regarded as key difference of the market design advocated by PJM,NEPOOL and NYPOOL. Although utilities had to bid into the PX, and thus,major generation resources were pooled, the Californian market was not a poolmarket following the understanding of the structure, e.g. in the PJM market.In order to ensure liquidity of the PX spot-market, utilities were not allowed tohedge into bilateral contracts, neither physical nor financial.
29

The initial Californian market design may be summarized by the followingfeatures:
• Separation of spot-market and system operation resulting into the creationof a power exchange and an independent system operator
• Prohibition of bilateral contracts to force utilities to trade all their energythrough the PX
• Implementation of a zonal congestion management concept
The last item will be examined in more detail in the next section.
Market Operation and Zonal Congestion Management
Essentially, two entities were formed to facilitate electricity trade. The Cali-fornia Power Exchange (PX) and The California Independent System Operator(CAISO). With the separation of service related to market and system opera-tion, the appliance of a nodal pricing concept was not feasible. Generation unitswould self-dispatch themselves, i.e. scheduling coordinators (SCs) would be re-sponsible for balancing the schedules of a group of market participants. ThePX may be seen as operating a ‘raw’ market for electricity[57], not taking intoaccount that energy has not only to be generated but also delivered. The balanc-ing of generation and demand as well as congestion management and providingancillary services was the responsibility of CAISO. For congestion managementmarket participants had to provide adjustment bids (inc/dec bids), stating forwhich price they are willing to increase/decrease generation/demand. Thesebids - along with the “raw” energy bids where submitted to the PX. After thePX stated the market clearing price and quantities, it forwarded the marketresults along with the adjustment bids to CAISO. CAISO then run compu-tations on whether the market outcome was feasible within the limits of thetransmission network without or with adjustment. In the latter case CASIOwould use the submitted adjustment bids to relief congestion by altering theinitial generation dispatch.
In the Californian transmission system congestion frequently occured on thetie lines between north and south.[57] Thus, initially two transmission zoneswere defined in order to relief inter-zonal congestion through a zonal congestionmanagement model. Proponents of the zonal model, claimed this concept tobalance equity concerns with efficiency goals.[58] Market participants would notface the complexity of nodal pricing concepts, and thus, energy trade would befacilitated being more transparent while effectively unbundling generation andtransmission. In California the congestion charge between the two zones wasdefined by the adjustment bids used for congestion relief. If there is conges-tion from north to south, the “cheapest available southern generation would berequired to produce more power, and the most expensive running northern gen-erators to produce less.”[57] The use of adjustment would determine differentzonal prices, with the difference of zonal prices defining the congestion chargeto be paid by the scheduling coordinators.
In contrast with inter-zonal congestion management, the cost for intra-zonalcongestion relief were covered by an uplift charge. This practice founded onthe assumption “that intra-zonal congestion is infrequent and insignificant (interms of financial consequences).”[58] However, the proportion of intra-zonaland inter-zonal congestion cost shifted significantly from 2002 to 2003 (see table4.1.5). One cause for the cost-shift is the installation of new generation “outsidemajor load pockets mostly in Southern California coupled with new generationat the California/Arizona/Nevada border.” This new load flow pattern withits financial consequences is obviously stimulating the transition process from azonal to a nodal congestion management concept.
30

2002 2003
Inter-Zonal $24,639,084 $25,684,132
Intra-Zonal $4,327,625 $46,536,772
Table 4.4: Congestion Cost Comparison for 2002 and 2003
Proposed Nodal Pricing Approach
Already after the energy crisis in 2000 and 2001 CAISO was assigned the func-tions of day-ahead spot-market and system operation, as the former separationwas identified to contribute to high electricity prices as well as high price volatil-ity. This merge of functions is now concluded by the introduction of a nodalpricing model together with FTRs. With the integration of market- and system-related services, CAISO has the possibility to carry out a security constrainedunit commitment (SCUC) and a subsequent centralized dispatch, which notonly schedules generation, but also provides locational marginal prices. Thus,the introduction of a nodal pricing system is not only a change in congestionmanagement but also in market organization. Following the recommendationsby FERC and the experience made in the PJM, NEPOOL and NYPOOL sys-tems, California is about to migrate to a more centralized market design buildaround the pool concept.
Conclusion
The example of the California market has shown, that an evolution from azonal CM concept to a nodal may become necessary if intra-zonal congestioncost rise, and thus, it is no longer possible to provide efficient economic signalsand to ensure reliable system operation. Moreover, the change in congestionmanagement occurred together with a change in market design. The initialdecentralized design is going to be substituted by a centralized concept. Thedevelopment of the Californian market seems to have significant impact on thegeneral view of market organization in the US. The Californian market evolutionrather than structural key drivers may have driven the proliferation of locationalmarginal pricing together with a pool-based market design.
4.1.6 Singapore and Ireland
Above the key features of several US markets have been characterized. Thenew Californian market, the PJM interconnection, New England and New Yorkrely on locational marginal pricing for congestion management. All systemsare build around a pool-based concept, and thus, integrate functions related tomarket and system operation. The current electricity market in Singapore andthe upcoming Irish market follow the same design principles, only exhibitingone major difference: physical bilateral contracts are not allowed. Market par-ticipants may only settle into financial hedging contracts. Thus, the Singaporemarket[64] and the planned Irish market[65] may be seen as mandatory pool-markets, where all energy has to be traded through the pool. Subsequently, theISO is in charge of clearing the market by obeying network constraints. Froman implementation viewpoint, this design reduces transaction complexity for theISO as no physical bilateral contracts have to be taken into account for the unitcommitment and dispatch, but market participants are still able to hedge riskby settling into financial contracts. In both markets locational marginal pricesare/will be used for congestion management. The implementation is straight-forward and follows the principles outlined for nodal pricing and its appliance,e.g. in the US East Cost markets.
The Singapore market is claimed to perform solidly,[66] and has helped con-sumers through lower electricity tariffs resulting from efficiency gains in gener-
31

ation and transmission companies.[66]
4.1.7 Conclusion
Above international electricity markets have been characterized, which are allbuild around the concept of pool markets. Nodal pricing is strongly connectedto this concept, as locational marginal prices require at a certain time stagethe use of a central optimization routine. Nonetheless, pool markets relying onnodal pricing do not necessarily exclude physical bilateral trading. The US EastCost markets and the proposed FERC standard marked design explicitly allowfor physical bilateral transactions by using nodal prices and financial transmis-sion rights. As market participants have to notify the pool operator about theirphysical transactions, the operator is able to take the physical portfolios intoaccount while committing and dispatching generation. In compliance with gen-eral market rules, bilateral transactions pay the difference in nodal prices astransmission charge.
In the US the integration of functions relating to market operation and thetransmission system may have been stimulated by the collapse of the Californianmarket, where both functions were assigned to separate entities. The integrationis (among others) advocated by Hogan, who claims the pool dispatch and thetransmission wires to be distinct essential facilities.[28] From a structural view-point, i.e. network topology and generation mix, it appears difficult to identifykey drivers for the introduction of nodal pricing. The generation mix in theareas of PJM, New England, New York and California are very heterogeneous.
However, the Californian case has shown, that a market may develop froma zonal to a nodal system, if intra-zonal congestion cost rise during marketoperation, i.e. cost for intra-zonal congestion relief exceed the cost for inter-zonal congestion relief. Thus, in a topology where congestion is likely to occur atdifferent locations within the network a nodal pricing system may perform moreefficient than a zonal system as one prerequisite for a zonal system is an a prioridefinition of the zones which intra-zonal price differences being neglectable.
4.2 Zonal Pricing Models
4.2.1 Introduction
Section 3.3.2 introduced the principles of zonal pricing which is also known asarea pricing, where in case of congestion the market is split in different pricezones (areas). In contrast with nodal pricing, zonal pricing does not requirea centralized dispatch, market participants may self-schedule themselves. Pro-ponents of zonal pricing, claim the system to balance equity concerns withefficiency goals.[58] Market participants would not face the complexity of nodalpricing concepts, and thus, energy trade would be facilitated being more trans-parent while effectively unbundling transmission and generation. The next sec-tions focus on two implementation examples: Norway and Nord Pool and Aus-tralia.
4.2.2 Norway and Nord Pool
The Scandinavian countries share a long history of collaboration in the powersystems sector. In January 1996, Norway and Sweden, formed a common elec-tricity market. Finland joined in 1998 and western and eastern Denmark in1999 and 2000. The central Scandinavian market place is Nord Pool, whereday-ahead, real-time and financial markets are operated. Within Norway andDenmark as well as between border interconnection market splitting is used ascongestion management concept. In case of congestion different prices apply tothe different countries or to the different areas within the countries. The price
32

areas in Norway are called NO1 and NO2, basically they divide the Norwegianpower system into a northern and southern part. The splitting involves NordPool as responsible spot-market operator and the respective national systemoperators. In Norway for instance, Nord Pool passes the day-ahead clearing in-formation to Statnett (the Norwegian transmission system operator). Statnettthan decides if market splitting is necessary.[67] The process follows the generalprinciples outlined in section 3.3.2.
“Bilateral contracts that span price areas must sell the energy in the supplyarea and purchase energy in the load area to account for the contribution to con-gestion, and to expose the contracts to the financial consequences of congestion.It is the only instance of mandatory spot market participation.”[67]
To hedge the risk implied by different area prices, contracts for differencesare used, where the CfDs3 used in the Scandinavian market explicitly considerthe spatial differentiation of prices. The Scandinavian CfD is defined by thedifference between the system price and the respective area price multiplied bythe contract volume. In [67] it is outlined that CfDs have similarities with fi-nancial transmission rights. While FTRs are used e.g. in the US markets toredistribute the congestion rent collected by the system operator, the Scandi-navian CfDs “have no connection to the congestion rent [...].”[67]
Market splitting in the Scandinavian market is used in the day-ahead phase. Forcongestion relief at real-time counter trading is applied. The implementation ofcounter trading in Sweden is described in section 4.3.3.
4.2.3 Australia
Australias national electricity market started in December 1998. For mar-ket operation The National Electricity Market Management Company Limited(NEMMCO) was founded. NEMMCO’s responsibility is market operation andpower system’s management according to the National Electricity Code.[68]The performance of NEMMCO is supervised by the National Electricity CodeAdministrator (NECA). The Code requires NEMMCO to operate a wholesalespot market, where “NEMMCO must operate a central dispatch process todispatch scheduled generating units, scheduled loads, scheduled network ser-vices and market ancillary services in order to balance power system supplyand demand”.[68] In that, the Australian market is similar to the pool conceptof US markets, Singapore and New Zealand. NEMMCO operates the marketin five minute intervals. For every interval a dispatch is carried out, takinginto account “any constraints on [...] scheduled generating units, schedulednetwork services, scheduled loads, ancillary service generating units or ancillaryservice loads which may result from planned network outages.”[68] Furthermore,“NEMMCO must represent intra-regional network constraints and inter-regionalnetwork constraints as inputs to the dispatch process.” Thus, it would be the-oretically possible to apply a nodal pricing system. However, the Australianmarket is run as zonal system. “For the purpose of conducting the spot mar-ket, the market is to be divided into regions recommended by NEMMCO andapproved by NECA”[68] Instead of differentiating prices for every node in thesystem, regional reference nodes are defined. This reference nodes representfive pre-defined zones, being The Queensland, New South Wales, Victoria andSouth Australia. The rent NEMMCO collects through the difference in zonalprices is called inter-regional settlement residue and is distributed among mar-ket participants by the conduct of an auction. “The auction process providesa mechanism for establishing the market value of the residue, and encouragesinter-regional trade by providing registered generators, market customers andtraders with a mechanism to manage the risk associated with different price
3Generally, contracts for differences may hedge temporal risks (as in the UK) or spatialrisks (as in Scandinavia).
33

outcomes between trade regions.”[69].Although Australia and Scandinavia both rely on zonal prices, the system
applied in Australia differs significantly from the market splitting procedure ofScandinavia. Zonal prices in the Australian market are the outcome of a centraldispatch procedure, where regional reference nodes are defined to represent fivezones within the network. In contrast to this centralized computation procedure,zonal prices in Scandinavia are not the outcome of a dispatch process. Thus,Australia and the Nordel System may be seen as two contrasting solutions tozonal pricing. The Australian system relies on the advantages of a centralizedmarket design, while aggregating the transmission system into reference nodes.This simplification may be beneficial for transparent trading. Nonetheless, theScandinavian system benefits from a more decentralized market organization,which provides more freedom to market participants.
4.2.4 Conclusions
Zonal pricing is efficiently applied for the Australian as well as for the Scandina-vian electricity market. In Scandinavia in case of congestion the market is splitinto different price areas, while through arbitrage trading the interconnectioncapacity is utilized up to its maximum. Although, zonal pricing does not requirecentralized unit commitment and dispatch, Australia follows an approach werezonal prices are the outcome of a central dispatch procedure. Both systemsperform adequately, where the different market design options provide differentopportunities for market participants. Nonetheless, considering a zonal pricingsystem in Europe would require spot-markets within every market area or onecoordinated spot market for whole Europe regardless of the chosen implemen-tation scheme.
4.3 Uniform Pricing Models
4.3.1 Introduction
Uniform pricing models are in place in Sweden and Finland, UMP was alsoimplemented in the electricity Pool of England and Wales. UMP models seemto attract less research as several drawbacks are associated with the pricingsystem as outlined in section 3.3.3. Generally, UMP appears only appropriate inmodels with insignificant congestion problems. Implementation issues of UMPare described in the sections below, focussing on England and Wales and Sweden.
4.3.2 England and Wales (Pool Design)
The UK electricity market was liberalized in 1990 in an effort to privatize theelectricity industry and to introduce competition. The model was often referredto as pool-market, as all energy was ‘pooled’ in a single market place. Gener-ators bid to the Pool and a scheduling algorithm would perform a merit-orderdispatch. The algorithm did not take into account network constraints. Themarket was treated as one price area. Thus, the UK pool market was basedupon uniform marginal pricing as described in section 3.3.3. In the marketdispatch phase (day-ahead) market participants are not notified of congestion,congestion is relieved in the so called congestion relief (CR) phase. The costof congestion relief were recovered through an uplift payment, which in [44] isclaimed to be “the least sophisticated part of the Pool’s pricing arrangements.”This assessment is based on the general drawbacks of uniform marginal pricingmodels as outlined in section 3.3.3. UMP fails to set locational incentives forgeneration investment. Furthermore, the cost of congestion relief are rolled-ininto a flat-rate (the uplift), and thus, do not differentiate between the contribu-tion of individual generators. A detailed treatment of the uplift, focussing on
34

the components, its calculation and cost developments can be found in [44]. Toovercome the problems associated with congestion management and pricing aswell as with general market design, the Pool design was replaced in March 2001by the New Electricity Trading Arrangements (NETA).[70]
4.3.3 Sweden
Section 4.2.2 introduced market splitting as day-ahead congestion managementconcept in Norway and the Nord Pool market. Nonetheless, for intra-zonalcongestion relief and real-time operation Norway relies on the counter tradingprinciple, which may seen as market-oriented form of redispatching as describedin conjunction with the uniform pricing model. In contrast to Norway, Swedenis solely relying on the counter-trade principle as CM concept. The system op-erator purchases up- or down-regulation according to the bids in the regulatingmarket. In the market dispatch phase (day-ahead) market participants are notnotified of congestion, congestion is relieved in the so called congestion relief(CR) phase. The same system is applied in Finland. In both countries theconcept has proven to be adequate.[67] Nonetheless, uniform marginal pricingexhibits several drawbacks as outlined in section 3.3.3. UMP fails to providelocational signals for investment into generation. In Sweden these incentives areprovided by a connection charge to the grid which is differentiated geographi-cally. As major load centers are in the South of Sweden, connection charges forloads in the south are higher than in the North, whereas charges for generationin the South are lower to set an incentive for investment.
4.3.4 Conclusion
UMP is used only by a few countries worldwide, which have no substantial con-gestion problems within the transmission system, and thus, the system operatorcan limit its action to congestion relief through counter trading. In Sweden thelack of incentives is compensated by geographically differentiated connectioncharges. For networks, where congestion is likely to occur a locational marginalpricing system appears more suitable. In that case cost for congestion reliefcan be allocated more efficiently, as they are not rolled-in in an general upliftcharge but are computed according to congestion contribution. The impreci-sion in cost attribution may have influenced the UK market to introduce a newmarket design.
4.4 Auctioning of Transmission Capacity
Explicit Auctioning of transmission capacity as described in section 3.3.4 is cur-rently used in several European countries for allocation of transmission capacityon interconnectors. [45] provides a comprehensive overview on specific imple-mentations for several European borders, such as the tie lines between Germanyand the Netherlands, Germany and Denmark, France and the United Kingdom,the United Kingdom and Ireland. The diverse use of explicit auctions suffersfrom several problems, such as increased transaction complexity for market par-ticipants, increased complexity for trade involving several interconnections aswell as the insufficient consideration of loop flows within the European net-work. These drawbacks initiated research by ETSO and EuroPEX to proposea comprehensive and unified method for the advancement of a truly internalEuropean electricity market. Coordinated auctioning and market coupling havebeen characterized in section 3.3.4. These methods have not been applied sofar. Thus, implementation examples can not be provided.
35

4.5 Conclusion
The above chapter provided an overview on the implementation of CM schemesin several international markets. It has been outlined that CM exhibits a strongdependence on overall market design. Pool concepts with an integrated entitybeing in charge for market as well as network operation mostly use nodal pricingschemes for capacity allocation and alleviation. However, the Australian markethas shown that with a pool market design zonal pricing is as well possible.In contrast to locational marginal pricing, market splitting does not requirea centralized dispatch. Thus, it facilitates to a larger extend the idea of freetrade. Nevertheless, a common spot market is needed for the implementation.A prerequisite for zonal pricing is an a priori definition of transmission zones. Incase of locational changes in the congestion pattern, nodal pricing may performmore efficiently.
36

Chapter 5
Comparison of CongestionManagement Concepts
This chapter concludes the report by briefly summarizing the main characteris-tics of CM concepts. The comparison aims at showing the dependency of marketdesign and congestion management.
The preceding chapters have shown that congestion management concepts arestrongly connected to overall market design. Generally, markets may be struc-tured ranging from centralized approaches (e.g. pool-based designs) to moredecentralized structures, relying more on self-commitment and bilateral trade.Figure 5.1 depicts the scope of organizational solutions for congestion man-agement. Nodal pricing schemes require a centralized dispatch, and thus, areapplicable in pool-based markets. Market splitting ranges in between nodal andauctioning concepts. It does not require a centralized dispatch, although a spotmarket is necessary for implementation. Decentralized concepts such as explicitauctions for transmission capacity allow diverse solutions such as the auction atEuropean interconnectors.
centralizeddesign
decentralizeddesign
nodalpricing
zonalconcepts
auctioningconcepts
Figure 5.1: Market Design and Congestion Management
The theoretical discussion as well as the description of international electricitymarkets has revealed, that no general recommendations for congestion manage-ment can be given. Certain network topologies, demographic factors and politi-cal dialogues influence the implementation of CM concepts in conjunction withoverall market design. Key drivers for the implementation of specific conceptscould not be identified. The US markets show that nodal pricing can be success-fully applied to markets with heterogenous structural features. Other marketsrelying on nodal pricing are New Zealand, Singapore and Ireland. Zonal pricingschemes are implemented at the moment in Australia, the Nordel area, Texasand California. The latter two will soon migrate to nodal pricing as proposedin the FERC standard market design. Middle Europe with its diverse marketstructures and explicit auctioning of transmission capacity has followed a dif-ferent path. Nonetheless, a need for more efficient and effective CM conceptsis indicated in [3], where there seems to be a trend towards more centralizationand standardization in electricity market products. Table 5.1 summarizes theinformation related to CM concept, market design and implementation.
37

Main Characteristics Auctioning InternationalImplementation Examples
Nodal Pricing requires a centralized dispatch, oftenimplemented in pool-based markets,high degree of centralization, FTR
market for hedging
implicit PJM, New England, NewYork, Singapore, Ireland,
upcoming market design ofTexas and California
Zonal Pricing may be implemented using acentralized dispatch (Australia) orusing market splitting (Nordel), in
any case zones defined a priori, Cfdsfor hedging possible
implicit Australia, Nord Pool
Uniform Pricing congestion not taken into account inthe day-ahead phase, redispatch orcountertrading for congestion relief
na Finland, Sweden1, formerEngland and Wales Pool
Explicit Auctioning decentralized auctioning oftransmission capacity
explicit some Europeaninterconnections
Table 5.1: Summary of Congestion Management Concepts
A genuine Thilo Krause product.
1Although Sweden uses an UMP system, incentives are provided by the geographical dif-ferentiation of connection charges as described in section 4.3.3.
38
Bibliography
[1] M. Vignolo and R. Zeballos, “Transmission Networks Or Distributed Gener-ation?” in Proceedings of the First International Symposium on DistributedGeneration: Power System and Market Aspects, Stockholm, 2001.
[2] L. Ruff, “Stop Wheeling and Start Dealing: Resolving the TransmissionDilemma,” in Electricity Transmission Pricing and Technology, M. Einhornand S. Riaz, Eds. Boston: Kluwer Academics Publisher Group, 1996.
[3] “Analysis of Cross-Border Congestion Management Methods for the EUInternal Electricity Market,” European Commission Directorate-GeneralEnergy and Transport, Tech. Rep., 2004.
[4] G. Gross, et al., “The Uses and Misuses of Optimal Power Flow in Unbun-dled Electricity Markets,” Tech. Rep.
[5] W.-J. Lee, C. Lin, and K. Swift, “Wheeling charge under a deregulatedenvironment,” Industry Applications, IEEE Transactions on, vol. 37, no. 1,pp. 178–183, 2001.
[6] V. Crastan, Elektrische Energieversorgung 2. Berlin: Springer-Verlag,2004.
[7] A. Ott, “Experience with PJM market operation, system design, and im-plementation,” Power Systems, IEEE Transactions on, vol. 18, no. 2, pp.528–534, 2003.
[8] L. Cameron and P. Cramton, “The Role of the ISO in U.S. Electricity Mar-kets: A Review of Restructuring in California and PJM,” The ElectricityJournal, vol. 12, no. 3, pp. 71–81, 1999.
[9] European Power Exchange. [Online]. Available: http://www.eex.de/
[10] Nord Pool. [Online]. Available: http://www.nordpool.no/
[11] Amsterdam Power Exchange. [Online]. Available: http://www.apx.nl/
[12] G. Federico and D. Rahmann, “Bidding in an electricity pay-as-bid auc-tion,” Tech. Rep., 2001.
[13] J. Nicolaisen, V. Petrov, and L. Tesfatsion, “Market Power and Efficiency ina Computational Electricity Market with Discriminatory Double-AuctionPricing,” IEEE Transactions on Evolutionary Computation, vol. 5, no. 5,2001.
[14] N. Fabra, N.-H. von der Fehr, and D. Harbord, “Designing Electricity Auc-tions,” Tech. Rep., 2004.
[15] A. Conejo and F. Prieto, “Mathematical Programming and Electricity Mar-kets,” Sociedad de Estadistica e Investigacion Operativa, Tech. Rep., 2001.
[16] P. Correia, et al., “Application of Microeconomic Metrics in CompetitiveElectricity Markets,” Tech. Rep.
39

[17] M. Bigatto, “Systemtechnische Evaluation unterschiedlicher Marktmodelleeines offenen Strommarkts,” PhD, ETHZ, 2000.
[18] B. Balmat and A. DiCaprio, “The PJM Energy Market (US),” in Proceed-ings of the Transmission and Distribution Conference and Exhibition 2002:Asia Pacific. IEEE/PES, vol. 2, 2002, pp. 1479–1481 vol.2.
[19] P. Centolella. (1996) The Organization of Competitive Whole-sale Power Markets and Spot Price Pools. [Online]. Available:http://www.ncouncil.org/pool.html/
[20] R. Green, “Draining the Pool: the reform of electricity trading in Englandand Wales,” Energy Policy, vol. 27, no. 9, pp. 515–525, 1999.
[21] G. Brunekreeft, K. Neuhoff, and D. Newbery, “Electricity transmission: Anoverview of the current debate,” Utilities Policy, vol. In Press, CorrectedProof.
[22] L. Cameron, “Transmission Investment: Obstacles to a Market Approach,”The Electricity Journal, vol. 14, no. 2, pp. 25–38, 2001.
[23] G. Shrestha and P. Fonseka, “Congestion-driven transmission expansionin competitive power markets,” Power Systems, IEEE Transactions on,vol. 19, no. 3, pp. 1658–1665, 2004.
[24] E. Gnansounou and J. Dong, “Agent-based Model for Market OrientedPlanning of Electricity Generation Expansion,” Swiss Federal Institute ofTechnology, Tech. Rep., 2004.
[25] S. Stoft, Power System Economics - Designing Markets for Electricity.IEEE Press, 2002.
[26] R. Christie, B. Wollenberg, and I. Wangensteen, “Transmission manage-ment in the deregulated environment,” Proceedings of the IEEE, vol. 88,no. 2, pp. 170–195, 2000.
[27] A. Ehrenmann and K. Neuhoff, “A comparison of electricity market designsin networks,” University of Cambridge, Tech. Rep., 2003.
[28] W. Hogan. (1998) Independent System Operator (ISO)For A Competitive Electricity Market. [Online]. Available:http://ksghome.harvard.edu/˜.whogan.cbg.Ksg/
[29] H. Singh, S. Hao, and A. Papalexopoulos, “Transmission congestion man-agement in competitive electricity markets,” Power Systems, IEEE Trans-actions on, vol. 13, no. 2, pp. 672–680, 1998.
[30] T. Parkinson, “Making Bilateral Competition Work,” in Electricity Trans-mission Pricing and Technology, M. Einhorn and S. Riaz, Eds. Boston:Kluwer Academics Publisher Group, 1996.
[31] M. Ilic and F. Galiana, “Power System Operation Old vs. New,” in PowerSystems Restructuring - Engineering and Economics, M. Ilic, F. Galiana,and L. Fink, Eds. Kluwer Academics Publisher Group, 1998.
[32] C. Schaffner, “Valuation of Controllable Devices in Liberalized Electric-ity Markets,” Diss. ETH No. 15850, Eidgenossische Technische HochschuleZurich, 2004.
[33] K. Frauendorfer, H. Glavitsch, and R. Bacher, Eds., Optimization in Plan-ning and Operation of Electric Power Systems. Zurich: Physica-Verlag,1992.
40

[34] R. Green, “Electricity Transmission Pricing - How much does it cost to getit wrong,” Program on Workable Energy Regulation (Power), vol. pwp-058,1998.
[35] I. Perez-Arriaga, et al., “Marginal pricing of transmission services: an anal-ysis of cost recovery,” Power Systems, IEEE Transactions on, vol. 10, no.0885-8950, pp. 546–553, 1995.
[36] X. Ma, D. Sun, and A. Ott, “Implementation of the PJM financial trans-mission rights auction market system,” in Proceedings of the Power Engi-neering Society Summer Meeting, 2002 IEEE, vol. 3, 2002, pp. 1360–1365vol.3.
[37] F. Rubio-Oderiz and I. Perez-Arriaga, “Marginal pricing of transmissionservices: a comparative analysis of network cost allocation methods,”Power Systems, IEEE Transactions on, vol. 15, no. 0885-8950, pp. 448–454, 2000.
[38] F. Schweppe, et al., Spot Pricing of Electricity. Kluwer Academic Pub-lishers, 1988.
[39] M. Rivier and I. Perez-Arriaga, “Computation and decomposition of spotprices for transmission pricing,” Tech. Rep.
[40] S. Stoft, “Fewer Prices Than Zones,” Program on workable Energy Regula-tion (Power), vol. pwp-055, 1998.
[41] L. de Vries, “Capacity allocation in a restructured electricity market: tech-nical and economic evaluation of congestion management methods on in-terconnectors,” in Proceedings of the Power Tech Proceedings, 2001 IEEEPorto, vol. 1, 2001, p. 6 pp. vol.1.
[42] E. Bompard, et al., “Congestion-management schemes: a comparative anal-ysis under a unified framework,” Power Systems, IEEE Transactions on,vol. 18, no. 1, pp. 346–352, 2003.
[43] X. Ma, D. Sun, and K. Cheung, “Evolution toward standardized marketdesign,” Power Systems, IEEE Transactions on, vol. 18, no. 2, pp. 460–469,2003.
[44] R. Green, “The Political Economy of the Pool,” in Power Systems Restruc-turing - Engineering and Economics, M. Ilic, F. Galiana, and L. H. Fink,Eds. Boston: Kluwer Academic Publishers, 2000.
[45] “An Overview on Current Cross-border Congestion Management Methodsin Europe,” European Transmission System Operators (ETSO), Tech. Rep.,September 2004 2004.
[46] R. Audouin, et al., “Coordinated auctioning of cross-border capacity: animplementation,” in Proceedings of the Power System Management andControl, 2002. Fifth International Conference on (Conf. Publ. No. 488),2002, pp. 25–30.
[47] A. Ehrenmann and Y. Smeers. (2004) Inefficiencies in Eu-ropean Congestion Management Proposals. [Online]. Available:http://www.ksg.harvard.edu/hepg/
[48] “Flow-based Market Coupling,” European Transmission System Operators(ETSO) Association of European Power Exchanges (EuroPex), Tech. Rep.,2004.
[49] “Reconciliation of market splitting with coordinated auction concepts- Technical issues,” European Transmission System Operators (ETSO),Tech. Rep., 2002.
41

[50] P. Joskow and J. Tirole, “Merchant Transmission Investment, mimeo,”Journal of Industrial Economics, 2003.
[51] J.-M. Glanchant and V. Pignon, “Nordic Electricity Congestion’s Arrange-ments as a Model for Europe: Physical Constraints or Operators’ Oppurtu-nity,” University of Cambridge Departement of Applied Economics, Tech.Rep., 2002.
[52] I. Wangensteen, “Kraftmarkeder,” Tech. Rep., 2005.
[53] A. Eydeland and K. Wolyniec, Energy and Power Risk Management - NewDevelopment in Modeling, Pricing, and Hedging. Hoboken, New Jersey:Wiley Finance, 2003.
[54] H. Singh, “The Art of Market Design - What’s next for Power Markets andSMD,” Power and Energy Magazine, IEEE, vol. 1, no. 5, pp. 12–14,16,2003.
[55] D. LaPlante. (2002) Standard Market Design in New England. [Online].Available: http://www.ferc.gov
[56] B. Kranz, R. Pike, and E. Hirst, “Integrated Electricity Markets in NewYork,” The Electricity Journal, vol. 16, no. 2, pp. 54–65, 2003.
[57] C. Blumstein, L. Friedman, and R. Green, “The History of Electricity inCalifornia,” University of California Energy Institute, Tech. Rep. CSEMWP 103, 2002.
[58] Z. Alaywan, T. Wu, and A. Papalexopoulos, “Transitioning the Californiamarket from a zonal to a nodal framework: an operational perspective,” inProceedings of the Power Systems Conference and Exposition, 2004. IEEEPES, 2004, pp. 862–867 vol.2.
[59] P. Navarro, “On the Political Economy of Electricity Deregulation–California Style,” The Electricity Journal, vol. 17, no. 2, pp. 47–54, 2004.
[60] J. Bushnell, “California’s electricity crisis: a market apart?” Energy Policy,vol. 32, no. 9, pp. 1045–1052, 2004.
[61] F. Wolak, “Diagnosing the California Electricity Crisis,” The ElectricityJournal, vol. 16, no. 7, pp. 11–37, 2003.
[62] J. Jurewitz, “California’s Electricity Debacle: A Guided Tour,” The Elec-tricity Journal, vol. 15, no. 4, pp. 10–29, 2002.
[63] A. Sheffrin, “California power crisis: failure of market design or regula-tion?” Power Engineering Review, IEEE, vol. 22, no. 8, pp. 8–11, 2002.
[64] Energy Market Authority Singapore. (2004) Introductionto the Singapore Electricity Market. [Online]. Available:http://www.ema.gov.sg/doc/introduction˙to˙the˙singapore˙NEM.pdf
[65] E. Kee, “Margadh Aibhleise na hEireann: A New Electricity Market ForIreland,” The Electricity Journal, vol. 17, no. 1, pp. 51–60, 2004.
[66] Y. Chang, “Deregulation in the National Electricity Market of Singapore:Competition and Efficiency,” in Proceedings of the 2004 IEEE InternationalConference on Electric Deregulation, Restructuring and Power Technolo-gies (DRPT 2004), Hong Kong, 2004, pp. 16–19.
[67] T. Kristiansen, “Congestion management, transmission pricing and areaprice hedging in the Nordic region,” International Journal of ElectricalPower and Energy Systems, vol. 26, no. 9, pp. 685–695, 2004.
42

[68] National Electricity Code Administrator (NECA). (2005)National Electricity Grid Code. [Online]. Available:http://www.neca.com.au/files/necacode/
[69] National Electricity Market Company Limited (NEMMCO). (2004)An Introduction to Australia’s National Electricity Market. [Online].Available: http://www.nemmco.com.au/nemgeneral/000-0169.pdf
[70] R. Green, “Failing electricity markets: should we shoot the pools?” UtilitiesPolicy, vol. 11, no. 3, pp. 155–167, 2003.
43

![Privacy in Online Social Networks - University of Twente ... · 2.1 Definition of an OSN Boyd and Ellison’s widely used definition [7] captures the ke y elements of any OSN: Definition](https://static.fdocuments.in/doc/165x107/5f0aa5127e708231d42ca2d7/privacy-in-online-social-networks-university-of-twente-21-deinition-of.jpg)