
Rights / License: Research Collection In Copyright - Non ...73/eth-73-01.pdf · SBB Local Traffic,...
19
Research Collection Working Paper Models of mode choice and mobility tool ownership beyond 2008 fuel prices Author(s): Weis, Claude; Axhausen, Kay W.; Schlich, Robert; Zbinden, René Publication Date: 2009 Permanent Link: https://doi.org/10.3929/ethz-a-005864304 Rights / License: In Copyright - Non-Commercial Use Permitted This page was generated automatically upon download from the ETH Zurich Research Collection . For more information please consult the Terms of use . ETH Library
Transcript of Rights / License: Research Collection In Copyright - Non ...73/eth-73-01.pdf · SBB Local Traffic,...
Research Collection
Working Paper
Models of mode choice and mobility tool ownership beyond 2008fuel prices
Author(s): Weis, Claude; Axhausen, Kay W.; Schlich, Robert; Zbinden, René
Publication Date: 2009
Permanent Link: https://doi.org/10.3929/ethz-a-005864304
Rights / License: In Copyright - Non-Commercial Use Permitted
This page was generated automatically upon download from the ETH Zurich Research Collection. For moreinformation please consult the Terms of use.
ETH Library

C. Weis, K.W. Axhausen, R. Schlich and R. Zbinden 1
Models of mode choice and mobility tool ownership beyond 2008 fuel prices
Claude WEIS (corresponding author) Institute for Transport Planning and Systems (IVT), ETH Zurich HIL F 33.1, ETH Hönggerberg Wolfgang-Pauli-Str. 15 CH-8093 Zurich Switzerland Phone: +41-44-633 39 52 Fax: +41-44-633 10 57 Email: [email protected] Kay W. AXHAUSEN Institute for Transport Planning and Systems (IVT), ETH Zurich HIL F 32.3, ETH Hönggerberg Wolfgang-Pauli-Str. 15 CH-8093 Zurich Switzerland Phone: +41-44-633 39 43 Fax: +41-44-633 10 57 Email: [email protected] Robert SCHLICH SBB Local Traffic, Swiss Federal Railways Wylerstrasse 125 CH-3000 Berne Switzerland Phone: +41-51-220 34 63 Fax: +41-51-220 28 91 Email: [email protected] René ZBINDEN SBB Passenger Traffic, Swiss Federal Railways Wylerstrasse 125 CH-3000 Berne Switzerland Phone: +41-51-220 56 13 Fax: +41-51-220 28 91 Email: [email protected] Words: 5250 Figures: 3 Tables: 6 Total: 7500

C. Weis, K.W. Axhausen, R. Schlich and R. Zbinden 2
ABSTRACT
The paper, which draws from a recently finished research project, deals with the question of how travellers would react to fuel prices rising above the high levels that were attained in mid-2008. Participants to the study were recruited during a phone interview, in the course of which trips made on a specified day were recorded. Based on one of those trips and the respondents’ equipment with mobility tools, Stated Preference experiments were constructed, where the first part consisted of a mode choice situation under modified price (and travel time) settings (tactical decisions). The second part focused on long-term (strategic) choices between the current and an alternative fleet, including a re-distribution of yearly mileages. Based on the SP data, multinomial logit models for mode and fleet choice were estimated. The mode choice models were estimated using income- and distance-dependent non-linear utility functions and separately for the various trip purposes (as has been the practise in earlier Swiss studies on similar topics) and controlled for all relevant trip characteristics. The mobility tool ownership models, which were formulated using a new approach, aimed to yield trade-offs between the various attributes of the offered fleets and to forecast the distribution of season tickets under modified settings. The findings suggest that inertia is present in both mode choice and mobility tool ownership. Elasticities do not change much from previous studies where more conservative price increases were assumed. Season ticket ownership is expected to grow only when increasing fuel prices coincide with stable public transport fares.

C. Weis, K.W. Axhausen, R. Schlich and R. Zbinden 3
INTRODUCTION AND MOTIVATION
This paper deals with the methodology and results of a recently finished study at the Institute for Transport Planning and Systems (IVT), ETH Zurich, contracted by the Swiss Federal Railway Company’s Passenger Traffic section (1). The study complements and extends the results which have been established in previous Swiss studies. Vrtic and Fröhlich (2) present a comprehensive mode choice model and derive the corresponding travel time and price elasticities. Vrtic et al. (3, 4) investigate the effects that potential mobility pricing schemes would have on travellers’ tactical (mode choice) and strategic (long-term) decisions. Axhausen et al. (5, 6) and Hess et al. (7) compute values of travel time savings for Switzerland on the basis of mode choice models. The results are applied in the official Swiss cost-benefit guidelines for values of travel time savings that were published and updated following their works (8). The motivation for the present study were the rising oil prices at the time it was initiated (mid-2008), and an interest in customers’ short- and long-term reactions to further fuel cost increases. At said time, the price for a litre of regular non-leaded fuel was around 2.- Swiss Francs (as of July 2009, 1.- Swiss Franc corresponds to about -.94 US Dollars). This circumstance provided the opportunity to conduct Stated Preference (SP) experiments implementing a much greater bandwidth in pricing schemes than was the case in the previous studies. In fact, a mere extrapolation of the previous results to the new price levels would possibly lead to biased forecasts, as the customers‘ reactions are assumed to vary with the costs. Specifically, demand elasticities are expected to increase non-linearly with rising prices. Even though the heavy fuel price increases have recently been slowed by the current worldwide economic crisis, fuel prices of 4.- CHF per litre and above remain quite imaginable in the mid- to long-term future. Corollary to fuel prices, pricing schemes in public transport may be adapted, also with more flexible margins than was previously assumed. The variation of both these cost factors constituted the basis for the SP experiments. In the short term, the interest focuses on modelling individuals’ mode choice under the modified pricing schemes while accounting for the other decision relevant variables, such as travel and waiting times. Here, the figures that the study aimed to investigate were values of travel time savings (VTTS) and demand elasticities. These were computed by the means of a first SP experiment on mode choice, in which the situations were based on trips reported by the recruited respondents during a previous phone interview. The data were used to estimate discrete choice models which yielded the relevant values. As far as the longer term is concerned, the client’s main interest was how customers’ sets of mobility tools, and especially public transport season tickets, would react to the aforementioned changes. Therefore, a second SP questionnaire was designed, specifically aiming at the determinants of these choices. As an iterative and interactive approach to the respondents’ ideal situation was not feasible (as pen-and-paper questionnaires were used as the survey instrument), a second-best approach was chosen, where the interviewees were faced with a choice between their current mobility tool setting (but with new prices) and an alternative fleet, consisting of a new car, a redistribution of annual mileage and the corresponding cheapest public transport season ticket. The fleet choice models were formulated as mixed multinomial logit models incorporating the two offered fleets’ attributes as linear terms in the utility functions. This approach, which is fairly straightforward and – to the authors’ best knowledge – new in its application, was chosen over a discrete-continuous formulation out of data considerations and in order to accommodate the client’s need of understanding the trade-offs between season ticket

C. Weis, K.W. Axhausen, R. Schlich and R. Zbinden 4
ownership, prices and mileage. Under the assumptions that were made in the study, the results should allow revenue managers to choose optimal pricing strategies for season tickets as a function of fuel prices. The paper is structured as follows. First, a brief overview of the data collection process, consisting of respondent recruitment and the structure and design of the SP experiments, shall be given. The same section will describe basic sample characteristics such as response rates and shares of non-traders in the SP experiments. The following section provides explorative statistics of the sample. The formulation and estimation of the mode choice and long-term decision models will be described in the subsequent sections, followed by a brief conclusion.
DATA COLLECTION
Recruitment of Respondents The data used for the study result from a Stated Preference (SP) survey. Respondents were recruited through an ongoing continuous CATI survey, in which approximately 400 persons per week are interviewed. The survey, which is contracted by the Swiss Federal Railway Company and named “Kontinuierliche Erhebung Personenverkehr” or KEP (9), is conducted by Link and encompasses questions on respondents’ socio-demographic characteristics and travel behaviour. Trips over 3 kilometres undertaken over the past week are recorded along with their relevant characteristics (origin and destination, travel and waiting times, distances, and so on).
Following the phone interview, respondents owning a car driving license were recruited for the SP survey. Limiting the recruitment process to driving license owners made sure that the car alternative presented in the mode choice experiments was realistic to the respondents. For those fulfilling the requirements and willing to participate in the study, one reported trip was selected according to the following criteria:
• If at least one car trip was reported, the longest such trip was selected; • Else, the longest reported trip by railway was selected. The selected trip was then used to construct the personalised mode choice experiments
for each respondent. Thus, the procedure made sure that every participant was presented with choice situations tailored to their actual behaviour rather than being confronted with purely hypothetical scenarios. Additional questions concerning the distribution of yearly mileage over the various transport modes and the characteristics of the respondents’ equipment with cars and public transport season tickets were posed, providing the basis for the fleet choice experiments.
Over the time period from September 8th through November 9th, 2008 (calendar weeks 38 through 45), roughly 1’200 respondents were recruited for the study. For various reasons, 200 of the recruited persons had to be excluded from the final survey, thus resulting in a total sample size of 993 participants to which the questionnaires were sent by postal mail. Design of the Stated Preference Experiments
Mode Choice
As has been stated above, the SP experiments were designed based on the data reported by the respondents in the phone interview. This procedure is in accordance with current practice (10, 11, 12, 13, 14) and has been successfully applied in former Swiss studies on the impact of tilting trains (15, 16) and mobility pricing schemes (3, 4). The values for the variables used in the mode choice SP experiment were derived from the trip chosen according to the abovementioned criteria.
C. Weis, K.W. Axhausen, R. Schlich and R. Zbinden 5
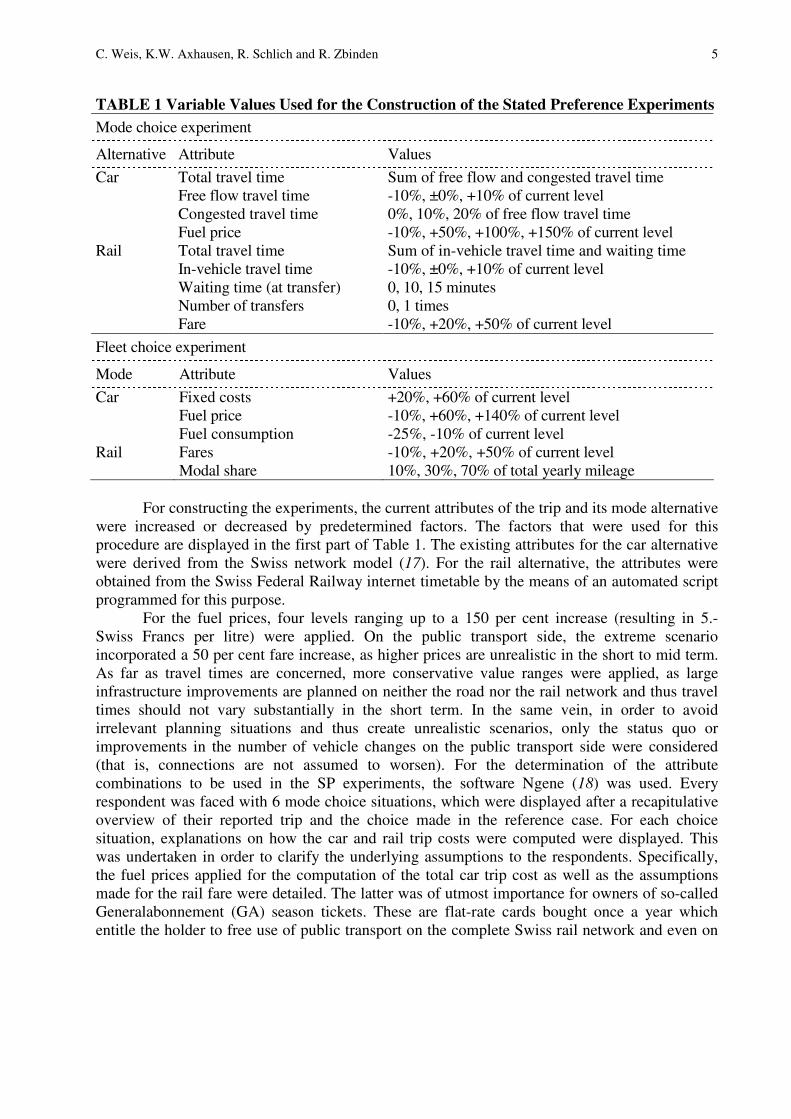
TABLE 1 Variable Values Used for the Construction of the Stated Preference Experiments
Mode choice experiment
Alternative Attribute Values
Car Total travel time Sum of free flow and congested travel time Free flow travel time -10%, ±0%, +10% of current level Congested travel time 0%, 10%, 20% of free flow travel time Fuel price -10%, +50%, +100%, +150% of current level Rail Total travel time Sum of in-vehicle travel time and waiting time In-vehicle travel time -10%, ±0%, +10% of current level Waiting time (at transfer) 0, 10, 15 minutes Number of transfers 0, 1 times Fare -10%, +20%, +50% of current level
Fleet choice experiment
Mode Attribute Values
Car Fixed costs +20%, +60% of current level Fuel price -10%, +60%, +140% of current level Fuel consumption -25%, -10% of current level Rail Fares -10%, +20%, +50% of current level Modal share 10%, 30%, 70% of total yearly mileage
For constructing the experiments, the current attributes of the trip and its mode alternative were increased or decreased by predetermined factors. The factors that were used for this procedure are displayed in the first part of Table 1. The existing attributes for the car alternative were derived from the Swiss network model (17). For the rail alternative, the attributes were obtained from the Swiss Federal Railway internet timetable by the means of an automated script programmed for this purpose.
For the fuel prices, four levels ranging up to a 150 per cent increase (resulting in 5.- Swiss Francs per litre) were applied. On the public transport side, the extreme scenario incorporated a 50 per cent fare increase, as higher prices are unrealistic in the short to mid term. As far as travel times are concerned, more conservative value ranges were applied, as large infrastructure improvements are planned on neither the road nor the rail network and thus travel times should not vary substantially in the short term. In the same vein, in order to avoid irrelevant planning situations and thus create unrealistic scenarios, only the status quo or improvements in the number of vehicle changes on the public transport side were considered (that is, connections are not assumed to worsen). For the determination of the attribute combinations to be used in the SP experiments, the software Ngene (18) was used. Every respondent was faced with 6 mode choice situations, which were displayed after a recapitulative overview of their reported trip and the choice made in the reference case. For each choice situation, explanations on how the car and rail trip costs were computed were displayed. This was undertaken in order to clarify the underlying assumptions to the respondents. Specifically, the fuel prices applied for the computation of the total car trip cost as well as the assumptions made for the rail fare were detailed. The latter was of utmost importance for owners of so-called Generalabonnement (GA) season tickets. These are flat-rate cards bought once a year which entitle the holder to free use of public transport on the complete Swiss rail network and even on

C. Weis, K.W. Axhausen, R. Schlich and R. Zbinden 6
local networks. To avoid confusion as to why the fares in such cases were not set to zero, the additional information of how the fare was calculated (average total yearly mileage by rail divided by the cost – 3’100.- Swiss Francs – of the above mentioned season ticket) was given.
Future Situation 1
• Behaviour Current Alternate
Season ticket Half-fare card GA
Season ticket costs 250.- CHF / year 4’500.- CHF / year
Public transport mileage 9’000 km / year 22’000 km / year
(about 30 %) (about 70 %)
Total public transport costs 2’200.- CHF / year 4’500.- CHF / year
Car current new
Fuel consumption 6.0 l / 100 km 5.4 l / 100 km
Fixed costs 600.- CHF / year 700.- CHF / year
Car mileage 22’000 km / year 9’000 km / year
(about 70 %) (about 30 %)
Fuel costs * 4’200.- CHF / year 1’600.- CHF / year
Total car costs 4’800.- CHF / year 2’300.- CHF / year
Total mobility costs 7’100.- CHF / year 6’800.- CHF / year
•
���� Your choice ����
•
* Results from an assumed fuel price of 3.20 CHF / l.
FIGURE 1 Example of a fleet choice experiment (translated from German original).
C. Weis, K.W. Axhausen, R. Schlich and R. Zbinden 7
Long-Term Decisions
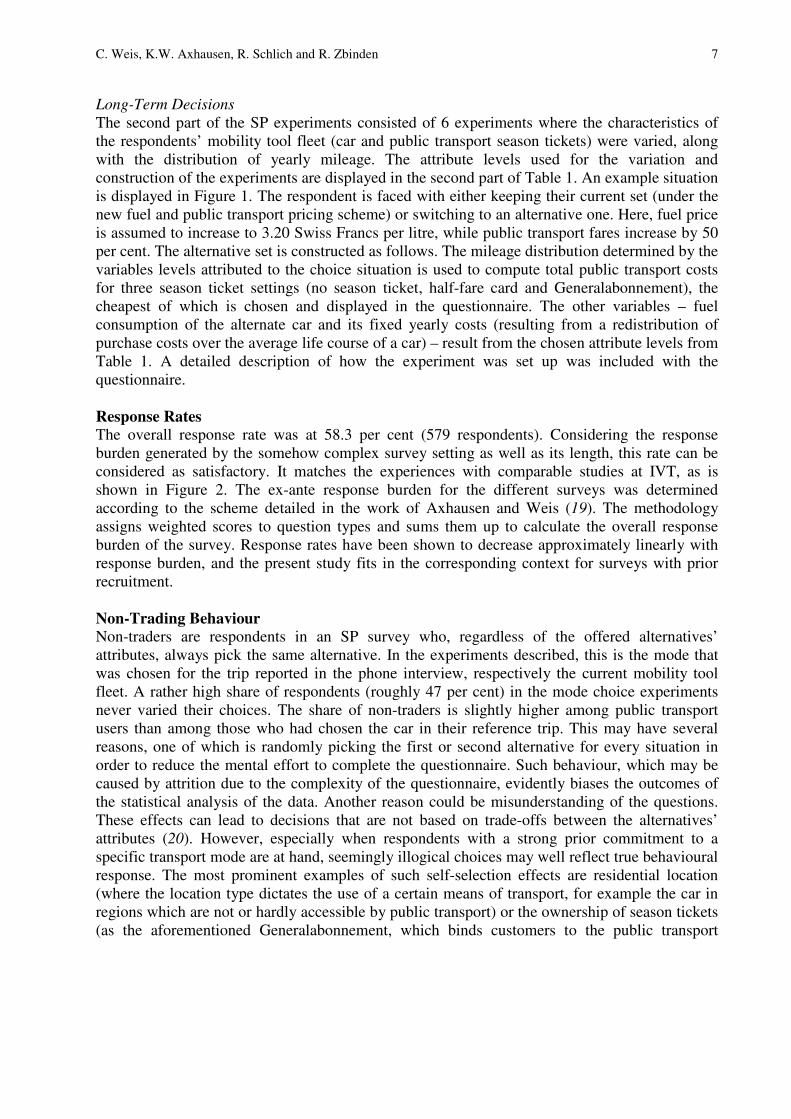
The second part of the SP experiments consisted of 6 experiments where the characteristics of the respondents’ mobility tool fleet (car and public transport season tickets) were varied, along with the distribution of yearly mileage. The attribute levels used for the variation and construction of the experiments are displayed in the second part of Table 1. An example situation is displayed in Figure 1. The respondent is faced with either keeping their current set (under the new fuel and public transport pricing scheme) or switching to an alternative one. Here, fuel price is assumed to increase to 3.20 Swiss Francs per litre, while public transport fares increase by 50 per cent. The alternative set is constructed as follows. The mileage distribution determined by the variables levels attributed to the choice situation is used to compute total public transport costs for three season ticket settings (no season ticket, half-fare card and Generalabonnement), the cheapest of which is chosen and displayed in the questionnaire. The other variables – fuel consumption of the alternate car and its fixed yearly costs (resulting from a redistribution of purchase costs over the average life course of a car) – result from the chosen attribute levels from Table 1. A detailed description of how the experiment was set up was included with the questionnaire. Response Rates
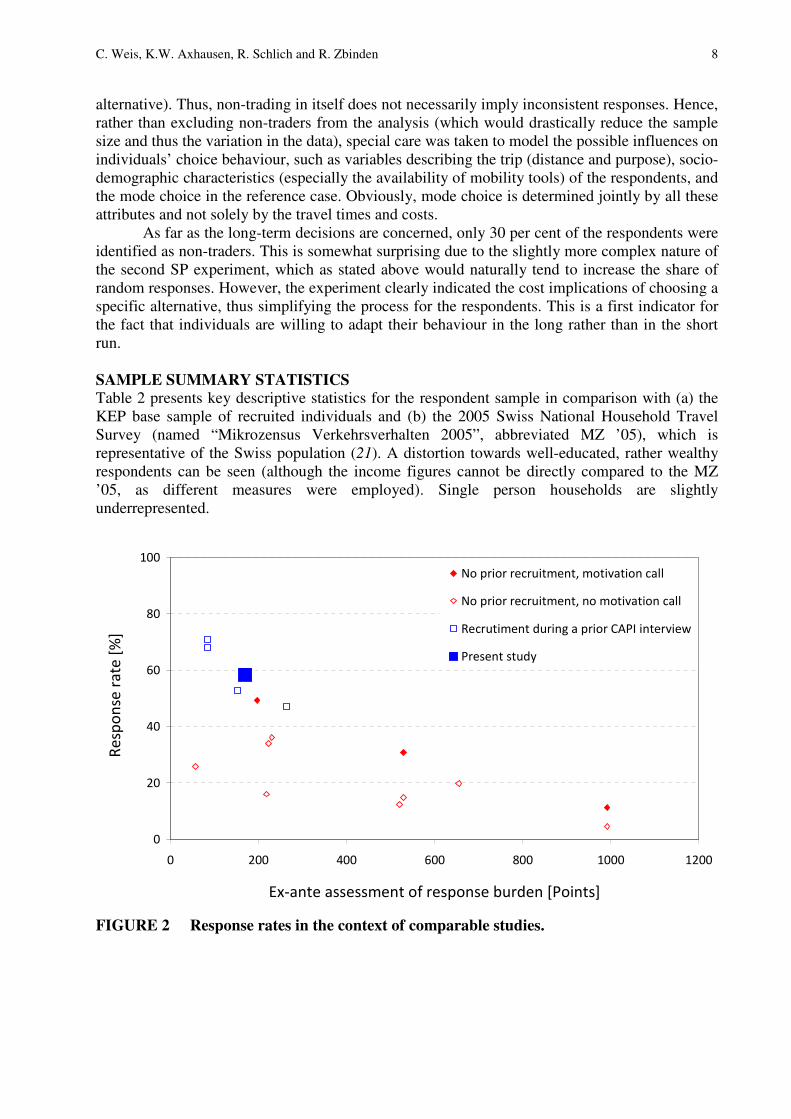
The overall response rate was at 58.3 per cent (579 respondents). Considering the response burden generated by the somehow complex survey setting as well as its length, this rate can be considered as satisfactory. It matches the experiences with comparable studies at IVT, as is shown in Figure 2. The ex-ante response burden for the different surveys was determined according to the scheme detailed in the work of Axhausen and Weis (19). The methodology assigns weighted scores to question types and sums them up to calculate the overall response burden of the survey. Response rates have been shown to decrease approximately linearly with response burden, and the present study fits in the corresponding context for surveys with prior recruitment. Non-Trading Behaviour
Non-traders are respondents in an SP survey who, regardless of the offered alternatives’ attributes, always pick the same alternative. In the experiments described, this is the mode that was chosen for the trip reported in the phone interview, respectively the current mobility tool fleet. A rather high share of respondents (roughly 47 per cent) in the mode choice experiments never varied their choices. The share of non-traders is slightly higher among public transport users than among those who had chosen the car in their reference trip. This may have several reasons, one of which is randomly picking the first or second alternative for every situation in order to reduce the mental effort to complete the questionnaire. Such behaviour, which may be caused by attrition due to the complexity of the questionnaire, evidently biases the outcomes of the statistical analysis of the data. Another reason could be misunderstanding of the questions. These effects can lead to decisions that are not based on trade-offs between the alternatives’ attributes (20). However, especially when respondents with a strong prior commitment to a specific transport mode are at hand, seemingly illogical choices may well reflect true behavioural response. The most prominent examples of such self-selection effects are residential location (where the location type dictates the use of a certain means of transport, for example the car in regions which are not or hardly accessible by public transport) or the ownership of season tickets (as the aforementioned Generalabonnement, which binds customers to the public transport
C. Weis, K.W. Axhausen, R. Schlich and R. Zbinden 8
alternative). Thus, non-trading in itself does not necessarily imply inconsistent responses. Hence, rather than excluding non-traders from the analysis (which would drastically reduce the sample size and thus the variation in the data), special care was taken to model the possible influences on individuals’ choice behaviour, such as variables describing the trip (distance and purpose), socio-demographic characteristics (especially the availability of mobility tools) of the respondents, and the mode choice in the reference case. Obviously, mode choice is determined jointly by all these attributes and not solely by the travel times and costs. As far as the long-term decisions are concerned, only 30 per cent of the respondents were identified as non-traders. This is somewhat surprising due to the slightly more complex nature of the second SP experiment, which as stated above would naturally tend to increase the share of random responses. However, the experiment clearly indicated the cost implications of choosing a specific alternative, thus simplifying the process for the respondents. This is a first indicator for the fact that individuals are willing to adapt their behaviour in the long rather than in the short run. SAMPLE SUMMARY STATISTICS
Table 2 presents key descriptive statistics for the respondent sample in comparison with (a) the KEP base sample of recruited individuals and (b) the 2005 Swiss National Household Travel Survey (named “Mikrozensus Verkehrsverhalten 2005”, abbreviated MZ ’05), which is representative of the Swiss population (21). A distortion towards well-educated, rather wealthy respondents can be seen (although the income figures cannot be directly compared to the MZ ’05, as different measures were employed). Single person households are slightly underrepresented.
0
20
40
60
80
100
0 200 400 600 800 1000 1200
Ex-ante assessment of response burden [Points]
Re
spo
nse
ra
te [
%]
No prior recruitment, motivation call
No prior recruitment, no motivation call
Recrutiment during a prior CAPI interview
Present study
FIGURE 2 Response rates in the context of comparable studies.

C. Weis, K.W. Axhausen, R. Schlich and R. Zbinden 9
A high share of respondents own public transport season tickets, as is common for surveys of the described type. In fact, public transport users tend to be more interested in transport policy issues (especially when the study is contracted by a railway operator), leading to a higher propensity to participate in the survey. As only car driving license owners were surveyed for the study and thus respondents for which car availability is impossible from the outset were excluded, the share of those regularly having a car at their disposal is slightly higher in the KEP sample than in the overall population. TABLE 2 Sample Descriptive Statistics
Variable Value Sample KEP MZ ’05
Gender Male 48.1 49.4 48.7 Female 51.9 50.6 51.3
Age (in years) 18 – 35 17.7 12.3 28.4 36 – 50 38.2 39.1 30.4 51 – 65 30.5 39.2 23.2 > 65 13.7 9.4 18.1
Education level Primary or secondary school 6.9 8.0 17.9 Professional school 47.6 48.3 59.6 College or university 45.5 43.8 22.5
Number of persons in household 1 15.2 14.3 18.9 2 41.9 36.4 36.9 3 13.1 17.1 16.5 4 17.7 20.0 18.3 > 4 12.1 12.0 9.4
Income (in CHF / month) < 2000 16.3 19.0 2000 – 4000 17.4 19.3 4000 – 6000 28.7 29.2 6000 – 8000 19.1 17.0 8000 – 10000 10.8 8.7 > 10000 7.8 6.8
Public transport season ticket None 42.7 51.2 67.2 Half-fare card 44.8 39.3 26.5 Generalabonnement 12.5 9.5 6.3
Car availability Always 77.2 79.8 79.4 Sometimes 15.5 15.0 15.7 Never 7.3 5.8 4.9
Car fuel consumption (in l/100km) < 5 6.5 6.0 5 – 8 69.6 70.2 8 – 12 21.6 21.7 12 – 15 1.9 1.7 > 15 0.4 0.4

C. Weis, K.W. Axhausen, R. Schlich and R. Zbinden 10
Compared to the KEP, the share of respondents without a car is higher in the final sample, again indicating an affinity towards public transport users. The discrepancy of the socio-demographic attributes that was observed between the sample and the Swiss population raises the question of the necessity of sample reweighting. For conducting explorative analyses, such a weighting procedure should clearly be undertaken. However, for the estimation of discrete choice models that will be described in the next section, weighting is not necessary under the condition the selectivity variables are included in the models (22).
FORMULATION AND ESTIMATION OF THE DISCRETE CHOICE MODELS
The models for the tactical and strategic decisions made use of standard discrete choice methodology (23), and specifically the multinomial logit model (MNL). All models that are described in the following sub-sections were estimated with the BIOGEME software package (24, 25).
Mode Choice
Model formulation
The formulation of the mode choice models follows the form that has been introduced in the study by Mackie et al. (26) and was employed in several of the abovementioned Swiss studies (5, 6, 7, 8). It extends the standard MNL utility formulation by continuous interactions between variables. In the present case, income and trip distance are assumed to influence the disutility generated by travel time and cost. As Hess et al. (7) state, the methodology has various advantages over the arbitrary segmentation into distance and income classes, such as the computation of deterministic taste heterogeneity, and the considerably faster estimation compared to random coefficient approaches.
The general specification of the utility function is as follows:
( ) xy
yxyf
xy
x ⋅
⋅=
,
,
λ
β (1)
where x = (dis)utility generating variable, such as travel time or cost;
xβ = utility parameter associated with x, to be estimated;
y = variable assumed to interact with x, such as income or trip distance;
y = reference value for variable y, such as the sample mean or median;
xy ,λ = elasticity of the influence of y on the (dis)utility generated by x, to be estimated.
The travellers’ sensitivity of attribute x is assumed to vary with the value of attribute y.
The present study considered interactions with income and distance. Normalising y with its mean assures that the linear parameter indicates the valuation of x at that point (as the interaction term then equals 1). Additionally, it was assumed that the valuation of travel time and costs would differ between trip purposes. The formulation of the final model therefore included a segmentation into the four categories commuting (work or education), shopping, business, and leisure.

C. Weis, K.W. Axhausen, R. Schlich and R. Zbinden 11
TABLE 3 Parameter Estimates and Model Fit for the Mode Choice Model
Trip purpose
Commuting Shopping Business Leisure
n = 592 n = 438 n = 306 n = 1975
Attribute Parameter Est. t stat. Est. t stat. Est. t stat. Est. t stat.
Car alternative
Inertia carβ 1.492 12.13 1.492 12.13 1.492 12.13 1.492 12.13
Congestion ongcβ -1.456 -2.82 -1.456 -2.82 -1.456 -2.82 -1.456 -2.82
Car availability car_availβ 0.202 2.69 0.202 2.69 0.202 2.69 0.202 2.69
Travel time carttβ -0.029 -1.77 -0.042 -4.82 -0.005 -0.74 -0.031 -7.79
carttdist,λ -1.909 -2.78 - - -2.020 -3.25 -0.551 -5.28
carttinc,λ 1.144 2.08 - - 3.933 1.49 -0.210 -6.26
Fuel cost carcostβ -0.085 3.29 -0.044 -2.61 -0.039 -2.60 -0.038 -7.66
carcostistd ,λ - - - - - - -0.261 -2.63
carcostinc,λ -0.985 -3.38 -1.427 -3.50 - - -0.184 -1.28
Public transport alternative
Transfers transfersβ -0.328 -2.42 -0.328 -2.42 -0.328 -2.42 -0.328 -2.42
Waiting time timewaiting _β -0.020 -1.70 -0.020 -1.70 -0.020 -1.70 -0.020 -1.70
Half fare card HTAβ 1.301 12.57 1.301 12.57 1.301 12.57 1.301 12.57
GA GAβ 1.891 12.10 1.891 12.10 1.891 12.10 1.891 12.10
Travel time publicttβ -0.037 -3.34 -0.020 -3.49 -0.050 -3.25 -0.016 -8.27
publicttistd ,λ -1.034 -2.15 - - -2.693 -3.61 -0.632 -5.51
publicttinc,λ 0.617 1.19 1.210 1.90 - - - -
Fare publiccostβ -0.046 -2.56 -0.040 -2.54 -0.039 -2.60 -0.047 -6.26
ublicpcostistd ,λ - - - - - - -0.261 -2.63
publiccostinc,λ -0.985 -3.38 -1.427 -3.50 - - -0.184 -1.28
Adjusted ρ2 = 0.305
n = number of observations, Est. = estimate, t stat. = t statistic, dist = distance, inc = income

C. Weis, K.W. Axhausen, R. Schlich and R. Zbinden 12
TABLE 4 Population Weighted Willingness-to-Pay Indicators and Demand Elasticities
WTP indicators Commuting Shopping Business Leisure
Car travel time [CHF/h] 24.4 ± 7.3 55.9 ± 5.9 81.6 ± 61.6 94.4 ± 99.9
Rail travel time [CHF/h] 31.7 ± 5.6 29.1 ± 3.4 185.2 ± 204.2 43.3 ± 5.9
Transfer waiting time [CHF/h] 27.5 27.5 27.5 27.5
Number of transfers 6.4 6.4 6.4 6.4
Travel time elasticities Commuting Shopping Business Leisure
Car -0.26 -0.49 -0.13 -0.71
Public transport -1.29 -1.34 -1.39 -2.37
Price elasticities Commuting Shopping Business Leisure
Car -0.23 -0.19 -0.46 -0.37
Public transport -0.30 -0.30 -0.40 -0.56
Results The parameter estimates for the final model are displayed in Table 3. The models were first estimated using a linear utility specification. The non-linear interactions and the purpose segmentation were then gradually added. The table shows the results for the purpose-specific non-linear model (where purpose specific parameters could only be found for the travel time and cost variables). Parameter values are displayed along with the corresponding t-statistics (where absolute values above 1.96 indicate significance of the parameters at the 5% level), as well as general model fit information. The adjusted ρ2 value of 0.305 indicates a good model fit, and all the included variables are of the expected sign and statistically significant.
Table 4 shows the relevant willingness-to-pay (WTP) indicators and demand elasticities for the mode choice model. The WTP indicators are obtained by dividing an attribute’s parameter by the cost parameter of the according alternative. As the valuation of the cost parameter varies with trip distance and income, so do the WTP indicators. The values indicated in the table were weighted to represent the Swiss population average for the respective trip purposes. The re-weighting was done according to the procedure detailed in the paper by Hess et al. (7). The 95 per cent confidence interval is indicated along with the mean values. For the WTP indicators relating to waiting time and number of transfers, the weighting procedure was not applied, as these attributes were included as linear terms in the utility function. Fleet Choice
Model formulation
The utility functions for the fleet choice model were formulated as a linear combination of the attributes of the current and alternate fleets. Additionally, fuel price (in Swiss Francs per litre) and the age of the current car were incorporated in the utility function for the alternate fleet, as both variables were expected to directly influence the respondents’ decision to purchase a new car. Two inertia variables were included in the model, one being an intercept term for the current alternative (and thus modelling the base utility of that alternative as compared to the other one), the other a dummy variable indicating whether the public transport season ticket present in the

C. Weis, K.W. Axhausen, R. Schlich and R. Zbinden 13
considered alternative was the same as the current one. The model was estimated as a panel mixed logit model, meaning that a normally distributed error term was included in order to model random taste heterogeneity between respondents. As can be seen in Table 5, all the included parameters are of the expected sign and are statistically significant (absolute values of the t statistics above 1.96). Costs on both the car and the public transport side represent a disutility. Car costs are perceived more negatively than a public transport costs, and fixed costs more negatively than variable costs. The presence of a season ticket, especially the Generalabonnement, has a positive effect on the alternatives’ utility. The reallocation of mileage from the car to public transport tends to be valued negatively. The assumption that both fuel price and the age of the current car have a positive effect on the probability of choosing a new fleet is confirmed by the corresponding parameter estimates.
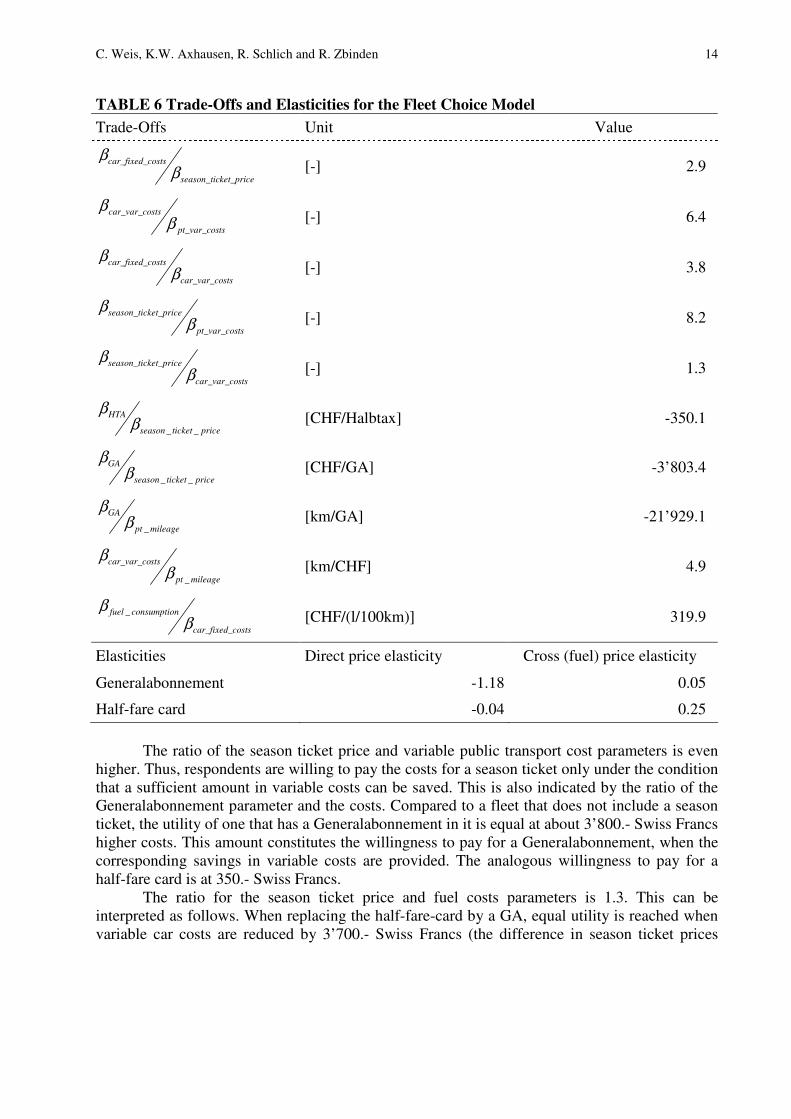
A number of trade-offs for the fleet choice model is displayed in Table 6. Of special interest are the trade-offs for the respective cost components, which indicate their relative valuation. The fact that fixed car costs are valued more negatively than fuel costs indicates a lacking willingness to invest in a new, less consumption-intense but more expensive, vehicle, even with fuel prices rising significantly.
On the other hand, the willingness to pay for a lower fuel consumption, which is given by the ratio of the parameters for the fixed costs and consumption, amounts to 320.- Swiss Francs per litre saved on a one-hundred kilometre distance. Aggregated over the assumed ten year long life duration of a vehicle, this results in a total amount of 3’200.- Swiss Francs. TABLE 5 Parameter Estimates and Model Fit for the Fleet Choice Model
Attribute Parameter Est. t stat.
Intercept current fleet c 2.293 6.17
Standard deviation of the error term σ 1.997 16.18
Current public transport season ticket currentβ 0.643 4.98
No public transport season ticket (reference category) noneβ - -
Half fare card HTAβ 0.110 0.70
GA GAβ 1.192 2.02
Price of public transport season ticket ket_priceseason_ticβ -0.313 -2.03
Variable public transport costs tspt_var_cosβ -0.038 -0.51
Fixed car costs costscar_fixed_β -0.912 -9.70
Variable car costs (fuel) stscar_var_coβ -0.242 -6.40
Yearly public transport mileage mileagept _β -0.049 -2.95
Fuel consumption nconsumptiofuel _β -0.292 -3.00
Fuel price pricefuel _β 0.351 6.76
Age of current car carageβ 0.033 1.51
2.ρAdj = 0.266 Est. = estimate, t stat. = t statistic
C. Weis, K.W. Axhausen, R. Schlich and R. Zbinden 14
TABLE 6 Trade-Offs and Elasticities for the Fleet Choice Model
Trade-Offs Unit Value
ket_priceseason_tic
costscar_fixed_
ββ
[-] 2.9
tspt_var_cos
stscar_var_co
ββ
[-] 6.4
stscar_var_co
costscar_fixed_
ββ
[-] 3.8
tspt_var_cos
ket_priceseason_tic
ββ
[-] 8.2
stscar_var_co
ket_priceseason_tic
ββ
[-] 1.3
priceticketseason
HTA
__ββ [CHF/Halbtax] -350.1
priceticketseason
GA
__ββ [CHF/GA] -3’803.4
mileagept
GA
_ββ [km/GA] -21’929.1
mileagept
stscar_var_co
_ββ
[km/CHF] 4.9
costscar_fixed_
nconsumptiofuel
ββ _ [CHF/(l/100km)] 319.9
Elasticities Direct price elasticity Cross (fuel) price elasticity
Generalabonnement -1.18 0.05
Half-fare card -0.04 0.25
The ratio of the season ticket price and variable public transport cost parameters is even
higher. Thus, respondents are willing to pay the costs for a season ticket only under the condition that a sufficient amount in variable costs can be saved. This is also indicated by the ratio of the Generalabonnement parameter and the costs. Compared to a fleet that does not include a season ticket, the utility of one that has a Generalabonnement in it is equal at about 3’800.- Swiss Francs higher costs. This amount constitutes the willingness to pay for a Generalabonnement, when the corresponding savings in variable costs are provided. The analogous willingness to pay for a half-fare card is at 350.- Swiss Francs.
The ratio for the season ticket price and fuel costs parameters is 1.3. This can be interpreted as follows. When replacing the half-fare-card by a GA, equal utility is reached when variable car costs are reduced by 3’700.- Swiss Francs (the difference in season ticket prices

C. Weis, K.W. Axhausen, R. Schlich and R. Zbinden 15
multiplied by the aforementioned factor). At the mean fuel consumption (8 litres per 100 kilometres) and a 2.- Swiss Francs per litre fuel price, this corresponds to a reallocation of yearly mileage of about 23’000 kilometres. Thus, an individual acquiring a Generalabonnement sees this step as a commitment to public transport, which is amortised by travelling more by that mode.
At the same time, the utility is reduced by the additional public transport mileage. With rising fuel prices, willingness to pay for a Generalabonnement, respectively the propensity of acquiring one at the present price and reassigning mileage to public transport increases. Assuming fuel price will double and attain 4.- Swiss Francs per litre, acquiring a Generalabonnement at the current costs of 3’100.- Swiss Francs will be profitable when 11’000 kilometres are shifted from car to rail (as the 3’700.- Swiss Francs savings in variable car costs is then given).
From the estimated parameters, choice probabilities for possessing no public transport season ticket, a half-fare card, or a Generalabonnement, were computed under various pricing scenarios. The results are shown in Figure 3. The 2.- Swiss Francs per litre fuel price and zero increase in season ticket costs form the base scenario. Today, about 28.5 per cent of Swiss residents own a half-fare card, while approximately 4.9 per cent are Generalabonnement holders. At the current fare setting, fuel price increases would lead to season ticket holder shares of up to 40 per cent in the 5.- Swiss Francs per litre scenario. At the same time, when fuel prices do not increase or do so only moderately (as can be realistically assumed after the recent developments), season ticket sales can only be increased if fares are held constant. In fact, as shown in Table 6, the direct price elasticity for the Generalabonnement is at about -1.2, while the cross elasticity is quite low (1).
0
10
20
30
40
50
0 10 20 30 40 50
Increase of season ticket prices [%]
Sh
are
of
sea
son
tic
ke
t h
old
ers
[%
]
2 3 4 5Fuel price [CHF/l]
FIGURE 3 Forecast of the share of public transport season ticket owners under various
price settings.
C. Weis, K.W. Axhausen, R. Schlich and R. Zbinden 16
CONCLUSION AND OUTLOOK The findings in this paper suggest that, even if fuel prices should again increase dramatically, certain inertia in both short term mode choice and long term mobility tool ownership and mileage distribution (fleet choice) is present. Price elasticities computed from the discrete choice models suggest that respondents are more sensitive to public transport price increases than to rising fuel prices. Thus, if the demand for rail services and season ticket sales is to be maintained, no wide margin exists for increasing public transport fares. Travel times on the other hand appear to be of greater importance in determining mode choice. These findings are interesting in view of the major improvements to the Swiss rail infrastructure that are to be made in the near future, such as the opening of the Gotthard basis tunnel. Feedback effects of such improvements on the share of public transport season ticket holders cannot be ignored and should be thoroughly investigated in the future, as they hold a significant potential for modal shifts if the fares are held at the current level.
ACKNOWLEDGEMENTS The authors gratefully acknowledge the financial support of the Swiss Federal Railway Company (SBB), and the advice of Tobias Ebinger and Johannes Lieberherr. Furthermore, we would like to thank the Link survey institute and especially Urban Schwegler for their assistance in the recruitment process and the prompt data delivery throughout the survey period. Alexander Erath contributed his programming efforts to the script that was used to obtain the rail travel times, while Dr. John Rose provided the Ngene software for the design of the SP experiments.

C. Weis, K.W. Axhausen, R. Schlich and R. Zbinden 17
REFERENCES
1. Weis, C., and K.W. Axhausen. Benzinpreis und Bahnnutzung. Report to the Swiss Federal Railway Company. IVT, ETH Zürich, Zürich, 2009.
2. Vrtic, M., and P. Fröhlich. Was Beeinflusst die Wahl der Verkehrsmittel?. Der Nahverkehr, Vol. 24, No. 4, 2006, pp. 52-57.
3. Vrtic, M., N. Schüssler, A. Erath, and K.W. Axhausen. Route, Mode, and Departure Time Choice Behaviour in the Presence of Mobility Pricing. Presented at 86th Annual Meeting of the Transportation Research Board, Washington D.C., 2007.
4. Vrtic, M., N. Schüssler, A. Erath, and K.W. Axhausen. Design Elements of Road Pricing Schemes and their Acceptability. Presented at 86th Annual Meeting of the Transportation Research Board, Washington D.C., 2007.
5. Axhausen, K.W., S. Hess, A. König, G. Abay, J.J. Bates, and M. Bierlaire. Income and Distance Elasticities of Values of Travel Time Savings: New Swiss Results. Transport
Policy, Vol. 15, No. 3, 2008, pp. 173–185.
6. Axhausen, K.W., A. König, G. Abay, J.J. Bates, and M. Bierlaire. State of the Art Estimates of the Swiss Value of Travel Time Savings. Presented at 86th Annual Meeting of the Transportation Research Board, Washington D.C., 2007.
7. Hess, S., A. Erath, and K.W. Axhausen. Estimated Value of Savings in Travel Time in Switzerland: Analysis of Pooled Data. In Transportation Research Record: Journal of the
Transportation Research Board, No. 2082, Transportation Research Board of the National Academies, Washington, D.C., 2008, pp. 43-55.
8. Swiss Association of Road and Transportation Experts. SN 641 822 Zeitkosten im
Personenverkehr: Kosten-Nutzen-Analysen im Strassenverkehr. EK 2.02, VSS, Zürich, 2007.
9. Swiss Federal Railways. Kontinuierliche Erhebung Personenverkehr (KEP). SBB, Bern, 2001.
10. Louvière, J.J., D.A. Hensher, and J. Swait. Stated Choice Methods: Analysis and
Applications in Marketing, Transportation and Environmental Valuation. Cambridge University Press, Cambridge, 2000.
11. Algers, S., J. Lindqvist Dillen, J., and S. Wildert. The National Swedish Value of Time Study. Presented at PTRC European Transportation Forum, Warwick, 1995.
12. Kurri, J., and M. Pursula. Finnish Preliminary Value of Time Studies. Swedish Road and Transport Research Institute and Swedish Transport and Communications Research Board, Linköping, 1995.
13. Ramjerdi, F., L. Rand, I. Saestermo, and K. Saelensminde. The Norwegian Value of Time
Study. Norwegian Centre for Transport Research, Oslo, 1997.
14. Jovivic, G., and C.O. Hansen. A Passenger Travel Demand Model for Copenhagen. Transportation Research A, Vol. 37, No. 4, 2003, pp. 333-349.
15. Vrtic, M., and K.W. Axhausen. Impact of Tilting Trains in Switzerland: Route Choice Model of Regional and Long-Distance Public Transport Trips. Presented at 82nd Annual Meeting of the Transportation Research Board, Washington D.C., 2003.

C. Weis, K.W. Axhausen, R. Schlich and R. Zbinden 18
16. Vrtic, M., and K.W. Axhausen. Forecast Based on Different Data Types: A Before and After Study. Presented at 10th World Conference on Transport Research, Istanbul, 2004.
17. Arendt, M., and M. Vrtic. Nationales Personenverkehrsmodell des Bundes als verkehrsplanerische Grundlage. In Bieger, T., Lässer, C. and Maggi, R. (eds.) Jahrbuch
2005/2006 Schweizerische Verkehrswirtschaft, pp. 145-166, SVWG, St. Gallen, 2006.
18. Rose, J.M., M.C.J.Bliemer, D.A. Hensher, and A.T. Collins. Designing Efficient Stated Choice Experiments in the Presence of Reference Alternatives. Transportation Research B, Vol. 42, No. 4, 2008, pp. 395-406.
19. Axhausen, K.W., and C. Weis. Predicting Response Rate: A Natural Experiment. Arbeitsberichte Verkehrs- und Raumplanung, No. 549, Institute for Transport Planning and Systems (IVT), Swiss Federal Institute for Technology, Zurich, 2009.
20. Van de Kaa, E.J. Assessment of the Value of Travel Time from Stated Choice Surveys: The impact of Lexicographic Answering. Presented at European Transport Conference, Strasbourg, 2006.
21. Swiss Federal Statistical Office and Swiss Federal Office of Spatial Development. Mobilität in der Schweiz: Ergebnisse des Mikrozensus 2005 zum Verkehrsverhalten. Swiss Federal Statistical Office, Bern, 2007.
22. Ben-Akiva, M., and S.R. Lerman. Discrete Choice Analysis: Theory and Application to
Travel Demand. MIT Press, Cambridge, 1985.
23. Train, K.E. Discrete Choice Models with Simulation. Cambridge University Press, Cambridge, 2003.
24. Bierlaire, M. BIOGEME: A Free Package for the Estimation of Discrete Choice Models. Presented at 3rd Swiss Transport Research Conference, Monte Verità, 2003.
25. Bierlaire, M. An Introduction to BIOGEME 1.8. Transport and Mobility Laboratory, École Polytechnique Fédérale de Lausanne. http://biogeme.epfl.ch. Accessed July 3rd, 2009.
26. Mackie, P., M. Wardman, A.S. Fowkes, G. Whelan, J. Nellthorp, and J.J. Bates. Values of
Travel Time Savings in the UK. Institute for Transport Studies, University of Leeds and John Bates Services, Leeds and Abingdon, 2003.