Rights / License: Research Collection In Copyright - Non ...47082/... · Criteria for scale-up and...
150
Research Collection Doctoral Thesis Criteria for scale-up and scale-down of bioreactors for cultivation of mammalian cells Author(s): Neunstoecklin, Benjamin Publication Date: 2014 Permanent Link: https://doi.org/10.3929/ethz-a-010316660 Rights / License: In Copyright - Non-Commercial Use Permitted This page was generated automatically upon download from the ETH Zurich Research Collection . For more information please consult the Terms of use . ETH Library
Transcript of Rights / License: Research Collection In Copyright - Non ...47082/... · Criteria for scale-up and...
Research Collection
Doctoral Thesis
Criteria for scale-up and scale-down of bioreactors forcultivation of mammalian cells
Author(s): Neunstoecklin, Benjamin
Publication Date: 2014
Permanent Link: https://doi.org/10.3929/ethz-a-010316660
Rights / License: In Copyright - Non-Commercial Use Permitted
This page was generated automatically upon download from the ETH Zurich Research Collection. For moreinformation please consult the Terms of use.
ETH Library

DISS. ETH NO. 22131
Criteria for scale-up and scale-down of bioreactors for
cultivation of mammalian cells
A dissertation submitted to
ETH Zurich
for the degree of
Doctor of Sciences
presented by
Benjamin Neunstoecklin
Dipl.-Biol. University of Heidelberg, Germany
born 31st of May, 1982
Citizen of Germany
accepted on the recommendation of
Prof. Dr. Massimo Morbidelli (ETH Zurich), examiner
Prof. Dr. Rudiyanto Gunawan (ETH Zurich), co-examiner
Dr. Miroslav Soos (ETH Zurich), co-examiner
Dr. Matthieu Stettler (Merck Serono), co examiner
Zurich, 2014


Invictus
Out of the night that covers me,
Black as the pit from pole to pole,
I thank whatever gods may be
For my unconquerable soul.
In the fell clutch of circumstance
I have not winced nor cried aloud.
Under the bludgeonings of chance
My head is bloody, but unbowed.
Beyond this place of wrath and tears
Looms but the horror of the shade,
And yet the menace of the years
Finds, and shall find, me unafraid.
It matters not how strait the gate,
How charged with punishments the scroll,
I am the master of my fate:
I am the captain of my soul.
From William Ernest Henley (1849 – 1903)


For Sabrina


I
Abstract
Application of quality by design (QbD) requires identification of the maximum
operating range for parameters affecting the cell culture process. These include hydrodynamic
stress, mass transfer or gradients in dissolved oxygen, carbon dioxide and pH. Since most of
these are affected by the impeller design and speed, the main goal of the first part of this work
was to identify the maximum operating range for hydrodynamic stress, where no variation of
cell growth, productivity and product quality can be ensured. To properly represent the
oscillation stress exposure of cells in large-scale bioreactors, two scale-down models were
developed operating under laminar and turbulent condition, generating repetitive oscillating
hydrodynamic stress with maximum stress values ranging from 0.4 to 420 Pa. Two
manufacturing cell lines (CHO and Sp2/0) used for the synthesis of therapeutic proteins were
employed. For both cell lines multiple process outputs were used such as cell growth,
morphology, metabolism and productivity, to determine the threshold values of hydrodynamic
stress resulting in values equal to 32.4±4.4 Pa and 25.2±2.4 Pa for CHO and Sp2/0,
respectively. Below the measured thresholds both cell lines did not show any appreciable
effect to hydrodynamic stress on any critical quality attribute, while above, cells responded
negatively to elevated stress. To confirm the applicability of the proposed method, the
obtained results were compared with data generated from classical small-scale reactors with a
working volume of 3L.
Although several scaling models are suggested and described in the literature, they
mostly lack reasonable validation or comparison at pilot or manufacturing-scale. Therefore,
the second part of this work is dedicated to a validation of the before developed oscillating
shear system. A 300 L pilot scale bioreactor was used for the validation, operated at either
safe agitation conditions (7 Pa) or at 28 Pa, corresponding to the edge of failure (25 Pa) of the
used Sp2/0 cell line. In order to consider the simultaneous action of stirring and sparging the

II
maximum stress values for the used bioreactors were determined using a stress sensitive
particulate system. Pilot scale data were compared with historical data from classical 3 L
cultivations and cultivations from the oscillating stress loop model. Results for the growth
behavior, analyzed metabolites, productivity and product quality showed a dependency on the
different environmental stress conditions but not on reactor size. Pilot scale conditions were
very similar to those generated in the oscillating stress loop model confirming its predictive
capabilities, including conditions beyond the edge of failure.
The final part of this work extends the investigation to multiple scale dependent
parameters as observed from the oscillatory environment of a large-scale bioreactor.
Parameters studied were increasing dissolved carbon dioxide over time, oscillation of
hydrodynamic stress and dissolved oxygen plus the perturbation of the pH by a basic feed.
Parameters were first examined individually resulting in the corresponding threshold values.
A two zone model consisting of two differently sized interconnected bioreactors was
developed to perform combinatorial experiments. With this model the most realistic large-
scale environment was simulated and the validity of the before determined thresholds was
reevaluated. Using different bubble sizes, elevated dCO2 levels were simulated resulting in a
critical value of 100 mmHg, which inhibited growth completely. Combination experiments in
the two zone model showed that the oscillation of dissolved oxygen between 40 and 60 % had
no negative impact on growth or metabolism. In contrary, the combination of stress and
elevated dCO2 levels both being below their individual threshold values, results in a combined
negative effect on growth and productivity. This clearly indicates that only studies with
combined effects of several parameters would represent the proper strategy when constructing
a design space for a cell cultivation process.

III
Zusammenfassung
Die Anwendung von „Quality by Design“ (QBD) benötigt die Identifizierung der
maximal anwendbaren Prozessparameter, die den Zellkulturprozess beeinflussen. Diese sind
hydrodynamischer Stress, Massentransfer oder Gradienten in gelösstem Sauerstoff und
Kohlendioxid. Da diese durch die Rührerdrehzahl beeinflusst sind, ist das Hauptziel des
ersten Teils dieser Arbeit die Identifizierung der maximalen Prozessparamter für
hydrodynamischen Stress, bei denen kein negativer Effekt auf Zellwachstum, Produktivität
und Produktqualität zu beobachten ist. Um die oszillierende Natur des hydrodynamischen
Stresses nachzuahmen, wurden zwei scale-down Modelle entwickelt, welche unter
turbulenten oder laminaren Konditionen arbeiten. Diese generieren einen oszillierenden
Maximalstress von 0.4 Pa bis 420 Pa. Zwei industrielle Produktionszelllinien (CHO und
Sp2/0) wurden untersucht. Für beide Zelllinien wurden mehrere Prozessresultate wie
Zellwachstum, Aussehen, Metabolismus und Produktivität benutzt, um einen Schwellenwert
zu definieren. Diese Werte waren 32.4±4.4 Pa für CHO Zellen und 25.2±2.4 Pa für Sp2/0
Zellen. Unterhalb dieses Schwellenwertes zeigten beide Zelltypen keinen deutlichen Effekt
gegenüber hydrodynamischem Stress, bezüglich kritischer Qualitätsattribute. Über dem
Schwellenwert wurde jedoch eine negative Zellantwort beobachtet. Um die Anwendbarkeit
der vorgestellten Methode zu überprüfen, wurden die Resultate mit Daten aus klassischen 3 L
Laborbioreaktoren verglichen.
Obwohl verschiedene Scaling Modelle in der Literatur beschrieben sind, wurden diese
meistens nicht mittels Pilot- oder Produktionsanlagen validiert. Der Zweite Teil dieser Arbeit
beschäftigt sich mit der Validierung des zuvor beschriebenen Modells. Hierzu wurde ein
300 L Bioreaktor benutzt, welcher entweder unter einer sicheren Rührgeschwindigkeit (7 Pa)
oder einer Rührgeschwindigkeit über dem Schwellenwert (28 Pa), welcher dem „Edge of
failure“ entsprach, betrieben wurde. Um die Eigenschaften von Rührer und Begasung

IV
zusammen zu betrachten, wurden die verwendeten Bioreaktoren mit einem Stress sensitiven
System charakterisiert. Die Resultate der Pilotanlage wurden mit Daten des scale-down
Modells und mit solchen aus klassischen 3 L Bioreaktoren verglichen. Resultate für
Wachstum, Metabolite, Produktivität und Qualität zeigten eine Abhängigkeit von den
angewendeten maximalen Stresswerten, aber nicht von der Grösse des Reaktors. Daten aus
der Pilotanlage waren sehr vergleichbar zu denen aus dem scale-down Modell. Dies bestätigt
die Voraussagefähigkeit des Geräts einschliesslich der Bedingungen über dem Schwellenwert.
Der letzte Teil der Arbeit erweitert die Studie im Hinblick auf die Untersuchung
verschiedener grössenabhängiger Parameter, wie sie in Produktionsanlagen beobachtet
werden. Diese waren Anreicherung von CO2 über die Prozesszeit, Oszillation von
hydrodynamischem Stress und gelöstem Sauerstoff plus Abweichungen vom pH-Wert. Die
Parameter wurden zur Evaluierung der einzelnen Schwellenwerte zunächst einzeln untersucht.
Ein zwei-Zonen Modell, bestehend aus zwei unterschiedlich grossen miteinander
verbundenen Bioreaktoren, wurde entwickelt. Mit diesem Modell konnte die realistischste
Umgebung eines Produktionsbioreaktors nachgeahmt werden und die Validität der zuvor
festgelegten Schwellenwerte wurde neu evaluiert. Mittels Verwendung verschiedener
Blasengrössen bei der Begasung wurde die Anreicherung von gelösstem CO2 simuliert,
resultierend in einem kritischen Schwellenwert von 100 mmHg, welcher zum Wachstumsstop
führte. Kombinationsexperimente im zwei-Zonen Modell zeigten, dass die Oszillation von
gelöstem Sauerstoff zwischen 40 und 60 % keinen negativen Einfluss auf Wachstum und
Metabolismus hatte. Andererseits resultierte die Kombination aus Stress und erhöhtem
gelösstem CO2 in reduziertem Wachstum und reduzierter Produktivität, obwohl beide
unterhalb des zuvor festgelegten Schwellenwertes waren. Diese Ergebnisse weisen klar darauf
hin, dass nur Kombinationsstudien mit mehreren Parametern eine gute Strategie zur
Erstellung eines „Design Spaces“ aufweisen.

V
Acknowledgements
First of all I would like to thank Prof. Massimo Morbidelli for giving me the opportunity to do
my thesis in his group and all the trust he gave me in this project. His great vision to turn a
Biologist into and Engineering was a hard task but finally successful and I am grateful for the
experiences that came along with it.
A very big thank you goes to my mentor and supervisor Miroslav Soos. He was the one
walking me through all the tiny details, while never losing the big picture. From him I learned
to see the value in each experiment, even those that seemed to be a failure. His patience in
discussing every written line over and over again is remarkable and his endurance in pushing
the boundaries will be a great example for my future live.
I want to thank my collaboration partner Merck Serono for supporting the thesis and including
me into their work environment. Special thanks at this point go to Matthieu Stettler, the USP
group manager, for his supervisions and ongoing unconditional support of the project. He
taught me that unconventional ideas and approaches also have value in an industrial
environment, although they might seem to be too much, off business. The same accounts for
Hervé Broly, VP Biotech Process Development and David Beatty, Senior Director EMD
Millipore, who both highly supported the strategy behind the project and the collaboration.
I would like to thank all my lab colleagues in Zurich for their support and daily care. Thanks
to Fabio Codari for all his good advice and being such a good friend. Thanks to Bertrand
Coquebert De Neuville for countless hours of climbing and the French lessons about Paris.
Thanks to Marija Ivarsson for supporting all my pedantic reconstruction ideas of several
fermentation labs and for her friendship and scientific guidance. Thanks to Vincent Diederich
for being such a helpful colleague and friend. Having you in my back was always the best.

VI
Thanks to Thomas Villiger and Daniel Karst for hopefully a continuous reoccurrence of our
Tarifa event. Thanks to Fabian Steinebach for all the Sunday morning brunches, may there be
plenty to come. Thanks to all the other former and current lab members of the Morbidelli
Group that crossed my way and were always and exclusively supportive.
I like to thank Thomas Heinzen, Youzhong Liu and Maximilian Lularevic for contributing
valuable results to this work with their Master theses, while challenging and educating me on
a scientific base as well as on a personal.
Thanks to the whole USP development group at Merck Serono who helped me learn and grow
as well a big thanks to the Analytics department covering all the countless samples I
delivered. Special thanks go to the other two PhD students at Merck Serono I shared my
office with. Thank you Francesca Zagari and Samira El Kouchni for being there and keeping
me motivated long after the usual business hours.
My highest gratitude at this point I want to express to my girlfriend Sabrina. She was always
there, taking care, listening, encouraging and loving me. Thanks you for never losing faith in
me - not in the past and hopefully also not in the future.
Final thanks go to my family being my strongest back bone and everlasting motivator. My
grandma Meta was always there with her experience and helped me and still does, to grow a
better person every day. I thank my brother Fabian, with his wife Simone for all the moral
support when times got rough. Thanks to Anna and Luis, their children, for all your priceless
smiles. At the very last thanks to my mother and my father to support me generously from my
youngest days and encouraging me to follow my dreams wherever they may lead me.

VII
Contents
Abstract I
Zusammenfassung III
Acknowledgements V
Chapter 1 Introduction 1
1.1 Outline ..................................................................................................................... 3
Chapter 2 A hydrodynamic stress scale down model 5
2.1 Introduction ............................................................................................................. 5
2.2 Materials and Methods ............................................................................................ 8
2.2.1 Cell lines and bioreactor setup ..................................................................... 8
2.2.2 Stress exposure device ............................................................................... 10
2.2.3 Offline Data Analysis ................................................................................. 14
2.3 Results ................................................................................................................... 15
2.3.1 Effect of oscillating stress exposure on cell growth .................................. 15
2.3.2 Cell Metabolism, Productivity and Amount of cell aggregates ................. 21
2.3.3 Stress threshold determination ................................................................... 23
2.4 Conclusion ............................................................................................................. 28
Chapter 3 Oscillating hydrodynamic stress at pilot scale 31
3.1 Introduction ........................................................................................................... 31
3.2 Materials and Methods .......................................................................................... 34

VIII
3.2.1 Bioreactor scales and setup ........................................................................ 34
3.2.2 Hydrodynamic stress characterization ....................................................... 36
3.2.3 Cell line and inoculum preparation ............................................................ 36
3.2.4 Cell cultivation and offline data analysis ................................................... 36
3.3 Results ................................................................................................................... 38
3.3.1 Shear characterization of the used bioreactor systems ............................... 38
3.3.2 Proliferation behavior of the cells .............................................................. 41
3.3.3 Cell metabolism and productivity .............................................................. 44
3.3.4 Effect on key product quality attributes ..................................................... 46
3.4 Conclusion ............................................................................................................. 48
Chapter 4 Comparison to production scale data 51
4.1 Introduction ........................................................................................................... 51
4.2 Results ................................................................................................................... 53
4.2.1 Growth and productivity in large scale compared to oscillating
hydrodynamic stress ................................................................................... 53
4.2.2 Large scale data comparison to individual stress thresholds ..................... 57
4.3 Conclusion ............................................................................................................. 59
Chapter 5 Simulation of large scale heterogeneity 61
5.1 Introduction ........................................................................................................... 61
5.2 Materials and Methods .......................................................................................... 63
5.2.1 Cell line and process description ............................................................... 63
5.2.2 Bioreactor setups and control ..................................................................... 64
5.2.3 Offline data analysis ................................................................................... 66
5.2.4 Bubble Size Analysis ................................................................................. 67
5.2.5 Characterization of mass transfer rates for O2 and CO2 ............................. 68
5.3 Results ................................................................................................................... 69
5.3.1 Simulation of elevated dissolved carbon dioxide profiles ......................... 70
5.3.2 Effect of elevated dCO2 on cell cultivation ............................................... 74
5.3.3 Determination of the maximum hydrodynamic stress threshold ............... 77
5.3.4 The two zone model for oscillating oxygen conditions ............................. 79
5.4 Conclusion ............................................................................................................. 83

IX
Chapter 6 Concluding remarks 85
Chapter 7 Outlook 89
Chapter 8 Appendix 91
8.1 A hydrodynamic stress scale down model ............................................................ 91
8.1.1 Hydrodynamic stress characterization ....................................................... 91
8.2 Oscillating hydrodynamic stress at pilot scale .................................................... 108
8.2.1 Determination of the maximum hydrodynamic stress of the used stirred
tank bioreactors ........................................................................................ 108
8.3 Simulation of large-scale heterogeneities ............................................................ 112
Nomenclature 115
Bibliography 117
Curriculum vitae 129
Publications 131
Conference proceedings 133


1
Chapter 1
Introduction
Modern society is growing older and older and with increased live span the risk to
develop chronicle illness like arthritis, cancer or diabetes is getting bigger with each year of
one’s life. The only medications know against such illnesses nowadays is the use of
monoclonal antibodies (mAb) mostly produced by mammalian cells (Walsh, 2010). To
support this increasing needs bioreactors of increased volumes are being used currently
reaching volumes of 20000 Liters (Birch and Racher, 2006; De Jesus and Wurm, 2011;
Varley and Birch, 1999). To meet the demand of the marked it is therefore required to scale
new or existing processes from the laboratory milliliter scale to GMP plants with several
thousands of liters. Due to the limited lifetime of a commercial patent of such products and
lengthy clinical trial, time is usually limited for the biochemical engineer to perform the
challenging tasks of process scale up and validation (Willoughby, 2006). Additional
complications occur through the multitude of cultivation devices used for mammalian cell
culture. In the early development of a bioprocess uncontrolled systems like static t-flasks,
agitated roller bottles or shake flasks are used to grow cells. With increasing the cell culture
volume single used bag based systems (i.e. Wave bioreactor), orbitally shaken systems (i.e.
Shake flasks, TubeSpin) and stirred bioreactor are commonly used for cell cultivation (Levine
et al., 2012; Stettler et al., 2007). Mixing dynamics in between those devices can be

Chapter 1 Introduction
2
completely different. Whereas in the stirred tank reactor the impeller causes homogenization
of the system it is the wall itself that is used in an orbitally shaken bioreactor. The wave
system uses a single use plastic bag on a horizontally shaken plate generating a wave that
mixes the cell culture. The cultivation environment of these conceptually very different
systems is tried to be compared and understood with detailed characterizations for mixing, gas
mass transfer, heat transfer and hydrodynamic stress (Li et al., 2006; Mollet et al., 2004;
Sieblist et al., 2011a, 2011b). Although all of those systems find application in a development
stage, the system of choice for manufacturing-scale has clearly become the stirred tank reactor
as it can be seen from its use in all major pharmaceutical companies (Chu and Robinson,
2001; Marks, 2003; Nienow, 2006; Xing et al., 2009).
The Quality by Design (QbD) concept introduced by the US Food and Drug
Administration (2009) expects from the producers a profound knowledge of their production
process and a detailed characterization of the relationship between process conditions and
critical quality attributes (CQA). This should include the understanding of the impact of raw
material variability and different production scales on the final product (Rathore, 2009; Seely
and Seely, 2003). Therefore, typical process optimization strategies are used already during
early process development by the screening of key operating parameters like temperature, pH
or dissolved oxygen (Heath and Kiss, 2007; Looby et al., 2011; Rouiller et al., 2012). The
influence of different scales however is rather seldom addressed, mostly due to the relative
small amount of data available from large scale and the limited possibilities for
experimentation at manufacturing-scale. The adverse effects of scale depend parameters, like
hydrostatic pressure, suboptimal gas mass transfer and a broad distribution of hydrodynamic
stress, nevertheless is often observed (Eon-duval et al., 2014; Gray et al., 1996; Mostafa and
Gu, 2003; Tsang et al., 2013) but for the systematic analysis of them, the development and
application of suitable downscale models is needed. The here presented work aims to review

Outline Chapter 1
3
the possibilities and develop methodologies to better understand inhomogeneity’s typical for
large scale.
1.1 Outline
This work pursues the following objectives:
Development of a downscale device to investigate oscillating hydrodynamic stress
on mammalian cells
The oscillatory nature of hydrodynamic stress is well known from stirred tank reactors
where the distribution of the hydrodynamic stress covers several orders of magnitudes.
A small-scale bioreactor device is to be developed being capable of mimicking the
high and low stress regions, while giving the possibility to determine a cell specific
threshold. Furthermore, the decoupling of stress magnitude and stress frequency is
aimed to allow the simulation of different reactor scales and mixing conditions. Ideally
the device is tested with several cell lines and processes to evaluate its general
applicability. Typical performance parameters like cellular growth and metabolism
will be used to classify the results. A special emphasis is moreover taken on the
productivity and product quality.
Verification of such a downscale device using pilot scale and manufacturing-scale
data
The before developed down scale model will be validated using especially designed
pilot scale experiments to show its predictive capabilities. After the determination of
the cell specific threshold for oscillating shear the verification will be performed by
running an experiment at pilot scale beyond the before determined threshold. The
comparison with large scale data obtained from manufacturing-scale should further
support the applicability of the model.

Chapter 1 Introduction
4
Development and application of a two zone bioreactor downscale model to
simultaneously simulate multiple heterogeneities known from manufacturing-
scale
Due to the presence of multiple heterogeneities in large scale a two zone model
consisting of two interconnected bioreactors is to be developed, which is capable of
simulating several scale dependent parameters simultaneously. The combination of
parameters will be (1) shear heterogeneity, (2) increasing dissolved carbon dioxide, (3)
feed based pH excursions and (4) oscillating dissolved oxygen. Growth behavior and
metabolism will be used to interpret the results, while single parameter results will be
compared to those obtained from combinatorial experiments.

5
Chapter 2
A hydrodynamic stress scale down model1
2.1 Introduction
Production of biopharmaceuticals is a delicate process considering the risks connected
to the administration of the product into human beings and the possibility of life-threatening
side effects (Attarwala, 2010; Schneider et al., 2006). To minimize these risks, the Quality by
Design (QbD) concept (US Food and Drug Administration, 2009) aims at increasing the
knowledge of the production process and characterizing the relationship between process
conditions and critical quality attributes (CQA). This includes the understanding of the impact
of raw materials variability and different production scales on the final product (Rathore,
2009; Seely and Seely, 2003). Key component of this concept is the design space that needs to
be characterized for each process step resulting in a maximum operating range, which
describes the overall process operational limits for which a defined product quality can be
ensured. Mostly, this evaluation is performed at development scale using design of
experiments (DoE), which raises the question how valid the results are at manufacturing scale
(Eon-duval et al., 2014). The micro environment at manufacturing scale can vary substantially
1 Original paper title: “Determination of the maximum operating range of hydrodynamic stress in mammalian
cell culture”

Chapter 2 A hydrodynamic stress scale down model
6
due to variations in mixing time, possibly inducing pH, oxygen and temperature gradients as
well as differences for oxygen transfer and carbon dioxide removal (Amanullah et al., 2001;
Li et al., 2010; Sieblist et al., 2011a). A maximum operating range established at small scale
(Eon-duval et al., 2012; Rouiller et al., 2012) needs to be proven valid across other scales.
Therefore options are limited. Application of a similar strategy at large-scale is possible;
however, it requires very high investment for the manufacturer. The alternative would be to
define a maximum operating range of scale independent parameters, e.g. O2 transfer, CO2
removal, temperature or maximum hydrodynamic stress (Eon-duval et al., 2014; Sieck et al.,
2014), instead of using scale dependent parameters like stirring speed or gas flow rate. In this
way some process parameters will be different at different scales, but can be defined as
unique scale independent parameters. This implies the use of scale independent parameters in
a DoE approach, to define a maximum operating range valid for multiple scales.
Process productivity is nowadays achieved by increasing cell densities beyond
20 106 cells/mL, optimizing specific productivity and culture duration. In these conditions
oxygen supply of state-of-the-art suspension cell cultures is challenging due to the
combination of high cell density, increased specific oxygen uptake rate and reduced mass
transfer caused by media components, i.e. surfactants. Compensation can be achieved by
increased aeration combined with the proper level of agitation. Although the effect of
hydrodynamic stress on mammalian cells is well-researched (Chisti, 2010, 2001) and
mammalian cells show good resistance against stress, as shown by several authors (Al-Rubeai
et al., 1995; Godoy-Silva et al., 2009b; Nienow, 2006; Nienow et al., 2013; Tanzeglock et al.,
2009), different thresholds of hydrodynamic stress are tolerated by various cell lines. Due to
this, any new process development within a QbD framework has to contain the response study
of a culture to the above mentioned scale independent parameters. In particular, the lower
limit will be determined by minimum O2 transfer and CO2 removal rates, and mixing

Introduction Chapter 2
7
performance of the bioreactor, while the upper limit of the maximum operating range will be
defined by the threshold values for lethal or sub-lethal effects due to stress. In classical single
vessel scale down models high stirring speed is used to reach the edge of failure for the
hydrodynamic stress (Nienow, 2009; Nienow et al., 2013). While this is the simplest possible
approach the application of high agitation drastically reduces the exposure period of cells to
highest stress values present closed to the impeller. Furthermore, depending on the robustness
of the investigated cells, to reach the stress threshold values it could require agitation rates
outside of the technical limit of the used motor. Additionally vortex formation becomes very
likely with the consequence of introducing air bubbles into the culture, a highly undesired
effect because it can cause cell damage (Nienow, 1998).
Therefore, the goal of this study was to develop a scale-down system allowing us to
cover a broad range of hydrodynamic stress avoiding the above mentioned limitations. After a
detailed characterization of the proposed system it was used to investigate the effect of
oscillating hydrodynamic stress on cell growth, productivity and product quality using two
recombinant manufacturing cell lines. The first was derived from a Chinese hamster ovary
(CHO) host cell line and the second from a mouse hybridoma (Sp2/0) host cell line. Since
various approaches were applied previously in the literature, where cells were exposed to
hydrodynamic stress, using laminar or turbulent conditions (Godoy-Silva et al., 2009b; Keane
et al., 2003; Kunas and Papoutsakis, 1990; Oh et al., 1989; Sieck et al., 2013; Tanzeglock et
al., 2009), both flow regimes were applied in the present study to identify an impact of the
flow type on cells performance.

Chapter 2 A hydrodynamic stress scale down model
8
2.2 Materials and Methods
2.2.1 Cell lines and bioreactor setup
Two model cell lines were used in this study. The first derived from a CHO host cell
line producing a fusion protein, which is in clinical development. The second was derived
from a Sp2/0 host cell line producing a commercialized monoclonal antibody.
Inoculum preparation for the CHO cells was started by thawing a cell bank vial and
directly diluting it into proprietary animal-derived component free expansion media. The
culture was kept at 37 °C and 90 % humidity. Cell density after thawing was
0.5±0.1 106 cells/mL and at least three sub-cultivation steps were performed every week to
keep the cell density below 2.5 106 cells/mL. Due to relatively high cell densities used for
bioreactor seeding, cells were diluted into a second nutritionally rich expansion media, during
the last 5 days of the inoculation preparation, to grow them to a cell density of more than
5 106 cells/mL. Independent of the bioreactor size, the duration of the expansion culture
was always kept at 14 days. Cells were seeded with a density equal to 1.4±0.1 106 cells/mL
into a bioreactor prefilled with animal-derived component free proprietary media. For this cell
line a 3 L bioreactor (Sartorius Stedim, Germany) was used equipped with online
temperature, pH and dissolved oxygen (DO) measurement probes (Mettler-Toledo,
Switzerland) and one elephant ear impeller inclined by 45° from horizontal plane, pumping
the liquid downwards (see Figure 2.1). Agitation speed during the culture was set to 150 rpm
and the volume average energy dissipation rate was calculated according to (Perry et al.,
1997):
5 3
PN D N
V (2.1)
where PN is the power number of the impeller, D the impeller diameter, N the agitation rate
and V the bioreactor volume.

Materials and Methods Chapter 2
9
Figure 2.1: Geometry of the used 3L bioreactor with loop system to generate an oscillating hydrodynamic stress
on cells. Nozzles of various diameters were used to generate different stress maxima (all values in cm).
Considering PN equal to 2.35 this results in being equal to 9.5 10-3 W/kg. Temperature
was controlled at 37 °C for the whole cultivation process. Due to lactate production of the
growing culture, the pH profile was characterized by a drift from the initial value of 7.2 down
to 7.0 over the first 2 days. After this reduction, the pH was kept constant until the end of the
culture by the addition of acid (lactic acid, 1 M) and base (NaOH, 0.5 M) when needed. To
keep the dissolved oxygen (DO) at the set-point of 50 % air saturation, a constant air flow of
5 mL/min combined with an oxygen on demand strategy was applied resulting in a total
volumetric gas flow being below 40 mL/min (0.013 vvm). Glucose was fed daily from day 3
in order to keep the glucose concentration in the bioreactor between 2 g/L and 4 g/L.
Additionally, a chemically defined bolus feed was added on day 6.
For the expansion of the Sp2/0 culture, cells were thawed into a complex proprietary
media and were first cultured in orbitally shaken T-flasks and then, when an appropriate

Chapter 2 A hydrodynamic stress scale down model
10
volume was reached, in spinner flasks (Integra, Switzerland). The culture was incubated at
37 °C and 90 % humidity. Initial cell density was 0.5±0.1 106 cells/mL and sub cultivation
was performed every 2 days to keep the cell density below 1.5±0.1 106 cells/mL. Cells were
kept in expansion for 29 days. Seeding into the bioreactor was performed using the same
media with a cell density of 0.3±0.1 106 cells/mL. Geometric details of the reactor were the
same as mentioned before but for agitation a radially pumping Rushton impeller was mounted
in the bottom part of the vessel and an elephant ear impeller, inclined by 45° from horizontal
plane pumping the liquid upwards, was mounted 8 cm above the Rushton impeller. Agitation
was set to 110 rpm (1.1 10-2 W/kg) and the DO was controlled at 70 % air saturation using
a constant air flow of 10 mL/min combined with oxygen on demand. The total gas flow rate
during the whole culture did not exceed 40 mL/min corresponding to 0.013 vvm. The pH was
controlled with CO2 addition at 7.1 until day 3 when a step change down to 6.9 was applied
and kept constant for the rest of the process. A single concentrated nutritional bolus feed was
added on day 2 containing a complex mixture of glucose, amino acids and proteins.
It is worth noting that preliminary experiments, for both cell lines, performed under
elevated gas flow rate confirmed that under the applied conditions damage of the cells by
aeration is negligible (Chisti, 2000). In all runs replicates were conducted to evaluate process
robustness. Error bars in the presented results represent one standard deviation obtained from
at least two independent runs.
2.2.2 Stress exposure device
To expose the cells to a well-defined hydrodynamic stress, two different experimental
setups were used. The first one is conceptually similar to that used by the Chalmers group
(Godoy-Silva et al., 2009a, 2009b; Hu et al., 2011; Mollet et al., 2007) and consists of a
standard 3 L bioreactor described above which was equipped with an external loop driven by
a contact-free centrifugal pump (BPS-200, Levitronix, Switzerland) as depicted in Figure 2.1.

Materials and Methods Chapter 2
11
By pumping the culture liquid through an external loop containing a nozzle an oscillating
hydrodynamic stress similar to the one present in stirred bioreactors was generated, with the
high stresses in the nozzle representing the region in the impeller vicinity and the lower
stresses those in the bioreactor bulk zone. To generate various magnitudes of the
hydrodynamic stress, nozzles of various diameters were mounted at the outlet of the
centrifugal pump. A large inner diameter tube equal to 10 mm was used to minimize the
effect of wall shear stress in the loop. The loop system was activated before inoculation so
that the stress exposure was applied from the very beginning of the culture. Besides the
hydrodynamic stress magnitude, the exposure period is another parameter which has to be
properly controlled (Sieck et al., 2013). It can be estimated from the mixing times ( mixt )
which are reported, for a 5000 L bioreactor in the order of 1 to 2 minutes, depending on the
conditions (Xing et al., 2009). The measured mixt of an in house 5000 L bioreactor used for
both cells at manufacturing scale was equal to 45 seconds, at culture operating conditions.
When considering the circulation time ( ct ) being 1/5 of mixt (Khang and Levenspiel, 1976;
Nienow, 1997) a lower estimate of the cell exposure period would be 12 to 24 seconds.
However, as it was shown by Soos et al. (2013), liquid is pumped through zones with largest
values of the hydrodynamic stress with much higher periods, in the order of several minutes.
Therefore, to approximate the oscillatory cell path in a large-scale bioreactor, an estimation of
the exposure period equal to two times the mixing time was used, i.e. 90 seconds. Considering
the working volume of the used bioreactor, i.e. 3L for all tested conditions the pump rotation
speed was adjusted to deliver a constant flow rate of 2 L/min through the external loop (Table
2.1) resulting in exposure period of 90 seconds.
Although correlations to estimate the averaged hydrodynamic stress inside a vessel, as
a function of the stirring speed are available in the literature, see for example Sánchez Pérez et
al. (2006), they cannot be applied to evaluate this quantity in the used external loop.

Chapter 2 A hydrodynamic stress scale down model
12
Table 2.1: Maximum hydrodynamic stress characterization of the used loop system shown in Figure 2.1 through
CFD calculations (see Appendix Figure 8.2 and Appendix text information) and using the shear sensitive
particulate system described by (Villiger et al., 2014).
nozzleD
(mm) _p u m p a g i tv
(rpm) loopQ
(L/min) nozzleRe
(‐)
maxCFD (Pa)
Pump / Nozzle
maxCFD (m2/s3)
Pump / Nozzle
maxEXP (Pa)
Pump + Nozzle
9 800 2 6769 17 / 1.6 417 / 21 15
6 900 2 10154 21 / 13 637 / 1250 21
5 1100 2 12184 24 / 22 832 / 1909 28
4 1300 2 15231 35 / 59 1769 / 3694 38
3 2400 2 20307 92 / 135 12222 / 11286 83
2.5 2800 2 24369 103
Therefore, to quantify the magnitude of the hydrodynamic stress in the external loop to
which the cells were exposed, a detailed CFD characterization of the used pump and nozzle
was performed. Detailed information on this can be found in the supplementary information.
Furthermore, the system was experimentally characterized by a shear sensitive particulate
system (Villiger et al., 2014). The maximum hydrodynamic stress values present in the
external loop obtained from both methods are summarized in Table 2.1. As can be seen, both
methods result in very similar values of the maximum hydrodynamic stress covering a range
from 15 Pa (3.3 102 W/kg) to 103 Pa (1.5 104 W/kg), which is similar to the values
reported by the Chalmers group (Godoy-Silva et al., 2009a, 2009b; Hu et al., 2011; Mollet et
al., 2007). Furthermore, under all investigated conditions the flow in the external loop was
turbulent with /nozzleR e Q D A being always above 6800 (Table 2.1), with Q referring
to the liquid flow rate, D and A being the nozzle diameter and its cross sectional area and
corresponding to the fluid kinematic viscosity.
To investigate the effect of the flow type a simple batch cultivation device generating
a laminar extensional flow at the entrance of a sudden contraction was employed as well

Materials and Methods Chapter 2
13
(Tanzeglock et al., 2009). Cells were cultured as described above for 2 days without any
feeding and exposed to the stress right after inoculation. The device consists of a gently
agitated thermostated reservoir containing the cell culture connected through tubing to a
syringe. To obtain the same exposure period as in the first system the speed of the syringe
pump was adjusted such that under all conditions, the cells were exposed to the high
hydrodynamic stress on average every 90 seconds. In between the syringe and the reservoir,
nozzles of variable sizes were installed to generate different stress values (see Figure 2.2)
ranging from 0.4 to 420 Pa.
Figure 2.2: Simple shear device used to generate oscillating stresses. A syringe pump containing cell culture
fluid is attached to a temperature-controlled vessel via a capillary. The capillary diameter is varied to generate
various magnitudes of the hydrodynamic stress.
Similar to the pervious setup also in this case cells were periodically exposed to
various levels of the hydrodynamic stress. The magnitudes of the hydrodynamic stress were
calculated by computational fluid dynamics (CFD) as discussed previously (Soos et al., 2010;
Tanzeglock et al., 2009). A summary of the obtained values is reported in Table 2.2. As can
be seen under all investigated conditions, the flow was laminar or transitional with n ozzleR e ,
being always below 1200. Thus, it was possible to compare the response of the studied cells
to similar stress magnitudes using both laminar and turbulent conditions. It is worth noting
that for both setups the exposure period can be easily changed and adapted to the mixing
Capillary
Syringe pump
Cell culture fluid
ThermostatedReservoir
Silicone tubingAir + 10% CO2
in/out
Capillary
Syringe pump
Cell culture fluid
ThermostatedReservoir
Silicone tubingAir + 10% CO2
in/out

Chapter 2 A hydrodynamic stress scale down model
14
conditions of any other sized bioreactor, simply by varying the flow rate generated by the
pump. Therefore, using this setup it is possible to independently tune magnitude and period of
the hydrodynamic stress, while covering a broad range of stresses as reported in the literature.
Table 2.2: Hydrodynamic stress characterization of the simple batch cultivation device (see Figure 2.2).
nozzleD
(mm) n o zzleQ
(mL/min) cu ltu reV
(mL)
nozzleRe
(‐)
maxCFD
(Pa)
maxCFD
(m2/s3)
2 20 30 222 0.4 0.1
0.5 20 30 887 40 921
0.5 27 40.5 1175 56 1795
0.3 10.6 15.9 784 109 6780
0.2 10.6 15.9 1175 420 101402
Compared to previous works (Godoy-Silva et al., 2009a, 2009b; Nienow et al., 2013)
where stress exposure was applied during or after the exponential phase, in the present work
the loop system was activated before inoculation so that the oscillating stress was applied
from the very beginning of the culture. We believe that stress exposure needs to be applied
throughout the whole culture, especially during the initial cultivation phase when the cells
tend to be more sensitive to any change of the environment (Sieck et al., 2013). Additionally,
compared to previous studies (Godoy-Silva et al., 2009a, 2009b) where the exposure period
needed to be changed (11 up to 333 minutes) to apply various stress levels, in this work the
exposure period, using both laminar and turbulent conditions, was kept constant allowing a
better comparison among various experiments.
2.2.3 Offline Data Analysis
Daily samples were taken from all cultures to follow the growth behavior and the
production and consumption of nutrients and metabolic products. The samples were used to
monitor cell density and viability (Vi CELL, Beckman Coulter, USA), pH (Seven Multi,

Results Chapter 2
15
Mettler-Toledo, Germany), pO2 and pCO2 (ABL5 blood gas analyzer, Radiometer,
Switzerland), metabolites (Nova CRT, Nova Biomedical, USA), turbidity (Turb 550, WTW,
Germany) and osmolality (Micro Osmometer, Advanced Instruments, USA). The amount of
produced protein was analyzed by standard HPLC analysis using Protein A. Product quality
was analyzed after Protein A capture by size exclusion chromatography for protein aggregates
(Berridge et al., 2009) and glycosylation analysis was performed via gel electrophoresis
(CGE-LIF) using the procedures published in the literature (Papac et al., 1998; Rapp et al.,
2011).
Specific consumption and production rates were calculated according to the following
equation (Adams et al., 2007):
1
2
( )i
it t
cq
t X X
(2.2)
where iq is the specific metabolic rate,
ic the concentration difference of the corresponding
metabolite, t the time difference in between two consecutive culture samples and X the cell
density. According to several published studies (Croughan and Wang, 1989; Lakhotia et al.,
1992; Senger and Karim, 2003; Tanzeglock et al., 2009), the measure of DNA was used to
quantify the amount of cells damaged due to necrosis. Therefore, the supernatant was
analyzed with Quant-iT dsDNA High-sensitivity assay kit (Life Technologies, Switzerland)
according to the instruction of the supplier.
2.3 Results
2.3.1 Effect of oscillating stress exposure on cell growth
Two different mammalian cell lines with significantly different processes were used to
investigate a cell line specific response to elevated hydrodynamic stress. Both cell lines were
cultivated in the 3L bioreactor equipped with the external loop that was used to expose cells

Chapter 2 A hydrodynamic stress scale down model
16
to various values of hydrodynamic stress. Nozzles of various diameters were applied to
generate different magnitudes of the hydrodynamic stress ranging from 15 Pa to 103 Pa. The
exposure period was set to 90 sec by applying the pumping speed through the loop equal to
2L/min. All data were compared to classical bioreactor cultivations without the external loop
attached. Student’s t-test was used to identify differences between cultivations performed at
different stress values. P-values above 0.1 where considered as equivalent to the control
culture. P-values below 0.1 were considered as different (indicated with * in Figures) and
values lower than 0.05 were considered as significantly different (indicated with ** in
Figures).
Time evolution of the measured viable cell density, corresponding viability and
product titer is presented in
Figure 2.3a-f. The presented error bars represent two standard deviations calculated at
least from two independent cultivations. In cases where no repetition of the sample was
available the presented error bar represents the largest value measured for standard conditions
at a given time point. As can be seen in
Figure 2.3a, time evolution of the viable cell density is characterized by rather large
variation leading to very comparable results when considering stresses lower than 83 Pa.
However, when increasing the stress values above this level differences can be observed.
Considering the fact that largest differences were observed at the end of the culture a
statistical significance between various stresses was evaluated at the harvest time point.
Calculated p-values with respect to the control conditions using Student’s t-test confirmed the
difference of the cultures performed at the stress level of 83 Pa and 103 Pa resulting in p-
values of 0.01 and 0.04, respectively. The other stress levels resulted in p-values above 0.3,
i.e. no significant difference compared to the control conditions. From the viability data
presented in

Results Chapter 2
17
Figure 2.3b, it can be seen that for all conditions the most significant variation was
observed on day 2.
Figure 2.3: Time profile of the viable cell density (a, d), cell viability (b, e) and product titer (c, f) measured for
CHO cell line (a, b, c) and for Sp2/0 cell line (d, e, f). Symbols correspond to various magnitudes of the
hydrodynamic stress introduced with a classical single vessels, 1.2 Pa (, Sp2/0 control), 2.2 Pa (, CHO
control) or the oscillating hydrodynamic stress loop systems 15 Pa (), 21 Pa (), 38 Pa (), 83 Pa () and
103 Pa (). Error bars represent two standard deviations from at least 2 independent experiments. Error bars
shown for Sp2/0 cells represent variation calculated for standard conditions.
0
1
2
3
4
5
CHO Sp2/0
20
40
60
80
100
Time [days] Time [days]0 1 2 3 4 5 6 7 8 9 10 11
0.0
0.2
0.4
0.6
0.8
1.0
123456789
Via
ble
cell
dens
ity [1
06 cel
ls/m
L]
60
70
80
90
100
Via
bilit
y [%
]
a d
eb
0 1 2 3 4 5 6 7 8 9 10
0.0
0.2
0.4
0.6
0.8
1.0 c
Tite
r [g
/L]
f

Chapter 2 A hydrodynamic stress scale down model
18
Although cells recover after the viability drop a systematic reduced viability is present
while increasing the hydrodynamic stress, with lowest viability measured for highest stresses
(see
Figure 2.3b). This was confirmed by p-values calculated on day 2, which resulted in
values above 0.5 for stress below 83 Pa. In contrast p-values evaluated for hydrodynamic
stress equal to 83 Pa and 103 Pa were equal to 0.1 and 0.02, again confirming statistical
difference with respect to the standard cultivation conditions. The last quantity presented in
Figure 2.3c is the time evolution of the measured product titer. Differences can be seen
already from the time evolution and were further confirmed by Student’s t-test, with
calculated p-values of 0.05 and 0.002 for stresses equal to 83 and 103 Pa, respectively. Lower
stresses showed no statistical difference, with p-values above 0.15. It is worth noting that for
all above mentioned parameters statistical difference obtained from Student’s t-test is in
closed agreement with the comparison of error bars derived from two standard deviations
which therefore can be used for direct comparison of the measured quantities.
Results measured for the other cell line (Sp2/0) are presented in
Figure 2.3d to f. Since for elevated stresses no experimental repetitions were
performed statistical analysis was not possible for this cell line. Instead, for better visual
comparison error bars calculated from standard runs, corresponding to two standard
deviations, were used for all other conditions. As can be seen, the qualitative response of
these cells to elevated stress was similar to that measured for CHO cells even though Sp2/0
cells showed slightly reduced growth already at 15 Pa and a strong lethal response was
observed for stress equal to 83 Pa (see
Figure 2.3d). Moreover, a clear difference can be seen at the end of the culture, where
for intermediate stress levels (15 or 21 Pa) viable cell density was almost 100% higher than

Results Chapter 2
19
that measured for the standard conditions where no external loop was used. When comparing
the profiles of cell viability measured for CHO and Sp2/0 cells shown in
Figure 2.3b and e, respectively, it can be seen that in contrast to CHO cells only a
small drop in cell viability was observed during the first day. The profile is characterized by
an initially constant value of cell viability followed by a monotonic decline at the later stage
of the culture (see
Figure 2.3e). When higher stress values were applied, i.e. 38 Pa, the viability started to
decay earlier, while in the case of 83 Pa the cell viability decayed immediately after
inoculation. It is worth noting that an increased longevity with higher viability at the end of
the culture was observed for data measured in the small-scale loop model applying stress
values of 15 or 21 Pa. This is also reflected in the product amount, shown in
Figure 2.3f with highest titers at the harvest. This indicates that the effect of stress
could even positively enhance cell growth, viability and productivity, supporting the
presented methodology with oscillating stress (Lakhotia et al., 1992; Senger and Karim,
2003).
Since the measurement of viability based on trypan blue staining determines only the
viable and dead (necrotic) cells, which represent the total amount of cells used to calculate the
culture viability, these values could be affected by the missing information of lysed cells. To
overcome this limitation and to detect the total amount of lysed and necrotic cells the analysis
of double stranded DNA was performed on the supernatant of the cultures (Tanzeglock et al.,
2009). Due to differences in viable cell density between two studied processes the increase of
DNA amount released between working day 0 and 2 was considered. Obtained results
measured for different stress values are plotted in Figure 2.4.

Chapter 2 A hydrodynamic stress scale down model
20
Figure 2.4: Change in DNA concentration in culture supernatant for CHO () and Sp2/0 cells () exposed to
oscillating stress form day 0 to day 2. Error bars represent two standard deviations (N = 2) and p-values are
indicated with stars (* for p < 0.1, ** for p < 0.05). Error bars shown for Sp2/0 cells represent variation
calculated for standard conditions.
It can be seen that higher values of DNA amount were measured for Sp2/0 cells
compared to CHO cells. By increasing the stress level in both cases there in an increase in the
DNA amount in the supernatant with a more than 2 fold increase for the Sp2/0 culture while
for the CHO culture an approximately 5 fold increase was measured when applying highest
stress values. Calculated p-values for the CHO cell line where 0.005 for the 83 Pa condition
and 0.07 for the 103 Pa condition while for other stresses the p-values were above 0.1. When
considering lower seeding cell density for Sp2/0 (approximately one order of magnitude with
respect to CHO cell culture) measured higher amount of DNA indicates that Sp2/0 cell
undergo substantial lysis. This would explain the difference in the viability profile shown in
Figure 2.3b and e, where in the case of Sp2/0 cells initially no significant drop was
observed. In this case weak cells were directly lysed without being detected as dead cells
resulting in almost constant viability over the first three days of the culture. In the case of
CHO cells, lysis was not that severe and therefore dead cells can be still detected resulting in
a drop of cell viability. This is a further indication that Sp2/0 cells are more fragile compare to
CHO cell. Presented results clearly show that, depending on the environment, the cells can
react with increased growth, as seen for the CHO cells (
Stress [Pa]1 10 100
0.2
0.4
0.6
0.8
1.0
**
*
D
NA
[mg/
L]

Results Chapter 2
21
Figure 2.3a) or with decreased growth or even death, as observed for the Sp2/0 cells (
Figure 2.3c). Similar observations made by others (Davies et al., 1986; Lakhotia et al.,
1992) indicate that great care has to be taken when evaluating the response of cells to elevated
stress.
2.3.2 Cell Metabolism, Productivity and Amount of cell aggregates
Cell culture samples were measured every day for glucose (GLC), lactate (LAC),
glutamine (GLN), glutamate (GLU) and ammonia (NH4) as described in the materials and
methods section. From the obtained values, specific rates were calculated according to Eq.
(2.2). When considering 95 % confidence interval it was found that no significant changes
were observed for the different stress values applied (see Appendix Figure 8.8). Except the
conditions when the culture was dying immediately after inoculation, similar effects of the
hydrodynamic stress were observed on the amino acid metabolism (see Appendix Figure 8.9
and Figure 8.10) with all values lying within the experimental error (two standard deviations
representing a 95% confidence interval) of the standard condition. This clearly indicates that
for both cell lines their metabolism was unchanged even though crossing the threshold values
for cell growth and productivity.
Another parameter which could be affected by the applied stress is the cell
productivity. The specific productivity ( T iterq ) measured for both cells as a function of time
are plotted in Figure 2.5.

Chapter 2 A hydrodynamic stress scale down model
22
Figure 2.5: Time profile of the specific productivity for the CHO cells (a) and the Sp2/0 cells (b). Symbols
correspond to various magnitudes of the hydrodynamic stress introduced with a classical single vessels,
1.2 Pa (, Sp2/0 control), 2.2 Pa (, CHO control) or the oscillating hydrodynamic stress loop systems
15 Pa (), 21 Pa (), 38 Pa (), 83 Pa () and 103 Pa (). Error bars represent two standard deviations from
at least 2 independent experiments. Error bars shown for Sp2/0 cells represent variation calculated for standard
conditions.
As can be seen for the CHO cell line, similar T iterq were measured for stress values up
to 38 Pa. Statistics revealed that the apparent decrease in T iterq at 83 and 103 Pa is significant
with p-values below 0.1. In comparison, the specific productivity of the Sp2/0 cell line was
similar for all conditions until day 6. After this point, a reduction of T iterq is observed for the
control culture while almost constant T iterq (except on the last day) was measured for stress
values below 38 Pa (see Figure 2.5b). This represents an increase of about 30 – 50 % with
respect to the control culture. It is worth noting that for the highest stress value, no growth
was observed (see
Time [days]
5
10
15
20
25a
0 1 2 3 4 5 6 7 8 9 10 110
10
20
30
40
50b
q Tit
er [
pg/c
ell*
day]

Results Chapter 2
23
Figure 2.3c). As a results, no protein was produced, hence the absence of data in
Figure 2.5b.
Furthermore, the cell size and the amount of cell aggregates, present during the
culture, were measured. As can be seen from Figure 8.11a and c in the Appendix, cell size
varies during the cultivation, increasing for CHO cells while an opposite trend was measured
for Sp2/0 cells. Student’s t-test for the CHO cell cultivations with p-values of 0.08 for 21 Pa
and 0.1 for 38 Pa confirmed the observed increase of the cell diameter. A significant
statistical difference for reduced cell size, with p-values lower than 0.01, were found for
values of 83 and 103 Pa. In the case of Sp2/0 there is small decrease of cell size for 38 Pa and
a substantial reduction for stress equal to 83 Pa. Furthermore, from Figure 8.11b and d in the
Appendix it can be seen that for both cell lines a substantial amount of cell aggregates is
present during the culture, which is a phenomena observed previously by several authors
(Borys and Papoutsakis, 1992; Renner et al., 1993). However, this amount becomes
systematically lower when the applied stress increases, reaching almost no aggregates present
at highest stress values.
2.3.3 Stress threshold determination
To determine the upper threshold for a viable and productive culture and to identify its
cell line dependency, we further analyzed the available data. The obtained data are
summarized for both cell lines in
Figure 2.6 using the various parameters discussed above. In the case of statistical
difference, i.e. p-values evaluated from Student’s t-test below 0.1 or 0.05, values were
indicated with one or two starts. Stress values for the reactors without external loop system
attached were estimated using the correlation developed by Villiger et al. (2012). It can be
seen that in all cases a rather similar trends are obtained, which is characterized by a region
where an increase of the hydrodynamic stress has no effect (horizontal lines in

Chapter 2 A hydrodynamic stress scale down model
24
Figure 2.6), and a region where the stress has a rather strong impact. Due to the
limited number of experiments performed at high stress values trends of the presented
quantities were obtained by a linear fit of the points showing statistical difference (p-value <
0.1 or non-overlapping error bars) plus the one before. The demarcation line represents the
stress threshold value and characterizes a maximum operating range of the hydrodynamic
stress for a given cell line. Interestingly, as can be seen from
Figure 2.6, the threshold is dependent on the measured parameter. In particular, the
initial decrease of the viability during the first 24 h (for detailed evaluation see Appendix
Figure 8.7) is very similar for both cell lines resulting in a stress threshold around 25 Pa.
Applying higher stress resulted in a large decay of the viability (see
Figure 2.6a and e).
The results from the laminar shear device are shown in
Figure 2.6a (crosses). As can be seen cell viability drops down at slightly higher
values of the hydrodynamic stress compared to the loop operated under turbulent conditions,
indicating different responses of the cells to the flow type. This is in agreement with Nienow
(2006) who suggested to apply turbulent conditions already in the scale down models when
aiming to simulate a large scale bioreactors(Nienow, 2006)(Nienow, 2006)(Nienow,
2006)(Nienow, 2006)(Nienow, 2006)(Nienow, 2006).

Results Chapter 2
25
Figure 2.6: Hydrodynamic stress threshold determination (dashed lines) based on the viability drop during the
first 24 h of the culture (a, e), the average size of the cells during exponential phase from day 1 to 4 (b, f), the
specific DNA amount in the culture on day 4 (c, g) and the specific productivity of the cells during exponential
phase from day 2 to 6 (d, h). Data obtained from the simple batch device operated under laminar conditions ()
is shown in (a), while fed-batch data is shown with open circles (). Error bars represent two standard
deviations from at least 2 independent experiments. Error bars shown for Sp2/0 cells represent the variation
calculated for standard conditions. For the CHO cell line p-values were calculated for all data and visualized
with stars (* for p < 0.1, ** for p < 0.05).
-20
-15
-10
-5
CHO SP2/0
-25
-20
-15
-10
-5
15.0
15.5
16.0
16.5
10
12
14
16
0.00
0.05
0.10
0.15
0.0
0.2
0.4
Stress [Pa]1 10 100
6
8
10
12
Stress [Pa]1 10 100
0
10
20
30
40
50
** *
a
Via
bili
ty d
cr.
[%/d
ay] e
****
b
Cel
l siz
e [
µm
]
f
***
c
qD
NA [
pg
/ce
ll*d
ay]
g
*
d
qT
iter [
pg/c
ell*
day]
h

Chapter 2 A hydrodynamic stress scale down model
26
Similar observations were made when different devices have been used to measure the
cell response, e.g. rheometer vs. contracting nozzle, since cells respond differently when
exposed to steady simple shear or to extensional flow patterns (Tanzeglock et al., 2009).
The same methodology to determine the stress threshold value was applied for other
parameters such as the cell size evaluated during exponential phase (
Figure 2.6b, f), the specific DNA content in the supernatant calculated on day 4 (
Figure 2.6c, g) and the specific productivity evaluated during exponential phase (
Figure 2.6d, h). In these cases p-values were calculated for all points against
corresponding control conditions and are shown in
Figure 2.6 when they were smaller than 0.1. From these four process parameters an
average value and a corresponding standard deviation was calculated per cell line, resulting in
an average hydrodynamic stress threshold for the CHO cell line of 32.4±4.4 Pa and for the
Sp2/0 of 25.2±2.4 Pa. As already indicated by the growth profiles and confirmed also by the
results presented in
Figure 2.6, the studied CHO cell line is more robust than the Sp2/0 cell line.
When producing a monoclonal antibody, the quality of the target molecule is even
more important than the growth and metabolic profiles of the culture. Therefore, similarly to
the cell behavior we investigated the critical quality attributes (CQA) such as the amount of
protein aggregates and the glycosylation of the secreted proteins as a function of the applied
stress. The fraction of aggregates was determined via size exclusion chromatography on three
different days, during exponential phase, at peak cell density and during stationary phase.
Although an increase of protein aggregates over time could be observed (see Appendix Figure
8.12a and b) the difference at a given day in between the applied conditions was negligible.
The fusion protein produced by the CHO cells showed relatively high amounts of aggregates
of about 18 %, while negligible amounts of protein aggregates (below 1 %) were measured

Results Chapter 2
27
for the Sp2/0 cells. Such large amounts for a non-purified fusion protein are not surprising
and agree with studies published in the literature (Rouiller et al., 2012; Shukla et al., 2007).
The percent change of the major glycoforms at the applied stress levels for both cell
lines is shown in Figure 2.7.
Figure 2.7: Comparison of the major glycoforms of the produced proteins, analyzed at different oscillating
hydrodynamic stresses on day 10. Values were normalized with respect to the control bioreactor. Controls are
shown as zero value with corresponding error bars, which represent two standard deviations (N = 2). Error bars
shown for Sp2/0 cells represent the variation calculated for standard conditions. Control stress for the CHO
culture (a) was 2.2 Pa, for the Sp2/0 culture (b) 1.2 Pa.
Values were normalized to the control condition (3L bioreactor without external loop
attached) and sorted in ascending order. The first bar is always zero and represents the control
with the corresponding error bars obtained from at least two non-parallel independent
cultivations and therefore corresponding to a 95% confidence interval. As can be seen from
G0 G1 G2
30
20
10
0
10
20
30
G0 G1 G2
-6-4-202468
10
a
15 Pa 21 Pa 28 Pa 38 Pa 83 Pa 103 Pa
b
Per
cent
cha
nge
com
pare
d to
con
trol
[%
]
Chapter 2 A hydrodynamic stress scale down model
28
Figure 2.7a the variation of the various glycoforms is not significant since under all tested
stresses the error bars overlap. In the case of the Sp2/0 cell line the variation is even less
pronounced (see Figure 2.7b). Contrary to other reports (Godoy-Silva et al., 2009a) we can
conclude that a change in the glycosylation pattern without a change in the growth behavior is
very minimal, which is a finding similar to that recently reported by Nienow et al. (2013)
indicating values below 5 %.
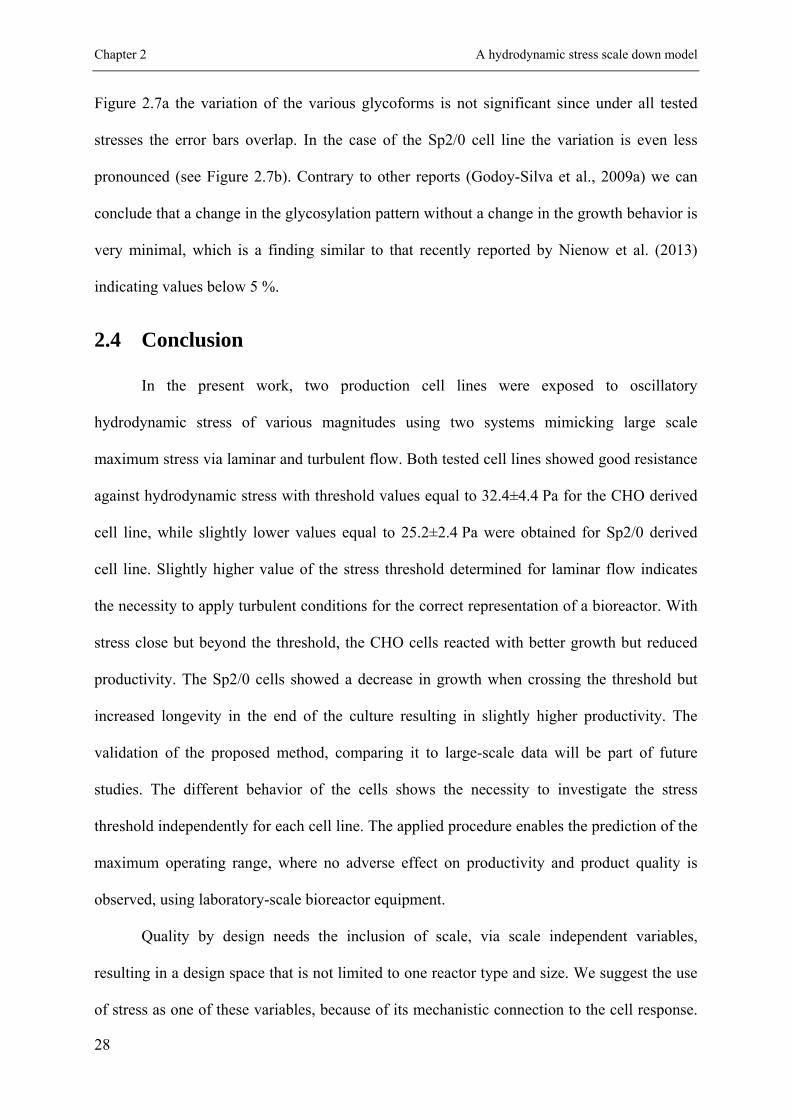
2.4 Conclusion
In the present work, two production cell lines were exposed to oscillatory
hydrodynamic stress of various magnitudes using two systems mimicking large scale
maximum stress via laminar and turbulent flow. Both tested cell lines showed good resistance
against hydrodynamic stress with threshold values equal to 32.4±4.4 Pa for the CHO derived
cell line, while slightly lower values equal to 25.2±2.4 Pa were obtained for Sp2/0 derived
cell line. Slightly higher value of the stress threshold determined for laminar flow indicates
the necessity to apply turbulent conditions for the correct representation of a bioreactor. With
stress close but beyond the threshold, the CHO cells reacted with better growth but reduced
productivity. The Sp2/0 cells showed a decrease in growth when crossing the threshold but
increased longevity in the end of the culture resulting in slightly higher productivity. The
validation of the proposed method, comparing it to large-scale data will be part of future
studies. The different behavior of the cells shows the necessity to investigate the stress
threshold independently for each cell line. The applied procedure enables the prediction of the
maximum operating range, where no adverse effect on productivity and product quality is
observed, using laboratory-scale bioreactor equipment.
Quality by design needs the inclusion of scale, via scale independent variables,
resulting in a design space that is not limited to one reactor type and size. We suggest the use
of stress as one of these variables, because of its mechanistic connection to the cell response.

Conclusion Chapter 2
29
Inclusion of stressors resulting from heterogeneities in O2 and CO2 as well as pH fluctuations
can complete such a scale independent design space.


31
Chapter 3
Oscillating hydrodynamic stress at pilot scale2
3.1 Introduction
Bioprocess scale-up in cell culture industry is a task, still based on historical
experience than scientific knowledge. Even though performed regularly, differences in
process performance are commonly observed in-between scales which are mainly resulting
from intrinsic differences between laboratory and production scales (Humphrey, 1998; Li et
al., 2006; Mostafa and Gu, 2003; Xing et al., 2009; Yang et al., 2007). Classical scaling rules
are applied by keeping various reactor characteristic such as power input or tip speed constant
to decide on the applied operating parameters in larger scales (Glacken et al., 1983; Ju and
Chase, 1992; Marks, 2003; Nienow, 2006). However, it is never possible to full fill all the
criteria because they are partially contradicting (Schmidt, 2005) often resulting in a
compromised solution. Further complication comes from non-unique determination of the
maximum values of shear rate or hydrodynamic stress tolerated by cells.
Pioneering works in bubble free systems with classical single vessel bioreactors were
conducted by Oh et al. (1989) reporting a agitation tip speed ( tipv ) of 1.4 m/s, corresponding
2 Original paper title: “Pilot scale verification of an oscillating hydrodynamic stress model used for mammalian
cell culture”

Chapter 3 Oscillating hydrodynamic stress at pilot scale
32
to a power input of 1.9 10-1 W/kg, to ensure no cell damage. In contrast, Leist et al. (1986)
reports tip speeds of 3.5 m/s (1.5 W/kg) and Kunas and Papoutsakis (1990) of 2.6 m/s
(2.7 W/kg) to be safe for cell culture, while Al-Rubeai et al. (1995) report tipv of 1.9 m/s
(3.1 10-1 W/kg) to be above the cell damage threshold. This disagreement between various
authors is further multiplied by the presence of bubbles. Under such conditions and without
the presence of shear protective agents, like Pluronic F-68, critical tip speeds around 0.5
(3.3 10-2 W/kg) and maximum gas flow rates between 0.02 and 0.03 vvm have been
reported (Cruz et al., 1998; Oh et al., 1992). Although addition of Pluronic can minimize the
effect of bubbles (Chalmers and Bavarian, 1991; Jöbses et al., 1991; Ma et al., 2004;
Murhammer and Goochee, 1990; Oh et al., 1992), it results in reduction of mass transfer
(Murhammer and Pfalzgraf, 1992; Sieblist et al., 2013), therefore higher stirring speeds need
to be applied to meet the oxygen requirements of current production cell lines. Furthermore, it
might be impossible to reach the cell specific threshold using high agitation in classical single
vessel bioreactors due to very robust cells, equipment limitations or vortex formation
resulting in bubble entrapment and foam formation. Reactor runs without head space might be
a solution but can be operational challenging. The change of environmental parameters like
the substantially reduced exposure time and the increased mass transfer complicate the
comparison with other scales. Moreover, the above mentioned approaches don’t address the
heterogeneous nature of large scale reactors, i.e. spacial variations in stress (Soos et al., 2013),
pH (Osman et al., 2002) or O2 (Amanullah et al., 1993; Serrato et al., 2004).
To simulate oscillating hydrodynamic stress a laminar extensional flow device was
developed by the group of Chalmers (Godoy-Silva et al., 2009a, 2009b; Ma et al., 2002;
Mollet et al., 2007) using an external loop forcing the culture broth through a well-defined
nozzle, exposing the cells to laminar stress values ranging from 1.2 10-2 W/kg to
6.4 103 W/kg. However, the device is not capable to fully decuple exposure frequency and

Introduction Chapter 3
33
exposure magnitude, limiting its applicability when aiming to mimic different large scale
conditions. Additionally, as discussed by Nienow et al. (Nienow, 2006; Nienow et al., 2013)
the application of laminar flow represent an intrinsic difference when comparing to the
turbulent flow of manufacturing-scale bioreactors. Building on this argument Sieck et al.
(2013) proposed a procedure to oscillate hydrodynamic stress in a turbulent operated classical
single stirred bioreactor, by changing the agitation speed periodically according to the mixing
conditions present in the manufacturing-scale. Although this approach gets closer to the
reality it accepts the fact that due to perfect mixing cells are exposed to the high stress values
at much higher frequencies than observed at manufacturing-scale. To employ turbulent flow
and decoupling exposure period and hydrodynamic stress magnitude, Neunstoecklin et al.
(2014a) recently proposed a scale-down model, where a 3 L bioreactor is equipped with an
external loop capable of generating a broad range of maximum hydrodynamic stresses (15 Pa
to 103 Pa). The proposed system was used to determine the stress threshold values for a Sp2/0
and a CHO cell line using a fed-batch cultivation process. The measured quantities, including
growth, metabolism, product quantity and quality, agreed well with those measured in large
scale bioreactors, thus supporting the proposed methodology. Despite this agreement the
applied stresses in large scale bioreactors never exceed the determined threshold values so the
true validity of the proposed method was never demonstrated beyond the edge of failure.
Furthermore, no data of this kind for direct comparison exist in the open literature.
Therefore, the goal of this work is to provide such a validation, targeting stresses
above the previously measured threshold value for the Sp2/0 cells (Neunstoecklin et al.,
2014a) using a 300 L pilot scale bioreactor. In order to apply comparable operating conditions
to those used in the scale-down model, the maximum hydrodynamic stress in the 300 L pilot
scale bioreactor was characterized using a shear sensitive particulate system (Villiger et al.,
2014). Measured growth behavior, metabolism, productivity and critical quality attributes

Chapter 3 Oscillating hydrodynamic stress at pilot scale
34
from the 300 L scale were compared to historical data from the oscillating hydrodynamic
stress loop model.
3.2 Materials and Methods
3.2.1 Bioreactor scales and setup
Two different bioreactor sizes were used to culture the above mentioned cells. The
development scale was a 3L bioreactor (Sartorius Stedim, Germany), followed by a pilot scale
bioreactor with a working volume of 300 L (New MBR, Switzerland). All reactors were
equipped with baffles and a combination of two impellers. One Rushton impeller mounted at
the bottom of the vessel and an elephant ear impeller mounted above, inclined by 45° from
horizontal plane pumping the liquid upwards. Geometric details of all scales are given in
Figure 3.1. The basic reactor operating parameters are compared in Table 3.1. Calculation of
the volume average energy dissipation rate for all scales was performed according to the
following equation (Perry et al., 1997):
5 3
PN D N
V (3.1)
where PN is the power number of the impeller, D the impeller diameter in meter, N the
agitation rate in 1/s and V the bioreactor volume in m3. Impeller Reynolds numbers
2 /ImpRe ND are given to verify turbulent conditions.

Materials and Methods Chapter 3
35
Figure 3.1: Dimensions of bioreactors used in this study. Values refer to bioreactors with a volume equal to 3 L
and 300 L (all values in cm).
Table 3.1: Applied operating conditions for the presented bioreactor cultivations.
BioV
(L)
N (rpm)
D (m)
tipv
(m/s)PN
(‐)
ImpRe
(‐)
(W/kg)
3 110 0.06 0.346 6.66 9474 1.06 10-2
300 71 0.23 0.855 3.8 89856 1.35 10-2
300 150 0.23 1.806 3.8 189838 1.27 × 10‐1

Chapter 3 Oscillating hydrodynamic stress at pilot scale
36
3.2.2 Hydrodynamic stress characterization
Maximum hydrodynamic stress values in the bioreactors used for this study were
determined using a non-cellular based shear sensitive system (Villiger et al., 2014). It is based
on the measurement of the maximum stable size of aggregates composed out of polymeric
nanoparticles. When exposed to certain hydrodynamic stress these aggregates undergo
breakup until steady state size is reached, which is controlled by the maximum stress present
in the system (Soos et al., 2013). A detailed description of the method and the results are
provided in the supplementary material.
3.2.3 Cell line and inoculum preparation
The cell line used in this study was derived from a Sp2/0 host cell line producing a
commercialized monoclonal antibody. A Cell bank vial was directly thawed into complex
proprietary media for the expansion of the cells. Density after thawing was
0.5±0.1 106 cells/mL and sub cultivation of the cells was performed every other day to keep
the cell density below 1.5±0.1 106 cells/mL. Initially orbitally shaken T-flasks were used
and after reaching an appropriate volume glass spinner flasks (Integra, Switzerland) were used
to culture the cells at 37 °C with 90 % humidity. Spinner flasks were aerated through an open
pipe sparger using air supplemented with 5 % CO2. Duration of the expansion was always 29
days before cells were used for inoculation. Seeding was performed into a prefilled bioreactor
using the same media, with a cell density of 0.3±0.1 106 cells/mL.
3.2.4 Cell cultivation and offline data analysis
In the 3L system the agitation rate was set to 110 rpm and the DO was controlled at
70 % air saturation with a constant air flow of 10 mL/min combined with oxygen on demand.
The total gas flow rate during the whole culture never exceeded 40 mL/min, corresponding to
0.013 vvm. The overall power number for the two mounted impellers was assumed by the

Materials and Methods Chapter 3
37
addition of the individual ones, being 4.96 for the Rushton turbine (Sieblist et al., 2011b) and
1.7 for the up pumping marine impeller (Zhu et al., 2009). With a total PN being equal to
6.66 the average power input results in equal to 1.06 10-2 W/kg. For the determination
of the hydrodynamic stress threshold for the given cell line an external loop was attached to
this reactor enabling the introduction of oscillating stress, ranging from 15 to 103 Pa. For
more details readers should refer to our previous work (Neunstoecklin et al., 2014a). The
300 L bioreactor was controlled at an agitation speed of 71 rpm and a DO set point of 60 %
air saturation. The latter was first controlled with air until a flow rate of 0.4 L/min was
reached. After that oxygen was added to the gas stream on demand resulting in maximum
total volumetric gas flow rates of 2 L/min, corresponding to 0.0067 vvm. At this scale PN
was determined from CFD studies being equal to 3.8 giving an of 1.35 10-2 W/kg. To
expose the culture to stress values beyond the threshold, this reactor was furthermore operated
at an agitation speed of 150 rpm corresponding to equal to 1.27 10-1 W/kg with max
equal to 28 Pa. All other parameters were kept as mentioned before. The pH was controlled at
all scales via CO2 with a set point of 7.1 until day 3 when a step change down to 6.9 was
applied. This value was kept constant for the rest of the process. A concentrated nutritional
bolus feed was added when a cell density of 2 106 cells/mL was reached, usually occurring
on day 2 or 3, containing a complex mixture of glucose, amino acids and proteins.
Daily samples were taken from all cultures to follow the growth behavior and the
production and consumption of nutrients and metabolic products. The samples were used to
monitor cell density and viability (Vi CELL, Beckman Coulter, USA), pH (Seven Multi,
Mettler-Toledo, Germany), pO2 and pCO2 (ABL5 blood gas analyzer, Radiometer,
Switzerland), metabolites (Nova CRT, Nova Biomedical, USA), turbidity (Turb 550, WTW,
Germany) and osmolality (Micro Osmometer, Advanced Instruments, USA). The amount of
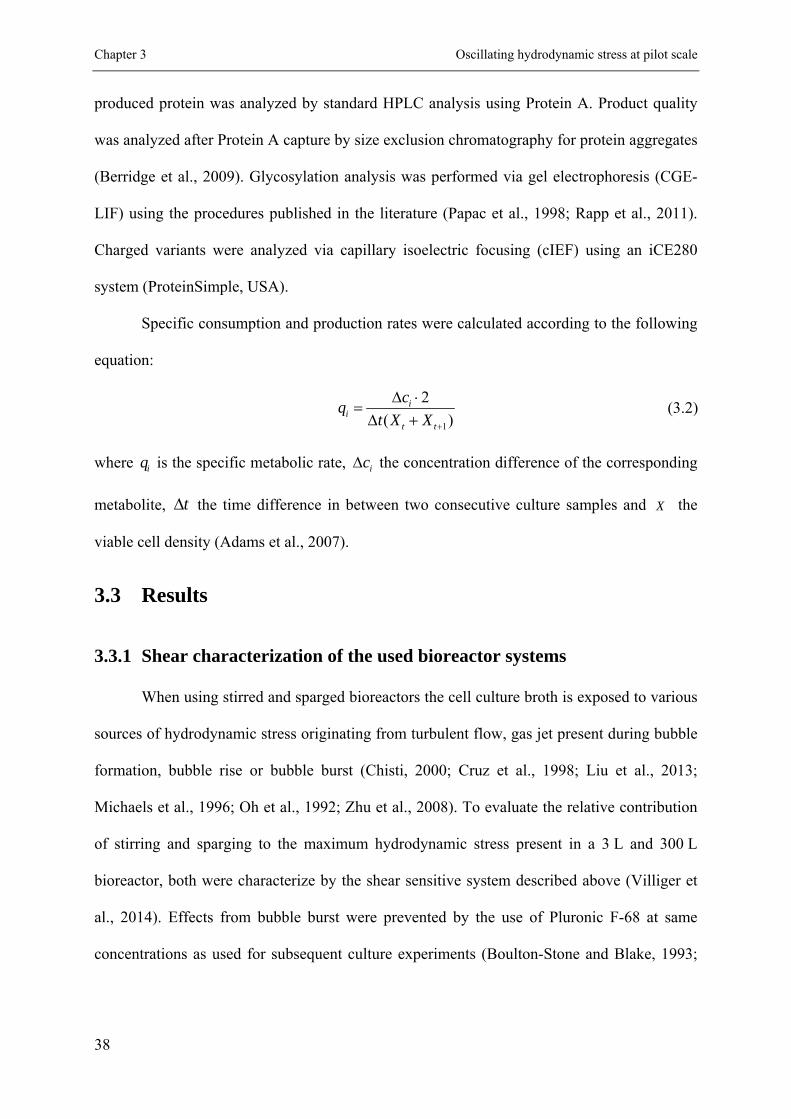
Chapter 3 Oscillating hydrodynamic stress at pilot scale
38
produced protein was analyzed by standard HPLC analysis using Protein A. Product quality
was analyzed after Protein A capture by size exclusion chromatography for protein aggregates
(Berridge et al., 2009). Glycosylation analysis was performed via gel electrophoresis (CGE-
LIF) using the procedures published in the literature (Papac et al., 1998; Rapp et al., 2011).
Charged variants were analyzed via capillary isoelectric focusing (cIEF) using an iCE280
system (ProteinSimple, USA).
Specific consumption and production rates were calculated according to the following
equation:
1
2
( )i
it t
cq
t X X
(3.2)
where iq is the specific metabolic rate, ic the concentration difference of the corresponding
metabolite, t the time difference in between two consecutive culture samples and X the
viable cell density (Adams et al., 2007).
3.3 Results
3.3.1 Shear characterization of the used bioreactor systems
When using stirred and sparged bioreactors the cell culture broth is exposed to various
sources of hydrodynamic stress originating from turbulent flow, gas jet present during bubble
formation, bubble rise or bubble burst (Chisti, 2000; Cruz et al., 1998; Liu et al., 2013;
Michaels et al., 1996; Oh et al., 1992; Zhu et al., 2008). To evaluate the relative contribution
of stirring and sparging to the maximum hydrodynamic stress present in a 3 L and 300 L
bioreactor, both were characterize by the shear sensitive system described above (Villiger et
al., 2014). Effects from bubble burst were prevented by the use of Pluronic F-68 at same
concentrations as used for subsequent culture experiments (Boulton-Stone and Blake, 1993;
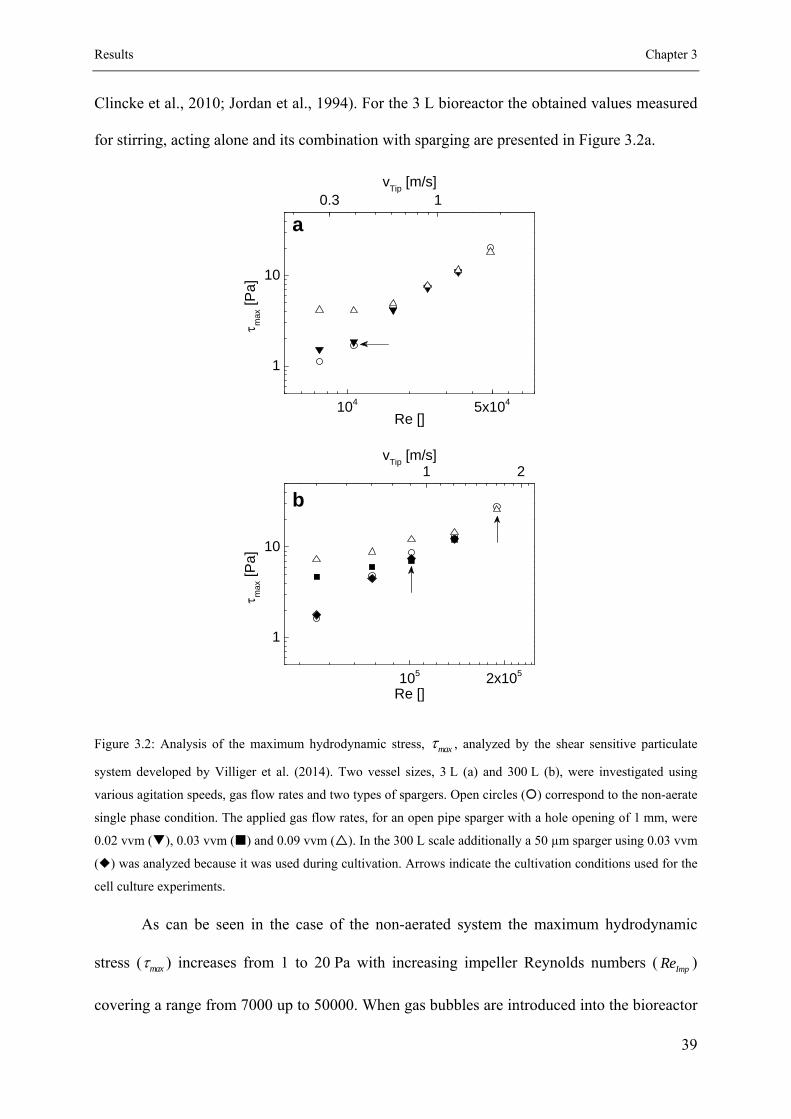
Results Chapter 3
39
Clincke et al., 2010; Jordan et al., 1994). For the 3 L bioreactor the obtained values measured
for stirring, acting alone and its combination with sparging are presented in Figure 3.2a.
Figure 3.2: Analysis of the maximum hydrodynamic stress, max , analyzed by the shear sensitive particulate
system developed by Villiger et al. (2014). Two vessel sizes, 3 L (a) and 300 L (b), were investigated using
various agitation speeds, gas flow rates and two types of spargers. Open circles () correspond to the non-aerate
single phase condition. The applied gas flow rates, for an open pipe sparger with a hole opening of 1 mm, were
0.02 vvm (), 0.03 vvm () and 0.09 vvm (). In the 300 L scale additionally a 50 µm sparger using 0.03 vvm
() was analyzed because it was used during cultivation. Arrows indicate the cultivation conditions used for the
cell culture experiments.
As can be seen in the case of the non-aerated system the maximum hydrodynamic
stress ( max ) increases from 1 to 20 Pa with increasing impeller Reynolds numbers ( ImpRe )
covering a range from 7000 up to 50000. When gas bubbles are introduced into the bioreactor
Re []104 5x10⁴
1
10
Re []105 2x10⁵
1
10
a
max
[Pa]
0.3 1v
Tip [m/s]
b
max
[Pa]
1 2v
Tip [m/s]

Chapter 3 Oscillating hydrodynamic stress at pilot scale
40
in the presence of stirring it is shown that at low ImpRe (around 10000) the level of the
hydrodynamic stress is solely controlled by the applied gas flow rate. In particular, when low
gas flow rates are used, corresponding to 0.02 vvm, the measured max is only slightly higher
than that measured for single phase. On the other hand, when the gas flow rate is increased to
0.09 vvm, stresses as high as 4 Pa can be measured over a rather broad range of ImpRe up to
about 18000 (see Figure 3.2a). By further increase of ImpRe the effect of the gas flow rate
becomes negligible and the measured max for all conditions is equal to that measured for
single phase. This indicates that depending on the applied ImpRe two regimes can be observed,
one dominated by the gas flow rate, while the second one is controlled by the stirring. In the
gas dominated regime the different mechanisms, i.e. (1) bubble inlet gas velocity (inlet gas
jet), (2) bubble coalescence and break up, (3) bubble rise and (4) bubble burst, acting alone or
in combination, are responsible for higher stress values (Nienow, 2006; Oh et al., 1992;
Villiger et al., 2014). The arrow in Figure 3.2a indicates the cultivation conditions used for all
3 L systems applying 0.013 vvm using a perforated pipe with 1 mm openings where the
maximum stress is originating from stirring.
In a similar way also for the 300 L bioreactor max was measured for various
combinations of stirring and sparging. Furthermore, two types of ring spargers, located under
the bottom impeller were investigated, equipped with either 8 sintered spargers (average pore
diameter equal to 50 µm) or 8 nozzles with a diameter of 1 mm. The obtained results are
present in Figure 3.2b. Similar to the 3 L bioreactor a monotonic increase of max with ImpRe
was found for non-aerated circumstances. When considering intermediate gas flow rates,
corresponding to 0.03 vvm, values of max measured for the sinter sparger are very similar to
those measured for single phase conditions, indicating negligible contribution of small
bubbles. In contrast, when openings with 1 mm diameter were used, generating larger

Results Chapter 3
41
bubbles, the level of max is clearly visible for low ImpRe being approximately 5 Pa with gas
flow rates of 0.03 vvm and about 8 Pa at 0.09 vvm (see Figure 3.2b). By further increase of
ImpRe this effect becomes negligible indicating that at high ImpRe the maximum hydrodynamic
stress is dominated by the turbulence generated from the impeller. Arrows in Figure 3.2b
indicate the cultivation conditions used applying 0.03 vvm and sintered spargers. Moreover,
in all cultivations the effect of bubble burst was prevented, due to the use of Pluronic F-68,
which is known to inhibit the attachment of cells to bubbles (Gigout et al., 2008; Handa-
Corrigan et al., 1989; Meier et al., 1999; Trinh et al., 1994; Wu, 1995).
3.3.2 Proliferation behavior of the cells
Small-scale cultivations were performed at 110 rpm ( ImpRe ≈ 10800) corresponding to
a max equal to 1.7 Pa. Prior to this study the described cell line was characterized upon its
hydrodynamic stress resistance using a specially designed shear loop system described earlier
(Neunstoecklin et al., 2014a). This setup uses a simple loop connected to a fully controlled
3 L bioreactor using a contracting nozzle to introduce a well-defined hydrodynamic stress. A
bearing less centrifugal pump is used to force the cell culture broth continuously through the
nozzle. By tuning the rotation speed of the pump and selecting several nozzle sizes, the
exposure period and stress magnitude can be varied independently to mimic the desired large
scale situation. In Figure 3.3 the determination of the threshold as measured by Neunstoecklin
et al. (2014a) is shown using the initial viability decrease of the culture (a), the specific titer
(b), the maximum cell density (c) and the cell size during exponential phase (d). Depending
on the quantity used for the threshold determination the result can vary. The overall average
value for the here investigated Sp2/0 cell resulted in 25.2±2.4 Pa. It is worth noting that an
alternative to the applied loop system, would be to use of a non-loop containing single
bioreactor, operated under elevated stirring speed and thus resulting in higher stresses

Chapter 3 Oscillating hydrodynamic stress at pilot scale
42
(Nienow et al., 2013). However, due to the robustness of the studied industrial cell line, the
very high stirring speeds that would be required are above the maximum operating limit of the
motor and therefore not reachable. Furthermore, even before reaching the maximum stirring
speed formation of vortex was observed resulting in a non-desired secondary effect of bubble
entrapment and consequent breakup (Chisti, 2000; Emery et al., 1995; Hua et al., 1993; Kunas
and Papoutsakis, 1990). Finally, when using bench top bioreactor operated at elevated stirring
speed an exposure period, by which cells would be exposed to highest values of the stress,
becomes very short not being representative of the manufacturing conditions.
Figure 3.3: Threshold determination of the studied Sp2/0 cell line as described by Neunstoecklin et al. (2014a).
Quantities used were the viability decrease during the initial 24 h of the culture (a), the specific titer in the
exponential growth phase (b), the maximum cell density (c) and the cell size during exponential phase (d).
Vertical dashed lines represent the threshold for the corresponding quantity. The overall average value results in
25.2±2.4 Pa. For comparison pilot scale data is plotted with solid symbols, 300 L at 71 rpm () and 300 L at
150 rpm ().
-25
-20
-15
-10
-5
10
20
30
40
Stress [Pa] Stress [Pa]
1 10 100
13
14
15
16
Via
bilit
y dc
r. [%
/day
]
qT
iter [pg/cell*day]
1 10 100
0
1
2
3
4
5
Max
. cel
l den
. [ce
lls*1
0^6/
mL]
Cell size [µ
m]
a b
dc

Results Chapter 3
43
To show the validity of the proposed methodology the same cell line was cultivated at
conditions below and above the threshold, using a 300 L pilot scale vessel. In order to
compensate for run to run variability’s all data were aligned to the time point of the initial
bolus feed, performed after reaching a cell density of 2 106 cells/mL, as described in the
material and method section. In particular, cultivations were performed at 71 rpm ( ImpRe ≈
90000) corresponding to a stress of 7 Pa being well below the threshold and at the maximum
agitation speed possible for the given reactor which is 150 rpm ( ImpRe ≈ 190000)
corresponding to 28 Pa (see Figure 3.2b). Vortex formation was not observed, due to the
upwards pumping marine impeller. In Figure 3.4a the growth profiles of these cultures are
compared with historical data obtained from either 3 L cultivations in classical single vessels,
applying stress values of 1.7 Pa or 3 L systems equipped with an external loop applying
various values of hydrodynamic stress. As can be seen the standard, low stress, 300 L
condition closely follows the growth and viability profile of the 3 L system at 1.7 Pa (Figure
3.4a, b) with an exception on day five where the 300 L culture shows a higher cell density.
With the overlapping standard errors at this point this can be interpreted as an experimental
error. This aligned trend is furthermore valid for the evolution of the cell size and the cell
aggregates in the culture (Figure 3.4c, d). Furthermore, results are very alike when comparing
data from the 300 L run at 28 Pa with the 3 L oscillating shear model applying 21 Pa. For
both, the maximum cell density is decreased from 5 106 cells/mL down to 4 106 cells/mL
and the viability profile is first comparable with the standard but stays higher from day 7 on.
Cell sizes appears to be not affected but the cellular aggregation rate is considerably reduced
especially between day 2 and 7 verifying the higher hydrodynamic stress values present in
both systems. Interestingly, when comparing to manufacturing-scale (data not shown), the
characteristically higher viability values after day 7 are much better fitted with either the 3 L
oscillating shear model or the pilot scale experiment with high agitation.
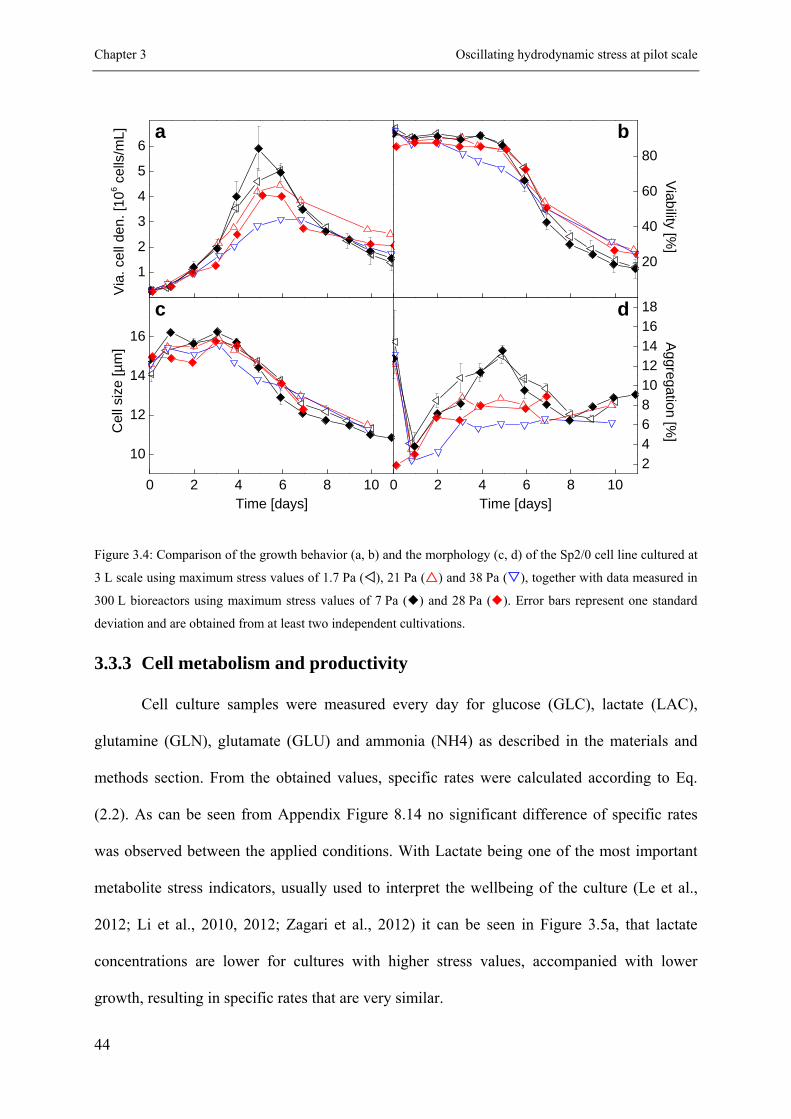
Chapter 3 Oscillating hydrodynamic stress at pilot scale
44
Figure 3.4: Comparison of the growth behavior (a, b) and the morphology (c, d) of the Sp2/0 cell line cultured at
3 L scale using maximum stress values of 1.7 Pa (), 21 Pa () and 38 Pa (), together with data measured in
300 L bioreactors using maximum stress values of 7 Pa () and 28 Pa (). Error bars represent one standard
deviation and are obtained from at least two independent cultivations.
3.3.3 Cell metabolism and productivity
Cell culture samples were measured every day for glucose (GLC), lactate (LAC),
glutamine (GLN), glutamate (GLU) and ammonia (NH4) as described in the materials and
methods section. From the obtained values, specific rates were calculated according to Eq.
(2.2). As can be seen from Appendix Figure 8.14 no significant difference of specific rates
was observed between the applied conditions. With Lactate being one of the most important
metabolite stress indicators, usually used to interpret the wellbeing of the culture (Le et al.,
2012; Li et al., 2010, 2012; Zagari et al., 2012) it can be seen in Figure 3.5a, that lactate
concentrations are lower for cultures with higher stress values, accompanied with lower
growth, resulting in specific rates that are very similar.
Time [days] Time [days]
1
2
3
4
5
6a
V
ia. c
ell d
en. [
10
6 cel
ls/m
L]
20
40
60
80
b V
iability [%]
0 2 4 6 8 10
10
12
14
16
c
Cel
l siz
e [µ
m]
0 2 4 6 8 10
2
4
6
8
10
12
14
16
18d
Aggregation [%
]
Results Chapter 3
45
Figure 3.5: Lactate (a) and product titer (b) production for the discussed cultivations. Maximum stress values
applied at 3 L were 1.7 Pa (), 21 Pa () and 38 Pa (), while at 300 L they were 7 Pa () and 28 Pa ().
Error bars represent one standard deviation and are obtained from at least two independent cultivations.
The specific productivity however shows a decreasing trend from values around 37 to
10 pg/cell/day, when conditions beyond the threshold of 25.2±2.4 Pa were applied (Figure
3.3b). This can also be seen in Figure 3.5b where the total amount of product at the day of
harvest is lowest, for the 300 L experiment performed at 28 Pa. Interestingly, highest titers
could be observed for the conditions applying 21 Pa in the 3 L system with about 15 % more
final product than obtained for the control culture. This can be explained by the increased
longevity of this culture with an approximately 10 % higher viability from day 6 on compared
to the control. Similar findings are reported by Senger et al. (2003) who realized increased
production of total recombinant tissue-type plasminogen activator protein when applying
Time [days]
0
1
2
3
a
LAC
[g/L
]
0 2 4 6 8 10
0.0
0.2
0.4
0.6
0.8
1.0b
Tite
r [g
/L]

Chapter 3 Oscillating hydrodynamic stress at pilot scale
46
moderate shear. These findings indicate the possibility, to increase productivity through
hydrodynamic stress, as long as the critical threshold is not trespassed.
3.3.4 Effect on key product quality attributes
Several authors discussed the effect of laminar or turbulent flow on the behavior of
mammalian cells in culture and their effect on the final product. Particular interest is given
into the influence of such stressor onto the quality of the protein. Most reports conclude only
minor impact on quality attributes like glycosylation and or charged variants as long as no
change in the growth behavior and the basic metabolite can be observed (Neunstoecklin et al.,
2014a; Nienow et al., 2013; Scott et al., 2012; Senger and Karim, 2003; Sieck et al., 2013).
Only one study exists that claims to observe significant changes in the glycosylation at
hydrodynamic conditions below the threshold effecting growth and metabolism (Godoy-Silva
et al., 2009a). In this study, the effect of hydrodynamic stress on the measured quality
attributes (nine major glycoforms) for sub lethal conditions is negligible (Figure 3.6a). It can
be seen that for conditions below the threshold (black 1.2 Pa, forward slash 15 Pa and back
slash 7.8 Pa), independent on the vessel size, the distributions are very similar. Values above
25 Pa (vertical line 38 Pa and horizontal line 28 Pa) show a shift towards more complex glyco
structures as shown especially for the abundance of the bi-antennary form FA2G2aG2 (Figure
3.6a structure 8), being distinctly higher than that of the control. A very similar trend is
visible for the charged variants profiles (Figure 3.6b). For stress values below the threshold
only minor changes are observed, while increasing the stress above the threshold results in a
distribution shift to the right, towards more alkaline forms. The distribution for both, the
glycosylation and charged variants is dependent on the applied hydrodynamic stress beyond
the threshold, and not on the reactor size. This becomes clear when comparing the patterns of
the 3 L run at 15 Pa (forward slash) and the 300 L run at 7 Pa (back slash). Results in between
the two are very similar.

Results Chapter 3
47
Figure 3.6: Comparison of glycosylation (a) and charged variants (b) profiles at day 11 measured in 3 L and in
300 L bioreactors for various values of the maximum hydrodynamic stress. Error bars represent one standard
deviation and are obtained from at least two independent cultivations.
The same applies to the 3 L run at 38 Pa (vertical line) and the 300 L run at 28 Pa
(horizontal line). Generally spoken one can say that the response to the applied environmental
condition, i.e. hydrodynamic stress, results in sub optimal growth and therefore in the same
change in quality, which in reverse can be used as a fingerprint representing the operating
conditions. In Appendix Figure 8.15 the glycosylation and charged variants profiles are again
displayed during late exponential phase at day 5. Total values at this day are different but the
overall trends are the same as discussed above. These results clearly indicate the strong
dependency of quality on the growth behavior of the culture. Furthermore, the obtained data
in the 300 L pilot scale reactor fully support the predictive capabilities of the earlier
developed small-scale model (Neunstoecklin et al., 2014a) and indicate that maximum
1 2 3 4 5 6 7 8 9
5
10
15
20
25
30
35a
Gly
cofo
rm W
D1
1 [%
]
7.5 7.7 7.9 8.1 8.2 8.4 8.6 8.7
5
10
15
20
25
30b
3L (1.2 Pa) 3L (15 Pa) 300L (7 Pa) 3L (38 Pa) 300L (28 Pa)
Cha
rge
d va
rian
ts W
D1
1 [%
]

Chapter 3 Oscillating hydrodynamic stress at pilot scale
48
hydrodynamic stress should be the scaling criteria of choice when agitation is considered as
the main source of hydrodynamic stress.
3.4 Conclusion
Determination of a scale independent safe operating range by scale down models
described in literature is limited, because available published models are not validated using
pilot or manufacture scale conditions. In this work, a validation of an earlier developed
oscillating hydrodynamic stress scale down model was pursued using a 300 L pilot scale
bioreactor. Maximum hydrodynamic stress values at this scale were determined at various
operating parameters with a shear sensitive particulate system based on the breakage of
aggregates composed of polymer nanoparticles. With this knowledge the operating
parameters could be adapted to the same conditions as previously simulated in the stress loop
system. Using the measured hydrodynamic stress threshold of the investigated Sp2/0 cell line
equal to 25 Pa the operating conditions for the pilot scale were set either well below (7 Pa) or
above (28 Pa) this value. The obtained results were compared with historical data from either
classical 3 L cultivations and with data obtained from the oscillating stress loop system. The
growth behavior of the cells at high agitation was reduced but showed a better longevity
expressed through a higher viability at the end of the cultivation. Very similar results were
obtained from the oscillating hydrodynamic stress loop scale-down model applying
comparable hydrodynamic conditions. Furthermore, the productivity and product quality were
very much aligned throughout the scales when comparing similar stress values. A shift to
more complex glycosylation forms as well as a shift to more basic charged variants could be
observed with increasing stresses beyond the edge of failure being rather dependent on the
hydrodynamic stress environment than on the actual reactor scale. The here presented data
show for the first time a validation study for a scale down model using an edge of failure
approach at pilot scale and proves the applicability and predictability of the discussed scale

Conclusion Chapter 3
49
down model. This knowledge assures better confidence when applying it in a quality by
design frame work, when determining the maximum agitation operating range of a process.


51
Chapter 4
Comparison to production scale data
4.1 Introduction
The interest in biopharmaceuticals rose significantly within the past decades resulting
in a continuously growing market (Walsh, 2010). Especially monoclonal Antibodies (mAbs)
are of great interest and importance to the industry considering their seemingly infinite
therapeutic potential, which was discovered in the mid-1970s (Köhler and Milstein, 1975).
Since then the number of diseases that can be cured or stopped from becoming worse such as
rheumatoid Arthritis or cancer has grown continuously. Along with the high therapeutic
potential of mAbs their high demand has forced the industry to develop faster and more
yielding processes, higher titers with more productive cell lines using larger bioreactors
(Jordan et al., 2013; Rouiller et al., 2013). At the moment bioreactors of 25000 L are the
biggest in the industry for mammalian cell culture and titers of 5 g/L and more have been
reported (Kim et al., 2012; Nienow, 2006; Varley and Birch, 1999).
The biggest challenge of such scales is the presence of in homogeneities which are
hard to address during the development (Lara et al., 2006; Ozturk, 1996) but cannot be
avoided when scaling bioprocesses to such scales. Hydrostatic pressure influences the gas
solubility, slow mixing can generate suboptimal pH perturbations and nutritional gradients.

Chapter 4 Comparison to production scale data
52
Furthermore, the fluid dynamics in-between scales vary substantially causing a different
hydrodynamic environment for the cultured cells. Hydrodynamic stress is an often discussed
parameter when scale up is performed, with the concern of fragile mammalian cells that could
be harmed by the large scale environment. Several authors address this topic using scale down
models of various forms to investigate the robustness of mammalian cells again
hydrodynamic stress (Godoy-Silva et al., 2009b; Keane et al., 2003; Kunas and Papoutsakis,
1990; Neunstoecklin et al., 2014a, 2014b; Oh et al., 1989; Sieck et al., 2013; Tanzeglock et
al., 2009). A rheometer producing uniform steady simple shear and a contracting nozzle
device generating oscillating extensional flow was used by Tanzeglock et al. (2009) to
investigate the robustness of CHO and HEK cells, concluding that laminar simple shear
quickly induces necrosis while oscillating extensional flow at the same amplitude results in an
apoptotic response of the cells. Other authors using a similar oscillating contracting nozzle
approach, attached to a bioreactor, could show the response of CHO cells to very high stress
values (6.4 106 W/m3) including the influence on the product quality at sublethal conditions
(Godoy-Silva et al., 2009a). This however is the only report showing stress as a modifier of
product quality when growth is not effected. It appears more general that growth is influenced
by hydrodynamic stress and as a consequence of this product quality is modified as reported
by Scott et al. (2012) or Neunstoecklin et al. (2014a). The representation of such systems
against large scale is however difficult and very scarce. As it was shown by Neunstoecklin et
al. (2014b) the developed 3L scale down model can well represents a 300 L pilot scale
bioreactor. According to our knowledge this is the only study where such comparison was
shown, although, a comparison to manufacturing-scales, with several thousand liters of
working volume, is still missing. Such a comparison using cultivation data from 5000 L and
15000 L is presented in this chapter. The stress values present in the large scale reactors were
estimated using the correlation provided by Villiger et al. (2012).

Results Chapter 4
53
4.2 Results
4.2.1 Growth and productivity in large scale compared to oscillating
hydrodynamic stress
The two before discussed cell lines (CHO and Sp2/0) having significantly different
processes were cultivated at manufacturing-scale with volumes of 5000 L and 15000 L. The
stress thresholds were 32.4±4.4 Pa for the CHO derived cell line, while a slightly lower value
of 25.2±2.4 Pa was found for the Sp2/0 derived cell line (Neunstoecklin et al., 2014a). The
hydrodynamic stress generated by the different vessels used, applying the corresponding
operating parameters, typical for the individual process, is compared in Table 4.1 and
geometric details of the vessels can be found in Figure 4.1.
Table 4.1: Maximum stress present in the different bioreactor scales studied at the corresponding agitation rate,
estimated according to Villiger et al. (2012).
Cell Line
V (L)
N (rpm)
Tipv
(m/s)
exp
(Pa)
CHO 3 150 0.471 2.2
CHO 5000 71 1.859 30.2
SP2/0 3 110 0.346 1.2
SP2/0 5000 42 1.100 11.0
SP2/0 15000 35 1.466 19.1
As can be seen in Figure 4.2a, no significant effect of the applied hydrodynamic
stresses was measurable for the CHO cell line when stress levels below 83 Pa were applied.
An even increased peak cell density compared to the control was observed at this stress level.
Further increase to 103 Pa resulted in a substantially prolonged lag phase and peak cell

Chapter 4 Comparison to production scale data
54
density was delayed by three days. Comparison of data obtained from 5000 L bioreactors
indicated good agreement of cell density to conditions with a hydrodynamic stress of 21 Pa.
Figure 4.1: Geometry of the studied bioreactors (all values in cm). Basic geometry of the 5000 L / 15000 L
vessel used for the Sp2/0 culture. The CHO culture was only cultivated in the 5000 L scale.
From the viability data presented in Figure 4.2b, it can be seen that for all conditions a
drop in cell viability on day two is observed. Although cells recovered after the viability drop,
a systematic trend is shown while increasing the hydrodynamic stress, with lowest viability
measured for highest stresses (see Figure 4.2b). The observed differences in the cell viability
profile during the first three days, with approximately constant values measured for the
5000 L bioreactor, were most probably related to the fact that for large-scale cultivations the
inoculum preparation was already done in stirred tanks resulting in more resistant cells. In
contrast, in the case of the presented scale-down model the inoculum was prepared in roller
bottles with substantially lower stress values (Peter et al., 2006). Due to this difference, the
cells’ response to elevated stress was probably more pronounced for the small-scale system
compared to large-scale where no adaption was required.

Results Chapter 4
55
Figure 4.2: Time evolution of the viable cell density (a, c) and cell viability (b, d) measured for CHO cell line (a,
b) and for Sp2/0 cell line (c, d). Open symbols correspond to various magnitudes of the hydrodynamic stress
introduced with a classical single vessels, 1.2 Pa (, Sp2/0 control), 2.2 Pa (, CHO control) or the oscillating
hydrodynamic stress loop systems 15 Pa (), 21 Pa (), 38 Pa (), 83 Pa () and 103 Pa (). While close
symbols refer to large-scale bioreactors: 5000 L () and 15000 L ().
Results measured for the other cell line (Sp2/0) are presented in Figure 4.2c and d. As
can be seen, the qualitative response of the cells to elevated stress was similar to that
measured for CHO cells even though these cells showed slightly reduced growth already at 15
Pa and a strong lethal response was observed for stress equal to 83 Pa (see Figure 4.2c).
Moreover, a clear difference can be seen at the end of the culture, where for intermediate
stress levels (15 or 21 Pa) viable cell density was almost 100% higher than that measured for
the standard conditions where no external loop was used. Profiles measured in 5000 L and
15000 L also had a higher cell density as well as cell viability, at the later stage of the
cultivation in both large-scale bioreactors, closely agreeing with the data measured in the
small-scale loop model applying stress values of 15 or 21 Pa (see Figure 4.2c and d).
CHO SP2/0
Time [days] Time [days]
2
4
6
8
a
V
iab
le c
ell d
ensi
ty [1
06 c
ells
/mL]
0
1
2
3
4
5c
0 2 4 6 8 10
60
70
80
90
b
Via
bili
ty [%
]
0 2 4 6 8 10
20
40
60
80
d

Chapter 4 Comparison to production scale data
56
Substantially lower values were measured for standard conditions using classical 3 L
bioreactor without an external loop. This indicates that the effect of stress could even
positively enhance cell growth and viability, supporting the presented methodology with
oscillating stress (Lakhotia et al., 1992; Senger and Karim, 2003). Furthermore, these data
also clearly indicate that the classical small-scale model, composed of a single stirred
bioreactor, is not properly mimicking the environment which cells experience, considering
manufacturing-scale bioreactors.
The specific productivity ( Titerq ) measured for both cell types and all scales is plotted
in Figure 4.3.
Figure 4.3: Time evolution of the specific productivity for the CHO cells (a) and the Sp2/0 cells (b). Open
symbols correspond to various magnitudes of the hydrodynamic stress introduced with a classical single vessels,
1.2 Pa (, Sp2/0 control), 2.2 Pa (, CHO control) or the oscillating hydrodynamic stress loop systems
15 Pa (), 21 Pa (), 38 Pa (), 83 Pa () and 103 Pa (). While close symbols refer to large-scale
bioreactors: 5000 L () and 15000 L ()
Time [days]0 2 4 6 8 10
10
20
30
40
50
60
5
10
15
20
a
b
qT
iter [
pg/c
ell*
day]

Results Chapter 4
57
As can be seen for the CHO cell line, similar Titerq were measured for stress values
below 21 Pa, while further increase resulted in a systematic decrease of Titerq . Similar to the
cell growth, large-scale data from 5000 L bioreactor agrees well with the small-scale data
when the stress level was below 38 Pa. A substantial deviation is observed when the applied
stress in the small-scale system exceeded this value.
In comparison, the specific productivity of the Sp2/0 cell line was similar for all
conditions until day 6. After this point, a reduction of Titerq is observed for the control culture
while almost constant Titerq (except on the last day) was measured for stress values below
38 Pa (see Figure 4.3b). This represents an increase of about 30 – 50 % with respect to the
control culture. When considering Titerq evaluated for the 5000 L bioreactor as shown in
Figure 4.3b, the values closely agree with results obtained in the small-scale loop system with
elevated stress. Data obtained from the 15000 L bioreactor agree within the experimental
error with the other data measured at 3 L as well as in 5000 L bioreactors until day 6. The
slightly lower specific productivity observed during the later stage can be explained by the
higher cell density in the 15000 L after day six compared to the 5000 L data or the classical
single reactor scale-down model (Figure 4.2c). A possible cause for this could be cell
adaption to higher stress values present at the 15000 L scale, similar to the results observed in
the small-scale loop model at elevated stress.
4.2.2 Large scale data comparison to individual stress thresholds
In Figure 4.4 the threshold determination for individual process quantities is shown as
described by Neunstoecklin et al. (2014a). When comparing the data obtained from
large-scale bioreactors, it can be seen that they closely agree with those measured in the
small-scale system supporting the applicability of the presented method (see closed circles
corresponding to the 5000 L scale and closed squares for the 15000 L scale in Figure 4.4).

Chapter 4 Comparison to production scale data
58
Figure 4.4: Hydrodynamic stress thresholds (dashed lines) in comparison with manufacturing data. Shown is the
viability drop during the first 24 h of the culture (a, e), the average size of the cells during exponential phase
from day one to four (b, f), the specific DNA amount in the culture on day four (c, g) and the specific
productivity of the cells during exponential phase from day two to six (d, h). Available large-scale data from
5000 L () and 15000 L () are shown for comparison.
-20
-15
-10
-5
CHO SP2/0
-25
-20
-15
-10
-5
15.0
15.5
16.0
16.5
13
14
15
16
0.05
0.10
0.15
0.0
0.2
0.4
Stress [Pa]1 10 100
6789
101112
Stress [Pa]1 10 100
10
20
30
40
a
V
iab
ility
dcr
. [%
/da
y]e
b
Cel
l siz
e [µ
m]
f
c
qD
NA [
pg
/ce
ll*d
ay]
g
d
qT
iter [
pg
/ce
ll*d
ay]
h

Conclusion Chapter 4
59
Based on the obtained data, it can be seen that the chosen stirring speed for large-scale
cultivations is always below the here determined threshold value (Figure 4.4), where no
adverse effect on the cell performance was observed. Although the maximum hydrodynamic
stress changes in between the scales, its obtained range is scale independent and therefore
should be used as one of the design space parameters when applying a Quality by Design
framework.
4.3 Conclusion
Comparison of available large scale data with results used before for the determination
of the hydrodynamic stress threshold, for two different mammalian cell lines, could reveal the
predictive strength of the oscillating loop scale down model. Better agreement with large-
scale was obtained using this model indicating the limitation of commonly used classical
single vessel models to study the effect of hydrodynamic stress. Especially the increased
longevity of the Sp2/0 cell line, in the end of the culture, observed at both
manufacturing-scales (5000 L and 15000 L), could be reproduced applying comparable
oscillating stress with the discussed model. The good agreement across various scales
qualifies this methodology to be applied during development for the determination of the
maximum operating range for agitation.


61
Chapter 5
Simulation of large scale heterogeneity3
5.1 Introduction
Therapeutic proteins such as monoclonal antibodies (mAb) need to be properly
glycosylated to have a desired biological activity. Nowadays, this can be efficiently achieved
using mammalian cells. To ensure optimal cellular growth conditions stirred bioreactors are
used with volumes of several thousand liters. Despite the success when using these large
vessels differences in cell behavior are often observed when comparing them to lab scale
bioreactors. Reasons therefore are differences in mixing characteristics (Chisti, 2001;
Nienow, 2006) and consequently inhomogeneous mass transfer of O2 and CO2 (Mostafa and
Gu, 2003; Xing et al., 2008).
Of particular importance is the accumulation of dissolved carbon dioxide (dCO2) in
mammalian cell culture, an often observed phenomenon in large scale culture. Sieblist et al.
(Sieblist et al., 2011a) discuss CO2 accumulation in gas bubbles due to their increased
residence time in the reactor, either through recirculation or due to the large scale liquid
height, resulting in very low CO2 removal rates and therefore the possibility of dCO2
3 Original paper title: “Simulation of the large scale specific heterogeneous environment for mammalian cell
culture”

Chapter 5 Simulation of large scale heterogeneity
62
accumulation during culture. Due to these different environmental conditions in between
several scales, the removal rates for CO2 are much lower for large scale than for development
scale. This difference becomes even more severe with continuously increasing cell densities
often resulting in un-physiologic levels of dCO2 being higher than 100 mmHg (Mostafa and
Gu, 2003; Xing et al., 2008). Most approaches to investigate these conditions already at
development scale, use different buffer conditions to change the dCO2 level either throughout
the whole process or at a distinct time point (Zhu et al., 2005). These fixed elevated set-points
however do not represent the usually observed increasing dCO2 profiles as described in
literature for large scale bioreactors (Gray et al., 1996; Mostafa and Gu, 2003).
An increased concentration of dissolved gases at the bottom of a vessel, due to
hydrostatic pressure, is another phenomena well documented in literature (Rhiel and
Murhammer, 1995; Serrato et al., 2004; Xing et al., 2009). As a consequence cells will be
periodically exposed to the various values of dissolved oxygen (DO). Although investigations
of different set-points of DO at development scale is common practice (Heidemann et al.,
1998; Jan et al., 1997; Kilburn and Webb, 1968; Li et al., 2006; Meilhoc et al., 1990; Restelli
et al., 2006), the simulation of gas gradients, as they are seen by cells in a
manufacturing-scale bioreactor, is so far only studied for bacterial cultures or insect cells.
Two compartment models are here for used, circulating the cells through two different
dissolved oxygen environments (Amanullah et al., 1993; Rhiel and Murhammer, 1995). For
mammalian cells studies with simulated oscillatory DO conditions are very rear. Serrato et al.
(2004) for example used a simple one compartment model with a step change of the DO set-
point, periodically every 800 to 12800 sec.
In addition to the above mentioned variations of concentration of dissolved gasses,
perturbations in pH can be observed, when pH is controlled via acid/base addition or when
special feeds with high or low pH are used. This can further affect cell growth, metabolism,

Materials and Methods Chapter 5
63
productivity and most importantly the quality of the produced mAbs, such as glycosylation
(Butler, 2006; del Val et al., 2010; Hossler et al., 2009; Kimura and Miller, 1996; Restelli et
al., 2006; Scott et al., 2012; Zanghi et al., 1999) .
To cover all above mentioned parameters and their interplay during a single
cultivation, in this study a two zone scale down model was developed and tested. The used
system is composed out of two interconnected stirred and sparged bioreactors allowing the
periodic exposure to perturbations of DO and hydrodynamic stress, upon the studied
industrial CHO cell line. Due to high pH of the applied feed, pH perturbations were
introduced using a fed-batch cultivation. To mimic dCO2 accumulation in the system
comparable to that present in a large scale bioreactor, the CO2 removal rate was controlled by
the combination of gas flow rate and size of bubbles introduced into the system. The resulting
decrease of the pH during accumulation situations was accepted to a certain extend because
the applied process didn’t foresee base addition due to known adverse effects base can have
on the lactate metabolism (Le et al., 2012). Obtained results are compared to the effect of
single parameters.
5.2 Materials and Methods
5.2.1 Cell line and process description
Cells used in this study were CHO cells provided by Merck Serono producing an IgG1
antibody and were cultured in a fed batch process with chemically defined culture media and
feeds. For inoculum preparation cells were thawed from a working cell bank vial, washed
once with pre heated media and diluted with fresh media to a concentration of
0.3±0.1 106 cells/mL. Cells were incubated in a shaking incubator (Kuhner AG,
Switzerland) at 37 °C, 90 % humidity and 5 % CO2 using orbitally shaken TubeSpin
bioreactors (TPP, Switzerland) for 7 days, followed by vertically shaken roller bottles

Chapter 5 Simulation of large scale heterogeneity
64
(Corning, USA) for additional 7 days. Three sub cultivation steps with a dilution down to
0.3±0.1 106 cells/mL were performed every week to keep the cell density below
2.5 106 cells/mL. The orbital of the shaker was set to 25 mm, agitation for TubeSpin
bioreactors was set to 320 rpm and for roller bottles to 130 rpm. Seeding into a 3 L bioreactor
(DASGIP, Germany) prefilled with proprietary chemically defined production media was
performed at a cell density equal to 0.2±0.1 106 cells/mL. The duration of the fed batch
culture process was 7 or 14 days with three different feeds being Glucose, a chemically
defined amino acid feed and two amino acids dissolved in 1 M NaOH. Glucose was fed daily
from working day 3 on, to keep the concentration between 2 g/L and 4.5 g/L. The two other
feeds were added on working days 3, 5, 7, and 10.
5.2.2 Bioreactor setups and control
Three different bioreactor configurations were used in this work. The first was a
classical single vessel stirred tank reactor with working volume 3L. The second was a
modified version of the first one equipped with an external shear loop to introduce oscillating
hydrodynamic stress as described by Neunstoecklin et al. (2014a). The third was a further
modification where two reactors were interconnected to introduce simultaneous oscillation of
dissolved oxygen (DO) and hydrodynamic stress. In this setup a 3 L reactor was
interconnected within a loop, with a 0.3 L reactor driven by a bearingless centrifugal pump
(BPS-200, Levitronix, Switzerland) as depicted in Figure 5.1. The integration of the smaller
bioreactor was implemented without headspace to avoid vortex formation and bubble
entrapment. Both reactors were fully controllable, with the 3 L reactor representing the larger
bulk region, the 0.3 L reactor corresponding to the region around the sparger of a large scale
reactor and the pump together with a contracting nozzle corresponding to high stress zones
near the impeller blades. Adjustment of the centrifugal pump speed allowed the adaption of
the system to different circulation times. All reactors were equipped with online temperature,

Materials and Methods Chapter 5
65
pH and DO measurement probes (Mettler Toledo, Switzerland). In the 3 L vessels two pitched
blade impellers both inclined by 30° from horizontal plane and pumping upwards operated at
250 rpm, were installed.
Figure 5.1: Bioreactor dimensions of the two zone model employed for the simulation of large scale
heterogeneity using a modified DASGIP vessel. All dimensions in mm.
Power input of these impellers was measured at different agitation rates using a torque
meter (Messtechnik Schaffhausen, Germany) and the Power number of the combined
impellers was found to be constant at 1.6±0.2 for Reynolds numbers ImpRe larger then 12000
(see Figure 8.16). According to Hudcova et al. (1989) the power number of individual
impellers can be added to obtain the combined power number in a multi impeller setup. One
of the here used 30° pitched blade impellers therefore would have a power number of 0.8
which is in agreement with the measured data from Shaw (1994) reporting 0.6 for a similar
pitched blade. In the 0.3 L reactor a Rushton turbine operated at 200 rpm ( ImpRe ≈ 9700) was
used for better mass transfer. In all cases temperature was controlled at 37 °C, DO at 50 % air
saturation (if not stated differently) and pH control was achieved with a one sided PI

Chapter 5 Simulation of large scale heterogeneity
66
controller keeping the pH below 7.1 using CO2 in the inlet gas stream. Due to lactate
production a downwards drift of the pH was allowed which never exceeded values of lower
than pH 6.75. Various aeration strategies were applied to change the CO2 removal rate (CRR),
using different sparger openings. Two different strategies were followed to keep the DO at the
set point. The first one was based on O2 on demand, where the O2 gas flow rate was increased
during the cell culture, while in the second approach a fixed total gas flow rate with an
adjustable oxygen fraction was applied. The utilized gas flow rates according to the
corresponding sparger are summarized in Table 5.1.
Table 5.1: Sparger sizes, their corresponding bubble sizes and volumetric gas flow rates used to influence the
CO2 removal rate ( bd = bubble diameter, p , S pd = pore size of the sparger, gasQ = volumetric gas flow rate,
LiquidV = bioreactor liquid volume, sv = bubble rise velocity according to Clift et al. (1978)).
bd
[mm]
p, Spd
[µm]
gas, minQ
[L/h]
gas, maxQ
[L/h]
gas LiquidQ V
[vvm] sv
[m/s]
5.61 1000 0.3 33 0.0018 ‐ 0.183 7.12 10-4
0.43 0.5 0.3 1.2 0.0018 ‐ 0.007 2.59 10-5
0.26 10 0.3 2 0.0018 ‐ 0.011 4.32 10-5
5.2.3 Offline data analysis
During cultivation in the bioreactor, daily sampling was performed. Cell density and
viability measurements were performed using the automated cell counter Cedex XS
(Innovatis, Switzerland). Furthermore, values for cell diameter, average compactness and
aggregation rate were obtained from the device. Measured values were used to calculate
specific growth rates and doubling times using the following equations:
1 dX
X dt (5.1)
Materials and Methods Chapter 5
67
ln 2
dt (5.2)
where is the specific growth rate, dt the doubling time and X the viable cell density.
Values for dt in animal cell culture range from 15 to 60 hours depending on grow conditions
and cell line (Adams et al., 2007). The here described CHO cells had an average doubling
time of approximately 22 h. Basic metabolites were measured with a Super GL compact
(Hitado, Germany) using enzymatic sensors for the detection of glucose and lactate. Titer
determination was performed via standard HPLC techniques using a Protein A column
(POROS® A20 Analytical HPLC column). Dissolved CO2 was measure right after sampling
using a dCO2 dipping probe (PreSens, Germany).
5.2.4 Bubble Size Analysis
To better understand the influence of the sparger type on gas mass transfer and
hydrodynamic stress a detailed bubble size analysis in the cultivation media was performed,
for each employed sparger at different volumetric gas flow rates. Pictures were taken from the
rising bubbles close to the sparger and analyzed using image analysis software (ImageJ
1.45s). To obtain a statistically relevant data set, for every condition more than 100 bubbles
were analyzed. Preliminary experiments indicate, that in the whole range of the investigated
conditions the produced bubbles can be well approximated as spherical and therefore the
sphere equivalent diameter (SED) was used to characterize different sparger types. The SED
is defined as:
b4ASED
(5.3)
where bA is the area of the bubble in the image, determined by the image analysis software.
This analysis was performed for several different spargers and flow rats as summarized in

Chapter 5 Simulation of large scale heterogeneity
68
Table 5.1. Furthermore, for every condition the rising time was estimated using the
correlation given by (Clift et al., 1978).
5.2.5 Characterization of mass transfer rates for O2 and CO2
The apparent oxygen mass transfer coefficient (2L Ok a ) was first determined in plain
culture media using Clark electrodes (Mettler Toledo, Switzerland) for several bubble sizes,
aeration rates and surfactant conditions using the dynamic gassing in method, described by
Bandyopadhyay and Humphrey (1967). During all experiments the headspace of the reactor
was gassed with the same gas as used for the sparger, at a relative high flow rate of 1 L/min.
The change in oxygen concentration over time is described as the Lk a multiplied with the
oxygen gradient between liquid and gas phase:
*L L L
dCk a C C
dt (5.4)
where *LC is the oxygen concentration in liquid phase at saturation and LC is the measured
oxygen concentration. Assuming perfect mixing conditions and a constant *LC the integration
of Eq. (5.4) for two discrete time points’ results in:
*L L0
0*L L
ln L ii
C Ck a t t
C C
(5.5)
where L 0C is the oxygen concentration at 0t and LiC the measured oxygen concentration at
it , respectively. The Lk a can be estimated from the slope of the curve, when plotting the
logarithmic term on the left hand side of Eq. (5.5) as a function of time.
Due to concerns that this measurement is not fully representative for the culture
conditions, were cells and surfactants are present, for selected conditions the Lk a was
measured during the culture. In this case Eq. (5.4) needs to be extended with the oxygen
uptake rate (OUR) of the cells resulting in:

Results Chapter 5
69
*L L L( )
dCk a C C qOUR X
dt (5.6)
with qOUR being the specific oxygen uptake rate of the cells and X the viable cell density.
Due to the fact that qOUR can vary over the culture time this value was determined each time
immediately before the Lk a measurement (Bandyopadhyay and Humphrey, 1967;
Ducommun et al., 2000).
When assuming LC to be the oxygen concentration of the bulk average dissolved
oxygen (DO) and *LC can be represented by a mean value, Eq. (5.6) can be rearranged as
follows:
*L L
L
1 dCC qOUR X C
k a dt
(5.7)
Applying a linear regression of LC as a function of the term in parenthesis, the L
1
k a is
equal to the slope of the resulting linear fit while *LC being its intercept (Bandyopadhyay and
Humphrey, 1967). Comparison of both approaches i.e. measurement in media with a given
concentration of antifoam and the measurement in cultivation broth resulted in very similar
results as can be seen from Appendix Figure 8.17b - d.
Dissolved carbon dioxide (dCO2) was measured using a fluorescence online probe
(PreSens, Germany) to determination the apparent mass transfer coefficient for carbon
dioxide (2L COk a ) applying the same methodology as described above for dissolved oxygen.
5.3 Results
The heterogeneous environment in manufacturing-scales beyond several thousand
liters is a well-known fact and discussed in literature for mammalian systems as well as for
microbial systems (Bylund et al., 1998; Hewitt et al., 2000; Lara et al., 2006; Ozturk, 1996;
Willoughby, 2006). For a realistic down scale model ideally all scale dependent parameters

Chapter 5 Simulation of large scale heterogeneity
70
need to be considered and applied simultaneously. Parameters such as hydrostatic pressure,
influencing gas solubility, increased maximum stress and reduced mixing are regularly
discussed. Emulating them at development scale is either not possible or only hard to achieve.
Multi compartment models were proposed by several authors aiming to simulate the
heterogeneous environment through plug flow loops or two compartments with different
conditions. Furthermore, commonly those models focus only on one parameter like pH
perturbation (Amanullah et al., 2001), O2 and nutrient gradients (Serrato et al., 2004) or
hydrodynamic stress oscillations (Godoy-Silva et al., 2009a; Neunstoecklin et al., 2014a,
2014b; Palomares et al., 2010; Scott et al., 2012). However, a combined effect of multiple
parameters using all of them, below the single parameter threshold value, on mammalian cell
culture was not presented until now.
5.3.1 Simulation of elevated dissolved carbon dioxide profiles
To achieve various dCO2 accumulation profiles a combination of three spargers and
various gas flow rates was used in this study. Examples of two conditions using a sinter
sparger with an average pore size of 10 µm and open pipe sparger with seven openings of
1 mm are presented in Figure 5.2a together with the corresponding bubble size distribution.
As can be seen from Figure 5.2a the 10 µm sparger generates very small bubbles with
diameters ranging from 0.15 to 0.4 mm with a mean of 0.26 mm. In contrast, the 1 mm
sparger generates bubbles covering a range from 2 to 9 mm with an average bubble size of
5.61 mm. For other conditions bubbles were in between the above mentioned sizes.
Comparison of the different flow rates showed a slight shift to smaller bubbles for the 10 µm
sparger and a slight shift to larger bubbles for the 1 mm sparger when applying higher gas
flow. Comparison of the fitted distributions showed very similar results and therefore the
further used mean bubble sizes were considered as flow rate independent for the applied flow
rate ranges.
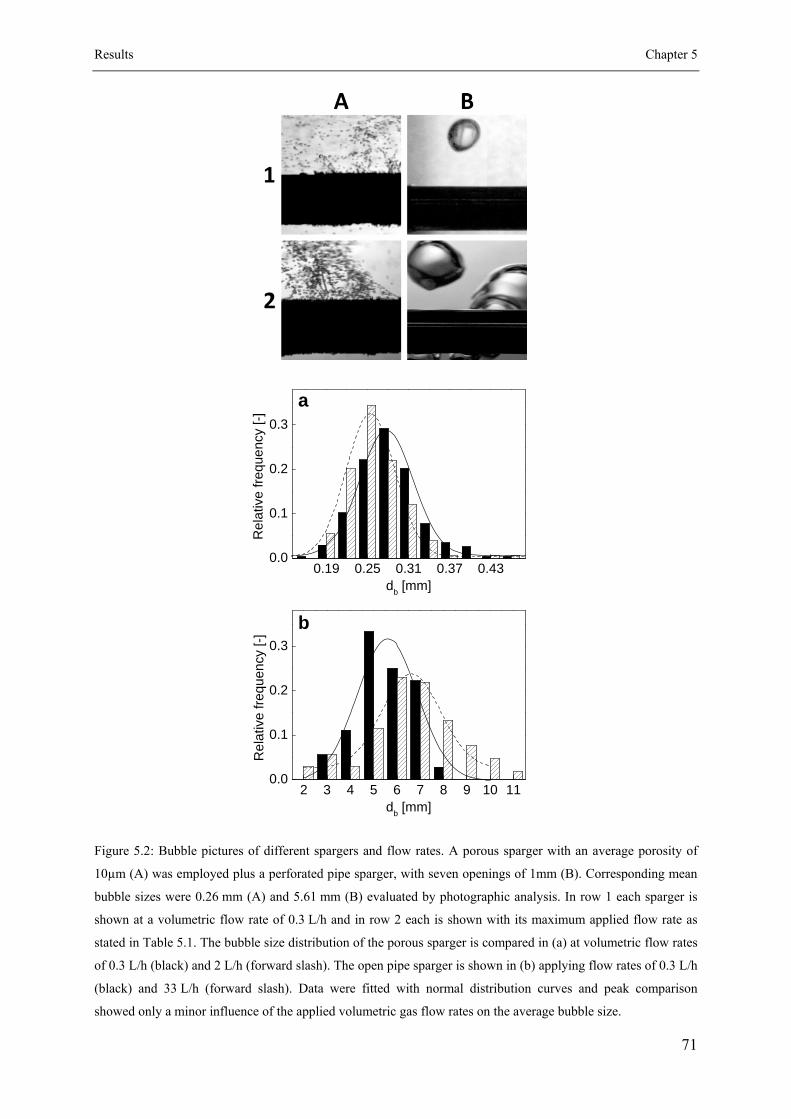
Results Chapter 5
71
Figure 5.2: Bubble pictures of different spargers and flow rates. A porous sparger with an average porosity of
10µm (A) was employed plus a perforated pipe sparger, with seven openings of 1mm (B). Corresponding mean
bubble sizes were 0.26 mm (A) and 5.61 mm (B) evaluated by photographic analysis. In row 1 each sparger is
shown at a volumetric flow rate of 0.3 L/h and in row 2 each is shown with its maximum applied flow rate as
stated in Table 5.1. The bubble size distribution of the porous sparger is compared in (a) at volumetric flow rates
of 0.3 L/h (black) and 2 L/h (forward slash). The open pipe sparger is shown in (b) applying flow rates of 0.3 L/h
(black) and 33 L/h (forward slash). Data were fitted with normal distribution curves and peak comparison
showed only a minor influence of the applied volumetric gas flow rates on the average bubble size.
0.19 0.25 0.31 0.37 0.430.0
0.1
0.2
0.3
a
Re
lativ
e fr
eque
ncy
[-]
db [mm]
2 3 4 5 6 7 8 9 10 110.0
0.1
0.2
0.3
b
Re
lativ
e fr
equ
ency
[-]
db [mm]

Chapter 5 Simulation of large scale heterogeneity
72
Furthermore, the operating conditions for gassing were selected avoiding any negative
effect of hydrodynamic stress generated by the bubbles on cells. In particular, the entrance
velocity or corresponding gas Reynolds jet were kept well below the critical values reported
in the literature (Villiger et al., 2014; Zhu et al., 2008). To avoid high values of the
hydrodynamic stress due to the bubble burst at the gas-liquid interface all cultivations were
conducted using 2 g/L Pluronic F-68.As it was shown in our previous work (Villiger et al.,
2014) as well as by other authors (Chalmers and Bavarian, 1991; Jöbses et al., 1991; Ma et
al., 2004; Murhammer and Goochee, 1990; Oh et al., 1992) the addition of Pluronic F-68 at
such concentration is sufficient to prevent cell entrapment by bubbles and therefore avoids
their damage by bursting bubbles. A summary of the calculated bubble sizes obtained for
different sparger types and flow rates is presented in Table 5.1.
Characterization of the apparent mass transfer coefficients for oxygen and carbon
dioxide were conducted in culture media for standard culture conditions, applying 250 rpm
agitation and gas flow rates from 0.3 L/h to 33 L/h, depending on the used sparger (see Table
5.1). It was found that the mass transfer coefficient is a strong function of the bubble size and
volumetric gas flow rate and its value increases with bubble size reduction, while an increase
of gas flow rate results in an increase of the Lk a (see Figure 5.3 and Appendix Figure 8.17a).
To evaluate the effect of antifoam on the Lk a additional measurements were conducted using
various antifoam concentrations and in culture measurements at the end of the cultivation (see
Appendix Figure 8.17b-d). The influence of the power input was not investigated because all
cultivation experiments were conducted at the same stirring speed of 250 rpm. As can be seen
from Figure 5.3 the apparent 2L COk a is lower for both investigated spargers than that for
oxygen, a phenomena previously reported by Gray et al. (1996) who measured the apparent
Lk a for CO2 about 95 % smaller than the one for oxygen. Furthermore, as can be seen from
Figure 5.3, the decay of the 2L COk a is much higher for the porous sparger ( bd 0.26 mm / p, Spd

Results Chapter 5
73
10 µm / ) than for the perforated pipe sparger ( bd 5.61 mm / p, Spd 1000 µm / ). The
corresponding 2L COk a for the perforated pipe sparger and the 10 µm porous sparger were
equal to 1.53 h-1 and 0.28 h-1, respectively, even though for both conditions a 2L Ok a was
approximately equal to 5 h-1.
Figure 5.3: Apparent mass transfer coefficients for oxygen (2L Ok a ) and carbon dioxide (
2L COk a ) in culture
media for two different spargers. Closed symbols represent the 2L Ok a for oxygen, while open symbols show the
2L COk a for carbon dioxide. Diamonds () are measurements from the 10 µm sparger, while circles () are
from the 1 mm sparger. All lines represent power law fits to the corresponding data.
A detail inspection of the flow of individual bubbles, revealed substantial recirculation
of smallest bubbles following the liquid flow, while large bubbles were not dominated by the
liquid and only rose upwards. This would have direct consequence on the CO2 concentration
in the bubbles, and therefore, reduced the removal rate of CO2 (Sieblist et al., 2011a). As a
consequence this results in a reduced apparent 2L COk a . This phenomenon was subsequently
used to generate various pCO2 profiles comparable to those reported in the literature form
large scale bioreactors (Gray et al., 1996; Mostafa and Gu, 2003; Xing et al., 2009; Zhu et al.,
2005).
1 10
0.1
1
10
k La [h
-1]
QGas
[L/h]

Chapter 5 Simulation of large scale heterogeneity
74
5.3.2 Effect of elevated dCO2 on cell cultivation
To simulate buildup of dCO2 due to cell metabolism during the cell cultivation similar
to that present in the large scale bioreactors, was in the presented work achieved by affecting
the carbon dioxide removal rates (CRR).Various combinations of the used sparger and gas
flow rates were used to achieve different maximum levels of dCO2 during the cell culture. It
is worth noting that this strategy does not require any modification of the cultivation media
(e.g. buffer composition) or any predefined dCO2 profiles which could be unknown for
processes in development.
Figure 5.4 shows the results of five cultivations for various profiles of dCO2 covering
a range from 20 to 160 mmHg. For cultures aerated with large bubbles ( bd 5.61 mm) two
different aeration strategies were followed which were either on demand with increasing
oxygen gas flow up to 33 L/h or fixed airflow of 33 L/h with an increasing oxygen fraction
(Figure 5.4d, and ). The Lk a and therefore the removal rate of CO2 is a function of the
gas flow rate (Mostafa and Gu, 2003) and it was expected that for the first aeration strategy
the CO2 removal will be less efficient than for the second. This can be seen in Figure 5.4c
where the dCO2 measurements show higher values for the on demand strategy () until
approximately day 5 where the gas flow becomes equal to the fixed gas flow strategy () and
therefore also the dCO2 values become very similar. Independent on the applied strategy
dCO2 levels were well below 50 mmHg during the whole culture time resulting in good
growth, with peak cell densities at day 7 about 16 106 cells/mL, and similar growth rates. In
the case of elevated dCO2 values two porous spargers with average pore diameters of 0.5 and
10 microns, generating bubbles with sizes of 0.43 mm () and 0.26 mm () were used,
resulting in peak dCO2 concentrations of 110 mmHg and 160 mmHg, respectively (Figure
5.4c). For the first condition dCO2 was constant at about 40 mmHg until day 3 and then rose
linearly until day 6 to a value of 110 mmHg and stayed there until the end of the culture.

Results Chapter 5
75
Figure 5.4: CHO cultured with various dCO2 time evolution profiles generated using different bubble sizes and
aeration strategies to change the corresponding carbon dioxide removal rates (see Figure 5.2 and Table 5.1). A
perforated pipe sparger with a pore size of 1000 µm ( bd = 5.61 mm) was used applying either an on demand
aeration strategy () or a constant aeration () with 33 L/h (0.18 vvm). Elevated dCO2 conditions were
generated with two different porous spargers and gas flow rates. A 10 µm sparger (, bd = 0.26 mm) with a
constant gas flow of 0.3 L/h generated highest dCO2 levels up to 160 mmHg and a 0.5 µm sparger (, bd =
0.43 mm) with a constant gas flow of 1 L/h generated final dCO2 levels of 110mmHg. A rescue condition using
the 0.5 µm sparger (, bd = 0.43 mm) with 1 L/h gas flow through the sparger and additional 32 L/h of air
through the headspace of the reactor resulted in a normal dCO2 profile and growth. Graph (a) shows the viable
cell density, (b) the accumulating product titer, (c) the evolution of dissolved CO2 and (d) the applied gas flows.
Error bars represent one standard deviation (N = 2).
The second condition started with a concentration of 30 mmHg and rose immediately
to 80 mmHg at day 3 followed by a further increase to 160 mmHg on day 6. The last
condition () represents an experiment where the sparger size was equal to 0.5 µm and to
avoid buildup of dCO2 the CRR was increased by an additional air flow of 32 L/h through the
bioreactors head space. Herewith the dCO2 profile could be recovered into a normal
02468
1012141618
V
iabl
e ce
ll de
nsity
[106 c
ells
/mL]
0.0
0.1
0.2
0.3
0.4
0.5
0.6 T
iter [g/L
]
0 1 2 3 4 5 6 70
20
40
60
80
100
120
140
160
pC
O2
[mm
Hg]
Time [days]0 1 2 3 4 5 6 7
0.1
1
10
50
Qg
as [L/h]
Time [days]
a b
dc

Chapter 5 Simulation of large scale heterogeneity
76
physiological range and growth as well as productivity where restored (Figure 5.4a-c). The
pH profiles of these experiments shown in Figure 5.5 are well correlated with the evolution of
the dCO2, with lowest pH values for experiments with highest dCO2.
Figure 5.5: pH profiles of the cultivations with elevated dCO2. Symbols are the same as in Figure 5.4.
With these results it is explicit that the decreased performance of the cultures is due to
the dCO2 accumulation, while other effects like stress due to bubble rise can be considered as
not harmful for the applied conditions. The elevated dCO2 environment has a significant
influence on the growth rate and peak cell density of the cultures. When values of about
110 mmHg are reached growth is stopped and the cell density stays at the current value
(Figure 5.4a) which in our case was around 10 106 cells/mL. For even smaller bubbles this
happens on day 4 and peak cell density reaches not more than 6 106 cells/mL. This reduced
amount of cells furthermore explicitly impacts the total productivity of the process with titers
being half or three times smaller than those obtained from a process with a low dCO2 profile
(Figure 5.4b). These findings are well supported by literature where increased sparging lowers
dCO2 and increases the product titer (Mostafa and Gu, 2003). Replacement of bicarbonate
buffer with MOPS-histidine buffer is reported to reduce dCO2 concentrations resulting in
increased growth and a corresponding titer being almost twice the one for conditions with
dCO2 accumulation (Goudar et al., 2007). The here presented method provides a quick and
0 1 2 3 4 5 6 76.6
6.8
7.0
7.2
7.4
7.6
Time [days]
pH

Results Chapter 5
77
easy approach to investigate the possible situation of manufacturing-scale without
modification of the media composition and gives the ability to determine a critical value of
dCO2 for the given cell line and uncovers the key parameters needed to be considered for best
CO2 removal. Obtained results clearly indicates that larger bubbles are preferred as long as
oxygen deliver can still be achieved and high overall gas flow rates have a great power to
increase CO2 removal as long as hydrodynamic stress can be omitted (Villiger et al., 2014).
5.3.3 Determination of the maximum hydrodynamic stress threshold
Before the investigation of the combined effect of several operating parameters on the
cells behavior using the experimental setup shown in Figure 5.1 the effect of hydrodynamic
stress was investigated in a separate experiment. Following the experimental procedure
developed earlier by our group (Neunstoecklin et al., 2014a) the studied cell line was exposed
to oscillatory hydrodynamic stress of various magnitudes using a 3 L bioreactor equipped
with an external loop driven by a centrifugal pump. Several nozzle sizes right behind the
pump enable the tuning of the maximum stress value, while the pump speed can adjust the
exposure frequency. Conditions applied here were the same as described by Neunstoecklin et
al. (2014a) with a liquid flow rate through the loop equal to 2 L/min, corresponding to an
exposure period of cell to peak stress values equal to 90 seconds with maximum stress values
ranging from 2.2 Pa to 103 Pa (Neunstoecklin et al., 2014a). Figure 5.6a compares the growth
profiles of the cultures applying various values of hydrodynamic stress. It can be seen that for
stresses up to 38 Pa the growth is very comparable to the standard conditions, while at 38 Pa
the growth is even slightly increased with a better longevity at the end of the culture. With a
stress value of 103 Pa a strong decrease of the viable cell density is observed, with a peak cell
density being only half compared to the standard condition. The same trend was also visible
in the productivity of the corresponding experiments (data not shown).

Chapter 5 Simulation of large scale heterogeneity
78
Figure 5.6: Stress threshold determination of the studied cell line using cell density and fraction of cell
aggregates. In (a) the cell density is shown and in (c) the fraction of cell aggregates. The applied stress values
applied were 2.2 Pa (), 15 Pa (), 38 Pa () and 103 Pa () using the shear loop system described by
Neunstoecklin et al. (2014a). In (b) the integral viable cell density at day 7 (IVC) was used to determine the
stress threshold, while in (d) the average aggregation fraction during stationary phase was used. Lines were
obtained by linear regression of the first three points and the last two. The dashed lines represent the individual
threshold for the investigated quantity. The average of the two was defined as the cell specific threshold with a
value of 36±3.7 Pa.
The used CHO cells were very prone to aggregation especially during the end of the
culture, with aggregation rates of up to 50 %, which can be seen in Figure 5.6c. With
increased hydrodynamic stress it was expected that cells will be more singularized, which was
confirmed by the conducted experiments. The time profile of the fraction of aggregates for the
experiment applying 15 Pa is almost identical to the standard, while with 38 Pa a decrease of
the aggregate fraction can be seen in the end of the culture. With 103 Pa a significant
reduction is observed with an aggregate fraction never being higher than 12 %. For the
determination of a stress threshold the integral viable cell density (IVC) at day 7 and the
02468
1012141618
V
iabl
e ce
ll de
nsity
[10
6 cells
/mL]
15
20
25
30
35
40
45
IVC
[106*ce
lls*days/m
L]
0 2 4 6 8 10 12 140
10
20
30
40
50
60
Fra
ctio
n o
f ag
g. [%
]
Time [days]1 10 100
10
20
30
40
50 Agg
. fraction in
s.p. [%
]
Stress [Pa]
a b
dc
Results Chapter 5
79
aggregation rate during stationary phase was used. Both were plotted over the applied stress
and due to the limited amount of data available linear regressions were applied to the first
three and the last two points (see Figure 5.6) similar as described by Cruz et al. (1998). The
intersection of the lines was defined as the threshold for the individual quantity (dashed line)
and the average of these two as the threshold for the given cell line, resulting in a value of
36±3.7 Pa.
5.3.4 The two zone model for oscillating oxygen conditions
Embossed from the historical anxiety of shear stress, very gentle agitation rates are
usually applied at manufacturing-scale in mammalian cell culture. A direct impact of slow
mixing is the pressure gradient along the vertical axes of the reactor resulting in different
concentrations of dissolved gases (Manfredini et al., 1983; Oosterhuis and Kossen, 1984).
When considering the standard operating conditions for mammalian cell culture in a 15000 L
bioreactor with a liquid height of 3.4 m, using air as gas, Oosterhuis and Kossen (1984)
reported gradients in DO covering ranges from 10 to 15%. Similar results for such a gradient
in different liquids are also described by Manfredini et al. (1983) and Steel et al. (1966).
Although a considerable amount of publications is available studying the effect of dissolved
oxygen on mammalian cell culture (Li et al., 2006; Ozturk and Palsson, 1991, 1990; Restelli
et al., 2006; Shi et al., 1993), mostly agreeing that DO values between 10 % and 90 % are
suitable for cell cultivation, only few works exist that investigate the oscillation of dissolved
oxygen. Serrato et al. (2004), being to our knowledge the only authors reporting results on
oscillating oxygen concentration for mammalian cell culture, describe the effect of
heterogeneous oxygen conditions on mAb N-glycosylation from hybridoma cells. By a
periodic change of the DO set-point an oscillation was achieved between 17 % and 3 % with a
minimum period (limited by the gas mass transfer) of 800 seconds. Due to the difficult
controllability of dissolved oxygen at the low level (3%) because of the slow polarographic

Chapter 5 Simulation of large scale heterogeneity
80
Clark electrodes a hypoxic situation is very probable and could be the most reasonable
explanation of the described results. In addition, the used oscillation period of 800 second is
rather long. Therefore, to investigate the cell behavior to oscillating values of DO, in this
study we use a two zone model (TZM) composed out of two interconnected bioreactors (see
Figure 5.1). The recirculation of the culture broth between the two bioreactors is realized by a
centrifugal pump. In this way cells will be exposed to the oxygen oscillation with a shorter
period, which in this case was equal to 90 seconds. Furthermore, to avoid a possible hypoxic
situation the oxygen tension was varied between 60 % and 40 % and compared to a control
situation where both reactors were set to 50 %. Having characterized the effects of the above
mentioned centrifugal pump the two zone model could be used with high confidence
neglecting the effects introduce by the pump driving the system. In Figure 5.7 the online
dissolved oxygen measurement is shown for the two interconnected reactors of the two zone
model over the whole cultivation.
Figure 5.7: Online dissolved oxygen signal from the two zone model during culture. Top line measured in the
small compartment (0.3 L) and bottom line measured in the large compartment (3 L). The desired difference of
20 % DO between the compartments could be achieved and maintained throughout the whole culture.
It can be seen that the two different set-points could be maintained from the beginning
throughout the whole time of the culture. The top line with 60 % DO represents the smaller
reactor mainly aerated with pure oxygen. The lower line represents the larger reactor initially
0 1 2 3 4 5 6 7 8 9 10 1130
40
50
60
70
Dis
solv
e ox
ygen
[%]
Time [days]
Results Chapter 5
81
aerated with nitrogen to remove the incoming oxygen rich liquid. With increasing culture time
this gas was enriched with oxygen to compensate for the increasing oxygen demand generated
by the growing culture.
The first experiments were conducted under the above described standard conditions
using the 1 mm perforated pipe sparger in both vessels generating large bubbles. Flow rates
were set to 33 L/h in the big vessel and to an on demand flow rate of pure oxygen (~0.1 L/h)
in the small vessel. The pump flow rate for the recirculation was set to 1 L/h to increase the
liquid residence time in the large vessel, which was needed to achieve the 20 % DO difference
between the two vessels. A shear characterization using the above described shear sensitive
system (Villiger et al., 2014) resulted in a maximum hydrodynamic stress of approximately
25 Pa, being well below the before determined threshold for this cell line. It is worth noting
that the following experiments investigating oscillating oxygen conditions can be considered
as combination experiments of oscillating stress and oxygen resulting from the stress
introduced by the pump nozzle combination and the recirculation through the different
environments of the two vessels. Due to the availability of two identical systems two
experiments were conducted in parallel using one as a control with DO set-points set to 50 %
in both vessels (indicated with solid up-triangles in Figure 5.8), while in the second system
the DO set-points were set to 40 % in the large vessel and to 60 % in the small (indicated with
open up-triangles in Figure 5.8). The difference between the two vessels was chosen as a
worst case scenario based on the above mentioned literature, reporting DO gradients from 10
to 15 % in 15000 L vessels with a liquid height of 3.4 m (Manfredini et al., 1983; Oosterhuis
and Kossen, 1984; Steel and Maxon, 1966). The results of both experiments are compared in
Figure 5.8 with a standard cultivation in a simple single vessel bioreactor (open squares). It
can be seen that growth, productivity, dCO2 evolution and lactate profile are very similar for

Chapter 5 Simulation of large scale heterogeneity
82
those conditions, concluding that the oscillating DO behavior between 40 and 60 % in
combination with the elevated hydrodynamic stress had no impact on the culture.
Figure 5.8: Cultivation results from the two zone model (, 1 mm sparger, bd = 5.61 mm, Qgas = 33 L/h, DO
50 % - 50 %; , 1 mm sparger, bd = 5.61 mm, Qgas = 33 L/h, DO 40 % - 60 %; , 10 µm sparger, bd =
0.26 mm, Qgas = 0.3 L/h, DO 50 % - 50 %; , 10 µm sparger, bd = 0.26 mm, Qgas = 0.3 L/h, DO 40 % - 60 %)
in comparison with a classical 3 L cultivation (, 1 mm sparger, bd = 5.61 mm, Qgas = 33 L/h, DO 50 %) and a
cultivation with elevated dCO2 (, 0.5 µm sparger, bd = 0.43 mm, Qgas = 1 L/h, DO 50 %). Shown is the
viable cell density (a), the dissolved CO2 (b), the product titer (c) and the lactate formation (d).
It is worth noting that the used device is not limited to the above mentioned DO
gradient and could also be used to investigate other DO variations being lower or higher than
the here mentioned. Furthermore, the possibility to achieve very small oscillation periods,
being close to the circulation time of manufacturing-scales, represents an advantage compared
to single vessel systems as describes by Serrato et al. (2004). In the last campaign
combination of all investigated parameters was studied using the same conditions as above
02468
1012141618 a
Via
ble
cell
dens
ity [1
06 cel
ls/m
L]
0
20
40
60
80
100
120b
pC
O2 [m
mH
g]
0 1 2 3 4 5 6 7 8 9 10 110.0
0.2
0.4
0.6
0.8
1.0
1.2 c
Tite
r [g
/L]
Time [days]
0 1 2 3 4 5 6 7 8 9 10 110
5
10
15
20
25d
Lacta
te [m
mol/L]
Time [days]

Conclusion Chapter 5
83
however combined with lower CRR applying smaller bubbles ( bd = 0.26 mm) generated by a
10 µm sparger and reducing the gas flow rate to 1.3 L/h until day 5. To avoid further dCO2
accumulation the gas flow was increased for about 15 % after day 5 to 1.5 L/h. Again in one
TZM the DO set-point was set to 50 % for both vessels (solid down-triangles) and two
different DO set-points equal to 40 % in the big vessel and to 60 % in the small (open down-
triangles). With those conditions it was possible to increase the dCO2 levels to values around
80 mmHg (Figure 5.8b) being higher than the control but still below the critical value of
100 mmHg as discussed above. Results show drastically reduced viable cell density (Figure
5.8a), a 50 % reduced final titer (Figure 5.8c) and a very different Lactate profile (Figure
5.8d). However the direct comparison between fixed and oscillating dissolved oxygen
conditions showed no difference. For comparison in Figure 5.8 an elevated dCO2 condition
conducted in a classical single vessel bioreactor is shown (open diamond). As can be seen
from Figure 5.8b the dCO2 profile is analogous to the TZM condition and is even more
elevated after day 5. Still the growth of this culture is better aligned with the control until day
5 (Figure 5.8a), shows a more expected Lactate profile (Figure 5.8d) and better productivity
(Figure 5.8b). This data clearly indicates that combination of several parameters, in this
particular case hydrodynamic stress and dCO2 where both are below their individual threshold
values, can lead to synergistically negative effects. This has direct implication on the design
space of the process being narrower compared to that obtained using individual parameters.
5.4 Conclusion
The development and application of a two compartment scale down model, capable of
investigating the combined effect of several process parameters was developed. The system
composed of two stirred tank bioreactors of different volume interconnected by a loop allows
the investigation of hydrodynamic stress, DO gradients, pCO2 accumulation and pH
perturbations on cell behavior. Applicability of this system was demonstrated using a
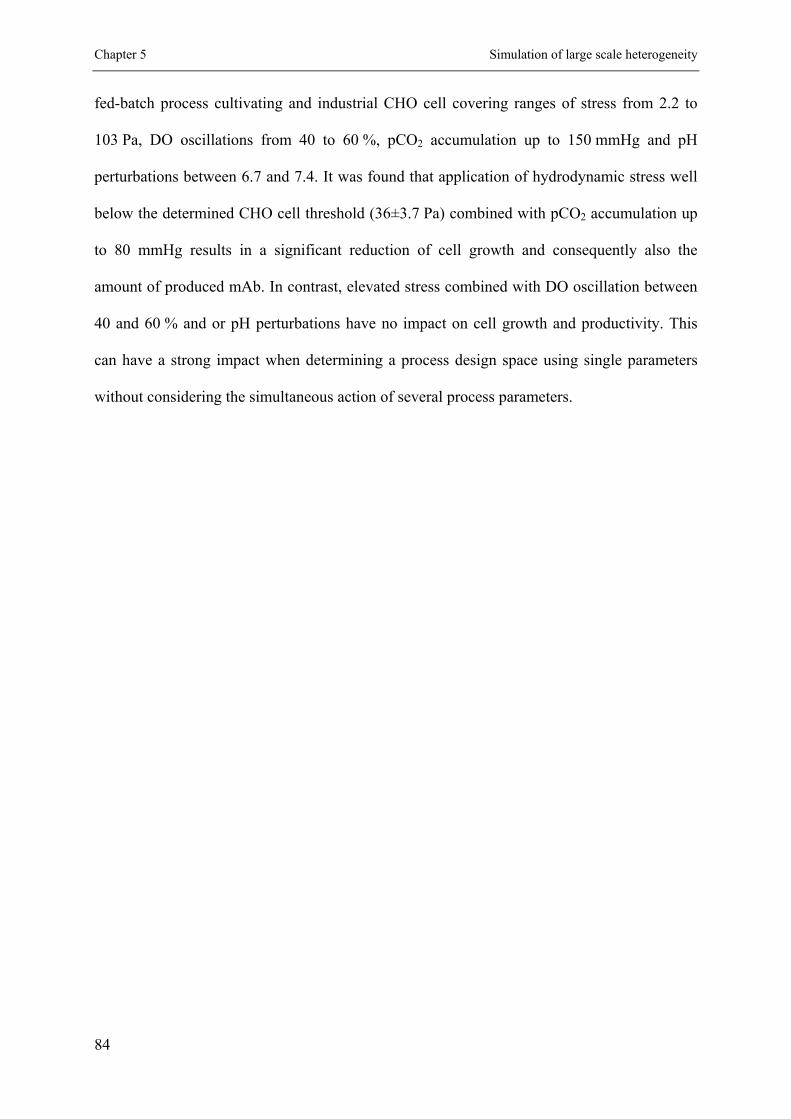
Chapter 5 Simulation of large scale heterogeneity
84
fed-batch process cultivating and industrial CHO cell covering ranges of stress from 2.2 to
103 Pa, DO oscillations from 40 to 60 %, pCO2 accumulation up to 150 mmHg and pH
perturbations between 6.7 and 7.4. It was found that application of hydrodynamic stress well
below the determined CHO cell threshold (36±3.7 Pa) combined with pCO2 accumulation up
to 80 mmHg results in a significant reduction of cell growth and consequently also the
amount of produced mAb. In contrast, elevated stress combined with DO oscillation between
40 and 60 % and or pH perturbations have no impact on cell growth and productivity. This
can have a strong impact when determining a process design space using single parameters
without considering the simultaneous action of several process parameters.

85
Chapter 6
Concluding remarks
A detailed study of multiple large scale specific heterogeneities has been studied in
this work by the development of physical bioreactor based down scale models being capable
of simulating (1) oscillating hydrodynamic shear, (2) increasing dissolved carbon dioxide
over time, (3) feed based pH excursions and (4) oscillating dissolved oxygen. For these scale
dependent parameters threshold values could be defined which are suggested to be used when
up-scaling bioprocesses.
The first part of this work focused on the robustness of two different mammalian cells
against oscillating hydrodynamic stress. A bioreactor based scale down model was developed
being capable of simulating high and low hydrodynamic stress as it is common for stirred
tank reactors. An external loop was connected to a 3 L development bioreactor driven by a
centrifugal pump. Inside this loop right after the pump a contracting nozzles of various size
could be installed to expose the cells, circulating through the loop, to a well-defined turbulent
flow regime. The bioreactor was therefore considered as the bulk region of a
manufacturing-scale reactor and the nozzle as the region around the impeller. Hence, the
described system decouples the hydrodynamic stress magnitude (nozzle size) and frequency
(recirculation flow rate) enabling the simulation of various bioreactor sizes by adapting those
quantities to the ones present in the system of interest. Here the recirculation flow rate and the

Chapter 6 Concluding remarks
86
resulting average exposure period, was based on the mixing time of a known manufacturing
bioreactor and was set to 2 L/min, resulting in an exposure time of 90 seconds. A broad range
of maximum hydrodynamic stress was applied ranging from 1.2 Pa up to 103 Pa to determine
the cell specific threshold for two different cell lines. These thresholds were determined based
on several quantities like growth, productivity, product amount and quality. Generally both
cell lines were robust against the applied stress values with threshold values of 32.4±4.4 Pa
for the CHO cell lines and 25.2±2.4 Pa for the Sp2/0 cell line.
To validate this system and to show its predictive capability, pilot scale experiments at
300 L scale were conducted below and above the before determined stress threshold. The
determination of the maximum stress used for this analysis was conducted for the pilot scale
bioreactor as well as for the loop system using a shear sensitive particulate system based on
the aggregation and breakup behavior of PMMA particles. Therefore, a direct comparison of
the two systems was possible. Results from the pilot scale runs were well in agreement with
the expected hypothesis. At low hydrodynamic stress (7.8 Pa), introduced through normal
agitation (71 rpm), pilot scale data follows the expected growth and metabolite profiles know
from development scale below the threshold. The same is true for high stress (33 Pa) in pilot
scale (150 rpm) which resulted in a reduced cell growth pattern, very similar to the one
measured in the scale-down model equipped with the external loop. Comparison with large
scale data from manufacturing-scales of 5000 L and 15000 L could further confirm these
findings.
Heterogeneities in large scale are not only limited to hydrodynamic stress but include
dissolved gas gradients derived from hydrostatic pressure. This can results in DO gradients
and dCO2 accumulation as observed previously in the literature. To include these effects into
the before developed scale-down model, it was further developed into a two zone model
consisting of two differently sized bioreactors interconnected with a loop. The constructed

Conclusion Chapter 6
87
two zone model consisted of a 3 L bioreactor, representing the manufacturing-scale bulk
region and a 300 mL bioreactor representing the impeller vicinity. Both vessel had individual
control for DO and pH and could therefore be operated at different set points. The application
of the already before used centrifugal pump enabled the circulation of the culture broth
through both environments while simultaneously the exposure to oscillating hydrodynamic
stress was possible. To include the accumulation of dCO2 the removal rate of the carbon
dioxide was modified by changing the aeration bubble size and rate. With this technique
various profiles of accumulating dCO2 were achieved, with a peak value covering a range
from 50 mmHg to 150 mmHg. To show the applicability of this system experiments were
conducted where the culture was exposed to all above mentioned heterogeneities to identify
their interaction onto the growth and productivity of the culture. It was found that the
interaction of hydrodynamic stress and elevated dCO2 has a negative impact on the culture
although both values were not beyond the before determine thresholds. The oscillation of
dissolved oxygen between 40 and 60 % was not found to be harmful for the culture, either as
single parameter or in combination with elevated stress or dCO2.


89
Chapter 7
Outlook
The special conditions present in large-scale bioreactors have been thoroughly
investigated in this work and scale-down models have been developed to better understand
the important criteria needed for scale-up and scale-down. It was possible to present a
methodology to evaluate scale dependent parameters already at development scale to avoid
suboptimal process conditions at manufacturing-scale. However, there are several interesting
things where further investigation would be needed.
The generality of the presented systems should be validated using other cellular
systems including different mammalian species’ and even yeast strains. In some cases
surprising results were observed, like positive effects on cellular productivity caused by
unusually high hydrodynamic stresses. A follow up on these observations could reveal a
simple and easy tool for process optimization. The validity and predictability of the developed
two zone model was not yet confirmed. Interesting would be, if a classical design of
experiments based process optimization, varying several operating parameters, would give the
same results when using either a classical single vessel reactor or the developed two zone
model. Scaling these results to large scale should show the real benefits of the system.
Miniaturization and atomization of such a system could have a great applicability for clone

Chapter 7 Outlook
90
screening, where the predictability of the right cell clone highly depends on the process
conditions that ideally should be as close as possible to the final manufacturing scale.
For all experiments a more detail analysis on the molecular and genetic level could
give a better understanding on the underlying mechanism for the observed results.
Quantitative PCR could be used to look deeper into the protein pathways involved to break
down the different responses of the cell culture on a molecular level. The application of
nowadays affordable protein chip analysis would help to analyze the metabolic state of the
cell and give the opportunity to develop metabolic network models, decoding the cellular
behavior. Moreover, these chip analysis would give a characteristic fingerprint of the process,
which could be used to validate batch to batch data. Different analysis methods facing multi
variant procedures, versus the here mostly univariant approaches, surly would help to give
better understanding on the interconnection of the variables. Moreover the detailed
characterization of large-scale vessels using experimental and computational techniques
would help to better understand the specific environments cells are exposed to, depending on
the vessels scale.

91
Chapter 8
Appendix
8.1 A hydrodynamic stress scale down model
8.1.1 Hydrodynamic stress characterization
The fluid flow in the centrifugal pump as well as in the contracting nozzles was
characterized by computational fluid dynamics (CFD) simulations using commercial
software, ANSYS Fluent v12.1 (Ansys, 2009). Geometry of the centrifugal pump (see
Appendix Figure 8.1) was imported from CAD drawing provided by the pump vendor
(Levitronix, Switzerland) into the meshing software GAMBIT 2.4 (ANSYS Inc., USA).
Computational domain, containing entrance tube, pump housing, pump rotor and outlet tube,
was used for the simulations and it was meshed with a combination of hexahedral and
tetrahedral elements. Rotation of the rotor with respect to the pump housing was simulated
using the multiple reference frame model (Ansys, 2009). The turbulence inside the pump was
modeled through a RNG k- model (Ansys, 2009) combined with a standard wall function.
Several refinement steps were performed to obtain a grid independent solution resulting in a
final mesh size ranging from 3.2x10⁶ up to 4.3x10⁶ computational elements (condition
dependent).
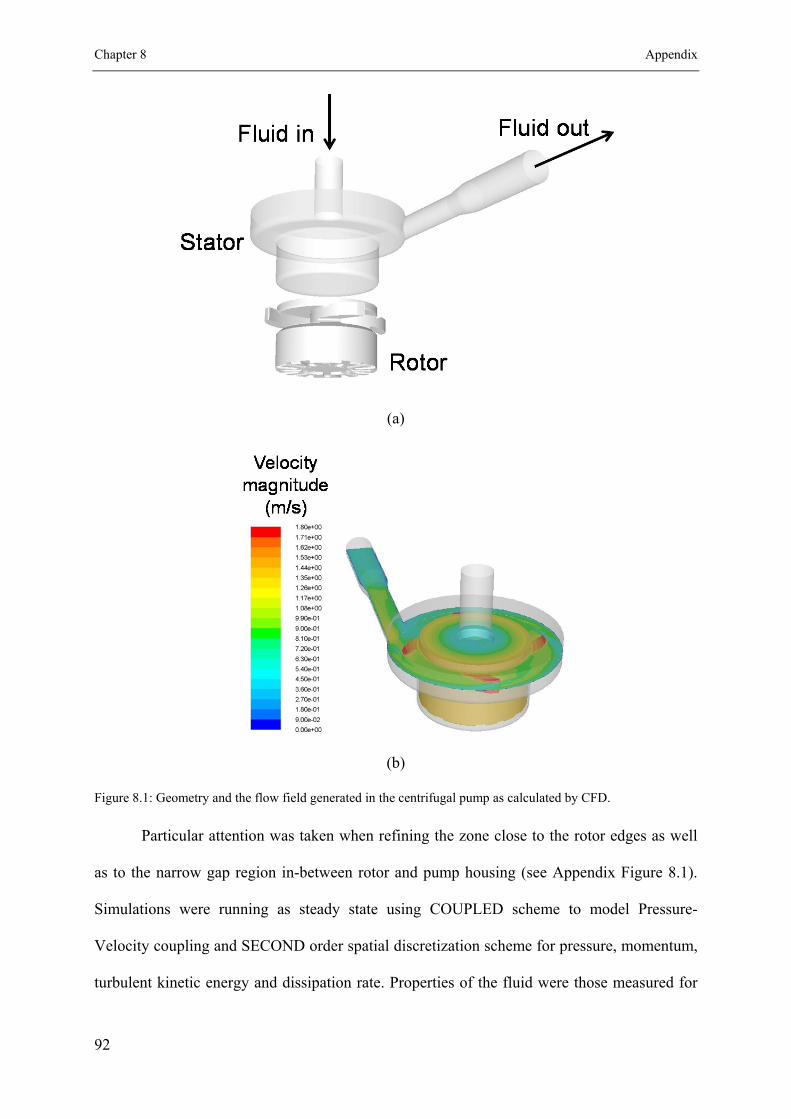
Chapter 8 Appendix
92
(a)
(b)
Figure 8.1: Geometry and the flow field generated in the centrifugal pump as calculated by CFD.
Particular attention was taken when refining the zone close to the rotor edges as well
as to the narrow gap region in-between rotor and pump housing (see Appendix Figure 8.1).
Simulations were running as steady state using COUPLED scheme to model Pressure-
Velocity coupling and SECOND order spatial discretization scheme for pressure, momentum,
turbulent kinetic energy and dissipation rate. Properties of the fluid were those measured for

A hydrodynamic stress scale down model Chapter 8
93
media at 37 °C with a density of 1010 kg/m3 and dynamic viscosity of 0.6974 mPa.s. Solution
convergence was monitored by calculating the torque acting on the pump rotor as well as the
magnitude of the residuals for solved quantities. Once convergence was reached calculations
were made for pump-averaged values as well as the evaluation for local quantities. Calculated
torque was compared with values provided by the pump vendor which agree within 10%
error, supporting the applied approach. Furthermore, validation of the applied computational
approach in terms of pressure drop-flow rate curves can be found in Blaschczok et al.
(Blaschczok et al., 2013)
Since this pump was used to pump the cell culture through the external loop, values of
the stress to which cells were exposed were calculated using an approach develop previously
by Soos et al. (2010) and Tanzeglock et al. (2009). Briefly, in the case of the mean velocity
gradient the corresponding stress can be calculated according to Blaser (1998) and Soos et al.
(2010):
5
2L L (7.1)
with L being the maximum positive eigenvalue of the mean velocity rate of strain (Bird et
al., 2002; Pope, 2000).
In the case of turbulent flow the stress originating from the turbulent fluctuations
could become dominant. Its magnitude depends on the relative size of a cell with respect to
the smallest eddies present in the flow which are characterized by Kolmogorov micro scale,
1 43K where is the energy dissipation rate of a turbulent flow. Below this length
scale the flow is approximately linear and accordingly, the hydrodynamic stress due to local
turbulent fluctuations, VS , is approximated through Eq. (7.1) where
L is substituted for its
turbulent counterpart T 6 (for more details see Soos et al. (2010)). This results in:

Chapter 8 Appendix
94
VS
5
2 6
(7.2)
On the other hand, when the cell size, celld , is larger than
K , i.e., when the cell is in the
inertial sub range of turbulence, the hydrodynamic stress to which the cell is exposed to,
results from the difference in the pressure on opposite locations of the cell (Hinze, 1955).
Under these conditions the hydrodynamic stress due to turbulent fluctuations equates to:
2 3
IS celld (7.3)
Evaluating all mentioned stress values it was found that VS was reaching the highest
values (see Appendix Figure 8.2). Due to a complicated flow pattern in the pump, cells can
follow different trajectories. To take this into account several hundred trajectories were
analyses and the maximum value of VS was extracted from these trajectories (see Appendix
Figure 8.3). It was found that cells are exposed to high values of the hydrodynamic stress over
very short period of time. When comparing various rotation speeds of the rotor corresponding
to various nozzle diameters, it was found that normalized stress distributions are rather similar
and cover approximately 1.5 orders of magnitude (see Appendix Figure 8.3c). A summary of
maximum values of the hydrodynamic stress ( VS ) calculated for various rotation speeds is
presented in Table 2.1 of the main text.
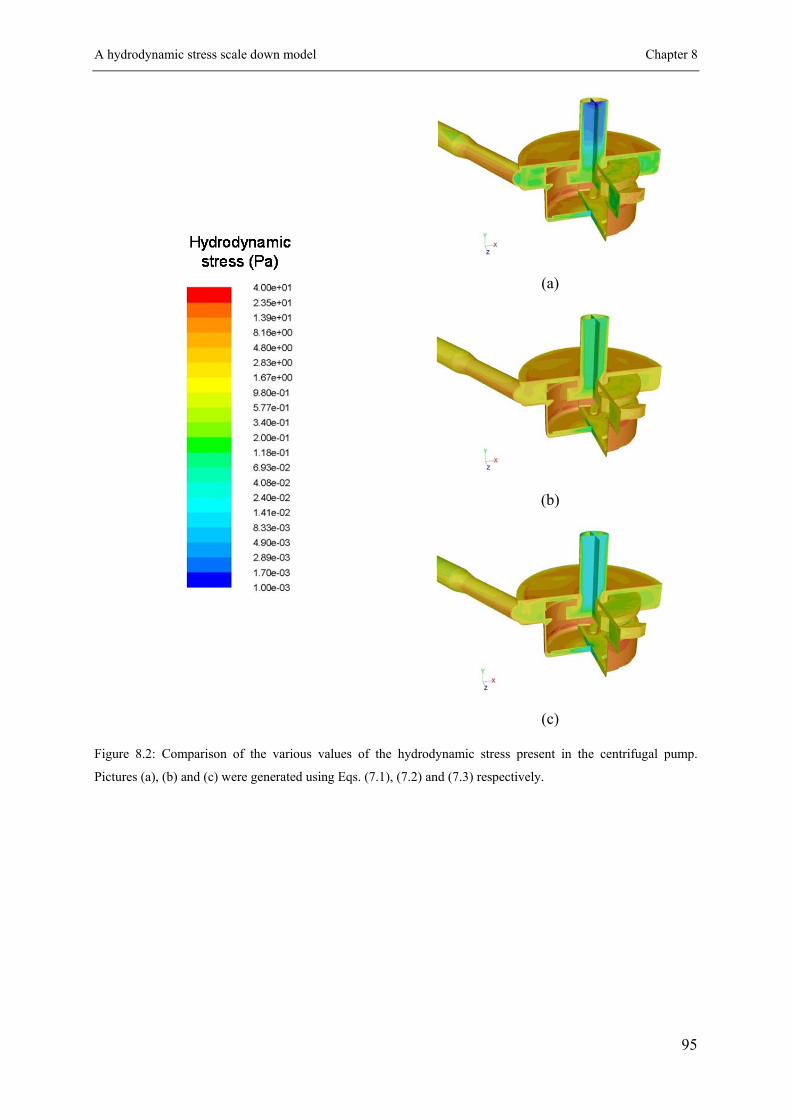
A hydrodynamic stress scale down model Chapter 8
95
(a)
(b)
(c)
Figure 8.2: Comparison of the various values of the hydrodynamic stress present in the centrifugal pump.
Pictures (a), (b) and (c) were generated using Eqs. (7.1), (7.2) and (7.3) respectively.

Chapter 8 Appendix
96
(a)
(b)
(c)
Figure 8.3: Example of the several hundred trajectories of massless particles used to evaluate the maximum
hydrodynamic stress present during a single pass through the pump (a) together with a variation of the
hydrodynamic stress magnitude along a single trajectory (b). Pump rotation speed was equal to 900 rpm in the
simulations presented in (a) and (b). Comparison of the normalized maximum hydrodynamic stress, with respect
to the pump averaged value, evaluated for several conditions, corresponding to various nozzle diameters, is
given in Table 2.1 in the main text.
0.00 0.05 0.10 0.15 0.20 0.25 0.300.0
0.5
1.0
1.5
2.0
2.5
3.0
Hyd
rody
nam
ic s
tres
s (P
a)
Time (s)
0.1 1 100
25
50
75
100
125
150 d
nozzle = 9 mm
dnozzle
= 6 mm
dnozzle
= 5 mm
dnozzle
= 4 mm
dnozzle
= 3 mm
Fre
quen
cy /
( )
/ / ()

A hydrodynamic stress scale down model Chapter 8
97
A similar approach was applied also for the contracting nozzle (see Appendix Figure
8.4). In particular, due to the axial symmetry of the nozzle and because the flow was turbulent
over the whole range of the studied conditions (see Table 2.1), 2D axisymmetric conditions
were used for the simulations.
Figure 8.4: Geometry and the flow field generated in the contracting nozzle.
Turbulence was modeled by employing RNG k- model (Ansys, 2006) combined with
enhanced wall treatment at the wall proximity. To properly resolve gradients of pressure,
velocity as well as turbulent quantities the narrowest part of the nozzle was meshed with 50
computational nodes in radial direction, while 60 computational nodes were used in axial
direction. Furthermore, the section upstream and downstream was included in the
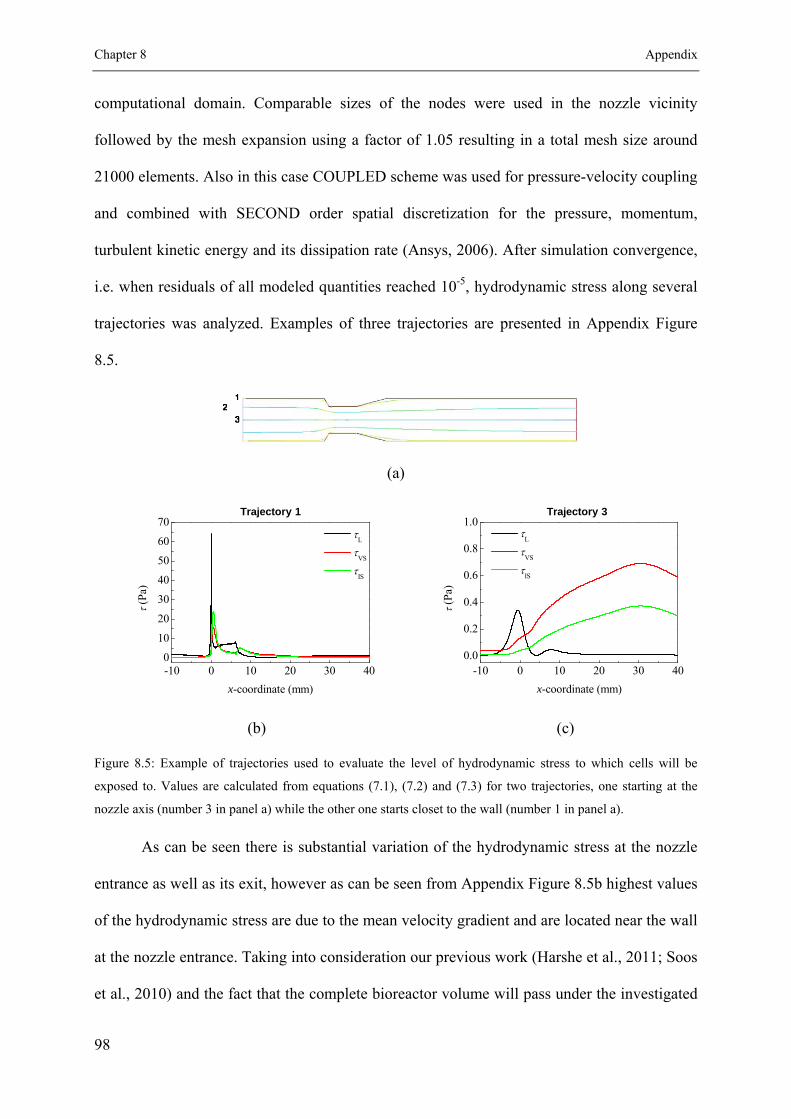
Chapter 8 Appendix
98
computational domain. Comparable sizes of the nodes were used in the nozzle vicinity
followed by the mesh expansion using a factor of 1.05 resulting in a total mesh size around
21000 elements. Also in this case COUPLED scheme was used for pressure-velocity coupling
and combined with SECOND order spatial discretization for the pressure, momentum,
turbulent kinetic energy and its dissipation rate (Ansys, 2006). After simulation convergence,
i.e. when residuals of all modeled quantities reached 10-5, hydrodynamic stress along several
trajectories was analyzed. Examples of three trajectories are presented in Appendix Figure
8.5.
(a)
(b)
(c)
Figure 8.5: Example of trajectories used to evaluate the level of hydrodynamic stress to which cells will be
exposed to. Values are calculated from equations (7.1), (7.2) and (7.3) for two trajectories, one starting at the
nozzle axis (number 3 in panel a) while the other one starts closet to the wall (number 1 in panel a).
As can be seen there is substantial variation of the hydrodynamic stress at the nozzle
entrance as well as its exit, however as can be seen from Appendix Figure 8.5b highest values
of the hydrodynamic stress are due to the mean velocity gradient and are located near the wall
at the nozzle entrance. Taking into consideration our previous work (Harshe et al., 2011; Soos
et al., 2010) and the fact that the complete bioreactor volume will pass under the investigated
-10 0 10 20 30 400
10
20
30
40
50
60
70
L
VS
IS
(P
a)
x-coordinate (mm)
Trajectory 1
-10 0 10 20 30 400.0
0.2
0.4
0.6
0.8
1.0
L
VS
IS
(P
a)
x-coordinate (mm)
Trajectory 3

A hydrodynamic stress scale down model Chapter 8
99
conditions, the nozzle approximately 1000 times over the cell doubling period, it is assumed
that every cell will experience several times the zone with highest stress. Therefore, this value
should be used when evaluating the effect of the hydrodynamic stress on the cell culture.
Comparing the distribution of the maximum hydrodynamic stress, evaluated using the above
described trajectory analysis and presented in Appendix Figure 8.6, it can be seen that the
narrower distribution of the stress maxima is obtained in the pump compared to the nozzle.
Figure 8.6: Comparison of the distributions of the hydrodynamic stress calculated for both pump and nozzle
applying a nozzle diameter of 6 mm and a pump speed of 900 rpm.
However, in both cases the maximum values present in the whole system are very
comparable. A summary of such maximum values calculated for various nozzle diameters
using a constant flow rate of 2 L/min is presented in Table 2.1.
To validate such obtained stress values in parallel to the CFD characterization the
maximum hydrodynamic stress present in the whole system (i.e. bioreactor combined with an
external loop) was measured also experimentally using a shear sensitive particulate system
(Villiger et al., 2014). In a typical breakage experiment, the initial suspension of PMMA
nanoparticles was aggregated in a 2 L beaker with a latex mass fraction, , of 21 10 . A
0.2 mol/L sodium chloride solution, well above the critical coagulation concentration (CCC),
and a 40 mm pitch blade impeller operated at 50 rpm were used for the initial aggregation of
primary PMMA nanoparticles. As soon as the strength of the growing clusters is smaller than
1 100.0
0.1
0.2
0.3
0.4
0.5 Nozzle Pump
Nor
mal
ized
Fre
quen
cy /
()
Hydrodynamic stress / (Pa)

Chapter 8 Appendix
100
the applied stress, i.e. when their size becomes large enough (Bäbler et al., 2010; Ehrl et al.,
2010), the aggregates break leading to the formation of aggregate cluster fragments.
Subsequently, these fragments can re-aggregate until a dynamic equilibrium between
aggregation and breakage is reached, resulting in a steady state aggregate size (Moussa et al.,
2007).
The initial aggregates were diluted in a studied system (bioreactor alone or bioreactor
equipped with loops system) filled with deionized water resulting in a final particle mass
fraction of 55 10 . This high dilution factor of 200 reduces the salt concentration to 1 mM,
preventing any significant re-aggregation as it is well below the CCC of the nanoparticles.
Consequently, breakage becomes the only mechanism controlling the aggregate size. As soon
as the hydrodynamic stress exceeds the aggregates’ strength, they will break until a new
steady state size is reached (Kusters, 1991; Soos et al., 2013).
Since bursting bubbles at the air-liquid interface can generate very high hydrodynamic
stress (Boulton-Stone and Blake, 1993; Garcia-Briones et al., 1994; Ma et al., 2004),
surfactant (0.5 g/l of Pluronic® F-68) was added to prevent the attachment of aggregates to
rising bubbles (Ma et al., 2004; Mollet et al., 2004).
Once steady state cluster size was reached, an off-line sample of 25 mL was gently
withdrawn and measured by small angle light scattering (SALS). This procedure was repeated
for nozzles of various sizes combined with appropriate pump speed to ensure flow rate
through the nozzle equal to 2 L/min. To ensure that no restructuring occurs during breakage
experiments the fractal dimension of the aggregates, fd , was determined from light scattering
data as discussed in the previous work (Ehrl et al., 2008; Soos et al., 2008).
Following an experimental procedure developed earlier (Soos et al., 2010), the relation
between the steady state aggregate size and the applied maximum hydrodynamic stress was
constructed by breaking the initial aggregates in contracting nozzles of various diameters and

A hydrodynamic stress scale down model Chapter 8
101
applying different flow rates. The aggregate suspension was pumped several hundred times
through the nozzle in order to guarantee complete aggregate breakage (Harshe et al., 2011;
Soos et al., 2010). The evolution of the CMD was monitored by small-angle light scattering
and the steady state aggregate size was correlated to the maximum hydrodynamic stress
calculated from direct numerical simulations (Soos et al., 2013).
For more details we refer to the original papers where this method as well as its
application to single phase and multiphase flow was applied (Soos et al., 2013; Villiger et al.,
2014). Comparison of both methods is presented in Table 2.1 of the main text. As it can be
seen both approaches, CFD as well as shear sensitive particulate system, are resulting in very
comparable values of the maximum hydrodynamic stress supporting the CFD characterization
discussed above.

Chapter 8 Appendix
102
Figure 8.7: Viability decay over 24 h for CHO cells. In (a) results from the simple shear device as described in
the material and methods section. Applied stress values calculated via CFD where 0.4 Pa (), 40 Pa (),
56 Pa (), 109 Pa () and 420 Pa () – also see Table 2.2. The same methodology was used for the bioreactor
runs equipped with external loop and results are shown in (b). Regression was performed over the first 24 h, the
points at working day 2 show the adaption of the cells to the hydrodynamic stress. Stress values are derived from
the system characterization describe in the material and method section and were 2.2 Pa (), 15 Pa (), 21 Pa
(), 28 Pa ( ), 38 Pa (), 83 Pa () and 103 Pa (). Error bars represent two standard deviations from at
least 2 independent experiments.
Time [days]
40
50
60
70
80
90
a
Via
bili
ty [
%]
0.5 1.0 1.5 2.0
70
75
80
85
90
95
b

A hydrodynamic stress scale down model Chapter 8
103
Figure 8.8: Time evolution of specific consumption and production rates of glucose (GLC), lactate (LAC),
glutamine (GLN), glutamate (GLU) and ammonia (NH4) during the fed-batch cultivation measured for CHO
cells (a – e) and Sp2/0 cells (f – j). Symbols correspond to various magnitudes of the hydrodynamic stress
introduced with a classical single vessels, 1.2 Pa (, Sp2/0 control), 2.2 Pa (, CHO control) or the oscillating
hydrodynamic stress loop systems 15 Pa (), 21 Pa (), 38 Pa (), 83 Pa () and 103 Pa (). Error bars
represent two standard deviations from at least 2 independent runs.
SP2/0CHO
-10
-8
-6
-4
-2
0
2
0
5
10
15
20
-10
-8
-6
-4
-2
0
-0.8
-0.4
0.0
0.4
0.8
Time [days] Time [days]
0 1 2 3 4 5 6 7 8 9 10 11
0
2
4
6
-8
-6
-4
-2
0
2a
q GL
C [
pmol
/cel
l*da
y]
f
02468
10121416 b
q LA
C [
pmol
/cel
l*da
y]
g
-0.4
-0.2
0.0
0.2
0.4 c
q GL
N [
pmol
/cel
l*da
y]
h
-0.1
0.0
0.1
0.2
0.3
0.4
0.5 d
q GL
U [
pmol
/cel
l*da
y]
i
0 1 2 3 4 5 6 7 8 9 10
-0.2
0.0
0.2
0.4 e
q NH
4 [pm
ol/c
ell*
day]
j

Chapter 8 Appendix
104
Figure 8.9: Amino acid profiles from CHO culture. Meaning of the symbols is the same as in Figure 2.3 or
Appendix Figure 8.8 and error bars represent two standard deviations (N = 2).
05
101520253035
2
4
6
8
10
0
2
4
6
2468
1012
0.5
1.0
1.5
2.0
2
4
6
8
10
0.5
1.0
1.5
2.0
2.5
0
2
4
6
8
10
1
2
2
4
6
8
2
4
6
8
10
2
4
6
8
10
1
2
3
4
5
0.5
1.0
1.5
2.0
2.5
2
4
6
8
10
2
4
6
8
10
2
4
6
8
Time [days]
0 2 4 6 8 10
0.5
1.0
1.5
Time [days]
0 2 4 6 8 10
1
2
3
4
Time [days]
0 2 4 6 8 10
2
4
6
8
A
LA
[m
mol
/L]
AR
G [
mm
ol/L
]
ASN
[m
mol
/L]
ASP
[m
mol
/L]
CY
S [m
mol
/L]
GL
N [
mm
ol/L
]
GL
U [
mm
ol/L
]
GL
Y [
mm
ol/L
]
HIS
[m
mol
/L]
ILE
[m
mol
/L]
LE
U [
mm
ol/L
]
LY
S [m
mol
/L]
ME
T [
mm
ol/L
]
PHE
[m
mol
/L]
PRO
[m
mol
/L]
SER
[m
mol
/L]
TH
R [
mm
ol/L
]
TR
P [m
mol
/L]
TY
R [
mm
ol/L
]
VA
L [
mm
ol/L
]

A hydrodynamic stress scale down model Chapter 8
105
Figure 8.10: Amino acid profiles from SP2/0 culture. Meaning of the symbols is the same as in Figure 2.3 or
Appendix Figure 8.8 and error bars represent two standard deviations (N = 2).
0
4
8
12
1.21.41.61.82.02.22.4
0.2
0.4
0.6
0.8
0.2
0.4
0.6
0.8
1.0
0.1
0.2
0.3
0.4
0.5
48
1216202428
0.5
1.0
1.5
2.0
2.5
0.60.70.80.91.01.11.21.31.4
0.40.50.60.70.80.9
1.0
1.5
2.0
2.5
2345678
1.5
2.0
2.5
3.0
3.5
0.2
0.4
0.6
0.6
0.8
1.0
1.2
0.20.40.60.81.01.21.4
1.0
1.5
2.0
2.5
1.0
1.5
2.0
2.5
Time [days]
0 2 4 6 8 10
0.0
0.1
0.2
0.3
Time [days]
0 2 4 6 8 10
0.5
1.0
1.5
2.0
Time [days]
0 2 4 6 8 10
1.0
1.5
2.0
2.5
A
LA
[m
mol
/L]
AR
G [
mm
ol/L
]
ASN
[m
mol
/L]
ASP
[m
mol
/L]
CY
S [m
mol
/L]
GL
N [
mm
ol/L
]
GL
U [
mm
ol/L
]
GL
Y [
mm
ol/L
]
HIS
[m
mol
/L]
ILE
[m
mol
/L]
LE
U [
mm
ol/L
]
LY
S [m
mol
/L]
ME
T [
mm
ol/L
]
PHE
[m
mol
/L]
PRO
[m
mol
/L]
SER
[m
mol
/L]
TH
R [
mm
ol/L
]
TR
P [m
mol
/L]
TY
R [
mm
ol/L
]
VA
L [
mm
ol/L
]

Chapter 8 Appendix
106
Figure 8.11: Cell size over culture time and aggregation behavior as a function of various hydrodynamic stress
values. CHO culture (a, b), Sp2/0 culture (c, d), symbols show various magnitudes of hydrodynamic stress
introduced with a classical single vessels or the oscillating hydrodynamic stress loop system. Values for (a) were
2.2 Pa (, CHO control), 21 Pa (), 38 Pa (), 83 Pa () and 103 Pa (). Values for (b) were 1.2 Pa (,
Sp2/0 control), 15 Pa (), 21 Pa (), 38 Pa () and 83 Pa (). Error bars represent two standard deviations
from at least 2 independent runs.
Time [days]0 1 2 3 4 5 6 7 8 9 10
9
10
11
12
13
14
15
16
17
4
8
12
16
20
Stress [Pa]1 10 100
45678910111213
14
15
16
17
18 a
C
ell s
ize
[µm
]
c
b
Cell aggregates [%
]
d
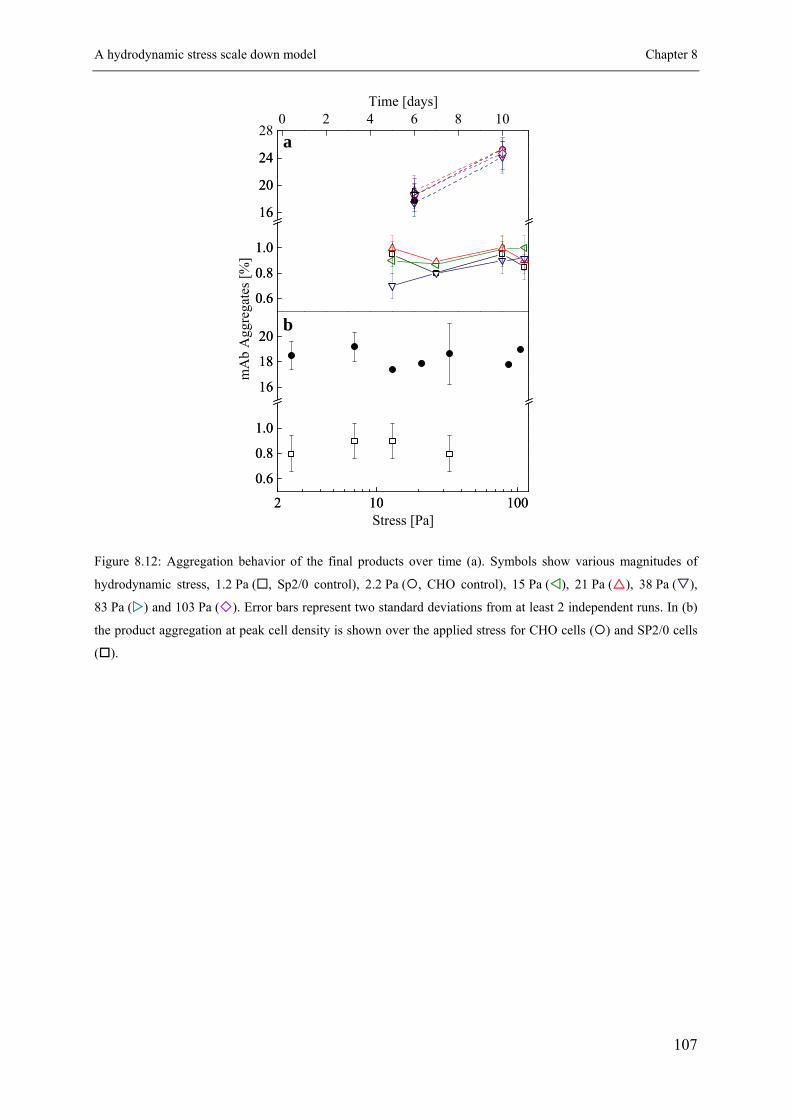
A hydrodynamic stress scale down model Chapter 8
107
Figure 8.12: Aggregation behavior of the final products over time (a). Symbols show various magnitudes of
hydrodynamic stress, 1.2 Pa (, Sp2/0 control), 2.2 Pa (, CHO control), 15 Pa (), 21 Pa (), 38 Pa (),
83 Pa () and 103 Pa (). Error bars represent two standard deviations from at least 2 independent runs. In (b)
the product aggregation at peak cell density is shown over the applied stress for CHO cells () and SP2/0 cells
().
Time [days]
0.6
0.8
1.0
16
20
24
280 2 4 6 8 10
0.6
0.8
1.0
16
20
24
2 10 100
0.6
0.8
1.0
16
18
20
Stress [Pa]2 10 100
0.6
0.8
1.0
16
18
20
a
b
mA
b A
ggre
gate
s [%
]

Chapter 8 Appendix
108
8.2 Oscillating hydrodynamic stress at pilot scale
8.2.1 Determination of the maximum hydrodynamic stress of the used
stirred tank bioreactors
To determine the maximum hydrodynamic stress values of the reactors used in this
work, poly(methyl methacrylate) (PMMA) nanoparticles were synthesized by a monomer-
starved semi batch emulsion polymerization (Sajjadi and Yianneskis, 2003; Villiger et al.,
2014). Particles with a mean diameter of 60 nm were produced and monodispersity was
shown by dynamic light scattering (DLS) with a polydispersity index (PDI) of 0.04. Initial
aggregates were prepared in a gently stirred 2 L beaker using a 0.2 M sodium chloride
solution with a latex mass fraction of 1 10-2. At this condition the particles grow due to
aggregation until their strength becomes lower than the maximum applied stress, max (Ehrl et
al., 2010; Soos et al., 2008). Multiple re-aggregation and breakup events occur until a steady
state aggregate size is reached. Subsequent dilution of these particles (200 x) into the vessel to
be analyzed filled with deionized water reduces the salt concentration to 1 mM, well below
the critical coagulation concentration, preventing further aggregation and breakup becomes
the dominant mechanism controlling the aggregates size. To ensure steady state conditions the
time evolution of the aggregate sizes was monitored by a small-angle light scattering
instrument, Mastersizer 2000 (Malvern Instruments, UK). Using the previously determined
calibration from Villiger et al. (Villiger et al., 2014) for stress and aggregate size, the
measured steady state size was used to calculate the maximum stress present in the system of
interest.
The steady state size of the particles is reached after 90 minutes as shown in Appendix
Figure 8.12a, where gR , the size of the particles, is not changing anymore for aerated and
non-aerated conditions for both reactor scales. The comparison of the structure factor S q

Oscillating hydrodynamic stress at pilot scale Chapter 8
109
measured for PMMA aggregates under various conditions, plotted as a function of the
scattering wave vector q , showed a reduction of aggregate sizes, indicating an increase of
the hydrodynamic stress (data not shown). To identify any differences in the internal structure
of the formed aggregates S q was plotted as a function of the normalized particle size
gq R (see Appendix Figure 8.12b). All data fall on the same curve with a slope (fractal
dimension) of a power law equal to -2.7, indicating very compact aggregates whose internal
structure is independent whether aerated or non-aerated conditions were applied.
Figure 8.13: The breakdown behavior of the PMMA particle sizes over time is given in (a) to verify their steady
state size after 90 min, for the 3 L () and 300 L bioreactors ( no aeration, 0.09 vvm aeration). In (b) the
structure factor S q is plotted over the normalized particle size gq R , to show the particles structural
independency on aerated or non-aerated conditions, for the 3 L bioreactor operated at 75 rpm without () and
with aeration ( 0.09vvm) as well as for the 300 L bioreactor at 40 rpm without () and with ( 0.09vvm)
aeration.
Time [min]0 30 60 90 120 150 180
5
10
15
20
25
30
35
q<Rg> [-]
10-1 100 101 102
10-5
10-4
10-3
10-2
10-1
100
a
Rg [µ
m]
b
S(q
) [-
]
q-2.7

Chapter 8 Appendix
110
Figure 8.14: Progression of the specific production and consumption of the basic metabolites Glucose (a),
Lactate (b), Glutamine (c), Glutamate (d) and Ammonia (e) plus the product titer (f). Symbols refer to maximum
stress values of 1.7 Pa (), 21 Pa () and 38 Pa () at 3 L scale, while at 300 L scale they symbolize 7 Pa ()
and 28 Pa (). Error bars represent one standard deviation and are obtained from at least two independent
cultivations.
-8
-6
-4
-2
0
0
5
10
15
20
-10
-8
-6
-4
-2
0
2
-0.5
0.0
0.5
1.0
Time [days]
0 2 4 6 8 10
-2-101234567
Time [days]
0 2 4 6 8 10
10
20
30
40
50
a
q
GLC
[pm
ol/c
ell*
day]
b qLA
C [pmol/cell*day]
c
q GL
N [p
mol
/cel
l*da
y]
d
qG
LU [pm
ol/cell*day]
e
q NH
4 [p
mol
/cel
l*da
y]
f
qT
iter [pg/cell*day]

Oscillating hydrodynamic stress at pilot scale Chapter 8
111
Figure 8.15: Glycosylation (a) and charged variants (b) profile measured at day 5 using 3L and 300L bioreactors
operated at various maximum hydrodynamic stresses.
1 2 3 4 5 6 7 8 9
5
10
15
20
25
30
35
Gly
cofo
rm W
D0
5 [%
]
7.5 7.7 7.9 8.1 8.2 8.4 8.6 8.7
5
10
15
20
25
30
3L (1.2 Pa) 3L (15Pa) 300L (7.8 Pa) 3L (38 Pa) 300L (33 Pa)
Cha
rge
d va
riant
s W
D05
[%]
b
a
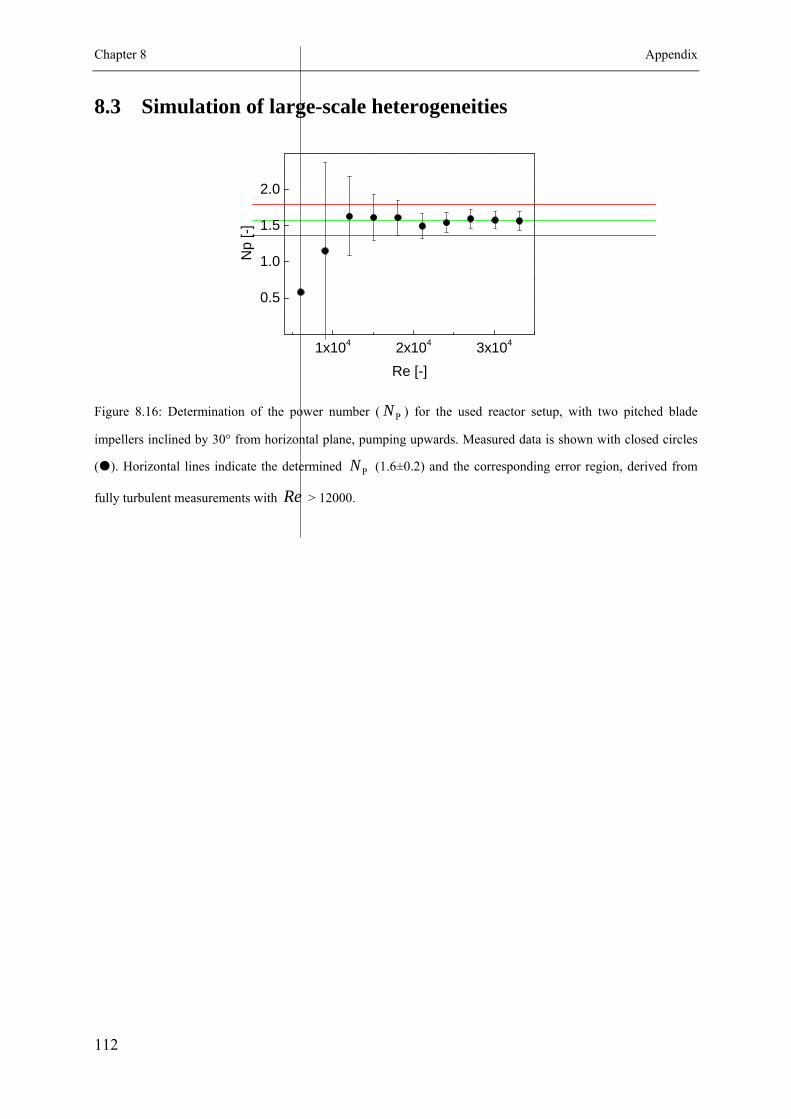
Chapter 8 Appendix
112
8.3 Simulation of large-scale heterogeneities
Figure 8.16: Determination of the power number ( PN ) for the used reactor setup, with two pitched blade
impellers inclined by 30° from horizontal plane, pumping upwards. Measured data is shown with closed circles
(). Horizontal lines indicate the determined PN (1.6±0.2) and the corresponding error region, derived from
fully turbulent measurements with Re > 12000.
1x10⁴ 2x10⁴ 3x10⁴
0.5
1.0
1.5
2.0
Np
[-]
Re [-]

Simulation of large-scale heterogeneities Chapter 8
113
Figure 8.17: Measurement of the apparent oxygen mass transfer coefficient (2L Ok a ) in culture media for
different gas flow rates and bubble sizes, generated with diverse sparger types (a). Agitation was fixed to
250 rpm in all cases. Bubble sizes and corresponding sparger pore openings where, bd 0.26 mm / p, Spd 10 µm
(), bd 0.43 mm / p, Spd 0.5 µm (), bd 0.67 mm / p, Spd 50 µm (), bd 1.00 mm / p, Spd 100 µm (),
bd 5.61 mm / p, Spd 1000 µm (). Measurements with different concentrations of antifoam agent are shown in
(b), (c) and (d) for fixed superficial gas flow rates of 8.63 10-5 m/s, 1.08 10-4 m/s and 7.12 10-4 m/s,
respectively. Closed symbols correspond to measurements during the culture (see materials and methods section
in the main text) and serve as comparison to verify, that non culture based 2L Ok a measurements are
representative for culture conditions.
10-5 10-4 10-3
100
101
db 0.26 mm, d
Sp 10µm
db 0.43 mm, d
Sp 0.5µm
db 0.67 mm, d
Sp 50µm
db 1.00 mm, d
Sp 100µm
db 5.61 mm, d
Sp 1000µm
a
k La
[1/h
]
vs [m/s]
10-2 10-1
QGas
[vvm]
0 5 10 15 20
15
20
25
30
35
40 b
k La
[1/h
]
AFA (g)
0 5 10 15 20
3.5
4.0
4.5
5.0
c
k La [1
/h]
AFA (g)0 5 10 15 20
2.0
2.2
2.4
2.6
2.8
3.0 d
k La [1
/h]
AFA (g)


115
Nomenclature
tX viable cell concentration at time t [106 cells/mL]
Titerq specific mAb production rate [pg/cell*day]
DNAq specific DNA release rate [pg/cell*day]
GLCq specific glucose consumption rate [pmol/cell*day]
LACq specific lactate production rate [pmol/cell*day]
GLNq specific glutamine consumption rate [pmol/cell*day]
GLUq specific glutamate consumption rate [pmol/cell*day]
4NHq specific ammonia production rate [pmol/cell*day]
max maximum hydrodynamic stress [Pa]
exp experimentally determined max [Pa]
L laminar hydrodynamic stress [Pa]
VS turbulent hydrodynamic stress [Pa]
IS inertial sub range of turbulent hydrodynamic stress [Pa]
energy dissipation rate of turbulent flow [W/kg]
mean energy dissipation rate [W/kg]
nozzleRe Reynolds number of the nozzle []
PN power number of the impeller []
N agitation rate of the impeller [1/s]
D diameter of the impeller [m]
nozzleD diameter of the nozzle [mm]
BioV volume of the bioreactor [L]

Nomenclature
116
nozzleQ flow through the nozzle [ml/min]
loopQ flow through the loop [L/min]
_pump agitv agitation rate of the centrifugal pump [rpm]
Agitv agitation rate of the impeller [rpm]
Tipv tip speed of the impeller [m/s]

117
Bibliography
Adams, D., Korke, R., Hu, W.W., 2007. Application of Stoichiometric and Kinetic Analyses to Characterize Cell Growth and Product Formation, in: Pörtner, R. (Ed.), Animal Cell Biotechnology - Methods and Protocols. Human Press Inc., Totowa, pp. 269–284.
Al-Rubeai, M., Singh, R.P., Goldman, M.H., Emery, A.N., 1995. Death mechanisms of animal cells in conditions of intensive agitation. Biotechnol. Bioeng. 45, 463–472. doi:10.1002/bit.260450602
Amanullah, A., McFarlane, C.M., Emery, a N., Nienow, A.W., 2001. Scale-down model to simulate spatial pH variations in large-scale bioreactors. Biotechnol. Bioeng. 73, 390–9.
Amanullah, A., Nienow, A.W., Emery, A.N., McFarlane, C.M., 1993. The use of Bacillus subtilis as an oxygen sensitive culture to simulate dissolved oxygen cycling in large scale fermenters. Trans I Chem E Part C, 206–208.
Ansys, 2006. FLUENT 6.3 User’s Guide.
Ansys, 2009. FLUENT 12.1 User’s Guide.
Attarwala, H., 2010. TGN1412: From Discovery to Disaster. J. Young Pharm. 2, 332–6. doi:10.4103/0975-1483.66810
Bäbler, M.U., Moussa, A.S., Soos, M., Morbidelli, M., 2010. Structure and kinetics of shear aggregation in turbulent flows. I. Early stage of aggregation. Langmuir 26, 13142–52. doi:10.1021/la1015516
Bandyopadhyay, B., Humphrey, A.E., 1967. Dynamic measurement of the volumetric oxygen transfer coefficient in fermentation systems. Biotechnol. Bioeng. 9, 533–544. doi:10.1002/bit.22566
Berridge, J., Seamon, K., Venugopal, S., 2009. A-Mab: a Case Study in Bioprocess Development.
Birch, J.R., Racher, A.J., 2006. Antibody production. Adv. Drug Deliv. Rev. 58, 671–85. doi:10.1016/j.addr.2005.12.006
Bird, R.B., Stewart, W.E., Lightfoot, E.N., 2002. Transport Phenomena, 2nd ed. John Wiley & Sons, Inc.
Blaschczok, K., Kaiser, S.C., Löffelholz, C., Imseng, N., Burkart, J., Bösch, P., Dornfeld, W., Eibl, R., Eibl, D., 2013. Investigations on Mechanical Stress Caused to CHO Suspension Cells by Standard and Single-Use Pumps. Chemie Ing. Tech. 85, 144–152. doi:10.1002/cite.201200135
Blaser, S., 1998. The hydrodynamical effect of vorticity and strain on the mechanical stability of flocs. ETHZ.

Bibliography
118
Borys, M.C., Papoutsakis, E.T., 1992. Formation of bridges and large cellular clumps in CHO-cell microcarrier cultures: effects of agitation, dimethyl sulfoxide and calf serum. Cytotechnology 8, 237–48.
Boulton-Stone, J.M., Blake, J.R., 1993. Gas bubbles bursting at a free surface. J. Fluid Mech. 254, 437–466.
Butler, M., 2006. Optimisation of the cellular metabolism of glycosylation for recombinant proteins produced by Mammalian cell systems. Cytotechnology 50, 57–76. doi:10.1007/s10616-005-4537-x
Bylund, F., Collet, E., Enfors, S.O., Larsson, G., 1998. Substrate gradient formation in the large-scale bioreactor lowers cell yield and increases by-product formation. Bioprocess Eng. 18, 171–180.
Chalmers, J.J., Bavarian, F., 1991. Microscopic visualization of insect cell-bubble interactions. II: The bubble film and bubble rupture. Biotechnol. Prog. 7, 151–8. doi:10.1021/bp00008a010
Chisti, Y., 2000. Animal-cell damage in sparged bioreactors. Trends Biotechnol. 18, 420–432. doi:10.1016/S0167-7799(00)01474-8
Chisti, Y., 2001. Hydrodynamic damage to animal cells. Crit. Rev. Biotechnol. 21, 67–110. doi:10.1080/20013891081692
Chisti, Y., 2010. Shear sensitivity, in: Flickinger, M.C. (Ed.), Encyclopedia of Industrial Biotechnology: Bioprocess, Bioseparation, and Cell Technology, Vol. 7. Wiley, New York, New York, pp. 4360–4398.
Chu, L., Robinson, D.K., 2001. Industrial choices for protein production by large-scale cell culture. Curr. Opin. Biotechnol. 12, 180–7.
Clift, R., Grace, J.R., Weber, M.E., 1978. Bubbles, drops and particles. Academic Press, New York.
Clincke, M.-F., Guedon, E., Yen, F.T., Ogier, V., Roitel, O., Goergen, J.-L., 2010. Effect of surfactant pluronic F-68 on CHO cell growth, metabolism, production, and glycosylation of human recombinant IFN-γ in mild operating conditions. Biotechnol. Prog. 27, 181–90. doi:10.1002/btpr.503
Croughan, M.S., Wang, D.I.C., 1989. Growth and death in overagitated microcarrier cell cultures. Biotechnol. Bioeng. 33, 731–744. doi:10.1002/bit.260330611
Cruz, P.E., Cunha, A., Peixoto, C.C., Clemente, J., Moreira, J.L., Carrondo, M.J., 1998. Optimization of the production of virus-like particles in insect cells. Biotechnol. Bioeng. 60, 408–18.
Davies, P.F., Remuzzi, A., Gordon, E.J., Dewey, C.F., Gimbrone, M.A., 1986. Turbulent fluid shear stress induces vascular endothelial cell turnover in vitro. Proc. Natl. Acad. Sci. U. S. A. 83, 2114–7.

Bibliography
119
De Jesus, M., Wurm, F.M., 2011. Manufacturing recombinant proteins in kg-ton quantities using animal cells in bioreactors. Eur. J. Pharm. Biopharm. 78, 184–8. doi:10.1016/j.ejpb.2011.01.005
Del Val, I.J., Kontoravdi, C., Nagy, J.M., 2010. Towards the implementation of quality by design to the production of therapeutic monoclonal antibodies with desired glycosylation patterns. Biotechnol. Prog. 26, 1505–27. doi:10.1002/btpr.470
Ducommun, P., Ruffieux, P., Furter, M., Marison, I., von Stockar, U., 2000. A new method for on-line measurement of the volumetric oxygen uptake rate in membrane aerated animal cell cultures. J. Biotechnol. 78, 139–147.
Ehrl, L., Soos, M., Morbidelli, M., 2008. Dependence of aggregate strength, structure, and light scattering properties on primary particle size under turbulent conditions in stirred tank. Langmuir 24, 3070–3081. doi:10.1021/la7032302
Ehrl, L., Soos, M., Wu, H., Morbidelli, M., 2010. Effect of flow field heterogeneity in coagulators on aggregate size and structure. AIChE J. 56, 2573–2587. doi:10.1002/aic.12179
Emery, A.N., Jan, D.C., Al-Rubeai, M., 1995. Oxygenation of intensive cell-culture system. Appl. Microbiol. Biotechnol. 43, 1028–33.
Eon-duval, A., Gleixner, R., Valax, P., Soos, M., Neunstoecklin, B., Morbidelli, M., Broly, H., 2014. Quality by Design Applied to a Fc-fusion Protein: A Case Study, in: Chamow, S.M., Ryll, T., Lowman, H.B., Farson, D. (Eds.), Therapeutic Fc-Fusion Proteins. Wiley-VCH, Weinheim.
Eon-duval, A., Valax, P., Solacroup, T., Broly, H., Gleixner, R., Strat, C.L.E., Sutter, J., 2012. Application of the quality by design approach to the drug substance manufacturing process of an Fc fusion protein: towards a global multi-step design space. J. Pharm. Sci. 101, 3604–18. doi:10.1002/jps.23273
Garcia-Briones, M. a., Brodkey, R.S., Chalmers, J.J., 1994. Computer simulations of the rupture of a gas bubble at a gas—liquid interface and its implications in animal cell damage. Chem. Eng. Sci. 49, 2301–2320. doi:10.1016/0009-2509(94)E0038-R
Gigout, A., Buschmann, M.D., Jolicoeur, M., 2008. The fate of Pluronic F-68 in chondrocytes and CHO cells. Biotechnol. Bioeng. 100, 975–87. doi:10.1002/bit.21840
Glacken, M.W., Fleischaker, R.J., Sinskey, A.J., 1983. Mammalian cell culture: engineering principles and scale-up. Trends Biotechnol. 1, 102–108. doi:10.1016/0167-7799(83)90032-X
Godoy-Silva, R., Chalmers, J.J., Casnocha, S., Bass, L. a, Ma, N., 2009a. Physiological responses of CHO cells to repetitive hydrodynamic stress. Biotechnol. Bioeng. 103, 1103–17. doi:10.1002/bit.22339

Bibliography
120
Godoy-Silva, R., Mollet, M., Chalmers, J.J., 2009b. Evaluation of the effect of chronic hydrodynamical stresses on cultures of suspensed CHO-6E6 cells. Biotechnol. Bioeng. 102, 1119–30. doi:10.1002/bit.22146
Goudar, C.T., Matanguihan, R., Long, E., Cruz, C., Zhang, C., Piret, J.M., Konstantinov, K.B., 2007. Decreased pCO(2) accumulation by eliminating bicarbonate addition to high cell-density cultures. Biotechnol. Bioeng. 96, 1107–17. doi:10.1002/bit.21116
Gray, D.R., Chen, S., Howarth, W., Inlow, D., Maiorella, B.L., 1996. CO2 in large-scale and high-density CHO cell perfusion culture. Cytotechnology 22, 65–78. doi:10.1007/BF00353925
Handa-Corrigan, A., Emery, A.N., Spier, R.E., 1989. Effect of gas—liquid interfaces on the growth of suspended mammalian cells: mechanisms of cell damage by bubbles. Enzyme Microb. Technol. 11, 230–235. doi:10.1016/0141-0229(89)90097-5
Harshe, Y.M., Lattuada, M., Soos, M., 2011. Experimental and modeling study of breakage and restructuring of open and dense colloidal aggregates. Langmuir 27, 5739–52. doi:10.1021/la1046589
Heath, C., Kiss, R., 2007. Cell culture process development: advances in process engineering. Biotechnol. Prog. 23, 46–51. doi:10.1021/bp060344e
Heidemann, R., Lütkemeyer, D., Büntemeyer, H., Lehmann, J., 1998. Effects of dissolved oxygen levels and the role of extra- and intracellular amino acid concentrations upon the metabolism of mammalian cell lines during batch and continuous cultures. Cytotechnology 26, 185–197. doi:10.1023/A:1007917409455
Hewitt, C.J., Nebe-Von Caron, G., Axelsson, B., McFarlane, C.M., Nienow, A.W., 2000. Studies related to the scale-up of high-cell-density E. coli fed-batch fermentations using multiparameter flow cytometry: effect of a changing microenvironment with respect to glucose and dissolved oxygen concentration. Biotechnol. Bioeng. 70, 381–90.
Hinze, J.O., 1955. Fundamentals of the hydrodynamic mechanism of splitting in dispersion processes. AIChE J. 1, 289–295. doi:10.1002/aic.690010303
Hossler, P., Khattak, S.F., Li, Z.J., 2009. Optimal and consistent protein glycosylation in mammalian cell culture. Glycobiology 19, 936–49. doi:10.1093/glycob/cwp079
Hu, W., Berdugo, C., Chalmers, J.J., 2011. The potential of hydrodynamic damage to animal cells of industrial relevance: current understanding. Cytotechnology 63, 445–60. doi:10.1007/s10616-011-9368-3
Hua, J., Erickson, L.E., Yiin, T.Y., Glasgow, L. a, 1993. A review of the effects of shear and interfacial phenomena on cell viability. Crit. Rev. Biotechnol. 13, 305–28. doi:10.3109/07388559309075700
Hudcova, V., Machon, V., Nienow, A.W., 1989. Gas-liquid dispersion with dual Rushton turbine impellers. Biotechnol. Bioeng. 34, 617–28. doi:10.1002/bit.260340506
Bibliography
121
Humphrey, A., 1998. Shake Flask to Fermentor: What Have We Learned? Biotechnol. Prog. 14, 3–7. doi:10.1021/bp970130k
Jan, D.C., Petch, D. a, Huzel, N., Butler, M., 1997. The effect of dissolved oxygen on the metabolic profile of a murine hybridoma grown in serum-free medium in continuous culture. Biotechnol. Bioeng. 54, 153–64. doi:10.1002/(SICI)1097-0290(19970420)54:2<153::AID-BIT7>3.0.CO;2-K
Jöbses, I., Martens, D., Tramper, J., 1991. Lethal events during gas sparging in animal cell culture. Biotechnol. Bioeng. 37, 484–90. doi:10.1002/bit.260370510
Jordan, M., Eppenberger, H.M., Sucker, H., Widmer, F., Einsele, A., 1994. Interactions between animal cells and gas bubbles: The influence of serum and pluronic F68 on the physical properties of the bubble surface. Biotechnol. Bioeng. 43, 446–54. doi:10.1002/bit.260430603
Jordan, M., Voisard, D., Berthoud, A., Tercier, L., Kleuser, B., Baer, G., Broly, H., 2013. Cell culture medium improvement by rigorous shuffling of components using media blending. Cytotechnology 65, 31–40. doi:10.1007/s10616-012-9462-1
Ju, L.-K., Chase, G.G., 1992. Improved scale-up strategies of bioreactors. Bioprocess Eng. 8, 49–53. doi:10.1007/BF00369263
Keane, J.T., Ryan, D., Gray, P.P., 2003. Effect of shear stress on expression of a recombinant protein by Chinese hamster ovary cells. Biotechnol. Bioeng. 81, 211–20. doi:10.1002/bit.10472
Khang, S.J., Levenspiel, O., 1976. New scale-up and design method for stirrer agitated batch mixing vessels. Chem. Eng. Sci. 31, 569–577. doi:10.1016/0009-2509(76)80020-6
Kilburn, D.G., Webb, F.C., 1968. The cultivation of animal cells at controlled dissolved oxygen partial pressure. Biotechnol. Bioeng. 10, 801–814.
Kim, J.Y., Kim, Y.-G., Lee, G.M., 2012. CHO cells in biotechnology for production of recombinant proteins: current state and further potential. Appl. Microbiol. Biotechnol. 93, 917–30. doi:10.1007/s00253-011-3758-5
Kimura, R., Miller, W.M., 1996. Effects of elevated pCO2 and/or osmolality on the growth and recombinant tPA production of CHO cells. Biotechnol. Bioeng. 52, 152–160. doi:10.1002/(SICI)1097-0290(19961005)52:1<152::AID-BIT15>3.3.CO;2-I
Köhler, G., Milstein, C., 1975. Continuous cultures of fused cells secreting antibody of predefined specificity. Nature 256, 495–497. doi:10.1038/256495a0
Kunas, K.T., Papoutsakis, E.T., 1990. Damage mechanisms of suspended animal cells in agitated bioreactors with and without bubble entrainment. Biotechnol. Bioeng. 36, 476–83. doi:10.1002/bit.260360507
Kusters, K.A., 1991. The influence of turbulence on aggregation of small particles in agitated vessels.

Bibliography
122
Lakhotia, S., Bauer, K.D., Papoutsakis, E.T., 1992. Damaging agitation intensities increase DNA synthesis rate and alter cell-cycle phase distributions of CHO cells. Biotechnol. Bioeng. 40, 978–90. doi:10.1002/bit.260400814
Lara, A.R., Galindo, E., Ramírez, O.T., Palomares, L.A., 2006. Living with heterogeneities in bioreactors: understanding the effects of environmental gradients on cells. Mol. Biotechnol. 34, 355–81. doi:10.1385/MB:34:3:355
Le, H., Kabbur, S., Pollastrini, L., Sun, Z., Mills, K., Johnson, K., Karypis, G., Hu, W.-S., 2012. Multivariate analysis of cell culture bioprocess data--lactate consumption as process indicator. J. Biotechnol. 162, 210–23. doi:10.1016/j.jbiotec.2012.08.021
Leist, C., Meyer, H.-P., Fiechter, A., 1986. Process control during the suspension culture of a human melanoma cell line in a mechanically stirred loop bioreactor. J. Biotechnol. 4, 235–246. doi:10.1016/0168-1656(86)90028-3
Levine, H.L., Lilja, J.E., Stock, R., Hummel, H., Jones, S.D., 2012. Efficient, Flexible Facilities for the 21st Century, in: Bioprocess International. pp. 20–30.
Li, F., Hashimura, Y., Pendleton, R., Harms, J., Collins, E., Lee, B., 2006. A systematic approach for scale-down model development and characterization of commercial cell culture processes. Biotechnol. Prog. 22, 696–703. doi:10.1021/bp0504041
Li, F., Vijayasankaran, N., Shen, A. (Yijuan), Kiss, R., Amanullah, A., 2010. Cell culture processes for monoclonal antibody production. MAbs 2, 466–479. doi:10.4161/mabs.2.5.12720
Li, J., Wong, C.L., Vijayasankaran, N., Hudson, T., Amanullah, A., 2012. Feeding lactate for CHO cell culture processes: impact on culture metabolism and performance. Biotechnol. Bioeng. 109, 1173–86. doi:10.1002/bit.24389
Liu, Y., Hu, W., Wiltberger, K., Ryll, T., Li, F., 2013. Effects of bubble-liquid two-phase turbulent hydrodynamics on cell damage in sparged bioreactor. Biotechnol. Prog. doi:10.1002/btpr.1790
Looby, M., Ibarra, N., Pierce, J.J., Buckley, K., O’Donovan, E., Heenan, M., Moran, E., Farid, S.S., Baganz, F., 2011. Application of quality by design principles to the development and technology transfer of a major process improvement for the manufacture of a recombinant protein. Biotechnol. Prog. 27, 1718–29. doi:10.1002/btpr.672
Ma, N., Chalmers, J.J., Auniņs, J.G., Zhou, W., Xie, L., 2004. Quantitative studies of cell-bubble interactions and cell damage at different pluronic F-68 and cell concentrations. Biotechnol. Prog. 20, 1183–91. doi:10.1021/bp0342405
Ma, N., Koelling, K.W., Chalmers, J.J., 2002. Fabrication and Use of a Transient Contractional Flow Device to Quantify the Sensitivity of Mammalian and Insect Cells to Hydrodynamic Forces. Biotechnol. Bioeng. 80, 428–37. doi:10.1002/bit.10611

Bibliography
123
Manfredini, R., Cavallera, V., Marini, L., Donati, G., 1983. Mixing and oxygen transfer in conventional stirred fermentors. Biotechnol. Bioeng. 25, 3115–31. doi:10.1002/bit.260251224
Marks, D.M., 2003. Equipment design considerations for large scale cell culture. Cytotechnology 42, 21–33. doi:10.1023/A:1026103405618
Meier, S.J., Hatton, T. a, Wang, D.I., 1999. Cell death from bursting bubbles: role of cell attachment to rising bubbles in sparged reactors. Biotechnol. Bioeng. 62, 468–78.
Meilhoc, E., Wittrup, K.D., Bailey, J.E., 1990. Influence of dissolved oxygen concentration on growth, mitochondrial function and antibody production of hybridoma cells in batch culture. Bioprocess Eng. 5, 263–274. doi:10.1007/BF00369376
Michaels, J.D., Mallik, A.K., Papoutsakis, E.T., 1996. Sparging and agitation-induced injury of cultured animals cells: Do cell-to-bubble interactions in the bulk liquid injure cells? Biotechnol. Bioeng. 51, 399–409. doi:10.1002/(SICI)1097-0290(19960820)51:4<399::AID-BIT3>3.0.CO;2-D
Mollet, M., Godoy-Silva, R., Berdugo, C., Chalmers, J.J., 2007. Acute hydrodynamic forces and apoptosis: a complex question. Biotechnol. Bioeng. 98, 772–88. doi:10.1002/bit.21476
Mollet, M., Ma, N., Zhao, Y., Brodkey, R., Taticek, R., Chalmers, J.J., 2004. Bioprocess equipment: characterization of energy dissipation rate and its potential to damage cells. Biotechnol. Prog. 20, 1437–48. doi:10.1021/bp0498488
Mostafa, S.S., Gu, X., 2003. Strategies for improved dCO2 removal in large-scale fed-batch cultures. Biotechnol. Prog. 19, 45–51. doi:10.1021/bp0256263
Moussa, A.S., Soos, M., Sefcik, J., Morbidelli, M., 2007. Effect of solid volume fraction on aggregation and breakage in colloidal suspensions in batch and continuous stirred tanks. Langmuir 23, 1664–1673. doi:10.1021/la062138m
Murhammer, D.W., Goochee, C.F., 1990. Sparged animal cell bioreactors: mechanism of cell damage and Pluronic F-68 protection. Biotechnol. Prog. 6, 391–7. doi:10.1021/bp00005a012
Murhammer, D.W., Pfalzgraf, E.C., 1992. Effects of pluronic F-68 on oxygen transport in an agitated, sparged bioreactor. Biotechnol. Tech. 6, 199–202. doi:10.1007/BF02439343
Neunstoecklin, B., Stettler, M., Solacroup, T., Broly, H., Morbidelli, M., Soos, M., 2014a. Determination of the maximum operating range of hydrodynamic stress in mammalian cell culture. Submitt. to J. Biotechnol.
Neunstoecklin, B., Villiger, T.K., Lucas, E., Stettler, M., Broly, H., Morbidelli, M., Soos, M., 2014b. Pilot scale verification of an oscillating hydrodynamic stress model used for mammalian cell culture. prep. Biotechnol. Prog.

Bibliography
124
Nienow, A.W., 1997. On impeller circulation and mixing effectiveness in the turbulent flow regime. Chem. Eng. Sci. 52, 2557–2565. doi:10.1016/S0009-2509(97)00072-9
Nienow, A.W., 1998. Hydrodynamics of Stirred Bioreactors. Appl. Mech. Rev. 51, 3–32. doi:10.1115/1.3098990
Nienow, A.W., 2006. Reactor engineering in large scale animal cell culture. Cytotechnology 50, 9–33. doi:10.1007/s10616-006-9005-8
Nienow, A.W., 2009. Scale-Up Considerations Based on Studies at the Bench Scale in Stirred Bioreactors. J. Chem. Eng. JAPAN 42, 789–796. doi:10.1252/jcej.08we317
Nienow, A.W., Scott, W.H., Hewitt, C.J., Thomas, C.R., Lewis, G., Amanullah, A., Kiss, R., Meier, S.J., 2013. Scale-down studies for assessing the impact of different stress parameters on growth and product quality during animal cell culture. Chem. Eng. Res. Des. 1–10. doi:10.1016/j.cherd.2013.04.002
Oh, S.K.W., Nienow, A.W., Al-Rubeai, M., Emery, A.N., 1989. The effects of agitation intensity with and without continuous sparging on the growth and antibody production of hybridoma cells. J. Biotechnol. 12, 45–61. doi:10.1016/0168-1656(89)90128-4
Oh, S.K.W., Nienow, A.W., Al-Rubeai, M., Emery, A.N., 1992. Further studies of the culture of mouse hybridomas in an agitated bioreactor with and without continuous sparging. J. Biotechnol. 22, 245–70.
Oosterhuis, N.M., Kossen, N.W., 1984. Dissolved oxygen concentration profiles in a production-scale bioreactor. Biotechnol. Bioeng. 26, 546–50. doi:10.1002/bit.260260522
Osman, J.J., Birch, J., Varley, J., 2002. The response of GS-NS0 myeloma cells to single and multiple pH perturbations. Biotechnol. Bioeng. 79, 398–407. doi:10.1002/bit.10198
Ozturk, S.S., 1996. Engineering challenges in high density cell culture systems. Cytotechnology 22, 3–16. doi:10.1007/BF00353919
Ozturk, S.S., Palsson, B.O., 1990. Effects of dissolved oxygen on hybridoma cell growth, metabolism, and antibody production kinetics in continuous culture. Biotechnol. Prog. 6, 437–46. doi:10.1021/bp00006a006
Ozturk, S.S., Palsson, B.O., 1991. Growth, metabolic, and antibody production kinetics of hybridoma cell culture: 2. Effects of serum concentration, dissolved oxygen concentration, and medium pH in a batch reactor. Biotechnol. Prog. 7, 481–94. doi:10.1021/bp00012a002
Palomares, L.A., Lara, A.R., Octavio T. Ramirez, 2010. Bioreactor Scale-Down, in: Flickinger, M.C. (Ed.), Encyclopedia of Industrial Biotechnology: Bioprocess, Bioseparation, and Cell Technology. John Wiley & Sons, Inc., pp. 1–13.
Papac, D.I., Briggs, J.B., Chin, E.T., Jones, A.J., 1998. A high-throughput microscale method to release N-linked oligosaccharides from glycoproteins for matrix-assisted laser

Bibliography
125
desorption/ionization time-of-flight mass spectrometric analysis. Glycobiology 8, 445–54.
Perry, R.H., Green, D.W., Maloney, J.O., 1997. Perry’s Chemical Engineers' Handbook, 7th ed. ed. McGraw-Hill.
Peter, C.P., Suzuki, Y., Büchs, J., 2006. Hydromechanical stress in shake flasks: correlation for the maximum local energy dissipation rate. Biotechnol. Bioeng. 93, 1164–1176.
Pope, S.B., 2000. Turbulent Flows. Cambridge University Press.
Rapp, E., Hennig, R., Borowiak, M., Kottler, R., Reichl, U., 2011. High-throughput glycosylation pattern analysis of glycoproteins utilizing a multiplexing capillary-DNA-sequencer. Glycoconj. J. 28, 234–235.
Rathore, A.S., 2009. Roadmap for implementation of quality by design (QbD) for biotechnology products. Trends Biotechnol. 27, 546–53. doi:10.1016/j.tibtech.2009.06.006
Renner, W.A., Jordan, M., Eppenberger, H.M., Leist, C., 1993. Cell-cell adhesion and aggregation: Influence on the growth behavior of CHO cells. Biotechnol. Bioeng. 41, 188–93. doi:10.1002/bit.260410204
Restelli, V., Wang, M.D., Huzel, N., Ethier, M., Perreault, H., Butler, M., 2006. The effect of dissolved oxygen on the production and the glycosylation profile of recombinant human erythropoietin produced from CHO cells. Biotechnol. Bioeng. 94, 481–94. doi:10.1002/bit.20875
Rhiel, M., Murhammer, D.W., 1995. The effect of oscillating dissolved oxygen concentrations on the metabolism of a Spodoptera frugiperda IPLB-Sf21-AE clonal isolate. Biotechnol. Bioeng. 47, 640–50. doi:10.1002/bit.260470605
Rouiller, Y., Périlleux, A., Collet, N., Jordan, M., Stettler, M., Broly, H., 2013. A high-throughput media design approach for high performance mammalian fed-batch cultures. MAbs 5, 501–511. doi:10.4161/mabs.23942
Rouiller, Y., Solacroup, T., Deparis, V., Barbafieri, M., Gleixner, R., Broly, H., Eon-Duval, A., 2012. Application of Quality by Design to the characterization of the cell culture process of an Fc-Fusion protein. Eur. J. Pharm. Biopharm. 81, 426–37. doi:10.1016/j.ejpb.2012.02.018
Sajjadi, S., Yianneskis, M., 2003. Semibatch Emulsion Polymerization of Methyl Methacrylate with a Neat Monomer Feed. Polym. React. Eng. 11, 715–736. doi:10.1081/PRE-120026371
Sánchez Pérez, J. a., Rodríguez Porcel, E.M., Casas López, J.L., Fernández Sevilla, J.M., Chisti, Y., 2006. Shear rate in stirred tank and bubble column bioreactors. Chem. Eng. J. 124, 1–5. doi:10.1016/j.cej.2006.07.002

Bibliography
126
Schmidt, F.R., 2005. Optimization and scale up of industrial fermentation processes. Appl. Microbiol. Biotechnol. 68, 425–35. doi:10.1007/s00253-005-0003-0
Schneider, C.K., Kalinke, U., Löwer, J., 2006. TGN1412--a regulator’s perspective. Nat. Biotechnol. 24, 493–6. doi:10.1038/nbt0506-493
Scott, W.H., Thomas, C.R., Hewitt, C.J., Lewis, G., Meier, S.J., Amanullah, A., Kiss, R., Nienow, A.W., 2012. Scale-down studies for assessing the impact of different stress parameters on growth and product quality during mammalian cell culture, in: 14th European Conference on Mixing. Warszawa, pp. 431–436.
Seely, R.J., Seely, J.E., 2003. A Rational, Step-Wise Approach to Process Characterization. Biopharm Intrenational 16, 24–35.
Senger, R.S., Karim, M.N., 2003. Effect of shear stress on intrinsic CHO culture state and glycosylation of recombinant tissue-type plasminogen activator protein. Biotechnol. Prog. 19, 1199–209. doi:10.1021/bp025715f
Serrato, J.A., Palomares, L. a, Meneses-Acosta, A., Ramírez, O.T., 2004. Heterogeneous conditions in dissolved oxygen affect N-glycosylation but not productivity of a monoclonal antibody in hybridoma cultures. Biotechnol. Bioeng. 88, 176–88. doi:10.1002/bit.20232
Shaw, J.A., 1994. Understand the effects of impeller type, diameter, and power on mixing time. Chem. Eng. Prog. 90, 45–48.
Shi, Y., Ryu, D.D., Park, S.H., 1993. Monoclonal antibody productivity and the metabolic pattern of perfusion cultures under varying oxygen tensions. Biotechnol. Bioeng. 42, 430–9. doi:10.1002/bit.260420405
Shukla, A. a, Gupta, P., Han, X., 2007. Protein aggregation kinetics during Protein A chromatography. Case study for an Fc fusion protein. J. Chromatogr. A 1171, 22–8. doi:10.1016/j.chroma.2007.09.040
Sieblist, C., Hägeholz, O., Aehle, M., Jenzsch, M., Pohlscheidt, M., Lübbert, A., 2011a. Insights into large-scale cell-culture reactors: II. Gas-phase mixing and CO2 stripping. Biotechnol. J. 6, 1547–56. doi:10.1002/biot.201100153
Sieblist, C., Jenzsch, M., Pohlscheidt, M., 2013. Influence of pluronic(®) F68 on oxygen mass transfer. Biotechnol. Prog. 29, 1278–88. doi:10.1021/btpr.1770
Sieblist, C., Jenzsch, M., Pohlscheidt, M., Lübbert, A., 2011b. Insights into large-scale cell-culture reactors: I. Liquid mixing and oxygen supply. Biotechnol. J. 6, 1532–46. doi:10.1002/biot.201000408
Sieck, J.B., Budach, W.E., Suemeghy, Z., Leist, C., Villiger, T.K., Morbidelli, M., Soos, M., 2014. Adaptation for survival: Phenotype and transcriptome response of CHO cells to elevated stress induced by agitation and sparging. J. Biotechnol. 189C, 94–103. doi:10.1016/j.jbiotec.2014.08.042
Bibliography
127
Sieck, J.B., Cordes, T., Budach, W.E., Rhiel, M.H., Suemeghy, Z., Leist, C., Villiger, T.K., Morbidelli, M., Soos, M., 2013. Development of a Scale-Down Model of hydrodynamic stress to study the performance of an industrial CHO cell line under simulated production scale bioreactor conditions. J. Biotechnol. 164, 41–9. doi:10.1016/j.jbiotec.2012.11.012
Soos, M., Ehrl, L., Bäbler, M.U., Morbidelli, M., 2010. Aggregate breakup in a contracting nozzle. Langmuir 26, 10–8. doi:10.1021/la903982n
Soos, M., Kaufmann, R., Winteler, R., Kroupa, M., Lüthi, B., 2013. Determination of maximum turbulent energy dissipation rate generated by a rushton impeller through large eddy simulation. AIChE J. 59, 3642–3658. doi:10.1002/aic.14206
Soos, M., Moussa, A.S., Ehrl, L., Sefcik, J., Wu, H., Morbidelli, M., 2008. Effect of shear rate on aggregate size and morphology investigated under turbulent conditions in stirred tank. J. Colloid Interface Sci. 319, 577–89. doi:10.1016/j.jcis.2007.12.005
Steel, R., Maxon, W.D., 1966. Dissolved oxygen measurements in pilot- and production-scale novobiocin fermentations. Biotechnol. Bioeng. 8, 97–108. doi:10.1002/bit.260080109
Stettler, M., Zhang, X., Hacker, D.L., De Jesus, M., Wurm, F.M., 2007. Novel orbital shake bioreactors for transient production of CHO derived IgGs. Biotechnol. Prog. 23, 1340–6. doi:10.1021/bp070219i
Tanzeglock, T., Soos, M., Stephanopoulos, G., Morbidelli, M., 2009. Induction of mammalian cell death by simple shear and extensional flows. Biotechnol. Bioeng. 104, 360–70. doi:10.1002/bit.22405
Trinh, K., Garcia-Briones, M., Chalmers, J.J., Hink, F., 1994. Quantification of damage to suspended insect cells as a result of bubble rupture. Biotechnol. Bioeng. 43, 37–45. doi:10.1002/bit.260430106
Tsang, V.L., Wang, A.X., Yusuf-Makagiansar, H., Ryll, T., 2013. Development of a scale down cell culture model using multivariate analysis as a qualification tool. Biotechnol. Prog. doi:10.1002/btpr.1819
US Food and Drug Administration, 2009. Guidance for Industry, Q8(R2) Pharmaceutical Development.
Varley, J., Birch, J., 1999. Reactor design for large scale suspension animal cell culture. Cytotechnology 29, 177–205. doi:10.1023/A:1008008021481
Villiger, T.K., Morbidelli, M., Soos, M., 2014. Experimental Determination of Maximum Hydrodynamic Stress in Multiphase Flow Using a Shear Sensitive Particulate System. Submitt. to AIChE J.
Villiger, T.K., Soos, M., Morbidelli, M., 2012. Experimental Determination of Maximum Shear Stress in Multiphase Flow – From Micro Scale to Pilot Scale Reactors, in: AIChE 2012 Annual Meeting. p. 107g.
Bibliography
128
Walsh, G., 2010. Biopharmaceutical benchmarks 2010. Nat. Biotechnol. 28, 917–24. doi:10.1038/nbt0910-917
Willoughby, N., 2006. Scaling up by thinking small: a perspective on the use of scale-down techniques in process design. J. Chem. Technol. Biotechnol. 81, 1849–1851. doi:10.1002/jctb.1617
Wu, J., 1995. Mechanisms of animal cell damage associated with gas bubbles and cell protection by medium additives. J. Biotechnol. 43, 81–94.
Xing, Z., Li, Z., Chow, V., Lee, S.S., 2008. Identifying inhibitory threshold values of repressing metabolites in CHO cell culture using multivariate analysis methods. Biotechnol. Prog. 24, 675–83. doi:10.1021/bp070466m
Xing, Z.Z., Kenty, B.M.N., Li, Z.J., Lee, S.S., 2009. Scale-up analysis for a CHO cell culture process in large-scale bioreactors. Biotechnol. Bioeng. 103, 733–46. doi:10.1002/bit.22287
Yang, J., Lu, C., Stasny, B., Henley, J., Guinto, W., Gonzalez, C., Gleason, J., Fung, M., Collopy, B., Benjamino, M., Gangi, J., Hanson, M., Ille, E., 2007. Fed-batch bioreactor process scale-up from 3-L to 2,500-L scale for monoclonal antibody production from cell culture. Biotechnol. Bioeng. 98, 141–54. doi:10.1002/bit.21413
Zagari, F., Jordan, M., Stettler, M., Broly, H., Wurm, F.M., 2012. Lactate metabolism shift in CHO cell culture: the role of mitochondrial oxidative activity. N. Biotechnol. 00. doi:10.1016/j.nbt.2012.05.021
Zanghi, J. a, Schmelzer, a E., Mendoza, T.P., Knop, R.H., Miller, W.M., 1999. Bicarbonate concentration and osmolality are key determinants in the inhibition of CHO cell polysialylation under elevated pCO(2) or pH. Biotechnol. Bioeng. 65, 182–91.
Zhu, H., Nienow, A.W., Bujalski, W., Simmons, M.J.H., 2009. Mixing studies in a model aerated bioreactor equipped with an up- or a down-pumping “Elephant Ear” agitator: Power, hold-up and aerated flow field measurements. Chem. Eng. Res. Des. 87, 307–317. doi:10.1016/j.cherd.2008.08.013
Zhu, M.M., Goyal, A., Rank, D.L., Gupta, S.K., Vanden Boom, T., Lee, S.S., 2005. Effects of elevated pCO2 and osmolality on growth of CHO cells and production of antibody-fusion protein B1: a case study. Biotechnol. Prog. 21, 70–7. doi:10.1021/bp049815s
Zhu, Y., Cuenca, J. V, Zhou, W., Varma, A., 2008. NS0 cell damage by high gas velocity sparging in protein-free and cholesterol-free cultures. Biotechnol. Bioeng. 101, 751–60. doi:10.1002/bit.21950

Benjamin Neunstoecklin Greifenseestrasse 29 8050 Zurich, Switzerland +41 78 928 42 62
Curriculum vitae
Personal Data Benjamin Neunstoecklin Greifenseestrasse 29 8050 Zurich, Switzerland Date of birth: 31 May 1982 Nationality: German
Practical Experience May 09 – present Doctoral student at ETH Zurich in the group of Prof. M. Morbidelli in the field of Production of Recombinant Proteins, Zurich, Switzerland PhD project title: Development of criteria for scale-up and scale-down of bioreactors for cultivation of mammalian cells
Nov 09 – Apr 12 Doctoral student in collaboration with Merck Serono S.A., Biotech Process Sciences, Corsier-sur-Vevey, Switzerland
Jul 08 – Nov 08 Internship at the industrial life science company Lonza Biologics Inc., Portsmouth, NH, USA Operator in manufacturing department – Upstream Manufacturing Personal objective: Studying the functions and processes of large scale protein fermentation
Sep 07 – May 08 Diploma student at the German Cancer Research Center (DKFZ), Heidelberg, Germany Master’s thesis: Functional analysis of Defensin proteins and their influence on tumor growth German Grade: 1.0 (equivalent to A / GPA: 4.0)
May 06 Internship at the Institute of Human Genetics, Heidelberg, Germany Screening of the gene HTR3E in anorexia patients
Jan 06 Internship at the Institute of Zoology, Heidelberg, Germany Analysis of the structures and functions in signal molecules
May 05 Internship at the Institute of Human Genetics, Heidelberg, Germany Mutation analysis, chromosome preparation, functional analysis in Xenopus-Embryos
Education Sep 02 – Jun 08 Student of biology at the University of Heidelberg, Germany Major subject: Molecular biology Minor subjects: Cell biology and business administration Degree: Diploma in biology (equivalent to Master of science)
German Grade 1.6 (equivalent to B+ / GPA: 3.3) Sep 01 – Jun 02 Community service at Theresienkrankenhaus, Mannheim, Germany Nursing service in intensive care
Aug 92 – Jun 01 Werner Heisenberg Gymnasium, Weinheim, Germany (German High School equivalent) Major subjects: Biology and Math Degree: “Abitur” – general qualification for university entrance
German Grade 2.5 (equivalent to B- / GPA: 2.5)

Benjamin Neunstoecklin Greifenseestrasse 29 8050 Zurich, Switzerland +41 78 928 42 62
Skills Specialist in up- and downscaling of bioprocesses including bioreactor characterization and control
Cultivation of mammalian cells like CHO or human and mouse derived cell lines
Expert knowledge in different platform processes including various media compositions
Excellent knowledge of reactor control for batch, fed batch and continuous mammalian cell culture operations
Profound knowledge of analytical tools for the determination of product amount and product quality like aggregation, glycosylation or charged variants using ELISA, HPLC or CGE-LIF
Excellent knowledge of versatile bioprocess equipment (DASGIP, Infors, Sartorius, Nova, PreSens) and its interoperability with automated control software via OPC
Experience in large scale mammalian cell fermentation up to 20 000 liters
Tissue culture with cervical cancer cells (HeLa) and intestine cancer cells
PCR, DNA-Sequencing, DNA-Cloning
Gel electrophoresis with Agarose and Polyacrylamid
Blotting techniques (Northern-, Southern- and Western-Blotting)
Chromosome preparation, Micro-injection in Xenopus-Embryos
Language Skills German: native language English: fluent (speaking, reading, writing) French: conversational (speaking, reading)
IT Knowledge Excellent knowledge of MS Windows and all MS Office applications Good programming knowledge in Perl, VBA, MatLab, MySQL, JavaScript and HTML
Zurich, February 2nd, 2014 Benjamin Neunstoecklin

131
Publications
[1] B. Neunstoecklin, M. Stettler, T. Solacroup, H. Broly, M. Morbidelli, and M. Soos,
“Determination of the maximum operating range of hydrodynamic stress in mammalian cell
culture,” accepted by Journal of Biotechnology (2014)
[2] B. Neunstoecklin, T. K. Villiger, E. Lucas, M. Stettler, H. Broly, M. Morbidelli, and
M. Soos, “Pilot scale verification of an oscillating hydrodynamic stress model used for
mammalian cell culture,” in preparation (2014)
[3] B. Neunstoecklin, M. Lularevic, M. Stettler, H. Broly, M. Morbidelli, and M. Soos,
“Simulation of the large scale specific heterogeneous environment for mammalian cell
culture,” in preparation (2014)


133
Conference proceedings
Oral Presentations
Benjamin Neunstoecklin, Maximilian Lularevic, Massimo Morbidelli, Miroslav Soos (2013) "Effect of heterogeneous cultivation conditions on mammalian cell productivity and product quality" AIChE Annual Meeting, 2013, San Francisco, USA
Benjamin Neunstoecklin, Miroslav Soos, Massimo Morbidelli (2012) "Facing heterogeneities in bioprocesses, a downscale approach tailored to suit large scale conditions" AIChE Annual Meeting, 2012, Pittsburgh, USA
Benjamin Neunstoecklin, Miroslav Soos, Massimo Morbidelli (2012) "Characterizing heterogeneity of environmental conditions in various bioreactor scales used for cell cultivation" 15th European Congress on Biotechnology, 2012, Istanbul, Turkey
Poster Presentations
Benjamin Neunstoecklin, Thomas Villiger, Massimo Morbidelli, Miroslav Soos (2013) "A scale down approach focusing large scale heterogeneity" 23rd European Society for Animal Cell Technology Meeting, 2013, Lille, France
Benjamin Neunstoecklin, Miroslav Soos, Massimo Morbidelli (2012) "Facing heterogeneities in large scale bioprocesses" 15th European Congress on Biotechnology, 2012, Istanbul, Turkey
Benjamin Neunstoecklin, Matthieu Stettler, Miroslav Soos, Massimo Morbidelli (2010) "Heterogeneity in bioreactors - Why different conditions change performance" Merck Serono Biotech and Manufacturing Excellence Forum, 2010, Montreux, Swiss
Benjamin Neunstoecklin, Miroslav Soos, Massimo Morbidelli (2009) "Study on the mammalian cell behavior and metabolism in the presence of shear stress" 14th European Congress on Biotechnology, 2009, Barcelona, Spain
Awards
Winner of the ACTIP Fellowship Award 2013-2014