Rights / License: Research Collection In Copyright - …1995/eth... · Prof. Dr. Roland W. Scholz,...
177
Research Collection Doctoral Thesis Decision-processes concerning the management of ecosystem services for ecosystem-based adaptation to climate change Author(s): Vignola, Raffaele Publication Date: 2010 Permanent Link: https://doi.org/10.3929/ethz-a-006207064 Rights / License: In Copyright - Non-Commercial Use Permitted This page was generated automatically upon download from the ETH Zurich Research Collection . For more information please consult the Terms of use . ETH Library
Transcript of Rights / License: Research Collection In Copyright - …1995/eth... · Prof. Dr. Roland W. Scholz,...

Research Collection
Doctoral Thesis
Decision-processes concerning the management of ecosystemservices for ecosystem-based adaptation to climate change
Author(s): Vignola, Raffaele
Publication Date: 2010
Permanent Link: https://doi.org/10.3929/ethz-a-006207064
Rights / License: In Copyright - Non-Commercial Use Permitted
This page was generated automatically upon download from the ETH Zurich Research Collection. For moreinformation please consult the Terms of use.
ETH Library

DISS.ETHNO.19154
DECISION‐PROCESSESCONCERNINGTHEMANAGEMENTOFECOSYSTEM
SERVICESFORECOSYSTEM‐BASEDADAPTATIONTOCLIMATECHANGE
Adissertationsubmittedtothe
ETHZURICH
forthedegreeof
DoctorofSciences
presentedby
RAFFAELEVIGNOLA
Agr.Eng.,UniversityofFlorence,Italy
bornFebruary4th,1969
CitizenofItaly
acceptedontherecommendationof
Prof.Dr.RolandW.Scholz,examiner
Prof.Dr.ThomasKöllner,co‐examiner
Prof.Dr.TimL.McDaniels,co‐examiner
2010


1
Summary
An increasing production of scientific literature addresses the past, current and future
importanceofecosystemsfortheprovisionofgoodsandservicestosociety.However,pressure
fromclimatechange,nationalpoliciesandglobalizationare increasinglydegradingthiscapacity
of ecosystems. Typically, the design of societal responses to ecosystem services degradation
requires considering the decision‐making ofmultiple actors from the local scalewhere ES are
providedtoregional,nationalandinternationalscaleswheredecisionsonrulesandresourcesare
defined and distributed. This is the case of SRS degradation which requires consideration of
decision processes also considering the on‐ and off‐site benefits of SRS. Indeed, soil erosion
affects upstream land users and downstream user as hydropower dam due to siltation.
Moreover, inawatershed,theseactorsdirectlybenefitingfromandmakingdecisionsregarding
SRSareembeddedindecisionprocesseshappeningatscalesthatgobeyondthewatershedand
beyondthedirectuseofSRSservices(e.g.,decisionstodesigntechnicalsolutionstosoilerosion,
decisionontheprovisionofincentivesandtheirtypes,etc.).
Thegoalofthethesisistoanalysethemulti‐hierarchyhumandecisionprocessescharacterizing
SRSprovisionconsideringthehumanandenvironmentsystemastwodifferent,complementary
andinterrelatedsystems.InthisthesisIanalysethecasestudyofSoilRegulationServices(SRS)in
theBirriswatershedCostaRica,acountrypioneerinpoliciestoprotectecosystemservices.The
Birris watershed is a relatively small territorywith an area of 5800 has. It is characterized by
intensiveandmarket‐orientedagriculturalproductionactivitieswithhighfragmentedfarmareas
andsteepslopes.Soilerosionhasbeenincreasingsinceseveraldecadesduetoinadequateland
use practices and increasing extreme precipitation events whose intensity and frequency is
expectedtogrowunderclimatechange.TheBirriswatershedrepresentsalearningcaseformany
nationalandregionalactorsduetoitscommonalitywithotherwatershedsintheregion.
Thefirstoffourarticlesofthisthesisanalyzestheenvironmentaldimensionfocussingtheroleof
forest ecosystem cover on hydrological responses. In the following three papers I address the
human dimension focusing on decision processes occurring at different scales: i) from the
individualfarmersdecision‐makingonsoilconservation;ii)tothewatershedscalewhereactors
aredirectlyaffectedbyon‐siteandoff‐siteprovisionofSRS;and,finally,iii)tothenationalcross‐
scale information‐sharing network of multiple actors involved directly or indirectly (scientists,

2
regulators, farmers’ associations, users of SRS, etc.) in themanagement ofwatersheds and of
SRS.
More specifically, the goal of the first paper is to synthesize the findings of several paired‐
catchmentexperimentsfromAfrica,AsiaandLatinAmericathatanalyzetheeffectofforestcover
changeonhydrologicalresponses.Weusemeta‐analysisasatoolused inecologicalstudiesto
synthesize results from different studies. This help us overcoming the small “n” problem
associated to many of these types of forest hydrology studies in watersheds especially in
developingworld.
The second paper addresses the complexity of farmers’ decision‐making in respect to soil
conservation decisions. This is analyzed through amulti‐dimensional decisionmodel including
economic cognitive and territorial variables influencing farmers’ decision‐making regarding soil
conservationefforts.Thestructuredsurveyincludeditemsbuiltthroughpreviousmeetingswith
farmerstocapturetheirperspectivesandunderstandingonsoilerosionanditssolutions.
The goal of the third paper is to analyze aspects that are relevant to build a collaborative
mechanismamongusersofon‐siteandoff‐siteprovisionofSRS.Specificmethodsfromdecision
scienceandnegotiationanalysisareappliedimplyingconsultationswithbothusersandproviders
ofSRS.Inseparatemeetings,consultationsallowedstructuringtheirfundamentalobjectivesand
identifyingkeyaspectsofcomposingadesiredmechanismsuchas: i)howtoselect farmers; ii)
what typeof contract should beused; iii)whoshould intermediateand, finally, iii) the typeof
possible incentives for farmers’soilconservation. Inorderto identifynegotiationspaceforkey
aspects of a mechanism, preferences of both stakeholders in respect to different alternative
aspectsofamechanismwereelicitedintwoseparatefocusgroups.
Thegoalofthefourthpaperistoidentifycross‐scaleinstitutionalmismatchesarisingfromformal
policiesandmandatesandconstrainingSRSprovisionanduse.Weuse“betweenesscentrality”
algorithm (common to social network science) to test how structural analysis of information‐
exchange network can identify boundary organizations which are potentially strategic to
overcomecross‐scaleinstitutionalmismatches.Weanalyseactors’officialmandatescontributing
directlyorindirectlytoSRSprovisionandtheirinteractionininformation‐sharingnetwork.
The analysis of the environmental dimension proves the usefulness and methodological
limitations of using meta‐analyses to synthesize findings from paired‐catchments experiments

3
studiesonthehydrologicaleffectsofchangesinnaturalandplantedforestscover.Overallresults
from experiments from Asia, Africa and Latin America show that forest cover can play an
importantroleindiminishingthebaseflowinwatershedbutitseffectonstorm‐flowcontrol(i.e.
water runoff causing erosion) depends more on local characteristics. Some methodological
limitationsfromthisuseofquantitativemeta‐analysiscanalsobeoutlined.Wefoundarelatively
smallnumberofpaired‐catchmentexperimentstudies fromAsia,AfricaandLatinAmericathus
limiting the capacity to analyze the interacting effect of important factors for water flow
regulation,suchassoil,geology,topography,orlandmanagementpractices.Asforthecapacity
of forests to control storm flows (related to increase in erosion) data found in the scientific
articlesusedinthemeta‐analysisdidnotallowaccountingfortheeffectsoffrequentandintense
extremeprecipitationevents.ThisalsolimitsthecapacitytocomparetheprovisionofSRSunder
climate change from natural forest ecosystem vs non‐forest land uses such as conservation
agriculture.
Atthelocalscale,farmers’awarenessoftheirexposureleveltosoilerosioncombineswithother
variables to determine their level of soil conservation efforts. The decision model includes
socioeconomic,territorialandcognitivevariablessuchasbeliefs,valuesandriskperceptionand
clearlyseparatesthreegroupsoffarmersbasedontheirsoilconservationefforts.Mostfarmers
areawareoftheriskoferosionalthoughsocioeconomicaspectssuchastypeofproductionand
farm size indicate that perceived opportunity cost given the farm production context might
hinder their conservation efforts. Farmers with low perception of erosion risk might also be
expressing “availability heuristic” paradigm due to their daily experience with erosion in the
watershed.
Atthewatershedscale,thedesignofcollaborativeeffortsfortheon‐andoff‐siteprovisionofSRS
requiresagreementonthefundamentalobjectivesofamechanismforcollaborativeefforts for
soilconservation.Consultedfarmersandhydropoweragreeontheimportanceofthepromotion
of learning through technical assistance andmonitoring of soil conservation programs and the
fairdistributionofincentives.Directpaymentforsoilconservationisonlylimitedlyconsideredas
a desired incentive alternative. Consistent with the fundamental goal of promoting learning,
technicalassistanceisseenasamoredesirablealternativethandirectpayments.

4
The national cross‐scale analysis of governance structure for SRS highlights that important
regulatorymismatches affect the definition of societal responses at the local level (i.e. where
directactionstopromoteadequateprovisionanduseofEShappen).Networkanalysishelpsus
identifying the information‐bridging characteristics of actors in informal information‐sharing
networks.Thisanalysisoutlinestheboundaryroleofthewatershedagricultural‐extensionoffice
helpingdiffusinginformationonimpactsaswellassocialandtechnicalfeasibilityofresponsesto
SRSdegradationacross‐scalesandpolicyareas.
Overall the thesis’ results show that soil conservation policies to support the provision of SRS
wouldbenefitfromtheuseofmixedpolicies.Thismightincludeprogramstoraiseawarenesson
currentand future soil erosion risks,promote learningamong farmers, and institutionalize the
boundary role of agricultural extension offices for their importance to promote learning and
adaptivemanagementofSRS.Thisisespeciallyvaluableinthecontextofareashighlyexposedto
increasingfrequencyofextremeprecipitationeventssuchasCentralAmerica.Moreover,inthe
faceofhighuncertaintiesandscarcityofdata(e.g.ontheimpactsoflanduse/managementand
climate change),mechanisms to update and disseminate information over timeon impacts on
soil erosion and correspondent solutions are required. In this respect, strengthening the
boundaryroleofagricultural‐extensionofficecanpotentiallyhelpupdatinginformationavailable
toscientists, regulatorsandfarmerson impactsandsocialandtechnical feasibilityofsolutions.
Thismightproveastrategytoaddresssomeoftheregulatorymismatchesthathinderresponses
toSRSdegradationatlocallevelandpromoteadaptivemanagementofsoilregulationservices.

5

6
Zusammenfassung
DiewissenschaftlicheLiteraturbefasstsichzunehmendmitdervergangenen,gegenwärtigenund
zukünftigen Bedeutung von Ökosystemen bei der Bereitstellung von für die Gesellschaft
essentiellen Gütern und Dienstleistungen. Diese Leistung von Ökosystemen ist jedoch
zunehmend gefährdet durch Klimawandel, nationale Politik und Globalisierung. Für die
Gestaltung von gesellschaftlichen Massnahmen gegen die Degradierung von
Ökosystemdienstleistungen müssen die Entscheidungsprozesse verschiedener Akteure
berücksichtigt werden: von der lokalen Ebene, auf der Ökosystemdienstleistungen geleistet
werden, über die regionale, nationale und internationale Ebene, auf der Entscheidungen über
Regeln und Ressourcenverteilung gefällt werden. Die Entscheidungsprozesse internationaler
Akteure müssen auch bei der Degradierung von Bodenregulierungsdienstleistungen
berücksichtigt werden, und systeminterne und ‐externe Nutzen berücksichtigt werden.
Bodenerosion beeinflusst flussaufwärts die Landnutzer und flussabwärts die Betreiber von
Staudämmen durch zunehmende Verschlammung. In einem Wassereinzugsgebiet sind die
Akteure, welche Entscheidungen zu Bodenregulierungsdienstleistungen fällen und davon
profitieren auch in Entscheidungsprozesse involviert, die über das Einzugsgebiet‐ und über die
direkte Nutzung von Bodenregulierungsdienstleistungen hinausgehen (z.B. Entscheidungen zu
technischen Lösungen für Bodenerosion oder Entscheidungen zur Bereitstellung von Anreizen
undderenAusgestaltung,etc.).
Das Ziel dieser Arbeit ist es die multi‐hierarchischen Entscheidungsprozesse, welche die
Bereitstellung von Bodenregulierungsdienstleistungen charakterisieren, zu analysieren. Dabei
werdendieMensch‐Umwelt‐Systemealszweiunterschiedliche,komplementäreundverknüpfte
Systeme verstanden. In dieser Arbeit untersuche ich die Bodenregulierungsdienstleistungen in
einerFallstudieimGebietdesBirri‐WassereinzugsgebietinCostaRica‐einemLandwelcheseine
Pionierrolle übernimmt in der Politik zur Erhaltung von Ökosystemdienstleistungen. Das Birri‐
EinzugsgebietistrelativkleinmiteinerFlächevon5800Hektaren.Charakterisiertwirdesdurch
intensive undmarktorientierte Landwirtschaft, stark fragmentierte Landwirtschaftsflächen und
steile Hänge. Die Bodenerosion hat in den letzten Jahrzehnten stark zugenommen. Gründe
hierfür sind nicht‐angepasste Landnutzungspraktiken und zunehmende Niederschläge, deren
Intensität und Häufigkeit mit wandelndem Klima weiter ansteigen werden. Das Birri‐

7
Einzugsgebiet dient als Lernbeispiel für nationale und internationale Akteure, da es viele
GemeinsamkeitenmitanderenEinzugsgebietenaufweist.
DererstevonvierArtikelndieserArbeitanalysiertdieUmweltdimensionundbehandeltdieRolle
der Ausdehnung von Waldökosystemen auf hydrologische Reaktionen. In den folgenden drei
Artikeln befasse ich mich mit der menschlichen Dimension und fokussiere auf
EntscheidungsprozesseaufverschiedenenEbenen:i)vomindividuellenEntscheideinesBauernzu
Bodenerhaltung; ii) zur EbenedesWassereinzugsgebiets,woAkteuredirektbetroffen sindvon
systeminterner und ‐externer Bereitstellung von Bodenregulierungsdienstleistungen; und
schliesslich iii) zum nationalen Netzwerk, welches ebenenübergreifenden zwischen
verschiedenenAkteurenInformationenaustauscht,welchedirektoderindirektimManagement
des Einzugsgebiets involviert sind (wie beispielsweise Wissenschaftler, Behörden,
Bauernverbände,NutzerderBodenregulierungsdienstleistungen).
Spezifisches Ziel des ersten Artikels ist es die Resultate von Experimenten mit gepaarten
Einzugsgebieten inAfrika, Asien und Lateinamerika zusammenzufassen,welche den Effekt von
veränderterWaldausdehnungaufhydrologischeReaktionenanalysieren.MittelsMeta‐Analysen
werden die Resultate verschiedener Studien zusammengeführt und das Problem vom kleinem
“n” bewältigt, welches bei vielen Studien zur Waldhydrologie, insbesondere in
Entwicklungsländern,auftritt.
Die zweitePublikationbefasst sichmitderKomplexitätderEntscheidungsprozessevonBauern
bezüglich Bodenerhaltung. Dies wird anhand eines multi‐dimensionalen Entscheidungsmodells
analysiert, welches ökonomisch kognitive und territoriale Variabeln beinhaltet, welche die
Entscheidungsprozesse von Bauern bezüglich Bodenerhaltungsanstrengungen beeinflussen. Die
strukturierteUmfrage beinhaltet Elemente aus vorgängigen Treffenmit Bauern, bei denen die
AnsichtenunddasVerständnisvonBodenerosionundderenLösungenuntersuchtwurden.
DasZieldesdrittenArtikelsistdieAnalysevonAspekten,dierelevantsindfürdenAufbaueines
gemeinschaftlichen Mechanismus unter systeminternen und ‐externen Nutzern von
Bodenregulierungsdienstleistungen. Spezifische Methoden der Entscheidungsforschung und
Verhandlungsanalysewerdenangewandt,welcheBefragungenvonNutzernundAnbieternvon
Bodenregulierungsdienstleistungen beinhalten. Getrennte Konsultation von Akteuren
ermöglichten es die fundamentalen Ziele zu strukturieren undHauptaspekte von gewünschte

8
Mechanismenzuidentifizieren,wiebeispielsweise:i)wiesollendieBauernausgewähltwerden;
ii) welche Kontakttypen sollten verwendet werden; iii) wer sollte Konflikte schlichten und
schliesslich iv) welche Arten von Anreizen gibt es für Bauern für die Umsetzung von
Bodenerhaltungsmassnahmen. Um die Verhandlungsspielräume für die Hauptaspekte des
Mechanismus zu erkennen wurde mit jeder Akteursgruppe eine separate Fokusgruppe
durchgeführt und die Präferenzen der Akteure zu verschiedenen alternativen Aspekten eines
Mechanismuseruiert.
Das Ziel der vierten Publikation ist es ebenenübergreifende institutionelle Diskrepanzen zu
identifizieren, welche aus offiziellen Regeln und Mandaten entstehen und welche die
BereitstellungundNutzungvonBodenregulierungsdienstleistungeneinschränken.Wirbenutzen
“betweeness centrality” Algorithmen (welche häufig in sozialer Netzwerkanalyse verwendet
werden) um zu testen wie die strukturierte Analyse des Informationsaustauschs‐Netzwerks
Schlüsselorganisationen identifizieren kann, die potenziell eine strategische Position innehaben
um ebenenübergreifende institutionelle Diskrepanzen zu bewältigen. Wir analysieren die
offiziellen Mandate der Akteure, welche direkt oder indirekt zur Bereitstellung von
Bodenregulierungsdienstleistungen beitragen und untersuchen deren Interaktion in
Informationsaustausch‐Netzwerken.
Die Analyse der Umweltdimension zeigt den Nutzen und die methodologischen Grenzen von
Meta‐Analysen für die Synthese von Resultaten aus hydrologischen Experimenten, in unserem
Fall Experimente mit gepaarten Einzugsgebieten, bei denen die hydrologischen Effekte von
veränderterFlächevonnatürlichenundgepflanztenWäldernanalysiertwerden.Gesamtresultate
ausAsien,AfrikaundLateinamerikazeigen,dassdieWaldbedeckungeinewichtigeRollespieltbei
derVerringerungdesBasisabflussesimWassereinzugsgebiet,aberderenEffektaufdieKontrolle
des Spitzendurchflusses (d.h. erosionsbedingter Wasserabfluss) hängt mehr von lokalen
Charakteristikenab.EinigemethodologischeGrenzenvonquantitativenMeta‐Analysenkönnen
ebenfalls umrissen werden. Wir fanden eine relativ kleine Anzahl Studien mit gepaarten
Einzugsgebiets‐Experimenten aus Asien, Afrika und Lateinamerika. Dies schränkt die
Analysemöglichkeiten von interagierenden Effekten wichtiger Wasserflussregulationsfaktoren,
wie Boden, Geologie, Topographie oder Landnutzungspraktiken, ein. Die in der Meta‐Analyse
von wissenschaftlichen Artikeln gefunden Daten zur Kapazität von Wäldern Sturmflüsse zu

9
kontrollieren (welche zu erhöhter Erosion führen) erlaubten es nicht, die Effekte häufiger und
intensiverExtremniederschlägezuberücksichtigen.DiesschränktauchdieVergleichsmöglichkeit
von der Bereitstellung von Bodenregulierungsdienstleistungen unter Klimawandel durch
natürliche Waldökosysteme und nicht‐Wald Landnutzungen wie beispielsweise Conservation
Agriculture(LandwirtschaftmitkonservierenderBodenbearbeitung),ein.
AuflokalerEbenesinddieAnstrengungenderBauernumdenBodenzuerhaltenunteranderem
bestimmt von ihrem Bewusstsein wie fest sie der Bodenerosion ausgesetzt sind. Das
Entscheidungsmodell beinhaltet sozio‐ökonomische, territoriale und kognitive Variablen wie
Überzeugungen,WerteundRisikowahrnehmungundunterscheidetzwischendreiGruppenvon
Landwirten, je nach Anstrengungen zur Bodenerhaltung. Die meisten Landwirte sind sich des
Risikos der Erosion bewusst, obwohl sozio‐ökonomische Aspekte, wie Produktionstypen und
Hofgrössedarauf hindeuten, dasswahrgenommeneundkontextgegebeneOpportunitätskosten
die Anstrengungen zum Bodenschutz eindämmen können. Bauernmit geringerWahrnehmung
desErosionsrisikoskönntenebenfallsdasParadigmaderVerfügbarkeitsheuristik zumAusdruck
bringen,dasietäglichErfahrungenmitErosionimWassereinzugsgebietmachen.
Auf der Ebene des Wassereinzugsgebiets erfordert der Aufbau von gemeinschaftlichen
Anstrengungen für eine systemsinterne und ‐externe Erbringung der
Bodenregulierungsdienstleistungen die Vereinbarung von grundsätzlichen Zielen eines
Mechanismus’fürgemeinschaflicheLeistungenzuGunstenderBodenerhaltung.BefragteBauern
und Wasserkraftakteure sind sich einig über die Wichtigkeit von Weiterbildung und fairer
VerteilungvonAnreizen.DirektzahlungenfürBodenerhaltungwirdnurineinemkleinerenMasse
als erwünschte Alternative betrachtet. Technische Unterstützung ist mehr erwünscht als
Direktzahlungen,wasmitdemGrundzielderFörderungvonWeiterbildungübereinstimmt.
Die nationale ebenenübergreifende Analyse von Lenkungsstrukturen für
Bodenregulierungsdienstleistungen betont, dass wichtige regulatorische Diskrepanzen lokale
gesellschaftliche Reaktionen beeinflussen (d.h. da, wo direkte Handlungen zur ausreichenden
BereitstellungunddieNutzungvonÖkosystems‐Dienstleistungenstattfinden).
Mittels Netzwerkanalyse können wir die informationsüberbrückenden Charakteristiken von
AkteurenininformellenInformationsaustausch‐Netzwerkenidentifizieren.DieseAnalysestreicht

10
dieSchlüsselrolle von landwirtschaftlichenBeratungsbüros imEinzugsgebiethervor,welchebei
der Verbreitung von Informationen zu Umwelteinflüssen und technischer Umsetzbarkeit von
Bodenschutzmassnahmen helfen, und dabei Informationen über Politikbereiche und Ebenen
hinausaustauschen.
GesamthaftzeigendieResultatedieserArbeit,dasspolitischeMassnahmenzurBodenerhaltung
zur Unterstützung von Bodenregulierungsdienstleistungen, von einer Kombination von
verschiedenenMethoden profitieren würde. Dies könnte Programme beinhalten, welche das
Risikobewusstsein von heutiger und künftiger Bodenerosion stärken, die Weiterbildung von
Bauern fördern und die Institutionalisierung der Schlüsselrolle der landwirtschaftlichen
Beratungsdienste, welche für die Förderung von Weiterbildung und angepasstem
Bodenmanagementswichtig sind, vorantreiben.Dies istbesonderswichtig inRegionen,welche
stark betroffen sind von zunehmenden Extremniederschlägen, wie beispielsweise
Zentralamerika. Angesichts grosser Unsicherheiten und Datenmangel (z.B. zum Einfluss von
Landnutzungund‐managementundKlimawandel),werdenMechanismenzurAufdatierungund
kontinuierlichen Verbreitung von Informationen zu Einflüssen auf Bodenerosion, sowie den
entsprechenden Lösungen, benötigt. Die Stärkung der Schlüsselrolle der landwirtschaftlichen
Beratungsdienste kann hier einen potenziellen Beitrag leisten zur Aufdatierung von
InformationenzuEinflüssenundsozialerundtechnischerMachbarkeitvonLösungen,umdiese
fürWissenschaftler,RegulatorenundBauernverfügbar zumachen.Diesehabeneinen Einfluss
auf die soziale und technischeUmsetzbarkeit der Lösungsvorschläge.Dies könnte sich als eine
Strategiebeweisen,umgewisseregulatorischeDiskrepanzenanzugehen,welchedieReaktionauf
dieDegradierungvonBodenregulierungsdienstleistungenauflokalerEbeneverhindern,undum
einangepasstesManagementvonBodenregulationsdienstleistungenzufördern.

11

12
TableofContents
Summary_____________________________________________________________ 1Zusammenfassung_____________________________________________________ 61. Introduction _______________________________________________________ 16
1. 1 Relevance of soil erosion ___________________________________________ 16
1.2 On- and off-site benefits of Soil Regulation Services (SRS)________________ 17
1.3 Soil erosion control: a human-environment paradigm ___________________ 19
1.4 Purpose and research questions of the thesis ___________________________ 22
1.5 Meta-analysis of forest-cover change effects on water-related ecosystem services _____________________________________________________________ 23
1.6 Farmers’ decision model regarding soil conservation effort _______________ 23
1.7 Two-party negotiation analysis for a mechanism to promote Soil Regulation Services _____________________________________________________________ 24
1.8 Institutional mismatches and information-sharing in multi-actors’ and cross-scale governance for Soil Regulation Services _____________________________ 24
1.9 Goals and justification of the methods used ____________________________ 25
1.10 References_______________________________________________________ 27
2. Managing watershed services of tropical forests and plantations: can meta-analyses help?________________________________________________________ 30
2.1 Introduction ______________________________________________________ 30
2.2 Method __________________________________________________________ 32
2.3 Results and discussion ______________________________________________ 342.3.1 Selected studies _______________________________________________ 342.3.2 Natural forests________________________________________________ 372.3.3 Planted forests ________________________________________________ 402.3.4 Usefulness of the meta-analyses __________________________________ 402.3.5 Limitations ___________________________________________________ 42
2.4 Conclusions ______________________________________________________ 42
2.5 References________________________________________________________ 43
3. Decision making by farmers regarding ecosystem services: factors affecting soil conservation efforts in Costa Rica________________________________________ 49
3.1 Introduction ______________________________________________________ 49
3.2 Farmers’ Decision-Making for Soil Conservation _______________________ 51
3.3 Methods _________________________________________________________ 543.3.1 Description of the area __________________________________________ 543.3.2 Sample and Survey Instrument Design _____________________________ 553.3.3 The Decision Model____________________________________________ 55

13
3.3.4 Statistical analysis _____________________________________________ 613.3.4.1 Construction of cognitive variables ____________________________ 61
3.3.4.2 Differentiation of farmers’ types_________________________________ 63
3.4 Results___________________________________________________________ 643.4.1 Sample description_____________________________________________ 643.4.3 Differentiation of farmers’ groups _________________________________ 663.4.4 Testing hypotheses of differences between farmers’ groups _____________ 67
3.5 Discussion ________________________________________________________ 70
3.6 Conclusions ______________________________________________________ 72
3.7 References________________________________________________________ 72
4.1 Negotiation analysis for mechanisms to deliver ecosystem services: a value-focused bargaining structure to achieve joint gains in the provision of Soil Regulation Services _____________________________________________________________ 77
4.1 Introduction ______________________________________________________ 77
4.2 Negotiation Analysis and Its Relevance for ES __________________________ 80
4.3 ES provision in the Birris Watershed _________________________________ 82
4.4 Methods _________________________________________________________ 844.4.1 Data Acquisition (Step 1)________________________________________ 864.4.1.1 Data from farmers ____________________________________________ 864.4.1.2 Data from JASEC ____________________________________________ 874.4.2 Synthesis for template building (Step 2) ____________________________ 884.4.3 Verification and evaluation of alternative strategies (Step 3) ____________ 88
4.5 Results___________________________________________________________ 894.5.1 Objectives of negotiating parties __________________________________ 894.5.1.1 Farmers ____________________________________________________ 894.5.1.2 JASEC_____________________________________________________ 914.5.2 Alternatives as strategies across several dimensions ___________________ 924.5.3 Acceptability, preferred alternatives and zones of bargaining ____________ 97
4.6 Discussion ________________________________________________________ 99
4.7 Conclusions _____________________________________________________ 102
4.8 References_______________________________________________________ 103
5. Governance across-scales: regulatory mismatches and the role of boundary organizations for soil regulation-services under climate change in Costa Rica ___ 108
5.1 Introduction _____________________________________________________ 109
5.2 Concepts ________________________________________________________ 1115.2.1 Information and knowledge exchange in ES governance structures ______ 1115.2.2 Multiple scales and regulatory mismatches for SRS __________________ 1125.2.3 Boundary organizations for ES governance networks _________________ 113
5.3. Context for the Birris case study____________________________________ 114
5.4 Methods ________________________________________________________ 115
14
5.4.2 Network analysis _____________________________________________ 1165.4.2.1 Building the questionnaire for network analysis____________________ 1175.4.2.2 Matrix analysis of network data ________________________________ 118
5.6 Results__________________________________________________________ 1205.6.1 Network boundary, formal policies and mandates of organizations across scales___________________________________________________________ 1205.6.2 Structural analysis of the governance network_______________________ 121
5.7 Discussion _______________________________________________________ 125
5.8 Conclusions _____________________________________________________ 131
5.9 References_______________________________________________________ 131
6. Conclusions ______________________________________________________ 136
6.1 Research questions and their rationales ______________________________ 136
6.2 Unanswered research questions, limitations and future research _________ 138
6.3 Main findings ____________________________________________________ 140
6.4 Lessons learned for other cases on ES degradation _____________________ 141
6.5 __________________________________________________________Key messages___________________________________________________________________ 144
7.Annexes __________________________________________________________ 146Annex 1: Extended acronyms of organizations in the network and their specific mandates___________________________________________________________ 147Annex 2. Ecosystem-based adaptation to climate change: what role for policy-makers, society and scientists?_________________________________________________ 163
A 2.1 Introduction ___________________________________________________ 163
A 2.2 Content of the workshop _________________________________________ 164
A 2.3 Key messages for national policy-makers ___________________________ 166
A 2.4 Key messages for communities, local actors and others members of civil society _____________________________________________________________ 167
A 2.5 Key messages for scientists _______________________________________ 168
A 2.6 Conclusions____________________________________________________ 170
Acknowledgments____________________________________________________ 172Curriculum Vitae ____________________________________________________ 174

15

16
1. Introduction
1.1Relevanceofsoilerosion
Timeneeded to formsoils ishighlydifficult to determinatealthough studiesaround theworld
suggestthat,dependingonspecificinteractionsamongclimate,humanandgeologicalprocesses,
uptohundredsofyearsmightberequiredtodevelopsoils(Chesworth,2008).Soilfertilityaswell
as itsdegradationduetoerosionhavebeenastrongdriverofcorrespondinglycivilizationraise
anddecline(McNeillandWiniwarter,2004).Currently,onlylessthanonefifthoftheearth’sland
ispotentiallyproductiveandavailabletoprovide97percentoffoodsupply(therestfromwater
systems).However, future food supply is bound to expand the intensification and frontiers of
agriculture increasingerosionespecially inmarginal lands(Morgan,2005).Evidenceforthisare
suggestedbythecurrentratesoferosioninagriculturallandsthatarebylarge(i.e.between13
and40times,PimentelandKounang,1998)greaterthannaturalsoilproduction,soil lossunder
naturalecosystemsandlong‐term‐geologicalerosion(Montgomery,2007).
Highratesoferosion(from20to100t/ha/yr)areproducingadeclineinproductivityasmuchas
15to30percentannuallywhichcorresponds(whenconsideringthedifficultyofrestoringtheir
fertility) to a loss of 6million hectares annually (Pimentel et al., 1995). Around 85%of global
agricultural land is affected by some form of degradation including erosion, salinization and
compaction(WRI,2000).AccordingtoUNEP’sGlobalAssessmentofSoilDegradation(GLASOD),
soilerosionaccountsfor82percentofthehuman‐inducedlanddegradationthusaffectingmore
thanabillionhectares,althoughonly0.5%ofwhichhasreachedanirreversiblestage(Oldeman,
1992). These figures bear inherent uncertainty in their estimation formethodological reasons
such as scaling up values from local assessments to large regional studies or using national
evaluation standards instead of a unique global one.However, even considering uncertainties,
they show that agricultural practices can reduce significantly soil erosion and provide food
security as well as intermediate services to different sectors of society (e.g. water users,
hydropowerdams,carbonmarkets)(Morgan,2005;Fisheretal.,2009).
In Latin America a major cause of soil degradation is associated to inappropriate soil
management practices in agricultural land and in Mesoamerican Isthmus reaches 74% of
croplands(SantibaniezySantibaniez,2007).Marginalityofsmall landowners insteep landsand

17
intensificationofagriculturalproductionareimportantdriversofcurrentsoilerosion.Observed
andprojectedfrequenciesofextremeprecipitationeventsinMesoamerica(Aguilaretal.,2005)
indicatethatclimatechangeandvariabilityareexpectedtoexacerbatesoilerosionandfurther
affect soil productivity in agricultural lands. For this challenging contexts, Santibaniez and
Santibaniez (2007) indicatethatamongtheseveraladaptationoptionstoreducesoilerosion in
agriculturallandsofLatinAmericaimprovedinformation‐sharingsystemsandinnovativefinancial
mechanismsareimportant.Theformerarenecessaryforearlywarningsagainstextremeclimate
aswellas for increasingfarmers’knowledgeon the implementationofsoundsoilmanagement
practices (Cash, 2001). Innovative financial mechanisms are also important to increase the
capacitytoaccesstechnologiesandinputsforbettersoilmanagement(Pagiola,2008).
1.2On‐andoff‐sitebenefitsofSoilRegulationServices(SRS)
The combined effect of upstream farmers’ decision regarding soil management and the
increasingoccurrenceofextremeprecipitationeventsdeterminethelevelofSRSprovisionboth
on‐site and off‐site. In this section I discuss the specific interaction of human and natural
componentsdefiningthedegradationofSRSasaresultofsoilerosion.
Morespecifically,soilerosioncanbedefinedasprocessincludingadetachmentofsoilparticles
andtheirtransportbywaterorwinduntilenergyisnotsufficientanddepositionoccurs(Morgan,
2005).When considering theerosioncontrol capacityofnaturalecosystems, it is important to
distinguishandtoestablishtheirrelative importanceandsite‐specificcontributionstodifferent
typesoferosion.Indeed,naturalforestecosystemstendtosufferrelativelylittlesurfaceerosion
(ChomitzandKumari,1996)whiletheycancontributelimitedlytocontrolsoilmasserosion(i.e.
deeperthan3m)or intherecoveryofsoilstructurefromprolongedexposuretogullyerosion.
Throughoutthisthesisweusetheterm“soilerosion”torefertosurfaceerosionasproducedby
rain splash, overland flow and rill erosion which are influenced by soil, water and vegetation
managementpracticesfarmerscandecidetoimplementintheirfarms(Morgan,2005).

18
Thefactorscontrollingsoilerosionaretheerosivityoftheerodingagent(e.g.precipitationand
wind), the erodibility of the soil (i.e. function of soil types1), the slope of the land (e.g. its
steepness, itsshapeand its length)andthenatureoftheplantcoverandfinallytheenergyof
precipitationdrops(Morgan,2005).Thesefactorsinteractwitheachotherinacomplexmanner.
For example, soil erodibility depends on interaction between geological and geomorphologic
processeswithsitespecificfloraandfaunaoverhundredsofyears(Chesworth,2008)whilethe
effectofprecipitationandofvegetationcovercanhaveimmediateeffects(e.g.densevegetation
cover can reduce soil erosion). Current societal decisions to define responses depend on
awarenessofthesecomplexcausalloopsandonthecontingentaction‐contextoferodingagents.
Forexample,precipitationerosivity(themostimportantsoilparticles‐detachingagent;Morgan,
2005) ishigherwhenbareunprotected soil surface isexposed to rain splashor runoff laminar
erosion(WischmeierandSmith,1978).Farmlevelpossibleresponsestosoillaminarerosioncan
includemeasuresuchasmanagementofvegetationcover,infiltrationcapacityandsurfacerunoff
kineticpotentialormanagementoforganicmatter fostering soil structuration (Morgan,2005).
Society ideally should aim at achieving a rate of erosion control that equals that of new soil
formationalthoughwherethisbalanceliesforspecificsitesisunknown.Currentannualaverage
soil regeneration rate of world are 0.1mm*yr‐1 while soil erosion rates in some areas of the
worldareover10mm*yr‐1 (Morgan,2005).Farmers’alternativestoreducesoilerosion include
measures to contrast detachment phase of soil particles such as agronomic measures (e.g.
managingvegetationcover)andsoilmanagementpractices(e.g.ploughingwithlowimpactson
soilstructure).Mechanicmethods(e.g.engineeringmanagementofslopetopographyoruseof
syntheticpolymers,Ortsetal.,2007)areinsteaddirectedtocontrolthetransportphaseofsoil
particles.Agronomicmeasuresarethemostcost‐effectiveandsuitabletomostfarmingsystems
(Morgan,2005).
Thescientificobservationoferosionaswellasitsmanagementmusttakeintoaccountwhether
both the on‐site and off‐site effects are considered or only one of them due to time‐lags
characterizingthetransportofparticlesdownstream.Indeed,whileon‐siteeffectsoferosioncan
be both visible and perceivable in short‐time horizon, its off‐site effects on sedimentation
1 For example, volcanic soils such as Andosols are prone to heavy erosion in Central America since they loose physicalstructuresduetotheirrecentformation.

19
downstreammustconsiderthecharacteristictime‐lagbetweenon‐siteremovalofasoilparticle
anditsoff‐siteobservationwhichtendsto increase(duetoincreaseofsedimentstorageareas)
with the dimension of the catchment (Schoenholtz, 2004; Riedelet al., 2004). In specific sites
wherenatural sedimentproduction is lowdue toon‐sitenaturalequilibrium, forest clearing is
bound to contribute to more erosion. Indeed, site‐ and species‐specific relationship are
importantandnatural forestshouldbeseenasthenaturalbaseline forerosioncontrolagainst
whichallotherlandusesshouldbecompared(Calder,2002).
1.3Soilerosioncontrol:ahuman‐environmentparadigm
Theanalysisofsoilerosioncontrolrequiresconsideringcomplexityofactorsandtheirdecision‐
making, spatial and temporal scales and the interactions/feedbacks from action on the
environment(i.e.soil) to itsconsequencesonhumanactivities.Sinceourgoal is tounderstand
how human (defined as the social system ranging from individuals to society) interacts with
environmentalsystemandwhattransitionpathwaycanbeoutlinedtoimprovemanagementof
soil resources, we can refer to the Human‐Environment System (HES) paradigm (Scholz and
Binder, 2004) as a framework allowing us to analyse this complex problem under a human‐
systemperspective(i.e.tounderstandimpactsofregulatorymechanismsinsideamulti‐hierarchy
human system). Under this perspective, soil erosion control can be defined based on the
decision‐making that society needs to consider for their management (Fisher et al., 2009).
Accordingtotheseauthors,classificationofecosystemservicessuchasSoilRegulationServices
must take into account the linkages among intermediate services such as soil formation, final
services such as fertility provision and actual benefits which accrue when the beneficiaries
actuallyisabletousetheseservicestoachievetheirgoals(e.g.producingagriculturalproducts).
The final achievement of beneficiaries’ intended goals using ecosystem services depends on
othertypeoffactorswhichconditiontheeffectiveuseoffinalservices2.
2 For example, hydropower production requires some built capital to harness thebenefitsofwaterregulationfromupstreamecosystems

20
Figure 1: Human-Environment System for soil erosion control in the Birris case study.
Then, under the decision‐making perspective to study the provision and the use of ecosystem
servicessuchassoilerosioncontrolwemustconsideron‐siteandoff‐siteprovisionofthisservice
and the corresponding actors interacting with the provision and/or use of this services. For
example, on‐site we must identify different actors/sectors playing different roles in the
management and use of soil erosion control services according towhether they influence the
provisionof intermediateservices(e.g.farmers influencetheformationofsoilswhilemanaging
organicmatter), the final service (e.g.which results from the interaction of soil characteristics
and the specific on‐site agricultural production type) and the actual benefit of producing
agriculturalproducts(e.g.whichmightbeinfluencesbyfarmers’accesstootherinputs).Onthe
otherside,off‐sitebenefitsofsoilerosioncontrolservicesdependonthecharacteristicsofthe
watershed dynamic transport of sediments downstream, on the specific requirements (e.g.
hydropower dams needs low sediment load water) and capacity of a user to concretize its
benefits.

21
Theseon‐siteandoff‐siteactorsmakedecisionsbasedontheirgoalsbutalsoontheiraccessto
resourcescomingfromotheractorsthatprovideinformationonerosioncontrolalternatives,on
laws defining incentives for improved soilmanagement, on the potential future threats to soil
erosion,etc. Alongwiththegeneral frameworkofHES, forthecaseofsoilerosioncontrolwe
needtoconsiderahierarchyofhumansystemsfromtheindividualfarmersconcernedbasically
withon‐siteaccesstoSRSbenefits, thedownstreamusersofoff‐siteSRSbenefits, theirmutual
interest in the provision of SRS and the regulatory frameworks in which each of them is
embedded as to guide legally their action, providing them with relevant information on
alternativeresponsestoSRSservicesdegradation.
Thus, goal formation and subsequent strategy formation to guide the transition (i.e. based on
actors’ values; Keeney, 1992) depend on capability, experiences and constraints of individuals
involved directly (e.g. farmers and hydropower downstream users of SRS) or indirectly (e.g.
regulators, scientistsproviding informationonalternative technically‐feasible responses) in the
problem of SRS degradation. Environmental awareness (i.e. of impacts, of externalities)
representstheinterfaceofthehuman‐environmentsystem ( )H E! whereindividualsaccording
totheirmentalmodeloftheenvironmentdefinewhataredirectandshort‐termconsequencesof
theiractionsontheenvironmentandwhataredelayedeffects.Inthespecificcaseofsoilerosion
control services farmers and downstream SRS users normally have a direct a short‐term
experience of environmental consequences of soilmanagement actions.However, the specific
environmentalcontextofSRS intrinsically includes longer‐termenvironmentalconsequencesof
humanactions.Forexample,soil formationinvolcanicsoilsmightprovidedeepsoilswherethe
effects of top‐soil losses due to erosionmight not be visible or experienced in the short‐term
productivecycleofthedirectusersofSRS. Itmightrequire longertimeuntil theconsequences
are evident. Similarly, climate change and variability can worsen the environmental
consequences of soil management actions in the longer term which might not be evident or
consideredindaytodaydecision‐makingofactors(SivakumarandNdiangui,2007).Inthiscase,
actorsdependalsoonaccesstoscientificinformationthatimprovestheirunderstandingofshort
and longer‐term consequences of their actions as well on the design of alternative regulatory
thatallowinvolvedactorstorespondandadaptovertimetochangingconditions(DuitandGalaz,
2008).TheproposedHES(ScholzandBinder,2004)providesaninterestingframeworksignalling

22
thattheenvironmentalconsequencesofhumanactionatonescale(e.g.atthefarmlevel)need
supportiveactionsatascaledifferentfromthatoftheaction(e.g.atthenationalorwatershed
scale designing new research on technology options and technology‐transfer mechanisms,
designingnewregulatoryincentivesforsustainablesoilmanagement,etc.).
Inthisrespect,awarenessofenvironmentalconsequencesofhumanactioninthecontextofSRS
services is relevant not only among those who are directly dealing with SRS degradation (i.e.
providers and users of SRS) but also among those who influence regulations, incentives and
scientific understanding on SRS. Alongwith the HES paradigm, these actors’ awareness of SEC
degradation and/or of their corresponding role potentially influence their decision‐making and
canthusconditiontheconstraintsandopportunitiesthatdirectly‐interestedactorsfacetocope
withthisenvironmentalproblem.ThisspecificprincipleoftheHESparadigmisespeciallyrelevant
since the complexity and deep‐uncertainty (Hulme, 2005) of the combined effects of climate
change and soilmanagement practices on SRS need updating information over time to adjust
actions undertaken. In otherwords, regulatory, incentive and science productionmechanisms
that allow human system to establish adaptive cycles are extremely important to cope with
changingconditions(i.e.changeinfrequencyandintensityofextremeprecipitationevents)that
arebyalargepartunknown(Cashetal.,2003;DuitandGalaz,2008).
1.4Purposeandresearchquestionsofthethesis
The objective of this study is to contribute to understanding of the human dimension of soil
degradationproblemusingamulti‐scaleapproach.Ourresearchquestionsarisefromtheanalysis
ofthefactorsthatcharacterizesoilerosioncontrol.Wethusconsidertheenvironmentalsystem
by analysing multiple studies on forest cover change‐water services relationship (i.e. through
meta‐analysis.Onthehumandimensionwetake intoaccountthemulti‐scalecharacteristicsof
soilerosionbyapproachingthedifferentdecisioncontextsthatateachscalearerelevant.Inthis
respect,farmers’decision‐makingregardingtheirfarm‐soilsaccountsfordecisionsthathavethe
most direct impacts of humans on the soil resource. At the watershed scale and using an
ecosystemserviceapproachweanalyse theaspects thatupstreamprovidersof SoilRegulation
Services(i.e.farmers)anddownstreamusersofSRS(i.e.hydropowerdam)considerimportantto

23
establishacollaborativeeffort(i.e.throughnegotiationanalysis)toimproveon‐siteandoff‐site
SRSprovision.Finally,weanalysethecross‐scaleinteractionofactorsfromdifferentpolicyareas
(e.g. regulators, scientists, NGOs, farmers’ associations, etc.) in information‐exchange and
multipleformal‐policyobjectivescontexts.Anadditionalarticlehasbeen includedtoreportthe
perspective of more than 80 experts on ecosystem‐based adaptation to climate change from
differentdisciplines inLatinAmerica.Keymessagesfromtheseexpertssupportthe importance
ofcommunicationandinformation‐sharingmechanismsaswelloutlinetheneedforintermediary
organizationbridgingdifferentknowledge‐communitiesfromthelocaltonationalscale.
1.5Meta‐analysisofforest‐coverchangeeffectsonwater‐relatedecosystemservices
Societyhas,sincelong,takenforgrantedthebeneficiaryroleofforestcoverinprovidingwater‐
related ecosystem services (Andreassian, 2004). General rule of thumb on the role of forest
ecosystems inprovidingwater‐relatedecosystemservices ishinderedbyhighsite‐specificityof
thisrelationship.Moreimportantforthethesis’focusonSRS,itisimportanttolookattheeffect
offorestcoveronhydrologicalprocessessuchasstormflowthatcancausesoilerosion.
Weusemeta‐analysis (Gurevitchetal., 2001) to runaquantitative synthesisof the findingsof
studies from different sites around the world. The limited number of studies on the specific
relationforestcover‐waterrunoffanderosionhinderthebenefitsofusingmeta‐analysistodraw
generalconclusions(Ilstedtetal.,2007).Wethusconcentrateonstudiesthatincludeanalysisof
the effects of forest cover on hydrological responses such as storm flow (defined as a part of
waterrunoff;UNESCO‐WMO,1992)whichisaproxyofsoilerosion(Bonell,1998).
Researchquestion:Canquantitativemeta‐analysishelpresolvethesmall“n”problemaffecting
decisions regarding the role of forest ecosystems in providingwater‐related services? Can this
methodhelpmakinggeneralconclusionsandsoguidepolicymakingonsoilcovermanagement?
1.6Farmers’decisionmodelregardingsoilconservationeffort
Many studies of adoption of control erosion measures by farmers have been based on
assumptions derived from neo‐classical economics (Van de Bergh et al., 2000). However,
evidences suggest that decision making of farmers is a complex combination of site‐
characteristicsandothercognitiveaspects.Thisisespeciallyrelevantconsideringthatobservable
24
effectsofsoilerosionarenotperceivedequallyamongfarmersandamonghigherandlowersoil
erosionriskareas.
Research question: Do risk perception, values and beliefs influence farmers’ soil conservation
behaviouroritisonlyeconomicreasoningthatguidefarmers’behaviour?
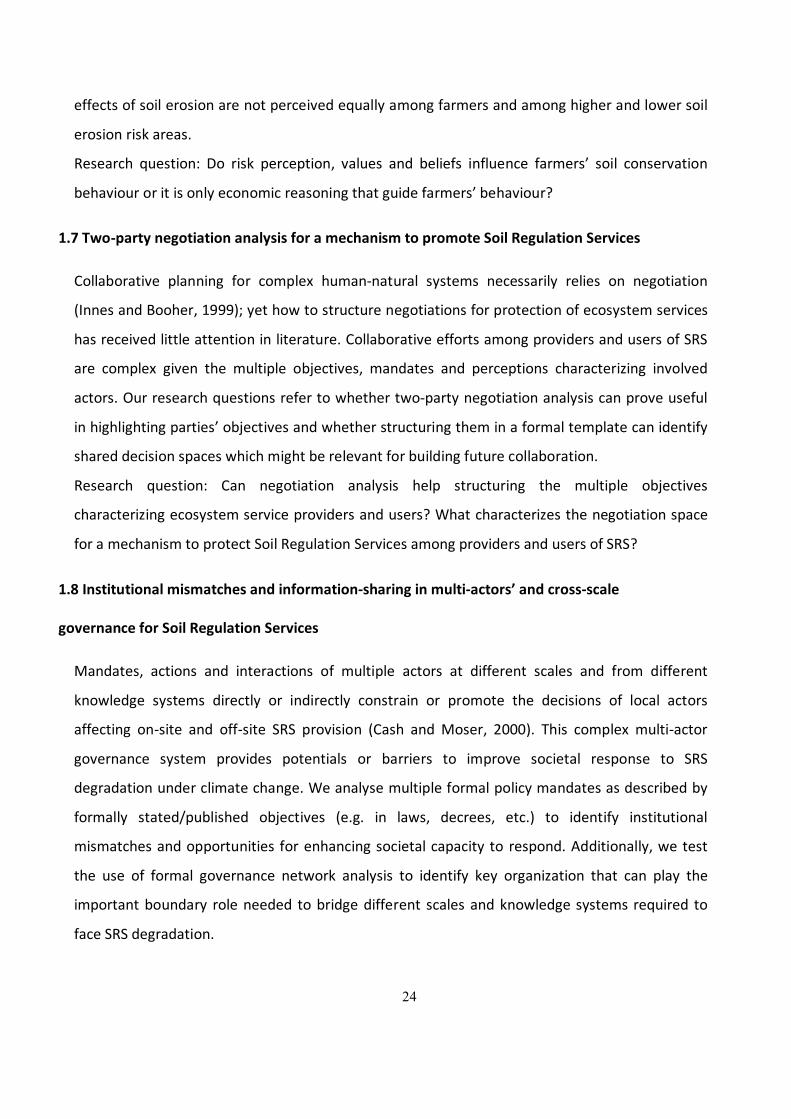
1.7Two‐partynegotiationanalysisforamechanismtopromoteSoilRegulationServices
Collaborative planning for complex human‐natural systems necessarily relies on negotiation
(InnesandBooher,1999);yethowtostructurenegotiationsforprotectionofecosystemservices
hasreceivedlittleattentioninliterature.CollaborativeeffortsamongprovidersandusersofSRS
are complex given the multiple objectives, mandates and perceptions characterizing involved
actors.Ourresearchquestionsrefertowhethertwo‐partynegotiationanalysiscanproveuseful
inhighlightingparties’objectivesandwhetherstructuringtheminaformaltemplatecanidentify
shareddecisionspaceswhichmightberelevantforbuildingfuturecollaboration.
Research question: Can negotiation analysis help structuring the multiple objectives
characterizingecosystemserviceprovidersandusers?Whatcharacterizesthenegotiationspace
foramechanismtoprotectSoilRegulationServicesamongprovidersandusersofSRS?
1.8Institutionalmismatchesandinformation‐sharinginmulti‐actors’andcross‐scale
governanceforSoilRegulationServices
Mandates, actions and interactions of multiple actors at different scales and from different
knowledge systems directly or indirectly constrain or promote the decisions of local actors
affecting on‐site and off‐site SRS provision (Cash andMoser, 2000). This complex multi‐actor
governance system provides potentials or barriers to improve societal response to SRS
degradationunderclimatechange.Weanalysemultipleformalpolicymandatesasdescribedby
formally stated/published objectives (e.g. in laws, decrees, etc.) to identify institutional
mismatchesandopportunities forenhancingsocietalcapacityto respond.Additionally,wetest
the use of formal governance network analysis to identify key organization that can play the
importantboundary roleneeded tobridgedifferent scalesandknowledgesystems required to
faceSRSdegradation.
25
Research questions: What are main institutional mismatches that pose barriers to collective
action in large governance network? Can formal structural analysis of governance network
identify key organizations to play boundary role in such network and thus help overcoming
institutionalmismatches?
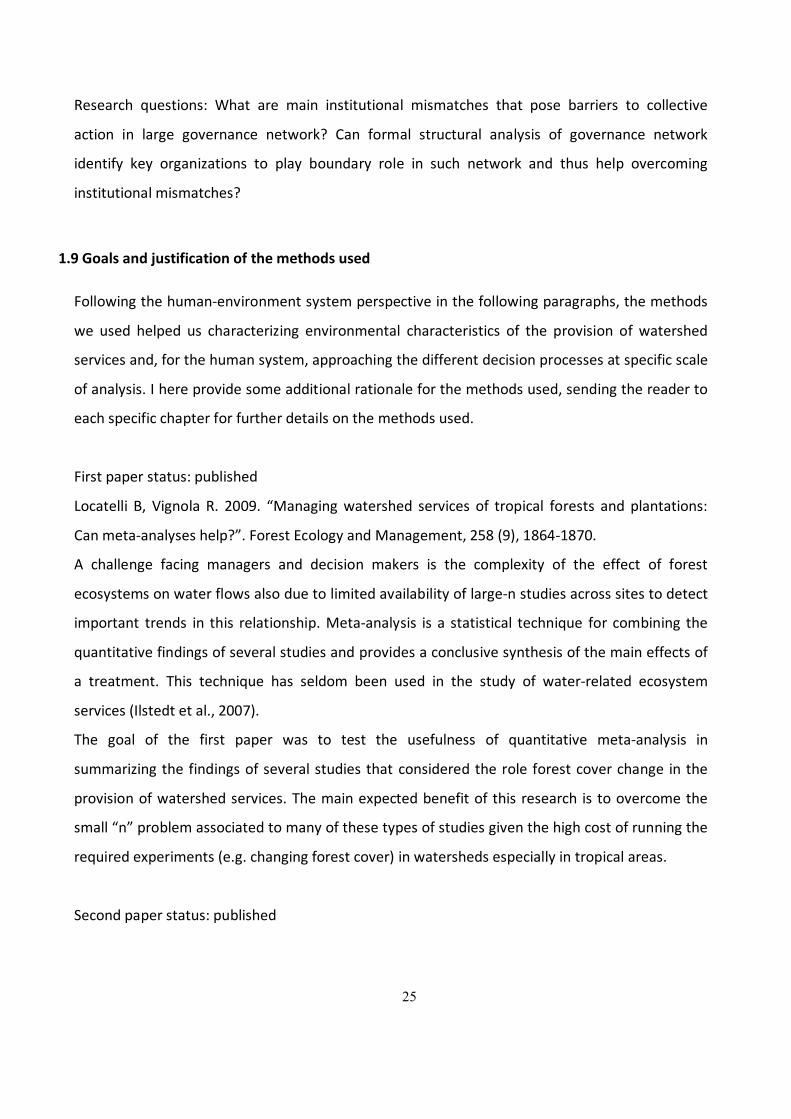
1.9Goalsandjustificationofthemethodsused
Followingthehuman‐environmentsystemperspectiveinthefollowingparagraphs,themethods
we used helped us characterizing environmental characteristics of the provision of watershed
servicesand,forthehumansystem,approachingthedifferentdecisionprocessesatspecificscale
ofanalysis.Ihereprovidesomeadditionalrationaleforthemethodsused,sendingthereaderto
eachspecificchapterforfurtherdetailsonthemethodsused.
Firstpaperstatus:published
Locatelli B, Vignola R. 2009. “Managingwatershed services of tropical forests and plantations:
Canmeta‐analyseshelp?”.ForestEcologyandManagement,258(9),1864‐1870.
A challenge facing managers and decision makers is the complexity of the effect of forest
ecosystemsonwaterflowsalsoduetolimitedavailabilityoflarge‐nstudiesacrosssitestodetect
important trends in this relationship.Meta‐analysis is a statistical technique for combining the
quantitativefindingsofseveralstudiesandprovidesaconclusivesynthesisofthemaineffectsof
a treatment. This technique has seldom been used in the study of water‐related ecosystem
services(Ilstedtetal.,2007).
The goal of the first paper was to test the usefulness of quantitative meta‐analysis in
summarizingthefindingsofseveralstudiesthat consideredtherole forestcoverchange inthe
provisionofwatershedservices.Themainexpectedbenefitof thisresearch is toovercomethe
small“n”problemassociatedtomanyofthesetypesofstudiesgiventhehighcostofrunningthe
requiredexperiments(e.g.changingforestcover)inwatershedsespeciallyintropicalareas.
Secondpaperstatus:published

26
VignolaR.,Koellner,T.,ScholzR.W.,McDanielsT.L.,2009.Decisionmakingbyfarmersregarding
ecosystemservices:factorsaffectingsoilconservationeffortsinCostaRica.LandUsePolicy,Land
UseePolicy27,1132‐1142
The second paper addresses the complexity of farmers’ decision‐making in respect to soil
conservation decisions. We test the hypothesis on the influence of cognitive and territorial
variables(alongwithcommonly‐usedeconomicvariables)onindividualfarmers’decision‐making
regardingsoilconservation.Topreparethestructuredsurvey instrumentwedidnotpre‐define
the items and multiple response options. Instead, we built some of the items and the
correspondentmultiplechoiceoptionsthroughpreviousmeetingswhereweelicitedparticipants’
perspectivesandunderstandingonsoilerosionanditssolutions.
Thirdpaperstatus:secondroundrevisioninEcologicalEconomics
Vignola,R.,McDaniels,T.M.,Scholz,R.W.,2010.Negotiationanalysisformechanismstodeliver
ecosystemservices:avalue‐focusedbargainingstructuretoachievejointgainsintheprovisionof
SoilRegulationServices.SubmittedtoEcologicalEconomics.
Thegoalof thethirdpaperwastoanalyzewhataspectsarerelevanttoprovidersandusersof
SRS in the specific case‐study watershed. We approach this by using specific methods from
decisionscience(e.g.structuringmeans‐endsobjectives;Keeney,1992)andnegotiationanalysis
(e.g. templatebuilding;Raiffaetal., 2002). In thecontextofwatershed servicesprovidersand
usersof SRSare separatedadministrativelyandgeographicallyandmightnotknow theycould
improve their gains by collaborating. Moreover, how to structure this collaboration is not
obvious. Inthisrespect, themethodsused impliedconsultationswithstakeholderstostructure
their fundamental objectives and identify key aspects that alternatives should include. This
helpedusbuildingastakeholders’salientnegotiation‐frameworkincludingasetofalternativesto
elicittheirpreferences.
Fourthpaperstatus:submitted
Vignola, R., McDaniels, T.M., Scholz, R.W., 2010. Governance across‐scales: regulatory
mismatches and the role of boundary organizations for soil regulation‐services under climate
changeinCostaRica.SubmittedtoGlobalEnvironmentalChange.
Inthelastpaper,thegoalistoidentifyinstitutionalmismatchesarisingfromformalpoliciesand
mandates and constraining SRS provision and use. On the other side, we test how structural

27
analysis of information‐exchange network can help identify boundary organizations thatmight
helpovercometheseinstitutionalmismatches.Actorsinthegovernancenetworkhaveeachtheir
ownofficialmandateby laworconsensusandcontributedirectlyor indirectlytoSRSprovision
through their specific role (e.g. funding, science, regulation, support to farmers, etc.). To
characterize this formal policy framework it is necessary to recompile laws, text inwebpages
statingofficialmandatesandorganization’scorporatecommunicationdocuments.Toanalysethe
informalinteractionininformation‐sharingnetwork,interviewstoactorsarerequiredinorderto
letthemindicatewithwhomtheir interchange informationandelicit theirviewsonhowother
organizations in the network produce trustable information and influence relevant policy
processes.
1.10References
Aguilar,E.,Peterson,T.C.,RamırezObando,P.,Frutos,R.,Retana,J.A.,Solera,M.,Soley,J.,GonzalezGarcıa,I.,
Araujo,R.M.,RosaSantos,A.,Valle,V.E.,Brunet,M.,Aguilar,L.,Alvarez,L.,Bautista,M.,Casta˜nonp,C., Herrera, L., Ruano, E., Sinay, J.J., Sanchez, E., Hernandez Oviedo, G.I., Obed, F., Salgado, J.E.,Vazquez, J.L., Baca, M., Gutierrez, M., Centella, C., Espinosa, J., Martınez, D., Olmedo, B., OjedaEspinoza,C.E.,Nu˜nez,R.,Haylock,M.,Benavides,H.,Mayorga,R.,2005.Changesinprecipitationandtemperature extremes in Central America and northern South America, 1961–2003. Journal ofGeophysicalResearch110,D23107.
Andreassian, V., 2004. Water and forests: from an historical controversy to scientific debate. Journal ofHydrology,291:1‐27.
Bonell,M.,Possibleimpactsofclimatevariabilityandchangeontropicalforesthydrology.ClimaticChange39,215‐272
Calder, I.R.,2002.Forestsandhydrologicalservices:reconcilingpublicandscienceperceptions.LandUseandWaterResourcesResearchNo.2,pp.2.1–2.12.http://www.luwrr.com.
Cash, D.W., Clark, W.C., Alcock, F., Dickson, N.M., Eckley, N., Guston, D.H., Jager, J., Mitchell, R.B., 2003.Knowledge systems for sustainable development. Proceedings of the National Academy of Science(PNAS)100(14),8086‐8091.
Cash, D.W., 2001. In order to aid in diffusing useful and practical information: agricultural extension andboundaryorganizations.Science,TechnologyandHumanValues26(4),431‐453.
Cash,D.W.,MoserS.C.,2000.Linkingglobalandlocal scales:designingdynamicassessmentandmanagementprocesses.GlobalEnvironmentalChange10,109‐120.
Chesworth,W.,2008.EncyclopediaofSoilScience.Springer,TheNetherlands.Chomitz,K.M.,Kumari,K.,1996.CentreforSocialandEconomicResearchontheGlobalEnvironment,Working
PaperGEC96‐19,Worldbank,Washington,USA.Duit,A.,Galaz,V.,2008.Governanceandcomplexity:emergingissuesforgovernancetheory.Governance:an
internationaljournalofPolicy,AdministrationandInstitutions21(3),311‐335.Fisher, B., Turner, R.K., Morling, P., 2009. Defining and classifying ecosystem services for decision making.
EcologicalEconomics68,643‐653.

28
Gurevitch,J.,Curtis,P.S.,Jones,M.H.,2001.Meta‐analysisinEcology.AdvancesinEcologicalResearch,32:199‐247.
Hulme,P.E.,2005.Adaptingtoclimatechange:istherescopeforecologicalmanagement inthefaceofglobalthreat?JournalofAppliedEcology42,784‐794.
Ilstedt,U.,Malmer,A.,Verbeeten,E.,Murdiyarso,D.,2007.Theeffectofafforestationonwater infiltrationinthetropics:asystematicreviewandmeta‐analysis.ForestEcologyandManagement251(1–2),45–51
Innes, J.E., Booher, D.E., 1999. Consensus building and complex adaptive systems. Journal of The AmericanPlanningAssociation65(4),412‐423.
Keeney,R.L.,1992.Value‐focusedthinking:apathtocreativedecision‐making.HarvardUniversity Press,432pp.
McNeill,J.R.,Winiwarter,V.,2004.Breakingthesod:humankind,history,andsoil.Science304,1627‐1629.Morgan,R.P.C.,2005.Soilerosionandconservation.BlackwellScienceLtd,USA.304pp.Montgomery,D.R.,2007.Soil erosionandagricultural sustainability.Proceedingsof theNationalAcademyof
Science104(33),13268‐13272.Oldeman,L.R.,1992.Theglobalextentofsoildegradation.In:Greenland,D.J.,Szabolcs,I.(Eds.),SoilResilience
and Sustainable Land Use. Proc. Symposium, Budapest, Hungary. 28 Sept.‐2 Oct. 1992, CABInternational,Wallingford,UK,pp.99‐l18.
Orts, W.J., Roa‐Espinoza, A., Sojka, R.E., Glenn, G.M., Imam, S.H., Erlacher, K., Pedersen, J.S., 2007. Use ofSynthetic Polymers and Biopolymers for Soil Stabilization in Agricultural, Construction, and MilitaryApplications.JournalofMaterialsinCivilEngineering19(1),58‐66.
Pagiola,S.,PaymentsforEcosystemServicesinCostaRica,EcologicalEconomics65(4),712‐724.Pimentel,D.,Kounang,N.,1998.Ecologyofsoilerosioninecosystems.Ecosystems1,416‐426.Pimentel, D., Harvey, C., Resosudarmo, P., Sinclair, K., Kurz, D., McNair, M., Crist, S., Shpritz, L., Fitton, L.,
Saffouri, R., Blair, R., 1995. Environmental and economic costs of soil erosion and conservationbenefits.Science267(5201),1117‐1123.
Raiffa,H.,Richardson,J.,Metcalfe,D.,2002.Negotiationanalysis:thescienceandartofcollaborativedecision‐making.HarvardUniversityPress,548pp.
Riedel, M.S.; Vose, J.; Bolstad, P. 2004. Characterizing Hysteretic Water Quality in Southern AppalachianStreams.InProceedingsofNationalWaterMonitoringCouncil,Chattanooga,TN,USA.
Santibaniez,F.,Santibaniez,P.,2007.Trends in landdegradationinLatinAmericaandtheCaribbean,theroleof climate change. In Sivakumar, M.V.K., Ndiangui, N. Eds. 2007. Climate and Land Degradation.Springer‐Verlagpublisher,Berlin,Germany.
Schoenholtz,S.H.2004. Impactsofforestmanagementonwaterquality. InHydrology.EnciclopediaofForestSciences.Availableonline:www.elsevier.com/locate/.doi:10.1016/B0‐12‐145160‐7/00209‐X.
Scholz, R.W., Binder, C., 2003. The paradigm of human‐environment systems. Social and Natural ScienceInterface‐ETHZ,WorkingPaper37.
Sivakumar,M.V.K.,Ndiangui,N.,2007.Climateandlanddegradation.SpringerlinkPublisher,624pp.WorldResourcesInstitute(WRI),2000.WorldResources2000‐2001:Peopleandecosystems:Thefrayingweb
oflife.WorldResourcesInstitute(WRI),WashingtonD.C.,US.UNESCO, WMO, 1992. International glossary of hydrology. Paris, United Nations Educational Scientific and
CulturalOrganization;Geneva,WorldMeteorologicalOrganization,1992.VandeBergh,J.C.J.M.,Ferrer‐i‐Carbonell,A.,Munda,G.,2000.Alternativemodelsofindividualbehaviourand
implicationsforenvironmentalpolicy.EcologicalEconomics32,43‐61.Wischmeier,W.H.,Smith,D.D.,1978.PredictingRainfallErosionLosses.AGuidetoConservationPlanning.US
DepartmentofAgricultureHandbookNo.537.USGovernmentPrintingOffice,WashingtonD.C.,USA.

29

30
2. Managing watershed services of tropical forests and plantations: can meta-analyses help?
Paperpublished:LocatelliB,VignolaR.2009.“Managingwatershedservicesoftropical forests
andplantations:Canmeta‐analyseshelp?”.ForestEcologyandManagement,258(9),1864‐1870.
Abstract
Thewatershed services provided by tropical natural and planted forests are critical to human
well‐being. An increasing number of valuation studies and experiences with payment for
ecosystem services have dealt with the role of ecosystems in regulating the flow of water.
However, several studies have been based on misconceptions about the role of forests and
plantationsinthehydrologicalcycle,despitethepublicationofmanyreviewsbyhydrologists.The
objectiveofthispaperistoevaluatewhethermeta‐analysesappliedtostudiescomparingwater
flows in tropicalwatershedsundernaturalorplanted forestsandnon‐forest lands canprovide
usefulresultsforvaluingwatershedecosystemservicesandmakingdecisions.Themeta‐analyses
show significantly lower total flows or base flows under planted forests than non‐forest land
uses. Meta‐analyses conducted with subsamples of the data also show lower total flow and
higherbaseflowundernaturalforeststhannon‐forestlanduses.However,theavailablestudies
were restricted to humid climates and particular forest types (Pinus and Eucalyptus planted
forestsandlowlandnaturalforests).Thesmallnumberofavailablestudieswithsufficientoriginal
dataisamajorconstraintintheapplicationofmeta‐analyses.Thisrepresentsamajortechnical
challengeforvaluationstudiesorpaymentforecosystemservices,especiallyincountrieswhere
financialresourcesforimplementingfieldresearcharescarce.
Keywords:ecosystem services; tropics; natural forest; planted forests; hydrology; policy;meta‐
analysis
2.1Introduction
Ecosystems provide services critical to humanwell‐being, in particularwatershed services that
regulate the quantity of water available for human activities. The conservation of dry season
streamflowsisessentialfornavigation,recreation,wildlife,andforruralcommunities,aswellas
for irrigation systems that lack the technology for pumping groundwater (Aylward, 2005). The
reductionofstormflowmaybenefithousing,infrastructure,oragricultureinflood‐proneareas.

31
Theconservationof total annualwater flow isalso relevant to reservoirs fordrinkingwateror
hydroelectricityproduction(Guoetal.,2000).
Over thepast50years,however, theconversionofnaturalecosystems toother landuseshas
dramatically altered hydrological cycles (Millennium Ecosystem Assessment, 2005). The
combined effects of climate and land cover changes require societies to adopt appropriate
adaptation measures for reducing their vulnerability to water scarcity and excess (Oki et al.,
2006;Hulme,2005).Thesemeasuresshouldincludetheprotectionorrestorationofecosystems
providingwatershedservices,especiallyindevelopingcountrieswithlowtechnicalandfinancial
capacityto regulatewater flowswithengineeredsolutions(Bergkampetal., 2003;Pattanayak,
2004).Inthisrespect,financialmechanismsthatencouragetheprovisionofecosystemservices,
suchaspaymentsforecosystemservices(PES),areincreasinglybeingusedtomanageupstream
forest ecosystems for the regulation of water flows (Wunder, 2005; FAO, 2004; Dudley et al.,
2003).
Valuation studies ofwatershed ecosystem services andmanagement or policy decisions about
PESarenotalwaysscientificallysound.Variousmisconceptionsabouttheroleofecosystemsin
regulating the flow of water persist among managers and decision‐makers, despite the
publication of many scientific papers on this issue (e.g., Bosch and Hewlett, 1982; Bruijnzeel,
1990;CritchleyandBruijnzeel,1996;SahinandHall,1996;Bonell,1998;Calder,2002;Bestetal.,
2003;Andreassian,2004;Bruijnzeel,2004;Scottetal.,2004;BonellandBruijnzeel,2005;Farley
et al., 2005; Guillemette et al., 2005; Scott et al., 2005). A challenge facing managers and
decision‐makers is thecomplexityoftheeffectofecosystemsonwater flows(Bruijnzeel,1990;
Fujiedaetal.1997;Bonell,1998;vanNoordwijketal.,2004;Waageetal.,2008).).
Meta‐analysis,astatistical techniqueforcombiningthequantitativefindingsofseveralstudies,
hasseldombeenused in foresthydrology(Ilstedtetal.,2007).Meta‐analysishastheabilityto
considerseveralstudiesthatareinthemselvesinconclusive,andprovideastatisticallyconclusive
synthesis.Althoughitrequiressimplificationoftheobservedphenomena,meta‐analysishasthe
advantage of producing results that are more easily understandable by decision‐makers than
narrative reviews. The objective of this paper is to evaluatewhethermeta‐analyses applied to
studiescomparingwaterflowsintropicalwatershedsunderdifferentforestornon‐forestcovers

32
canprovideusefulresultsforvaluingwatershedecosystemservicesandmakingdecisionsabout
PESandwatershedmanagement.
2.2Method
Weconductedseveralmeta‐analysestocombinethefindingsofstudiescomparingwaterflows
betweenwatershedsundernaturalforestsvs.non‐forestlanduses,andplantedforestsvs.non‐
forestlanduses.Thesestudiesweresynchroniccomparisonsoftwoormorepairedwatersheds
or diachronic comparisons of one watershed under changing forest cover over time. We
considerednaturalandplantedforestsbecausebotharebeingconsideredinPESforwatersheds
(Wunder et al., 2008). For instance, the national PES scheme in Costa Rica rewards forest
conservation and plantation and recognizes explicitly hydrological services, including the
provisionofwaterforhumanconsumption,irrigation,andenergyproduction(Pagiola,2008).
Weconsideredthreehydrologicalvariablesof interest:annualtotal flow,stormflow,andbase
flow.According to theGlossaryofHydrologyofUNESCO‐WMO(1992), annual total flow is the
“total volumeofwater that flowsduringayear,usually referring to the outflowofadrainage
area or river basin”. Storm flow is “part of surface runoffwhich reaches the catchment outlet
shortlyaftertherainstarts; itsvolume isequal torainfallexcess”.Baseflow is the“partofthe
discharge(volumeofwaterflowingthroughariverorchannelcross‐sectioninunittime)which
entersastreamchannelfromgroundwaterfromlakesandglaciersduringlongperiodswhenno
precipitation or snowmelt occurs” (UNESCO‐WMO, 1992). Other authors have modified this
definition by adding that base flow is “themore or less permanent flow supplied to drainage
channelsbyratherinvariablesources”(Sussweinetal.,2001).Inareaswithseasonalityinrainfall,
thedischargeduringmostofthedryseasonresultsfrombaseflow(Smakhtin,2001).
We followed the generally accepted procedures for meta‐analysis (e.g., Cooper and Hedges,
1994;Gurevitchetal., 2001). First,we searchedpeer‐reviewedarticles comparingwater flows
undernaturalorplanted forestsandnon‐forest landuses in tropicalwatersheds.Wesearched
referencesinCAB,ISIWebofScience,andtheAGRICOLAliteraturedatabaseinMarch2006with
thefollowingquery:“(forestORdeforestationORreforestationORafforestation)AND(waterOR
hydrology OR hydrological) AND (watershed OR catchment OR land use OR land‐use) AND
(tropicalORsubtropical)”.About1100referenceswereretrieved.
33
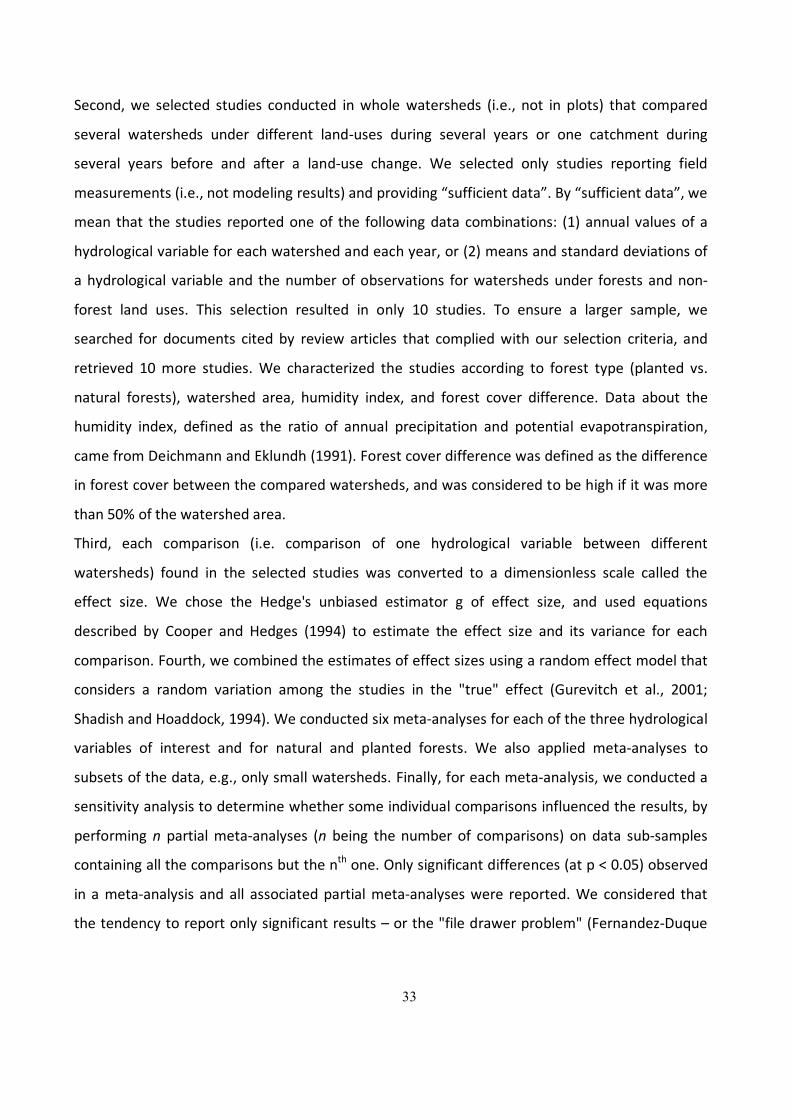
Second,we selected studies conducted inwholewatersheds (i.e., not in plots) that compared
several watersheds under different land‐uses during several years or one catchment during
several years before and after a land‐use change. We selected only studies reporting field
measurements(i.e.,notmodelingresults)andproviding“sufficientdata”.By“sufficientdata”,we
mean that thestudies reportedoneof the followingdata combinations: (1)annual valuesofa
hydrologicalvariableforeachwatershedandeachyear,or(2)meansandstandarddeviationsof
ahydrological variableand thenumberofobservations forwatershedsunder forestsandnon‐
forest land uses. This selection resulted in only 10 studies. To ensure a larger sample, we
searched for documents cited by review articles that compliedwith our selection criteria, and
retrieved 10more studies.We characterized the studies according to forest type (planted vs.
natural forests), watershed area, humidity index, and forest cover difference. Data about the
humidity index, defined as the ratio of annual precipitation and potential evapotranspiration,
camefromDeichmannandEklundh(1991).Forestcoverdifferencewasdefinedasthedifference
inforestcoverbetweenthecomparedwatersheds,andwasconsideredtobehighifitwasmore
than50%ofthewatershedarea.
Third, each comparison (i.e. comparison of one hydrological variable between different
watersheds) found in the selected studies was converted to a dimensionless scale called the
effect size. We chose the Hedge's unbiased estimator g of effect size, and used equations
described by Cooper and Hedges (1994) to estimate the effect size and its variance for each
comparison.Fourth,wecombinedtheestimatesofeffectsizesusingarandomeffectmodelthat
considers a random variation among the studies in the "true" effect (Gurevitch et al., 2001;
ShadishandHoaddock,1994).Weconductedsixmeta‐analysesforeachofthethreehydrological
variables of interest and for natural and planted forests. We also applied meta‐analyses to
subsetsofthedata,e.g.,onlysmallwatersheds.Finally,foreachmeta‐analysis,weconducteda
sensitivityanalysistodeterminewhethersomeindividualcomparisonsinfluencedtheresults,by
performingn partialmeta‐analyses (n being the number of comparisons) on data sub‐samples
containingallthecomparisonsbutthenthone.Onlysignificantdifferences(atp<0.05)observed
inameta‐analysisandall associatedpartialmeta‐analyseswere reported.We considered that
thetendencytoreportonlysignificantresults–orthe"filedrawerproblem"(Fernandez‐Duque

34
andValeggia,1994) ‐wasnotarelevantbias inouranalysis,becausetheresultsofcostlylong‐
termhydrologicalstudiesaregenerallyreportedevenifnosignificantdifferencesarefound.
2.3Resultsanddiscussion
2.3.1Selectedstudies
Amongthe20selectedstudies,ninewereconducted inAsia,eight inAfrica,andthree inLatin
America(seeTable1fordetailsofthestudies,andFigure1fortheirlocation).Thesmallnumber
of studies is due to the lack of comparison betweenwatersheds under forests and non‐forest
land uses and the lack of sufficient data in many studies. The focus of the meta‐analyses on
tropicalareas, thethemeofthisspecial issueofForestEcologyandManagement,alsostrongly
reducedthenumberofavailablestudies,astropicalareasareunder‐representedinthescientific
literatureaboutforesthydrology.Forexample,among135watershedexperimentsreviewed in
Andreassian(2004),only16aretropicalwatersheds.

35
Table 1. Characteristics of the selected studies.
Firstauthorandyear
CountryHumidityclass(2)
Watershedarea(3)
Forestcoverdifference(4)
Years(5) Description(6)
Bailly1974p(1) Mada‐gascar
HU S Hi 64‐71
NFSyn(4w.forest,2w.agriculture/fallow)
PFSyn(1w.Eucalyptus,2w.agriculture/fallow)
Bailly1974m Mada‐gascar
HU S Hi 62‐72PFSyn(1w.Eucalyptus,2w.
grassland)Bewket2005 Ethiopia
HU L Lo60‐64and80‐84
NFDia(1w.lessforestedin1960thanin1982).
Blackie1972 KenyaHU‐DR L Hi 61‐68
NFSyn(1w.forest,1w.partiallyagriculture)
Chandler1998 ThePhili‐ppines
HU S Hi 95‐96NFSyn(1w.forest,2w.
grasslands)Costa2003 Brazil
HU L Lo49‐68and79‐98
NFDia(1w.lessforestedin49‐68thanin79‐98).
Dagg1965 TanzaniaHU S Hi 57‐63
NFSyn(1w.forest,1w.agriculture)
Fritsch1983 FrenchGuyana
HU S Hi 77‐81NFSyn(2w.forest,6w.deforested/pasture)
Fritsch1992 FrenchGuyana
HU S Hi 77‐87
NFSyn(2w.forest,2w.pasture/slash‐and‐burn)
PFDia(2w.beforeandafterreforestation)
Goujon1968 Mada‐gascar
HU S Hi 62‐66 PFSyn(1w.Pinus,1w.grassland)
Lal1997 NigeriaHU‐DR S Hi
74‐75and79‐84
NFDia(1w.deforestedin1979)
Mathur1976 India
DR S Hi61‐67and69‐73
PFSyn(after19691w.Eucalyptus,1w.shrub)
PFDia(1w.undershrubbefore1968,thenEucalyptus)
Mungai2004 SriLankaHU L Lo
51‐61,67‐77,78‐88
NFDia(1w.underdeforestation)
Mwendera1994 MalawiHU L Hi
61‐65,70‐78
PFDia(1w.underforestationwithPinusandEucalyptus)
Raghunath1970 IndiaHU L Hi
Variousperiods
NFSyn(9w.mainlyunderagricultureorpasture,3w.
mainlyunderforest)Samraj1988;Sharda1998;Sikka2003
India
HU S Hi68‐71,73‐81,82‐91
PFSyn(after19721w.Eucalyptus,1w.shrub)
PFDia(1w.undershrubbefore1972,thenEucalyptus)
Wilk2001 ThailandHU L Hi
57‐64,87‐94
NFDia(1w.withdecreasingforestcover)
Zhou2002 ChinaHU S Hi 81‐90
PFSyn(1w.Eucalyptus,1w.baresoil)

36
(i) (1)Twostudiesarereportedinthesamereference(Baillyetal.,1974),oneinPérinet(1974p)andanotherinManankazo(1974m).
(ii) (2)HU=humidarea,HU‐DR=humidareanear the transitionbetweenhumidanddry (less than50km),DR=dryarea.Humidity indextakenfromDeichmannandEklundh(1991).
(iii) (3)S=Small(<1km2),L=Large(>1km2).
(iv) (4)Lo:forestcoverdiffersbylessthan50%ofthewatershedareabetweenthecomparedwatersheds,Hi:morethan50%.
(v) (5)Period(s)oftimeselectedforouranalysis.(vi) (6)NF:comparisonsbetweennatural forestsandnon‐forest landuses,PF:comparisonbetweenplanted forestsandnon‐forest landuses.Syn:synchroniccomparisons.Dia:diachroniccomparisons.Inparenthesis:descriptionofwatershedlandcover(“w.”=watershed).
Amongthe20studies,13studieswereconductedinwatershedssmallerthan1km2andsevenin
watersheds larger than 1 km2. Seventeen studies comparedwatershedswithhigh forest cover
difference(morethan50%ofthewatershedarea).Seventeenstudieswereconductedinhumid
areas,andthreeindryareasortransitionareasbetweenhumidanddry.Thisresultshowsabias
in the meta‐analyses, as no studies in semi‐arid or arid areas and few studies in dry areas
provided sufficient data. As the results cannot be generalized to the tropics as a whole, the
scientificknowledgefordecisionmakingindry,semi‐arid,andaridareasislacking.
Figure 1. Location of the 20 studies selected for the meta-analyses.
In the 20 studies,we retrieved 63 comparisons betweenwatersheds under natural or planted
forestsandnon‐forestlanduses.Onaverage,acomparisonwasbasedon16observations(e.g.,
onewatershedobservedduring16yearsorfourwatershedsduringfouryears).Thenumbersof
studies and comparisons arewithin the acceptable range of sample sizes used in othermeta‐
analyses.Indeed,inthefewmeta‐analysesthathavebeenappliedtohydrology,thesamplesizes
weregenerallylower;forinstance,14observationsandfourstudiesinIlstedtetal.(2007).

37
2.3.2Naturalforests
In 12 of the 20 selected studies, 39 comparisons were analyzed between watersheds under
naturalforestsandnon‐forestlanduses.Thesecomparisonswererelatedmostlytowatersheds
largerthan1km2(26comparisons),withhighforestcoverdifferences(24),and inhumidareas
(36). No studies about montane cloud forests complied with our selection criteria. As these
forestscanhaveadifferenteffectonwaterflowscomparedtoothernaturalforestsbecauseof
their capacity to collect water from the clouds, valuation of ecosystem services or decision
makingaboutcloudforestsshouldnotbebasedonourmeta‐analyses.
Including all comparisons, the meta‐analysis did not show significant differences in total flow
between watersheds under natural forests and non‐forest land uses (see Table 2). However,
whenselecting comparisonsmade in smallwatershedsor largedifferences in forest cover, the
meta‐analyses showed that the total flowwas significantly lower inwatersheds under natural
foreststhannon‐forestlanduses.Thisresultshowstheinterestincomparingsmallwatersheds
orwatershedswithlargedifferencesinforestcover.Someauthorshavestatedthattheeffectsof
forestsonwaterflowsarediscernableonlyinwatershedssmallerthan1000km2(FAOandCIFOR,
2005) or 500 km2 (Pattanayak, 2004), while others have stated that the most significant
observationshavebeenmadeinsmallwatersheds,usuallylessthanonekm2(Bruijnzeel,2004).
Separating the hydrological effects of forests is more difficult in larger catchments, which
generallypresentdiverselandusesandland‐usechanges.

38
Table 2. Results of the meta-analyses. Results of the meta‐analysiswithalldata
Selectedstudies(i) Number of comparisonsandcharacteristicsofthecomparedwatersheds(ii)
Othersignificantresultsofthemeta‐analyses with datasubsets(ii)
Differencesinflowsbetweennaturalforestsvs.non‐forestlanduses(Studiesavailableonlyforlowlandforests.Nostudiesoncloudforests).
Totalflow:Nosignificantdifference
11(Bai74pBew05Bla72Cha98Cos03Dag65Fri83Lal97Mun04Rag70Wil01)
15(6smallw,9largew,1 dry,12humid,2 11high3 diff.,4lowdiff)
Withsmallw.orhighdiff.:Lesstotalflowinnaturalforestthannon‐forestlanduses
Baseflow:Nosignificantdifference
4(Bai74pBew05Mun04Wil01)
8(1smallw,7largew,8humid,2highdiff.,6lowdiff.)
Inlargew.:Morebaseflowinnaturalforestthannon‐forestlanduses
Stormflow:Nosignificantdifference
8(Bai74pBew05Cha98Cos03Fri92Mun04Rag70Wil01)
16(6smallw,10largew,16humid,9highdiff.,7lowdiff.)
None
Differencesinflowsbetweenplantedforestsvs.non‐forestcover(StudiesavailableonlyaboutEucalyptusandPinusplantations.
Nostudiesonotherspecies,incl.nativespecies).Totalflow:Lesstotalflowinplantedforestthannon‐forestlanduses
7(Bai74mBai74pGou68Mat76Sam88Sha98Zho02)
11(11smallw,1dry,10humid,11highdiff.)
Withsmallw.,humidorhighdiff.:Sameresult
Baseflow:Lessbaseflowinplantedforestthannon‐forestlanduses
5(Bai74pMwe94Sam88Sha98Sik03)
8(7smallw,1largew,8humid,8highforestdiff.)
Withsmallw.,humidorhighdiff.:Sameresult
Stormflow:Nosignificantdifference
5(Bai74pGou68Mwe94Sam88Sha98)
4 (4smallw,1largew,5 5humid,5highdiff.)7
None
(vii) Numberofstudiesandreferences inparenthesis(referencesaregivenwiththe first threelettersof thefirstauthor’snameandthe2‐digityear).
(viii) “smallw.”=watershedsmallerthan1km2,“largew.”=watershedlargerthan1km2,“humid”=humidaccordingtoTable1definition,“dry” =dryor transition fromhumid todry, “low diff.”= forest coverdiffers by less than50%of thewatershedarea between the comparedwatersheds,“highdiff.”=morethan50%.
The effect of natural forests on total flowhas been demonstrated by other authors in diverse
situations, although theymay not be valid for some very old forests or cloud forests (Calder,
2002;Bruijnzeeletal., 2004).Theseeffects can beexplainedby thehigherevapotranspiration
ratesinforestscomparedtopastureorannualcroppinglanduses(Bruijnzeel,1990).Treeswith
deeprootsandhightranspirationratesmayactaspumpsthatremovewaterfromthesoiland
transpire it. Although conversion of natural forests to non‐forest land uses is immediately
followedbyaperiodofincreasedtotalflow,thesubsequentperiodmaynotbecharacterizedby
a high total flow, for instance with forest recovery or high evapotranspiration rates in the
subsequentvegetation.

39
The meta‐analysis showed no significant differences in base flow between watersheds under
naturalforestsandnon‐forestlanduses(seeTable2).Theeffectofnaturalforestsonbaseflow
resultsfromtwocompetingprocesses(Calder,2002;Bruijnzeeletal.,2004):hightranspirationby
the forest, contributing to a low base flow, and high infiltration under the forest, generally
contributing to soilwater rechargeandhighbase flow. If the infiltrationcapacityof the soil is
increasedwhenconvertingnatural foreststonon‐forest landuses,baseflowcanbe increased.
Natural forests conserve base flow compared to other land uses in situations where the
alternative land use decreases the infiltration capacity (Bruijnzeel et al., 2004). In the meta‐
analysis,thebaseflowwashigherundernatural forestsforthesubsetoflargewatersheds;but
this result is difficult to explain. This may due to the regional recycling of rainfall by forests
(Vanclay,2009)butthisinterpretationiscontroversial(Bruijnzeel,2004).
Regarding storm flow, no significant difference was found betweenwatersheds under natural
forests and non‐forest land uses (see Table 2). Forest hydrologists agree that the relationship
betweenforestsandstormflowisnotclear(BoschandHewlett,1982).Evenifhigherinfiltration
andevapotranspirationunderforestsmayreducestormflow,ourresultsshowedthatthiseffect
wasnotalwayssignificant.Theroleofforestcoverforstormflowreduction isadebatedissue,
especiallyforthepartofthestormflowthatisreleasedduringextremerainfallevents(peakflow
ormaximumflow)andisresponsibleforfloods.AccordingtoFAOandCIFOR(2005),thereisno
hardevidencethattropicalforestsreducefloods,whileBradshawetal.(2007)showedthatflood
frequency isnegatively correlatedwith forest cover.Theeffectof forestson large scale floods
seemsparticularlyweak;Bruijnzeel(2004)concludedthatfloodsoccurringinextremeconditions
(e.g., extreme rainfall at theendof the rainy seasonwhensoilsarewet)arenot regulatedby
vegetationcover.Ouranalysesdidnotdistinguishstormflowsfromrainfalleventswithdifferent
intensities,andthus itwasnotpossibletodeterminethe roleof forests inregulatingthepeak
flowresultingfromextremerainfallevents.Theregulationofannualstormflowisdifferentfrom
the regulation of peak flow resulting in large‐scale floods (Bruijnzeel, 2004). However, even if
forests do not prevent large scale floods, their role in preventing average andmost frequent
floodsshouldnotbeundervalued.
40
2.3.3Plantedforests
In10ofthe20selectedstudies,24comparisonsbetweenwatershedsunderplantedforestsand
non‐forest land uses were analyzed. These comparisons were related mostly to watersheds
smaller than 1 km2 (22 comparisons),with high forest cover differences (all 24), and in humid
areas (23). The selected studies referred to planted forests with species of two genera:
EucalyptusandPinus.Nostudieswereavailableforotherspecies,includingnativespecies.This
showsthatthereisalackofscientificdataformakingdecisionsaboutplantingspeciesotherthan
EucalyptusandPinusgenera,as the resultsof themeta‐analyses cannotbegeneralized toany
plantedforestinthetropics.
Themeta‐analysesshowedthattotalflowandbaseflowwerelowerinwatershedsunderplanted
forests than non‐forest land uses (see Table 2). These results can be explained by the high
transpiration rates of exotic species, especially Eucalyptus (Vertessy et al., 2001). Infiltration
capacitymaybehigherunderplantedforeststhannon‐forestlanduses(Ilstedtetal.,2007),but
maynotbeenoughtooffsetthehigher lossofwaterbytranspiration.However,someauthors
have reported that in degraded soils, planted forests may increase infiltration more than
transpiration, thus increasing base flow, compared to non‐forest land uses (Bruijnzeel, 2004).
However, theavailablestudiesdidnotcomparewater flowsbetweenplantedforestsandnon‐
forest land uses on degraded soils. Including all comparisons, themeta‐analysis did not show
significant differences in storm flow betweenwatershedswith planted forests and non‐forest
landuses.Thisanalysisofplantedforestsandstormflowwasbasedononly fivecomparisons,
comparedtoeightto16forotheranalyses.
2.3.4Usefulnessofthemeta‐analyses
Theresultsofthemeta‐analysesallowtheanalysisofsomemisunderstandingsabouttheeffects
of natural and planted forests on water flows in decision making on PES or watershed
management. According to the conventional beliefs analyzed by various authors (Chomitz and
Kumari, 1996; Susswein et al., 2001; Calder, 2002; Bruijnzeel et al., 2004; Kaimowitz, 2005),
natural and planted forests are thought to increase total flows. This belief is deeply rooted in
publicperception,aswasshownbyKosoyetal.(2007)inCentralAmerica,wheremorethan90%

41
of the population involved in a survey perceived thatmore forestswould lead to higher total
waterflows.AccordingtoFAO(2004),manyhydrologicalPESarebasedonassumptionsthathave
notbeenverifiedintheparticularcase.Forexample,inthePESschemeinPimampiro(Ecuador),
theeffectofland‐useofhydrologicalserviceshasnotbeenstudied(WunderandAlbán,2008).In
CostaRica,aprivatehydro‐energyfirmpaysforecosystemservicesprovidedbyforestationand
forest conservation with the objective of increasing its energy production, in part through
increasingtotalflow(Mirandaetal.,2007).ThreePESschemesstudiedbyKosoyetal.(2007)in
CentralAmericaarebuiltuponthebeliefthatforestsincreasetotalflows.
Aylward(2005)showedthatseveralvaluationsofforesthydrologicalserviceswerebasedonthe
unverified assumption that natural forestswould decrease storm flow and increase base flow.
AmongthestudiesvaluingforestwatershedservicesintheFAOForestValuationDatabase(FAO,
2007), three were based on unsubstantiated relationships between forests and water, for
instance that forests decrease floods or increase total flows. To supply water and reduce
sedimentinthePanamaCanal,aplandevelopedinthe1990spromotedplantingforestsamong
otheractivities,andwasbasedonthebeliefthatplantedforestswouldincreasetotalandbase
flows(Calder,2002;Kaimowitz,2005).AfterhurricaneMitchinCentralAmericainOctober1998,
thepublic,decision‐makers,environmentalists, and internationalagencieswereconvinced that
deforestation had increased the damage, and proposed forest planting as a watershed
managementmeasure (Kaimowitz, 2005). Similarly, Bruijnzeel (2004) reported that large‐scale
forestplanting inupperwatershedswasproposed in BangladeshandChina to reducedamage
causedbyfloods.
Even though the results of the meta‐analyses should not be generalized to any tropical
watershed,totalflowsappearedtobelowerinwatershedsundernaturalforeststhannon‐forest
land uses (for smallwatersheds orwith high differences in forest cover). The results showno
significantdifferences in storm flowbetweenwatershedsunder natural forestsandnon‐forest
landuses.Regardingplantedforests, theresultsshowedthattheyreducedbaseflowandtotal
flowandhadnosignificanteffectonstormflowcomparedtonon‐forestlanduses.Theseresults
highlight that the effects of natural or planted forests on water flows are not the same as
perceivedbysomedecisionmakers.Meta‐analysescanhelpcorrectmisunderstandingsandshow

42
that some of the effects of natural or planted forests on water flows are unclear, and that
inappropriategeneralizationsshouldbeavoided(Tognettietal.,2004).
2.3.5Limitations
Themeta‐analysesfacedseveral limitations.First, thesmallnumberofavailablestudies limited
thenumberofsignificantdifferencesandpreventedfromtaking intoaccountother factors, for
instancesoilcharacteristics,geology,topography,rainfallpattern,locationofland‐usechangein
thewatershed and landmanagement in non‐forest land areas,which are important factors in
explaining the difference in water flows between forested and non‐forested watersheds
(Bruijnzeel, 2004; Aylward, 2005). Applyingmeta‐analyses in a rigorousway is difficult with a
smallnumberofstudies,especiallywithregardstothesensitivityanalysiswhichisconductedon
subsamplesofthedataset.Thefollowingresultswerediscardedbythesensitivityanalysis:more
base flow in watersheds under natural forests than under non‐forest land uses (with all
watersheds),lessstormflowinwatershedsundernaturalforeststhanundernon‐forestlanduses
(onlywithwatershedswhereforestcoverdifferedbymorethan50%ofthewatershedarea),and
lessstormflow inwatershedsundernatural foreststhanundernon‐forest landuses(onlywith
smallwatersheds).
Second, the available studies had beenmostly conducted in humid areas and in some forest
types (e.g., no cloud forests or planted forests with species other than of the Pinus and
Eucalyptus genera). For these reasons, the results cannot be generalized to the entire tropics.
Third,theavailablestudiesuseddifferentmethods(e.g.forseparatingbaseflowandstormflow)
anddifferenttimeperiodsforcalculatingflow‐rainfallratios.Amorethoroughanalysisoforiginal
hydrologicaldatawouldbenecessarytoextendoursimplifiedmeta‐analyses.
2.4Conclusions
Meta‐analysisappearstobeapromisingwaytocombineresults fromstudiescomparingwater
flowsbetweentropicalwatershedsundernaturalorplantedforestsandnon‐forestlanduses.It
canhelpdecisionmakersunderstandtheeffectsofforestsonwaterflows,andalsohighlightthe
effects that remain unclear. This help is necessary because even though hydrologists have
published many narrative reviews about these effects, not all economists or decision makers
have attempted to integrate this knowledge into the process of determining the value of

43
hydrological ecosystem services or formaking decisions. Themeta‐analyses show significantly
lowertotal flowsorbaseflowsunderplanted foreststhannon‐forest landuses.Meta‐analyses
conductedwithsubsamplesofthedataalsoshowlowertotal flowandhigherbaseflowunder
natural forests than non‐forest land uses. However, the available studies were restricted to
humid climates and particular forest types (Pinus and Eucalyptus planted forests and lowland
naturalforests).
The small number of available studieswith sufficient data is amajor constraint in the use of
meta‐analysis foranalyzingtheeffectsofnaturalorplantedforestsonwater flows. It impedes
analyzing the interacting effect of important factors for water flow regulation, such as soil,
geology, topography, or land management practices. Furthermore, the available studies with
sufficientdataare restricted to some local conditionsor forest typesandknowledge is lacking
aboutdryareas,cloudforests,nativespeciesplantations,andplantationsondegradedlands.
The lack of measurements of water flow under different land‐uses and of empirical data on
hydrologicalservicesrepresentsamajortechnicalchallengeforvaluationstudiesorpaymentfor
ecosystemservices(KremenandOstfeld,2005),especiallyincountrieswherefinancialresources
for implementing field research are scarce. More empirical data on underrepresented local
conditions or forest types and a facilitated access to hydrological data would be valuable for
watershedmanagersanddecision‐makers.Analyzingoriginaldataaboutwaterflows,climateand
watershedcharacteristicsinaconsistentwaycouldimprovefurtherapplicationofmeta‐analysis.
2.5References
Andreassian, V., 2004. Water and forests: from an historical controversy to scientific debate. Journal ofHydrology,291:1‐27.
Aylward, B.,2005.Landuse,hydrological functionandeconomic valuation. In:M. BonellandL.A.Bruijnzeel(eds.),Forests,WaterandPeople intheHumidTropics:Past,presentandfuturehydrologicalresearchforintegratedlandandwatermanagement.CambridgeUniversityPress,pp.99‐120.
Bailly, C., Benoit de Coignac, G., Malvos, C., Ningre, J.M. and Sarrailh, J.M., 1974. Etude de 1'influence duconvert naturel et de ses modifications à Madagascar. Cahiers Scientifiques du Centre TechniqueForestierTropicalNo.4,Nogent,France,114pp.
Bergkamp,G.,Orlando,B.Burton,I.,2003.AdaptationofWaterManagementtoClimateChange.IUCN,Gland,Switzerland.
BestA,ZhangL,McMahonT,WesternA,VertessyR.2003.Acriticalreviewofpairedcatchmentstudieswithreferencetoseasonalflowsandclimatevariability.Murray‐DarlingBasinCommission,Canberra,Au.
Bewket,W.,Sterk,G.,2005.Dynamics in landcoveranditseffectonstreamflowintheChemogawatershed,BlueNilebasin,Ethiopia.HydrologicalProcesses,19:445–458.

44
Blackie, I.R.,1972.HydrologicaleffectsofachangeinlandusefromrainforesttoteaplantationinKenya.In:Proceedings of Symposium on the Results of Research on Representative and Experimental Basins,Wellington,NZ,IAHSPublicationNo.97,pp.312‐329.
Bonell, M., Bruijnzeel, L.A.,. 2005. Forests, water and people in the humid tropics: past, present and futurehydrological research for integrated land and water management. International Hydrology Series,CambridgeUniversityPress.
Bonell, M., 1998. Possible effects of climate variability and change on tropical forest hydrology. Climaticchange,39:215‐272.
Bosch, J.M, Hewlett, J.D. 1982. A review of catchment experiments to determine the effect of vegetationchangesonwateryieldandevapotranspiration.JournalofHydrology,55:3‐23.
Bradshaw,C.J.A.,Sodhi,N.S.,Peh,K.S.H.,Brook,B.W.,2007.Globalevidencethatdeforestationamplifiesfloodriskandseverityinthedevelopingworld.GlobalChangeBiology,13:1‐17.
Bruijnzeel, L.A., 1990. Hydrology of moist tropical forests and effects of conversion: a state of knowledgereview.UNESCO,Paris,230pp.
Bruijnzeel,L.A.,2004.Hydrologicalfunctionsoftropicalforests:notseeingthesoilforthetrees?.Agriculture,EcosystemsandtheEnvironment,104:185‐228.
Bruijnzeel,L.A.;Calder,I.R.;Vertessy,R.A.,2004.Foresthydrology:impactsofforestconversiononstreamflow.In:J.Burley,J.EvansandJ.A.Youngquist(eds.),TheEncyclopediaofForestSciences.Oxford,Elsevier,pp.350‐358.
Calder, I.R.,2002.Forestsandhydrologicalservices:reconcilingpublicandscienceperceptions.LandUseandWaterResourcesResearch,2:1‐12.
Chandler,D.G.,Walter,M.F.,1998.Runoffresponsesamongcommon landuses intheuplandsofMatalom,Leyte,Philippines.TransactionsoftheASAE,41(6):1635‐1641.
Chomitz,K.,Kumari,K.,1996.Thedomesticbenefitsoftropicalforests.PolicyResearchWorkingPaper1601,WorldBank,Washington,D.C.
Cooper,H.,Hedges,L.V.(eds.),1994.TheHandbookofResearchSynthesis.RussellSageFoundation,NewYork,573pp.
Costa,M.H., Botta, A.,Cardille, J.,2003. Effectsof large‐scalechanges in land coveron thedischargeof theTocantinsRiver,SoutheasternAmazonia.JournalofHydrology,283(1):206‐217.
Critchley, W.R.S., Bruijnzeel, L.A., 1996. Hydrological impacts of conversion of moist tropical forests toagricultureandplantations.IHPHumidTropicsProgrammeseriesnº10,UNESCO,Paris,50pp.
Dagg,M., Blackie, J.R., 1965. Studies of the effects of changes in land use on the hydrological cycle in EastAfricabymeansofexperimentalcatchmentareas.BulletinoftheInternationalAssociationofScientificHydrology,10(4):63‐75.
DeichmannU., Eklundh L., 1991. Global digital data sets for landdegradation studies: a GIS approach.GRIDCaseStudySeriesNo.4;UNEP/GEMSandGRID;Nairobi,Kenya;103p.(dataavailableat:http://www‐cger.nies.go.jp/grid‐e/gridtxt/hind_geo.html).
DudleyN.,StoltonS.,2003.Runningpure:theimportanceofforestprotectedareasfordrinkingwater.WorldBank,WashingtonD.C.,114p.
FAO, 2004. Payment schemes for environmental services in watersheds: regional forum, 9‐12 June 2003,Arequipa,Peru.LandandWaterDiscussionPapernº3,FAO,Roma,88pp.
FAO,2007.Forestvaluationdatabase.DevelopedundertheEC‐FAOPartnershipProgrammeonDataCollectionandAnalysis.FAO,Romaaccessedon19April2007www.fao.org/forestry/valuation
FAO,CIFOR,2005.Forestsandfloods:Drowninginfictionorthrivingonfacts?ForestPerspectivesSeriesnº2,CIFOR,Bogor,Indonesia,40pp.
Farley, KA, Jobbagy, EG, Jackson, RB., 2005. Effects of afforestation on water yield: a global synthesis withimplicationsforpolicy.GlobalChangeBiology,11:1565‐1576.
Fernandez‐Duque,E.,Valeggia,C.,1994.Meta‐analysis:avaluabletoolinconservationresearch.ConservationBiology,8(2):555‐561.

45
Fritsch, J.M., 1983. Modifications des écoulements après défrichement et aménagements agro‐forestiers debassins versants expérimentaux en Guyane française. In: Le Projet ECEREX (Guyane) : analyse del'écosystème forestier tropical humide et des modifications apportées par l'homme. Journées deCayenne,Cayenne(GF),ORSTOM,Paris,p.260‐304.
Fritsch,J.M.,1992.Leseffetsdudéfrichementdelaforêtamazonienneetdelamiseenculturesurl’hydrologiedespetitsvassinsversants.ORSTOMéditions,Paris,392pp.
Fujieda, M.; Kudoh, T.; deCicco, V.; Calvarcho, J.L. 1997. Hydrological processes at two subtropical forestcatchments:theSerradoMar,SaoPaulo,Brazil.JournalofHydrology,196:26‐46.
Goujon, P., Bailly, C., de Vergnette, J., Roche, P., 1968. Essai de mise en valeur agricole par aménagementrationneldesbassinsversants: lepérimètredeManankazosur leshautsplateauxmalgaches.BoisetForêtsdesTropiques,121:19‐34.
Guillemette, F, Plamondon, AP, Prevost, M, Levesque, D., 2005. Rainfall generated stormflow response toclearcutting a boreal forest : peakflow comparison with 50 world‐wide basin studies. Journal ofHydrology,302:137‐153.
Guo, Z., Xiao, X., Li, D., 2000.An assessment of ecosystem services: water flow regulation andhydroelectricpowerproduction.EcologicalApplications,10(3):925‐936.
Gurevitch,J.,Curtis,P.S.,Jones,M.H.,2001.Meta‐analysisinEcology.AdvancesinEcologicalResearch,32:199‐247.
HulmeP.2005.Adaptingtoclimatechange: istherescopeforecologicalmanagement inthefaceofaglobalthreat?JournalofAppliedEcology,42:784‐794.
Ilstedt,U.,Malmer,A.,Verbeeten,E.,Murdiyarso,D.,2007.Theeffectofafforestationonwater infiltrationinthetropics:Asystematicreviewandmeta‐analysis.ForestEcologyandManagement,251(1‐2):45‐51.
Kaimowitz,D.,2005.UsefulMythsandIntractableTruths:thePoliticsoftheLinkBetweenForestsandWaterinCentral America. In: M. Bonell and L. A. Bruijnzeel (eds.), Forests,Water and People in the HumidTropics: Past, present and future hydrological research for integrated land andwatermanagement.CambridgeUniversityPress,pp.86‐98.
Kosoy,N.,Martinez‐Tuna,M.,Muradian, R.,Martinez‐Alier, J.,2007. Payments for environmental services inwatersheds:InsightsfromacomparativestudyofthreecasesinCentralAmerica.EcologicalEconomics,61(2‐3),446‐455.
Kremen,C.,Ostfeld,R.S.,2005.A call to ecologists:measuring,analyzing,andmanaging ecosystemservices.FrontEcolEnviron,3(10):540‐548.
Lal,R.,1997.DeforestationeffectsonsoildegradationandrehabilitationinwesternNigeria.IV.Hydrologyandwaterquality.LandDegradationandDevelopment,8(2):95‐126.
Mathur,H.N., Babu, R., Joshie, P.andSingh, B., 1976.EffectofClearfellingandReforestationonRunoffandPeakRatesinSmallWatersheds.IndianForester,102(4):219‐26
Millennium Ecosystem Assessment, 2005. Ecosystems and Human Well‐being: Synthesis. Island Press,Washington,DC.,137pp.
Miranda,M.,Dieperink, C.,Glasbergen, P.,2007.Voluntaryagreements inwatershedprotection experiencesfromCostaRica.Environment,DevelopmentandSustainability,9(1):1‐19.
Mungai, D.N., Ong, C.K., Kiteme, B., Elkaduwa, W., Sakthivadivel, R., 2004. Lessons from two long‐termhydrologicalstudiesinKenyaandSriLanka.Agriculture,EcosystemsandEnvironment,104(1):135‐143.
Mwendera,E.J.,1994.EffectonthewateryieldoftheLuchelemucatchmentinMalawiofreplacingindigenousgrasseswithtimberplantations.ForestEcologyandManagement,65(2‐3):75‐80.
Oki,T.,Kanae,S.,2006.Globalhydrologicalcyclesandworldwaterresources.Science,313:1068‐1072.Pagiola,S.,2008.PaymentsforenvironmentalservicesinCostaRica.EcologicalEconomics65,713–725.Pattanayak, SK., 2004. Valuing watershed services: concepts and empirics from Southeast Asia. Agriculture,
EcosystemsandEnvironment,104:171‐184.

46
Raghunath, B., Das, D. C., Thomas., P. K., 1970. Some results of investigations on hydrology of the sub‐watersheds in the Nilgiris (India). In: Proceedings of Symposium on the Results of Research onRepresentativeandExperimentalBasins,Wellington,NZ.,IAHSPublicationnº96,pp.416‐440.
Sahin,V.,Hall,M.J.,1996.Theeffectsofafforestationanddeforestationonwateryields.Journalofhydrology,178:293‐309.
Samraj, P., Sharda, V.N., Chinnamani, S., Lakshmanan, V., Haldorai, B., 1988. Hydrological behaviour of theNilgirisub‐watershedsasaffectedbybluegumplantations,PartI.Theannualwaterbalance.JournalofHydrology,103(3‐4):335‐345.
Scott,D.F.,Bruijnzeel,L.A.,Mackensen,J.,2005.Thehydrologicalandsoilimpactsofforestationinthetropics.In:M.BonellandL.A.Bruijnzeel(eds.),Forests,WaterandPeopleintheHumidTropics:Past,presentand future hydrological research for integrated land and water management. Cambridge UniversityPress,pp.622‐651.
Scott,D.F.;Bruijnzeel,L.A.;Vertessy,R.A.;Calder,I.R.2004.Foresthydrology:impactsofforestplantationsonstreamflow. In: J. Burley, J. Evans and J.A. Youngquist (eds.), The Encyclopedia of Forest Sciences.Oxford,Elsevier,pp.367‐377.
Shadish,W.R.,Haddock,C.K.,1994.Combiningestimatesofeffectsize. In:H.Cooper,L.V.Hedges(eds.).TheHandbookofResearchSynthesis.RussellSageFoundation,NewYork,pp.261‐281.
Sharda, V. N., Samraj, P., Samra, J.S., Lakshmanan, V., 1988. Hydrological behaviour of the Nilgiri sub‐watersheds as affectedby blue gumplantations, Part II.Monthlywater balances at different rainfallandrunoffprobabilities.JournalofHydrology,103(3‐4):347‐355.
Sikka,A.K.,Samra,J.S.,2003.Lowflowandhighflowresponsestoconvertingnaturalgrasslandintobluegum(Eucalyptusglobulus)inNilgiriswatershedsofSouthIndia.JournalofHydrology,270(1‐2):12‐26.
SmakhtinV.U.,2001.Lowflowhydrology:areview.JournalofHydrology240:147‐186.Susswein,P.M.,vanNoordwijk,M.,Verbist,B..,2001.Forestwatershedfunctionsandtropicallandusechange.
Towardsintegratednaturalresourcemanagementinforestmarginsofthehumidtropics: localactionand global concerns. ASB Lecture Note 7. International Centre for Research forAgroforestry, Bogor,Indonesia,38pp.
Tognetti,S.S.,Mendoza,G,Aylward,B.,Southgate,D.,Garcia,L.,2004.Aknowledgeandassessmentguidetosupportthedevelopmentofpaymentarrangementsforwatershedecosystemservices.WorkingPaper.EnvironmentDepartment,WorldBank,Washington,DC.
UNESCO, WMO, 1992. International glossary of hydrology. Paris, United Nations Educational Scientific andCulturalOrganization;Geneva,WorldMeteorologicalOrganization,1992.
vanNoordwijk,M.,Poulsen, J.G.,Ericksen,P.J..,2004.Quantifyingoff‐site effectsof land‐use change: filters,flowsandfallacies.Agriculture,EcosystemsandEnvironment,104:19‐34.
Vanclay, J.K.,2009.Managingwateruse fromforest plantations.ForestEcologyandManagement257:385–389.
Vertessy, R.A., Watson, F.G.R., O'Sullivan, S.K., 2001. Factors determining relations between stand age andcatchmentwaterbalanceinmountainashforests.ForestEcologyandManagement,143:13‐26.
Waage, S., Bracer, C., Inbar,M., 2008. Payments for EcosystemServices:Getting started. Forest Trends, theKatoombaGroup,UNEP,WashingtonDC.
Wilk,J.,Andersson,L.,Plermkamon,V.,2001.HydrologicalimpactsofforestconversiontoagricultureinalargeriverbasininnortheastThailand.HydrologicalProcesses,15(14):2729‐2748.
Wunder, S., 2005. Payments for environmental services: some nuts and bolts. Occasional Paper 42, CIFOR,Bogor,Indonesia,32pp.
Wunder,S.,Albán,M.,2008.Decentralizedpaymentsforenvironmentalservices:ThecasesofPimampiroandPROFAFORinEcuador.EcologicalEconomics,65:685‐698.
Wunder, S., Engel S., Pagiola S., 2008. Taking stock: A comparative analysis of payments for environmentalservicesprogramsindevelopedanddevelopingcountries.EcologicalEconomics65:834‐852.

47
Zhou, G.Y., Morris, J.D., Yan, J.H., Yu, Z.Y., Peng, S.L., 2002. Hydrological impacts of reafforestation witheucalypts and indigenous species: a case study in southernChina. Forest Ecology andManagement,167(1):209‐222.

48

49
3. Decision making by farmers regarding ecosystem services: factors affecting soil conservation efforts in Costa Rica
Paperpublished:VignolaR.,Koellner,T.,ScholzR.W.,McDanielsT.L.,2009.Decision‐makingof
upstream farmers for targeting policies on ecosystem services: cognitive and socio‐economic
variablesforsoilregulationservicesinCostaRica.LandUsePolicy27,1132‐1142
Abstract
Theimpactofclimatechangeonfarmsoilsinthetropicsisthecombinedresultofshort‐termsoil
management decisions and expanding precipitation extremes. This is particularly true for
cultivated lands located in steeply slopingareaswherebare soil isexposed toextreme rainfall
suchastheBirriswatershedinCostaRica.Farmersinthiswatershedareaffectedby increasing
degradation of soil regulation services and respondwith different level of efforts to conserve
their soils. This paper examines influences on farmers’ decisions through a survey involving
interviews with a sample of farmers (n = 56) to test hypotheses on how a combination of
cognitivevariables(beliefs,riskperception,values)andsocioeconomicvariablesshapedecisions
onsoilconservation.Resultsshowthatfarmers’awarenessoftheirexposureleveltosoilerosion
combineswithothervariables todetermine their level of soil conservation.Usingdiscriminant
analysis,threegroupsoffarmerswereidentifiedbasedontheirsoilconservationefforts.ANOVA
pairwise‐comparisonamong thesegroups showedsignificantdifferences in respect to levelsof
awareness, perception of risk, and personal beliefs along with territorial exposure and
participation in soil conservation programs. Our results help to understand farmers’ complex
decision‐makingonsoilconservationandhelpdesigningpoliciestosupporttheprovisionofsoil
regulation services especially in areas highly exposed to increasing frequency of extreme
precipitationeventssuchasCentralAmerica.
Keywords:Soilregulationservices,cognitivevariables,Farmersdecision‐making,CostaRica
3.1Introduction
Soil erosion, land use and water management are highly interlinked. In Central America,
unsustainableuseofmarginal lands iswidespreadandhascausedseveresoilerosion,which in
turn reduces productivity of soils in upstream areas (Pimentel et al., 1995) and, downstream,

50
water quality regulation services (Southgate andMacke, 1989; Lutz et al., 1994a; Guo et al.,
2000). Inaddition to theseanthropogenic factors,precipitationdistributionplaysan important
roleinerosion.AccordingtothemodelofWischmeierandSmith(1978),extremerainfallevents
interact with high sloping and unprotected soils, increasing kinetic potential of raindrops to
remove soilparticles increasingerosionand sedimentationdownstream.ForCentralAmericaa
significantincreaseinintensityandfrequencyofextremeprecipitationeventshasbeenobserved
(Aguilaretal.,2005)andisprojectedtoincreasefurther(Magrinetal.,2007).
Exposure to precipitation extremes and the high susceptibility of soils to erosion due to
questionablemanagementmakethisregionhighlyvulnerabletoclimatechange.TheCostaRican
MinistryofEnvironmentestimatedthatreducedsoil fertilityandsoilerosion,partlyduetothe
human and natural factors described above, caused a 7.7% reduction in agricultural Gross
Domestic Product from 1970 to 1989 (MINAE, 2002). Moreover, the National Commission on
LandDegradation(CADETI,2002)estimatesthat20%ofagriculturallandisseverelyover‐utilized
due topoormanagementpracticesasa resultof short‐term responses toproductiveneedsof
farmers.
Policies and development programs to foster soil conservation in vulnerable watersheds of
tropicalcountries likeCostaRicausetools likedirecteconomic incentivessuchasthePayment
for Ecosystem Services (PES) scheme (Pagiola, 2008;Wunder et al., 2008). However, adoption
rates of conservation practices in Costaricanwatershedswhere intensive andmarket‐oriented
agriculturalactivitieshavecausedlargedeforestationandsoilsarepronetointenseerosionare
low (Abreu, 1994). This is the case of the Birris watershed where other factors than direct
payments are influencing farmers proneness to adopt soil conservation practices. Here, PES
schemesneedtocomplementexistingdirectincentiveswithotherstrategiestoachieveintended
additionality.Ananalysisofinstitutionalandcognitiveaspectsassociatedwithsoilconservation
cangiveinsightstothedesignofsuccessfulprograms(SWCS,2003).
Thereasonforthatisthatoftenthecost‐effectivenessofsoilconservationprogramsdependson
whether erosion is considered only for its off‐site effects or also for on‐site effects (i.e. in the
lattercasefarmersmighthaveadirectpersonalincentivetoimplementvoluntaryconservation)
(WossinkandSwinton,2007;DaleandPolanski,2007).Soilconservationprogramsshould,then,
use complementary tools to foster adoption of adequate practices among farmers. This paper

51
intendtoprovideinputstothedesignofappropriatesoilconservationprogramwhileanalyzing
thecomplexityofsocioeconomicandcognitivevariablesthatinfluencefarmers’decision‐making
forsoilconservation.
The objective of this paper is to analyze how cognitive and socioeconomic variables influence
farmers’decisionsregardingtheirmanagementofsoils.Morespecifically,wetesthypotheses,in
ourcasestudy,concerningtheinfluenceofcognitive,exposure,andsocioeconomicvariableson
farmers’ adoption of soil conservation practices.We test the following null hypotheses: i) risk
perceptionofnaturalandanthropogenicactivities,andknowledgeofthefactorscausingerosion;
ii) traditional socioeconomic variables (farm size, tenure, education, economic status); and iii)
landcharacteristics,suchaslocationinhighriskareas,consideredindividuallyandtogether,have
noeffectonsoilconservationdecisions.
This paper is organized in the following manner. Section 2 discusses the decision‐making
processesoffarmersrelatedtosoilconservationreferringtopreviousliteraturefindings.Section
3 presents the case study, and describes themodel and themethods. Section 4 presents the
results in terms of a series of analytical steps and the construction of cognitive variableswith
factoranalysis.Section5providesdiscussion,followedbyconclusionsinSection6.
3.2Farmers’Decision‐MakingforSoilConservation
A large body of literature has analyzed farmers’ decision‐making to inform the design of soil
conservationprograms.Econometric studiesbasedon farmers’monetaryutility functionshave
beenwidelyused to studyadoptionof soil conservationpractices (FeatherstoneandGoodwin,
1993;InnesandArdila,1994;Souleetal.,2000;IllukpitiyaandGopalakrishnan,2004;Leyvaetal.,
2007).Neo‐classicaldecisionmodelsassumingmaximizationhavebeencritizedbysomewriters
as inappropriate for modeling behaviour in real world decisions since strong assumptions on
cognitiveaspectsarerequired(e.g.accesstoperfectinformation,influenceofsocialcontext,and
individuals’andsocialpsychologicalcharacteristics) (VanderBerghetal.,2000).Theseauthors
alo suggest that especially in developing countries, a changed behavioural economics that
includesecologicalandpsycho‐socialdimensionsofagricultureisemerging.
Societal responsetoreduce increasingvulnerabilitytoerosion requiresphysicalassessmentsof
erosionprocessesbutalsoananalysisof institutionalandcognitiveaspectsassociatedwiththe

52
problemanditssolution(SWCS,2003;GrothmannandPatt,2005;Parryetal.,2007).Thereason
for that is thatoften thecost‐effectivenessof soil conservationprogramsdependsonwhether
erosion isperceivedonly for itsoff‐siteeffectsoralso foron‐siteeffects (i.e. in the latter case
farmers might have a direct incentive to implement voluntary conservation) (Wossink and
Swinton,2007).Indeed,actionsdirectedtoimprovesoilregulationhavethepotentialtobenefit
other societal sectors. For example, soilmanagement practices such as using low soil‐removal
ploughscanreducesoilerosionbutalsoincreasewaterinfiltration(Swintonetal.,2007;Daleand
Polanski,2007).
Whenstudyingfarmers’conservationbehaviour, theperceptionofuncertaincostsandbenefits
ofconservationpracticesisalsorelevant.Asprospecttheory(TverskyandKahneman,1974)and
other theories indicate, decision‐making under uncertainty is influenced by cognitive aspects
such aswhat is considered a loss or gain, experience, individual values and a series of beliefs
aboutthefunctioningofthesysteminwhichdecisionsaremade.
Tostudyfarmers’voluntaryconservationefforts,Gouldandcolleagues(1989)usedathreephase
decision model: identifying the problem, deciding on adoption and determining the level of
effort.Theseauthorsfoundthat,forsocioeconomicvariables,theeffectoffarmsizeonadoption
of soil conservation practices was negative while that of income was positive. In the case of
cognitivevariables, theperceptionof severityof impactsof soil erosionwaspositive. Similarly,
Lynne et al. (1988) combined psychological variables measuring attitudes, with economic
variables, such as income and tenure. In theirmodel, attitudeswere used as an expression of
expectedvalueattachedtoagivenconservationactivity.Theseauthorsfoundthatcognitiveand
psychologicalvariablessuchasbeliefsonconservationofand responsibilityonmanagementof
soilhadapositiveeffectonadoptionofsoilconservationpractices.
Along the same line, theon‐siteperceivedeffectsof conservationbehaviourwereanalyzedby
Traoreetal.(1998),whoconfirmedthatperceptionofenvironmentalproblemsbyfarmerswas
correspondedbyahigheradoptiondegreeofenvironmental‐friendlyagriculturalpractices,while
socioeconomicvariablesliketenureandfarmsizewerenotsignificant.
The role of risk perception, beliefs, values and socioeconomic variables in farmers’ decision‐
making on soil conservation has been a concern of environmental policies to address climate
changethreats.Riskperception,environmentalvalues(cost‐benefitexpectancy)andbeliefs(i.e.

53
knowledge base) have different explanatory power for decisions that address environmental
change(O’Connoretal.,1999;SiegristandGutscher,2006).Forexample,LeeandZhang(2005)
used psychometric measurements to analyze farmers’attitudes and risk perceptions of land
degradationalongwithsocioeconomicvariables.Theseauthorsmeasuredtheriskperceptionsof
farmersfortheeffectsofgrazing,openingupfarmland,cuttingtreesforfuel‐woodanddigging
upalocaltraditionalplantonlanddegradation.Typeofoccupationandagehaveapositiveeffect
on awareness of land degradation and on the perception of its impacts. Farmers perceive the
existence of different ecological risks associated with land degradation activities although
significant misconceptions on land degradation causes and impacts exist among farmers’ and
experts’knowledge.
Another approach, utilized by Bayard and Jolly (2007), adapted the Health Belief Model as a
modifiedversionofAjzen’stheoryofPlannedBehaviour(1991).Intheirapproach,psycho‐social,
physical and economic constructs were used to measure persons’ beliefs about costs and
benefitsofagivenbehaviourwhichdetermine intentionandsoilconservationbehaviour.More
specifically, four components associated with the risk of soil degradation were included:
perceived susceptibility (e.g. exposure); perceived severity (e.g. size of impacts); perceived
benefits(privatevspublic),andbarriers(e.g.perceivedbehaviouralcontrol).Thefindingsconfirm
that awareness of the problem has a positive effect on soil conservation behaviour, while
attitudes had no significant effect. On the other side, awareness is positively influenced by
farmers’higherperceptionofseverityandsusceptibilityofsoildegradationrisk.
Explicitly accounting for climate change risk, Grothmann and Patt (2005) used the Private
Proactive Adaptation to Climate Change decision model. In this model, farmers’ access to
resources,institutionalbarriers,experience,theperceptionofprobabilityandseverityofclimate‐
related events and, finally, perceived capacity to respond were determinants in farmers’
adoptionofresponsivebehaviour.Theseauthorsappliedqualitativelytheirmodeltothecaseof
farmers’ adoption of climate forecast information in their farming decisions. They could show
that there is inconsistency among farmers’ and experts’ assessment of risk and that low
perceived self‐adaptive capacity hinder adoption of risk‐preventive behaviour. In Central
America, farmers’ soil conservation decisions have been studied mainly from a traditional

54
utilitarianperspective,withsomeexceptionsfoundintherecompilationofCentralAmericacase
studiesoneconomicandinstitutionalanalysisofsoilconservationprojects(Lutzetal.,1994).
Noneoftheseregionalstudiesanalyzedtheinfluenceofriskperceptionsandbeliefsconcerning
anthropogenic activities and natural events as determinants of preventive behaviour of soil
erosioncontrol.Considering theconcernsof the international communityandnationalpolicies
onreducingthepotential impactsofclimatechange, it is relevanttoexplorehowandwhether
riskandcausesofsoilerosionareperceivedandwhethertheseinfluencefarmers’conservation
effortsinahighlyvulnerableregion.
3.3Methods
3.3.1Descriptionofthearea
TheBirris (coordinates 9.9o N, 83,8oW) is a sub‐watershed of the ReventazonRiver in central
CostaRicaflowingintotheCaribbean,andis4800hectaresinsize.Thewatershedisinfluenced
by the Caribbean climate, with 2325 mm average annual rainfall of which about 80% is
concentratedintheperiodfromMaytoDecember.Thetopographyischaracterizedbyslopesof
up to 70 %, especially in the upper part of the watershed. The population density is 161
inhabitantspersquarekilometer(i.e.abovethenationalaverage;INEC,2002);mostinhabitants
arelocallybornandthemajority(61%)areinvolvedinagriculture(ICE,2000).
Large‐scalelandconversionofthecloudforestintheBirriswatershedstartedinthe1960swhen
horticulture and dairy‐cattle pastureswere established. Intensive soil use for horticulture (217
producersofpotato,cabbageandcarrotswith2.5haaveragefarmsize)anddairy‐cattlepastures
(122producerswith5to7haaveragefarmsize), is foundmainly inriparianareas.Agriculture
andinfrastructureshavereducedthecoveroftropicalcloudforestto28%ofthetotallandarea
in the watershed. This intense process of forest fragmentation and intensive agricultural
production makes this area one of the largest sediment‐producers in the country (Sanchez‐
Azofeifaetal.,2002).Averageerosionratesgrewfrom12ton/ha/yrpriorto1978,whenonly15%
ofthewatershedwasunderhorticulture, to42ton/ha/yr in1992(Abreu,1994).However, the
effect of these high levels of erosion is only visible in some areas3, since deep andosols are
3Thatis,probablyonlysomefarmersarestartingtoperceiveitsdirectimpactsoferosion.

55
common inthearea(Lutzetal., 1994b;MarchamaloandRomero,2007).TodatetheNational
ElectricityInstitute(ICE)yearlyspendsmorethanfourmillionUS$tocleanitsdamsandaround
threehundredthousandUS$topromotethesoilwatershedmanagementplan.Ontheotherside
theministryofagricultureprovideshumanand logistic resources topromote soil conservation
practicesinupstreamareas.Here,arecentestimationoftherepositioncostofsoilnutrientslost
witherosioncorrespondstoninety‐fivethousandsUS$ayear(Vignolaetal.,2010).
3.3.2SampleandSurveyInstrumentDesign
To develop the survey instrument we conducted two focus groups and interviews with key
informants(farmersandagriculturalextensionofficers)toidentifyaspectstobeincludedinthe
analysisoffarmers’adoptionofsoilconservationpracticesintheBirriswatershed.Additionally,
we also reviewed instruments applied in previous farmers’ adoption studies that analyzed
attitudesandvaluesrelatedtosoil conservation (seesection3.3).Wereviewedquestionswith
agriculturalextensionofficerstoensurethattheywouldbeeasilyunderstoodbyfarmers.Apilot
testwasconductedwithfivefarmerstofurtherclarifyquestions.
Oursample(n=56;N=300)iscoveringaround18%ofallfarmersinthewatershedandissimilar
to that of previous studies similar studies (n = 64; Bewket, 2007). Three lists of producers
availablefromthelocalagricultureextensionofficewereusedforastrata‐proportionalselection
offarmerscorrespondingtothreecategoriesofproducerspresentinthewatershed:horticulture
anddairy‐cattle ( )10n = ,horticultureonly ( )35n = anddairy‐cattleonly( )11n = .Producerswere
visited in the field or at home andwere administered by pre‐trained interviewers a half‐hour
structured interview consisting of the following sections: i) soil conservation practices
implemented; ii)perceptionof farmsoilquality; iii) risk factors contributing to soil erosion; iv)
values that influence soil conservation decisions; and, finally v) questions regarding socio‐
economicdata.
3.3.3TheDecisionModel
Building on Bayard and Jolly (2007), we propose the followingmodel of farmers’ decisions to
adoptsoilconservation:
( ), , ,CD f B RP V SE= ,

56
wheresoilconservationdecisions ( )CD dependonthreetypesofindependentvariablessuchas
theirbelief/knowledge( )B , theirriskperceptions( )RP ,values ( )V andasetofsocio‐economic
characteristics ( )SE .Thismodelservedasthebasisoftheresearchdesigndiscussedbelow.
To measure farmers’ soil conservation behaviour we used secondary literature and key
informants (e.g.agriculturalextensionofficersandmembersof farmersassociations)tobuilda
list of conservation practices that are promoted by existing extension programs or by farmers
themselves in thewatershed (ICE,2000;Marchamalo, 2004).The listof conservationpractices
includes planting of trees, cultivation along contour lines, use of water and soil conservation
channels,naturalregenerationofvegetation incriticalareas,amongothers. Weconstructeda
binaryvectorforeachpracticebyaskingrespondentstomarkthosepracticesonthelistthatthey
wereimplementingwhentheinterviewswereconducted.
We then constructed for each farmer i the dependent categorical variable soil conservation
effortCE(i) = 1 forloweffort,CE(i) = 2 formediumeffort,andCE(i) = 3 forhigheffort.Todo
this,wefirsthavetoconsiderthattherearedifferentnumbersofpossibleprotectionpractices
Pj(i) foreachproductivecategory j ( j = 1 forcattlebreeding; j = 2 forhorticulture, j = 3 for
bothpractices).Forafarmer i belongingtoproductioncategory j ,wecalculatetheconservation
score:
YConsj(i) =
P(i)
Tj
,
where P(i) is the total number of practices implemented by the farmer i and Tj is the total
numberofpossiblepracticesforproductivecategoryj.Theconservationscorevariablewasused
to define CE(i) by: (1)CE if less than half of the protection practices are applied (i.e. if
YConsj(i) < 0.5 ); (2)CE ifmore thanhalf andup to75%of theproductionpracticesareapplied
(i.e. if 0.5 ! YConsj(i) ! 0.75 );and (3)CE ifmorethanthree‐quartersofallpossiblepracticesare
applied(i.e.if 0.75 < YConsj(i) ).
Cognitivevariables

57
Wedrawonsimilarstudies(Bewket,2007)thatusedexplanatoryvariablesoffarmers’decisions
toimplementsoilconservation,suchasawarenessandperceptionoferosionhazard,itscauses
andcontrollability.Inthissection,weexplorekeyconceptsunderlyingthesecognitivevariables.
Farmers’beliefs ( )B guidetheirunderstandingandevaluationofcausesandsolutionsassociated
witherosioncontrol(D’emdenetal.,2008).WefollowedtheapproachofWagner(2007),who
usedmentalmodelquestionstoelicitlay‐people’sbeliefsoncausesofflashfloods,andBewket
(2007) who asked farmers about their beliefs on causes of soil erosion. Rankings on the
importance of five degradation activities reported by recent studies (ICE, 2000; Marchamalo,
2004; Ramirez, 2008) were used, namely: deforestation, agricultural practices, extreme
precipitation,urbanization,anddairycattlepastures.Wealsoaskedquestionsonwhetherthey
perceive that the “general health”4 of their soil has changed from the past andwhether they
think itwill change in the futureasaway tomeasure their judgmenton thecontinuityof the
erosion problem over time. Additionally, perceptions on the positive role of trees in erosion
controland riparianprotection,as recognized inthe literature(Tejwani1993;Bruijnzeel,2004)
andpromotedbysoilconservationprograms,weremeasured.
Risk perception ( )RP was measured following the psychometric paradigm which allows
identification of differences in perceptions among groups of individuals (Slovic, 1987). In this
paper, risk perceptionmerely denotes the cognitive representation and evaluation of negative
impacts resulting from a given activity that changes the environment. Risk of erosion can be
definedasconsequence‐relatedriskthat,usingtheclassificationofSlovic(1987),canbejudged
observable, is relatively well‐known to scientists, has immediate effect and, considering the
highlyexposedcontextofour study, is a relativelywell‐knownandoldproblem in thearea. In
thisstudy,theidentificationofriskconstructswasadaptedfrompreviousstudiesthatanalyzed
the relationship among environmental risk sources and behavioural intentions and responses
(McDaniels et al., 1996; McDaniels et al., 1997; O’Connor et al., 1999; Lee and Zhang, 2005;
BayardandJolly,2007).
4 This concept was used by key informants when discussing on soil erosion. Soil erosion is associated by farmers to theconcept of decreasing soil health which they perceive associated to several consequences such as decreasing productivecapacityandincreaseinamountoffertilizersneeded.

58
Farmers’ decisions regarding soil conservation are largely driven by short‐term perceived risks
associated with markets and weather, rather than long‐term climate change‐related hazards
(GrothmannandPatt,2005).Tomodelthiscomponent,andfollowingBayardandJolly(2007),we
builtconstructstomeasureriskperceptionusingLikertscalesfromonetoseventomeasurethe
individuals’perceptionoftheimmediacyandsaliencyofimpactsfromdriversofsoilerosionsuch
as agriculture, cattle, rainfall, and logging and urbanization. This immediacywasmeasured by
four constructs; namely, severity, uncontrollability, observability and rapidity. Additional
questionswere intendedtomeasuretheextenttowhich individualsperceivethemselvestobe
livinginareasgenerallyexposedtosoilerosionrisk.
Values ( )V characterize those standards that individuals judge appropriate and desirable in a
givensituation,andthusreflecttheirorderingofpreferencesforend‐statesoftheenvironment
(Scholz,n.d.).Webuild,forthevalueitems,onLeeandZhang(2005)andO’Connoretal.(1999)
to formulate questions on how much farmers and public administration should be held
responsible for avoiding damage to soil. Finally, all items used to measure all our cognitive
variablesarepresentedintable1.

59
Table 1: Items and their codes to measure cognitive variables. Component Abbreviations Items
BProdInRipAgua Riparianareasareoptimalformyproductiveactivitiesgivenproximitytowater.BProdRipGood Slopingareasaregoodformyproductiveactivity.BSoilConsCostInco Soilconservationmeasuresdon'tbringmuchbenefit,itismoretheinvestmentcostthen
thereturnsformyfarm.BSoilNeverDegr Soilisaninexhaustibleresource,whichiswhyitcanbeexploitedcontinuously.BScienceTech Scientificandtechnologicalprogressinsoilmanagementallowsovercomingsoil
degradationproblemsBSoilHealth* Howhealthydoyouthinkyoursoilis?BSHchange** Doyouconsiderthatyoursoilhealthhaschangedcomparedtothepast?BSHChFut Doyouthinkyoursoilhealthmightchangeinthefuture?BContrPreci Howmuchdoesrainfallcontributetoerosion?BContrAgr Howmuchdoagriculturalpracticescontributetosoilerosion?BImpoRain Amongdeforestation,agriculture,rainfall,roadsandcattlebreeding,howwouldyourank
precipitationimpactsonsoilerosion?BImpoAgr Amongdeforestation,agriculture,rainfall,roadsandcattlebreeding,howwouldyourank
theimpactsofagriculturalactivitiesonsoilerosion?BTreesDecrProd Treesonfarmlandsdecreaseproduction.BTreeConsSoil Treesbenefitsoilconservation.
Belief
BSlopeFor Inhighslopingareasthereshouldbenoproductiveactivity,onlyforest.RPCattleObs Howobservableistheimpactofcattleonsoilerosion?RPCattleRap Howfastistheimpactofcattleonsoilerosion?RPAgrRap Howfastistheimpactofagricultureonsoilerosion?RPCattleSev Howlargeistheimpactofcattleonsoilerosion?RPAgrObs Howobservableistheimpactofagricultureonsoilerosion?RPAgrSev Howlargeistheimpactofagriculturalactivitiesonsoilerosion?RPEroPast Howmuchhaserosionriskincreasedinrespecttothepast?RPEroFut Howmuchwillsoilerosionriskincreaseinthefuture?RPCrSev Howlargearesoil‐erosion‐relatedlossesinCostaRica?RPRainObs Howobservableistheimpactofprecipitationonsoilerosion?RPRainSev Howlargeistheimpactofprecipitationonsoilerosion?RPRainRap Howfastistheimpactofprecipitationonsoilerosion?RPCrContr HowmuchcanpeopleinCostaRicacontroltheriskofsoilerosion?RPRainContr Howcontrollableistheimpactofprecipitationonsoilerosion?RPCattleContr Howcontrollableistheimpactofcattleonsoilerosion?
Risk
RPAgrContr Howcontrollableistheimpactofagricultureonsoilerosion?VSoilProdNoDestr SoilproductivityshouldneverbedestroyedVwstrUseCare Downstreamusersdon'tcareabouthowweupstreamproducersmanageourfarmsoilsVIncomeNow Ensuringmaximumreturnpossibleforthisyearismuchmoreimportantthanensuringsoil
productivityforfuturegenerationsVProdPay Producerswhoareresponsibleforsedimentationinriversshouldpayforremovingsuch
sedimentsfromriversanddamsVProdOwnDec EachproducerownshisfarmsoilsothathissoilmanagementdecisionsarestrictlypersonalVRespFutGenr Forourchildren,weproducershavetheresponsibilitytoreduceerosion
Values
VPublicAdmPay Publicadministrationresponsibleforroadsshouldpayforremovingsedimentsproducedbythisinfrastructurefromriversanddams
AllvariablesaremeasuredonLikert‐scales.Beliefsscalesare1(donotagree)to7(verymuchagree);except*(veryunhealthy=1toveryhealthy=4)and**(Hasworsened=1,thesameasnow=2,hasimproved=3);Riskperceptionsarefrom1(verylittle)to7(verylarge);Valuesscalesare1(donotagree)to7(verymuchagree).
Socioeconomicvariables
As reported in other studies (Grasmuck and Scholz, 2005; Siegrist and Gutscher, 2006) risk
perception and its associated responsive behaviour is influenced by individuals’ exposure.We

60
createdabinaryvariabletodiscriminateproducersbyriskareasthatwereidentifiedbypolygons
(see Figure 1) reflecting the boundaries of communities subject to the highest rates of soil
erosion(Marchamalo,2004).
Figure 1: Location, current land uses and the delimitation of areas with high soil erosion of the Birris watershed, (A: Costa Rica; B: Reventazon watershed; C: Birris watershed).
Existingprogramspromotingsoilconservation intheBirriswatershedcovera limitedextentof
the area. To account for their eventual influence on individuals’ judgment and conservation
behaviour,participation inanexistingprogramwasmeasuredwithabinaryvariable.Economic
welfarelevelwasincluded,similartootherstudies(Lynneetal.,1988;O’Connoretal.,1999;Lee
and Zhang, 2005; Bayard and Jolly, 2007), with a ranking variable of monthly household
consumption with seven levels. As seen in section 2, land tenure has widely been used in
studyingfarmers’adoptionofsoilconservationpractices.So,basedonourrecollecteddatawe
constructedanownershipvariable(“owned”)whichmeasuresthepercentageoftotalfarmland

61
thatisownedbytheindividualproducer.Finally,educationlevel(measuredby5levels)andage
of individualswere included for their important role outlined inprevious research on farmers’
conservationbehaviour(Traoreetal.,1998;IllukpitiyaandGopalakrishnan,2004;LeeandZhang,
2005).
3.3.4Statisticalanalysis
3.3.4.1Constructionofcognitivevariables
In what followswe describe howwe used factor analysis in SPSS (2001) on B , RP , and V to
create three indexes thatwereultimatelyused, togetherwith socioeconomicvariables, to test
our hypotheses. The three sets of indexes ( ), ,B RP V were obtained by conducting the factor
analysis with the Kaiser normalization method, varimax rotation, and Principal Component
Analysisastheextractingmethodwiththevariablesundereachheadingintable1.Onlyfactors
withaneigenvalueof1orabovewereretained(Kaiser‐Gutmannretentioncriterion;Kinneletal.,
2002).Fitness for factorialanalysiswastestedwithBartlets’KMOand p value! .Rotatedfactor
loadings were used to identify relevant variables to be used in the construction of indexes.
Variableswereretainediftheirrotatedloadingswereabovethethresholdvalueof0.5.
In the exploratory analysis, we excluded from further analysis the variable that measured
farmers’ judgmenton“own responsibilitynot todestroy soil productivity” ( )SoilProdNoDestrV for its
low variance (ratings between 5 and 7), possibly due to strategic answering. Then, a separate
factor analysis5 (i.e. one for each specific cognitive aspect of the decisionmodel) reduced the
numberofvariablesfromtheoriginal38to9cognitiveindexes.Ineachfactoranalysisweutilized
standard procedures such as KMO values and commonalities to improve the separation of
factors.Thefinalresultsareshownintable2.
Table 2: Socio-economic variables of the sample (n = 56). Variable Average S.D. Min Max
Age(years) 48.98 14.55 18 80
Farmsize 18.30 11.11 1 38
Educationlevel 2.29 0.87 1 5
5Inanattempttoreducethenumberofvariables,weranexploratoryfactoranalysesusingallvariablesmeasuringcognitive
aspects.Thelowfitness‐testvalue ( )0.352; 0.0001KMO p= < ,however,didnotseparateconsistentfactorsoutofthe
14loaded,thussuggestingtheneedforaminor‐aggregationanalysis.

62
Monthlyconsumptionlevel 4.45 1.37 2 8
Beliefs. The factor analysis on beliefs variables identified 3 underlying
factors( )0.671; 0.01KMO p= < . With factor 1 loadings, we constructed an index1B called
“Positive Thinking” ( )1 ProdInRipAgua SoilNeverDegr ScienceTechB B B B= + + composed of items capturing i)
beliefsthatsoilsareresilienttodegradation, ii) thattechnologicalprogress insoilmanagement
practicesissufficienttocountersoildegradationand,finally,iii)thatproducinginriparianareas
(i.e. sloping areas) is good because water is closer. This index thus indicates the triumph of
positive thinkingaboutproductionand technologyoverworries on soildegradationprocesses.
Items from factor 2 loadings built index2B named “soil critical conditions”
( )2 SoilHealth BSHchangeB B= + .Theseitemsmeasurebeliefsastohowhealthyfarmersthinktheirfarm
soil isandwhether ithaschanged.Thescalesofthetwocontributoryitemswerestructuredto
measure how strongly they believe their farm soil to be in critical condition (i.e. higher values
correspond to higher awareness of critical soil conditions). Factor 3 loadings identified beliefs
associatedwiththeimportanceofrainfallinerosionprocessesingeneralandintheirfarmsoilin
particular. Index3B , termed “Climate extremes” ( )3
ContrPreci ImpoRainB B B= + , captures beliefs
associatedwiththiscomponentoftheerosionproblem.
Risk perception. Factor analysis for risk perception ( )0.71; 0.0001KMO p= < identified four
factors. Factor 1 loadings identified an underlying index1
RP called “Agricultural
risk”( )1 AgrContr AgrObs AgrSev AgrRapRP RP RP RP RP= + + + , which captures risk perception associated
with agricultural activities. More specifically, it measures the immediacy of their impacts on
erosion and how controllable they are and tells us about the relevance of these activities for
erosion.Basedontheloadingsofthesecondfactor,weconstructedindex2
RP ,termed“Pasture
risk”, ( )2 CattleObs CattleSev CattleRapRP RP RP RP= + + , representing the perception associatedwith the
immediacy and severity of pasture activities on erosion. The index 3
RP
( )3 EroPast RainObs RainRapRP RP RP RP= + + isnamed“ExtremePrecipitation”andclearlycomplements
the first two risk perception indexes, which are directed at anthropogenic activities, by

63
addressingjudgmentonnaturalphenomena.Thisindexincludesperceptionoftheimmediacyof
rainfallimpactswhich,interestingly,iscorrelatedinthesamefactorwiththeperceptionofhow
strongly erosion has increased in respect to the past. Finally, in the factor analysis of risk
perception,thefourthfactorloadeditemsmeasuringperceptionofthecontrollabilityoferosion
effectstogetherwiththeextenttowhichindividualsperceivethatpeopleinthecountryareable
to control this environmental problem. We name index4
RP “control
perception”( )4
CrContr RainContrRP RP RP= + since it measures perceptions of how controllable the
erosion effects of extreme precipitation are, alongwith the capacity of Costa Rican people to
copewiththem.
Values. Factor analysis on values items identified two underlying
factors( )0.559; 0.05KMO p= < . The first factor loaded items measuring values on private
aspects of the erosion problem. Thus, this index called “private
benefits”( )1 IncomeNow ProdOwnDec ProdNoPayV V V V= + + measures preference for short‐term benefits,
right to decision on their own farm soil (i.e. erosion is not of public concern) and, finally, the
opinionthatproducersshouldnotbepayingforremovingsedimentsfromtheriver.Thesecond
factor, in contrast, identified an index ( )2 VRespFutGenr PublicAdminPayV V= + that captures the values
related more to the public than to the private benefits. This index is built with variables
measuringconcernsonwhetherpublicadministration(i.e.andnotindividualfarmers)shouldbe
held responsible for removing sediment from rivers and whether soil conservation should be
ensuredforthebenefitsoffuturegenerations(i.e.expressingconcernsforlonger‐termbenefits
oferosioncontrol).
3.3.4.2Differentiationoffarmers’types
Inasecondstep, followingCarlssonetal. (1977),weuseddiscriminantanalysis,using ( )CE i as
thedependentvariables,toprojectthesocioeconomicandcognitiveindexesinabi‐dimensional
space allowing for visual representation of the farmers’ conservation‐efforts groups and the
variables characterizing them. Finally, we tested our hypotheses in section 1with a pair=wise
ANOVAtocomparegroups’meansscoresoncognitiveandsocioeconomicvariables.

64
3.4Results
3.4.1Sampledescription
Most farmers in our sample are full‐time agricultural producers (63%) and have relatively low
educationallevels(i.e.primaryschool).Theaveragelevelofhouseholdmonthlyconsumptionis
betweenUS$200andUS$400(Table3).

65
Table 3: Results of factor analysis with the loadings of the rotated factors for cognitive variables.
Dimension variable Factor1 Factor2 Factor3 Factor4
Explainedvariance
31.32 15.74 14.85 ‐
Rotatedloadings
BProdInRipAgua 0.82 0.13 0.09 ‐
BScienceTech 0.70 ‐0.05 0.26 ‐
BSoilNeverDegr 0.67 0.22 ‐0.16 ‐
BSoilHealth ‐0.04 0.83 0.19 ‐
BSHchange 0.37 0.7 ‐0.07 ‐
BContrPreci 0.32 ‐0.001 0.67 ‐
Beliefs
BImpoRain 0.11 ‐0.11 ‐0.74 ‐
Explainedvariance
33.18 14.643 10.801 10.459
Rotatedloadings
RPAgrContr 0.65 0.19 ‐0.12 0.42
RPAgrObs 0.85 0.03 0.11 ‐0.09
RPAgrSev 0.76 0.22 0.12 ‐0.10
RPAgrRap 0.72 0.29 0.39 ‐0.15
RPCattleContr 0.59 0.31 0.06 0.43
RPCattleObs 0.27 0.81 0.09 0.20
RPCattleSev 0.21 0.92 0.04 0.06
RPCattleRap 0.12 0.92 0.04 0.01
RPRainObs 0.07 0.03 0.72 ‐0.28
RPRainRap 0.09 0.15 0.63 0.06
RPEroPast ‐0.11 0.06 ‐0.70 ‐0.15
RPCrContr 0.02 0.04 ‐0.19 0.74
Riskperception
RPRainContr ‐0.12 0.11 0.32 0.75
Explainedvariance
33.82 23.39 ‐ ‐
Rotatedloadings
VIncomeNow 0.71 0.41 ‐ ‐
VProdNoPay 0.75 0.25 ‐ ‐
VProdOwnDec 0.73 0.07 ‐ ‐
VRespFutGenr 0.03 0.71 ‐ ‐
Values
VPublicAdmPay 0.005 0.70 ‐ ‐
Themajorityofinterviewees(71%)donot,atpresent,participateinconservationprogramsand
the sample shows a relatively even distribution of farmers in and outside (46%) of risk areas.

66
Farmersinthesample,independentlyfromtheirfarmproductionactivity,implementonaverage
abouthalf(55%)ofthetotalsoilconservationpracticeswelisted.
3.4.3Differentiationoffarmers’groups
Combinedcognitiveandsocioeconomicvariablesclearlydifferentiatethethreegroupsoffarmers
basedontheirconservationefforts(CE ).Agriculturalistsrepresentthemajorityofinterviewees
inthegroups (1)CE and (2)CE (i.e.lowerconservationefforts)(Table4).
Table 4: Distribution of interviewees by farm activity in the different farmers’ conservation- effort groups of the sample.
Farmers’groups(n)
Farmactivity CE(1) CE(2) CE(3)
Agriculture 13 14 8
Dairy‐cattle 3 6 2
Agricultureanddairycattle
3 1 6
Total 19 21 16
Farmerswithinthegroupoflowestconservationefforts (1)CE ownasmallerpercentageofthe
land they cultivate respect to farmers in the other two groups. The bi‐plot of discriminant
analysis6 (Figure 2) identifies three separate groups of farmers distinguished using circles built
with the confidence interval atp‐value lower than 0.05. The first canonical axis explainsmore
than 70% of total variance and allows a clear separation between the group of farmers with
greater conservationefforts (3)CE from thatofgroup (1)CE .Clearly, group (3)CE is strongly
andpositivelyassociatedwithexposureinriskareas,highereducation level,moreparticipation
inprogramsandmore“publicbenefits”(2V )concerns.Thefigurealsoshowsthat inthisgroup,
given thenegativeassociationwith socioeconomicvariables suchas “age” and“own”,we find
younger farmersowninga smallerportionof landwith respect to total land farmed.Similarly,
group (3)CE , incontrastto (1)CE , isalsostronglynegativelyassociatedwithriskperceptionsof
“Agriculturalrisk”andof“extremeprecipitation”.Thedifferencesbetweenthesetwogroupsare
also reflected in their contrasting association with beliefs on topics such as “soil critical
conditions”and“climateextremes”.
6Dataareconsistentforlineardiscriminantanalysissincethenullhypothesesforthehomogeneityofvarianceisaccepted(p=0.4646).

67
Indexes such as “positive thinking” (1B ) beliefs and “pasture risk” (
2RP ) perceptions are only
slightlyimportantwithrespecttothefirstcanonicalaxis.Inthesecondcanonicalaxis, it isonly
cognitiveindexB1whichshowsastrongandpositiveassociationwith (2)CE .Similarly,it isonly
with respect to this axis that the index “private benefits” (1V ) shows a stronger contribution,
beingpositivelyassociatedwith (1)CE andnegativelywithgroup (2)CE .
Figure 2: Discriminant analysis for the three groups of farmers with different soil conservation efforts ( )CE i . Blue triangles correspond to (1)CE ,
yellow squares to (2)CE and green circles to (3)CE . The grey lozenge represents the spatial location of the variable, showing its positive or negative association with farmers groups.
3.4.4Testinghypothesesofdifferencesbetweenfarmers’groups
The clear separation among groups of farmers (defined by their conservation effort) resulting
from the discriminant analysis rejects our null hypothesis supporting that a combination of
socioeconomic and cognitive variables explain significant differences among farmers’

68
conservation efforts. In the following pairwise ANOVA we refine our hypotheses testing to
highlight the differential contribution of cognitive and socioeconomic variables by groups of
farmers.ResultsofANOVAshowkeycontrasting characteristicsof the threegroupsof farmers
(table5).
Table 5: Pair-wise ANOVA comparison of the three farmers’ groups; ( )CE i identifies the Conservation-Effort farmers’ group.
Groupaverages(standarddeviation) p‐values
Variables CE(1) CE(2) CE(3) CE(1)vsCE(2) CE(1)vsCE(3) CE(2)vsCE(3)
PartiProgr 0.11(0.31) 0.14(0.35) 0.69(0.47) 0.48 0.0005 0.001
Activity 2(0.57) 2.24(0.53) 1.75(0.68) 0.23 0.29 0.03
Age 48.53(14.79) 52.57(16.08) 44.81(11.50) 0.39 0.39 0.13
Edu 2.37(0.83) 2(0.83) 2.56(0.89) 0.21 0.44 0.08
MonthCons 4.21(1.18) 4.33(1.71) 4.88(1.02) 0.49 0.11 0.28
Owned 0.70(0.43) 0.83(0.33) 0.70(0.40) 0.33 0.50 0.34
RiskArea 0.21(0.41) 0.48(0.51) 1(0) 0.10 0.0001 0.0002
B1 11.89(4.93) 14.47(4.45) 10.50(4.80) 0.12 0.39 0.02
B2 4.42(1.017) 4(0.94) 3.87(1.08) 0.22 0.17 0.48
B3 9.78(1.81) 10.04(2.17) 8.81(2.28) 0.48 0.22 0.14
RP1 19.84(3.46) 15.90(4.08) 15.93(3.51) 0.003 0.003 0.50
RP2 9.63(6.83) 6.42(4.17) 9.43(4.76) 0.12 0.49 0.07
RP3 17.63(2.31) 16.52(2.69) 17.56(2.09) 0.21 0.49 0.24
RP4 6.47(3.19) 6.81(3.22) 5.56(2.06) 0.49 0.34 0.21
V1 13.42(3.99) 8.38(3.74) 10.25(4.41) 0.0003 0.05 0.22
V2 10.78(3.13) 10.80(2.37) 12.56(1.36) 0.50 0.05 0.01
Farmersingroup (3)CE liveinareasmoreaffectedbyerosionandhavegreaterparticipationin
the soil conservation program than the other two groups showing that technical assistance
programs have been having a significant effect on adoption of soil conservation practices. In
respecttocognitivevariables,higherawarenessofthelimitsoftechnologiesandsoiltoprovide
resilience to erosion together with higher perceptions of i) risks associated to agricultural
activities,andii)benefitsassociatedtosoilconservationandawareness,haveapositiveeffecton
adoption. More specifically, farmers in group (3)CE (who are mainly agriculturalists) show
significantly higher risk perception of the immediacy of pasture impacts on erosion than do
groups (1)CE and (2)CE . Similarly, as opposed to theother twogroups, group (3)CE ismore
concernedwiththelonger‐termbenefitsoferosioncontrol(i.e.forfuturegenerations)aswellas

69
with a perspective that public administration should be paying for removing sediment from
rivers.Ontheotherhand,withrespectto (2)CE , (3)CE farmersshowsignificantlylowervalues
of index B1 (i.e. positive beliefs on the role of technology and soil resilience to reduce the
adverseeffectsofsoilmanagement).
The group with medium conservation effort (2)CE is composed of a significantly larger
proportionoffarmersdedicatedtodairy‐farmingwithalowerparticipationinsoilconservation
programs.Farmersinthisgroupshowasignificantlylowerperceptionoftheriskassociatedwith
humanactivities(i.e.agricultureanddairy‐cattlefarming)thanfarmersintheothertwogroups,
andgenerallylessconcernoverthepublicandprivatebenefitsoferosioncontrol(i.e.V1andV2).
Consistentwiththefindingsofthediscriminantanalysis,riskperceptionofimpactsofagricultural
activitiesonerosionandvaluesregardingshort‐termbenefitsoferosioncontrolhaveaninverse
relationship with conservation efforts. Indeed, farmers with the lowest level of conservation
effort (1)CE showedhigherriskperceptionoftheimpactsofagriculturalactivitiesonerosion(R1
=agriculturalrisk)thanfarmersin (3)CE and (2)CE Farmersingroup (1)CE alsoshowedhigher
concernwithrespecttogroups (2)CE and (3)CE fortheprivateaspectsofsoilconservationand
theimportanceofshorttermbenefitsofagriculturalactivitiesagainstthelongertermbenefitsof
erosioncontrol (V1=“privatebenefits”).Deeperanalysisof thedataontenureandproduction
activities will help to illustrate this finding. In group (1)CE we findmainly horticulturalists as
opposed to the other two groups (where horticulturalists and dairy‐farmers are more evenly
represented). A comparison of the average farmland owned by these two types of producers
showsthathorticulturalistsownsmallerplots( )0.005Kruskal Wallisp!
< inwhichtheopportunitycost
ofsoilconservationmightbeperceivedasbeinghigher.Small‐scalefarmers,dealingwithshort‐
term production cycles, such as is the case of horticulture in the area, however, might show
awarenessofsoildegradationbutfeelthatprivatebenefitsaremoreimportantintheshortrun.
To furtherexplore thesehypotheseswe rananon‐parametric test to comparemeanvaluesof
cognitive indexes accounting for farmers’ groups ( )CE i and also accounting for size of farm
owned. We thus categorized the variable “total farmland” available to producers into two
separate classes; namely, those owning less than 10 ha ( 16n = ) and the others ( 40n = ). For
smaller landowners, the groupwith lower conservation efforts (1)CE has a significantly higher

70
score for beliefs about “critical soil conditions” ( 0.05)Kruskal Wallisp!
< and “private benefits”
compared to the other two groups ( 0.05)Kruskal Wallisp!
< . Finally, the producers in group (3)CE
showgreaterconcernsabout“publicbenefits”(2V )aspectsthantheothertwogroupsoffarmers.
3.5Discussion
Theresultsofouranalysisrejectsthehypothesisthatfarmers’voluntarysoilconservationefforts
arenotinfluencedbytheinteractionofcognitiveandsocioeconomicvariables,keepingwiththe
findings of previous research in the region (Foster, 1994). Factor analysis allowed the
identificationofthemost importantcognitiveaspectsthat influencesoilconservationdecisions
andtheconstructionofconsistentindexes.Themultivariatediscriminantanalysisindicatesthat
the group of farmers with lower conservation effort is positively correlated with cognitive
variables. This contrasts with the group showing higher conservation effort (i.e. group (3)CE ),
where there is mainly a positive correlation with socioeconomic variables and exposure to
erosionrisk.Thissuggeststhat, togetherwiththepromoteddirectpayments,acomplexsetof
factorsneedtobeconsideredindesigningconservationprogramsaimedatpromotingadoption
ofappropriatesoilmanagementpractices.
Our results indicate that complex interactions among cognitive and socioeconomic dimensions
influence significantly farmers’decisionson soil conservation.However, comparisonwithother
studies in the Central American region can only be limited to socioeconomic and some
institutionalvariables(e.g.presenceofsoilconservationprograms)whilecognitivevariableshave
been overlooked. More specifically, from an economic perspective, farmers with lower
conservation effort are also those cultivating smaller farmlands, which might entail the
perceptionofhigheropportunitycostsintheimplementationofsoilconservationpractices.This
is supportedby the resultsof theeconomicanalysisof soil conservationpractices in theclose
Tierrablanca watershed in Costa Rica (Cuesta, 1994) where results indicate that conservation
practiceshavenegativereturnsalsoduetotheproportionofproductivefarmlanddedicatedto
conservation (i.e. small farms having higher opportunity cost). Our results also support the
finding of Cuesta (1994) and Vasquez and Santamaria (1994) by suggesting that institutional
programspromoting technical assistance should be strengthenedgiven their positiveeffect on
adoptionofsoilconservationpractices.Ourfindingsshow,however,thatcognitivevariablesalso

71
influencetheextenttowhichindividualfarmersdecidetoimplementsoilconservationpractices.
Farmers’ evaluation of the benefits of soil conservation for agricultural production trades off
against the costs they attach to erosion control. Their judgment on the costs of soil erosion
controlandonitsbenefitsappearstobeconditionedbytheirspecificcontext,suchastheextent
and tenure regimeof the landcultivated. Smallerholdingsareassociatedwithhorticulturalists
thathavelesslandavailablefortheimplementationofconservationpracticesand,moreover,are
moreconcernedwithshort‐termincomeneeds,althoughtheyscorehigheronawarenessofrisks
andcausesofsoilerosioninthearea.
Farmersinoursamplewith lowerconservationeffortsshowasignificantlyhigherperceptionof
the risk of agricultural activities. This finding contrastswith those ofWeber et al. (2001),who
reported that actual exposure and awareness increase proactive behaviour. Additionally, the
“availabilityheuristic”paradigm(TversyandKahneman,1974)mayalsobeplayinganimportant
role in farmers’ soil conservation behaviour. Indeed, the inverse relationship between risk
perceptionofthe impactsofagriculturalactivitiesonerosionandconservationeffortssuggests
that farmersmayunderestimatetheconsequencesoftheiragriculturalactivitiesonerosion. In
other words, daily experience with erosion might give the illusion of control and/or smaller
losses. Moreover, as discussed Bewket (2007), while awareness of risk and its causes can
influence farmers’ intentions to implement soil conservation practices, its actual adoption
dependsonsocioeconomicandinstitutionalaspects.
Themosteducatedfarmersdonotshowstrongbeliefsregardingthesoil’scapacitytorecoveror
theabilityofscienceandtechnologytoovercomeerosionproblems(2B )andtheyrevealhigher
conservationefforts. These findings contrast thoseofAbreu (1994)whom foundno significant
effectofeducationonadoptionleveloffarmersintheclosewatershedofTierrablanca.Educated
farmers in our sample show awareness of the importance of implementing soil conservation
practices, understanding that soil productivity can be degraded if appropriate actions are not
initiated.Thesefindingsconfirmthoseofotherauthors, inkeepingthateducationisrelatedto
knowledgeofconsequencesofsoilmanagementpracticesandofalternativesolutions,which in
turninfluencesbehaviour(Carlsonetal.,1977;ErvinandErvin,1982;Traoreetal.,1998;Mbaga‐
SemgalaweandFolmer,2000;Lambertetal., 2007). In linewiththissameargument, technical

72
assistance programs improving farmers’ understanding of erosion causes and alternatives
availablecanimprovetheirchancesofadoption(Traoreetal.,1998).
3.6Conclusions
This article provides new perspectives on the relationship between the perception of climate
changeriskposedtofarmsoilsandtheadoptionofconservationpractices.Themodelweused
enriches our understanding of the complex interactions among socioeconomic and cognitive
variablesbyshowinghowtheseinteractionsdifferentiateamongspecificgroupsoffarmertypes.
Farmers showa lowawarenessof the risksposedby climate‐change‐relatedextremes to their
farmsoil, although they showhighconcernwith the impactsofhumanactivities.Additionally,
our results suggest that soil conservation programs should strategically consider promoting
improvement of understanding of the causes, the on‐site and off‐site consequences, and the
limitationofsoilsandtechnologicalsolutionstoprovideresiliencetoerosion.Thismightimprove
understandingontheurgencytotakeactiongiventhepotentialintensificationoferosion‐causing
extremeeventsinvulnerablewatershedsand increasetheprobabilitiesof largerself‐motivated
adoptionofsoilconservationpractices.
3.7References
Abreu,H.M.,1994.AdoptionofsoilconservationinTierraBlanca,CostaRica.In:Lutz,E.,Pagiola,S.,Reiche,C.(Eds.),Economicandinstitutionalanalysisofthesoilconservationprojects inCentralAmericaandtheCaribbean.WorldBankDevelopmentpaperNo.8,WashingtonD.C.,USA,207pp.
Aguilar,E.,Peterson,T.C.,RamırezObando,P.,Frutos,R.,Retana,J.A.,Solera,M.,Soley,J.,GonzalezGarcıa,I.,Araujo,R.M.,RosaSantos,A.,Valle,V.E.,Brunet,M.,Aguilar,L.,Alvarez,L.,Bautista,M.,Castañonp,C., Herrera, L., Ruano, E., Sinay, J.J., Sanchez, E., Hernandez Oviedo, G.I., Obed, F., Salgado, J.E.,Vazquez, J.L., Baca, M., Gutierrez, M., Centella, C., Espinosa, J., Martınez, D., Olmedo, B., OjedaEspinoza,C.E.,Nuñez,R.,Haylock,M.,Benavides,H.,Mayorga,R.,2005.Changes inprecipitationandtemperature extremes in Central America and northern South America, 1961‐2003. Journal ofGeophysicalResearch,110,D23107.
Ajzen,I.,1991.TheTheoryofPlannedBehaviour.OrganizationalBehaviourandHumanDecisionProcesses50,179‐211.
Bayard, B., Jolly, C., 2007. Environmental behaviour structure and socio‐economic conditions of hillsidefarmers:amultiple‐groupstructuralequationmodelingapproach.EcologicalEconomics,62(3/4),433‐440.
Bewket,W., 2007. Soil andwater conservation interventionwith conventional technologies in northwesternhighlandsofEthiopia:acceptanceandadoptionbyfarmers.LandUsePolicy24,404‐416.
Bruijnzeel, L.A., 2004.Hydrological functionsof tropical forests:not seeing thesoil for the tres?. Agriculture,EcosystemsandEnvironment104,185‐228.

73
Comisión Asesora sobre Degradación de tierras (CADETI), 2002. Segundo informe nacional para elcumplimientodelaUNCCDenCostaRica.SanJosé,CostaRica,56pp.
Carlson, J.E., McLeod, M., Lassey,W.R., Dillman, D.A., 1977. The farmer, absentee landowner and erosion:factorsinfluencingtheuseofcontrolpractices.IdahoWaterResourcesInstitute,Moscow,Idaho.
Cuesta,M.D.,1994.EconomicanalysisofsoilconservationprojectsinCostaRica.In:Lutz,E.,Pagiola,S.,Reiche,C. (Eds.),Economicand institutionalanalysisof thesoil conservationprojects inCentralAmericaandtheCaribbean.WorldBankDevelopmentpaperNo.8,WashingtonD.C.,USA,207pp.
D’emden,F.H., Llewellyn, R.S.,Burton,M.P.,2008.Factors influencing theadoptionofconservation tillage inAustralian cropping regions. The Australian Journal ofAgricultural and Resource Economics 52, 169‐182.
Dale, V.H., Polansky, S., 2007. Measures of the effects of agricultural practices on ecosystem services.EcologicalEconomics64,286‐296
Ervin, C.A., Ervin,D.E., 1982. Factors affecting theuseof soil conservationpractices: hypotheses, evidences,andpolicyimplications.LandEconomics58(3),277‐292.
Featherstone, A.M., Goodwin, B.K., 1993. Factors influencing a farmer’s decision to invest in long‐termconservation.LandEconomics69(1),67‐81.
Forster,N.R.,1994.TenuresystemsandresourceconservationinCentralAmerica,Mexico,HaitiandDominicanRepublic. In: Lutz, E., Pagiola, S., Reiche, C. (Eds.), Economic and institutional analysis of the soilconservationprojects in Central America and the Caribbean.World BankDevelopment paperNo. 8,WashingtonD.C.,USA,207pp.
Gould, B.W.,Saupe,W.E., Klemme,R.M.,1989. Conservation tillage: the roleof farm characteristicsand theperceptionofsoilerosion.LandEconomics65(2),167‐182.
Grasmuck,D.,Scholz,R.W.,2005.Riskperceptionofheavymetalsoilcontaminationbyhigh‐exposedandlow‐exposedinhabitants:theroleofknowledgeandemotionalconcerns.RiskAnalysis25(3),611‐622.
Grothmann,T.,Patt,A.,2005.Adaptivecapacityandhumancognition:theprocessofindividualadaptationtoclimatechange.GlobalEnvironmentalChange15,199‐213.
GuoZ.,XiaoX.,LiD.2000.Anassessmentofecosystemservices:waterflowregulationandhydroelectricpowerproduction.EcologicalApplications10(3),925‐936.
Illukpitiya, P., Gopalakrishnan, C., 2004. Decision‐making in soil conservation: application of a behaviouralmodeltopotatofarmersinSriLanka.LandUsePolicy21,321‐331.
InstitutoCostarricensedeElectricidad(ICE),2000.PlandeManejodelaCuencadelRíoReventazón.SanJosé,CostaRica.
Instituto Nacional De Estadística y Censo Centroamericano de Población (INEC), 2002. Estimaciones yproyeccionesdepoblación1970‐2050.SanJosé,CostaRica,112pp.
Innes, R., Ardila, S., 1994. Agricultural insurance and soil depletion in a simple dynamic model. AmericanJournalofAgriculturalEconomics76(3),371‐384.
Kinnel,J.,Lazo, J.K.,Epp,D.J.,Fisher,A.,Shortle, J.S.,2002.Perceptionsandvaluesforpreventingecosystemchange:PennsylvaniaDuckHuntersandthePrairiePotholeRegion.LandEconomics78(2),228‐244.
Lambert, D.M., Sullivan, P., Claassen, R., Foreman, L., 2007. Profiles of US farm household adoptingconservation‐compatiblepractices.LandUsePolicy,24,72‐88.
Lee,H.F.,Zhang,D.D.,2005.Perceivingland‐degradationactivitiesfromthelayperspectiveinnorthernChina.EnvironmentalManagement36(5),711‐725.
Leyva,J.C.,Martinez,J.A.F.,Gonzalez‐Roa,M.C.,2007.Analysisoftheadoptionofsoilconservationpracticesinolivegroves:thecaseofmountainousareasinsouthernSpain.SpanishJournalofAgriculturalresearch5(3),249‐258.
Lutz,E.,Pagiola,S.,Reiche,C.,1994a.Thecostsandbenefitsofsoilconservation:thefarmers’viewpoint.TheWorldBankResearcherObserver9,273–295.

74
Lutz,E.,Pagiola,S., Reiche,C.,1994b.Economicand institutionalanalysisof thesoil conservationprojects inCentralAmericaandtheCaribbean.WorldBankDevelopmentpaperNo.8,WashingtonD.C.,207pp.
Lynne,G.D.,Shonkwiler, J.S.,Rola,L.R.,1988.Attitudesandfarmerconservationbehaviour.AmericanJournalofAgriculturalEconomics70(1),12‐19.
Magrin,G.,GayGarcía,C.,CruzChoque,D.,Giménez,J.C.,Moreno,A.R.,Nagy,G.J.,Nobre,C.,Villamizar,A.,2007. Latin America. Climate Change 2007: Impacts, Adaptation and Vulnerability. Contribution ofWorkingGroupIItotheFourthAssessmentReportoftheIntergovernmentalPanelonClimateChange,Parry,M.L.,Canziani,O.F.,Palutikof,J.P.,vanderLinden,P.J.,Hanson,C.E.,Eds.,CambridgeUniversityPress,Cambridge,UK,581‐615.
Marchamalo, M., 2004. “Ordenación del territorio para la producción de servicios ambientales hídricos.aplicaciónalacuencadelRíoBirrís(CostaRica).PhDThesis,ForestryDepartmentofthePolytechniqueUniversityofMadrid,Spain,409pp.
Marchamalo,M.,Romero,C.,2007.Participatorydecision‐makinginlanduseplanning:anapplicationinCostaRica.EcologicalEconomics63(4),740‐748.
Mbaga‐Semgalawe, Z., Folmer, H., 2000. Household adoption behaviour of improved soil conservation: thecaseoftheNorthPareandWesternUsumbaraMountainsofTanzania.LandUsePolicy17,321‐336.
Mcdaniels, T.L., Axelrod, L.J., Canavagh, N.S., Slovic, P., 1997. Perception of ecological risk to waterenvironment.RiskAnalysis17(3),341‐352.
McDaniels, T.L., Axelrod, L.J., Slovic, P., 1996. Perceived ecological risks of global change: a psychometriccomparisonofcausesandconsequences.GlobalEnvironmentalChange6(2),159‐171.
Ministerio de Medio Ambiente y Energía (MINAE), 2002. GEO Costa Rica: una perspectiva sobre el medioambiente.ObservatoriodeDesarrollodelaUniversidaddeCostaRica,SanJose162pp.
O’Connor,R.E.,Bord,R.J.,Fischer,A.,1999.Riskperceptions,generalenvironmentalbeliefs,andwillingnesstoaddressclimatechange.RiskAnalysis19(3).461‐471.
Pagiola,S.,2008.PaymentsforenvironmentalservicesinCostaRica.EcologicalEconomics65(4),712‐724.Parry, M.L., Canziani, O.F., Palutikof, J.P., Van der Linden, P.J., Hanson, C.E., 2007. Climate Change 2007:
Impacts, Adaptation and Vulnerability. Contribution of Working Group II to the Fourth AssessmentReport of the Intergovernmental Panel on Climate Change, Intergovernmental Panel on ClimateChange(IPCC),CambridgeUniversityPress,Cambridge,UK,976pp.
Pimentel, D., Harvey, C., Resosudarmo, P., Sinclair, K., Kurz, D., McNair, M., Crist, S., Shpritz, L., Fitton, L.,Saffouri, R., Blair, R., 1995. Environmental and economic costs of soil erosion and conservationbenefits.Science267(5201),1117‐1123.
Ramirez,L.C.,2008.Caracterizaciónfísica,socioeconómicaeindicadoresdesostenibilidadenlaCuencamediadelRioReventado.MScThesis,CiudadUniversitariaRodrigoFacio,SanJosé,CostaRica,192pp.
Sanchez‐Azofeifa,G.A.,Harriss,R.C.,Storrier,A.L.,DeCamino‐Beck,T.,2002.WaterresourcesandregionallandcoverchangeinCostaRica:impactsandeconomics.WaterResourcesDevelopment18(3),409‐424.
Scholz,R.W.,n.d.EnvironmentalLiteracy inScienceandSociety:FromKnowledgetoDecisions”byRolandW.Scholz will be available in early 2011 at Cambridge University Press (Hardback 978‐0‐521‐19271‐2,Paperback978‐0521‐18333‐8).
Siegrist, M., Gutscher, H., 2006. Flooding risks: a comparison of lay people’s perceptions and expertsassessmentinSwitzerland.RiskAnalysis26(4),971‐979.
Slovic,P.,1987.PerceptionofRisk.Science236(4799),280‐285.SoilandWaterConservationSociety(SWCS),2003.Soilerosionandrunofffromcropland.ReportfromtheUSA,
SoilandWaterConservationSociety63pp.Soule,M.J.,Tegene,A.,Wiebe,K.D.,2000.Landtenureandtheadoptionofconservationpractices.American
JournalofAgriculturalEconomics82(4),993‐1005.Southgate, D., Macke, R., 1989. The downstream benefits of soil conservation in third world hydroelectric
watersheds.LandEconomics65(1),38‐48.SPSSforWindows,Rel.11.01.1Chicago:SPSSInc.
75
Swinton, S.M., Lupi, F., Robertson, G.P.,Hamilton, S.K., 2007. Ecosystem services and agriculture: cultivatingagriculturalecosystemsfordiversebenefits.EcologicalEconomics64,245‐252.
Tejwani, K.G., 1993.Watermanagement issues: Population, Agriculture and Forests ‐ a focus on watershedmanagement. In: Bonell, M., Hufschmidt, M.M., Gladwell, J.S. (Eds.), Hydrology and WaterManagementintheHumidTropics.UNESCO,Paris,pp496‐525.
Traore, N., Landry, R., Amara, N., 1998. On‐farm adoption of conservation practices: the role of farm andfarmercharacteristics,perceptions,andhealthhazards.LandEconomics74(1),114‐127.
Tversky,A.,Kahneman,D.,1974.Judgmentunderuncertainty:heuristicsandbiases.Science185(4157),1124‐1131.
VandeBergh,J.C.J.M.,Ferrer‐i‐Carbonell,A.,Munda,G.,2000.Alternativemodelsofindividualbehaviourandimplicationsforenvironmentalpolicy.EcologicalEconomics32,43‐61.
Vasquez,T.,Santamaria, J.,1994.Economicandinstitutionalanalysisofsoilconservationatthefarm level inCoclé,Panama.In:Lutz,E.,Pagiola,S.,Reiche,C.(Eds.),Economicandinstitutionalanalysisofthesoilconservationprojects in Central America and the Caribbean.World BankDevelopment paperNo. 8,WashingtonD.C.,USA,207pp.
Vignola, R., Otarola, M., Calvo, G., 2010. Defining ecosystem‐based adaptation strategies for hydropowerproduction:stakeholders’participationindevelopingandevaluatingalternativelandusescenariosandthe strategies to achieve desired goals. In Martinez, C., Locatelli, B., Imbach, P., Vignola, R., (Eds),2009.Proceedings of the international Seminar on “Adaptation to Climate Change: the role ofecosystemservices”,CATIE,Turrialba,CostaRica.InPress.
Wagner,K.,2007.Mentalmodelsofflashfloodsandlandslides.RiskAnalysis27(3),671‐682.Weber,O.,Scholz,R.W.,Bühlmann,R.,Grasmück,D.,2001.Riskperceptionofheavymetalsoilcontamination
andattitudestowardsdescontaminationstrategies.RiskAnalysis21,(5).967‐977.Wischmeier,W.H.,Smith,D.D.,1978.PredictingRainfallErosionLosses.AGuidetoConservationPlanning.US
DepartmentofAgricultureHandbookNo.537.USGovernmentPrintingOffice,WashingtonD.C.,USA.Wossink, A., Swinton, S.M., 2007. Jointness in production and farmers’ willingness to supply non‐marketed
ecosystemservices.EcologicalEconomics,64,297‐304.Wunder,S.,Engel,S., Pagiola,S.,2008. Takingstock:acomparativeanalysisofpayments for environmental
servicesprogramsindevelopedanddevelopingcountries.EcologicalEconomics65(4),834‐852.

76

77
4.1 Negotiation analysis for mechanisms to deliver ecosystem services: a value-focused bargaining structure to achieve joint gains in the provision of Soil Regulation Services
Authors:RaffaeleVignola,TimL.McDaniels,andRolandW.Scholz
Paperstatus:undersecondroundrevisioninEcologicalEconomics.
Abstract
Directpaymentschemeshavebeendiscussedintheliteratureaseconomicallyefficientmeansto
createandmaintainthe institutionalandpracticallinkagestoreducedegradationofecosystem
services (ES). However, evidence suggests that the nature and structure of institutional
mechanisms is fundamental to the efficacy and efficiency of outcomes, yet has received little
attention.
Linkages between ES producers and consumers require bargaining about the characteristics of
mechanismsforcooperationatagivenlocation.Inthispaper,weintroducenegotiationanalysis
informedbybothstakeholders'value‐basedinformationandtechnicalknowledgeasameansof
structuring negotiation about mechanisms for maintaining ES. We use a case study in a
watershedwhereupstreamfarmersanddownstreamhydropowermightbenefitfromthedesign
of a mechanism to foster the provision of soil regulation services. We identify the values of
producersandconsumerstounderstandtheirviewson importantmeansandends indecisions
about ES provisions. We complement this value‐based information, with literature on
alternatives forsoil conservationprograms.We, thus,createanegotiationtemplateto identify
bargainingopportunitiesandthusthepotentialforbetteroutcomes.Ourresultsshowthatthere
is convergence of preferences on the important aspects of themechanisms between the two
stakeholders.Thisprovidesopportunitiesforjointgainsintheprovisionofsoilregulationservices
thatcanprovidemoreresiliencetoclimatechangeinCostaRica,whichisexpectedtobringmore
erosionduetomoreintenserainfall.
Keywords:Negotiationanalysis,decisionanalysis,ecosystemservices,soilconservation
4.1Introduction
TheMillenniumEcosystemAssessment documents themassive growth in humandemands for
services fromecosystemsover the last fourdecadesand revealsthatover two thirdsofglobal

78
ecosystemservices(ES)systemsareindecline(MEA,2005).ItprovidesatypologyofdiverseES
produced within linked human and natural systems7. ES involving water resources are often
produced or regulated at upstream locations and consumeddownstream (Kosoy et al., 2007).
This is thecaseofsoil regulationservices (SRS)whoseprovision is influencedbyactorssuchas
upstreamfarmersaffectingthequantityofsedimentsinriversanddownstreambeneficiariesof
SRSsuchashydropowerdams(SouthgateandMacke,1989).Oftenthesegroupsarespatiallyand
administratively separated,donothaveahistoryof interactions,and lackanunderstandingof
thepotentialjointgainsifupstreamproducershadtheinterestsofdownstreamconsumersmore
directlyinmind,andhadresourcestoaddressthoseinterests(Isonetal.,2007).
Themechanismmostwidelyemployedtolinkproducersandconsumersofecosystemservicesis
direct (or indirect) Payment for Ecosystem Services (PES) from direct beneficiaries (or
governments) to providers. Researchers have provided typologies of PES compared to other
policy instruments (Engel et al., 2008), and considered ways to improve economic (Ferraro,
2008),environmental(Wunscheretal.,2008)andsocial(Pagiolaetal.,2005)performanceofPES
schemes.TheunderliningreasoningofPESschemesputsemphasisonthepotentialforefficiency
gains bymaking externalities internal to the decisions of ES providers. Yetmany social factors
otherthanopportunitycostsinfluencethedecisionsofactorstoalterlanduses,asconfirmedby
acomparativestudyintheCentralAmericanregionwhichshowedthatproducersgenerallyfailed
tomeettheiropportunitycostsineffortstoprovideES(Kosoyetal.,2007).
Henceabroaderformofbargaining,inwhichmultipleobjectivesareconsideredonbothsidesof
ecosystem service production and consumption, built on an understanding of how upstream
producerscouldbemotivatedtoprovideservicesfordownstreambeneficiaries,wouldbehighly
relevant in designing mechanisms for ES provision. Previous experience in cooperative
managementofnaturalresourceshasshownthatformalandinformalinstitutionalarrangements
arefundamentaltooutcomes(Dietzetal.,2003).Yethowmechanismsaretobebuiltinorderto
foster ES provision has received relatively little attention (Wilson and Horwath (2002) and de
Groot and Herman (2009), are exceptions). This paper attempts to address that gap through
7 These include:provisioning services suchas food,water, timber, and fiber; regulating services thataffect climate, floods,
disease,wastes,andwaterquality;culturalservicesthatproviderecreational,aesthetic,andspiritualbenefits;andsupportingservicessuchassoilformation,photosynthesis,andnutrientcycling(MEA,2005:9).

79
attentiontobargainingfordesignofmechanismsforprovisionofESthataremutuallyagreeable
tothe interestedparties.Thestandardnormativeapproachtoconflictandnegotiation isgame
theory, which seeks normative equilibrium solutions given known alternatives, constrained
objectives, and known payoffs8. Here we adopt a more behaviourally‐oriented, prescriptive
approachtoanalysisofbargainingcontexts,withanemphasisondecisionstructureandprocess,
referredtoasnegotiationanalysis(Young,1991;Sebenius,1992;Raiffaetal.,2002).
CostaRicahasexperiencewithPESthroughitsrecentlyestablishedsystemofpayinglandholders
formaintainingorregeneratingforestcover(Pagiola,2008).TheperformanceofPESschemesin
CostaRicahasbeenthesubjectofmuchdiscussion,reviewandevaluation(Mirandaetal.,2007;
Sanchez‐Azofeifaetal.,2007;Wünscheretal.,2008).Inthispaper,weconsideranothercontext
for ecosystem service provision in Costa Rica, involving farmers who are horticulturalists and
dairy‐cattleproducersonsteep,cool,erosion‐pronevolcanicslopesintheBirriswatershed,high
abovereservoirsthatareimportantfornationalhydropowerproduction.Weusethecontextof
potential SRS provision through soil erosion control to develop a bargaining framework for a
mechanism to foster ES provision, in which the downstream power producers could provide
incentives or other kinds of support. Improving soil erosion controlwould benefit two electric
utilitiesbyreducingtheamountofsediment in rivers, (theAdministrativeBoardoftheElectric
UtilityofthecityofCartago(JASEC)andtheCostaRicanInstituteforElectricity(ICE)),aswellas
providingon‐sitebenefitsforthefarmersengagedinserviceprovision(Pimenteletal.,1995;Guo
etal.,2000;WossinkandSwinton,2007).
This paper has two related objectives. One objective is to demonstrate the relevance of
negotiation analysis for complex bargaining contexts such as developing mechanisms for ES
provision. A second objective is to provide a structure for the negotiation space among
stakeholders.Webuildatemplatetoguidebargaininginthedesignofmechanismstoaccomplish
linkages among producers and consumers. ES provision in the Birris watershed is used as an
8Forarichdiscussiononthelinkagesanddifferencesbetweengametheoryandnegotiationanalysis,seeSebenius(1992).Alivelyexchangebetweennormativescholarsofgametheoryandmorebehaviourally‐orientedBayesianscholarsoccurredin
thepagesofManagementSciencefrom1982to1983(see,forexample,KadaneandLarkey, (1982,1983);Harsanyi,(1982),RothandSchoumaker(1983),andRothkopf(1983).Oneauthorsharpenedthedebatetoaquestionposedinthetitleofhis
paper: "OnChoosingBetweenRev. BayesandProf. vonNeumann" (Kahan (1983), as cited inSebenius,1992).Raiffaatal.(2002)alsoprovidesacomparisonofgametheoryandnegotiationanalysis.
80
example. The next section provides an introduction to negotiation analysis, and the particular
characteristics of ES provision thatmake the approach especially relevant. Section 3 provides
moredetailsoftheBirrisecosystemservicescontextrelevantfornegotiationanalysis.Section4
discussesmethods used to gather information for this research. Section 5 includes results, in
termsofanegotiationtemplateanditsevaluationbyfarmersandtheelectriccompany.Section
6providesconclusions.
4.2NegotiationAnalysisandItsRelevanceforES
Collaborative planning for complex human‐natural systems necessarily relies on negotiation
(InnesandBooher,1999,Fisheretal.,2009);yethowtostructurenegotiationsinsuchcontexts
meritsgreaterattention.Negotiationanalysiscouldpotentiallybeavaluabletoolforbuildingthe
basis foragreementamongconflicting intereststhatcharacterizethesecontexts (deGrootand
Hermans, 2009). Negotiation analysis might be referred to as both “game theory minus” and
“decisionanalysisplus”(Sebenius,1992).
“Game theory minus” indicates that while it deals with the same broad kinds of issues,
negotiation analysis does not entail the examination of well‐defined gameswith known rules,
playersandpayoffs,inasearchfornormativeequilibriumsolutions,asingametheory.Ratherit
is asymmetrically prescriptive/descriptive in orientation, providing prescriptive guidance on
negotiationdecisionprocess foroneactor,basedondescriptionsofexpectedbehaviourbythe
other party9. Negotiation analysis has a Bayesian (subjectivist) perspective on uncertainty and
information,andadoptsboundedrationalityratherthannormativeoptimizationastheguiding
assumption regarding behaviour of participants. It recognizes the benefits of full and open
informationexchangeinnegotiation10.
“Decisionanalysisplus”indicatesthatnegotiationanalysisinvolvessituationsinwhichagreement
among multiple parties is required, providing the potential for joint gain, which are more
demandingcontextsthananalysis forasingledecisionmaker. Itdrawsonthedecisionanalytic
process(Hammondetal.,1999)intermsofaseriesofiterativestepsinvolvingvalueperspectives
9 In this paper, we seek to provide support and analysis for both sides in potential negotiations, so its orientation isprescriptive,builtondescriptiveunderstandingforbothsides.10Raiffaetal.2007referstothebenefitsof“full,open,truthfulexchange”(FOTE)asanidealinreachingbetteragreementswithinnegotiationanalysis.

81
andtechnicalinformation,withafocusonvaluesofthepartiestothenegotiationasabasisfor
constructing and comparing alternatives. Raiffa (1982) first explicitly considered how the
concepts andmethods of decision analysis for a single decisionmaker could be broadened to
serveasthebasisforbothanartandscienceofnegotiation.Intheearly1990s,asurveyarticle
(Sebenius, 1992) and edited book (Young, 1991) delineated negotiation analysis as a new
perspective on conflict and bargaining, and provided concepts and applied examples to guide
theseefforts.ArecentbookbyRaiffaandcolleagues(2002)furtherdevelopsnegotiationanalytic
concepts and practice. Drawing on these sources, key aspects of negotiation analysis that are
particularlyimportantforESincludethefollowingpoints.
Creatingorchangingthenegotiation.ESprovisionisacontextinwhichthepotentialparties(i.e.
producersandconsumers)toaprospectivenegotiationmaybespatiallydistant,ofdifferentclass
or ethnic backgrounds, and operate in entirely different institutional or governance contexts.
Theymayhavelittleornoknowledgeofthepotentialgainsthatcouldbeachievedforconsumers
ifproducersmanagedESprovisiondifferently.Hencethepreceptsofagamewithknownparties,
known rules and knownpayoffs forwell‐defined alternatives are not relevant. In ES provision,
there isaneed tobeginby creating thecontext foranegotiation,orperhapsalteringexisting
arrangements,ratherthanlearningthroughrepeated,well‐definedgames.
Afocusonthevaluesofthenegotiatingparties.Thevaluesofthepartiesarethereasonwhy
theymaywishtonegotiateandachievejointgains.ValuesforESprovisionmaybecomplexand
involvedifferentconcernsfordifferentgroups(Isonetal.,2007).Forexample,theworkbyKosoy
andcolleagues(2007)showsthatmultipleobjectivesnecessarilymatter forESprovision.While
almost any approach to decision‐making or negotiation calls for attention to values, decision
analyticapproacheshavewell‐developedandeffectivemethodsto characterizevalues.Keeney
(1992)discussesvalue‐focusedthinkingasaframeworkforcharacterizingvaluesforanydecision
context,includingmulti‐partynegotiation,(seeSection4).
Creating attractive alternatives that expand the benefits, and are more likely to facilitate
agreement.Negotiationanalysisbuiltonvalue‐focused thinkingattempts to createnew,more
attractivealternativesthatarebothmore likelytobe implemented,andmore likelytoaddress
thefullrangeofobjectivesamongtheparties(Keeney,1996).Inthismanner,thepartieshavean
opportunitytoexpandthepotentialbenefitsofagreement,ratherthanonlyfocusingonclaiming

82
benefits11.Reachingagreementsbasedonrelevantstakeholders’valuescansupportthedesign
ofmoresocially‐stablemanagementstrategies(e.g.buildingtrustandmutuallearning)thatare
importantforlonger‐termadaptivesolutionsneededinESprotection(InnesandBooher,1999).
How the alternatives are to be constructed is a particularly significant question involving
technicalunderstanding,knowledgeofrelevantvalues,andcreativityinlinkingthetwo.Keeney
stressestheimportanceofvaluesasaguidetodesignofalternatives,anddifferentiatesamong
valuesfortheoutcomes(theultimateendsofinterest,suchasESprovision,costsandsoforth)
versusvaluesforthedesignoftheprocess.
Attention to the alternatives to a negotiated agreement.Anegotiator’s best alternative to a
negotiated agreement (BATNA) is widely seen as an important indicator of the value of an
alternative and thus negotiation strategy. In the case of ES provision, the BATNAmay be the
statusquo.Alternatively,theremayberecognitionthatcompetitionforESisincreasinginmany
locations,andglobalchangeprocesses,particularlyclimatechange,maywell limittheextentto
whichthestatusquoofESprovisioncancontinue.Understandingthatthestatusquomaynotbe
viableoverthemediumtolongtermprovidesmoreincentivetoreachanegotiatedagreement
forESprovision.
4.3ESprovisionintheBirrisWatershed
TheBirriswatersheddescendsfromtheslopesofIrazuVolcanoabovethecentralvalleyofCosta
RicainCartagoprovince.Thewatershedischaracterizedbyrichanddeepsoils(i.e.andosols)that
have attractedmany farmers to cultivate vegetables on small tomedium sized plots for local
markets. Over 300 producerswork in thewatershed, often on very steep slopes, in locations
whereannualprecipitationis2325mm(Marchamalo,2004).Extremeprecipitationeventshave
increasedoverthelastfortyyears(Aguilaretal.,2005)andareexpectedtocontinuetoincrease
asaresultofclimatechange(Magrinetal.,2007).
AresearchprojectwithmanyregionalpartnershasinvestigatedseveralaspectsofSRSprovision
in the Birriswatershed, and its links to hydroelectric facilities downstream. These facilities are
greatlyaffectedbysiltation,which isexpected toworsen in the futureunder changingclimate
11 Sebenius (1992)providesadiscussionof the tensionbetweencreatingandcreatingvalue innegotiationanalysis, andidentifieswhathetermsthe“negotiator’sdilemma”,incontrasttothePrisoner’sdilemma.

83
conditions.BothJASECandICEoperateelectricalgenerationfacilitiesdownstreamfromtheBirris
watershed,forwhichcostlydredgingandflushingofsilt,orreplacementofenergypoweredby
diesel generators, or both, are needed to address power losses due to siltation in reservoirs.
Interviewsindicatedthat,in2006,morethan$fourmillionUSinforegonepowerproductionand
otherdirectcostswerespentbytheutilitiestoflushsedimentsfromoftheirreservoirs.
ThesituationintheBirriswatershedillustratesseveralofthepointsmadeintheprevioussection
aboutthenatureofESprovisionandwhynegotiationanalysis is relevant.Theutilitieshaveno
direct experience in building a large scale program to provide incentives or other support to
farmers for soil conservation practices. Neither ES providers nor beneficiaries in the Birris
watershed have a clear understanding of the need to bargain or the potential benefits of
bargaining. They operate at different scales of governance, and different spatial scales, and
require new institutionalmechanisms in order to address joint interests.While farmers in the
watershedunderstanderosionprocesses,theyhavelimitedawarenessoftheeffectsoferosion
ondownstreamhydropowerfacilitiesandofhowtheeffectsofclimatechange(inmakingrainfall
moreintense)canaffecttheirownfarmsoils.
NationallawrequireselectriccompaniestopayataxtotheMinistryofEnvironmentMINAETfor
wateruse.Apartofthesepaymentscanbedestinedtofundwatershedmanagementactivities
(Ponce,2006).Thetwodownstreamhydropowercompanies,JASECandICEhaveinitiatedsome
small scaleprograms to i) increaseawareness, ii) encouragevoluntaryerosioncontrol, and, iii)
provide some learning opportunities for soil conservation practices. Yet the companies have
limitedunderstandingof farmers’objectives,andtheconstraintstheyface. Inaddition,neither
farmers nor the electric companies havemuch experiencewith the costs and structure of soil
conservationmechanisms,ortheirbenefitsintermsofactualchangesintheratesoferosion.
Althoughecosystemservicesmayseemtobeunusualascontextforanegotiationanalysis, it is
highly relevant application (de Groot and Hermans, 2009). Writers concerned with providing
negotiationadviceoftenspeakoftheneedtonegotiateabouttheprocessaswellassubstantive
outcomesofES conservation schemes (Fisheretal., 1991).The structureof thenegotiation in
what follows is more along the lines of institutional design than a more standard textbook
negotiation problem, such as negotiating the price of an asset; nevertheless it is a new and
potentiallywidelyapplicablecontext.

84
4.4Methods
Negotiationanalysisrequiresconstructionofanegotiationtemplate(Raiffaetal.,2002),builton
an understanding of motivations, objectives, and characteristics of acceptable alternatives,
identifiedseparately foreachofthenegotiatingparties.Theoverallprocedureusedtodevelop
thenegotiationtemplateinthisstudyisshowninFigure1.
Figure 1: Research method: steps to build and evaluate the negotiation template for the design of mechanisms to improve ES provision.
Herewe adopt Keeney’s value‐focused thinking (VFT) as one important basis for creating this
template(KeeneyandRaiffa,1991;1993).VFTinvolvesaprocessofclarifyingvaluesimportantto
decision makers and interested parties. That information can then be used to identify
requirementsofadditionalinformationfordecisionsandforservingasabasisforcreatingmore
attractivealternatives(Keeney,1992;GregoryandKeeney,1996).VFThashadwideapplication
in a variety of contexts, including environmental management, business strategy, defence,
engineering,andplanning,particularlyforcitizens’involvementincomplexdecisions(McDaniels
et al., 1996) and recently in negotiations for PES (de Groot and Hermans, 2009). Keeney and
Raiffa (1991) have discussed value‐focused thinking for both parties in a negotiation as a
fundamental step indevelopingadecision template,which isan important step innegotiation
analysis.
Ourmethod is informedby twoclosely related approaches,namely: discourse‐basedandArea
DevelopmentNegotiations.Thefirstapproach involvestheuseofsmallgroupsofstakeholders’
representatives to deliberate on relevant aspects of ecosystem services, bringing to the
discussiontheirvalues,attitudesandbeliefs(McDanielsetal.,1999;WilsonandHowarth,2002).

85
The secondapproach includesa sequenceof steps tobuildunderstandingof thecase through
interviews,focusgroups,expertinformationandexperientialencounterswiththecasestudyasa
way to identify common strategies in the presence of divergent interests (Scholz and Tietje,
2002).

86
4.4.1DataAcquisition(Step1)
Steps1isconcernedwitheliciting,byinterviewsandfocusgroupswitheachstakeholder,value
perspectivesandotherrelatedcognitiveinformationrelevantforthedecisioncontext(detailsin
section4.1.1and4.1.2).
The discussions with actors were structured to elicit the participants’ values for actions and
decisionsregardingwatershedmanagementeffortstoreduceerosion.Toelicitvaluesweasked
stakeholderstocommentonwhatisimportanttothemregardingdirectpaymentstofarmersas
ameans to foster conservation in upstream farms, drawing on the analogy of an existing PES
scheme inCostaRica (Pagiola,2008). Specificquestionselicited their viewson implementinga
scheme for soil conservation in productive farms and the associated constraints. We asked
questionsonwhatmakesidealalternativesolutionsandtheirexpectedbenefitsinordertoelicit
theirviewsonalternativestrategies.Thefocusgroupdiscussionsweretranscribedandanalyzed
toidentifyandstructurekeyobjectivesinordertousethemasinputsintheconstructionofthe
negotiationcriteriaonaSCP.
4.4.1.1Datafromfarmers
Interviews. In June2007, individual semi‐structured interviewswereconductedwithproducers
( 50)n = from theBirriswatershed, selected randomly from the producers’ census of the local
agriculturalextensionoffice.Wecompletedacomprehensivereviewofavailablefarmpractices
for soil conservation and their adoption in the area based on existing documents in the
agriculturalextensionoffice.Inpart,thisreviewhelpedidentifykeybarriersandopportunitiesfor
the successful implementation of conservation practices in the Birriswatershed. The interview
instrument included questions to elicit farmers’ perceptions on the health of their soil and
whether they believe they face problems with soil degradation or erosion. We also included
questions to capture their understanding of erosion control processes using thementalmodel
method discussed in Morgan et al. (2002and open‐ended questions about the factors
constrainingorpromotingtheimplementationofsoilmanagementpractices(detailedresultscan
befoundinVignolaetal.,2009).

87
Focus group. To build on the individual interview results, we conducted a focus group with
representativesofproducers’associationsintheofficeoftheBirrisagriculturalextensionservice
in order to discuss the objectives for soil conservation programs. The participants included
representatives of a large local cooperative of producers, a member of a national producers’
association,amemberofasmallproducers’association,andanindependentproducerwhomisa
localleadproducerpromotingsoilconservationonproducers’farms.
Webeganwithanopendiscussiononthestateofsoilerosioninthewatershedandthefactors
thatmake itvulnerabletoerosion(i.e.climate, landusepracticesand infrastructure).Next,we
explored past experiences regarding conservation of SRS and the alternatives that have been
considered, in conjunctionwith incentives that would be helpful to foster their adoption.We
then employed methods discussed in Keeney (1992), and related papers, to elicit concerns,
constraints,andvalueperspectives.
4.4.1.2DatafromJASEC
Interviews.Aseriesofinformaldiscussionswasheldwithdifferentindividualsworkingwithinthe
JASEC‐Birrishydropowerproductionsystem.Those interviewed includedthevice‐president, the
manager of the hydropower facility, and the individuals responsible for watershed operations
andforsedimentmonitoringinthedam.Thebroadintentwastolearnaboutsystemoperations,
the effects of siltation on operations, and the utility’s interests and concerns in considering
possibleESprogramstoaddresssiltation.WeagainfollowedmethodsoutlinedinKeeney(1992)
tostructurethediscussion,asabasisforclarifyingthefundamentalendsandmeanstoachieve
theoverallgoalofaSCP.
FocusGroup.Tobuildontheresultsofthe interviews,afocusgroupwasheldwithfoursenior
officialsfromJASEC,including:thevice‐president;thecoordinatoroftheElectricOperationUnit;
the director of the Special Project Unit; and the coordinator of an environmental education
programintheBirriswatershed.Participantsdiscussedoncurrentsoilconservationactivitiesand
whatarethecharacteristicsofidealalternativestoimproveSRSprovision.Positiveandnegative
aspectsof currentuser‐financedPESprogramsandpotential alternativeshelpedcharacterizing
JASEC’smeansandendstoachieveadesirableSCP.

88
4.4.2Synthesisfortemplatebuilding(Step2)
Step 2 involves synthesizing and analyzing transcribed interviews and focus group discussions
which complementary information for evaluation of natural resources (Kaplowitz and Hoehn,
2001).HereweusedtheWITI(“Whyisthatimportant?”)methodofquestioningininterviews,as
discussedinKeeney(1992)andClemenandRielly(2001),todistinguishamongendsandmeans
relevant for the two groups of decision makers (farmers and the electric utilities). For a
negotiation template, the ends or fundamental objectives are used as the basis for criteria to
compare and evaluate alternatives from each party’s viewpoint, while themeans are used to
createbetter,moreattractivealternatives.Basedonthisinformationwepreparedadraftsetof
objectives,andanobjectivesnetwork,alsocalledameans‐endsnetwork(Keeney,1992).Step2
also involves creating attractive alternatives to be addressed in the negotiation. Gregory and
Keeney(1994)andKeeney(1992)articulatehowstakeholdervaluescanbeusedtohelpcreate
more attractive alternatives through a process of considering and building creative linkages
amongmeansandends.
Thisvalue‐orientedinformationonalternativeswascomplementedbyexpert‐basedsources.We
draw on literature regarding watershed management and soil conservation mechanisms to
identify various aspects or components of a mechanism for soil conservation, as well as the
alternativeoptionsavailable.Weuseanapproach referred toasastrategy table (Clemenand
Reilly, 2001) to graphically communicate the structure of the alternatives,which includes four
separatecomponents(discussedbelow)andseveralsub‐alternatives.Thesesub‐alternativescan
thenbecombinedinvariouswaystocreateseparatestrategiesofamechanismforfosteringES
provision,whicharethealternativesconsideredinthistemplate.Inotherwords,combiningsub‐
alternatives from each of the four components provides the basis for an array of different
strategies,whichcould serveas thebasis fornegotiationandultimatelyagreementamong the
twopartiestocreateandstructureasoilconservationprogram.
4.4.3Verificationandevaluationofalternativestrategies(Step3)
In Step 3, the two groups are asked, in two separate focus groups, to first verify and then
evaluate the alternatives under each of the components of mechanism design. We verified,
followingHabron et al. (2004), the diagramswedrewbased on stakeholders’ consultations in

89
ordertoconfirmwehadadequatelycapturedparticipants’perspectiveontheproblem.Hencein
eachofthesemeetings,our interpretationsoftheresults fromearliermeetingswerereviewed
andverifiedbyeachpartytothenegotiation.
Afterverificationbythetwogroups, theelicitedendscanserveastheobjectivesorevaluation
criteria for each group in the decision context12. The evaluation process is akin to eliciting the
‘zoneofbargaining’(Raiffaetal.,2002)foreachofthecomponents13.Thetwogroupswerealso
separately asked to identify which sub‐alternatives under each of the four components of
strategies are acceptable from their viewpoint. The intent of this process is to define the
negotiation space, or areas of potential agreement, that could help shape and direct the
subsequentnegotiationprocess.
We did this by asking the individuals in each group of participants to review the specific
components, and sub alternative under each component, as presented in aworkbookwehad
previouslyprepared.Participantswereasked to indicatewhichalternativeswereacceptable to
them(atasksimilartoapprovalvoting;McDanielsandThomas,1999).Wealsoaskedparticipants
to indicatewhich alternativewould bemost preferred in negotiation.We tried to ensure the
questions were understood by all participants. The judgment tasks were kept as simple as
possible to facilitate participation14, but elicited important information regarding initial
perspectivesonaspectsoffuturenegotiations.
4.5Results
4.5.1Objectivesofnegotiatingparties
4.5.1.1Farmers
Themeetingwithfarmers ( 8)n = washeldattheBirrisagriculturalextensionofficeinFebruary,
2009,andincludedleadersoffarmers’associationsandindividualproducers.Figures2presents
12Objective statements requireadecisioncontext, anobject, andadirectionofpreference (Keeney,1992). Forexampleoneobjectiveisstatedasstatedasfosteringorimproving(directionofpreference)farmincomes(object),inthecontextofimplementation of a soil conservation program (context). Sub‐objectives (e.g. short term (less than two years) and longterm(twoyearsormore))furtherspecifytheobjectivestatement.13Notethatbecausethecomponentsarelargelyseparable,theycanbeconsideredandnegotiatedindividuallyaspartofalargeagreement.14TheBirrisagriculturalextensionofficerattendedthefinalworkshoptoanswerquestionsandprovidehelptofarmerswhohaddifficultyreadingtheworkbook.

90
theobjectivesof farmersregardingthenatureofadesirablemechanismforanESprogram,as
derivedfromthemethodsdiscussedinSection4andverified inthefinalmeetingwithfarmers.
Ontheleftsideofthediagramarevariousmeansraisedindiscussions,whiletherightsideshows
the ends or fundamental objectives important to farmers in terms ofmechanism design. The
objectives listed on the right side reveal the characteristics of the ideal mechanism from the
farmers’viewpoints,whichinclude:1)provideincentivesforsoilconservation,2)ensureequityin
distribution of incentives, 3) promote learning and adaptive management (i.e.. about soil
conservationpractices)and4)achievetheoverallobjectivesofaSCP(i.e.thatworkwellforboth
farmers and JASEC in addressing soil conservation). Theremaywell be tradeoffs among these
objectives, or no alternatives that satisfy all at once, so care is required in designing and
evaluatingthealternatives.
Fig. 2. Farmers’ network of means-ends objectives for a desirable soil conservation program.

91
Themeanson the left side of Figure2 showkeyaspects for creatingattractivealternatives to
achievetheoverallgoalsofsoilconservationinthewatershedfromfarmers’perspectives.Note
that many of the means for designing a desirable SCP relate to fundamental objective of
achievingprogramsuccess.Inotherwords,onecriterionfordesigningthemechanismiswhether
itislikelytoachievethefundamentalendsofprogramimplementation15.
4.5.1.2JASEC
ThemeetingwiththeExecutiveBoardofJASEC ( 5)n = washeldattheircorporateadministrative
officeonMarch,2009.Participantsincludedallthosewhotookparttothefocusgroupsessions
forstep1plustheJASECresponsibleforsedimentmanagementandmonitoring.Fig.3(parallelin
structuretoFig.2)addressestheobjectivesofJASECforthedesignofamechanismforfostering
SRS provision. Again, we drew on the results of interviews and focus group with JASEC to
distinguishendsfrommeansandthenconfirmedtheseresultsintheJASECfinalworkshop.
15 Similar linkagesbetween fundamentalobjectives for the process, and for theactual implementation,arefoundinKeeney,McDanielsandRidge‐Cooney,1996

92
Fig. 3. JASEC’s network of means-ends objectives for a desirable soil conservation program.
In Fig. 3, in the right column, we find four objectives that are related to the fundamental
achievements of a Soil Conservation Program that show concerns in different dimensions. For
example, JASEC is concerned with minimizing investment needs by targeting areas for SRS
provisionprovidinghigherreturnininvestments.Moreover,theyexpressedthewishtoimprove
knowledgeoncostsandbenefitsofsupportingaSCPwhilemaintainagoodpublicimagethrough
thepromotionofaSoilConservationProgram.AcomparisonbetweenFig.2and3showsthatthe
two sets of parties to the negotiation share some objectives, and also have some differing
concernsovertheaspectsofadesirableSCP.That isnotunexpected,and it ishelpful tomake
thesedifferencesexplicit(Sebenius,1992).
4.5.2Alternativesasstrategiesacrossseveraldimensions

93
Thealternatives(whicharestrategiescomposedofsub‐alternativesundervariouscomponents)
consideredforthenegotiationtemplatearebasedonthecomplementaryuseofthestructured
means‐ends networks in Fig. 2 and 3 and expert‐based literature. Table 1 shows the four
components important in designing a mechanism for a soil conservation program, the sub‐
alternativesundereachcomponent,andtheinformationsourcesusedtoidentifythem.Thefour
componentsofdesigningamechanismforESprovision(Engeletal.,2008;Wunderetal.,2008):
include(i)SelectionofproducerstoreceiveSCPsupport,(ii)theNatureofsupportthattheSCP
delivers to producers, (iii) the Nature of the contract establishing a formal linkage between
providersandbeneficiariesofSRS,and,finally,(iv)Whoshouldbeintermediarybetweenthetwo
partiesintheSCP.

94
Table 1. Components of alternatives drawn from participants and expert-based literature.
Component Alternatives SourceAlloverthewatershed Participants(farmers,utilities)
Bidthroughauctions Ferraro,2008.
Highpriorityareas Goldmanetal.,2007.
Selectionofproducers
Socioeconomicstatus Pagiolaetal.,2005.
Random Participants
Credit ParticipantsNatureofsupport
de‐taxation Participants
Technicalassistance Participants
DirectPayment Engeletal.,2008;Wunderetal.,2008;Pagiola,2008.
Flexible BougheraraandDucos,2006.Natureofcontract
Rigid BougheraraandDucos,2006.
None Participants
Whoshouldbeintermediary Eachsingleproducer Participants
Agriculturalextensionoffice Participants
Watershedcommittee Participants
Producer'sassociation Participants
The sub‐alternativesundereachcomponentwerederived fromboth stakeholders’ andexpert‐
based literature. For example, the sub‐alternatives under the component “Selection of
producers” are the result of both actors’ consultation and literature. Here, farmers indicated
concern over “Characterizing farmers by socioeconomic characteristics” as a prerequisite of
targetingincentivesinequitablemannerwhileJASECexpressedconcernover focusingselection
of farmers in “Highpriorityareas”.Both these sub‐alternativesare complementedby the sub‐
alternative to select farmers by an auction‐bidding process (Ferraro, 2008).On the other side,

95
based on interviews with farmers and JASEC we could identify that the current strategy for
selectingfarmersforsupportisat“Random”16.
Similarly, for thecomponent “Natureof support”, literaturewidely supports theuseof “Direct
payments”tosupportfarmers’effortsinsoilconservation(Engeletal.,2008).Ourinterviewsand
focus groups additionally identified the potential use of indirect economic incentives, such as
removing taxes on agricultural inputs (i.e. “De‐taxation”), “Credits”17 for soil conservation, and
the provision of ”Technical assistance”18. For the component “Nature of the contract” to
formalizeagreementbetweenthenegotiatingparties,wefoundastatus‐quoalternative(i.e.”No
contract”) from stakeholder consultations. Additionally, two other sub‐alternatives from the
literature (Bougherara and Ducos, 2006), namely “Flexible” (defined annually) or ”Rigid”
contracts (fixed over a period of several years) were included to identify potential trade‐offs
between the concerns of JASEC and farmers. More specifically, farmers attempt to maintain
flexibility, to allow ongoing adaptation to changingmarkets and climate conditions; therefore
theyare likelymoreattracted by thepossibility of flexible contracts. For JASEC, rigid contracts
mightbepreferable,toensurethatpractices implementedatthestartofacontractperiodare
maintainedthroughoutthedurationofthecontract(i.e.eveninthefaceofchangingmarketor
climateconditions).
Finally, the alternatives for ”Who should be intermediary” reflect concerns over which
institutionalentity isorshouldbeentitledtosupportactivitiessuchascontracting,monitoring
and following‐up of soil conservation practices.While entities such as ”Agricultural extension
office”, “Producers’ associations” and “Individual producers” are known to both groups,
“Watershedcommittee”isfamiliaronlytoJASECwhosewatershedmanagementplanincludesa
mandate to create such a committee. Sub‐alternatives under the component “Selection of
farmers” and “Nature of support” are not mutually exclusive, and could be combined. For
example, for “Selection of producers”, targeting farmers in priority areas and letting them
compete throughauctions couldbothbe selected. Similarly, for ”Natureof support”,providing
16Although,technicalassistanceisfocusingonbroadly‐definedareaswithseriouserosion,thereisnoestablishedprocessfordefiningpriorityareas.17Creditswerementionedinreferencetopastexperienceintheareawherebankswereprovidinglow‐rateloanstoselectedproducersusingaspecificvarietyoflow‐impactpotatocrop.18Technicalassistancewasdefinedtoincludeon‐goingsoilconservationprograms.Extensionofficersvisitfarmsperiodicallytoadviseonandmonitorfarmers’implementationofsoilconservationpractices.Alsotrainingisprovidedifnewtechniquesareintroduced.

96
“Directpayment”couldbecombinedwith“Technicalassistance”.Ontheotherhand,alternatives
under “Nature of contracts” and “Who should be intermediary”, sub‐alternatives aremutually
exclusive.

97
4.5.3Acceptability,preferredalternativesandzonesofbargaining
Intheevaluationphase,participantsinthefocusgroupusedaworkbookorganizedtoevaluate
the components one at a time. Fig. 4 summarizes the consultation results of the evaluation
processinasimilarwayaspresentedinScholzandcolleagues(2007).Inseparatemeetingswith
bothfarmersandJASEC,weelicited,whichofthealternativesundereachcomponentwouldbe
acceptable(i.e.morethanonesub‐alternativecouldbeselected),andwhichwasmostpreferred.
Thefigureshowsalternativesacceptabletoatleastsomeofthefarmers,tosomerepresentatives
of JASEC, and to both. To avoid an arbitrary aggregation rule, we report the percentage of
participantsinagreement,ineachboxofthetable.
Fig. 4. Acceptable and most preferred alternatives for farmers and JASEC (note: numbers in the bottom-right (left) of boxes represent the percentage of votes given by JASEC (farmers) to that sub-alternative).
Resultsfromthenegotiationexerciseshowthatthecharacteristicsoftheprogram,asdefinedby
stakeholders’ preferences, can serve the learning requirements for both parties and can be
efficient in the provision of SRS to both hydropower and farmers. More specifically, such a
programcould,consistentlywiththeirpreferences,concentratein“Highpriorityarea”,promote
“Technical assistance” instead of PES, use either flexible or rigid contracts and entitle

98
“Agricultural extension office” or the not‐yet‐created “Watershed committee” as intermediary
betweentheprogramandthefarmers.Somesurprisesarisefromtheseresults.Indeed,farmers
showlowacceptanceforhavingtheprogramspreadalloverthewatershed(i.e.theysuggestto
concentrate in “High priority areas”) although preference for program to cover the whole
watershedmightbeexpected.Similarly,monetaryincentivessuchas”Credit”and“De‐taxation”
or ”Direct payment” (accepted partially only by JASEC), have, contrasting expectations, low
acceptanceamongfarmers.Ontheotherside,farmers,consistentlywiththeirvalues,expressed
lowacceptance for selectionmechanisms thatpromotecompetitionamong themsuchas “Bid
throughauctions”.Forthecomponent“Natureofthecontract”,bothparties’acceptanceofrigid
and flexible contracts as alternatives to status quo (i.e. no contract) underlies a shared
perception of the need to establish a formal agreement to reduce soil degradation in the
watershed.While for JASEC no contractmight represent uncertain investment, for farmers no
contract might represent uncertain access to support. It is interesting to note that sub‐
alternatives supporting their direct or indirect (i.e. through their associations) involvement in
negotiating supportwith the programreceived little support contrary toexpected.Both JASEC
andfarmersacknowledgedtheroleofagriculturalextensionofficeorwatershedcommitteefor
intermediation.
Finally,aftertheevaluationexercise,bothfarmersandJASECwereaskedtoexpresstheirviews
onpossiblenextstepsinordertomoveforwardthisnegotiationprocess.Bothgroupsarticulated
theneedtoidentifyhighriskareas,andbetterspecifythenatureoftechnicalassistancesought
by farmers.Moreover, both also indicated the need to create a structure for developing and
implementingcontracts,perhapsthroughanewwatershedmanagementprocess.Farmersalso
stressedtheneedtoengageintheprocessotherfarmerswithinhigh‐riskareas.

99
4.6Discussion
Our paper builds on the recent paper of de Groot and Hermans (2009) whom used a
stakeholders’value‐basedanalysis tooutlinepotentials forPESnegotiationsbetweenproviders
anduserswater‐related ES.Our focus, however differ for three reasons. First,we focusedour
attentiononthebuildingofaninstitutionalmechanismratherthanmainlyontheeffectiveness
andstructureofdirectpaymentstofarmers.This isespeciallyrelevantwhenconsidered inthe
CostaRicancontextwherei)pioneeringexperienceonimplementationofPESschemeshasput
mostemphasisonthiscompensationmechanismthanonthevaluesand interestsofproviders
andusersofES,andii)thelocationinCentralAmericacanprovideinsightsonnegotiationsforES
contextthatmightberelevantfordevelopingcountriescontext.Second,weputemphasisison
the provision of water‐soil regulation services that provide potential for joint gains between
farmersandhydropowerratherthanputtingemphasisontheprovisionofservicesthatbenefit
principally itsuser (e.g. thewaterboard).Third,differently fromdeGrootandHermans(2009)
weusedvalue‐basedandexpert‐based literature tobuilda negotiation template, validateand
evaluate it to test ourmethodwith stakeholders’ preferences. Results from our consultations
withstakeholdersshowthatthestructureofmeans‐objectivesexpressesconcernsforeconomic
(i.e.transactioncostsofmonitoringimplementationofpractices,definecontractsanddistribute
incentives)andproceduralaspects(i.e.meetlegalrequirementsinsigningcontractsandprovide
incentives)ofthedesirablemechanismforsoilconservation.Thefiguresandthefinaltemplate
evaluationinthispaperprovideabasisforstructuringthefuturenegotiationprocess.
Thecomponentsandsub‐alternativesreflect,beyondavailabilityandconsistency19ofresources
for the program, concerns (McKenzie, 1997; Hajkowicz, 2009) on procedural aspects, such as
definingstrategiesfordistributionofresourcesandmonitoringofprogramimplementation,are
important.Drawingalternativestrategiesfromresultsofbothopendiscussionswithparticipants
(i.e.means‐endobjectivenetwork)andexpert‐basedliteratureallowswidening“thelimitedand
fallible perspective of a single actor by drawing on other experience and knowledge” (Smith,
19 As outlined in Hajkowicz (2009), many watershed conservation program have not yet adequately addressed whether
investmentsinresourcesareconsistentwithfull‐rangeofcostsandbenefitsofSCPprovidingSRS.giventhefocuson“hard‐to‐quantifyandhard‐to‐monetize”environmentaloutcomes.

100
2001). For example, for the component “Nature of the contract” between providers and
beneficiaries of the ES stakeholders had not mentioned important aspects of the possible
contracttypebetweentheprogramandfarmers.Bringingnewknowledgeinthenegotiationof
themechanism,expertliterature(BougheraraandDucos,2006)showsthattheextenttowhich
the“Flexibility”ofthecontractallowsfarmerstoadaptsoilconservationpracticesovertimecan
beanacceptedalternativetoovercomestatus‐quo,whensubjecttostakeholders’evaluation.
Ourstrategytable,basedoninputsfrombothconsultationswithparticipantsandtheliterature,
provides a set of alternatives under each component, some of which are acceptable or most
preferredtobothgroups20.Forexample,bothfarmersandJASECpreferthattheprogramselect
farmersbasedontheprincipleoftargetinghighriskareas(steepareaswithexposedslopes).This
convergence of perspectives on targeting priority areas for the ES provides an opportunity for
increasingefficiency in hydrologicalES schemes (Goldmanetal., 2007;ParkhurstandShogren,
2007).Moreover,targetingofESpriorityforwatershedconservationwouldimproveCostaRica’s
currentPESprogram,(Wunscheretal.,2007;Pagiola,2008).
Someproceduralaspectssuchas“Selectionofproducers”haveprovidedcontroversialoutcomes.
Forexample,thealternative“Auctions”thathavebeenproposedasastrategyforconservation
programs to make farmers reveal their true opportunity costs in the provision of ecosystem
services(Ferraro,2008)havereceivedlittlesupport.AsFerraro(2008)notes,selectionbasedon
this self‐revealed opportunity cost can be seen as unfair by farmers, due to incentives for
competition among farmers with different resource endowment. Additionally, this sub‐
alternative requires the SCP to dispose of additional resources to cover the transaction costs
needed to runandmonitor thebiddingprocess. For thecomponent “Natureof support”,both
groupsexpressedpreference for “Technicalassistance” rather than“Directpayments” thatare
beingpromotedbynationalPESprograms.Thispreferencehighlightstheimportanceoflearning
over time,which ishighly relevant in theuncertain context inwhich thepartiesareoperating.
Mobilizing effective scientific knowledge and the appropriate technology (through technical
assistance)canbeaveryeffectivestrategyforsustainablelandmanagement(Cashetal.,2003).
This is especially the case in the context of the Birris watershed where neither the best
20 Some 240 strategies are possible (5x4x3x4), ignoring the potential for combining alternatives under the nature ofincentives.

101
conservation practices to reduce soil erosion nor the potential benefits for agricultural
productivity are precisely known by the parties. Moreover, this is particularly relevant
consideringthatuncertainclimatedynamicsandincreasesinextremeprecipitationeventsinthe
future might require continuous adjustments (i.e. learning over time). Farmers’ preferences
suggestedtheirconcernsthat“Directpayment”would involverestrictions(i.e. legal liability)on
soil management. In light of the small farm‐area available and the dependence on unstable
market prices, farmers consistently showedpreference for less‐binding solutions. As shownby
ZbindenandLee(2005), themajorityofparticipants inthecurrentlyoperatingCostaRicanPES
arelargelandownerswithrelativelyloweropportunitycostsforadoptingthelandusesrequired
byPEScontracts.Thus,unlessBirrisfarmersalsoperceiveprivatebenefitsfromsoilconservation,
thefixedpaymentmightbeperceivedastoosmall(Pagiola,2008)orunabletomatchunstable
agricultural market prices during contract period. JASEC, on the other hand, viewed direct
paymentsasacceptable,consistentwiththeirknowledgeonPESexperiences(bothgovernment
anduser‐financedPESschemes)inthecountry(Engeletal.,2008;Pagiola,2008).
Therelativelyhighdegreeof farmers’acceptanceof“Rigid”contractsdeservesmoreattention,
especially in the light of the agricultural production context. Based on their actual experience,
farmersmayhaveevaluatedthe“Natureofcontract”asawaytoensureacontract‐basedaccess
to“Technicalassistance”butwithoutthelegalimplicationsofreceivingdirectpayment.Technical
assistance is currently provided without a legal contract (i.e. no formal commitment) but the
provisionofthisserviceisdiscontinuousandwithalimitedgeographicalcoverage.
Whenaskedtoevaluatealternativesonthecomponent“Whoshouldbeintermediary”between
theprogramandfarmers (e.g. includingactivitiessuchasmonitoringandfollow‐upofprogram
activities),theformerexperienceofparticipants21mightplayanimportantrole(Imperial,1999).
Forexample,neitherofthegroupshaveexperiencewiththealternative“Watershedcommittee”
(representing relevantstakeholderssuchas farmers)because,thecommitteehasnotyetbeen
formed,andonly JASEChasacknowledged its formation in theirBirriswatershedmanagement
plan. Current positive experience with the agricultural extension office might underlie the
21Neitherofthegroupshaveexperiencewiththealternative“Watershedcommittee” (representing relevantstakeholders
such as farmers) because, the committee has not yet been formed, although it is included in the existing watershedmanagementplan.
102
convergenceofpreferencesoffarmersandJASECparticipants.Thelackofsupportforproducers’
associationsbybothgroupsmightpresumablybedue to concernsoverprincipal‐agency issues
andthelackoftrustintheseorganizations,factorswhichhavebeenalsoobservedbyahistorical
analysis of the farmers’ cooperative movement in the country (Anderson, 1991). The
“Agriculturalextensionoffice”,highlyappreciatedforthetechnicalassistanceservicesitprovides,
mightbeperceivedasatrustworthyandconvenientchannelforadministrativetasksneededto
jointheprogram.JASEC’slackofsupportfor“Eachsingleproducer”asintermediatorsmightbe
relatedtotheconcernsovertransactioncosts,indicatedbyexperiencesinotherregions(Engelet
al., 2008; Wunder et al., 2008). In sum, intermediary organizations, rather than direct
intermediation, linking the providers and consumers of ES is seen as a desirable aspect of the
program,asshowninananalysisofVoluntaryAgreementsinwatershedprotectioninCostaRica
(Mirandaetal,2007).Aninterestingpointraisedbyfarmerswastheperceivedneedtoinvolve
most farmers in targeted areas. Indeed, the efficacy of farmers’ soil conservation practices in
providing SRS depends in part on topographical gradients and on how their actions are
coordinatedwithupstreamanddownstreamneighbouringproducers.Thisterritorialconcernhas
receivedattentionalsoinrecentliterature(Goldmanetal.,2007;ParkhurstandShogren,2007)
thatdiscussedthepotentialsofappropriatetargetinginESprogramsusingcooperativebonuses
anddeclarationofenvironmentaldistrictsasameanstopromotefarmerscooperationinpriority
areas.
Finally,theidentifiedareasofagreementcanbeusedtocreatemanyalternativestrategiesthat
could be evaluated on the basis of stakeholders’means‐ends objectives. For example, if after
further negotiation, farmers would ultimately find direct payments acceptable in place of
reduced input taxes or credit, then some eight different strategies could be created from the
alternativesofmutualagreementfromTable4(1x2x2x2).Theseeightstrategieswouldneedto
be evaluated and negotiated by both farmers and JASEC to select the best overallmechanism
acceptabletoboth.
4.7Conclusions
Thisarticle focusedon thebuildingofalternative strategies foraESmechanismusingdecision
and negotiation analysis to explore stakeholders’ values and interests. We elicited the

103
subjectivelyperceivedcausalitiesofsoilerosionbyapplyingmentalmodelinterviews,thevalues
attachedtoitscontrolandthoseofrelevanceforthedesignofcollectiveresponsestrategiesby
applyingavalue‐focusedapproach.Stakeholdersanalyzedalternativesforbuildingamechanism,
ratherthanrelyingonpre‐establishedandfixedalternativeoutcomes.Thisapproachpermitted
ustoidentifyfundamentalvaluesofrelevantstakeholders(i.e.providersandbeneficiariesofES)
and zonesofagreement thatmayhelp shape thedesignofmore sociallyandenvironmentally
efficientfutureprograms.
WhilethemajorityofliteratureonPESassumesthatdirectmonetaryincentivesareappropriate
for fostering ES provision, this paper shows that in analyzing the complex institutional
requirementsof soil conservationprograms,other considerationsmatter. Indeed, stakeholders
base their preferences on issues such as fairness, trust in and experience of interaction with
others,andaccesslearningovertimeonthechangingcausesandsolutionsofthedegradationof
ES.Acknowledging these fundamentalaspects in thedesigningofamechanismmight increase
thewillingnessofinterestedpartiestofindagreementonSCP.Thisinturncouldimprovesocial
efficiencyandenvironmentalefficacyofconservationprograms.Furtherresearchonnegotiations
should include willingness among farmers to find agreements on the best mechanisms for
cooperation, especially in high priority areas where returns on investments in conservation
effortspromisetobegreater.
4.8References
Aguilar,E.T.,PetersonC.,Ramırez,P.,Frutos,R.,Retana,J.A.,Solera,M.,Soley,J.,GonzalezGarcıa, I.,Araujo,R.M., Rosa Santos, A., Valle, V.E., Brunet, M., Aguilar, L., Alvarez, L., Bautista, M., Castañonp, C.,Herrera,L.,Ruano,E.,Sinay,J.J.,Sanchez,E.,HernandezOviedo,G.I.,Obed,F.,Salgado,J.E.,Vazquez,J.L., Baca,M.,Gutierrez,M.,Centella, C.,Espinosa, J.,Martınez,D.,Olmedo, B.,OjedaEspinoza,C.E.,Nuñez, R., Haylock, M., Benavides, H., Mayorga,R., 2005. Changes in precipitation and temperatureextremesinCentralAmericaandnorthernSouthAmerica,1961‐2003.JournalofGeophysicalResearch,Vol.110,D23107.
Anderson, L., 1991.Mixedblessings: disruption and organization amongpeasantUnions in Costa Rica. LatinAmericanResearchReview26(1),111‐143.
Bougherara,D.,Ducos,G.,2006.Farmers’PreferencesoverConservationContractFlexibilityandDuration,AnEstimation of the Effects of Transactions Costs using Choice Experiment, , Working Paper, INRA,Rennes,France,26pp.
Cash, D., Clark, W.C., Alcock, F., Dickson, N.M., Eckley, N., Guston, D.H., Jäger, J., Mitchell, R.B., 2003.Knowledge Systems for sustainable development. Proceedings of the National Academy of Science(PNAS)100(14),8086‐8091.
Clemen,R.T.,Reilly,T.,2001.MakingHardDecisions,Duxbury,PacificGrove,CA.

104
deGroot,R.B.A.,Hermans,L.M.,2009.Broadeningthepicture:negotiatingpaymentschemesforwater‐relatedenvironmentalservicesintheNetherlands.EcologicalEconomics68,2760‐2767.
Dietz,T.,Ostrom,E.,Stern,P.C.,2003.Thestruggletogovernthecommons.Science302(5652),1907‐1912.Engel,S.,Pagiola,S.,Wunder,S.2008.Designingpaymentsforenvironmentalservices intheoryandpractice:
Anoverviewoftheissues.EcologicalEconomics65(4),663‐674.Ferraro, P., 2008. Asymmetric information and contract design for Payment for Environmental Services.
EcologicalEconomics65(4),810‐821.Fisher, B., Turner, R.K., Morlina, P., 2009. Defining and classifying ecosystem services for decision making.
EcologicalEconomics68,643‐653.Fisher, R.,Ury,W.,Patton, B.,1991.Getting to yes: negotiatingagreementwithout giving in. Eds.Houghton
MifflinHarcourt,200pp.Goldman,R.L.,Thompson,B.H.,Daily,G.C.,2007.Institutionalincentivesformanagingthelandscape:including
cooperationfortheproductionofecosystemservices.EcologicalEconomics65,333‐343.Gregory,R.,Keeney,R.L.,1994.Creatingpolicyalternativesusingstakeholdervalues.ManagementScience40
(8),1035‐1048.Guo, Z., Xiao, X., Li, D., 2000. An assessment of ecosystem services: water flow and hydroelectric power
production.Ecologicalapplications10,925‐936.Habron,G.B.,Kaplowitz,M.D.,Levine,R.L.,2004.AsoftSystemsApproachtowatershedmanagement:aRoad
Saltcasestudy.EnvironmentalManagement33(6),776‐787.Hajkowicz,S.,2009. The evolutionofAustralia’snatural resourcemanagementprograms:Towards improved
targetingandevaluationofinvestments.LandUsePolicy26,471‐478.Hammond, J., Keeney, R.L., Raiffa, H., 1999. Smart Choices: A Practical Guide to Making Better Decisions,
HarvardBusinessSchoolPress,Cambridge,MA.Harsanyji, J.,1982.SubjectiveProbabilityandthcTheoryofGames:CommentsonKadaneandLarkey'sPaper.
ManagementScience28(2),120‐124.Imperial,M.T.,1999. InstitutionalAnalysisand Ecosystem‐BasedManagement: The InstitutionalAnalysisand
DevelopmentFramework.EnvironmentalManagement,24(4),449‐465.Innes, J.E., Booher, D.E., 1999. Consensus building and complex adaptive systems. Journal of The American
PlanningAssociation65(4),412‐423.Ison,R.,Röling,N.,Watson,D.,2007.Challengestoscienceandsocietyinthesustainablemanagementanduse
ofwater:investigatingtheroleofsociallearning.EnvironmentalScienceandPolicy10,499‐511.Kadane, J.B., Larkey,P.D.,1982.SubjectiveProbabilityandtheTheoryofGames.ManagementScience28(2),
113‐120.Kadane, J.B., Larkey, P.D., 1983. The Confusion of Is and Ought in Game Theoretic Contexts. Management
Science29(11),1365‐1379.Kahan, J.P., 1983. On Choosing Between Rev. Bayes and Prof. von Neumann.Management Science 29 (11),
1334‐1336.Kaplowitz, M.D., Hoehn, J.P., 2001. Do focus groups and personal interviews cast the same light on natural
resourceevaluation?.EcologicalEconomics36(2),237‐247.Keeney,R.L.,Raiffa,H.,1991.StructuringandAnalyzingValuesformulti‐partynegotiations,inYoungH.P.,(ed.)
1991.NegotiationAnalysis.UniversityofMichiganPress.AnnArbor.Keeney, R.L.,1992.Value‐focused thinking:apath tocreativedecision‐making.HarvardUniversityPress,432
pp.Keeney,R.L.,McDaniels,T.L.,1992.Value‐focusedThinkingaboutstrategicdecisionsatBChydro.Interfaces22,
94‐109.Keeney,R.L.,Raiffa,H.,1993,DecisionswithMultipleObjectives:PreferencesandValueTradeoffs,Cambridge
UniversityPress,Cambridge,UK.Keeney,R.L.,1994.Usingvaluesinoperationsresearch.OperationResearch42(5),793‐813.

105
Keeney, R.L., 1996. Value‐focused thinking: identifying decision opportunities and creative alternatives.EuropeanJournalofOperationalResearch92(3),537‐549.
Keeney, R.L., McDaniels, T.L., Ridge‐Cooney, V.L., 1996. Using values in planning wastewater facilities formetropolitanSeattle.JournaloftheAmericanWaterResources32(2),293‐303.
Kosoy,N.,Martinez‐Tuna,M.,Muradian, R.,Martinez‐Allier, J.,2007. Payments forenvironmental services inwatersheds:insightsfromacomparativestudyofthreecasesinCentralAmerica.EcologicalEconomics61(2‐3),446‐455.
Magrin,G.,GayGarcía,C.,CruzChoque,D.,Giménez,J.C.,Moreno,A.R.,Nagy,G.J.,Nobre,C.,Villamizar,A.,2007. Latin America. Climate Change 2007: Impacts, Adaptation and Vulnerability. Contribution ofWorkingGroupIItotheFourthAssessmentReportoftheIntergovernmentalPanelonClimateChange,Parry,M.L.,Canziani,O.F.,Palutikof,J.P.,vanderLinden,P.J.,Hanson,C.E.,Eds.,CambridgeUniversityPress,Cambridge,UK,581‐615.
Marchamalo,M.,Romero,C.,2007.Participatorydecision‐makinginlanduseplanning:anapplicationinCostaRica.EcologicalEconomics63(4),740‐748.
McDaniels,T.L.,Gregory,R.S.,Fields,D.,1999.Democratizingriskmanagement:successfulpublicinvolvementinlocalwatermanagementdecisions.RiskAnalysis19(3),497‐510.
McDaniels,T.L.,Thomas,K.,1999.Elicitingpreferencesforlandusealternatives:astructuredvaluereferendumwithapprovalvoting.JournalofPolicyAnalysisandManagement18(2),264‐280.
McKenzie,S.H.,1997.TowardIntegratedResourceManagement:LessonsabouttheEcosystemApproachfromtheLaurentianGreatLakes,EnvironmentalManagement21(2),173‐183.
Millennium Ecosystem Assessment (MEA), 2005. Ecosystems and human well‐being: hydrological ecosystemservicesreport.IslandPress,WashingtonD.C.,USA.
Miranda,M.,Dieperink, C.,Glasbergen, P.,2007.Voluntaryagreements inwatershedprotection experiencesfromCostaRica.Environment,DevelopmentandSustainability9,1‐19.
Morgan,M.G., Fischhoff, B., Bostrom,A., Atman, C.J., 2002. Risk communication: amentalmodel approach.CambridgeUniversityPress,354pp.
Pagiola,S.,2008.PaymentsforenvironmentalservicesinCostaRica.EcologicalEconomics65(4),712‐724.Pagiola, S., Arcenas, A., Platais, G., 2005. Can Payment for Environmental Services help reduce poverty? An
explorationoftheissuesandtheevidencesfromLatinAmerica.WorldDevelopment33(2),237‐253.Parkhurst,G.M.,Shogren,J.F.,2007.Spatial incentivestocoordinatecontiguoushabitat.EcologicalEconomics
64,344‐355.Pimentel, D., Harvey, C., Resosudarmo, P., Sinclair, K., Kurz, D., McNair, M., Crist, S., Shpritz, L., Fitton, L.,
Saffouri, R., Blair, R., 1995. Environmental and economic costs of soil erosion and conservationbenefits.Science267(5201),1117‐1123.
Ponce, L.O., 2006. Economic instruments inwatermanagement: the caseof Costa Rica.Natural and EnergyResources,UnitedNationsEconomicCommissionforLatinAmerica(ECLAC),Mexico,p.59.
Raiffa,H.,1982.TheArtandScienceofNegotiation.BelnapPress,Boston.Raiffa,H.,Richardson,J.,Metcalfe,D.,2002.Negotiationanalysis:thescienceandartofcollaborativedecision‐
making.HarvardUniversityPress,548pp.Roth,A.,Schoumaker,F.,1983.ExpectationsandReputations inBargaining:AnExperimentalStudy,American
EconomicReview83(73),362‐372.Rothkopf,M.H.,1983.ModelingSemirationalCompetitiveBehaviour,ManagementScience29(11),1341‐1346.Sanchez‐Azofeifa, G.A., Pfaff, A., Robalino, J.A., 2007. Costa Rica’s Payment for Environmental Services
program:intention,implementationandimpact.ConservationBiology21(5),1165‐1173.Scholz, R.W., Tietje, O., 2002. Embedded Case Study Methods: Integrating Quantitative and Qualitative
Knowledge.ThousandOaks‐SagePublications,392pp.Scholz,R.W.,Stauffacher,M.,Bösch,S.,Krütli,P.&Wiek,A.(Eds.).(2007).EntscheidungsprozesseWellenberg
‐ Lagerung radioaktiver Abfälle in der Schweiz. ETH‐UNS Fallstudie 2006 [Decision processes

106
Wellenberg ‐ Radioactive Waste in Switzerland. ETH‐NSSI Case Study 2006]. Zürich, Chur: VerlagRüegger.
Sebenius,J.K.,1992.Negotiationanalysis:acharacterizationandreview.ManagementScience38(1),18‐38.Smith,G.,2001.Takingdeliberationseriously:institutionaldesignandgreenpolitics.EnvironmentalPolitics,10
(3),72‐93.Southgate, D., Macke, R., 1989. The downstream benefits of soil conservation in ThirdWorld Hydroelectric
Watersheds.LandEconomics65(1),38‐48.Vignola,R.,Koellner,T.,Scholz,R.W.,McDaniels,T.L.,2009.Decisionmakingbyfarmersregardingecosystem
services:factorsaffectingsoilconservationeffortsinCostaRica.SubmittedtoLandUsePolicy.Wilson,M.A.,Howarth,R.B.,2002.Discourse‐basedvaluationofecosystemservices:establishingfairoutcomes
throughgroupdeliberation.EcologicalEconomics41(3),431–443.Wossink, A., Swinton, S.M., 2007. Jointness in production and farmers’ willingness to supply non‐marketed
ecosystemservices.EcologicalEconomics64(2),297‐304.Wünscher,T.,Engel,S.,Wunder,S.,2008.Spatialtargetingofpaymentsforenvironmentalservices:Atoolfor
boostingconservationbenefits.EcologicalEconomics65(4),822‐833.Wunder, S., Engel, S., Pagiola, S., 2008. Taking stock: a comparative analysis of payments for environmental
servicesprogramsindevelopedanddevelopingcountries.EcologicalEconomics65(4),834‐852.Young,H.P.,1991.Negotiationanalysis.UniversityofMichiganPress,204pp.Zbinden,S.,Lee,D.R.,2005.Payingforenvironmentalservices:ananalysisofparticipationinCostaRica’sPSA
program.WorldDevelopment33(2),255‐272.

107

108
5. Governance across-scales: regulatory mismatches and the role of boundary organizations for soil regulation-services under climate change in Costa Rica
Authors:RaffaeleVignola,TimL.McDanielsandRolandW.Scholz.
Paperstatus:submittedtoJournalofGlobalEnvironmentalChange.
Abstract
The degradation of ecosystem services such as soil erosion control results from complex
interaction of climate extremes and soil management decisions. This complexity poses new
challenges to governance systems for the definition of strategies to adapt to these changing
conditions.Regulatoryframeworkandaccesstoinformationdeterminethecapacityofactorsto
achievetheirgoalsandcontributetosoilerosioncontrol.Inthispaper,weusethecasestudyof
Birris watershed where the degradation of Soil Regulation Services of upstream ecosystems
affects both upstream farmers and downstream hydropower dams. The Birris watershed, as
otherpartsofCentralAmerica,ischaracterizedbyhighlanduseconflict(duetohighslopesand
soil‐intensive agriculture) and is highly vulnerable to increasing precipitation extremes. We
analyzeformal regulatoryframeworkand information‐exchangenetworksthatcharacterizethe
constellationofactorsacrossscalesthatdirectlyorindirectlyinfluencetheprovisionanduseof
these ecosystem services. Our results show that two important regulatorymismatches across
scales affect the definition of societal responses at the local level (i.e.where direct actions to
promote adequate provision and use of ES happen). Additionally, through analysis of
information‐exchange networks among actorswe identify an important boundary organization
such as the watershed agricultural extension office that helps diffusing information from
differentscalesandpolicyareas.Theformalizationoftheboundaryroleofthisorganizationcan
revealastrategicstepinpromotingadaptivegovernance.Indeed,thiscanimprovethecapacity
of this organization to systematically recollect evidences of impacts on and responses to soil
degradation in the area. Adaptive governance can benefit from the dissemination of this
information to actors that play an important role in formulating regulations, allow and design
economic incentives and implement scientific research on the degradation of soil regulation
services.

109
Keywords:Ecosystemservices,adaptationtoclimatechange,adaptivegovernance, information
exchangenetworks.
5.1Introduction
TheMillenniumEcosystemAssessment(MEA)paintsagrimpictureof rapidgrowth indemand
for ecosystem services22,while two thirds of ecosystems providing services (ES) are in decline
(MEA,2005).Thepictureisevenmoredisturbingwhenthedisruptiveeffectsofclimatechange
areconsidered(Fischlinetal.,2007).Coordinatedadaptationefforts,withincomplexinstitutional
and governance contexts and under extreme uncertainties are required if ES supplies are to
bettermeetESdemandsunderthepressuresofclimatechange(Hulme,2005;BodinandCrona,
2009). Yet often i) those relying on a specific type of ES are spatially and administratively
differentfromii)thosewhoinfluencethequalityandquantityofthatESprovisionandiii)those
whogenerate,elaborateordisseminateinformationthatisrelevantformanagingthoseES.The
managementofSoilRegulationServices(SRS)providesacaseinpoint.Farmersonupstreamsites
clearlyhaveindividualincentivestoavoiderosionandretainsoilsontheirfarms,butoften lack
technical knowledge,equipment, capital, timeor cooperation of others fo needed inorder to
changepracticestoreduceerosion.Downstreamneighboursandmoredistantwaterusers,such
ashydroelectricelectric facilities,bear costs that couldbeavoided if formal regulationswould
allowmoreresources(e.g.financialandinformation)tobedevotedforupstreamerosioncontrol.
Intheparlanceofeconomists, thepotentialpositiveexternalitiesofSRS inavoidingsiltationof
reservoirsarenotinternalizedintodecisionsbyupstreamfarmers.
Theeffectsofclimatechangeareexpectedtoincreasetheintensityofrainfall,andthusincrease
erosivity,withevenmoresoil loss.Inthiscontext,actorsinvolvedinSRSmanagementdecisions
need appropriate information to guide their technical, administrative and socially‐sensitive
actions on ecosystems. However,most governance systems for ecosystems and adaptation to
climate change, however, are in their initial stages of recompiling information on impacts and
analyzingfeasibleresponses inthefaceofuncertainties (Eastaughetal.,2009). Inthiscontext,
22These include:provisioningservicessuchasfood,water,timber,andfiber;regulatingservicesthataffectclimate,floods,
disease, wastes, and water quality; cultural services that provide recreational, aesthetic, and spiritual benefits; andsupportingservicessuchassoilformation,photosynthesis,andnutrientcycling(MEA,2005,p.9)

110
research is needed to improve understanding of the role of key organizations in information‐
sharingnetworksasastrategicallyfordesigningadaptationresponses.
Information‐sharing among organizations is shaped by an existing set of formal and informal
institutionalstructuresandgovernancearrangementsthatdeterminethecapacityforcollective
responsestoESdegradationproblems(Ostrom,2007).Theseincludeformalgovernanceassetby
lawsandmandates,butalsoinformalinteractionsamongactorsbeyondtheirspecificmandates
andgeographicallocation.Thisgovernancestructureframes,overseesandimplementsresource
management policies from broader levels of governance, such as regional or national or
international,toindividuallandusersatthelocallevel(Adgeretal.,2005).
Recentstudiesofgovernanceforglobalenvironmentalchangehaveidentifiedtwocrucialaspects
foranalysisofsocietalcapacitytodesignandimplementadaptationstrategies.Thefirstconcerns
the interaction of actors at multiple scales of governance needing different detail‐levels of
informationonglobalenvironmentalimpacts(CashandMoser,2000).Often,mismatchesorgaps
ariseinregulatoryeffortsandgovernanceacrossscales,whichcanthwarttheireffectiveness.The
secondreferstotheroleofboundaryorganizationstoserveasconduitsthatprovidelinkages(i.e.
information and knowledge exchange), across scales and organizations belonging to different
communitiessuchasscience,government,andcivilsocietythatmakesdecisions influencingES
management(Agrawalaetal.,2001;Cashetal.,2003;Turtonetal.,2007).Todate,littleresearch
hasconsideredbothofthesethemesinonepaperusingempiricaldata,toseei)howquantitative
network analysis can identify key boundary organizations that may help build linkages across
scales, and how ii) governance systemsmay shape the role of and effectiveness of boundary
organizations. Moreover, little empirical research has, to our knowledge, put emphasis on
networkgovernanceacross‐scalethatisrelevantfortheprovisionofESunderclimatechange.
The objective of this paper is to address these gaps through an empirical case regarding the
provision and use of SRS in the Birriswatershed of Costa Rica.Here, both farmers and a local
electriccompanyareaffectedcorrespondentlyon‐andoff‐sitebyincreasingdegradationofSRS.
We focus on regulatory mismatches and on the identification and analysis of the role of key
actors by using policy network analysis. In the following section we address concepts and
definitionofgovernanceand its relation toecosystemmanagementandadaptation to climate
change for the case of ecosystem services. In Section 3, we describe briefly the case study
111
highlighting the drivers of SRS degradation and actors’ context of SRS provision and use. In
Section4,wepresentthemethodsofanalysisof formalpoliciesandmandatesand, finally, the
structureofpolicynetworkquestionnaireandtheanalysisofnetworkalgorithm.InSection5,key
findings are discussed alongwith existing experiences and concepts for ecosystemgovernance
andadaptationtoclimatechange.InSection6,weprovidegeneralrecommendationsforfurther
research.
5.2Concepts
5.2.1InformationandknowledgeexchangeinESgovernancestructures
Important components of effective ecosystem governance across scales are the exchange of
informationandknowledgeonpotential impactsandavailablealternatives forES conservation
(CashandMoser,2000;Adgeretal.,2005).Whileinformationistheresultofdataanalysis(e.g.
produced to understand impacts, technical solutions, etc.), knowledge results from the
interpretationandcontextualizationof information(i.e. requiresexperienceandunderstanding
ofspecificcontextswhereinformationismeanttobeapplied)(Toimu,1999).Inter‐organizational
informationnetworks,assuggestedbyInstitutionalandOrganizationalLearningtheories,provide
notonlyexchangeofinformation,knowledgeandawareness‐raisingonnewissuesbutalsohave
thepotentialtoprovideimportantinformationoncostsandbenefitsofalternativeswithahigher
persuasivenessdegreethanothersources(Brassetal.,2004).ThisisespeciallyimportantforES
contextswherealargevarietyofactors(whohavedifferentexperiences,interests,mandatesand
understandingofthefunctioningofecosystems,theirdegradationandofthepossibleresponses;
Fisher et al., 2009) interact and exchange information and knowledge in networks in order to
guide their decision‐making. The interchange of information and knowledge depends, among
other things, on politically and economically ambiguous social networks characterizing
governanceofspecificenvironmentalissues(Adger,2003;Folkeetal.,2005;Pellingetal.,2005).
Althoughdebateonthedefinitionofgovernanceisstillopen(Kjær,2004),accordingtoHuitema
etal. (2009),governance is theresultofboththeformallystatedrules (e.g.policies, laws,etc.)
and the informal interactions of actors in networks that promote collective responses to
environmentaldegradationproblems.Thus, formalmandatesand interactionsofdiverseactors
operating at different scales shape relevant opportunities and/or constraints for organizing

112
collective responses to natural resource degradation problems (Uitto, 1997; Koimann, 1999;
Hodge,2001).Buildingontheseauthors,governancethuscomprisestwointer‐relatedaspects:1)
formalrulesdefinedbylawsandofficialmandatesthatexplicitlyframeactors’legitimacyintheir
actions related to the environmental degradation problem at hand, and 2) informal policy
structuresdescribedbyinteractionsinnetworks(Piattoni,2006)thatdeterminetheirsharingof
information and knowledge across scales and policy communities23 (influenced by their
respectivepowerandinterests).
Emphasisontheinformation‐sharingmechanisminthisgovernancesystemisespeciallyrelevant
wherecomplexityanduncertaintiescharacterizingaproblemlikeESdegradation(vanNoordwijk
etal.,2004)requiretheirinformationandknowledgetobeupdatedtofacechangingconditions.
Insuchcontexts,“rigid”policiesmightproveinadequate24;rathertheestablishmentofflexible
rules,andproductionanddisseminationofinformationtoincreaseknowledgeandlearningover
time may be more appropriate (Duit and Galaz, 2008). Sharing information in networks can
promotecommonperceptionandunderstandingoftheproblem,andcapacitytoplanresponses
andmonitortheminawidernumberoforganizations(Cash,2001;vanderBruggeetal.,2007;
Pahl‐Wostletal.,2009).
5.2.2MultiplescalesandregulatorymismatchesforSRS
LandusedecisionsinfluencingboththeprovisionanduseofESaretypicallytakingplace inside
institutionalstructuresthatspanacrossscales(RotmansandRothman,2003).Forourcase,the
life span of downstream hydropower dams depends on the quantity of sediment transported
from uplands (Southgate andMacke, 1989; Guo et al., 2000) while the impacts of erosion on
farmersarevalued inupstreamareas (Pimentel etal., 1995). Thepotential jointgainsamong
these two scales depend on whether there is coordination and information exchange among
differenttypesofactorsoperatingatdifferentscalesandembeddedinlargernetworks.
23 Policy communities are defined by actors sharing experience, common specialist language. A subset of actors in larger
networkssodefinedas“policycommunity”sharesacommonidentityintermsoflanguagesandday‐to‐daypolicy‐making.Forexamples,scientistshavelimitedpresenceintheday‐to‐daypolicy‐makingactivitiesoftheregulators’communitiesand
vice‐versa(HowlettandRamesh,1998).
24RigidpoliciesarereferredtobyDuitandGalaz(2008)asthosethatcanbeelaboratedbasedonhigh scientificcertaintyandclarityonthebehaviourtobe(suchasprohibitiontosmokeinpublicplaces),thenclear‐cutlawsareeffective.

113
Scalesarethusasocialconstructandtheirdefinitiondependsontheperspectivetaken(Cashand
Moser, 2000). Along with these authors, we understand that “scale refers to a specific
geographically or temporally bounded level atwhich a particular phenomena is recognizable”.
Morespecifically,erosionisrecognizableatthefarmlevelwherefarmersmightperceiveitasa
problemaffecting their soil fertility, at thewatershed scalewheredownstreamusersmightbe
affectedbyupstreamactivitiesand, finally,at thenationalscalewhereagriculturalpoliciesand
scientificorganizationsareinterestedinpromotingsoilconservationandagriculturalproduction
potential. Aswe have seen, the degradation of SRS as a social‐ecological problemdepends on
components that range from the very local level (e.g. topography and soil; farm land use
decisions)tothewatershed(e.g.microclimaticconditions;presenceofconservationprograms),
to the national (e.g. distribution of precipitation; laws and incentives), and finally to the
international (e.g. climate change and variability; markets; and, international agreements and
funding) scale. Access to adequate resources such as information and incentives, needed to
supportstakeholders’responsestoESdegradationatagivenscale,isconditionedbycross‐scale
institutionalgapsandmismatches25(CashandMoser,2000).
5.2.3BoundaryorganizationsforESgovernancenetworks
Structural interactions of actors in networks has received increasing attention in social studies
(Borgatti, 2009) and specifically in studies of environmental degradation problems and
adaptation to climate change (Adger, 2003; Brooke, 2002; Jost and Jacob, 2004). Actors’
information exchange in networks is strategically important to effectively plan adaptive
responses (DuitandGalaz, 2008).BoundaryOrganizations (BOs)arekeyactors in information‐
sharing networks, capable of bridging information across scales and knowledge systems.
Boundary organizations provide spaces for changes in cultural aspects by facilitating mutual
understanding of preferences and meanings among different epistemic communities. Indeed,
they promote the creation of boundary packages, such as collaborative partnerships between
farmers, scientists, and policy makers PES schemes (Guston, 2001). Additionally, BOs also
25Forexample,thescaleofinformationproducedbyanactoratnationallevelsuchasacountry‐levelclimatechangeimpactstudiesmight require, inorder toguideactiononES,downscalingof information toa specific siteand communicationof
uncertaintiestonon‐expertaudience.Similarly,nationalactorssuchasregulatorswouldimprovetheiractionsifbuildingonlocalknowledge/experienceonsoilerosion(e.g.constraintsandinnovativesolutioninapplyingsoilconservationpractices).

114
contribute to the stability of multi‐stakeholder processes (involving accountability and
participation) while maintaining information‐sharing mechanisms between science and policy
and supporting both the building and performance of partnerships across scales (Cash 2001;
Guston,2001;Cashetal.2003).
Structural analysis of information‐sharing networks can allow identification of key bridging
organizations(Burt,2005).BOscan,thus,alsobedefinedbystructuralnetworkpropertiessuch
asthenumberofinformationlinksacrossscalesanddifferentpolicycommunities,heterogeneity
oftheactorsconnectedandthedecentralizationlevelofinformationthroughitsnodes(Weible,
2008).ThisstructuraldefinitionhighlightsthepotentialroleofBOstocontributetoanetwork’s
capacitytoi)definewhatandwherearetheESdegradationpriorities,ii)whicharetheavailable
solutions and, finally, iii) how institutional mechanisms could be shaped to implement and
monitor responses (Carlsson, 2008). Structural analytic methods use Betweenness Centrality
(Freeman, 1977) as a measure of actors’ capacity to mediate and influence relations among
actors(BodinandCrona,2009)andgeneratecontagionofideas(Borgatti,2009).
5.3.ContextfortheBirriscasestudy
The Birris sub‐watershed, part of the upper Reventazonwatershed (1500Km2), has an area of
almost five thousands hectares and its population density of 161 inhabitants per square
kilometreisabovethenationalaverage(INEC,2002).SRSdegradationisdeterminedbyexposure
to extremeprecipitation, by the area’s high sloping topography and by land use conflicts. Its
steep landssuffer serious soil erosiondue to intensiveusebyhorticulturalistsanddairy‐cattle,
whichcomprisethemajoreconomicactivity. Itsvulnerabilitytoclimatechange ischaracterized
by observed increases in extremeprecipitation events over the last forty years (Aguilar et al.,
2005)andbytheprojectedclimatechangescenariosfortheregion(Magrinetal.,2007).Thehigh
fragmentation of agricultural family plots and the high market orientation of its production
represent a challenge for existing conservation incentive mechanisms such as PES which are
challenged by high opportunity costs to local farmers (Pagiola, 2008). In this context, the
downstreamhydropowerdamsoftheAdministrativeBoardofElectricServiceofCartago(JASEC)
and of theNational Electric Institute (ICE) suffer the off‐site effects of upland erosion. Several
millionsUS$arespenteachyeartoflushanddredgesedimentsoutofthesedams.Thesefigures

115
are of national interest given that i) the Reventazon watershed is the most important in the
countryforhydropowerproduction;ii)thathydropowerrepresentsmorethantheeightypercent
ofenergysourceinCostaRica;iii)thatcurrentpoliticalgoalsaimatincreasinguseofhydropower
asanationalstrategy(ICE,2007).
5.4Methods
When considering environmental governance, we focus on the analysis of formally stated
objectivesandmandates(e.g.asdefinedbynational laws,decreesandofficialstatements)and
actors’interchangeofinformationwithothers.Definingmanagementofsoilregulationservices
inthecontextofwatershedsrequiresconsiderationofthemultipleactors fromdifferentpolicy
communities (Van Noordwijk et al., 2007). Indeed, governance for provision of ecosystem
services in agricultural landscapes can be described by the interactions of actors focusing on
socialandecologicalsystems(Hodge,2001;Ostrom,2007).Drawingfromthepluralisticapproach
(Cowie, 200526) and the trialoguemodel forwater governance27 (Turton et al., 2007), and the
specificSRSdecision‐makinginterestedactors(Fisheretal.,2009),ourSRSenvironmentalpolicy
systeminvolvesfourpolicycommunities:
1. Directusersofoff‐sitebenefitsofSRS(e.g.hydropowerdamsdownstream);
2. Direct users of on‐site benefits of SRS (also influencing provision off‐site) in upstream
areas(i.e.farmers,theirassociations,civilsocietyinterestedinupstreamconservation);
3. Scientistsprovidingunderstanding,knowledgeontechnicalaspectsofSRSprovision(role
of forests, soil, agriculture and climate on soil erosion) and those involved in
disseminationofscience;and,
4. Regulators providing policy guidelines relevant for the management of watershed and
theirSRS.
26 Cowie (2007) indicate the potential stakeholders to be involved in the design of collective actions for watershedmanagementplanningsuchasrules‐makers(e.g.governmentagencies),actorsdirectlyinvolved inbenefitsand/orcostsofdecisions(i.e.providersandusersofSRS)andpartieswithtechnicalknowledge(e.g.scientistsandtechnicalagencies).27Theseauthorsidentifygovernment(rulemakers),scientistsandcivilsociety(actorsdirectlyandindirectlyaffectedbyESmanagementdecisions)asthreeimportantpillarsofwatergovernance.

116
Defining the network boundary represents the first step in the application of social network
methods(Knoke,1990;WassermannandFaust,1994).Weidentifiedactorsbymeansofatwo‐
stepcomplementaryprocedure,consultingkeydocumentsandinformants(Jost,2004).First,we
identifiedlawsandofficialmandatesrelevantforeachpolicycommunity(PenkerandWytrzens,
2008).Whereorganizationswereexplicitlymentionedinthelaws,theywereincludedinthelist
of actors. Secondly, we complemented this initial list using reputational snowball techniques
(Farquharson, 2005) asking key informants who represented each of our four policy
communities) at different scales to list organizations that they considered to be influential in
issues such as soil conservation, climate studies, land planning, watershed conservation, and
hydropowerproduction.Then,weexplicitlydefinedthoseorganizations(associations,ministries,
privatecompaniesandNGOs)thatactivelycontributetosettingpoliticalagendas,activities,and
proposals,orthatparticipateintheimplementationofpoliciesandactionsinoneofthoseareas
relevant for SRS provision and use. Because individual respondents at one scale within an
organization may not acknowledge all interactions of all departments of his organization,
(Brinkerhoff 1996), we consider sub‐units of such organizations (e.g. departments) as actors
themselves.Thus,we identifiedtheactors/organizationsconcernedwithformulation,advocacy
and selection of alternatives to respond to SRS degradation problems (Knoke, 1990). For the
analysis of formal mandates and objectives, for each identified organization we reviewed
published documents and characterized their relevant tasks for designing and implementing
actions to improve SRS. During the network questionnaire meetings we asked open‐ended
questionsto intervieweesonwhataspectstheyperceivedasabarrierorasanopportunity for
improving their support to SRS provision (McDaniels et al., 2006). These interviews were
transcribed and used to cross‐check and complement our secondary data on laws and official
mandatestoanalyseformalpolicycontext.
5.4.2Networkanalysis
Reflecting theworkofBorgatti (2009),wehave considered fourbasicaspectskey toanalyzing
multi‐actor interactionsusing socialnetwork theory: theoretical framework, research question,
relationsandstructure.OurtheoreticalframeworkrestsontheoriessuchasInstitutionalTheory
(DiMaggioandPowell,1983),OrganizationalLearningTheory(Levitt&March,1988)andtheory
ofAdaptiveGovernance (DuitandGalaz, 2008) all ofwhichemphasize the roleof information

117
transmissionamongactors’networkstopromotelearninganddesignofcollectiveresponses(see
Section 2). Our research question aims to identify key bridging organizations in order to
subsequently contrast their boundary positions with evidence on their current and potential
ability to contribute to networks’ adaptive capacity. Relations refer to the content of the
connection among couples of actors. In our case, this would include information or resource
flows connecting two ormore actors for its relevance to learning (Duit and Galaz, 2008). The
concept of structure refers to the position of ‘nodes’ (i.e. organizations)with respect to other
actorswhenagivenrelationisconsidered.Weemployawidelyusedconcepttostudystructural
positioninnetworks:‘betweenesscentrality’(BC)(Freeman,1977),whichmeasuresthebridging
capacityofanactortoconnectotherpairsofactors.
5.4.2.1Buildingthequestionnairefornetworkanalysis
Weanalysedthreetypesofrelationsbasedonpreviousresearch(Knoke,1990;Cashetal.,2003;
RaabandKenis,2006):
1) Position in inter‐organizational information‐flow networks as a proxy of their bridging
functions between local watershed level and national policy and science‐making; this is
calculatedbyananalysisofapolicynetworkmatrix(seebelow);
2) Perceived influence as a proxy of the persuasive power of an actor given by how he is
perceivedbyothers;
3)Perceivedcompetenceasaproxyoftheperceivedcredibilityof informationproducedbyan
actor by other actors which can influence how effective is this information in promoting
responses.
BuildingonKnoke(1990)andWeibleandSabatier(2005),wepresentedalistoforganizationsto
everyrespondentandaskedthemtousethecorrespondingscalestoindicatehowtheyrelateto
otherorganizations,namely:
1) Please check the corresponding box for those organizations from which you receive
informationusefulforyourdutiesandfunctionsinyourownorganization(i.e.binaryvariable)
2) Please check the corresponding box for those organizations to which you give information
producedbyyourownorganization(i.e.binaryvariable)

118
3)Onascalefromonetofourpleaseratehowinfluentialyouperceiveeachoftheorganizations
inthe list (wherenocheck isnoopinion,1 isvery low influenceand4 is thehighestperceived
influence)
4)Onascalefromonetofourpleaseratehowcompetentyouperceiveeachoftheorganizations
in the list is (where no check is no opinion, 1 is very low competence and 4 is the highest
perceivedcompetence)
5.4.2.2Matrixanalysisofnetworkdata
Networkdatarecompilationwasusedtocreatesymmetricalmatrices(i.e.adjacencymatrix)with
nodes(i.e.organizations)inthefirstcolumnsandinthetoprow,filledwiththevaluesassigned
byeach respondent (on the row)abouthis relation to theothers (i.e. listed in the topofeach
column) (HannemannandRiddle, 2005). Forour study,each relationwasanalyzed through its
specificmatrix, although combinations of relations can be visualized in a single graph. To run
analysisofthematricesweusedUCINET(BorgattiandEverett,2002).Tovisualizeresultsweused
its complementary software NetDraw which allows representation of nodes, relation, and
networkparameters(Brandesetal.,1999).Severalalgorithmsfornetworkanalysisareavailable
intheUCINET‐NetDrawpackage.Forour informationnetwork,weanalyzedparameters largely
usedinpolicynetworkanalysis(Knoke,1990).Wefirstconfirmedinformationflowsbychecking
whetherstated“giveto”informationflowisconfirmedbythereceiver.
Then,weusednetworkalgorithmsforstructuralanalysisofoverallnetworkcharacteristicssuch
as density (defined by the total number of existing ties out of all possible ties) and actors’
Betweenness Centrality ( )BC . Density, defined as ameasure of group cohesion, takes a value
between0(noties)and1(allactorsinter‐linkedtoeachother)istheaverageofthestandardized
actordegreeindexaswellasafractionofthenetworktiesforagivenrelation(Wassermanand
Faust,1994:181).BetweenessCentrality ( )BC measuresthebridgingpositionofanactorandis
determined by an actor’s position with respect to two others (i.e. the minimum required for
definingbridgingpositions)(Knoke,1990;Brandesetal.,2003).Thispositionmeasureofanactor
isformallydefinedbyWassermanandFaust(1994:190)as:
( )( )
jk i
B i
j k jk
g nC n
g<
=!

119
Where ( )B iC n is the Betweeness Centrality of actor i , jkg represents the number of geodesics
linkingactor j withactor k .Then ( )jk ig n is thenumberofgeodesicsbetweenthesetwoactors
thatpassesthroughactor i .Thisalgorithmassumesthatlinks(i.e.informationpaths)haveequal
weight (i.e. probability to be chosen), and that communicationswill travel along the shortest
route(regardlessoftheactorsalongtheroute).Thisindexisthenasumofprobabilitieswitha
minimumof0(iftheactorfallsonnogeodesics)andmaximumgivenbythenumberofpairsof
actors not includingin reached when i falls on all geodesics. Finally, we analyse the average
values of perceived influence ( )Pi andperceived competence ( )Pc that are attributed to each
actorbytheothersinthenetwork.

120
5.6Results
5.6.1Networkboundary,formalpoliciesandmandatesoforganizationsacrossscales
Basedonkeyinformants,analysisofpolicydocumentsandface‐to‐faceinterviewsweidentified
theboundaryofthenetwork(i.e.theconstellationofactors)(Table1).
Table 1: Actors and their scale scope defined by the network boundary for improving SRS in Birris watershed (in Appendix 1 see extended version of organizations’ acronyms, formal mandates).
Scale Policyarea
Regulation Demand Supply Science
Organizations1
Internationaltonational
CRRH,IICA,IUCN
National ARESEP,Agua‐MINAE,
FONAFIFO,CIA
IPN,IMN,INTA,CIA‐UCR,ENCC,PROGAI‐UCR,CADETI
Nationaltolocal
MAG,SINAC‐MINAE,SENARA‐
MAG
ICE,ICE‐UMCRE
IDA,CNP,IMAS CNE
Regional JASEC COMCURE ASA‐Pacaya
Local Municipality Producersassociations(ADICO,ADAPEX,COOPEBAIRES
1Extendedorganizations’namesareinAnnex1.
At the national scale, actors such as IICA and CRRH disseminate information on climate or
agriculture‐related agreements28 that influence benefits and costs of policies dealingwith ES‐
related land uses in the country by providing inputs to design laws, research programs and
mechanismstopromoteSRSconservation.Similarly,largecivilsocietyorganizationssuchasIUCN
organize and participate in national and international initiatives to raise awareness on climate
changeandtheroleofecosystems inadaptationpolicies.Wealsofindorganizationsregulating
and providing incentives for water resources and watershed management in general such as
28UnitedNationFrameworkConventiononClimateChangeor theUS‐CentralAmericaAgreementonFree Trade (CAFTA;withastrongagriculturalcomponent).

121
FONAFIFO,ARESEP andAgua‐MINAE. Forexample, these typesof organizationsestablish rules
that affect the economic efficiency of SRS provision to hydropower production. In the science
policyareawehaveorganizationsdedicatedtoproductionofscientificstudiesonclimatechange,
itsexpectedandobservedimpactsandonbestpracticesforSRSsuchasIMN,CIA‐UCR,CADETI
andINTA‐MAG.Scientificinformationismainstreamedinnationalpoliciesthroughgovernmental
initiatives such as IPN and ENCC also promoting strategic partnerships to initiate actions on
mitigationandadaptation.Otherorganizationsusescientificinformationtodefinepriorityareas
andregulatehowlandusemanagementandchangeshouldcomplywithtechnicalstandardsto
promoteSRSprovisionsuchasCNE,MAGandSENARA.Wealsofindgovernmentagenciesthat
supportprogramsto improvefarmers’well‐beingandreducetheirvulnerabilitytomarketsand
toclimateextremesthroughtraining,disseminationoftechnical informationandbypromoting
partnerships of farmers’ associations thus improving their landmanagement practices such as
IMAS, CNP and IDA. On the demand side of SRS, hydropower company ICEhas interests and
promoteswatershedmanagementinitsprioritywatershedssuchasReventazonthuspromoting
partnershipswithotheractorsalsointerestedincontrollingerosion.
At the regional watershed scale, intermediation between national directives and local
implementation is key to provision feed‐back information in both directions. For example,
nationalpoliticaldirectivesstrivetoempowerwatershedcommitteessuchCOMCUREtoestablish
participatoryanddecentralizedactionstoconserveprioritycatchmentsalso inpartnershipwith
anotherhydropowercompanydemandingSRSasJASEC.Atamorelocalscale,undertherecent
decentralizationeffortsofthenationalgovernment,thelocalmunicipality(MUNI)ismandatedto
regulate landmanagement. In upstream locations, farmers associations, representing small to
medium producers (ADICO, ADAPEXand COOPEBAIRES), share common goals of promoting
productivecapacitiesandmarketingofagriculturalproductsaswellasinformationexchangeon
alternativetechnologiesrelevantforSRS.
5.6.2Structuralanalysisofthegovernancenetwork
ThenetworkrepresentationinFigure1highlightssomeimportantactorsastotheirinformation‐
bridgingpotential.Values inTable2givemorequantitative informationon thenetworkvalues
associated with each actor. Considering that density of ties equal to one represents full
connectionsofallnodes,theoveralldensityofournetworkislow( 0.12D = )withonly214ties

122
present (i.e.outof1722possibleties).Our results fromtheanalysisof BC highlightkeynodes
thatbridgeinformationacrossscalesandpolicyareas29.Althoughthereisarelativecontinuumin
therangeofvalues max min( 52.16; 0.62)BC BC= = , thefirst fiveorganizations30 (IMNethnicunit,
ICE environment, CNE, ASA‐Pacaya and regional SINAC) in Table 2 show high BC values
highlightingtheirbridgingroleforinformationexchangeacrossscalesandpolicyareas.
Figure 1: Structure of the information network showing the actors (node) in quadrants by scale (x) and policy areas (y), the confirmed information flows (arrowed links) and its Betweenness Centrality (size).
29We tried an analysis of only reciprocal ties where actor x and y interchange information in both direction as tried byHannemanRA,RiddleM.(2005).(Hanneman,R.,R.A.,Riddle,M.,2005.Introductiontosocialnetworkmethods.Riverside,California , available at: http://faculty.ucr.edu/hanneman/.)When running this analysis, IDA‐regional is themost centralactorofthewholenetworkandtherestoforganizations’centralitiesaremoreevenlydistributed.However,fromthispointon,wewilldiscusstheresultsofourconfirmed“giveinformationto”matrixthatallowsidentificationofdifferenthigh‐Bcvaluesintheinformationflowmechanismatdifferentscales.30 Considering the continuum of values, in correspondence of the fifth organization there is the highest value‐jump/discontinuity(i.e.6points)tothesixth.

123
The vector measuring perceived influence max min( 3.6; 1.6; 2.9; 3.1)average medianPi Pi Pi Pi= = = =
correlates with the vector measuring Betweenness centrality
( 0.407; 0.05)PearsonR p= < suggesting that bridging positions in the network are associated to
persuasive power. On the other side, Perceived Competence
. .( 2.6; 0.3; 2.7)Mean S D Median
Pc Pc Pc= = = isnotcorrelatedtovaluesofBetweennessCentralitybut
issignificantlyandpositivelycorrelatedtoPerceived Influence ( 0.54; 0.0001)PearsonR p= < (Table
2).

124
Table2:BetweennessCentrality(BC)andPerceivedInfluenceandPerceivedCompetencevaluesin
informationnetwork(organizationslistedfromlargerBCvaluestosmaller).
Perceivedinfluence(Pi) PerceivedCompetence(Pc)
Ties Betweennesscentrality(BC)
Organizations n Pi S.D. n Pc S.E. In Out BCIMNTécnicos 17 3.3 0.9 17 2.8 1.0 11 7 52.2ICEAmbiente 15 3.2 0.8 16 2.7 0.8 5 15 47.4
CNE 26 3.3 0.9 24 2.8 0.9 8 5 39.2ASAPACAYAS 6 3.3 1.2 6 2.8 1.0 2 9 38.0ICEElectricidad 12 3.4 0.8 11 3.1 0.7 2 16 37.1SINACCentral 18 3.4 0.7 17 2.5 0.9 6 10 31.4PROGAI‐UCR 17 2.8 1.0 17 2.7 1.0 9 5 31.3IMNDirección 21 3.4 0.9 21 2.8 1.0 9 4 31.0MAGRegional 21 3.6 0.8 19 3.1 0.9 4 7 29.8ACCVC‐Cartago 19 2.7 1.0 19 2.5 0.9 5 8 28.2
ENCC 21 3.1 1.0 20 2.5 1.1 9 5 27.4INTAPlanton 12 2.7 1.2 10 2.4 0.7 7 6 27.2AGUASMINAE 27 3.4 0.8 27 2.7 0.7 9 3 24.4
INTAST 14 3.1 1.0 13 2.7 1.0 3 9 23.2IDANacional 18 3.1 0.8 18 2.3 0.6 9 3 20.1CNPRegional 14 2.7 0.8 14 2.1 1.0 6 3 18.1
SENARARegional 23 3.2 0.8 23 2.5 0.8 5 7 17.3IDARegional 17 2.9 1.1 15 2.7 1.0 2 6 16.6
JASEC‐Proyectos 17 3.2 1.1 15 2.9 1.1 6 6 16.6FONAFIFO 26 3.4 0.8 25 3.2 0.9 9 2 15.5
IPN 15 2.8 0.8 15 2.1 1.0 9 2 13.9CNP‐Subregional 12 2.1 1.1 11 1.9 0.9 2 4 13.9
MUNI 15 3.1 1.1 13 2.3 0.8 5 6 13.8JASEC‐Gerencia 13 3.2 0.8 12 2.8 0.9 5 5 13.5
UMCRE 16 3.3 0.9 16 3.2 1.0 4 6 13.3CRRH 12 3.3 1.0 12 2.9 1.2 6 2 12.9
COMCURE 20 3.3 0.9 18 2.9 0.9 10 1 10.0ICECENPE 13 3.3 1.0 13 3.0 1.1 5 5 7.6
IMAS‐Regional 12 2.8 1.2 12 2.8 0.9 3 2 7.1ICEPISA 12 3.1 1.1 12 2.8 1.1 3 6 6.8
ARESEPEnergía 16 3.3 1.0 15 2.5 1.1 7 1 6.8ADAPEX 9 2.2 1.3 9 2.9 1.2 5 0 6.0CIA 16 2.6 1.2 16 2.3 0.9 3 5 5.8
JASEC‐Producción 7 2.6 1.1 7 2.6 1.0 1 7 5.7IICA 14 2.6 0.9 14 2.5 0.9 6 1 5.5
ADICO 6 1.7 1.0 6 2.5 1.1 1 4 5.1COOPEBAIRES 7 2.3 1.1 7 2.4 1.0 4 1 4.6SINAC‐ACCVC 18 3.1 0.8 18 2.4 0.9 3 5 3.8
CADETI 6 3.5 0.6 6 2.5 1.2 0 6 3.7ICEProduccion 12 3.5 0.8 12 3.3 0.9 3 2 2.5
CIA‐UCR 8 2.1 1.1 8 2.3 1.2 2 3 2.0UICN 5 2.6 1.1 5 2.8 1.1 1 4 0.6
Atthelocallevel,actorssuchasprivateprovidersofagriculturalinputsandfarmers’associations
(COOPEBAIRES,ADICO,ADAPEX)showverysmall BC values.Theirmaininformationsourcesare
agenciespromotingfarmers’productiveactivities(ASA‐Pacaya,regionalCNPandMAG,andCNE).

125
Watershed level isascalewhereorganizationscanbe importantto informationexchangefrom
local to national scales and across different policy areas. Departments of JASEC and ICE,
exchangeinformationamongthemselvesandwithotherorganizationsattheregionallevelthat
focusonSRSscienceresearchanddissemination,suchasINTA‐Planton,MAG‐regionalandASA‐
Pacaya,allofwhomshowhigh BC andaperceivedcompetenceandinfluencevalue( 2.8Pc = ;
3.3Pi = . These values are among the highest in the network (i.e. in the percentile 75).
COMCUREshowsalow BC value.Atthenationalscale,the largestBetweenessCentralityvalue
of the IMN ‐technical department is consistent with its mandate to provide information on
climatechangetoawiderangeofactorsindifferentpolicyareas(e.g.technical informationon
extreme events that might affect hydropower production and/or agricultural producers).
Moreover, in linewith itsmandate to coordinate the National Communication toUNFCCC on
bothmitigation and adaptation, IMN recompiles information frommany sectors to synthesize
prioritiesofdifferentsectors.CNE,asanationalorganizationwithlocalbranches(e.g.community
emergencycommittees),bridgesinformationamongusersofSRSatnationalandwatershedlevel
(e.g. ICE‐PisaandJASECcorrespondently),scientificorganizations(i.e.national INTA researching
on soil conservation alternatives) and local committees dealing with landscape management.
Regulatory agencies such as MAG, MINAE, SENARA and institutionalized multi‐stakeholder
committees suchasENCC, IPN,andCADETI have relativelymediumto low BC valuespossibly
due to their recent formationand/ormarginal role in information sharingmechanisms. Finally,
actors at the international‐national interface such as IICA, CRRH and IUCN show low values
possiblyduetothefocusofourlocalcasestudy31.
5.7Discussion
Our results show that beyond the institutional and formal policy framework, organizations
interactandsupportinitiativesacrossscales,buildinginformalpartnershipsandlinkagestocope
withtheirSRSdegradationproblems.Ourformalanalysisofnetworkshasshownthatthereare
keynodes/organizationsthathelpprovideinformationacrossscalesandpolicyareasandwhose
importantroleshouldbere‐evaluatedbynationalpolicies.
31Wecouldhaveexpandedtheboundaryofthenetworktotheinternationalarenabutpotentiallycouldhavelostrelevantdetailsonthenationalnetworksthatinfluencepolicy‐makingforourlocalcasestudy.

126
Someauthorsinrecentarticleshaveoutlinedtheroleofnationalpoliciestoprovideanenabling
institutionalenvironmentandappropriateresourcesforcross‐scalegovernanceofenvironmental
degradationproblems(Adgeretal.,2005;DuitandGalaz,2008).TheintendedgoaloftheCosta
Rican national policy on soil resources (Law 7779) is to “protect, conserve and improve soil
resources in an integrated and sustainable management of other natural resources and by
promotingadequateenvironmentalplanning”, identifying theMinistryofAgriculture (MAG)as
theimplementingagency.Thelawsetstheframeworktoprovideincentives,technicalassistance,
and formation of management committees to foster soil and water conservation. More than
hundredlawsinthecountrydealwithwater‐relatedissues,hinderingtheidentificationofclear
administrative responsibilities for protecting water related ecosystem services such as SRS
(Segura,2004;Mirandaetal., 2006). Inspiteofthis institutionalcontext,ourresultsshowthat
severalactors,followingtheirmandatesand/orinterestshavepromotedcollaborativeeffortsto
buildcapacity,knowledgeandactions(Mirandaetal.,2006)atdifferentscales.
Forexample,IMNalongwithregionalandglobalinterests(PACADIRHandGEF),hasimplemented
projectsonadaptation to climatechange inareas characterizedbyvulnerablewater resources
which have involved many national (including ICE andMINAE) and local organizations. These
results support findings by previous research on inter‐organization networks for biodiversity
conservation and adaptation to climate change (Brooke, 2002). National organizations such as
CNE, IMN, MINAE have conformed to the recommendations of the National Consultative
Commission for Climate Change (2003) to promote adaptation responses in the country.
Similarly,MINAEtogetherwithMAGandCADETIhavebeenpromoting,since2004,aninitiative
topreventlanddegradationthroughcollaborationwithcivilsociety,andlocalinitiativesforland
planningandeconomicdevelopment.
At the local level, farmers, affected by on‐site effects of SRS degradation in upstream areas
searchfor informationontechnologicalalternativesthroughtheirnetworksofprivateagencies
dealingwithagriculturalinputs32and/orthroughinstitutionalchannelsofgovernmentextension
officessuchasASA‐PacayaorMAG.Theseorganizationstransfertechnical/scientificknowledge
onsoilconservationalternativesproducedbynational researchorganizationssuchas INTAand
32Inthecaseofprivateextensionservicesdealingwithagriculturalinputstheremightbeaaconflictofinterestsforthebiastowardsmarketingoftheirownproductstofarmerswhichnotnecessarilyareenvironmentallyfriendly.
127
CIA‐UCR.Similarly,actorsaffectedbytheoff‐siteeffectsofSRSdegradationsuchasJASECandICE
are involved in initiatives to copewithSRSdegradation.These typesofactors implementboth
private corporate responses (Smit et al., 2000) and use institutionalized structures to build
alliances for planning and implementing adaptation responses. For example, JASEC and ICE,
directly bearing the costs of sediments removal from their reservoirs, have adopted corporate
restructuringofdepartmentsreflectingtheneedtorespondtoSRSdegradationcosts.TheJASEC
managementboardhasadoptedaformalresolutiontoinstitutionalizeawatershedmanagement
unit to channel its resources to concrete conservation actions. Similarly, ICE has placed its
formerly separate watershed management unit33 ICE‐UMCRE under the production units to
monitor and cost watershed conservation actions against evidence of benefits in reduction of
operation costs (i.e. sediment removal). As part of these responses, these organizations
promoted collaborations with the ASA‐Pacaya extension office to support dissemination of
innovativesoilconservationpractices.
Thecapacityofthiscross‐scalegovernancesystemtorespondtoSRSdegradationisinfluencedby
distribution and access to funding (e.g. to sustainmonitoring and learningmechanisms across
scales;Brooke, 2002)and information (e.g.onalternatives to respond to changingconditions).
Distribution and access to these resources is influenced by institutionalmismatches (Cash and
Moser,2000).Twoexampleswillhelphighlightinghowinstitutionalmismatchesandinformation
gapscanhinderactors’capacitytocopewithESdegradationproblem.Wethenshow,through
structuralanalysisofinformation‐sharingnetwork,thatBOcanbeanimportantgovernanceasset
tohelpovercomingthesegapsandmismatches.
Thefirstexamplereferstoaccesstofundingforwatershedconservationinitiatives.ARESEP,the
regulatorof tariffs forpublic services, requires sound technicalevidence forassigning rights to
access financial incentives tohydropower investing inwatershedconservation. Inotherwords,
the hydropower facility must provide sound scientific evidence approved byMINAE, that the
investments inwatershedconservationactivitiesarenecessary for the sustainableprovisionof
electric service34. The large uncertainties characterizing SRS provision under climate change
33Thisunitfocusedonbroadintegratedwatershedmanagementactivitiesnotspecificallytighttoproductionofhydropower.34Inthisway,themarginal investmentsmadetopromotewater‐relatedecosystemservicessuchasSRSinthewatershedscanbeconsideredascorrespondingtothemarginalcostofproducingtheserviceandassuchcanbedetractedfromthetaxamountdue.

128
representaseriouschallenge.Inthisrespect,ICE isautonomouslypromotingthe installationof
monitoringstationstomeasuresedimentsfromprioritywatershedswhereconservationactivities
arecurrentlybeingsupported(i.e.toincreaseevidence‐basedinclusionofSRSconservationcosts
inelectrictariffs).Generating informationonsoilconservationactivitiesand itseffectsrequires
ICEtocollaborateandexchangeinformationovertimewithlocalpartnerswhointermediatewith
farmers.
Asecondexampleofscalemismatchisof“assessmentandmanagement”type(CashandMoser,
2000) and is related to the contrast between the activities, defined by national actors, to be
funded for watershed protection (based on the FONAFIFO list of eligible activities) and the
realitiesoflandusesinwatershedswhereJASECandICEareoperatingthatrequireupdatingof
information.EligibleactivitiesundertheFONAFIFOschemeincludeonlytree‐basedlandusesasa
way to protect the provision of water services, used for the calculation of the environmental
tariff(tointernalizetheSRSconservationcosts;Ponce,2006)andisbasedonuncertainscientific
evidence (Locatelli andVignola, 2009).Moreover,emphasison treesexcludes priorityareasof
watershed such as Birris. Here, providing support to technical information agencies (e.g.
improving soil conservation practices) would be amore acceptable alternative to current PES
incentives(Vignolaetal.,2009)whichcannotcompensateforthelargeopportunitycostsfaced
bysmall‐holdershorticulturalists.
Thesemismatchessuggestthatpolicyobjectivestoachievesustainableprovisionofservicesare
challenged by inherent uncertainties in estimating costs and benefits of SRS conservation
responses.Inthiscontext,information‐sharingmechanismscanimprovecapacityofinstitutions
to target investments (i.e. where and what actions) and monitor their effects over time. Our
structuralanalysishighlightsthatsomekeyorganizationsatthenational levelsuchas IMNand
CNE operate within networks for coping with climate change vulnerability and biodiversity
conservation issues in Costa Rica (Brooke, 2002). Although, SINAC, UCR, MAG and other
organizationsappearatthetopofthelist,thehigh BC valuesoftheagriculturalextensionoffice
ASA‐Pacaya deserve discussion.ASA‐Pacaya hasenabled connections between local direct SRS
stakeholders (e.g. providers and users) to others across scales and policy communities. It is
crucialtonotethatattheintermediatescaleofthewatershed,bridgingpositionsareespecially
important. While national policies have designed institutional spaces such as COMCURE to

129
mediateacrossscalesandsectors,theroleofadecentralizedwatershedmanagementinstitution
in information sharing is not yet fully acknowledged by other organizations in the network35
(possiblydueto limitedexperienceandresourceendowment;Diazetal.,2009).Watershedsoil
conservationinitiativescurrentlyinplace,however,suggestthatothermediatorsarefacilitating
relevant partnerships. The bridging position ofASA‐Pacaya, the only non‐national organization
amongthetopfive BC values,resultsfromitsinvolvementininterchangeofinformationacross
scalesandsectors(suchasthoseforSRSconservation).ASA‐PacayaisinvolvedinSRSinitiatives
withactors fromdifferentknowledgeareasofSRSpolicysuchasJASEC, ICE, INTAandCIA‐UCR
reflecting its boundary role. Indeed, this result supports the findings of Cash (2001), which
outlinedthekeyroleofagriculturalextensionorganizationsasboundaryorganizationsspanning
knowledge systems and ofMahanty (2002)who showed that intermediary positions (between
thestateandvillagers in India)arecrucial in facilitatingconservation interventionsforbuilding
trustandthedesignoflegitimatesolutions.
Multiple knowledge systems are required to address the complexities and uncertainties
associatedwithestimatingclimatechangeimpactsonwatershedSRSandthedesignofresponses
(Cashetal.,2003;Hulme,2005;Pellingetal.,2005;DuitandGalaz,2008).ThehighBCvaluesof
ASA‐Pacaya reveal its knowledge‐sharing potential36.ASA‐Pacaya plays an important boundary
role while i) communicating research across scales, ii) translating messages into appropriate
languagesfordifferentsystemsofknowledge(i.e.policyareasorcommunitiesofpractice)andiii)
mediating among the different interests characterizing them. To enhance this role, boundary
objects (e.g. reports, forecasts, models) produced by boundary organizations should be
accountabletobothscienceandpolicycommunitiesandthroughdifferentscalesoforganizations
(Tuinstraetal.,1999;Guston,2001).Anexamplefromourresearchmighthelphighlightthisrole.
ICE needs information on climate extremes events provided by IMN and on the effect of
conservationpracticesinplaceinthewatershedonerosionprovidedbyINTAorCIA‐UCR.These
actors promote and implement soil conservation research projects in collaboration with ASA‐
Pacaya that directlyworkswith farmers. The activities ofASA‐Pacaya include the provision of
35Asshownbythelowcitationininformationexchangebyotheractors.36 A similar use ofBC can be found in the analysis of Leydesdorff (2007) on the knowledge‐sharing potential of scientificjournals where high BC values indicated journals with “strong trandisciplinary contents” (i.e. able to transmit, translateknowledgefromdifferentacademicfields).

130
technicalinformationonsoilconservationalternativestolocalfarmers,supportofnationaland
international research initiatives (e.g. INTA‐INIA’s Planton Pacaya soil conservation project; or
IUCN‐CATIEproject37)focusingonsoilerosioncontrolandclimatechangeimpacts.Theresultsof
suchresearcharepresentedinnationalforaanddisseminatedtorelevantnationalcommittees.
SimilartothecaseoutlinedbyCash(2001),ASA‐Pacayasupportseffortstodefinewaterandsoil
management as a multilevel problem connecting national academic research, watershed
committees,providers(i.e.thefarmers)andusersofSRSsuchasICEandJASEC.
This boundary organization not only transfers information down to farmers, it also feedbacks
information ‘upwards’.Morespecifically, ASA‐Pacaya,dueto its localpresenceandsupportto
farmers’decisionson soilmanagement, feeds informationback to scientistsandpolicy‐makers
supporting 1) identification of new research needs and 2) data recompilation on impacts of
climateextremesonSRSneededtoreduceuncertaintiesinglobalchangeimpactstudies(Ayensu
etal.,1999).Finally,experienceintheUSprovesthatstabilityandresourceendowmentforlocal
technical assistance services are keys to support the monitoring of complex ecosystem
degradationproblems,andtoidentifykeyresearchareaswithlocalstakeholdersespeciallyunder
climatechange(Joyceetal.,2003).Theseauthorsstresstheneedtoinstitutionalizethesetypes
of services to improve theadaptive capacityof society.Nevertheless, institutionalizationmight
behinderedbyactualresourceendowment,aresultofpastpolicydecisions.Indeed,asoutlined
by Eakin and Lemos (2006), the capacity to provide adaptive responses to environmental
degradationproblemof LatinAmericanStates (e.g. toprovide stable support for theboundary
workofagriculturalextensionoffices)hasbeenreducedbypastdecisions.Inourcase,theactual
resourceendowmentofASA‐Pacaya results fromdecisions to reduce publicexpenditure taken
undertheimplementationofStructuralAdjustmentprogramsbackinthe1980s(LeclercandHall,
2007). A limitation of our approach was determined by the static perspective we have on
information‐sharingnetwork. Indeed,SRSprovisionandusehappens in localcontextsandover
time.Moreover,actorsinvolvedininformation‐sharingnetworksmodifytheirunderstandingand
interests,andshapetheirpreferencesonalternativeactionsovertime.Furtherresearchwould
consideranalyzingthehistoricalevolutionofideas,actionsandpolicyissuesraisedovertimeasa
consequenceofnetworkinterchangeofinformationinCostaRica.
37Thisprojectanalysedfuturepotentiallandusescenariosandtheireffectsonon‐siteandoff‐siteeffectsonSRSprovision.

131
5.8Conclusions
Weaddressedtwoimportantaspectsofgovernancesystemforecosystemservicesunderclimate
change,namely: institutionalmismatchesandtheroleofboundaryorganizations.Weanalysed
acrossscalesthroughanempiricalstudy,formalregulationsandmandatesthatframeactionsof
relevant actors to design responses to SRS degradation and inter‐organization information‐
sharing networks. We identified important regulatory mismatches affecting access to scarce
financial resources. We also identified, through policy network analysis, important boundary
organizationsthathavepotentialtofosteradaptiveresponsesingovernancenetworks.However,
pastdecisionshaveweakenedtheoperationalcapacityofthisboundaryorganization.Ourstudy
suggeststhatinstitutionaleffortstostrengthentheboundaryroleplayedbytheextensionoffice
could benefit continuous learning which is a prerequisite of adaptive governance. Further
researchmightshedlightoni)howtheinformationtimelinessandresolutionscalesbydifferent
actors provides sufficient for organizations’ decision‐making processes, and ii) how networks
evolveovertimeandunderdifferentpolicyconstraintsandopportunities.
5.9References
Adger,W.N., 2003. Social capital, collective action, and adaptation to climate change. Economic Geography79(4),387‐404.
Adger,W.N., Brown, K., Tompkins, E.L., 2005. Thepolitical economyof cross‐scale networks in resource co‐management.EcologyandSociety10(2).
Agrawala, S., Broad, K., Guston, D.H., 2001. Integrating climate forecasts and societal decision making:challenges toan emergentboundaryorganization.Science, Technology,&HumanValues 26(4),454‐477.
Aguilar,E.T.,PetersonC.,Ramırez,P.,Frutos,R.,Retana,J.A.,Solera,M.,Soley,J.,GonzalezGarcıa, I.,Araujo,R.M., Rosa Santos, A., Valle, V.E., Brunet, M., Aguilar, L., Alvarez, L., Bautista, M., Castañonp, C.,Herrera,L.,Ruano,E.,Sinay,J.J.,Sanchez,E.,HernandezOviedo,G.I.,Obed,F.,Salgado,J.E.,Vazquez,J.L., Baca,M.,Gutierrez,M.,Centella, C.,Espinosa, J.,Martınez,D.,Olmedo, B.,OjedaEspinoza,C.E.,Nuñez, R., Haylock, M., Benavides, H., Mayorga,R., 2005. Changes in precipitation and temperatureextremesinCentralAmericaandnorthernSouthAmerica,1961‐2003.JournalofGeophysicalResearch,Vol.110,D23107.
Ayensu, E., Van R. Claasen,D., Collins,M.,Dearing, A., Fresco, L., Gadgil,M., Gitay,H., Glaser, G., Juma, C.,Krebs, J., Lenton, R., Lubchenco, J., McNeely, J.A., Mooney, H.A., Pinstrup‐Anderson, P., Ramos, M.,Raven,P.,Reid,W.V.,Samper,C.,Sarukhas,J.,Schei,P.,Tundisi,J.G.,Watson,R.T.,Guanhua,X.,Zakri,A.H.,1999.Internationalecosystemassessment.Science286,685‐686.
Bodin,O.,Crona,B.I.,2009.Theroleofsocialnetworksinnaturalresourcegovernance:whyrelationalpatternsmakeadifference.GlobalenvironmentalChange19,366‐374.
Borgatti, S.P., Everett,M.G., Freeman, L.C., 2002.Ucinet forWindows: software for social network analysis,AnalyticTechnologies,Harvard,MA.

132
BorgattiS.2009.Networkanalysisinthesocialsciences.Science,323,892‐895.Brandes, U., Kenis, P., Raab, J., Schneider, V.,Wagner,D., Explorations into visualizationof policy networks.
JournalofTheoreticalPolitics11(1),75‐106.Brass,D.J.,Galaskiewicz,J.,Greve,H.R.,Tsai,W.,2004.Takingstockofnetworksandorganizations:amultivelel
perspective.AcademyofManagementJournal24(6),795‐817.Brinkerhoff,D.W., Coordination issues in policy implementationnetworks: an illustration fromMadagascar’s
EnvironmentalActionPlan,WorldDevelopment24(9),1497‐1510.Brooke, C., 2002. Climate change, vulnerability and conservation in Costa Rica: An investigation of impacts,
adaptive environmental management and national adaptation networks. PhD thesis, Oriel College,Oxford,UK,253p.
Brooke, C., 2002. Climate change, vulnerability and conservation in Costa Rica: An investigation of impacts,adaptive environmental management and national adaptation networks. PhD Thesis, School ofGeographyandtheEnvironment,OrielCollege,OxfordUniversity,Oxford,UK..
Burt,R.S.,2005.Brokarageandclosure:anintroductiontosocialcapital.OxfordUniversityPress,UK,279pp.Carlsson,L.,Sandstrom,A.,2008.Networkgovernanceofthecommons.InternationalJournaloftheCommons
2(1),33‐54.Cash, D.W., 2001. In order to aid in diffusing useful and practical information: agricultural extension and
boundaryorganizations”.Science,TechnologyandHumanValues26(4),431‐453.Cash,D.W.,MoserS.C.,2000.Linkingglobalandlocal scales:designingdynamicassessmentandmanagement
processes.GlobalEnvironmentalChange10,109‐120.Cash, D.W., Clark, W.C., Alcock, F., Dickson, N.M., Eckley, N., Guston, D.H., Jager, J., Mitchell, R.B., 2003.
Knowledge systems for sustainable development. Proceedings of the National Academy of Science(PNAS)100(14),8086‐8091.
Cowie, G.M., Borrett, S.R., 2005. Institutional perspectives on participation and information in watermanagement.EnvironmentalModelling&software20,469‐483.
Diaz, A., Locatelli,B., Vignola, R., Prins, C., 2009. Evolución de instituciones adaptativas frente a problemashidrológicos endos cuencas de Costa Rica. Submitted toRevista de RecursosNaturales y Ambiente,CATIE,CostaRica.
DiMaggio,P.J.,Powell,W.W.,1983.Theironcagerevisited:Institutionalisomorphismandcollectiverationalityinorganizationalfields.AmericanSociologicalReview48,147–160.
Duit,A.,Galaz,V.,2008.Governanceandcomplexity:emergingissuesforgovernancetheory.Governance:aninternationaljournalofPolicy,AdministrationandInstitutions21(3),311‐335.
Eakin,H., Lemos,M.C.,2006.Adaptationand thestate: LatinAmericaand thechallengeofcapacity‐buildingunderglobalization.GlobalEnvironmentalChange16,7‐18.
Eastaugh,C.,Reyer,C.,Gonzalez‐Moreno,P.,Jian,W.,Biscaia,A.G.,Pentelkina,O.,2009.Forestagencies’earlyadaptations to climate change. International Union of Forest Research and Organizations (IUFRO)OccasionalPaper23,ISSN1024‐414X.
Engel,S.,Pagiola,S.,Wunder,S.,2008.Designingpaymentsforenvironmentalservicesintheoryandpractice:Anoverviewoftheissues.EcologicalEconomics65(4),663‐674.
Farquharson,K.,2005.Adifferentkindofsnowball:identifyingkeypolicymakers.InternationalJournalofSocialResearchMethodology8(4),345‐353.
Fischlin, A., Midgley, G.F., Price, J.T., Leemans, R., Gopal, B., Turley, C., Rounsevell, M.D.A., Dube, O.P.,Tarazona, J., Velichko, A.A., 2007: Ecosystems, their properties, goods, and services. Climate Change2007: Impacts, Adaptation and Vulnerability. Contribution of Working Group II to the FourthAssessmentReportof the Intergovernmental PanelonClimateChange,M.L.Parry,O.F.Canziani, J.P.Palutikof,P.J.vanderLindenandC.E.Hanson,Eds.,CambridgeUniversityPress,Cambridge,211‐272.
Fisher,B.,Turner,R.K.,Morling,P.,Definingandclassifyingecosystemservicesfordecisionmaking.EcologicalEconomics68,643‐653.

133
Folke, C., Hahn, T., Olsson, P., Norberg, J., 2005. Adaptive governance of social‐ecological Systems. AnnualReveiwofEnvironmentalResources30,441‐473.
Freeman,L.C.,(1977).Asetofmeasuresofcentralitybasedonbetweenness.Sociometry40(1),35‐41.Guo, Z., Xiao, X., Li, D., 2000. An assessment of ecosystem services: water flow and hydroelectric power
production.Ecologicalapplications10,925‐936.Guston. D.H., 2001. Boundary organizations in environmental policy and science: an introduction. Science,
Technology,&HumanValues26(4),399‐408.Hodge, I., 2001. Beyond agri‐environmental policy: towards an alternative model of rural environmental
governance.LandUsePolicy18,99‐111.Howlett, M.H., Ramesh, M., 1998. Policy subsystem configurations and policy change: operationalizing the
postpositivistanalysisofthepoliticsofthepolicyprocess.PolicyStudiesJournal26(3),466‐481.Hanneman, R.A., Riddle, M.,2005.Introduction to social network methods. Riverside, CA: University of
California,Riverside(availableathttp://faculty.ucr.edu/~hanneman/Huitema, D., Mostert, E., Egas, W., Moellenkamp, S., Pahl‐Wostl, C., Yalcin, R., 2009. Adaptive water
governance:assessingtheinstitutionalprescriptionsofadaptive(co‐)managementfromagovernanceprespective and defining a research agenda. Ecology and Society 14(1), Online:(www.ecologyandsociety.org/vol14/iss1/art26/
Hulme,P.E.,2005.Adaptingtoclimatechange:istherescopeforecologicalmanagement inthefaceofglobalthreat?JournalofAppliedEcology42,784‐794.
Instituto Nacional De Estadística y Censo Centroamericano de Población (INEC), 2002. Estimaciones yproyeccionesdepoblación1970‐2050.SanJosé,CostaRica,112pp.
InstitutoCostaricensedeElectricidad(ICE),2007.Plandeexpansióndelageneracióneléctrica:periodo2008‐2021. San Jose, Costa Rica 131 pp. Available at:http://www.grupoice.com/esp/ele/planinf/plan_exp.htm)
Jost,F.G.,Jacob,K.,2004.TheclimatechangepolicynetworkinGermany.EuropeanEnvironment14,1‐15.Joyce,L.A.,2003.Improvingtheflowofscientific informationacrosstheinterfaceofforestscienceandpolicy.
ForestPolicyandEconomics,5,339‐347.Kjær,A.M.,2004.Governance.CambridgeUniversityPress,UK,256pp.Knoke,D.,1990.Politicalnetworks:thestructuralperspective.CambridgeUniversityPress,290pp.Koiman,J.,1999.Social‐politicalgovernance:overview,reflectionsanddesign.PublicManagement1(1),67‐92.Leclerc,G.,Hall,C.A.S.,2007.MakingWorldDevelopmentwork:scientificalternativestoneoclassicaleconomic
theory,UNMpress,645pp.Levitt,B.,March,J.G.1988.Organizationallearning.InW.R.Scott&J.Blake(Eds.),Annualreviewofsociology,
PaloAlto,CA.Leydesdorff, L., 2007. Betweenness centrality as an indicator of the interdisciplinarity of scientific journals
58(9),1303‐1319.Magrin,G.,GayGarcía,C.,CruzChoque,D.,Giménez,J.C.,Moreno,A.R.,Nagy,G.J.,Nobre,C.,Villamizar,A.,
2007. Latin America. Climate Change 2007: Impacts, Adaptation and Vulnerability. Contribution ofWorkingGroupIItotheFourthAssessmentReportoftheIntergovernmentalPanelonClimateChange,Parry,M.L.,Canziani,O.F.,Palutikof,J.P.,vanderLinden,P.J.,Hanson,C.E.,Eds.,CambridgeUniversityPress,Cambridge,UK,581‐615.
Mahanty, S., 2002. Conservation and development interventions as networks: the case of the IndiaEcodevelopmentproject,Karnataka.WorldDevelopment30(8),1369‐1386.
McDaniels,T., Longstaff,H.,Dowlatabadi,H.,2006.Avalue‐based framework for riskmanagementdecisionsinvolvingmultiplescales:asalmonaquacultureexample.EnvironmentalScienceandPolicy9,423‐438.
Millennium Ecosystem Assessment (MEA), 2005. Ecosystems and human well‐being: hydrological ecosystemservicesreport.IslandPress,WashingtonD.C.,USA.
Miranda,M., Monge,C.,Otoya,M., 2006.Formulacióndepolíticaspara laadaptacióndelsistemahídricoalcambio climático. Proyecto Fomento de las Capacidades para la Etapa ‐ II de Adaptación al Cambio

134
Climático en Centroamérica, México y Cuba. PNUD‐MINAE‐IMN. Centro Internacional de PolíticaEconómicadelaUniversidadNacional(CIMPE‐UNA).SanJosé,CostaRica.84p.
Ostrom,E.,2007.Adiagnosticapproachforgoingbeyondpanaceas.ProceedingsoftheNationalAcademyofScience(PNAS)104(39),15181‐15187.
Pagiola,S.,2008.PaymentsforEnvironmentalservicesinCostaRica.EcologicalEconomics65(4),712‐724.Pahl‐Wostl,C.,Sendzimir,J.,Jeffrey,J.,Arts,J.,Berkamp,G.,Cross,K.,2007.Managingchangetowardadaptive
watermanagementthroughsociallearning.EcologyandSociety12(2),art.30.Pelling,M., High, C., 2005.Understanding adaptation:what can social capital offer assessments of adaptive
capacity?GlobalEnvironmentalChange15,308‐319.Penker,M.,Wytrzens,H.K.,2008.Evaluatinglandscapegovernance:atoolforlegal–ecologicalassessments.In
Hadorn, H.H., Hoffmann‐Riem, H., Biber‐Klemm, S., Grossenbacher‐Mansuy, H., Joye, D., Pohl, C.,Wiesmann,U.,Zemp,E.,2008.HandbookofTrandisciplinaryResearch,SpringerEds.448pp.
Piattoni,S.,Informalgovernanceinstructuralpolicy.PerspectivesonEuropeanPoliticsandSociety7(1),56‐74.Pimentel, D., Harvey, C., Resosudarmo, P., Sinclair, K., Kurz, D., McNair, M., Crist, S., Shpritz, L., Fitton, L.,
Saffouri, R., Blair, R., 1995. Environmental and economic costs of soil erosion and conservationbenefits.Science267(5201),1117‐1123.
Ponce,L.O.,2006.Los instrumentoseconomicosenlagestiondelagua.ElcasodeCostaRica.UnitedNationsEconomicCommissionforLatinAmerica(ECLAC),D.F.,Mexico,59pp.
Raab,J.andKenis,P.(2006).TakingStockofPolicyNetworks:DotheyMatter?InFischer,F.,Miller,G.J.,andSidney,M.S.,editors,HandbookofPublicPolicyAnalysis:Theory,Methods,andPolitics,number125inPublicAdministrationandPublicPolicy.Taylor&FrancisCRCPress.
Rotmans,J.,Rothman,D.S.,2003.Scaling in integratedAssessment.SwetsandZeitlingerpublishers,Lisse,theNetherlands,355pp.
Segura,O.,2004.AgendaAmbientaldelAguaenCostaRica.RevistaGeográficadeAméricaCentral40,39‐50.Southgate, D., Macke, R., 1989. The downstream benefits of soil conservation in ThirdWorld Hydroelectric
Watersheds.LandEconomics65(1),38‐48.Toimu,I.,1999.Dataismorethanknowledge:implicationsofthereversedknowledgehierarchyforknowledge
managementandorganizationalmemory.JournalofManagementInformationSystems16(3),103‐117.Tuinstra,W.,Hordijk,L.,Kroeze,C.,Movingboundariesintransboundaryairpollutionco‐productionofscience
and policy under the convention on long range transboundary air pollution. Global EnvironmentalChange16(4),349‐363.
Turton, A.R., Hattingh, H.J., Maree, G.A., Roux, D.J., Claassen, M., Strydom, W.F., 2007. Governance as atrialogue:government‐society‐scienceintransition.Springer‐Verlang,Germany,354.
UittoJ.L.,1997.Environmentalgovernanceandtheimpendingwatercrisis.GlobalEnvironmentalChange7(2),167‐173.
Vander Brugge, R., van Raak, R., 2007. Facing the adaptivemanagement challenge; insights from transitionmanagement.EcologyandSociety12(2),art.33.
VanNoordwijk,M., Poulsen, J.G., Ericksen, P.J., 2004.Quantifying off‐site effects of land‐use change: filters,flowsandfallacies.Agriculture,EcosystemsandEnvironment104,19‐34.
vanNoordwijk,M.,Leimona,B.,Emerton,L.,Tomich,T.P.,Velarde,S.J.,Kallesoe,M.,Sekher,M.,Swallow,B.,2007. Criteria and indicators for environmental service compensation and reward mechanisms:realistic,voluntary,conditionalandpro‐poor.WorldForestryCentre,CESScopingStudyIssuepaperno.2.ICRAFworkingpaperno.37,Nairobi,Kenia.
Wasserman,S.,Faust,K.,1994.Socialnetworkanalysis:methodsandapplications.CambridgeUniversityPress,Boston,USA,825pp.
Weible,C.M.,Sabatier,P.A.,2005.Comparingpolicynetworks:marineprotectedareasinCalifornia.ThePolicyStudiesJournal33(2),181‐201.
Weible, C.M., 2008. Expert‐based information and policy subsystems: a review and synthesis. The PolicyStudiesJournal36(4),615‐635.

135

136
6. Conclusions
6.1Researchquestionsandtheirrationales
Thissectiondescribesandsummarizestheframeworkandscopeofthequestionsaddressed in
thisthesis.Thethesisinvestigateshuman‐environmentsystemdimensionsofsoilerosionandits
controlinCostaRica.Theanalysisofthehumansystemrelevantforsoilerosioncontrolrequires
theconsiderationofthedecisionmakingandinteractionsofactorsoperatingatdifferentscales.
Thisismainlyduetohowtheirdecisionsinfluencethespecificdynamicsofsoilerosionthatstarts
inupstreamareaswheretopsoilparticlesaredetachedand,throughwaterrunofftransportation
processes, flows down to downstream areas. Societal responses have been based on
assumptionsonactors’decisionsand interactionsalongtheseenvironmentalprocesses.Society
hashistoricallyassumedan inverse relationshipbetween forest cover inwatershedandwater‐
runoff and this has drivenmost efforts to protectwater resources andwatersheds in general.
However, systematizing peer‐review studies worldwide reveals that these decisions might be
based on uncertain assumptions on the relationship among upstream forest‐cover effects on
water‐relatedecosystemservicessuchascontrolofrunoff(andthuslaminarerosionprocesses).
On the other side, in Costa Rica societal collective responses, characterizing the human
componentofthesystem,haveassumedthatactorsdirectlybenefitingfromon‐siteandoff‐site
SRSsuchasupstreamfarmersanddownstreamhydropowerfacilityrespondmainlytoeconomic
incentives structures. The motivations of these two types of actors to get involved in SRS
managementdependonhowthedegradationofSRSaffectstheiractivities.Morespecifically,for
upstream farmers soil erosion is a concern due to its effects on decreasing soil fertility and
increasingtheneedtorestorethesoilnutrientslost.Ontheotherside,hydropowerfacilitiesare
concernedbythe increasingcostsofmanagingsedimentscomingfromupstreamareastotheir
dams. However, thedecisionsoftheseactorsaredrivenbytheir cognitiveandsocioeconomic
characteristics and by institutional settings in which they are embedded. Indeed, incentive
distributionmechanismsaswellasgeneralinstitutionalsettingshaveimportantconsequenceson
the constraints and opportunities faced by these actors in promoting soil conservation. This
thesishasaddressedquestionsarisingfromthesesocietalassumptionsbyanalyzingthehuman

137
andtheenvironmentsystemsofsoilerosionanditscontrolinthespecificcasestudyoftheBirris
watershedofCostaRica.
Chapter 2 concentrates on the questions related to the environmental consequences of
upstream forest‐cover change on watershed hydrological responses including water runoff
control(animportantdriveroftopsoilerosionanddownstreamsiltation.Firsttheenvironmental
characteristics of the relationship among upstream land uses and downstream hydrological
effectsincludingwaterrunoff,baseflowsandtheregulationofwatercyclewasanalyzed.Then,
in an aggregated meta‐analysis evidences from worldwide watershed experiments on how
upstream complex land‐usemosaics influence hydrological responses influencingwater runoff
andconsequentlytop‐soilerosionwereanalyzed.
Inthefollowingchapters,questionsofthethesisfocusontheconstraintsandopportunitiesfor
the human system to organize collective responses to promote upstream soil conservation
measures (i.e. thus reducing water runoff and its consequences on downstream users of soil
regulation services).Researchquestionsand focus follows themultiple scalesatwhich specific
decision‐makingprocessesarerequired.
So,thequestionsofrelevanceforChapter3focusondecision‐makingoflocalupstreamfarmers.
Theirdecisionsonsoilmanagementdirectly interactwithaclimatic (i.e.precipitation intensity)
and site‐specific (i.e. topography and soil types) to determine the level of provision of soil
regulationservicestodownstreamarea.Thespecificquestionsrefertohowterritorial,cognitive
and socioeconomic aspects combine to characterize different voluntary efforts by farmers to
controlsoilerosion.Thisaddressesthehypothesisthatmainlysocioeconomicaspectsdetermine
the level of conservation efforts implemented by farmerswhile cognitive aspects (such as risk
perceptionsoferosion,valuesandknowledgeoncauses,effectsandsolutions)donot.
Moving at scale of the whole watershed, the analysis of decision‐making processes need
including the analysis of decision‐making and interaction (along the specific processes of
upstream topsoil loss and downstream transportation of sediments) of those directly involved
with the on‐site and off‐site effects of SRS degradation. In Chapter 4, the question on what
institutional characteristics should a collective response among these actors have is analyzed.
Although multiple objectives characterize the definition of common responses among these

138
actors, society has been driven by assumptions on the role of direct economic incentives (e.g.
Payment for Ecosystem Services) to promote socially desired mechanisms. The question
addressedinthischapterreferstowhatotherobjectives,inadditiontodirectpayment‐transfer,
compose a socially desired mechanism and how negotiation analysis can help structuring
collectiveresponsesaccountingforthoseobjectives.
Decisionsofactorsdirectly involvedwithon‐siteandoff‐site consequencesof SRSdegradation
areconstrainedandfosteredbytheiraccesstoproperregulationframeworkandinformation.In
thisrespect,decision‐makingofdifferentactors(i.e.otherthanthosedirectlyinvolvedwithSRS
provision)hasdirectorindirectinfluenceoncollectiveactionstoreduceSRSdegradation.Indeed,
this direct and indirect influence happens in a complexity of contrasting objectives, different
knowledge systems and different information‐needs and ‐exchanges among actors. In this
complex multi‐actors’ setting, research questions for Chapter 5 refer to i) which institutional
mismatchesandgapsconditiondecisionsofthosedirectlyinvolvedinSRSprovisionandbenefits
and ii) which actors play a an important boundary role across scales and knowledge systems
providingspacetoaddressthosemismatchesandgaps.
Finally,intheAnnex2,Idonotaddressaspecificresearchquestionbutpresenttheresultsofa
consultation involvingmore than 80 stakeholders from LatinAmerica involved in research and
policies on ecosystem services and adaptation to climate change. This consultation shows an
interesting match among findings of the thesis and stakeholders’ concerns on the role of
differentactors (i.e.directlyor indirectly involvedwithprovisionanduseofecosystemservices
underclimatechange).
6.2Unansweredresearchquestions,limitationsandfutureresearch
The high complexity of the human‐environment system characterizing SRS on‐ and off‐site
provisionchallengestrandisciplinaryresearchandleavesspacetomanyun‐answeredquestions.
Weherehighlightthemostimportantaspectsthatcouldnotbeaddressedinthisthesisandthat
can be object of future research efforts. Starting with the analysis of the environment
component, we could not include, in our meta‐analysis, paired‐catchment experiments
considering comparisonof runoff responsesofagriculturalwatershedswithdifferenteffortsof
soilmanagementinproductionunits.Increasingevidencesfromaroundtheworldinthisrespect

139
couldimprovealsoinformedtargetingofsoilconservationpoliciesinareasofprioritywatersheds
in developing nations.Moreover, ourmeta‐analysis could not benefit of comparison of forest
covereffect inwatershedswithdifferent levelofsoildegradationasawaytodemonstratethe
beneficialroleofforestinotherregulationservicesassociated,forexample,towaterinfiltration.
The following three papers on the human component, we also outline some un‐answered
research questions on the factors that hinder or promote how individuals’ or collective’s
responsestoSRSdegradationaredesignedandimplemented.
Attheindividualfarmerlevel,ouranalysishasidentified,basedoncombinationofcognitiveand
socioeconomicvariables,groupingsoffarmersaccordingtotheirconservationefforts.Themodel
used expanded the traditional econometric analysis of soil conservation adoption decisions by
addingriskperceptionandknowledge.However,forfutureresearchanalysisoffarmersinternal
networkforinformation‐sharingmightrevealinterestingprocessesofinformationdissemination
thatcomplementandupdatetheirknowledgesoastheirperceptionoftheriskfactorsaffecting
SRSdegradation.
At thewatershed scale level the two‐parties negotiation analysis is only partially covering the
issuesthatmustbetakenintoaccountSRSmanagement.Indeed,spatialaspectsareparticularly
relevantindefiningstrategiestopromotecollectiveactionsespeciallyregardingtheprovisionof
off‐site benefits to downstream actors. Here, more research is required on what strategy is
sociallyacceptableinagivencontexttopromotecollaborationoffarmersbyerosionriskpriority
areas.Morespecifically,soilmanagementdecisionsoffarmersinupperstreamareasdetermine
theefficacyofsoilmanagementpracticesinlowerstreamzones.Inthisrespect,futureresearch
might be interested in looking at the most‐preferred incentives mechanisms to promote
negotiations/cooperationamong farmersaccording to their relative spatial importanceof their
soilmanagementdecisions.Intheanalysisofcross‐scaleinformationnetworkinteractionsfuture
research in the benefit of adaptation planning could analyse the stability of networks under
different sectorial policies that affect objectives and interests of actors to interact and share
information.Consideringthattheroleofextensionofficesisstrategicinadaptivegovernanceof
SRS,athoroughanalysisofincurredcostsandexpectedbenefitsofinvestingintheseservicesin
the face of climate change projected increase in erosive extreme precipitation events might

140
promoterevisionofpastdecisionsthatreducedtheiravailableresourcesandcouldbepartofan
analysisofthebenefitsofSRSprotectioninadaptationplanninginCostaRica.
6.3Mainfindings
In the environment system analysis we could show that, systematizing different studies
comparing theeffectofnatural forest coverandplantations (NFCP)vs. non‐forest cover (Non‐
FC), there is no significant difference in the contribution of these two groups of land uses in
controlling storm flow (Sections 2.3.2 and 2.3.3). Since this hydrological response is a strong
proxyofwaterrunoffandthussoilerosionresultsindicatethatimprovedsoil‐managementalso
inlandswithlowornoforest‐cover(suchasagriculturalandlivestockproductiveunitswithsoil
andwaterconservationpractices)canalsocontributetocontrollingsoilerosion.
Inupstreamlocations,traditionalsocioeconomicvariablesareonlypartiallyinfluencingfarmers’
decisionmakingonsoilconservation.Consistentlywithpreviousliterature,ourfindings(Section
3.4.4) farmsize canbean importantdeterminantof soil conservationbehaviour.Results show
that this is especially true in the case of small farmers where, although showing higher
perception of erosion risk, farm land has a high opportunity costs and the benefits of soil
conservation practices might be perceived too little. In addition to traditional socioeconomic
variables,ourdecisionmodel indicatesthat farmers’awarenessofsoilconservationcausesand
impactsisalsoaprerequisiteofsoilconservationbehaviouralthoughnotsufficient.Indeed,the
locationofproducersinhigherosionareasandinareascoveredbysoilconservationprogramisa
strongdeterminantofsoilconservationbehaviour.Similarly,higherriskperceptionsontherole
ofhumanactivitiesandnegativevalueson theextent towhich technologycanhelpovercome
consequences of topsoil loss are importantly associated to higher farmers’ soil conservation
efforts in upstream areas. Thus, expanding access to programs raising awareness on the
consequencesofhumanactivitiesandlimitationsoftechnologiesinaddressingtheeffectsofsoil
erosioncanproveahighlycost‐effectivestrategytoincreaseSRSprovisionbothon‐siteandoff‐
site.
Atthewatershedscale,applyingnegotiationanalysismethodshelpedoutliningandstructuring
the multiple objectives characterizing parties directly involved with SRS on‐site and off‐site
provision. We could synthesize and present formally and jointly preferences of SRS directly‐

141
relatedactorsover thecharacteristicsofa soil conservationmechanism.Our results show that
key governance aspects such as types of incentives, fairness in distribution of incentives, and
trust in intermediary are essential component to design socially‐desiredmechanisms (Sections
4.5.1.1 and 4.5.1.2). Direct payments for ecosystem services (highly promoted in national
watershedconservationprograms)appearasoneoftheleastpreferred incentivetype.Instead,
technical assistance is seen as an appropriate way to maintain productive activities while
protecting SRS. Intermediary actors are needed to mediate (i.e. to reduce transaction costs)
amongtheincentive‐giversandtheirintendedbeneficiariesthataresupposedtoimplementsoil
conservation.
The analysis of formal policies and mandates (Section 5.6.1) that across scales constrain or
promoteactors’ responses toSRSdegradationhighlighted that institutionalmismatcheshinder
the possibility of farmers and hydropower to access additional resources to promote their
collaborativeefforts.Inthisrespect,formallawsrequireusersofoff‐siteSRSsuchashydropower
companies to demonstrate the real costs and benefits incurred by activities to protect their
priority watersheds as a prerequisite for including an environmental tariff in the electric bill.
However,datascarcityanddeepuncertaintycharacterizesuchstudiesespecially inthecontext
of climate change impacts on soils in the future and possible responses.We usedmulti‐actor
analysis to analyze parameters of information‐sharing network which help highlighting
organizations that play a key role in disseminating information and linking actors at different
scaleandpartofdifferentknowledgecommunitiesinvolveddirectlyorindirectlyinSRSprovision
(Section5.6.2).Concordantlywithprevious research thisanalysis finds that the localextension
office is connecting actors interested in on‐site and off‐site benefits of SRS.Moreover, across
scalestheylinkalsotothescientificcommunitiesthatdesignandimplementresearchtorespond
toSRSdegradation.Thisrole isstrategic inadaptivegovernanceofSRSandnationalregulators
shouldreconsidertheirpastdecisionsinreducingthebudgetexpenseinfavoroftheseservices.
6.4LessonslearnedforothercasesonESdegradation
In this section, the thesis presents conclusions drawn from the Birris watershed case
study on SRS that can be applied elsewhere in ES or specifically SRS contexts of
developing countries. The Birris case study is defined by its strongly market‐oriented

142
agriculture combined with a high population density dependent on land use‐based
activities. Moreover, this context can also be characterized, along with the IPCC
definition,byitsvulnerablecontext.Wecanidentifyprocessesthatincreaseexposureas
indicatedbyobservedandprojectedincreaseinthenumberand/orintensityofextreme
precipitation events.Moreover, agricultural activities pose strong pressure on few‐left
forestresourcesand,duealsotosteepslopes,soilresourcesincreasingsensitivityofthe
systemtoerosion.Basedontheselargelydefineddimensionsofourcasestudywecan
draw lessons that might be relevant for other contexts where society in a given
landscapestronglydependsontheprovisionofecosystemservicesthatarethreatened
bycombined societal and climatechange impacts.These lessons refer to themethods
applied in the thesis to describe, analyze and prescribe actions for planning collective
actionstorespondtoESdegradation.
In developing world, water‐related ecosystem services are at the centre of different
initiatives aiming at sustaining development (e.g. Millennium Development Goals;
national hydroelectricity policies). Protecting or restoring forest cover for its role in
water‐relatedecosystemservices inspecificwatersheds isconsideredanessentialpart
ofthesecollectiveeffortsalthoughtheneededscientificandcontext‐specificevidenceto
makeinformeddecisionisoftenmissing.Generally,thistypeofinformation iscostlyto
produce, requires large series of data and, especially considering the complex climate
change alteration of hydrological cycle, require thorough analysis and clear
communication of uncertainties. In the light of these considerations, some important
hintscanbegivenforwatershedsofdevelopingcountrieswhere,astheBirriscasestudy,
largedeforestationhasalreadyoccurred,market‐orientedagricultureiswellestablished
andhighfragmentationofagriculturalproductiveplotscanbefound. Inthesetypesof
watersheds, it is difficult to hypothesize the design and implementation of large and
extended researchproject to study thehydrologicalbenefitsof increasing forest cover
(needed to provide evidence for improved water‐related services). Limitations are
relatedtothepresenceof importantagriculturalactivitiesthatguarantee livelihoodof
local inhabitants. Thus, considering the above contextual limitations and the
uncertaintiesontheeffectivehydrologicalbenefitsof increasingtreecover,watershed

143
managementplanshouldstrivetofosterindividualandcollectiveresponsestopromote
the role of agriculture in the provision of on‐ and off‐site ecosystem services. Indeed,
agricultural production system can potentially reduce erosion and dam’s siltation by
introducingtechniqueslargelyknowntoagriculturalscientistsandtomanyfarmers.
In this context, the provision of ecosystem services by agricultural systems can be
promoted through a combination of complementary policies. While direct economic
incentives such as PES schemes has been widely promoted as a means to stimulate
individualconservationbehaviour, ithasbeensubjectofseveralcriticsrelatedtosocial
ethics, environmental performance, transaction costs and uncertain opportunity costs
miningitseconomicefficiency.LessonslearnedfromtheBirriscasestudyandthereview
of results from other cases show that policies and programs supporting technical
assistance aswell as awareness‐raising on causes and consequences of environmental
degradation in agricultural landscapes can prove a strong determinant for voluntary
conservationbehaviour.
The methods and tools used to analyze the cross‐scale decision processes of SRS
managementisapplicabletootherSRSwatershedcontextsindevelopingworldaswell
astootherecosystemservicesmanagementsituation.Inthisrespect,individualfarmers’
decision‐making can be studied through a combination of social, economic, territorial
and cognitive aspects. To be broadly applicable to different ES contexts, these
dimensions need to be adapted to reflect the specific barriers and opportunities that
farmersmightfaceinthefaceand/orperceiveofanESotherthanSRS.Forexample,for
the case of global ecosystem services such as climate regulation, the perceived
opportunitiesand institutionalbarrierstoaccess incentives(i.e.transactioncosts)from
carbonmarketsmightbeaveryimportantcognitivefactorinfluencingfarmers’decision
toincreasetreecoverintheirfarms.Movingatlandscapescale,multipleactorsinfluence
directlythelandusedecisionsaffectingtheprovisionofESinaspecificarea.Themethod
proposedinthenegotiationanalysischapterofthethesisopenstheopportunityforjoint
gainsthroughtheanalysisoftheseactors’objectivesandcreationofalternativesshaped
byconverginginterestsandvalues.Apossiblechallengeintheapplicationofthismethod

144
inotherEScontextsmightresideonthesynthesisofi)theobjectivesofmultipleactors
intocreativealternativestoproposefornegotiationofmechanismcharacteristics;andii)
the resultof thepreferenceelicitationexercise.This isespecially thecaseofglobal ES
whereoftenlandowners(especiallyforestcommunities)providingtheserviceofforest
carbonsinks liveawayfrompotentialbuyersandthesetwoactorshavenormally little
experienceofinteractionamongthem.
6.5 Keymessages
Responses to the degradation of Soil Regulation Services require consideration of decision
processeshappeningatmultiplescalesandfacinglargeuncertaintiesonthecombinedeffectsof
landmanagementandclimatechange.Thefollowingthesis’keymessagessuggestactionsthat,
atdifferentscales,canpromoteSRSconservation:
1) Attheindividualfarmerlevel:
a. Promoteawarenessonimpactsproducedbytheinteractionoflandmanagementand
climatechangeamongactorsaffectedbySRSdegradationon‐andoff‐site.
b. Promote support to farmers’ soil conservation behaviour tailored to their specific
productioncontexts(e.g.farmsize).
2) Atthewatershedscale,soilconservationprogramsshouldusenegotiationanalysistoidentify
key componentsofa soil conservationprogramaccording tobothon‐and off‐siteusersof
SRS.Keycomponentsofadaptationresponsesshouldincludepromotionoflearningovertime
(throughtechnicalassistanceandmonitoring)andcost‐effectivedistributionofsupport (i.e.
focusingonerosionpriorityareas).
3) Finally, national agricultural policies in vulnerable regions should consider strengthening
resourcesendowed toagriculturalextension servicesas thesecan representakeyactor in
the implementation of SRS adaptive management across‐scales (i.e. bridging information
fromfarmerstonationalscientificandpolicy‐makingcommunity).

145

146
7.Annexes

147
Annex 1: Extended acronyms of organizations in the network and their specific mandates
PolicyArea Scale Organization
MandaterelevantforBirriscasestudy
Source
Regulatory National Authority
RegulatingPublicServices(ARESEP)
Ensureadequatequalityofpublicservices
includingwaterprovisiontodomestic,agriculturalandhydroelectricusers.
LawoftheRegulatoryAuthorityforPublicServices.Articles:5,6a)yb),9,23y25
Regulatetariffsofpublicservicessuchaselectricbillanddefineitemscoveredbytariffson
electricserviceincludinginternalizationofenvironmental
externalitiesinwatershedmanagement.
RegulationoftheARESEPLaw,Art.5,6a),9,34,47‐52
Legitimizetheinclusionofcostsofwatershedmanagementforhydroelectricity
productioninelectrictariff.
LawauthorizingElectricProduction,Art.5,6,24
Regulate,fiscalandfinancialauditingofpublicserviceproviderssuchas
hydropower.
Nationaltolocal
Waterdepartment‐
Ministryof
Environment
(MINAE)
ØGeneralLawofWater
AdministerallwaterresourcesintheCountry.
ØFrameworkLawfortheEnvironment,Art.50
Leadprocessesfordefiningnationalpolicies
onwater.
ØCodeforMines,Art.4.
Enforcemonitoring,controland
administrationofwaterinthewatershed.
ØRegulatoryLawforPublicServices.TransitorioIV.
Transactnationalconcessionsfor
hydropowerproduction.
Decree26635‐MINAE.TransfertheWaterDept.TotheNationalMeteorologicalInstitute
Operateasinformationdeskforindividualsand

148
Operateasinformationdeskforindividualsand
governmentorganizations.
Auditwaterandprovidesconcessionstousers.
ChairtheAdvisoryBoardonWaterandcoordinatememberinstitutions.
Chargewatertaxtousers(includinghydropower)anddefinemechanismsforidentificationof
priorityareastoinvestforESprovision.
Nationaltolocal
Ministryof
Agricultureand
Livestock(MAG)
Promoteresearchonhydrological,
hydrogeological,agriculturalactivitiesandtheirrelationwithsurfaceandundergroundwater.
1949CreationoftheMAG
Certificaterationalsoilandwateruseinirrigation
concessions.
ØLawN°7779forUse,ManagementandConservationofSoil,Art.6y33
Auditthroughtechnicalstudiestheappropriatemanagementofsoiland
waterandtransmitinformationtoMinistryofEnvironment(MINAE)forcorrespondenteventual
cancellationofconcessions.
ØRegulatoryLawforUse,ManagementandConservationofSoil
Audit,evaluatetechnicalstudiesfordefinitionofappropriateagriculturalusesandzoningofrural
areastodefineappropriatemanagement
accordingtoenvironmental,socialand
agriculturaluse.
ØRegulationfortheControlandRegistrationofDangerousProductsArt.4y12
Defineandcoordinateimplementationof
nationalsoilconservationplansincollaboration
withrelevantagriculturalorganizations.
RegulationforUse,RegistrationandControlofPesticidesArt.2y66
Implementresearchtoimprovelandand
resourcemanagement.
1995DecentralizationprocessunderWorldBankfinancingtoprivatizesomeservices
provisionandcreatingthreemaindivisions:Technologyresearch;ExtensionservicesindecentralizedBaseAgricultureCentres;and
Administration.

149
Promotetrainingtoalllevelsforincreasing
transferofappropriatetechnologiesforlanduseandmanagement;Thiswasformedforanalysis
anddiscussionofagriculturalpolicy‐making.
ThecreationoftheNationalInter‐organizationalForumforAgriculture,Executive
DecreeNº31170‐MAG,2003.
Providetechnicalassistancetoagriculturalproducerstopromote
appropriatelandmanagement.
ConsolidatedNationalNetworkforConservationistAgriculturewithorganizationsasMAG,ICE,ITCR,CNFL,UNED,UCR,UNA,tostrengthenresearchanddevelopmentof
conservationistagriculture. Providecriteriato
evaluateconsequencesofdifferentwateruses
includinghydropowerandagricultureonsoil
resources.
Keepregistersofandmonitororganizationsandindividualsimplementing
soilconservationactivities.
ElaboratedtheAgriculturalStrategy21withSupportofIICAofficeinCostaRica
Maintainadatabankwithregistersofsoil
managementandlandusecapacityincluding
informationonsocioeconomic,technical
andenvironmentalaspects.
TheNationalProgramtoPromoteSustainableAgriculturewasstartedwithIADBloan
1436/OC‐CR(MAG/BID)PFPAS.
Promoteconstantlyparticipationofcivil
societyinsoilconservationactivities
throughitsdecentralizedextensionofficessuchas
ASA‐MAGPacaya.
National NationalFundforForestry(FONAFIFO)
DecentralizedinstitutioninsidetheNational
ForestryAdministrationwithmandateto:
Law71741990(ExecutiveDecreeN.19886‐MIRENEM;
Fundforwatershedandecosystemconservationactivitiestosmallandmediumlandusers;
NormN032,Law7216,1991,Creationofthefund
Fundreforestation,agro‐forestryandregenerationofnaturalvegetationin
priorityareasforwatershedprotection,biodiversity,carbonand
Law7575,Art.46creationofFONAFIFO

150
Fundreforestation,agro‐forestryandregenerationofnaturalvegetationin
priorityareasforwatershedprotection,biodiversity,carbonand
scenicbeauty;
Law7575,Art.46creationofFONAFIFO
Definecriteriaforidentificationofpriorityareaswherefundingshouldbetargeted;
Ensureappropriatefundingtopromote
provisionofappropriatelevelofES;
Defineandimplementmechanismsforfund
assignment.
Nationaltolocal
NationalSystemfor
ProtectedAreas(SINAC‐MINAE)
Decentralizedandparticipatoryorganization
integratingforestry,wildlifeandprotectedareasdepartmentsof
MINAE.
ØLawofCreationofNationalServiceforProtectedAreas,Art.13.
Establishallianceswithrelevantactorstopromotewatershed
protection.
ØBiodiversityLaw,Art.22,25y59.
Defineandenforcerulestoregulatelandusein
protectedareas.
FrameworkLawoftheEnvironment,Art.34.
Local Municipality
Takepartinthelocaladvisoryboard.
ØDecreeN.26635‐MINAE:Art..5y7CreationandFunctionoftheAdvisoryEntityforWater
Promoteprocessesoforganizations
implementingsoilconservationactivities.
ØWaterLaw,Art.31,41,154‐158,177,194‐198
Enforcelocaldecreesandconcessionstoprotect
forestsandwatersourcesinwatershedplanning.
ØDecreeN°26624‐MINAE
Evaluateandprovideapprovalofwatershedmanagementplans.
ØMunicipalCode,Art.4c),6,13d),79y81
Design,planandimplementpoliciesforsustainablenatural
resourcemanagement.
ØGeneralDrinkingWaterLaw,Art.4,5,6,710y11.
Recommendappropriatelegalenforcementfor
protectedareas.
ØLawofCreationofAYAArt.20y22
Enforcerulescorrespondingto
protectionstatusofnaturalareasthrough
decentralizedofficessuchasACCVC‐Cartagointhe
BirrisWatershed,.
ØFrameworkLawoftheEnvironment,Art.60
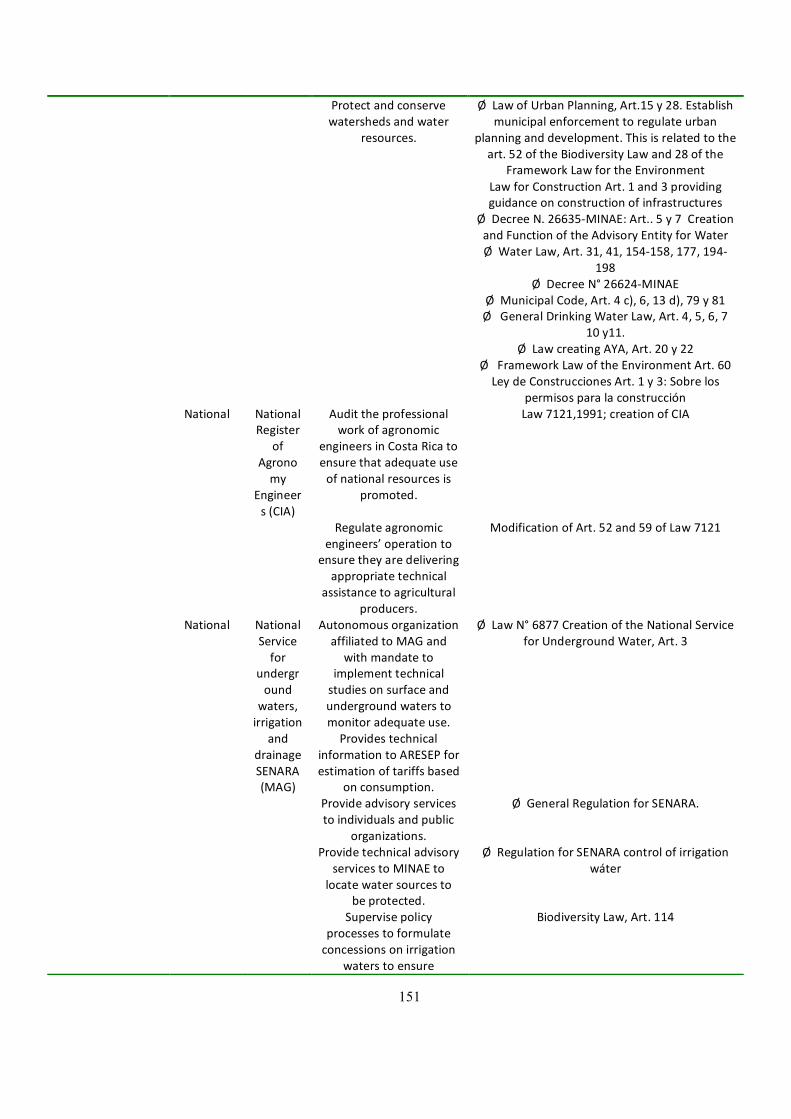
151
Protectandconservewatershedsandwater
resources.
ØLawofUrbanPlanning,Art.15y28.Establishmunicipalenforcementtoregulateurban
planninganddevelopment.Thisisrelatedtotheart.52oftheBiodiversityLawand28ofthe
FrameworkLawfortheEnvironment LawforConstructionArt.1and3providing
guidanceonconstructionofinfrastructures ØDecreeN.26635‐MINAE:Art..5y7Creation
andFunctionoftheAdvisoryEntityforWater ØWaterLaw,Art.31,41,154‐158,177,194‐
198 ØDecreeN°26624‐MINAE ØMunicipalCode,Art.4c),6,13d),79y81 ØGeneralDrinkingWaterLaw,Art.4,5,6,7
10y11. ØLawcreatingAYA,Art.20y22 ØFrameworkLawoftheEnvironmentArt.60 LeydeConstruccionesArt.1y3:Sobrelos
permisosparalaconstrucción National National
Registerof
Agronomy
Engineers(CIA)
Audittheprofessionalworkofagronomic
engineersinCostaRicatoensurethatadequateuseofnationalresourcesis
promoted.
Law7121,1991;creationofCIA
Regulateagronomicengineers’operationto
ensuretheyaredeliveringappropriatetechnical
assistancetoagriculturalproducers.
ModificationofArt.52and59ofLaw7121
National NationalServicefor
undergroundwaters,irrigation
anddrainageSENARA(MAG)
AutonomousorganizationaffiliatedtoMAGandwithmandateto
implementtechnicalstudiesonsurfaceandundergroundwaterstomonitoradequateuse.Providestechnical
informationtoARESEPforestimationoftariffsbased
onconsumption.
ØLawN°6877CreationoftheNationalServiceforUndergroundWater,Art.3
Provideadvisoryservicestoindividualsandpublic
organizations.
ØGeneralRegulationforSENARA.
ProvidetechnicaladvisoryservicestoMINAEto
locatewatersourcestobeprotected.
ØRegulationforSENARAcontrolofirrigationwáter
Supervisepolicyprocessestoformulateconcessionsonirrigation
waterstoensure
BiodiversityLaw,Art.114
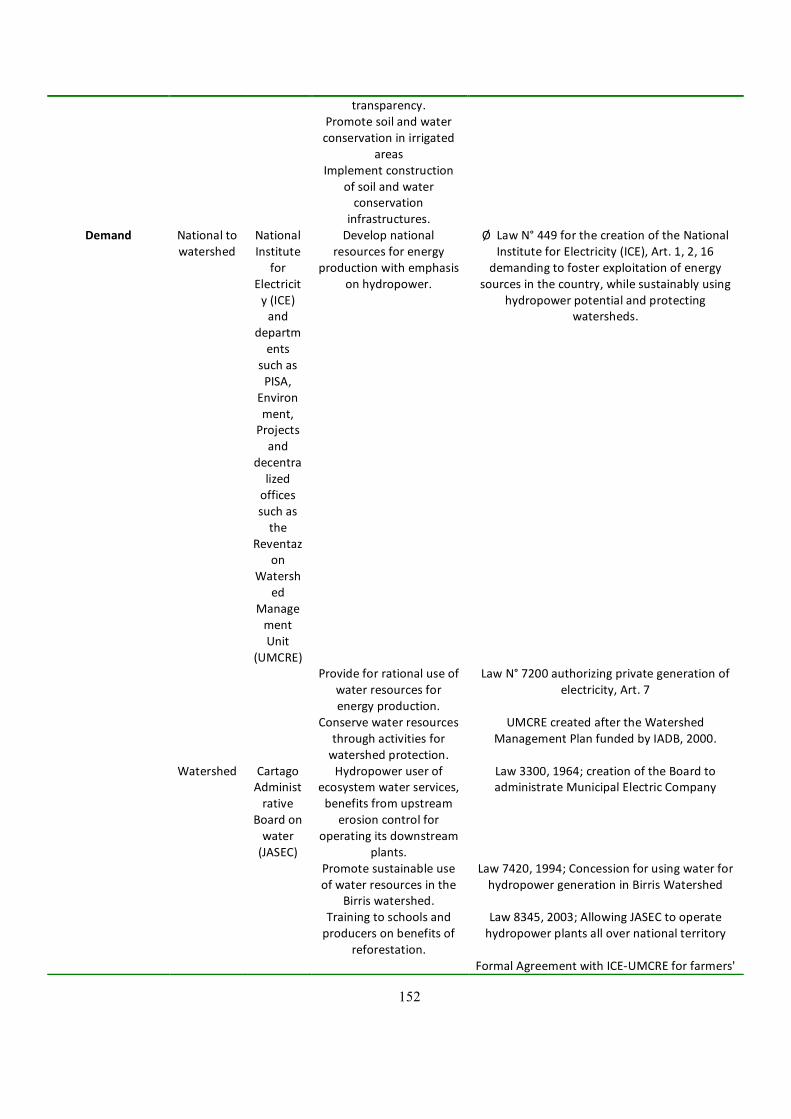
152
transparency. Promotesoilandwater
conservationinirrigatedareas
Implementconstructionofsoilandwaterconservationinfrastructures.
Demand Nationaltowatershed
NationalInstitute
forElectricity(ICE)and
departments
suchasPISA,
Environment,Projectsand
decentralizedofficessuchasthe
Reventazon
Watershed
ManagementUnit
(UMCRE)
Developnationalresourcesforenergy
productionwithemphasisonhydropower.
ØLawN°449forthecreationoftheNationalInstituteforElectricity(ICE),Art.1,2,16
demandingtofosterexploitationofenergysourcesinthecountry,whilesustainablyusing
hydropowerpotentialandprotectingwatersheds.
Provideforrationaluseofwaterresourcesforenergyproduction.
LawN°7200authorizingprivategenerationofelectricity,Art.7
Conservewaterresourcesthroughactivitiesforwatershedprotection.
UMCREcreatedaftertheWatershedManagementPlanfundedbyIADB,2000.
Watershed CartagoAdministrative
Boardonwater(JASEC)
Hydropoweruserofecosystemwaterservices,benefitsfromupstream
erosioncontrolforoperatingitsdownstream
plants.
Law3300,1964;creationoftheBoardtoadministrateMunicipalElectricCompany
Promotesustainableuseofwaterresourcesinthe
Birriswatershed.
Law7420,1994;ConcessionforusingwaterforhydropowergenerationinBirrisWatershed
Trainingtoschoolsandproducersonbenefitsof
reforestation.
Law8345,2003;AllowingJASECtooperatehydropowerplantsallovernationalterritory
FormalAgreementwithICE‐UMCREforfarmers'
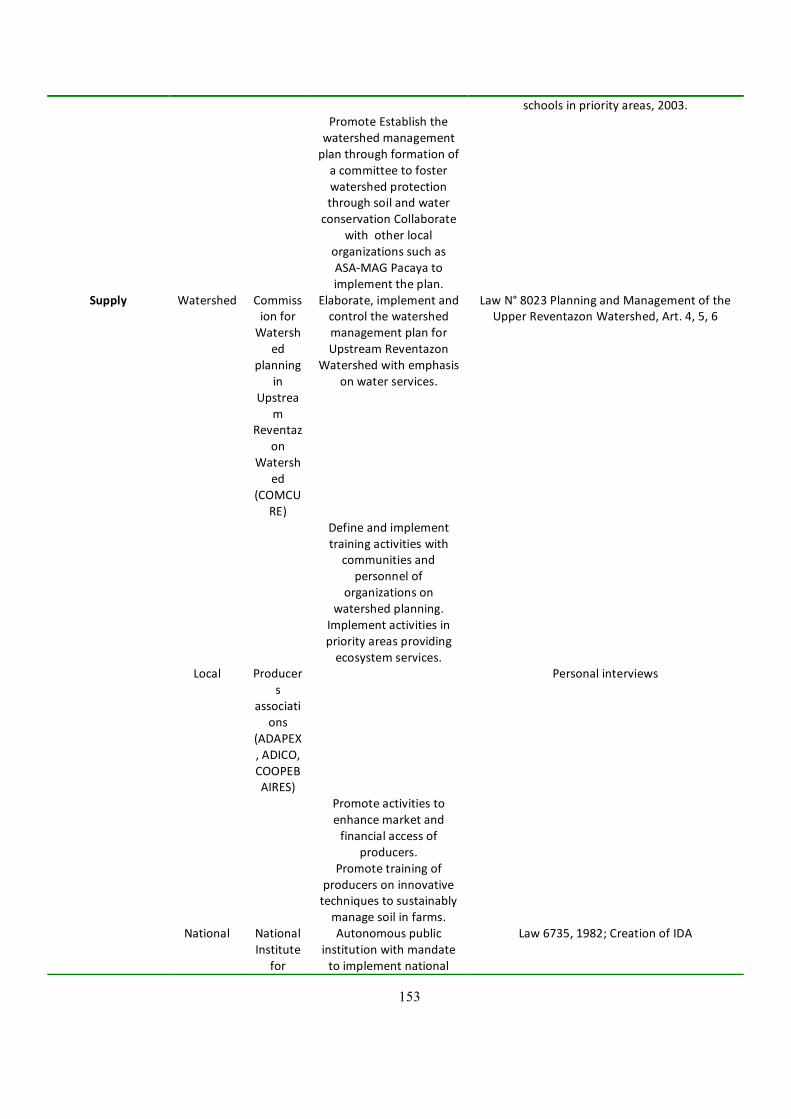
153
schoolsinpriorityareas,2003. PromoteEstablishthe
watershedmanagementplanthroughformationofacommitteetofosterwatershedprotectionthroughsoilandwaterconservationCollaborate
withotherlocalorganizationssuchasASA‐MAGPacayatoimplementtheplan.
Supply Watershed CommissionforWatersh
edplanning
inUpstrea
mReventaz
onWatersh
ed(COMCU
RE)
Elaborate,implementandcontrolthewatershedmanagementplanforUpstreamReventazon
Watershedwithemphasisonwaterservices.
LawN°8023PlanningandManagementoftheUpperReventazonWatershed,Art.4,5,6
Defineandimplementtrainingactivitieswithcommunitiesandpersonnelof
organizationsonwatershedplanning.
Implementactivitiesinpriorityareasprovidingecosystemservices.
Local Producers
associations
(ADAPEX,ADICO,COOPEBAIRES)
Personalinterviews
Promoteactivitiestoenhancemarketandfinancialaccessof
producers.
Promotetrainingofproducersoninnovativetechniquestosustainablymanagesoilinfarms.
National NationalInstitute
for
Autonomouspublicinstitutionwithmandatetoimplementnational
Law6735,1982;CreationofIDA

154
Agriculture
Development(IDA)
agriculturalpoliciesapprovedbyNational
DevelopmentPlanofthenationalEconomicPolicy
PlanningBureau. Providelandandtenure
securitytoproducersLaw2825,1982;RegulationofLanduseto
fosterESprovisionandtenurerights Throughitsdecentralized
officespromotetechnologicalinnovationthroughtrainingonsoilmanagementtechniques,
economicandorganizationof
agriculturalproductionunits.
Nationaltowatershed
NationalCouncilfor
agricultural
production(CNP)
AutonomousinstituteascribedtoMAG,with
mandateto:
LawoftheNationalProducersCouncilreformedbyLaw6050andbyLawnº7742.
Fosteractivitiesthatincreasemarketandfinancialaccessof
producers;
Promoteactivitiesandstrategiesthatimprove
nationalfoodsecurityandsocioeconomicwell‐being
ofproducers;
Supportdisseminationoftechnologicalinnovations
inproduction,industrializationand
marketing;
Supportimportandexportofagriculturalproducersfocussingon
smalltomediumfarmers;
Establishpartnershipswithextensionandtechnicalassistance
programs;
National NationalInstitute
forSocialWelfare(IMAS‐regional)
LawNº4760CreatingtheMixedInstituteforSocialSupportanditsregulationdecreeNº
26940‐MIVAH‐MTSS
Formulateandimplementspolicy
Law8563tosupporttheMixedInstituteforSocialSupporttostrengthenIMASbyuseof

155
guidelinestocombatpovertyincluding
financinginitiativesthatthroughappropriatelandmanagementpromotesocialwelfareand
environmentalbenefits.
tax‐sourcesforpovertyreduction
Supportproducersaffectedbyclimate
extremes.
LawNº7742createstheprogramforagriculturalsectorproductionreformmodifiedbyLaw8563.Regulatesprovisionofresourcestosupportthenationalplanforagricultural
productionreconversion Supportwithsmall
subsidiespoorproducersthatincollaborationwithlocalASA‐MAGPacayaextensionofficeuseappropriatesoil
managementtechniques.
Establishallianceswithotherrelevantactorstoachieveitsgoalsofpovertyreduction.
Science Internationalto
National
RegionalCommitteeforwater
resources(CRRH)
Inter‐governmentalCommissionformedbyrepresentantofnationaltechnicalinstitutesonclimatechangeandhydrometeorologyof
CentralAmericanregion,promoting:sustainableuseandconservationofwaterresourcesthroughdisseminationoftechnical
studies.
Formalcreation1966
Communicatingtolargepublicandorganizationsonclimatechangeandvulnerabilitywater
resourcesanditsusers.
FormalAgreementwithRegionalIUCNheadquartertofosterinitiativesonclimatechangeadaptationinwaterresourcesand
supportregionalparticipationinCopenhagenCOP
Identify,coordinateandfacilitateprocessesand
programsrelatedtowaterresourcesinCentral
America.
Strengthenthelinksbetweenregionalprogramsand
internationalinitiativesdealingwithclimatechange,variabilityand
water.
Internationalto
RegionalInstitute
PartofOrganizationofAmericanStates,itisan
Creationin1948undertheOrganizationoftheAmericanStates(OAS)
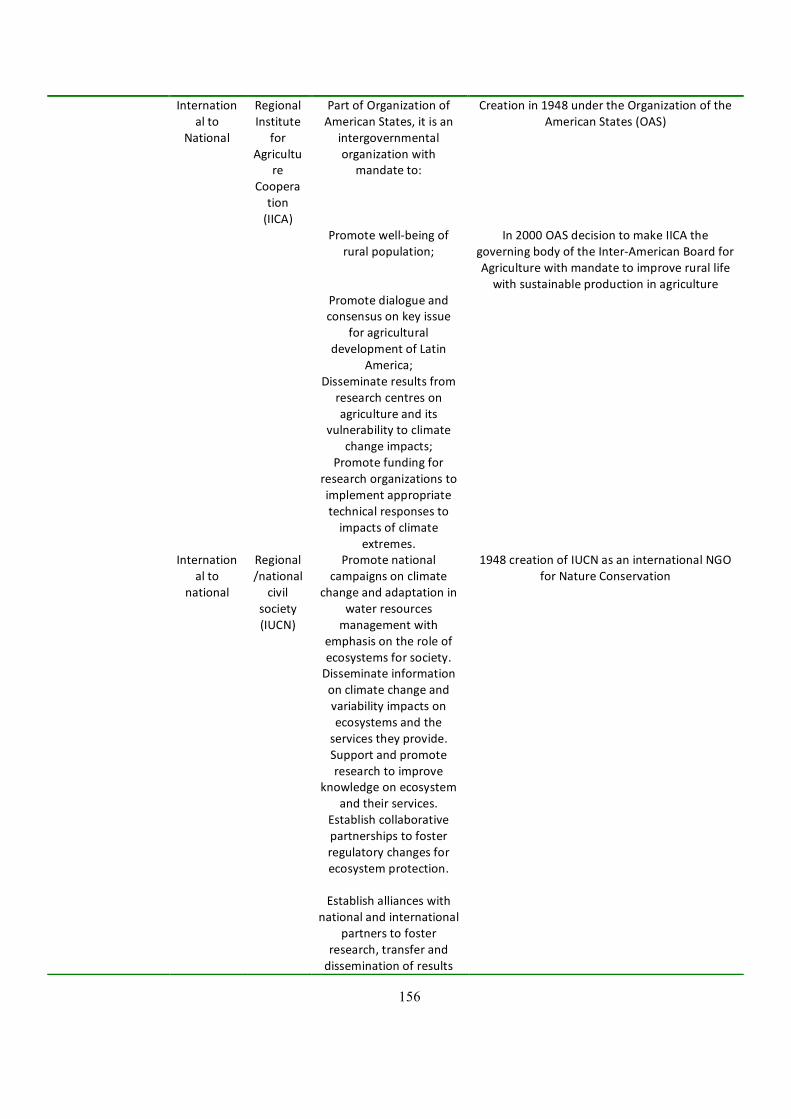
156
Internationalto
National
RegionalInstitute
forAgricultu
reCooperation(IICA)
PartofOrganizationofAmericanStates,itisan
intergovernmentalorganizationwith
mandateto:
Creationin1948undertheOrganizationoftheAmericanStates(OAS)
Promotewell‐beingofruralpopulation;
In2000OASdecisiontomakeIICAthegoverningbodyoftheInter‐AmericanBoardforAgriculturewithmandatetoimproverurallifewithsustainableproductioninagriculture
Promotedialogueandconsensusonkeyissue
foragriculturaldevelopmentofLatin
America;
Disseminateresultsfromresearchcentresonagricultureandits
vulnerabilitytoclimatechangeimpacts;
Promotefundingforresearchorganizationstoimplementappropriatetechnicalresponsestoimpactsofclimate
extremes.
Internationalto
national
Regional/national
civilsociety(IUCN)
Promotenationalcampaignsonclimate
changeandadaptationinwaterresourcesmanagementwith
emphasisontheroleofecosystemsforsociety.
1948creationofIUCNasaninternationalNGOforNatureConservation
Disseminateinformationonclimatechangeandvariabilityimpactsonecosystemsandtheservicestheyprovide.
Supportandpromoteresearchtoimprove
knowledgeonecosystemandtheirservices.
Establishcollaborativepartnershipstofosterregulatorychangesforecosystemprotection.
Establishallianceswith
nationalandinternationalpartnerstofoster
research,transferanddisseminationofresultsforsustainableuseof
lands.
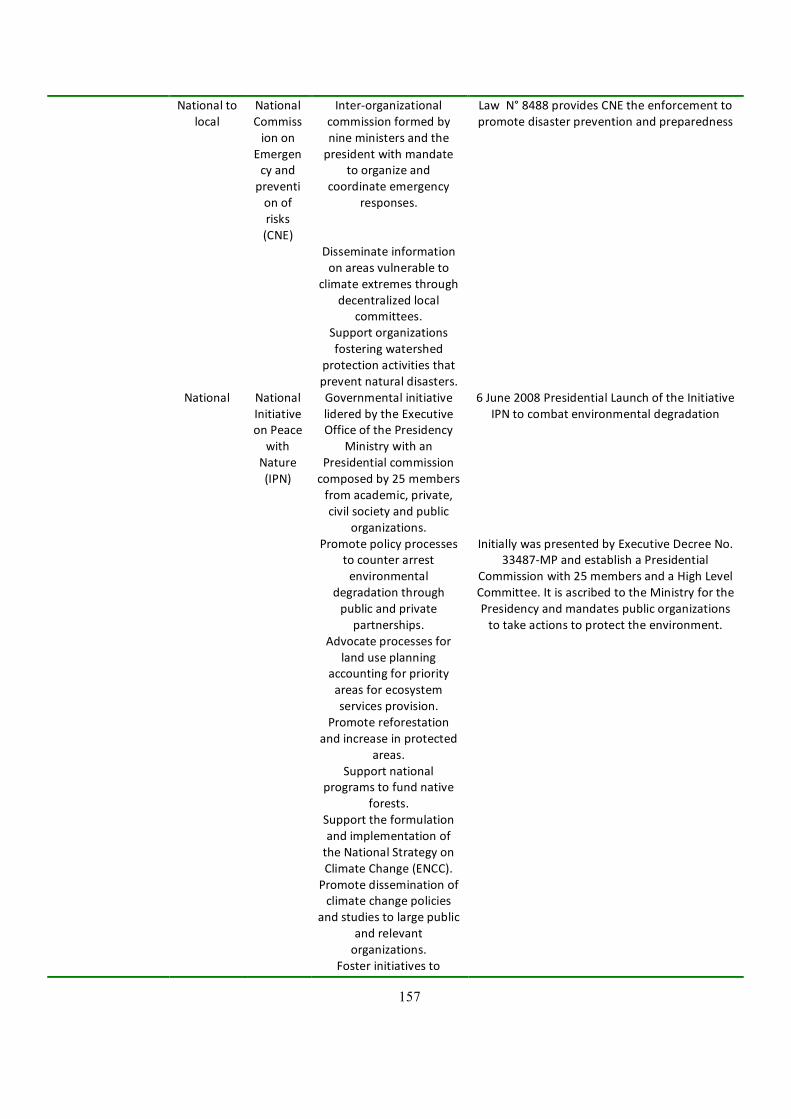
157
Nationaltolocal
NationalCommissionon
Emergencyandpreventionofrisks(CNE)
Inter‐organizationalcommissionformedbynineministersandthepresidentwithmandate
toorganizeandcoordinateemergency
responses.
LawN°8488providesCNEtheenforcementtopromotedisasterpreventionandpreparedness
Disseminateinformationonareasvulnerableto
climateextremesthroughdecentralizedlocal
committees.
Supportorganizationsfosteringwatershed
protectionactivitiesthatpreventnaturaldisasters.
National NationalInitiativeonPeacewith
Nature(IPN)
GovernmentalinitiativelideredbytheExecutiveOfficeofthePresidency
MinistrywithanPresidentialcommissioncomposedby25membersfromacademic,private,civilsocietyandpublic
organizations.
6June2008PresidentialLaunchoftheInitiativeIPNtocombatenvironmentaldegradation
Promotepolicyprocessestocounterarrestenvironmental
degradationthroughpublicandprivatepartnerships.
InitiallywaspresentedbyExecutiveDecreeNo.33487‐MPandestablishaPresidential
Commissionwith25membersandaHighLevelCommittee.ItisascribedtotheMinistryforthePresidencyandmandatespublicorganizationstotakeactionstoprotecttheenvironment.
Advocateprocessesforlanduseplanning
accountingforpriorityareasforecosystemservicesprovision.
Promotereforestationandincreaseinprotected
areas.
Supportnationalprogramstofundnative
forests.
SupporttheformulationandimplementationoftheNationalStrategyonClimateChange(ENCC).
Promotedisseminationofclimatechangepolicies
andstudiestolargepublicandrelevantorganizations.
Fosterinitiativesto

158
protectEcosystemServicesinlanduseplanningfortheirimportancefor
developmentandadaptationtoclimate
change. National National
Institutefor
Meteorology(IMN)
ScientificandtechnicalInstituteascribedto
MINAE.
1988CreationofIMN
Coordinatemeteorologicaldatacollectionanalysisand
dissemination.
LawN°5222createdtheIMNunderMAG.Afterwards,LawNº7152in1990transfersIMN
toMINAE.
Implementresearchonclimatechangeandvariability,andin
collaborationwithotherorganizationsstudiesonimpactsandvulnerabilityofwaterresourcesandof
coastal,agricultural,biodiversityandhealth
sectors.
Coordinatetherecompilationofthe
NationalCommunicationandispartoftheNationalDelegationtoUNFCCC
Nationaltolocal
NationalInstitute
forTechnological
Innovationin
Agriculture(INTA)
Promoteresearchonthefieldforinnovationin
agriculture
In1999theformerTechnicalResearchofficeofMAGistransformedinINTA
DisseminateresultstogetherwithMAG
decentralizedextensionoffices.
Validateappropriatesoilmanagementtechniques
topreventerosion
PersonalInterviews
National Agronomic
ResearchCentreofthe
Universit
Implementbasicandappliedresearchonsoilsciencealsothroughallianceswithlocal
producers’associationsoragriculturalextension
FormalAgreementwithMAG,1dec.1950;FormalcreationbyUCRfacultydecree,1971

159
yofCostaRica(CIA‐UCR)
offices.
Disseminateresearchresultsthroughtechnicalpamphletsorscientificarticlesinnationalandinternationaljournals.
Developandupdatedatabasesofinformationonnaturalresourcesin
CostaRica.
Providetechnicalassistanceforspecific
environmentalmanagementproblemsrelatedtoagriculture.
National Programfor
NationalStrategy
onClimateChange(ENCC)
NationalinitiativeledbyMINAEinsideIPNwithamandatetorespondtoglobalclimatechange
throughnationalprivateandpublicpartnerships.
Website(http://www.encc.go.cr/)andinterviews.
PromotepoliciestomitigateGHGwith
nationalactivities(bio‐fuels,increaseenergyuseefficiency,promotelowcarbonenergysuchashydro,wind,solar,andgeo‐thermalpower).
Promoteadaptationtoclimatechangeandvariabilityinwater,agricultural,coastal,
health,biodiversityandinfrastructurepolicies.
Supportinitiativestoraisesocialandhumanresourcestoreduce
climatechangeanditsimpacts.
Promoteawarenessincivilservantsandpublicingeneralonclimatechange
anditsimpactsandsolutions.
Identifytheneedforinformationnetworks
creationinordertofoster

160
adaptation. National Program
forIntegrat
edEnvironmentalManagementofthe
UniversityofCostaRica
(PROGAI‐UCR)
2005thePROGAIisestablishedinUCR
Promoteresearchonappropriatemanagement
ofecosystemswithspecialemphasisonwater
resources.
12‐15Feb2008firstNationalCongressPROGAI‐UCRfinaldeclarationstatesimportanceof
preventiveecosystemmanagementtorevertdegradationandfosterdevelopmentandthatestablishingpartnershipsisimportantfor
fosteringsustainablewatershedmanagement Promotenationalevents
fordisseminationofresearchresultsonwater
andwatershedmanagement.
Promotenationalprocessesfordesignofwaterrelatedpolicies.
Watershed ASA‐PacayasMinistry
ofAgricultu
re(MAG)
LocalextensionofficeoftheMAGpromotingdiffusionoftechnicalinformationonsoil
management,takesparttoregionalcommitteesto
reduceimpactsofclimate‐extremeson
agriculture.
The2004XIVSummitofIberoAmericanGovernmentssupportedthecreationofruralcentretosupporttrainingandpromotionofsustainableagriculturalproductionsystems
Promoteandsupportscollaborationswithresearchprojectson
strategiestoimprovesoilmanagementandprovidestransferto
farmers.
Decree31623MAG‐H,2003;definingprioritiesandexecutionoffundingfortechnical
assistance
Promoteawarenesscampaignsonenvironmentaldegradation.
Establishallianceswithindividualfarmersand/orfarmers'associationsto
promotesoil

161
Establishallianceswithindividualfarmersand/orfarmers'associationsto
promotesoilmanagementinthe
watershed.
National NationalAdvisoryCommissiononDegradedLands(CADETI)
Inter‐organizationalcommissionunderMINAEandMAGintegratedbyrepresentativesfrom
academicorganizations,NGOs,MINAE,IMN,MAGtechnicalconservation
offices.
ExecutiveDecreeNº27258‐MINAEcreatesCADETIasfocalpointtoUNCCDmandatingthedesignofrelatedactionsatnationallevel,andtheelaborationofNationalPlantoCombat
LandDegradationandDesertification.
FormulateandevaluatetheNationalactionplanonDegradedlands.
AdviseNationalFocalPointtoUnitedNations
ConventionandcoordinatestheNationalActionPlanstoCombatDesertification(UNCCD)

162

163
Annex 2. Ecosystem-based adaptation to climate change: what role for policy-makers, society and scientists?
Paper published: Vignola, R., Locatelli, B., Martinez, C., Imbach, I., 2009. Ecosystem‐Based
adaptationtoclimatechange:whatroleforpolicy‐makers,societyandscientists?.Mitigationand
AdaptationStrategiesforGlobalChange14,601‐696
Abstract
Indevelopingcountrieswhereeconomiesandlivelihoodsdependlargelyonecosystemservices,
policies foradaptationtoclimatechangeshould take intoaccountthe roleoftheseservices in
increasingtheresilienceofsociety.Thisecosystem‐basedapproachtoadaptationwasthefocus
ofaninternationalworkshopon"AdaptationtoClimateChange:theroleofEcosystemServices"
heldinNovember2008inCostaRica.Thisarticlepresentsthekeymessagesfromtheworkshop.
Keywords:Adaptationtoclimatechange,ecosystemservices,policy‐science‐societydialogue.
A2.1Introduction
An internationalworkshopon “Adaptation to Climate Change: the role of Ecosystem Services”
washeldinNovember3‐5,2008intheInternationalCentreforTropicalAgricultureResearchand
Higher Education (CATIE) in Turrialba, Costa Rica. The 80 participants came from 24 countries
(mostly Latin American) and 56 institutions (local communities, NGOs, scientific organizations,
government agencies, public and private firms, and international agencies for cooperation) to
discusstheroleofecosystemservicesinadaptationtoclimatechange.
Whilemostdevelopingcountries’economiesdependlargelyonnaturalresourcesandecosystem
services,thecapacityofecosystemstoprovideservicestosectorsofthesocietyispressuredby
landusechangeandclimatechange.Asadaptationisneededforthesectorsofsocietyfacingthe
impactsofclimatechange,itisnecessarytoconsiderthevulnerabilityandroleofecosystemsin
sustainedprovisionofecosystemservicestothesesectors.
Theaimofthisarticleistopresentthekeymessagesthattheparticipantsdiscussedduringthe
workshop.Thesekeymessagesaretargetedatthestakeholdersthatcandesignandimplement
ecosystem‐based adaptation (EBA). We define ecosystem‐based adaptation as the adaptation
policies and measures that take into account the role of ecosystem services in reducing the
vulnerability of society to climate change, in a multi‐sectoral and multi‐scale approach. EBA

164
involvesnationalandregionalgovernments, localcommunities,privatecompaniesandNGOsin
addressingthedifferentpressuresonecosystemservices,includinglandusechangeandclimate
change,andmanagingecosystemsto increasetheresilenceofpeopleandeconomicsectorsto
climate change. The concept of EBA has emerged recently in the international climate change
arena,withcountries(e.g.,Colombia,SriLanka),groupsofcountries(e.g.,theAfricanGroup)and
observers (e.g. the International Union for Conservation of Nature) addressing EBA in their
submissionstotheUnitedNationsFrameworkConventiononClimateChange.
A2.2Contentoftheworkshop
Theworkshop included seven sessions.The first sessionaimedatupdatingparticipantson the
mainconceptsandissuesrelatedtoecosystemservices,adaptationtoclimatechange,andEBA.
The second session aimed at communicating results of scientific studies related to the
vulnerabilityofecosystemsandecosystemservicesinLatinAmerica.Discussiontopicsaddressed
differentdimensionsofecosystemvulnerability:exposure(climatechangescenarios),sensitivity
(e.g.theimpactsofclimatechangeonprotectedareas,hydrologicalecosystemservicesorforest
fires), and adaptive capacity (e.g. the role of landscape connectivity in ecosystemadaptation).
Thethirdsessionaddressedtheroleofecosystemservices(e.g.hydrologicalservicesforsectors
dependingonwater,suchasdrinkingwaterandhydropowerproduction).
During the fourth session, attendees reviewed experiences of policies and measures for
adaptationatlocal,nationalandregionallevels.Eventhoughtheimpactsofclimatechangeand
theroleofecosystemservicesareuncertain,no‐regretpolicyresponsescanbenefitbothclimate
changeadaptationandsustainableecosystemmanagement.Thefifthsessionaimedatexploring
communication strategies regarding adaptation to climate change. Establishing an efficient
dialogue between scientists, decisionmakers and civil society is challenging but necessary for
EBA. This dialogue should start at the stage of research design and be pursued until the
communicationofresearchresultsanduncertainties.
During the sixth session, financial mechanisms for adaptation or for the management of
ecosystem services were reviewed. Innovative financial mechanisms are needed for these
processes,butremainchallengingbecauseofthecomplexityofevaluatingadaptationcostsand
benefits,andthesensitivityofpoliticalnegotiationsrelatedtointernationaladaptationfinance.

165
The seventh session was aimed at sharing experiences of public and private initiatives of
ecosystemmanagementandconservation.Asthese initiativesare seldomexplicitly linkedwith
climate change adaptation, their role in reducing the vulnerability of ecosystems and society
needstobefurtheranalyzed.
The participants presented awide array of perspectives and experiences related to ecosystem
servicesandadaptationtoclimatechange inLatinAmerica, includingcommunitymanagement,
paymentforecosystemservices,andinsuranceschemes.Theseexperiencesallowedparticipants
to discuss crucial issues such as the need for institutional changes for adaptation, a better
understanding of uncertainties and strategies to copewith them, improved dialogue between
scientistsanddecisionmakers,andstrengthenedlinkagesbetweensectorsandscales,fromlocal
togloballevels.
At the end of the workshop, the participants worked in groups to elaborate key messages
directedatthreegroupsofstakeholdersinEBA:(1)nationalpolicy‐makers(2)localcommunities,
privatesectorandothersmembersofcivilsociety,(3)scientists(Figure1).
Figure 1: Key messages to stakeholders related to ecosystem-based adaptation (EBA)

166
A2.3Keymessagesfornationalpolicy‐makers
Mainstreamadaptationandecosystemservices intonationalpolicies. Ecosystemdegradation
and vulnerability to climate change are development issues rather than strictly environmental
problems. As the loss of natural capital and the associated vulnerabilities are a threat for
sustainable development, national development policies should integrate ecosystem
managementandadaptation to climatechange.Multi‐sectorial andcross scaleapproachesare
needed formainstreamingbothadaptationand ecosystemservices intopolicies.Policy‐makers
should create and enforce linkages between ecosystem managers and vulnerable sectors
benefiting from ecosystem services. Moreover, education and outreach policies should raise
societal awareness about the relevance of ecosystem services and adaptation for sustainable
development.
Develop innovative funding. Because of market failures, current regulations fail to conserve
ecosystem services that are valuable for society. Thus, sectors benefiting from ecosystem
services should be involved in funding ecosystem management or conservation. Payment for
EcosystemServices(PES)isaninnovativemechanismbeingdevelopedinseveralLatinAmerican
countries in both governmental and private initiatives. PES can complement international
adaptationfundingsourcesincaseswheretheusersofecosystemservicesarewillingandableto
provide resources forprotecting these services. Thechallenge forpolicymakers is to createan
institutionalenvironmentthatfacilitatesagreementsbetweenusersandprovidersofecosystem
services.
Influence internationalpolicies. Internationalnegotiationsondevelopmentandenvironmental
issuescaninfluencenationalpoliciesonadaptationandecosystemsandthusEBAdesign.Policy‐
makersshouldthereforeensurethattheoutcomesofnegotiationsinthisarenaincludeadequate
consideration of ecosystem services that are priorities for their national development and
adaptation. To enforce their positions in these negotiations, it is strategically important that
policy‐makers strengthen their understanding of the challenges implied in designing and
implementingEBA.Thismightbeespeciallyrelevant inthecontextofthenegotiationsdefining
thetermsofreferenceandthemanagementoftheAdaptationFundwhereinvestmentpriorities
aredefined.

167
Strengthen the links between adaptation andmitigation.Mitigation instruments, such as the
Clean DevelopmentMechanism or the currently discussed REDD (Reduction of Emission from
DeforestationandForestDegradation)canprovidebenefitsforbothmitigationandadaptation,
astheycontributetoconservingandrestoringecosystemservices.However,someconcernshave
been raised about the potential negative impacts that somemitigation projectsmay have on
local development and biodiversity. Thus policymakers should try to foster synergies between
mitigation and adaptation by developing and applying guidelines or standards for mitigation
projects. These standards could provide guidance to mitigation project developers willing to
addressadaptationandenablepolicymakersordonorstoassessthecontributionofmitigation
projectstoadaptation.
Interactwithlocalcommunities.Localcommunitiesareimportantdecision‐makersinadaptation
and ecosystem management. National policymakers should empower local and indigenous
communitiestofacilitateadaptationprocessesthattaketraditionalknowledgeintoaccount.EBA
policiesshouldrecognizethediversityoflocalsituationsandcreateafacilitatingenvironmentfor
effective local adaptation and ecosystem management. Policies should also promote
environmentaleducationforpromotingEBAinlocalcommunities.
Interactwith scientists. Understanding climate change impacts and vulnerability is a complex
task, and technical expertise is required to understand and interpret the results of scientific
studies.Itisthereforeimportantthat,forbuildingno‐regretpolicies,policy‐makersinteractwith
scientists to take into account uncertainties inherent in climate change studies. Policy‐makers
shouldcreateinstitutionalarrangementsandfundingsourcestofacilitatethedevelopmentand
useofrelevantsocialandnaturalscienceknowledgeintopolicyprocesses.
A2.4Keymessagesforcommunities,localactorsandothersmembersofcivilsociety
The followingmessagesareaddressed to thevarietyof stakeholders thatmanageecosystems,
implementadaption,oruseecosystemservices,suchaslocalcommunities,thecivilsocietyand
theprivatesector.
Define and implement adaptation. Even though national policies influence local processes,
adaptationeventuallyhappenslocally.LocalactorshavetheresponsibilitytopromoteEBA,given
their direct interest in ecosystemhealth and provision of services. Communities should design

168
and implement strategies for ecosystem‐based adaptation as part of their local resource
planning.Civilsocietyandcommunitiesshouldincreasetheircapacitytonegotiateandestablish
equitable partnershipswithavarietyofactors (publicandprivate)actingatdifferent scalesof
decisions.NGOscanplayaroleinstrengtheningindigenouspopulationsinprotectingtheirrights
andvaluesinthedesignofadaptationplans.
Rewardecosystemserviceproviders.Localcommunities,civilsocietyandprivateactorsshould
rewardactorsthatconserveorrestoreecosystemservices.Thiswouldenablerestoringservices,
orpreventingfuturelandusechangesandlossofservices.Innovativemechanisms,suchasPES,
maybeanimportantcomponentofecosystem‐basedadaptation.
Interact with policy makers. Policy makers set the institutional context in which ecosystem‐
based adaptation can take place. The interests, obstacles and capacities of local communities,
however,arenotalwaysreflectedinnationalandlocalpolicies.Akeyroleforcivilsocietyisthen
toempowerthecapacityoflocalactorstoparticipateinpolicy‐makingatbothlocalandnational
levels.Building capacityandopening spaces forparticipation inpolicymakingcanbeaway to
achievethesegoals.
Interact with scientists. Research on ecosystems services and how they can reduce societal
vulnerability to climate change is a relatively new field characterized by complexity and
uncertainty. In this context, local knowledge on ecosystems and theirmanagement should be
respected and is crucial for improving scientists’ understanding and their capacity to support
design of appropriate responses. In this respect, interactionwith social scientists is important
giventheirexpertiseonintegratingdifferentknowledge‐systemsintocollaborativeefforts.Local
communitiesandcivilsocietyarethuscalledtoplayamoreactiverole,gettinginvolvedinfield
researchandinformingscientistsonobservedchangesandlocaladaptation,andscientistsshould
adapt their methods to use these resources. In addition, private sectors could also finance
science,astheyalsocouldbenefit fromnewscientificknowledgeonadaptationandecosystem
services.
A2.5Keymessagesforscientists
Quantify and value ecosystem services. Several international scientific initiatives such as the
MillenniumEcosystemAssessmenthaveacknowledgedtherelevanceofecosystemservices for

169
human wellbeing. However, more evidence is needed on the role of ecosystem services in
reducingthevulnerabilityofsociety,aswellasthecostsandbenefitsofconservingecosystem
services,inthecontextofclimatechange.Quantificationandspatialprioritizationofecosystem
servicesforadaptationarealsoneededforadaptation.
Evaluate uncertainties. Ecosystem services and climate change impacts assessments dealwith
complexityanduncertainty;therefore,theirrecognitionandevaluationisessentialfordesigning
adaptiveapproachestoEBA.Impactorvulnerabilitystudiesshouldalwaysincludeananalysisof
sensitivity, for instance, using differentmodels and different climate scenarios. In an adaptive
process,uncertaintyanalysisalsoenablestheidentificationofwhichvariablesareuncertainand
determinant in explaining vulnerability to climate change. These variables can be transformed
intoindicatorsformonitoringtrendsinthefield.
Work at local scales. Many climate change impact studies or vulnerability assessments show
resultsonregionalandglobalscales,providingabroadviewthatseldomhelpsinterestedparties
todesignlocaladaptation.Forinstance,EBArequiresidentifyingtheflowofecosystemservices
in local landscapes, as a tool for determining land uses that may provide ecosystem services
relevanttotheadaptationofsociety.Thus,moreresearchisneededtoaddressscientificissues
related to EBA at a local scale. In addition, social scientists have an important role to play in
understandinglocalsocialprocessesrelevantforadaptationandecosystemconservation.
Communicate results to non‐scientists. Scientists should devote substantial efforts in
communicatingresearchresultstonon‐scientists,suchaslocalNGOs,publicadministrationand
themedia, inordertoincreasetheircapacityto influencethe implementationofEBA.Strategic
allianceswithexpertsfromcommunicationsciencesshouldbeconsideredasakeycomponentof
researchprojectsonEBA.
Interactwith localcommunitiesandprivatesector.Scientistsstudyingclimatechange impacts
andthedesignofEBAmeasuresarecalledtoworkcloselywithlocalcommunitiesandtheprivate
sector in order to understand local processes of adaptation and ecosystem management.
Scientists should also involve local communities and private sectors from the early stages of
research design, so that scientific work and results can serve local EBA design and
implementation.

170
Interactwithpolicymakers.ScientistsproducingknowledgeonclimatechangeimpactsandEBA
measures should ensure that results are communicated in a way that is relevant to policy‐
makers.Atthelocalandnationallevels,scientistsshouldparticipate,asoneofthestakeholders,
inpolicydesignprocess,includingproblemidentification,strategyformulation,selectionofpolicy
options,monitoringandevaluation.Atgloballevel,scientistscanplayanimportantadvisoryrole
tonationalpolicy‐makerswhoparticipateininternationalnegotiationsrelatedtoadaptationand
possiblytoEBA.
A2.6Conclusions
Increasing attention has been paid to the complex interactions between human and environmental
systems,especially regarding theconservationandmanagementofecosystemservices.However, the
roleofecosystemservices in supportingadaptation to climatechange isa relativelynew issue in the
scientific arena, and even more so in the policy arena. In order to promote the role of ecosystem
servicesinsocietaladaptationtoclimatechange,itisimportantthatavarietyofactors,suchaspolicy‐
makers, scientists and civil society, are actively involved in accordancewith theirmandates. The key
messagespresented inthisarticlearenotonly relevant forLatinAmericabutarevalidalsoforother
regions,especiallywherepeopledependstronglyonnaturalresources.

171

172
Acknowledgments
In long journey of this thesis I havemet and collaboratedwithmany people that have shared
withmetheirknowledgeandfriendship,andhavecontributedtomyprofessionalandpersonal
growth.Firstofall,IwanttoacknowledgethesupportgiventojointhePhDprogramatETHZby
Dr. LucioPedroni, leaderof theClimateChangeProgramatCATIEat themomentofPhDstart
date. He has given me the opportunity to participate in the TroFCCA project where my
understanding of global change phenomena has been fed by intense exchange of theories,
knowledge and methods that have inspired my research in the PhD. I want to thank Bruno
LocatelliwhomduringtheinitialyearsattheCATIEhassharedhisknowledgeandthefriendship
of hiswarm family. I acknowledge Pablo Imbach, a friend from the very start and a colleague
sharingmotivationsandperspectivesonprofessionalaspectsaswellasthepositiveandnegative
momentsofourPhDstudies. IacknowledgeprofessorR.W.Scholz forthe inspiringdiscussions
hadduring ourmeetings. Forhis supportand foropening the opportunity to joinhisgroupat
ETHZwhereImetpeoplethathavebeenfriendsandteacherstomewhilesharingmethodsand
theory of interdisciplinary science, so needed especially in developingworld contexts. Iwould
alsoliketoacknowledgeMariaReyforherkindsupportthroughoutmystudiesatETHZ.Ithank
ProfessorThomasKoellnerforhisfriendshipandsupportinmanyjourneystoZurich.Ithankhim
for his support in the developing of ideas and opportunity for this PhD; from the very start
Thomashasbeenanimportantmotivatoralongtheupsanddownsofthisresearch.
I want to give special thanks to Professor Tim L. McDaniels from the University of British
Columbiawhom kindly acceptedmy invitation to visit CATIE and join the research developed
during this investigation. Timhas givenmehis valuable friendship and has been an important
inspirerforthisthesisandforexpandingourscientificandpersonalcollaborationandfriendship.
IthankallmyfriendsandcolleaguesattheClimateChangeProgramatCATIEthatsharethedaily
stressesandpleasuresofourjobswithsmilesandpatience.
IwanttothankalsomyfamilyinItalyforalwaysbeingthereandmakingtheAtlanticOceanand
theMediterraneanSeadisappearwhenwetalk, andthedaysandmonthsseparatingourvisits
disappearwhenwemeet.Finally,IwanttothankthetwotreasuresofmylifeSofiaManuelaand
Jimenawhommakemylifeacontinuousmotivationtoimprovemycharacterandaninspiration
togivemoretoothers.

173

174
Curriculum Vitae
RaffaeleVignola
Agr.Eng.UniversityofFlorence,Italy.
1969 BorninSalerno,Italy
1982‐1987 ScientificLyceum,Eboli,Salerno,Italy
1987‐1996 StudyatUniversityofAgriculture,Florence,Italy
1994 Field‐studiesinEcologyTamilNadu,India
1997ScholarshipAgro‐MeteorologicalInstitute,UniversityofFlorence,Italy
1998FellowshipatInstitutefortheOverseas,MinistryofForeignAffairs,Italy
2000ConsultantonWatershedManagementPlanning,Honduras
2001‐2003CoordinatorEUDisasterPreventionProjectDIPECHOII,ElSalvador
2003‐2004StudyMasterofScienceinEnvironmentalEconomics,CentreforHigherEducationandTrainingforLatinAmerica(CATIE),CostaRica
2004UnitedNationsOperationProgram(UNOPS)‐CentralAmericanProgramtoFightPoverty,ConsultantSocio‐economicimpactsofenvironmentalpollution,ElSalvador
2005‐2010Researcher/professorofClimateChangeProgramatCATIE,CostaRica
2007‐2010 PhDstudiesatETH‐NSSIwithCATIE
2010‐2012Co‐investigatorresearchproject:HumanDimensionofSoilRegulationServicesunderclimatechangeinCostaRica,ClimateChangeprogram‐CATIE/InstituteforResourcesandSustainability‐UniversityofBritishColumbia,Canada
Contact
ClimateChangeProgram,
TropicalAgricultureCentreforHigherEducationandTraining(CATIE)
7170,Turrialba,
CostaRica
phone:+506‐25582528,email:[email protected];[email protected];www.catie.ac.cr