Rights / License: Research Collection In Copyright - …1137/eth... · High pressure crystal...
103
Research Collection Doctoral Thesis High pressure crystal growth, thermodynamics and physical properties of AIxGa₁-xN semiconductors Author(s): Belousov, Andrey Publication Date: 2010 Permanent Link: https://doi.org/10.3929/ethz-a-006039449 Rights / License: In Copyright - Non-Commercial Use Permitted This page was generated automatically upon download from the ETH Zurich Research Collection . For more information please consult the Terms of use . ETH Library
Transcript of Rights / License: Research Collection In Copyright - …1137/eth... · High pressure crystal...

Research Collection
Doctoral Thesis
High pressure crystal growth, thermodynamics and physicalproperties of AIxGa₁-xN semiconductors
Author(s): Belousov, Andrey
Publication Date: 2010
Permanent Link: https://doi.org/10.3929/ethz-a-006039449
Rights / License: In Copyright - Non-Commercial Use Permitted
This page was generated automatically upon download from the ETH Zurich Research Collection. For moreinformation please consult the Terms of use.
ETH Library
Diss. ETH No. 18846
High pressure crystal growth, thermodynamics and physical
properties of AlxGa1-xN semiconductors
A dissertation submitted to the
EIDGENÖSSISCHE TECHNISCHE HOCHSCHULE ZÜRICH
for the degree of
Doctor of Sciences
presented by
ANDREY BELOUSOV
Master of Physics, State Technological University
"Moscow Institute of Steel and Alloys" (MISIS), Moscow
Dipl. -Ing, TU Bergakademie Freiberg, Germany
born November 23, 1979
citizen of Barvikha, Russia
accepted on the recommendation of
Prof. Dr. Bertram Batlogg, examiner
Dr. Janusz Karpinski, co-examiner
Dr. hab. Izabella Grzegory, co-examiner
Zurich, 2010


.


Contents
Summary 3
Zusammenfassung 5
Chapter 1 Introduction 7
Chapter 2 III-nitride synthesis from solution under nitrogen pressure 15
2.1 Basic thermodynamic and kinetic aspects……………………….…. 15
2.2 GaN crystal growth……………...………………………………….. 21
2.3 AlN crystal growth……………...…………………………………... 25
2.4 AlxGa1-xN crystal growth……………...……………………………. 26
Chapter 3 High pressure growth technique 31
3.1 High nitrogen pressure gas autoclave………………………………. 31
3.2 Cubic anvil cell……………………………………………………... 39
Chapter 4 Bulk single-crystal growth of ternary AlxGa1-xN from 45
solution in gallium under high pressure
4.1 Summary……………………………………………………………. 45
4.2 Introduction…………………………....……………………………. 45
4.3 Experimental details………………………………………………… 46
4.4 Results and discussion……………………………………………… 49
Chapter 5 AlxGa1-xN bulk crystal growth: influence of the growth 55
parameters and structural properties
5.1 Summary…………………………………………………………..... 55
5.2 Introduction…………………………………………………………. 55
5.3 Experimental details………………………………………………… 56
5.4 Results and discussion…………………………………………..….. 58
Chapter 6 Thermodynamics in the Al-Ga-N2 system 71
6.1 Summary………………………………………………………….… 71
6.2 Introduction…………………………………………………………. 71
6.3 The thermodynamic data of AlN and GaN…………………………. 72
6.4 The Gibbs free energy, enthalpy and entropy
of formation for AlxGa1-xN…………………………………………. 75
6.5 The results of the calculation……………………………………….. 78
Chapter 7 Conclusions and Outlook 89
7.1 Crystal growth…………………………………………………….… 89
7.2 Thermodynamics……………………………………………….…… 91
7.3 Outlook………………………………………………………….…... 92
Acknowledgments 95
Curriculum Vitae 97
List of publications 99

Summary
The rapid development in the field of nitrides, particularly (Al,Ga)N system, in the past
decade has become of technical significant due to their optical and electrical properties.
(Al,Ga)N is characterized by its wide band gap, which can be tuned by the Al content, from
3.4 eV to 6.2 eV. Despite the technical applications of (Al,Ga)N in thin film form, only a few
studies dealing with the synthesis of bulk (Al,Ga)N crystals have been reported because of
some significant challenges. The target of the research in this work is mainly the synthesis of
(Al,Ga)N bulk crystals under high nitrogen pressure as well as the investigation of their
properties in relation to the growth conditions.
This thesis work addresses and answers the question of how to grow (Al,Ga)N bulk single
crystals from solution. As a main result, we demonstrated reproducible (Al,Ga)N growth
using high pressure solution growth method (HPSG) in a self-constructed gas autoclave. After
a general introduction of the basic aspects of III-nitride synthesis from solution, we briefly
present our high pressure techniques used in this study: a high nitrogen pressure gas autoclave
and a cubic anvil cell.
From the solution in Al/Ga melt under high nitrogen pressure (2.5-10 kbar) und at high
temperature (1425-1780 °C), we have been able to grow (Al,Ga)N bulk single crystals with an
Al content in the range from 0.22 to 0.91. We have used Ga metal as the solvent and we have
introduced an appropriate amount of Al in the form of pre-reacted polycrystalline (Al,Ga)N or
AlN pellets. The growth process was optimized, yielding (Al,Ga)N crystals up to 0.8x0.8x0.8
mm3. We found that (Al,Ga)N crystals could be grown by choosing the appropriate pressure
and temperature conditions, selected below the GaN equilibrium line. Moreover, the Al
composition in the growing crystals can be selected by the proper choice of p-T conditions.
Further studies with different Al sources such as Al metal, pre-reacted polycrystalline
(Al,Ga)N or AlN tablets showed that using (Al,Ga)N helps to avoid the formation of an AlN
capping layer on the melt surface and the AlN combustion reaction. By contrast, by adding Al
metal into the melt (up to 0.4 at%) resulted in a growth of very small (Al,Ga)N crystals and
Al2O3 crystals as by-product. Larger amount of Al (up to 30 at%) leads to AlN combustion.
The crystals were mainly characterized by laser ablation inductively coupled plasma mass
spectrometry (LA-ICP-MS) and X-ray diffraction. We pay an essential attention to the
composition homogeneity of the crystals and its crystallographic analysis. Importantly, it was
3
demonstrated that an about 1-μm-thick, inhomogenously substituted (Al,Ga)N capping layer
with various Al content was formed on the crystal surface. It was noted that the Al
composition of this layer depends on the cooling profile.
The growth results allowed us to study the thermodynamics and the p-T-x equilibrium
phase diagram of (Al,Ga)N system. Based on the experimental p-T growth conditions the
standard Gibbs free energy, the enthalpy and entropy of formation of the (Al,Ga)N system
were estimated for temperatures of up to 1800 °C and up to 30 kbar pressure. Furthermore,
knowing the thermodynamic functions allowed us to determine the p-T and x-T phase
diagrams for extended parameter ranges. For instance, in the p-T phase diagram, the
equilibrium lines between (Al,Ga)N(s) and Al/Ga(l) + N2(g) for various Al composition in the
crystals were calculated.
4
Zusammenfassung
Die rasante Entwicklung auf dem Gebiet der Nitride, insbesondere der (Al,Ga)N
Verbindung, in den letzten Jahrzehnten gewann dank ihrer optischen und elektrischen
Eigenschaften eine technische Bedeutung. (Al,Ga)N zeichnet sich durch eine breite
Bandlücke aus, die je nach Al-Gehalt von 3.4 eV bis 6.2 eV variiert werden kann. Trotz den
interessanten Anwendungen wurden bisher nur wenige Studien über die Synthese von
(Al,Ga)N Kristallen publiziert, weil diese einige bedeutende Herausforderungen stellt. Das
Ziel der Forschung in dieser Arbeit ist vor allem die Synthese von (Al,Ga)N Kristallen unter
hohem Stickstoffdruck sowie die Untersuchung ihrer Eigenschaften in Bezug auf die
Wachstumsbedingungen.
Diese Dissertationsarbeit stellt und beantwortet die Frage, wie (Al,Ga)N Einkristalle aus
der Schmelze gezüchtet werden können. Als ein Hauptresultat haben wir ein reproduzierbares
Züchten von (Al,Ga)N Kristallen aus einer Schmelze unter hohem Druck (HPSG) in einem
selbst konstruierten Gasautoklav demonstriert. Nach einer allgemeinen Einführung zu den
grundlegenden Aspekten der III-Nitriden Synthese aus der Schmelze, beschreiben wir kurz
die Hochdruckanlagen, die in dieser Arbeit verwendet wurden: den Stickstoff Hochdruck
Gasautoklav und die kubische Druckzelle.
Aus der Al/Ga Schmelze konnten wir (Al,Ga)N Einkristalle mit einem Al-Gehalt im
Bereich von 0.22 bis 0.91 unter hohem Stickstoffdruck (2.5-10 kbar) und bei hoher
Temperatur (1425-1780 °C) synthetisieren. Wir haben Ga Metall als Schmelze verwendet und
die entsprechende Al Menge in der Form vom vorsynthetisierten polykristallinen (Al,Ga)N
oder AlN Tabletten eingebracht. Die Optimierung des Wachstumsprozesses ermöglichte die
Synthese von (Al,Ga)N Einkristallen mit einer maximalen Größe von bis zu 0.8x0.8x0.8
mm3. Wir haben festgestellt, dass (Al,Ga)N Einkristalle durch die Auswahl der
entsprechenden Druck- und Temperaturbedingungen unterhalb der GaN Gleichgewichtslinie
gezüchtet werden können. Darüber hinaus kann der Al-Gehalt in den wachsenden Kristallen
durch geeignete Wahl der Druck- bzw. Temperaturbedingungen gewählt werden. Weitere
Studien mit verschiedenen Al-Quellen wie Al Metall, vorsynthetisierten polykristallinen
(Al,Ga)N oder AlN Pellets zeigten, dass die Verwendung von (Al,Ga)N die AlN
Schichtbildung auf der Schmelzoberfläche und die AlN Verbrennungsreaktion vermeiden
lässt. Im Gegensatz dazu hat die Verwendung von Al Metall in der Schmelze (bis zu 0,4 at%)
5
das Wachstum von sehr kleinen (Al,Ga)N Einkristallen und von Al2O3 Kristallen als
Nebenprodukt zur Folge. Grössere Al Mengen (bis zu 30 at%) führen zu der AlN
Verbrennungsreaktion. Die Kristalle wurden hauptsächlich mit Hilfe von Laserablation
induktiv gekoppelter Plasma Massenspektrometrie (LA-ICP-MS) und X-ray Diffraktion
analysiert. Dabei fokussierten wir hauptsächlich auf die Homogenität der Zusammensetzung
in den Kristallen und auf ihre kristallographischen Eigenschaften. Es wurde gezeigt, dass sich
eine etwa 1-μm dicke inhomogene (Al,Ga)N Schicht mit verschiedenem Al-Gehalt auf der
Kristalloberfläche bildet. Dabei hängt die Al Zusammensetzung dieser Schicht überwiegend
vom Abkühlungsprofil ab.
Die Ergebnisse haben uns erlaubt, die Thermodynamik und die p-T-x Gleichgewichts-
phasendiagramm vom (Al,Ga)N System zu studieren. Basierend auf den experimentellen
Druck- und Temperaturwachstumsbedingungen wurden die Standard Gibbs Freie Energie, die
Bildungsenthalpie und die Bildungsentropie von (Al,Ga)N für Temperaturen von bis zu 1800
°C und bis zu 30 kbar Druck kalkuliert. Darüber hinaus ermöglichte uns die Kenntnis der
thermodynamischen Funktionen die p-T und x-T Phasendiagramme zu bestimmen.
Beispielsweise wurden die Gleichgewichtskurven zwischen (Al,Ga)N(s) und Al/Ga(l) + N2(g)
für verschiedenen Al-Gehalt in den Kristallen im p-T Phasendiagramm berechnet.
6
Chapter 1
Introduction
The research of III-nitrides, such as GaN and AlN, from their synthesis to characterisation
to device manufacturing is continuously developing since Lirman and Zhdanov synthesized
the first GaN in 1930 [1] and AlN by Briegleb and Geuther in 1842 [2]. The interest in III-
nitride materials and their solid solutions have become of technical significant due to their
optical and electrical properties [3]. They are characterized not only with their wide band gap,
covering the near and middle UV range, but also by the good thermal stability, thermo-
electrical properties as well as mechanical strength. This has, over the years, resulted in
significant advances in the synthesis of such compounds, as well as in much progress in
understanding and control of their thermodynamic stability, physical properties and
employment in increasingly sophisticated device architectures.
There is currently a great need of solid-state light emitters with wavelength in the blue-
UV range that have a promising application in the detection of chemical and biological
agents, in the ventilation system for bacteria disinfection, optical storage of data, high power-
high frequency transistors for radars and communication as well as for general lighting. Many
nitride-based devices include heterostructures involving binary or ternary alloys of GaN, AlN
and InN. In particular, ternary layers such as (Al,Ga)N is one of the key material and
conductive n-type and p-type (Al,Ga)N alloys with high Al contents are especially important
for applications. Such ternary (Al,Ga)N alloys are mainly used as electron barriers in power-
switching HEMTs [4], as an active zone in light-emitting structures [5], or as cladding layers
in lasers [6] since the band gap energy can be tuned from 3.4 to 6.2 eV depending on the
atomic composition, or as quantum wells in UV LEDs [7].
In commercially available devices (Al,Ga)N is mainly deposited by epitaxy techniques
such as MBE [8-10], MOVPE [11-13] and HVPE [14-17] on different substrates, e.g. on
sapphire or silicon carbide because of the lack of native substrates. The resulting thin films
exhibit large defects concentrations (e.g. high dislocation density up to 109 cm-2), mainly due
7

to the difference of thermal expansion coefficient between such substrates and nitride.
Homoepitaxy is strongly preferred and some attempts are reported for GaN thin-film
deposited on bulk GaN crystals grown by solution method at high nitrogen pressure [18,19].
There are two ways of growing high quality nitride crystals: solution or vapour growth
methods. Due to the high Al vapour pressure the vapour growth method (sublimation method)
is more suitable for the bulk AlN crystal growth and is mostly used [20-22]. The AlN crystals
with up to 25 mm in diameter and up to 15 mm thickness are currently reported by B.
Epelbaum et al. [23]. Despite the relatively low dislocation density of about 103 cm-2 in AlN
grown by sublimation method, control of voids and point defects remains an issue. GaN
single crystals are basically synthesized by solution growth method. In Table I the bulk GaN
solution growth methods are summarized. Generally, large GaN bulk crystals can be grown
by high pressure nitrogen solution growth (HPSG), by a Na flux method or by the using
ammonothermal method. The Na flux method was first introduced by Yamane et. [24] and
leads to GaN crystals (with maximum size of about 6x4x0.25 mm3 [25]), slightly smaller then
crystals grown by the HPSG method (platelets with a surface exceeding 100 mm2 [26]). This
method is characterized by low growth temperature (750-900 °C) and pressure (20-50 atm).
The nitrogen dissolution will be enhanced by sodium acting as a catalyst. The most promising
method for synthesis of GaN substrates in a commercial and industrial scale is the
ammonothermal crystal growth, where the synthesis is realized in supercritical ammonia,
from metallic gallium, at a temperature of about 400-600 °C and pressures of 1-5 kbar. This
method was invented by Dwilinski et al [27] in the middle of the 1990s. The low solubility of
nitrogen in the melt and slow mass transport result in very low growth rates. Thermal
decomposition of NH3 is so fast that the ammonia method can not be extended to the
temperatures higher than 1150 °C. To increase the solubility of GaN in ammonia, a
mineralizer, acidic (ammonium halogenide NH4X) or basic (lithium or potassium amide
XNH2:NH3) is used. Currently, high quality 2-inch c-plane GaN substrates grown by
ammonothermal method have been reported [28] and 1 and 1.5-inch substrates are already
available on the market. However, the crystal quality, for example, the dislocation density is
still quite higher (order of 104 cm-2 [29]) than by GaN grown by HPSG method (order of 102
cm-2 [30]).
The first attempt of GaN high pressure growth from solution at temperature about 1200 °C
and pressure up to 10 kbar was done by Madar et al [31]. This work was specified by
Karpinski et al. [32] and lately developed by UNIPRESS in Warsaw, Poland [33]. The GaN
8

Tabl
e I.
Bul
k G
aN G
row
th fr
om s
olut
ion
[36]
Bas
ic s
olu
tes
Sol
ven
t b
ase
Tem
per
atu
re
Pre
ssu
re
Th
e w
ay
solu
tion
is
Dri
vin
g fo
rce
of
crys
tal g
row
th
GaN
Sol
utio
n gr
owth
1-3
atm
20 -
100
atm
5-20
kba
r
Nit
roge
n
Sup
ercr
itic
al N
H3
Ga
GaN
or
Ga
NH
3 di
ssol
utio
nA
mm
ono
ther
mal
Sod
ium
fl
ux
Nea
r at
m
pres
sure
so
luti
on
DC
or
AC
el
ectr
ic f
ield
H
PN
S
grow
th
Pre
ssur
e co
ntro
l so
luti
on g
row
th
RF
, MW
pl
asm
a G
a fr
ee
solv
ents
Am
mon
oaci
dic
(NH
4+)
Am
mon
obas
ic
(NH
2- )
5-20
kba
r1-
5 kb
ar Hig
h P
ress
ure
amm
onot
herm
al
Ga+
Na
Ga+
Li
Ga
free
sol
vent
s
5-50
torr
1-2
atm
≤1 a
tm
1300
-160
0 °C
80
0-10
00°C
600-
1000
°C90
0-10
00°C
75
0-90
0°C
400-
600
°C60
0-10
00°C
700-
850
°C
20-1
00 a
tm
Na
flux
L
PE
Dir
ect N
2 di
ssol
utio
n E
xcit
ed N
2 di
ssol
utio
n C
hem
ical
ly e
nhan
ced
N2
diss
olut
ion
Che
mic
ally
enh
ance
d G
aN d
isso
luti
on
Dif
fere
nce
of g
as a
nd
soli
d ph
ase
solu
bili
ty
GaN
di
ssol
utio
n
Tem
pera
ture
gr
adie
nt
9
high pressure crystal growth is characterized by low solubility of nitrogen in Ga liquid and
high equilibrium temperature and pressure that make this method technically difficult.
Nevertheless, the modern HPSG method leads to the synthesis of excellent quality GaN near
dislocation free crystals. However, the size of those crystals still needs to be improved.
Inoue et al [34] proposed recently another process based on HPSG method. By applying
the controlled nitrogen overpressure that supports the N supersaturation in Ga melt GaN
single crystals with the size up to 25 mm were synthesized. However, such crystals exhibit
higher defects density (~105 cm-2 dislocations) than by HPSG.
The thin film deposition methods of (Al,Ga)N alloy need some improvements, in
particular due to the structural defects and the inhomogeneities in the Al concentration in
obtained films. Thus, improving the material quality of (Al,Ga)N alloys is of crucial
importance for the device fabrication. Moreover, there is some variance in the properties of
(Al,Ga)N alloys, e.g. the compositional dependence of the lattice constants, the direct energy
gap, produced by different methods and groups. A relatively little is known about the growth
of bulk ternary (Al,Ga)N alloys from solution [35]. The major difficulties are the equilibrium
conditions required to thermodynamically stabilize the (Al,Ga)N alloy at certain temperature
and pressure. The growing (Al,Ga)N crystals poses significant challenges; two of which have
been successfully addressed in this work: control of the thermodynamic conditions and proper
choice of the solvent.
Scope and overview of this thesis
The principal objective of the present thesis is to explore the understanding of the
synthesis of (Al,Ga)N compound using the high pressure techniques. Two methods have been
applied: synthesis of the polycrystalline AlxGa1-xN by solid-state reaction [37] and of AlxGa1-
xN bulk single crystals from solution in Ga melt.
Driven by the previously reported pioneer study [35,38] and a disappointing poor
availability of the information on the crystal growth of bulk (Al,Ga)N compound in general,
in this thesis, the synthesis of AlxGa1-xN bulk single crystals in gas autoclave is intensively
investigated and discussed. Crystal growth results involving the control of the chemical
composition in the crystals and the reproducibility of the experiments are reported.
10
The research presented in this thesis is focused on synthesis and thermodynamic aspects
as well as characterisation of (Al,Ga)N system. In particular, we pay an essential attention on
the investigation of the stability of the compound and its crystallographic analysis. Among
other things, the p-T-x diagram, which is the basis for crystal growth experiments, thermal
annealing and for the device application in general, has been determinated.
In Chapter 2, the basics of the thermodynamic and kinetic aspects of the III-nitride
synthesis from solution are discussed. The most essential studies on GaN, AlN and (Al,Ga)N
crystal growth under high pressure are overviewed. The high pressure growth technique used
in this thesis for the synthesis of the polycrystalline as well as bulk single (Al,Ga)N crystals is
described in Chapter 3.
In Chapter 4, the synthesis of the AlxGa1-xN bulk single crystals with 0.22≤x≤0.91 from
solution in Ga melt under high nitrogen pressure and high temperature is discussed.
Moreover, the measurements of the bandgap of Al0.86Ga0.14N crystals and some preliminary
studies on p-T phase diagram are addressed. The detailed study of the crystal growth as well
as the crystallographic characterisation of the obtained crystals and extended p-T phase
diagram is described in Chapter 5.
Finally, in Chapter 6, the essential and pioneer results obtained from the studying the
thermodynamics of the stability of ternary (Al,Ga)N up to 10 kbar and 1800 °C are
demonstrated.
In order to validate the applicability of our high pressure technique and to overcome technical
hurdles a numerous work was carried out in tremendously fruitful collaborations with Dr. Jan
Jun, who, at the time, engaged himself for this proposal and who is currently working at the
Institute of High Pressure Physics of the Polish Academy of Sciences. The optical bandgap
studies using a femtosecond, pump-probe spectrometry technique were done in fruitful
collaboration with Jie Zhang, who is currently conducting research for his PhD on this topic
under the supervision of Prof. Roman Sobolewski at the Department of Electrical and
Computer Engineering and Laboratory for Laser Energetics at the University of Rochester,
USA (Chapter 4). Most compositional characterisations were carried out using laser ablation
inductively coupled plasma mass spectrometry in collaboration with Kathrin Hametner, who
is working in the group of Prof. Detlef Günther at the Laboratory of Inorganic Chemistry,
11
ETH Zurich (Chapter 4 and 5). Furthermore, substantial contributions were made by Dr.
Sergiy Katrych, who conducted the numerous X-ray diffraction measurements on our single
crystals (Chapter 4 and 5); by Peter Wägli from the Electron Microscopy Center at ETH
Zurich, who did a series of essential EDX measurements and recorded a numerous of EDX
spectra of our crystals.
This dissertation is reproduced from a collection of papers, which have been published or
have been submitted for publication:
Chapter 4. A. Belousov, S. Katrych, J. Jun, J. Zhang, D. Günther, R. Sobolewski, J.
Karpinski, and B. Batlogg, J. Cryst. Growth, 311 (2009) 3971-3974.
Chapter 5. A. Belousov, S. Katrych, K. Hametner, D. Günther, J. Karpinski and B. Batlogg,
AlxGa1-xN bulk crystal growth: crystallographic properties and p-T phase diagram, (2010)
submitted to J. Cryst. Growth.
Chapter 6. A. Belousov, J. Karpinski and B. Batlogg, Thermodynamics of the Al-Ga-N2
system, (2010) submitted to J. Cryst. Growth.
In addition, the publications related to this work are listed on page 99.
12
References:
[1] J. V. Lirman, H.S. Zhdanov, Acta Physicochim. USSR 6 (1930) 306.
[2] F. Briegleb and A. Geuther, Ann. Chem. 123 (1862) 228.
[3] S. Nakamura, G. Fasol, The Blue Laser Diodes, Springer Verlag, Berlin (1997).
[4] W. Saito, Y. Takada, M. Kuraguchi, K. Tsuda, I. Omura, T. Ogura, and H. Ohashi, in
IEEE Transaction on electron devices 50 (2003) 2528-2531.
[5] T. J. Schmidt, X. H. Yang, W. Shan, J. J. Song, A. Salvador, W. Kim, O. Aktas, A.
Botchkarev, and H. Morkoc, App. Phys. Lett. 68 (1996) 1820-1822.
[6] S. Nakamura, M. Senoh, S. Nagahama, N. Iwasa, T. Yamada, T. Matsushita, H.
Kiyoku, Y. Sugimoto, T. Kozaki, H. Umemoto, M. Sano, and K. Chocho, Appl. Phys.
Lett. 72 (1998) 211-213.
[7] H. X. Jiang and J. Y. Lin, Opto-electronics Rev. 10 (2002) 271-286.
[8] Y. Cordier, F. Semond, M. Hugues, F. Natali, P. Lorenzini, H. Haas, S. Chenot, M.
Laügt, O. Tottereau, P. Vennegues, J. Massies, J. Cryst. Growth 278 (2005) 393-396.
[9] W. Kim, Oe. Akta, A. Botchkarev, H. Morkoc, J. Appl. Physiology 79 (1996) 7657-
7666.
[10] E. Iliopoulos, K. F. Ludwig, T. D: Moustakas, and S. N. G. Chu, Appl. Phys. Lett. 78
(2001) 463-465.
[11] M. Matloubian, M. Gershenzon, J. Electro. Mater. 14 (1985) 633-644.
[12] M. Migoshi, M. Sakai, H. Ishikawa, T. Egawa, T. Jimbo, M. Tonaka, O. Oda, J. Cryst.
Growth 272 (2004) 293-299.
[13] H. Amano, M. Imura, M. Iwaya, S. Kamiyama and I. Akasaki, Materials Science
Forum 590 (2008) 175-210.
[14] L. Liu, J. H. Edgar, Materials Science and Engineering R: Reports 37 (2002) 61-127.
[15] S. S. Park, I. W. Park, S. H. Choh, Jpn. J. Appl. Physics 39 (2000) L1141-1142.
[16] J. Hagen, R. D. Metacalfe, D. Wickenden, W. Clark, J. Phys. C 11 (1978) L143-146.
[17] B. Baranov, L. Daweritz, V. B. Gutan, G. Jungk, H. Neumann, H. Raidt, Phys. Status
Solidi (a) 49 (1978) 629-636.
[18] P. R. Hageman, V. Kirilyuk, W. H. M. Corbeek, J. L. Weyher, B. Lucznik, M.
Bochkowski, S. Porowski, S. Muller, J. Cryst. Growth 255 (2003) 241-249.
[19] C. Krichner, V. Schwegler, F. Eberhard, M. Kamp, K. J. Ebeling, P. Pystawko, M.
Leszczynski, I. Grzegory, and S. Porowski, Prog. Cryst. Growth. Charact. 41 (2000)
13
57-83.
[20] J. H. Edgar, L. Liu, B. Liu, D. Zhuang, J. Chaudhuri, M. Kuball, S. Rajasinggam, J.
Crystal growth 246 (2002) 187-193.
[21] R. Schlesser, R. Dalmau, Z. Sitar, J. Crystal Growth 241 (2002) 416-420.
[22] B. M. Epelbaum, C. Seitz, A. Magerl, M. Bickermann, A. Winnacker, J. Crystal
growth 265 (2004) 577-581.
[23] B.M. Epelbaum, O. Filip, M. Bickermann, P. Heimann and A. Winnacker, „Growth
direction and polarity on properties of bulk AlN crystals”, 6th International Workshop
on Bulk Nitride Semiconductors”, August 23-28 (2009), Galindia, Poland.
[24] H. Yamane, M. Shimada, S. J. Clarke, F. J. Disalvo, Chem. Mater. 9 (1997) 413-416.
[25] M. Aoki, H. Yamane, M. Shimada, S. Sarayama, F. J. DiSalvo, J. Cryst. Growth 242
(2001) 70-76.
[26] S. Krukowski, C. Skierbiszewki, P. Perlin, M. Leszczyński, M. Bockowski, S
Porowski, Acta Physica Polonia B 37 (2006) 1265-1312.
[27] R. Dwilinski, A. Wysmolek, J. Baronowski, M. Kaminska, R. Doradzinski, J.
Garczynski, L. Sierzputowski, Acta Physica Polonica 88 (5) (1995) 833-836.
[28] R. Dwilinski et al., „Growth of GaN crystals by the ammonothermal method”,
International Workshop on Nitride Semiconductors, October 6-10 (2008), Montreux,
Switzerland.
[29] R. Dwilinski, R. Doradzinski, J. Garczynski, L. Sierzputowski, M. Zajac, „Recent
achievements in AMMONO bulk method”, 6th International Workshop on Bulk
Nitride Semiconductors”, August 23-28 (2009), Galindia, Poland.
[30] Z. Liliental-Weber, J. Jasinsk, J. Washburn, J. Cryst. Growth 246 (2002) 259-270.
[31] R. Madar, G. Jacob, J. Hallais and R. Fruchart, J. Cryst. Growth 31 (1975) 197-203.
[32] J. Karpinski, S. Porowski, J. Cryst. Growth 66 (1986) 1-10.
[33] S. Porowski, Acta Physica Polonica 87 (2) (1995) 295.
[34] T. Inoue, Y. Seki, O. Oda, S. Kurai, Y. Hamada, T. Taguchi, Phys. Stat. Sol. B 223
(2001) 15-27.
[35] P. Geiser, J. Jun, S. M. Kazakov, P. Wägli, L. Klemm, J. Karpinski, and B. Batlogg,
Appl. Phys. Lett. 86 (2005) 081908.
[36] The table is demonstrated with kind permission from Dr. Boris Feigelson, Naval
Research Laboratory, USA (Email: [email protected]).
[37] H. Saitoh, W. Utsumi, H. Kaneko, and K. Aoki, Jpn. J. Appl. Phys. 43 (2004) L981.
[38] P. Geiser, Dissertation 16126, ETH Zurich (2005).
14
Chapter 2
III-nitride synthesis from solution
This chapter describes the thermodynamic and kinetic aspects of the III-nitride synthesis
from solution under high nitrogen pressure. The thermal stability of the compounds and its
dependence on the nitrogen pressure are discussed. We also present a comprehensive
overview of a GaN, AlN and AlxGa1-xN growth from solution under high nitrogen pressure.
2.1 Basic thermodynamic and kinetic aspects
It is known that III-nitrides are compounds of high bonding energy compared to other III-
V compounds. The bonding energy in III nitrides are 11.52 and 8.92 eV/atom for AlN and
GaN respectively, whereas for GaAs this energy is only 6.52 eV/atom [1]. Therefore, nitrides
melt at very high temperatures and are good thermally stable. The synthesis/decomposition
reaction of one mole of metal nitride MeN is simply:
MeNNMe ⇔+ 22
1 (1)
However, the strong triple bond in the N2 molecule (4.38 eV/atom) lowers the
thermodynamical potential (Gibbs free energy G) of the system of nitrides constituents, Me +
½ N2, approaching that of the nitrides [2]. Moreover, the free energy of constituents decreases
faster with the temperature than G(T) for the compound, and therefore the stability of the
nitride is shifted towards metal and nitrogen at high temperature as illustrated in Figure 1. In
Figure 1 the Gibbs free energy of nitride (1 mol) and the Gibbs free energy of the sum of its
constituents (Ga+½ N2) are shown as a function of temperature and nitrogen pressure
(adapted from [2]). The free energy change ΔG for the considered reaction is:
15
)2
1(
2NMeMeN GGGG +−=Δ (2)
or for ternary AlxGa1-xN:
)2
1)1((
21 NGaAlNGaAl GGxxGaGGxx
+−+−=Δ−
(3)
In equilibrium, ΔG=0. If ΔG<0, the nitride compound is stable. We will describe this reaction
(3) in more detail in Chapter 6.
The data for the constituents in Figure 1 were taken from the thermodynamic tables [3,4].
Since the enthalpy and entropy of formation of GaN [5] are known, we can evaluate the G(T)
dependence for GaN shown in Figure 1a. For AlN, in Figure 1b, the data were used
according to Slack and McNelly [6]. Figures 1a and 1b illustrate the large difference in the
thermal stability between GaN and AlN. At 1 bar pressure GaN becomes thermodynamically
unstable at high temperatures and decomposes around 850 °C, whereas AlN is stable up to
2494 °C [6]. Similar consideration can be made for ternary AlxGa1-xN. Based on the
experimental data and thermodynamic calculations described in Chapter 5 and Chapter 6 the
Gibbs free energy of e.g. Al0.86Ga0.14N as a function of temperature was evaluated as indicated
in Figure 1c and 1d. AlxGa1-xN with high Al content has as predicted higher thermal stability
as for GaN. Al0.86Ga0.14N decomposes at ~942 °C at 1 bar nitrogen pressure. However, the
Gibbs free energy of Al0.86Ga0.14N is much lower than of AlN and is comparable with GaN.
The reasons of this fact will be discussed in Chapter 6. More importantly, it means that
AlxGa1-xN, even with high Al content, becomes unstable at the temperatures comparable to
the GaN decomposition temperature. In particular, for the synthesis of AlxGa1-xN the
decomposition temperature is one of the key issues. Considering the solution growth of
nitrides, where the kinetics of the growth strongly depends on the process temperature,
knowing the decomposition temperature is very important.
Figure 1d shows the influence of the nitrogen pressure on the stability of the nitrides. It
can be seen that the application of the pressure increases the Gibbs free energy of the
constituents more than G(T) of the nitride, which causes the equilibrium point to shift to
higher temperatures, increasing the range of nitride stability. Thus, at 5 kbar Al0.86Ga0.14N
decomposes at 1675 °C, compared to 942 °C at 1 bar nitrogen pressure.
16

0 500 1000 1500 2000 2500 3000-400
-300
-200
-100
0
Ga+1/2N2
GaN
1/2N2
Ga
Gib
bs f
ree
ener
gy (
kcal
/mol
e)
Temperature (K)
ΔG0(T)
0 500 1000 1500 2000 2500 3000 3500-400
-300
-200
-100
0
Al+1/2N2
AlN
1/2N2
Al
Gib
bs f
ree
ener
gy (
kcal
/mol
e)
Temperature (K)
a) b)
0 500 1000 1500 2000 2500 3000 3500-400
-300
-200
-100
0
ΔG0(T)
0.86Al+0.14Ga+1/2N2 Al
0.86Ga
0.14N
1/2N2
Ga
Al
Gib
bs f
ree
ener
gy (
kcal
/mol
e)
Temperature (K)
0 500 1000 1500 2000 2500 3000 3500
-350
-300
-250
-200
-150
5 kbarAlN
GaN
Me+1/2N2
Al0.86
Ga0.14
N
Gib
bs f
ree
ener
gy (
kcal
/mol
e)
Temperature (K)
1 bar
c) d)
Fig. 1. Gibbs free energy change with temperature for III nitrides and their constituents: (a)-
(c) for N2 pressure 1 bar; (d) - G(T) for the constituents is the sum of averaged energy of the
metal and the free energy of nitrogen at pressures of 1 bar and 5 kbar.
17
The results of the analysis agree well with the experimental equilibrium data obtained in
this study (Chapter 5 Figure 3).
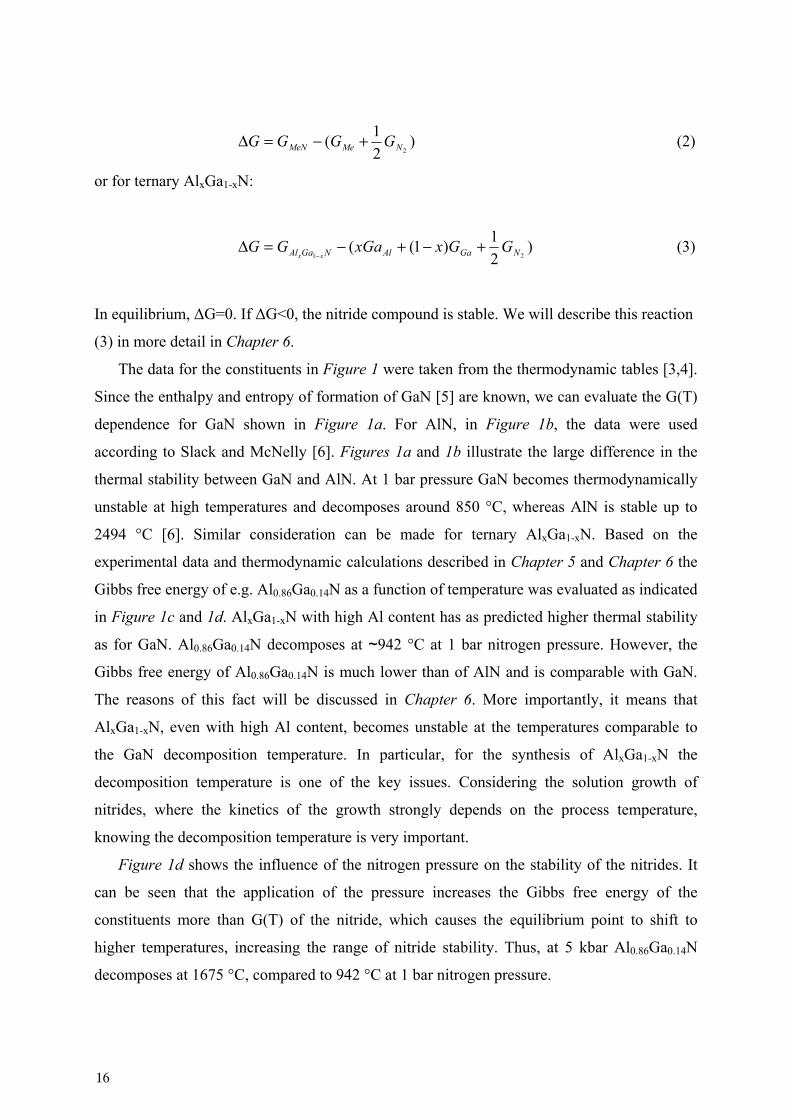
Figure 2 shows the equilibrium nitrogen pressure curves for GaN and AlN. The curve for
AlN was calculated by Slack and McNelly [6] using the available thermodynamical data of
the constituents of the AlN formation reaction. On the basis of the GaN decomposition and
crystal growth experiments, Karpinski and Porowski [5] evaluated the equilibrium curve for
GaN (Figure 2). In short, under certain conditions of temperature and pressure lying above
the equilibrium curve the binary nitride is stable. For example, at 10 kbar GaN starts to
decompose at temperatures higher than 1490 °C. Compared to AlN, the GaN equilibrium
curve deviates from a linear dependence. This is mainly due to the non-ideal behaviour of
nitrogen gas at high temperature and pressure. For AlN, the high nitrogen pressure is not
necessary to extend the thermal stability range.
The stars in the Figure 2 indicate the melting points of AlN and GaN (Table I). These
points were calculated by the use of Quantum Dielectric Theory of Chemical Bonding
proposed by Van Vechten [7]. According to his estimations, the melting temperatures of GaN
3500 2800 2100 1400
3 4 5 610-6
10-5
10-4
10-3
10-2
10-1
100
101
102
103
AlN
GaN
104/T (K-1)
Nit
roge
n p
ress
ure
(kb
ar)
Temperature (°C)
Fig. 2. Equilibrium nitrogen pressure
over GaN and AlN corresponding to the
curves reported by Slack and McNelly.
[6] and Karpinski and Porowski [5]. The
melting points of the two binary
compounds are indicated by stars.
18

and AlN are much higher than the temperatures ever reached in the gas autoclave. For
example, in a gas pressure chamber used in this study the maximum temperature is 1900 °C.
Table I. Melting temperatures and decomposition nitrogen pressures for AlN and GaN [2].
Nitride Tm (K) PN2
* (kbar) PN2
** exp (kbar)
GaN 2488 [8] 60 >55 [8]
AlN 3487 [7] 0.2 >0.1 [9] * - extrapolation of the experimental equilibrium data ** - the highest pressure at which decomposition was observed.
For pressures above the equilibrium curve at a given temperature, the decomposition
occurs at a slow and apparently constant rate suggesting a diffusion-controlled process of
decomposition as reported by Karpinski and Porowski [5].
In the solution growth the behaviour of nitrogen at high pressure is not a trivial problem.
The nitrogen gas is absorbed on the Ga surface and then dissolved in liquid gallium.
Therefore, adsorption of nitrogen N2 molecules leads to its disintegration. This process
required energy not higher than 4.8 eV. According to the quantum mechanical calculations
[10] penetration of the disintegrated single N atoms into Ga liquid leads to the dissolution of
nitrogen N in liquid Ga. For AlN the barrier of this process is 3.2 eV. In addition, the
dissolution of nitrogen in liquid Ga is limited. The solubility of nitrogen in gallium was
reported by Logan and Thurmond [11], Karpinski and Porowski [12] and Grzegory et al. [2].
Fig. 3. Liquidus lines for Ga-GaN
and Al-AlN [13].
XN [at units]
19

In Figure 3 the liquidus curves for Ga-GaN and Al-AlN calculated for ideal solution
approximation with the use of melting parameters estimated by Van Vechten [7] are shown.
The nitrogen solubility is higher for Ga-GaN than for Al-AlN. At 2000 K for Ga-GaN the
solubility of nitrogen can reach 1.5 at% and for Al-AlN only 0.3 at%. Accordingly, for Al-
Ga-AlGaN, adding Al into the Ga melt should decrease the solubility of nitrogen in Al-Ga
melt. However, it is expected that the solubility of nitrogen in Al should have a strong
negative deviation from the ideal solution behaviour and the higher concentration of nitrogen
than predicted by the ideal solution model can be dissolve in the Al liquid [13].
As we discussed, the dissociation of nitrogen in liquid Ga or Al is a kinetically controlled
process dependent on the temperature. Since the barrier for AlN is lower than for GaN, the
efficiency of the nitrogen dissociation by AlN does not require high temperatures (Figure 4).
Figure 4 represent the rate of the nitrogen dissociation estimated for nitrogen pressure of 20
kbar. The horizontal dotted line is the experimental limit for the effective synthesis of GaN
and AlN. In this case, it is 10 mg of nitride at 1 cm3 during 100 hours [13]. As it can be seen,
at low temperature the dissociation rate for GaN is relatively slow. Only at temperatures
higher than 1500 K the effective synthesis of GaN becomes possible. If we take into account
the p-T phase diagram (Figure 2), then we can also conclude that the growth of GaN from the
Ga solution is only possible by application of the high nitrogen pressure.
Fig. 4. Nitrogen dissociation rate I on Al and Ga surface as a function of temperature [14].
20
2.2 GaN crystal growth
The first attempt at high pressure crystal growth of GaN from the solution was reported by
Madar et al. [15]. They could grow the GaN single crystal of the needle, platelets and prism
type at 1200 °C and pressures up to 10 kbar. The growth at 1000 °C led to very thin GaN
films on the gallium surface. It was concluded that an increase of the temperature to 1250 °C
enhances the solubility of nitrogen to 10-3 mole fraction. Karpinski and Porowski [5,12]
continued the study of GaN crystal growth. They constructed a high pressure gas autoclave
that allowed to work up to 1700 °C and 20 kbar. In their experiments, a study of the
equilibrium nitrogen pressure by decomposition of GaN was done: up to 1700 °C and 20 kbar
using gas autoclave and from 1500 to 2300 °C und pressures from 20 to 70 kbar using an
anvil apparatus. For the crystal growth two methods were used: thermal gradient solution
growth and cooling an isothermal solution. They reported the growth of small single crystals
up to 100 μm by thermal gradient method in 4h experiments with the growth rate of about 10
μm/h. This growth rate was significantly higher than reported by Madar et al [15]. The layers
grown at 1250 °C under 16 kbar pressure had a resistivity higher than 108 Ωcm. At the
temperature of 1400-1500 °C under the same pressure, n-type layers of resistivity 10-2-10-4
Ωcm were obtained. It was assumed that nitrogen vacancies developed at the conditions closer
to the equilibrium curve are the source of free electrons. Afterwards, the GaN crystal growth
was investigated at the UNIPRESS Institute of High Pressure in Warsaw [16, 17, 18]. This
Institute is the leading research center on GaN bulk crystal growth with and without
intentional seeding, on the thermodynamic and kinetic of the GaN growth under high nitrogen
pressure. Most thermodynamic aspects of GaN growth from solution described in this chapter
are reviewed from the numerous papers published by UNIPRESS. In our High Pressure
Materials Synthesis Group we investigated the GaN growth from solution using 30 and 40
mm interner diameter chambers. The high pressure gas autoclave is described in Chapter 3.
Boron nitride and graphite were used as a crucible material. The inner diameter of the crucible
is 8 or 14 mm.
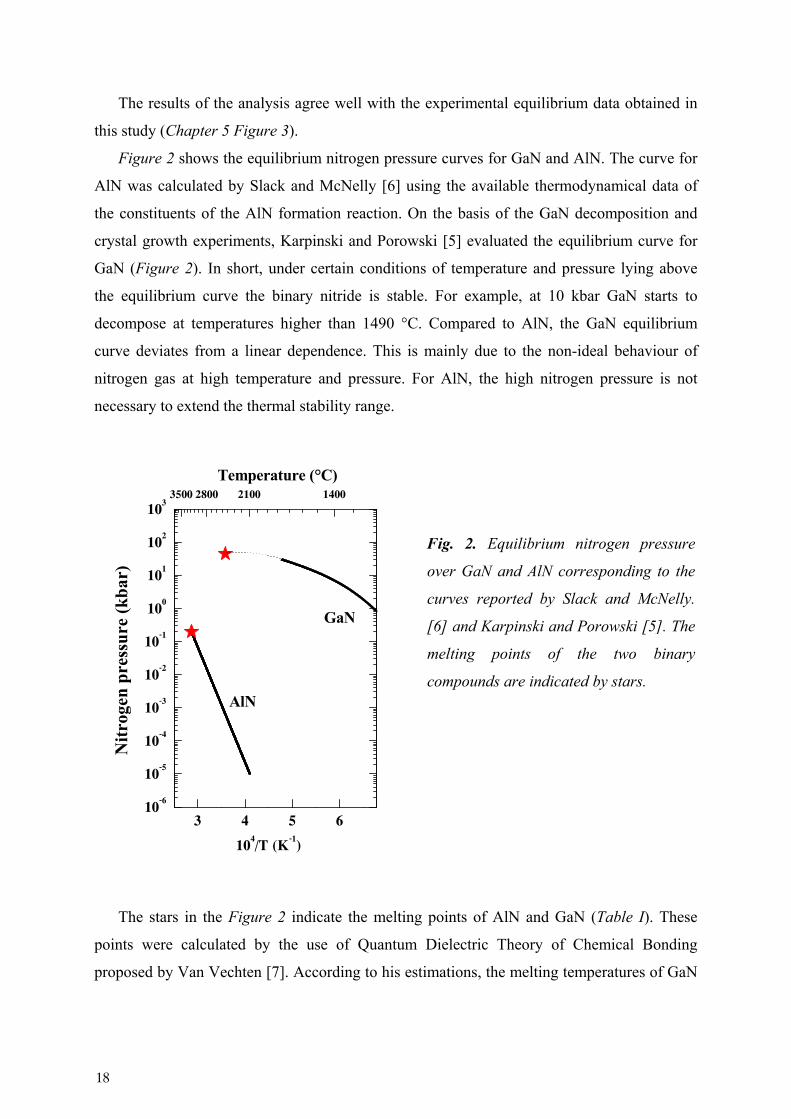
Single crystals of GaN have been grown in our lab without initial seeding at nitrogen
pressure of about 8-12 kbar at temperature of about 1500 °C. The size of the crystals scaled
up to a size of 3x4 mm2 (Figure 5b). The morphology of such crystals strongly depends on
the process pressure, temperature range and nitrogen supersaturation. The low temperature
gradient promotes the growth of hexagonal platelets into the 0110 direction (perpendicular
21
to the c-axis). Such crystals are colourless, transparent, with a flat face and perfect
morphology. Larger thermal gradients as well as limited size of crucible support the high
supersaturation of nitrogen what leads to the growth of dendrites or needles into the 0001
direction parallel to the c-axis. We succeeded in the growth of large GaN crystals using a
seeding crystal. The crystals are up to ≈ 5x3 mm2 in size (Figure 5).
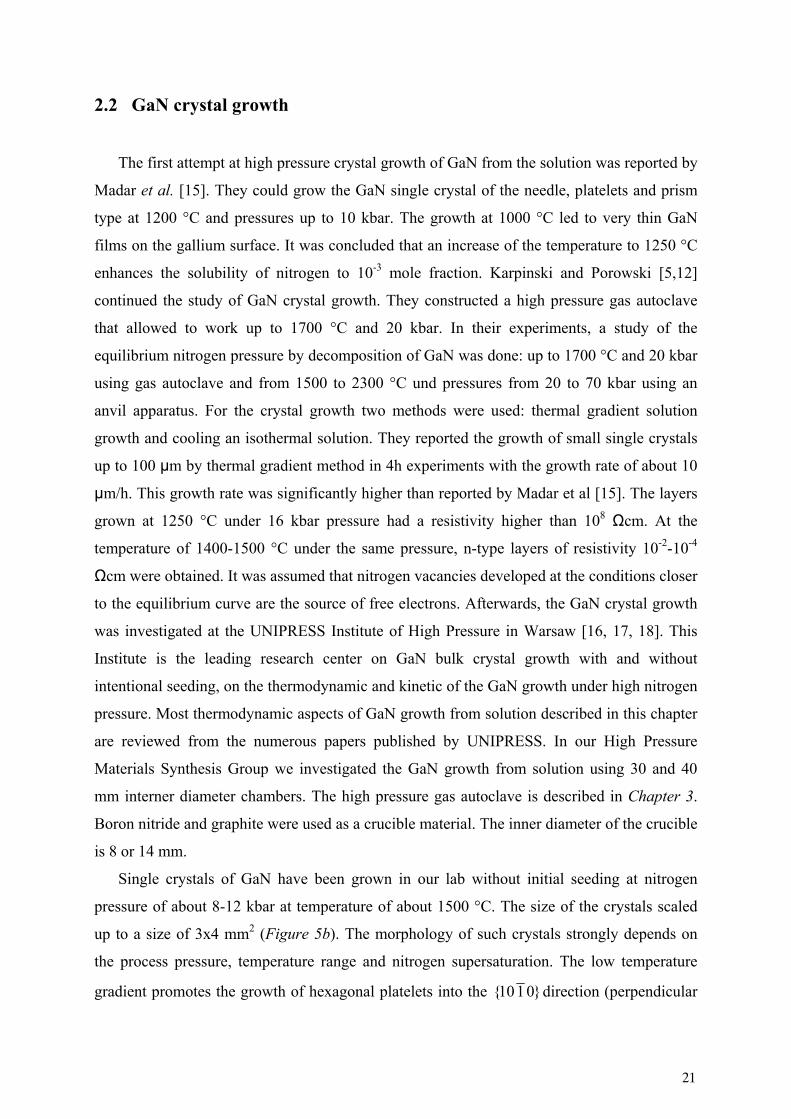
Without initial seeding the GaN crystals
typically grow spontaneously as it can be seen in
Figure 6. At first, the wall of the crucible will be
covered with GaN polycrystalline layer, on which
the GaN crystals then start to grow.
The experiments showed that the size of the
crystals can be extended by using a larger pressure
chambers. At UNIPRESS, GaN can be crystallized
in gas pressure chambers with volume up to 5000
cm3, which allow the use of crucibles with a working
volume up to 50-100 cm3. The internal diameter of the chamber is up to 100 mm. The crystals
are typically synthesized in the range of 5-20 kbar and temperatures of 1400-1720 °C. The
supersaturation in the growth solution is created by the application of the temperature gradient
Fig. 6. Spontaneous growth of
GaN crystals in the BN crucible.
Fig. 5. GaN crystals grown in 40 mm chamber using high nitrogen pressure: (a)- without
initial seeding; (b) with seeding. The grid is 1 mm.
a) b)
22

of 2-20 °C/cm along the axis of the crucible. Typical duration of the growth process is 120-
200 hours. The GaN crystals grown from the solution under high nitrogen pressure are
typically of wurtzite structure, mainly in the form of hexagonal planes.
The two polar faces of the crystal are observed: N-side polar denoted as 1000 and Ga-
side polar as 0001. The growth rate for the platelets without intentional seeding is below
0.1 mm/h along ]0110[ direction (perpendicular to the c-axis), suggesting stable layer-by
layer growth by low supersaturation. The size of the platelets grown without intentional
seeding is usually about 2-3 cm2. The dislocation density in the GaN crystals is lower than 102
cm-2. Usually, the crystals are strongly n-type with free electron concentration of 1019-1020
cm-3 and mobility of about 60 cm2/Vs [19]. The source of free electrons is the oxygen
impurity in the growth system. These free carriers can be eliminated by adding Mg acceptor
into the growth solution. In Figure 7, GaN crystals grown using high nitrogen pressure at
UNIPRESS with 0.2-0.5 at% Mg or Be are shown [20].
The resistivity of the GaN:Mg becomes as high as 104-106 Ωcm at 300 K. More detailed
analysis of electrical properties of pressure grown Mg doped GaN was reported by Litwin-
Staszewska et al. [21]. It should be mentioned that p-type doping is very important for the
technology of all nitride based devices. However, the high ionization energy (200 meV for
GaN) of Mg limits the fraction of ionized acceptors to 1% at room temperature. This affects
the electrical properties of GaN and AlxGa1-xN layers and causes intensive heat generation,
Fig. 7. GaN crystals with 0.2-0.5 at% of Mg or Be grown at UNIPRESS using high nitrogen
pressure. The grid is 1 mm [20].
23
which is a serious problem in high power devices [20]. The GaN crystals grown under high
nitrogen pressure have a high concentration of Ga vacancies as shown by positron
annihilation measurements [22]. In GaN:Mg crystals no gallium vacancies could be observed.
The difference in the Photoluminescence (PL) spectra of the conductive (strong yellow
luminescence) and Mg-doped crystals (no yellow luminescence, but blue Mg-related signal)
supported the view that gallium vacancies are involved in the yellow luminescence in GaN.
The later studies showed that the oxygen impurities and gallium vacancies are both involved
in the yellow luminescence [23]. In case of GaN without doping, the full width at half
maximum (FWHM) is 20-30 arcsec for 1 mm crystals and 30-40 arcsec for 1-3 mm ones. For
large platelets the rocking curve often splits into a few 30-40 arcsec peaks showing a presence
of low angle (1-3 arcsec) boundaries separating grains of a few mm in size. The structural
studies of pressure grown GaN and their dependence on the Ga/N face polarity can be found
here, for X-ray Diffraction [24], transmission electron microscopy (TEM) [25, 26, 27], defect
selective etching (DSE) [28] and atomic force microscopy (AFM) [29].
In this section, we should also shortly mention the method PCSG (Pressure-Controlled
Solution Growth) recently proposed by Inoue et al [30, 31]. In fact, this is similar to HPSG
method. In this method, an over-pressure instead of the temperature decrease is used to induce
the supersaturation of the Ga melt. Inoue et al. constructed high-pressure system with an inner
diameter up to 130 mm which alloys the use of the crucibles with up to 52 mm diameter.
Temperatures up to 1600 °C and pressures up to 10 kbar can be achieved. For crystal growth
the furnace was heated up to the growth temperature of 1475 °C, with pressurizing by
nitrogen. The nitrogen pressure was tentatively increased to 10 kbar at a rate up to 3 kbar/h,
lasting from 0.5 to 16 h. GaN crystal growth was performed without thermal gradient and
initial seeding. Several BN crucibles were simultaneously placed into the furnace. The largest
GaN crystals with a size up to 25 mm were synthesized at 1475 °C and 10 kbar with a rate of
pressure increase about 690 bar/h. Experiments with different rates showed that at lower rates
the growth of larger GaN crystal with a good morphology was preferred. The crystals are
yellowish transparent hexagonal platelets with macro steps and cracks. The reported
dislocation density of these crystals is below 105 cm-2, which is still higher than by HPSG
process.
24

2.3 AlN crystal growth
The main method used to grow AlN bulk crystals is the sublimation technique as
mentioned in Chapter 1 [6, 32, 33]. Only few attempts at growing AlN bulk crystals using
high pressure were made [13, 34]. As we discussed, from the thermodynamic point of view
the high nitrogen pressure is not necessary for AlN crystal growth. AlN is stable at 1 bar up to
2494 °C [6]. However, at the high temperature and at few mbar nitrogen pressure the vapour
pressure of aluminium is high enough that evaporated aluminium destroys the furnace
elements. This can be avoided by increasing the nitrogen pressure, whereas at higher pressure
the self-propagating combustion of AlN is observed [34]. In this case, only low-oxygen
content AlN sintered powder can be obtained. This reaction under nitrogen and nitrogen-
argon mixtures was investigated by M. Bockowski et al. [35]. They proposed a model of AlN
combustion. Accordingly, due to the high enthalpy of AlN formation (see Chapter 6) the heat
released during the creation of nitride warms the sample and the flame starts to propagate
through the liquid aluminium initiating the spontaneous AlN formation. The flame
temperature can reach locally a very high level (~2500 °C). The combustion process strongly
depends on pressure. According to M. Bockowski et al. [34] at pressure higher than 6.5 kbar
the AlN combustion can be suppressed. However, in our experiments in Ga melt the AlN
combustion reaction was observed even up to 10 kbar nitrogen pressure (see Chapter 4). In
those experiments the pressure was applied at first and then the temperature was increased to
the desired value. The understanding of combustion reaction is very important for the growth
of ternary (Al,Ga)N crystals from solution, since the Al metal can be considered as a source
of aluminum in the Ga melt. The growth of AlxGa1-xN crystals by this combustion reaction is
impossible. In case of AlN, only whiskers can be obtained during the combustion reaction
according to Guojian et al [36]. Even if the combustion reaction is suppressed, a thin AlN
layer forms on the liquid aluminum surface and prevents the diffusion of nitrogen into the
melt.
However, this layer can be dissolved into the melt at high temperature. The AlN needle-
like and irregularly shaped crystals were obtained from solution in aluminum at the nitrogen
pressure of ~10 kbar and in temperature range of ~1525-1725 °C (Figure 8) [34]. In a typical
experiment, the bulk aluminum, contained in a BN crucible, located in the furnace inside the
high-pressure chamber with 40 mm internal diameter, was heated at a constant rate of 10 °C/h
25

to the given temperature. Then, the metal sample was annealed at high temperature for 120
hours.
The temperature gradient, comparable with that used for GaN, was in order of 5-25 °C/cm
along the axis of the crucible. The crystals were white in colour and had a wurtzite structure.
They grew spontaneously at the cooler end of the crucible from the polycrystalline AlN layer
created on the surface of liquid aluminium. At high temperature this AlN layer was dissolved
in the Al melt and subsequently serves as a nitrogen source for the crystal growth. The need-
like crystals were grown in a large thermal gradient, greater than 10 °C/cm, and the bulk
crystal with lower than 10 °C/cm. The chemical or physical characterisation of these AlN
crystals was not reported until now.
2.4 AlGaN crystal growth
AlN and GaN were successfully synthesized in a high nitrogen pressure gas autoclave at
high temperature and under nitrogen atmosphere [5,12,16,17,34]. However, no reports were
available on the growth of ternary (Al,Ga)N alloy in gas autoclave. The first attempts to grow
(Al,Ga)N under nitrogen atmosphere were made by Peter Geiser in our group [37, 38]. He
looked for a possibility to synthesize the ternary nitride from solution in Al/Ga melt using 30
Fig. 8. Typical AlN crystals grown from a liquid solution of nitrogen in aluminium: (a) need-
like crystals; (b) irregular bulk [34]. The grid spacing is 1mm.
26
mm interner diameter gas autoclave. It was found that if the concentration of Al dissolved in
the Ga melt is higher than ~1% at 1475 °C, the AlxGa1-xN crystal growth is suppressed. After
the crucible with the Ga melt was cooled down to room temperature, a very dense AlN layer
forms on the Al/Ga melt surface. This layer probably prevents dissolving of nitrogen gas in
the melt. For higher Al concentration (>10%), a strong AlN combustion reaction, similar as it
is described in [34] for AlN solution growth, occurred, yielding fine-grained material. Though
at higher temperatures around 1550 °C and by adding small amount of Al into the melt (<1%)
the AlN layer did not form; nevertheless AlxGa1-xN crystal growth was not possible [37]. It
was expected that growth of (Al,Ga)N would be possible at higher temperatures, since the
AlN layer can be dissolved in the melt as reported by Bockowski for AlN layer in the Al melt
[34]. However, due to the temperature limitations in the gas autoclave at that time, the growth
experiments were pursued in a cubic anvil cell, allowing to operate the temperature up to
2100 °C and pressure up to 35 kbar. AlxGa1-xN bulk single crystals up to x=0.3 were
synthesized from solution in Ga/Al melt using a cubic anvil cell [38]. The cubic anvil cell
itself is described in the Chapter 3. For the crystal growth, annealed GaN powder was placed
in the middle of the gold capsule, whereas on the top and the bottom of the capsule liquid Ga
and small pieces of Al were added. Then, the gold capsule was placed into the BN crucible,
which was introduced into the pressure cell. The gold capsule prevented the liquid Ga from
being pressed out of the BN crucible. GaN powder served as a source of nitrogen. The
crystals were typically synthesized at 30 kbar and 1750 °C during annealing for 12-60 h. The
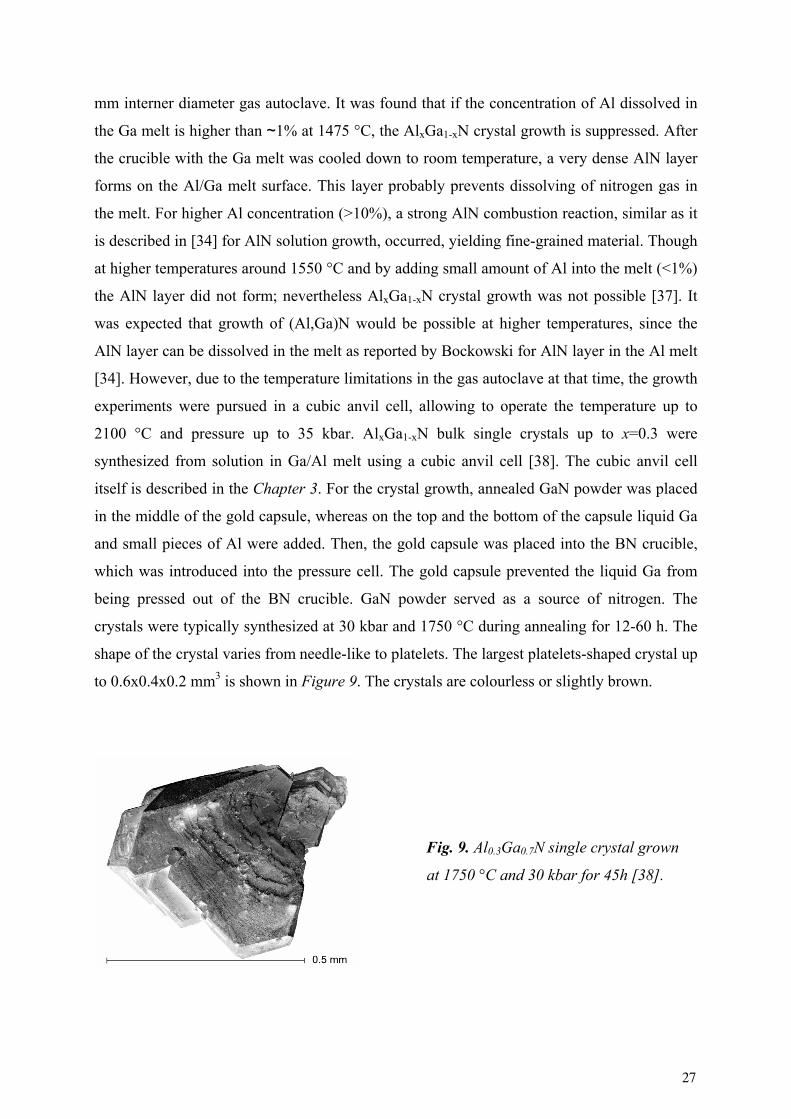
shape of the crystal varies from needle-like to platelets. The largest platelets-shaped crystal up
to 0.6x0.4x0.2 mm3 is shown in Figure 9. The crystals are colourless or slightly brown.
Fig. 9. Al0.3Ga0.7N single crystal grown
at 1750 °C and 30 kbar for 45h [38].
27
According to the laser ablation mass spectrometry gold was not incorporated into the
AlxGa1-xN crystals. Only Si was detected as a significant trace element, with concentrations in
the range of 103 ppm. However, a thin GaN capping layer in range of few μm was observed
on the surface of AlxGa1-xN crystals [37]. Room-temperature photoluminescence
measurements showed the blue shift of the near-band gap luminescence of GaN up to 0.45 eV
for Al-substituted samples.
Since a single-stage heater was used that produces temperature gradient along the c-axis
of the crucible, the various shapes of crystals thus reflect the local temperature gradient. The
temperature and therefore the temperate gradient is controlled by the applied power according
to the calibration made using B-type thermocouples. As a result the temperature error may
reach ±50 °C. In addition, the pressure is controlled in a range of 0.5 kbar. Misalignment of
the starting materials, mainly GaN pellet, in the BN crucible is possible during built-up of the
pressure. All considered factors make it difficult to precisely control the crystal growth
conditions and therefore to provide the reproducibility of the crystal growth and Al content in
the crystals.
However, small AlxGa1-xN crystals can be grown from Al/Ga melt with a low Al content
(1-3 %Al) using a gas pressure autoclave [37]. If GaN powder is used as a nitrogen source
small crystals with 3 to 6 %Al were obtained. Unfortunately, since the p-T conditions for
those experiments were chosen above the GaN equilibrium line, at which GaN is stable (see
Figure 2), GaN crystals with diffused Al were probably synthesized. This is also supported
by the fact that Al content in the GaN crystals varies from the cold to hot zone of the crucible,
depending on the temperature.
The key question here concerns the equilibrium conditions required to thermodynamically
stabilize the (Al,Ga)N phase. As it will be shown in Chapter 4-6, the reproducible AlxGa1-xN
crystal growth in a nitrogen gas pressure autoclave is possible. The use of the pre-reacted
AlxGa1-xN precursor as a source of aluminium and nitrogen in the melt (as proposed by Peter
Geiser [37]), allows to overcome the problem with formation of AlN layer on the Ga/Al
surface. Such AlxGa1-xN precursors were synthesized using a cubic anvil cell. Knowing the
proper p-T conditions one can synthesize the crystals even at lower temperature such 1426 °C.
As we found, the p-T conditions for the AlxGa1-xN growth should be selected below the GaN
equilibrium curve. Moreover, the composition x in the growing AlxGa1-xN crystals can be
selected by the proper chose of p-T conditions according to the estimated AlxGa1-xN
equilibrium phase diagram.
28

References:
[1] W. A. Harrison, Electronic Structure and Properties of Solids, San Francisco (1980).
[2] I. Grzegory, J. Jun, M. Bockowski, S. Krukowski, M. Wróblewski, B. Lucznik, and S.
Porowski, J. Phys. Chem. Solids 56 (1995) 639-647.
[3] L. V. Gurvich, I. V. Veyts and C. B. Alcock, Thermodynamic properties of individual
substances, 4th edition, V. 1, part 2, Hemisphere Publishing Corp., 1989.
[4] L. V. Gurvich, I. V. Veyts and C. B. Alcock, Thermodynamic properties of individual
substances, 3rd edition, V. 3, part 1-2, Begell House, Inc., 1996.
[5] J. Karpinski, S. Porowski, J. Cryst. Growth 66 (1986) 11-20.
[6] G. A. Slack, T. F. McNelly, J. Cryst. Growth 34 (1976) 263-279.
[7] J. A. Van Vechten, Phys. Rev. B 7 (1973) 1479-1507.
[8] W. Utsumi, H. Saitoh, H. Kaneko, T. Watanuki, K. Aoki and O. Shimomura, Nature
Materials 2 (2003) 735-737.
[9] W. Class., Contract Rep., NASA-Cr-1171 (1968).
[10] S. Krukowski, Cryst. Res. Technol. 34 (1999) 785-795.
[11] R. A. Logan, C. D. Thurmond, J. Electrochem. Soc. 125 (1976) 1161.
[12] J. Karpinski and S. Porowski, J. Cryst. Growth 66 (1986) 1-10.
[13] M. Bockowski, Cryst. Res. Technol. 36 (2001) 771-787.
[14] S. Krukowski, Z. Romanowski, I. Grzegory, S. Porowski, J. Cryst. Growth 175 (1998)
159-162.
[15] R. Madar, G. Jacob, J. Hallais and R. Fruchart, J. Cryst. Growth 31 (1975) 197-203.
[16] I. Grzegory, J. Jun, S. Krukowski, Proceedings of XI AIRAPT Conference, Naukowa
Dumka, Kijev (1989).
[17] J. Prywer, S. Krukowski, MRS Internet J. Nitride Semicond. Res. 3 (1998) 47.
[18] I. Grzegory, J. Phys. Condens. Matt. 13 (2001) 6875-6892.
[19] P. Perlin, J. Camassel, W. Knap, T. Talercio, J. C. Chervin, T. Suski, I. Grzegory, S.
Porowski, Appl. Phys. Lett. 67 (1995) 2524-2526.
[20] S. Krukowski, C. Skierbiszewski, P. Perlin, M. Leszczyński, M. Bockowski, S.
Porowski, Acta Physica Polonica B 37 (2006) 1265-1312.
[21] E. Litwin-Staszewska, T. Suski, R. Piotrkowski, I. Grzegory, M. Bockowski, L.
Robert, J. Knczewcz, D. Wasik, E. Kaminska, D. Cote, B. Clerjaud, J. Appl. Phys. 89
(2001) 7960-7965.
29

[22] K. Saarinen, T. Laine, S. Kuisma, P. Hautojarvi, L. Dobrzynski, J. M. Baranowski, K.
Pakula, R. Stepniewski, M. Wojdak, A. Wysmolek, T. Suski, M. Leszczynski, I.
Grzegory, S. Porowski, Phys. Rev. Lett. 79 (1997) 3030.
[23] G. Slack, L. J. Schowalter, D. Morelli, J. A. Freitas, J. Cryst. Growth 246 (2002) 287-
298.
[24] M. Leszczynski, I. Grzegory, H. Teisseyre, T. Suski, M. Bockowski, J. Jun, J. M.
Baronowski, S. Porowski, J. Domagala, J. Crystal Growth 169 (1996) 235-242.
[25] Z. Liliental-Weber, EMIS Data review Series No23, Published by INSPEC, The
Institution of Electrical Engineers, London (1999) 230.
[26] S. H. Christiansen, M. Albrecht, H. P. Strunk, C. T. Foxon, D. Korakakis, I.
Grzegory, S. Porowski, Phys. Stat. Solidi (a) 176 (1999) 285-290.
[27] J. L. Weyher, P. D. Brown, J. L Rouviere, T. Wosinski, A. R. A. Zauner, I. Grzegory,
J. Cryst. Growth 210 (2000) 151-156.
[28] J. L. Weyher, S. Müller, I. Grzegory, S. Porowski, J. Cryst. Growth 182 (1997) 17-22.
[29] P. Prystawko, R. Czernecki, M. Leszczyński, P. Perlin, P. Wiśniewski, L. Dmowski,
H. Teisseyre, T. Suski, I. Grzegory, M. Bockowski, G. Nowak, S. Porowski, Phys.
Stat. Solidi (a) 192 (2002) 320-324.
[30] T. Inoue, Y. Seki, O. Oda, S. Kurai, Y. Hamada and T. Taguchi, Phys. Stat. Sol. (b)
223 (2001) 15-27.
[31] T. Inoue, Seki, O. Oda, S. Kurai, Y. Hamada and T. Taguchi, Jpn. J. Appl. Phys. Part
1 39 (2000) 2394-2398.
[32] B. M. Epelbaum, C. Seitz, A. Megerl, M. Bickermann, A. Winnacker, J. Cryst.
Growth. 265 (2004) 577-581.
[33] R. Schlesser, R. Dalmau, Z. Sitar, J. Cryst. Growth 241 (2002) 416-420.
[34] M. Bockowski, B. Lucznik, I. Grzegory, S. Krukowski, M. Wróblewski and S.
Porowski., J. Phys. Condens. Mat. 14 (2002) 11237-11242.
[35] M. Bockowski, A. Witek, S. Krukowski, M. Wróblewski, S. Porowski, R. M. Marin-
Ayral, and J. C. Tedenac, J. Mat. Synth. Proc. 5 (1997) 449-458.
[36] J. Guojian, Z. Hanrui, Z. Jiong, R. Meiling, L. Wenlan, W. Fengying, Z. Baolin, J.
Mater. Sci. 35 (2000) 63-69.
[37] P. Geiser, Dissertation 16126, ETH Zurich (2005)
[38] P. Geiser, J. Jun, S. M. Kazakov, P. Wägli, J. Karpinski, and B. Batlogg, Appl. Phys.
Lett. 86 (2005) 081908.
30
Chapter 3
High pressure growth technique
As mentioned in Chapter 1, effective ways to grow high quality III-nitrides bulk crystals
is the use of solution or vapour growth methods. The solution method applied in this work is
based on the growth from nitrogen dissolved in liquid Ga/Al under high nitrogen pressure. In
this chapter we describe the high pressure technique used for the synthesis of the
polycrystalline samples as well as AlxGa1-xN bulk single crystals.
3.1 High nitrogen pressure gas autoclave
Originally, the gas autoclave for the growth from solution in a gas atmosphere was
applied in the beginning of the 1980s by Karpinski et al [1,2] at UNIPRESS in Poland. They
could work with pressures up to 20 kbar and temperatures up to 1700 °C. Similar equipment
was used in our laboratory and was continuously modified and improved. For crystal growth
crucial system parameters are the crucible size, pressure and the maximum temperature. To
increase the size of crucible chambers with larger interner diameter are needed. If a higher
maximum operating temperature is required, the isolation of the furnace plays an important
role. This required again a larger volume of the pressure chamber. To increase the interner
diameter of the chamber and at the same time to be able to operate with high pressure is not a
trivial problem. The pressure-induced stress and strain distribution in the chamber is
important. According to the elastic equilibrium theory the highest stress occurs at the bore
surface of the chamber [3]. And for the most part of the cross section, only a small part is
loaded with a maximum stress. It means that increasing the outer diameter will bring only a
small advantage for the maximum pressure inside. The most suitable solution is the use of two
cylinders mounted together with pre-stress. The outer cylinder applies a compressive stress on
the inner one in opposite direction to the internal gas pressure, yielding the reducing of
31

material fatigue and therefore increasing the maximum operational pressure by up to
approximately a factor of 2. Such compressive stress is built up by pressing an outer cylinder
on top of the inner cylinder. For that reason the inner diameter of that outer cylinder is smaller
than the outer diameter of inner one. The contact surface between two cylinders is designed as
a slight cone (0.2°). Another possibility is to cool the inner cylinder and simultaneously heat
the outer one. As a result, the outer cylinder will thermally expand in comparison to the inner
one and the necessary compressive stress will be produced. However, the latter method is
quite difficult to handle and therefore the solution with the slightly conical cylinders is used
more often. In the beginning the 30 mm interner diameter chamber was used in our laboratory
for the growth of GaN crystals. The maximum pressure that could be safety operated is 15
kbar. By using the BN ceramics and alumina isolation the temperature up to 1600 °C can be
achieved. Later, in order to grow larger crystals the new chamber with 40 mm interner
diameter was designed by Jan Jun in our lab [4].
Fig. 1. Nitrogen high pressure growth system used for the synthesis of binary and ternary
III nitrides.
Gas compressor
Capillary
Hydraulic compressor
Pressure intensifier
Experimental gas chamber40 mm inner diameter
30 mm chamber
Gas compressor
Capillary
Hydraulic compressor
Pressure intensifier
Experimental gas chamber40 mm inner diameter
30 mm chamber
32

A state of art high pressure equipment, constructed in our lab and suitable for the crystal
growth experiments at high gas pressure and high temperature is shown in Figure 1. By using
a 40 mm interner diameter chamber, we can operate up to 12 kbar pressure and temperature
around 1800 °C. The 30 mm chamber is used as a pressure intensifier and the 40 mm chamber
is used for the crystal growth. Both chambers are connected through a thin capillary (0.3 mm
inner diameter). The capillary are fixed in a plug, which closes the chambers from one side.
On the other side the piston and the plug with a furnace are placed for the 30 mm and 40 mm
chamber respectively. At first, the high purity nitrogen gas (99,9999 %) is pumped up to 3
kbar in the 30 mm and 40 mm chambers using a commercial gas compressor by “Nova
Swiss”. Then, the inlet into 30 mm chamber will be closed with a piston operated by an oil
hydraulic compressor with a maximum oil pressure of 630 bar. Thus, by moving the piston
into the 30 mm chamber the gas inside is compressed to desired value. For safety reasons, the
free volume in the 30 mm chamber is reduced by filling free space with an aluminium spacer.
Only the space required to move the piston is left free. The diameter of the oil hydraulic
cylinder and the autoclave bore yield a multiplication factor of about 30 for the pressure
intensifier. The gas pressure can be kept constant by using specially constructed sealing rings
on the piston. Depending on the required pressure range the rubber ring and CuBe2 alloy rings
with different hardness are used as seals. The same type of sealing is also used for the plugs
of both chambers. More details about construction and description of the sealing rings can be
found in Peter Geiser`s thesis [4]. Finally, the 40 mm chamber is shut off from the system by
a high pressure valve. When the temperature is ramped up, the gas pressure increases
accordingly. On the basis of previous experiments one can select the starting pressure so, that
the desired pressure can be achieved after establishing of the growth temperature. Several
gauges are used for pressure measurements. One unit is attached to the 3 kbar compressor to
monitor the pressure during operation of the first compressor. The second one is connected to
the oil hydraulics. The measured oil pressure can be converted to the pressure inside the
chamber. Due to the friction forces between autoclave walls, metal seal and piston some
significant uncertainty in determining of the pressure can occur. For that reason, another
pressure sensor, a manganese coil, is placed on the capillary plug inside the chamber for
precise pressure monitoring. In order to control the pressure in the 40 mm chamber after all
valves were closed, another additional pressure gauge is installed. Thus, the pressure in both
chambers can be monitored with a good accuracy ~±50 bar.
In our construction the heater is placed inside the pressure chamber. In comparison to
another pressure technique, where the pressurized volume is heated externally, this is more
33
advantageous. There is no heating of the walls of the mechanically stressed chamber that
encloses the gas of very high pressure.
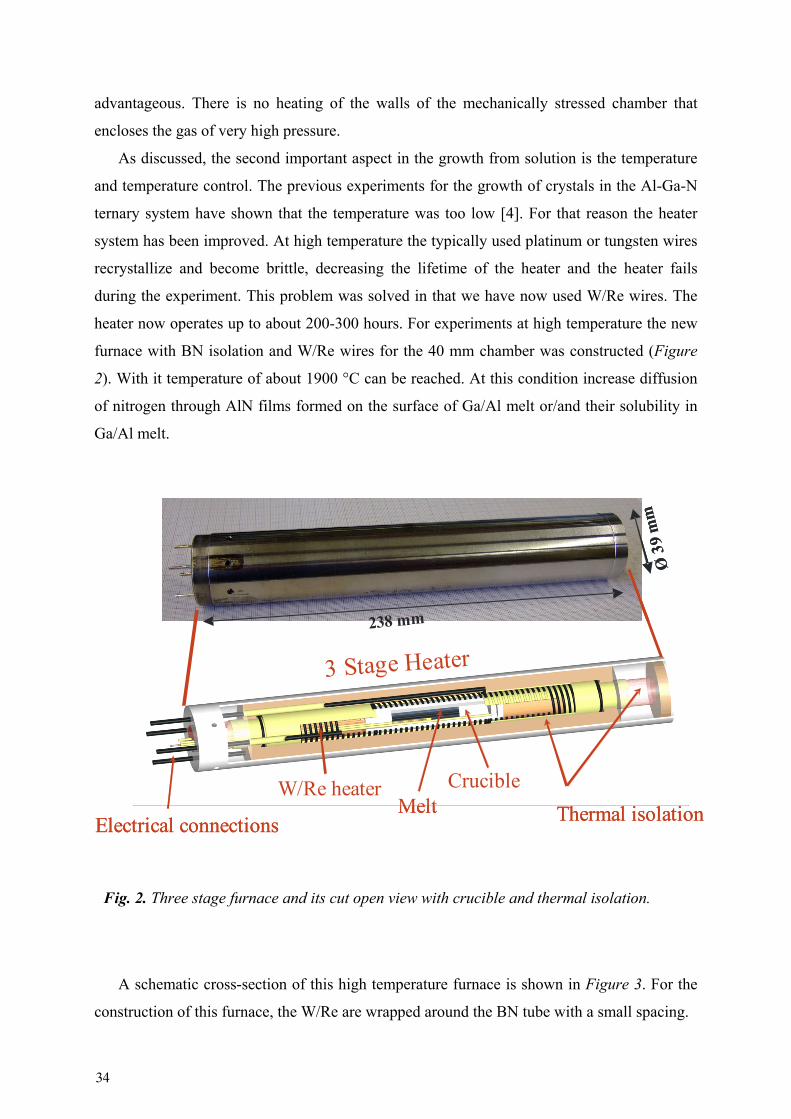
As discussed, the second important aspect in the growth from solution is the temperature
and temperature control. The previous experiments for the growth of crystals in the Al-Ga-N
ternary system have shown that the temperature was too low [4]. For that reason the heater
system has been improved. At high temperature the typically used platinum or tungsten wires
recrystallize and become brittle, decreasing the lifetime of the heater and the heater fails
during the experiment. This problem was solved in that we have now used W/Re wires. The
heater now operates up to about 200-300 hours. For experiments at high temperature the new
furnace with BN isolation and W/Re wires for the 40 mm chamber was constructed (Figure
2). With it temperature of about 1900 °C can be reached. At this condition increase diffusion
of nitrogen through AlN films formed on the surface of Ga/Al melt or/and their solubility in
Ga/Al melt.
A schematic cross-section of this high temperature furnace is shown in Figure 3. For the
construction of this furnace, the W/Re are wrapped around the BN tube with a small spacing.
Fig. 2. Three stage furnace and its cut open view with crucible and thermal isolation.
3 Stage Heater
CrucibleMelt
Electrical connections
W/Re heaterThermal isolation
238 mm
Ø39
mm
3 Stage Heater
CrucibleMelt
Electrical connections
W/Re heaterThermal isolation
238 mm
Ø39
mm
34
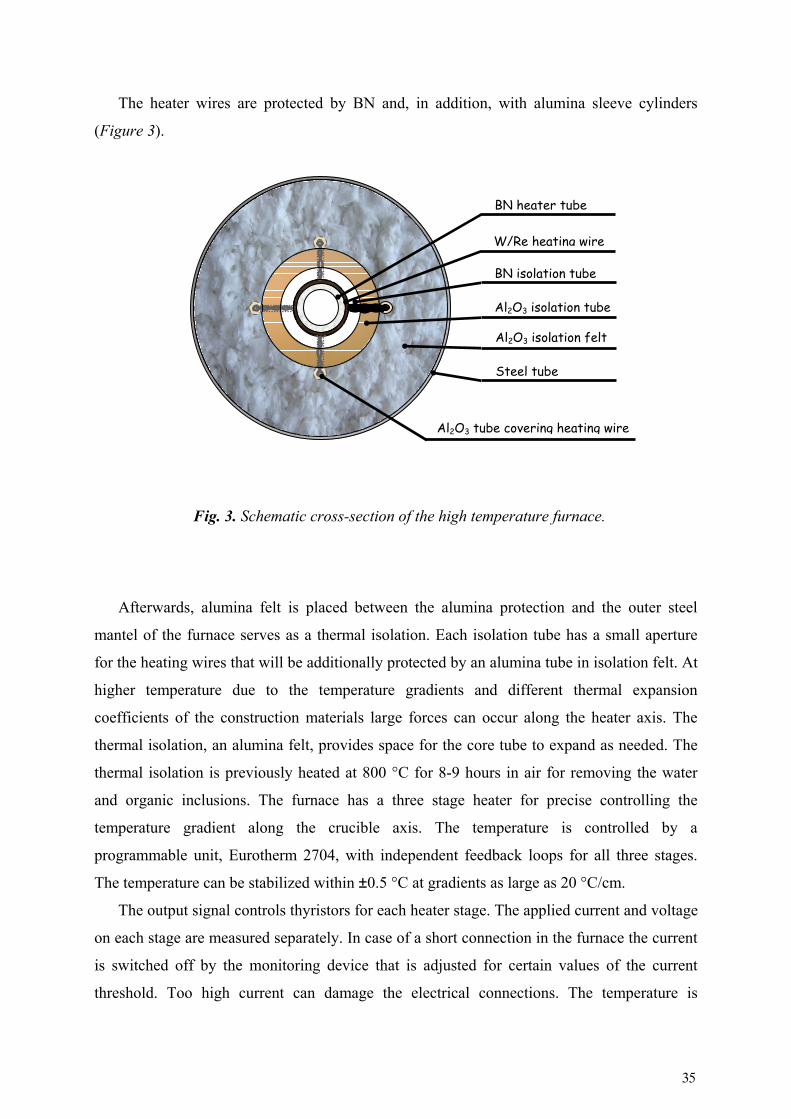
The heater wires are protected by BN and, in addition, with alumina sleeve cylinders
(Figure 3).
Afterwards, alumina felt is placed between the alumina protection and the outer steel
mantel of the furnace serves as a thermal isolation. Each isolation tube has a small aperture
for the heating wires that will be additionally protected by an alumina tube in isolation felt. At
higher temperature due to the temperature gradients and different thermal expansion
coefficients of the construction materials large forces can occur along the heater axis. The
thermal isolation, an alumina felt, provides space for the core tube to expand as needed. The
thermal isolation is previously heated at 800 °C for 8-9 hours in air for removing the water
and organic inclusions. The furnace has a three stage heater for precise controlling the
temperature gradient along the crucible axis. The temperature is controlled by a
programmable unit, Eurotherm 2704, with independent feedback loops for all three stages.
The temperature can be stabilized within ±0.5 °C at gradients as large as 20 °C/cm.
The output signal controls thyristors for each heater stage. The applied current and voltage
on each stage are measured separately. In case of a short connection in the furnace the current
is switched off by the monitoring device that is adjusted for certain values of the current
threshold. Too high current can damage the electrical connections. The temperature is
BN heater tube
BN isolation tube
Al2O3 isolation tube
W/Re heating wire
Steel tube
Al2O3 isolation felt
Fig. 3. Schematic cross-section of the high temperature furnace.
Al2O3 tube covering heating wire
35

measured with W/Re thermocouples Type C in every furnace stage. This type of
thermocouples delivers a temperature accuracy of about ±1%. In addition, the temperature of
electrical connections will be also measured with a thermocouple Type T (copper-constantan)
as a reference for the cold point of the three thermocouples placed inside the furnace. The
furnace can have two different internal diameters depending on the desired temperature. For
the temperatures up to 1600 °C the furnace with the alumina tube and isolation can be used.
This furnace has a 19 mm internal diameter in which a crucible of 14 mm interner diameter
(Figure 4) can be inserted. At higher temperatures, the inner wall of the steel chamber will be
heated and causes degradation of its mechanical properties due to the embittlement. For
higher temperatures the furnace with BN ceramics is suitable as described above.
Subsequently, the thermal isolation of this furnace is much thicker and the internal diameters
of the furnace and therefore of the growth crucible are reduced to 12.5 mm and 8 mm
respectively. In Figure 4 two kind of aforementioned crucibles with inner diameter 8 mm and
14 mm are shown. In this work graphite was used as crucible material. The graphite crucible
is 70 mm long and has 3 slots on the side for thermocouples. For safe operation, the inner wall
of the steel chamber must not be hotter than 200 °C. To prevent overheating the chamber is
equipped with a steel mantel that is cooled by water.
Metal melt
Space forthermocouples
Cap with central bore
70m
m
øInn=8 mmøInn=14 mm
Metal melt
Space forthermocouples
Cap with central bore
70m
m70
mm
øInn=8 mmøInn=14 mm
Fig. 4. Side- and schematic view of graphite crucibles.
36

There is a failsafe system that was built in the cooling water supply. In case of problems
with the water supply all heater stages are turned off. All acquired data such as temperatures
and pressures are monitored and logged in a computer.
The experimental procedure for the crystal synthesis will be described in Chapter 4 in the
crystal growth part. However, here we would like to give addition information on the
operating of the high pressure equipment. After the crucible is loaded with the starting
materials, it is placed into the middle of the furnace. Afterwards, the whole bore of the
furnace is covered from the top and bottom with alumina ceramics. It is important for
ensuring of a good thermal isolation and for preventing heat convection inside the furnace.
Especially for the growth experiment in a vertical autoclave position the heat convection
plays a crucial role. If heat convection is too strong, the loss of heat for the certain heater
stage will be so big that the temperature can not be controlled anymore properly. All free
volume in the furnace must be well filled. The heat convection can be reduced by slightly
tilting the gas autoclave. The furnace is connected to the plug equipped with electrical feed-
through and is placed into the experimental chamber. A high purity of the system is achieved
by an initial evacuation of the whole high pressure equipment (30 and 40 mm chambers and
capillary) to 10-6 mbar. Subsequently, the furnace is annealed in vacuum in order to remove
the water adsorbed on the surface of the crucible and the thermal isolation of the furnace. The
bake-out is done at around 300 °C for 4-5 hours. After the furnace is cooled to the 50 °C,
nitrogen gas is introduced into the system and pumped to the desired value. From this stage
the system is ready for the experiment.
In order to test the high pressure system, the furnace is pre-heated to 300 °C under high
nitrogen pressure. After this the experiment run can begin according to the desired time-
temperature program. A typical growth run follows the temperature program steps listed in
Table I.
At first, the temperature is slowly increased to 1000 °C during 2 hours and then to the
growth temperature. The duration of the second heating stage is selected depending on the
desired growth temperature. It is also advisable to heat up slowly at temperatures higher than
1000 °C. Too quicker heating or cooling of the furnace may cause its failure. Then, the
temperature gradient is set and the crystal growth dwell starts. As we observed in this study,
the crystal with a particular composition x can be synthesised at the p-T conditions lying on
the equilibrium line for a particular AlxGa1-xN composition (see Chapter 5 and Chapter 6). If
the temperature or pressure are shifted from this characteristic equilibrium line, another
AlxGa1-xN compound with different composition x will grow. This is a very important during
37
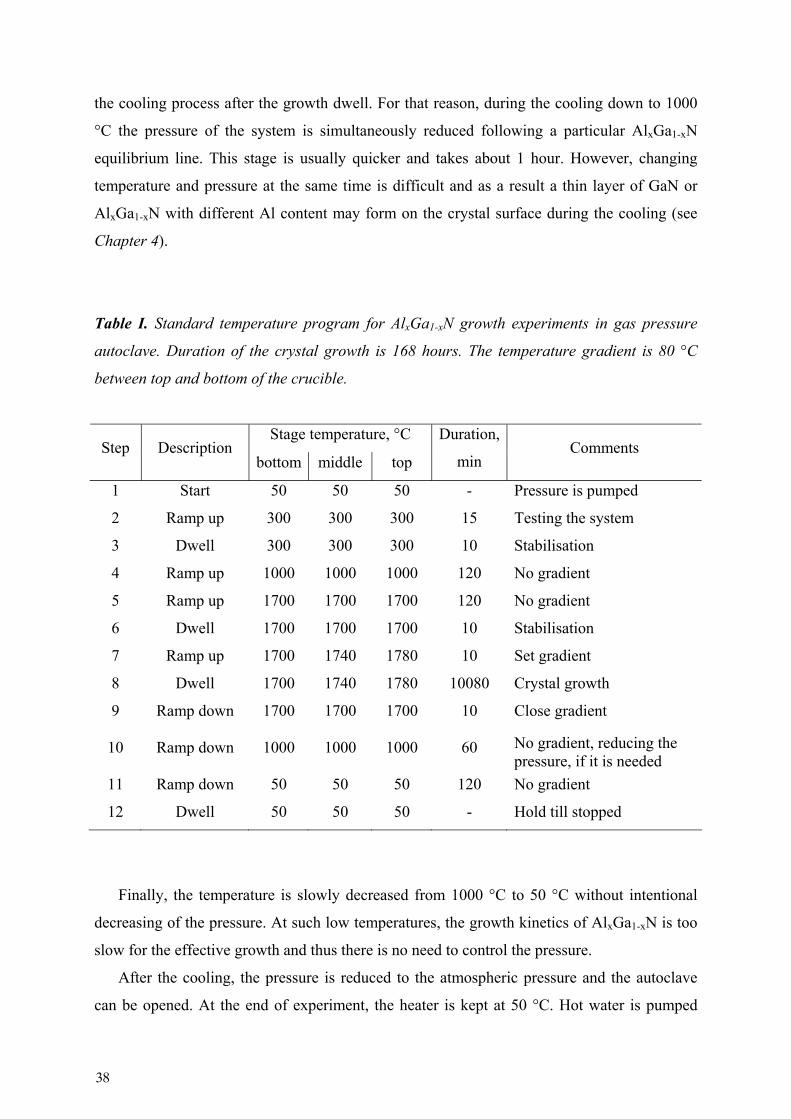
the cooling process after the growth dwell. For that reason, during the cooling down to 1000
°C the pressure of the system is simultaneously reduced following a particular AlxGa1-xN
equilibrium line. This stage is usually quicker and takes about 1 hour. However, changing
temperature and pressure at the same time is difficult and as a result a thin layer of GaN or
AlxGa1-xN with different Al content may form on the crystal surface during the cooling (see
Chapter 4).
Table I. Standard temperature program for AlxGa1-xN growth experiments in gas pressure
autoclave. Duration of the crystal growth is 168 hours. The temperature gradient is 80 °C
between top and bottom of the crucible.
Stage temperature, °C Step Description
bottom middle top
Duration,
min Comments
1 Start 50 50 50 - Pressure is pumped
2 Ramp up 300 300 300 15 Testing the system
3 Dwell 300 300 300 10 Stabilisation
4 Ramp up 1000 1000 1000 120 No gradient
5 Ramp up 1700 1700 1700 120 No gradient
6 Dwell 1700 1700 1700 10 Stabilisation
7 Ramp up 1700 1740 1780 10 Set gradient
8 Dwell 1700 1740 1780 10080 Crystal growth
9 Ramp down 1700 1700 1700 10 Close gradient
10 Ramp down 1000 1000 1000 60 No gradient, reducing the pressure, if it is needed
11 Ramp down 50 50 50 120 No gradient
12 Dwell 50 50 50 - Hold till stopped
Finally, the temperature is slowly decreased from 1000 °C to 50 °C without intentional
decreasing of the pressure. At such low temperatures, the growth kinetics of AlxGa1-xN is too
slow for the effective growth and thus there is no need to control the pressure.
After the cooling, the pressure is reduced to the atmospheric pressure and the autoclave
can be opened. At the end of experiment, the heater is kept at 50 °C. Hot water is pumped
38
through the cooling jacket. This prevents the condensation of water on the wall of the crucible
after exposing the cooled system to the air. The steel used for the pressure autoclave may
corrode and therefore the mechanical properties can degrade. The heater is taken out from the
experimental chamber and disassembled. To recover the grown crystals, the whole crucible
with the crystals and remained gallium is placed in hydrochloric acid and aqua regia to etch
away excess gallium. Although the crucible material, usually graphite, and the AlxGa1-xN
crystals do not dissolve in acids, selective etching of AlxGa1-xN crystals may occur if the
temperature of the acid is too high (~50 °C).
After and before every experiment the bore of both 30 mm and 40 mm chambers is
polished with sand paper and diamond paste with 10-25 μm grain size and subsequently
cleaned with a water-free and non corrosive solvent (usually benzene). For longer breaks
between experiments, the chamber bores are protected with a thin grease layer. All alumina
pieces used in the furnace should be also heated in order to remove the carbon (comes from
graphite crucible) and water. During some experiments the W/Re wires recrystallize and the
furnace do not work properly. Unfortunately, the re-isolation of the furnace is not possible,
because the W/Re heater wires as well as BN isolation break when the furnace is opened.
3.2 Cubic anvil cell
The maximum pressure obtained in our gas pressure autoclave is about 15 kbar. As it was
shown in Chapter 2, the nitrides can be thermodynamically stabilized at high temperatures
under high pressure. The higher the growth temperature, the higher is the solubility of
nitrogen in the melt and the quicker the mass transport occurs during the growth. For
example, for GaN temperatures up to about 1670 °C can be applied at 20 kbar nitrogen
pressure. In order to increase the growth temperature, one should apply pressure higher than
30 kbar. This can be done using the anvil high pressure technique and a solid pressure
transmission medium. There are different kinds of anvils such as hemispherical, cubic and
octahedral with different sample size and shape. The anvils can be also used together with an
x-ray beam facility for the in-situ sample characterisation. In the III-nitrides research a few
studies using anvil technology are reported. Karpinski and Porowski [5] used a hemispherical
anvil apparatus for the thermodynamic equilibrium studies of GaN in the pressure range of 15
to 70 kbar and temperatures from 1500 to 2300 °C. To study the congruent melting conditions
39

of GaN, W. Utsumi et al. used a multi-anvil apparatus for synchrotron radiation [6]. By
slowly cooling the melt under high pressures they could grow GaN crystals up to 100 μm in
size. GaN crystal growth up to 0.5 mm in size using hemispherical anvil was also reported by
Kelly et al. [7]. They used a cell containing pressed GaN powder used as the source of
nitrogen upon heating and a metal alloy consisting of Ga (70 at%) and Mn (30 at%) as
reactants. Interestingly, Mn was added in order to increase the solubility of nitrogen.
Hasegawa et al. successed in the growth of nitrides in a laser heated diamond anvil cell [8].
In this section we focus on use of an anvil apparatus for the AlxGa1-xN growth. Using
cubic anvil cell in our lab [4], Peter Geiser could synthesize AlxGa1-xN bulk single crystals up
to 30% Al from solution in Ga/Al melt. The apparatus is based on a commercially available
pressure cell with tungsten carbide anvils as shown in Figure 5. The pressure is built up with
a 1500 ton oil hydraulic press working perpendicular to the anvil cell, on the two base plates
(marked with grey colour in Figure 5). The force on the plates is transmitted to a set of eight
Fig. 5. Cubic anvil apparatus and schematic setup view [4].
Power supply and water cooling
Volume
Load
Power supply and water cooling
Volume
Load
Sample
ring
Sample
ring
Hydraulic
Load frame
Tungsten carbide piston
Pressure transmission
Hydraulic
Load frame
Tungsten carbide anvils
Pressure transmission
40

large steel dies, which in turn compress the smaller six tungsten carbide anvils, finally
applying an amplified pressure on a cubic experimental cell (Figure 6). This cell is located at
the center of the assembly. The pressure is determined from the measured force of hydraulic
press. By applying ~300 bar oil pressure in the hydraulic press, a pressure of about 30 kbar is
generated in the core of cell. The edge length of tungsten carbide anvils is 22 mm. Rubber O-
rings serve as spacers between the tungsten carbide anvils. A pyrophylite, alumo-silicate,
cube serves as a solid pressure transmitting medium placed in the core of the cell (Figure 6).
The volume of the cube is about one cubic inch. The assembly has one stage graphite heater
placed in the bore of pyrophilite cube. The heater is filled with the BN crucible in the center,
and with pyrophilite tablets on the top and bottom. Depending on the dimensions of the cube
bore and the graphite heater, the inner diameter of the BN crucible can be chosen between 6.8
and 8.1 mm. The length of the free space in the BN crucible is about 8 mm. This system is
capable of applying up to 35 kbar pressure and 2100 °C.
In Figure 7 two types of graphite heaters are shown. Besides the standard graphite heater,
a heater with two steel rings on both ends can be used. The latter assembly allows us to reach
the desired temperature with electric lower powder applied. For high temperatures, the
external load ring and both base plates are water cooled to prevent the anvil from being
overheated. If the temperature on the tungsten anvils will be higher than 600 °C the anvils
will drastically loose their strength and break. For the pressure calibration, the electrical
resistance changes during the phase transitions of Bi, Ba and Tl was used. For heating, a
current passes through graphite heater, supplied from outside through the steel parts und two
tungsten carbide anvils. The steel parts are isolated with a thin polymer foil. The temperature
Fig. 6. Top view on cubic experimental cell:
Pyrophilite cube is placed in the core of cell
between tungsten carbide anvils.
41
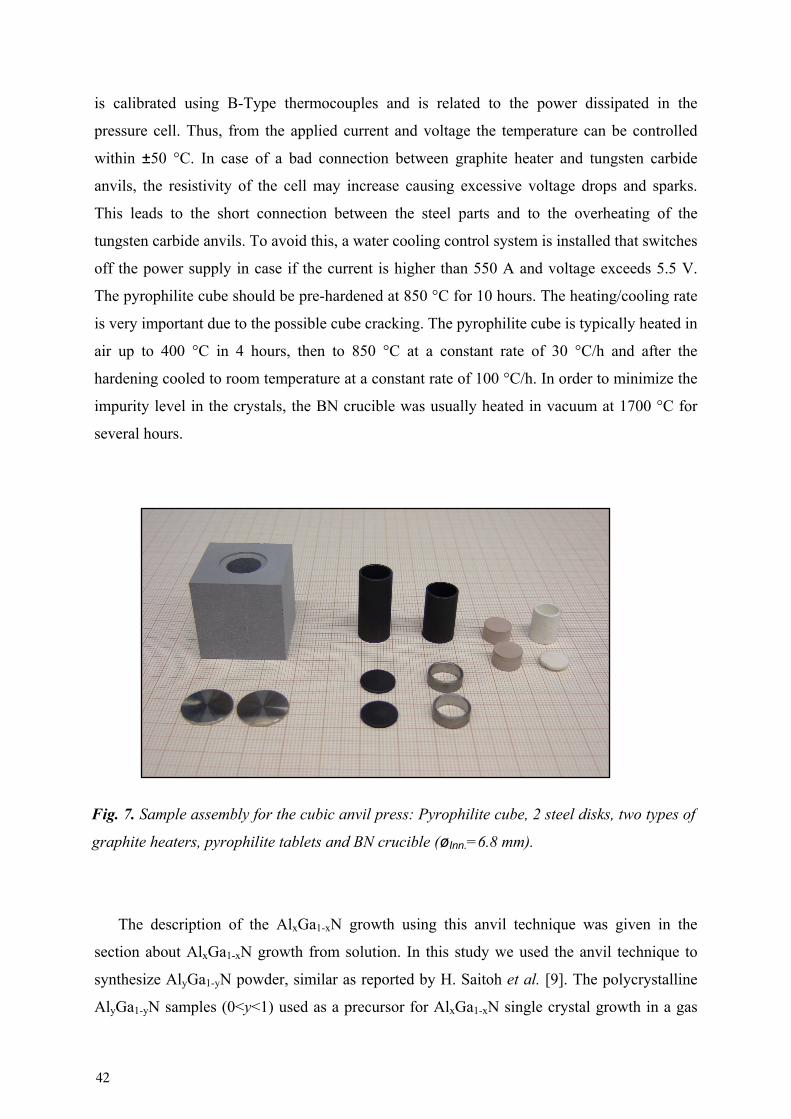
is calibrated using B-Type thermocouples and is related to the power dissipated in the
pressure cell. Thus, from the applied current and voltage the temperature can be controlled
within ±50 °C. In case of a bad connection between graphite heater and tungsten carbide
anvils, the resistivity of the cell may increase causing excessive voltage drops and sparks.
This leads to the short connection between the steel parts and to the overheating of the
tungsten carbide anvils. To avoid this, a water cooling control system is installed that switches
off the power supply in case if the current is higher than 550 A and voltage exceeds 5.5 V.
The pyrophilite cube should be pre-hardened at 850 °C for 10 hours. The heating/cooling rate
is very important due to the possible cube cracking. The pyrophilite cube is typically heated in
air up to 400 °C in 4 hours, then to 850 °C at a constant rate of 30 °C/h and after the
hardening cooled to room temperature at a constant rate of 100 °C/h. In order to minimize the
impurity level in the crystals, the BN crucible was usually heated in vacuum at 1700 °C for
several hours.
The description of the AlxGa1-xN growth using this anvil technique was given in the
section about AlxGa1-xN growth from solution. In this study we used the anvil technique to
synthesize AlyGa1-yN powder, similar as reported by H. Saitoh et al. [9]. The polycrystalline
AlyGa1-yN samples (0<y<1) used as a precursor for AlxGa1-xN single crystal growth in a gas
Fig. 7. Sample assembly for the cubic anvil press: Pyrophilite cube, 2 steel disks, two types of
graphite heaters, pyrophilite tablets and BN crucible (øInn.=6.8 mm).
42

pressure autoclave have been synthesized in the cubic anvil press under 30 kbar pressure and
1800 °C. The starting materials were highly pure GaN and AlN (Alfa Ceasar) powders
blended with a mortar for suitable compositions (y = 0.2, 0.4, 0.5, 0.9). The samples were
filled in boron nitride crucible placed in graphite cylinder that served as a furnace. In the
experiments, the pressure was initially increased to 30 kbar at room temperature and then the
crucible was heated up to 1800 °C within 1 hour, annealed for 3 hours and finally cooled to
room temperature within 1 hour. After the temperature is decreased, the pressure is
subsequently released. The pyrophilite cube must be broken apart to get access to the BN
crucible and the sintered sample. Sintered samples have a diameter of about 6 mm and are 4
mm height. X-ray measurements show pure AlyGa1-yN phase.
43
References:
[1] J. Karpinski and S. Majorowski, High pressure in research and industry, Proc. of 8th
Airapt Conf., Uppsala (1981).
[2] J. Karpinski, S. Porowski, S. Miotkowska, J. Cryst. Growth 56 (1982) 77-82.
[3] L. Deffet, L. Lialine, High pressure techniques in general, in A. Van. Itterbeek
(editor), Physics of High Pressures and Condensed Phase, North-Holland Publ. Co,
Amsterdam (1965) 1-36.
[4] P. Geiser, Dissertation 16126, ETH Zurich (2005).
[5] J. Karpinski, S. Porowski, J. Cryst. Growth 66 (1986) 1-10.
[6] W. Utsumi, H. Saitoh, H. Kaneko, T. Watanuki, K. Aoki and O. Shimomura, Nature
Materials 2 (2003) 735-737.
[7] F. Kelly, D. R. Gilbert, R. Chodecka, R. K. Singh and S. Pearton, Solid-State
Electronics 47 (2003) 1027-1030.
[8] M. Hasegawa, T. Yagi, J. Cryst. Growth 217 (2000) 349-364.
[9] H. Saitoh, W. Utsumi, H. Kaneko, K. Aoki, Jp. J. Appl. Phys. 43 (2004) L981-983.
44
Chapter 4
Bulk single-crystal growth of ternary AlxGa1-xN from
solution in gallium under high pressure
4.1 Summary
In this chapter, we report the first growth of (Al,Ga)N crystals with 0.22 ≤ x ≤ 0.86 from
solution in Ga melt under high nitrogen pressure (up to 10 kbar) and at high temperature (up
to 1800 °C) in gas autoclave. A crystal growth rate of up to 0.1 mm/day was achieved, a rate
comparable to the growth of GaN from solution, or by the ammonothermal method. For the
Al0.86Ga0.14N crystals, the bandgap was determined by the femtosecond two-photon
absorption autocorrelation method and is 5.81±0.01 eV. This chapter is published in Journal
of Crystal Growth in Priority Communications section, 2009 (see page 12). The preliminary
studies of the p-T equilibrium phase diagram for the growth of AlxGa1-xN crystals published
in this paper were omitted, since the p-T diagram was lately explored and published in
following paper addressed in the Chapter 5.
4.2 Introduction
Due to their particular optical and electrical properties, III-V nitrides, especially GaN, and
their ternary alloys are a class of semiconductors of great technical importance. Many GaN-
based devices include heterostructures involving alloys of GaN, AlN and InN, with a direct
bandgap Eg varying from 0.7 eV for InN to 6.2 eV for AlN [1,2]. Ternary layers such as
AlxGa1-xN are mainly used as electron barriers in power-switching HEMTs, as an active zone
in light-emitting structures, or as cladding layers in lasers and as quantum wells in UV LEDs
[3-6]. The high optical efficiency of GaN-based devices and, therefore, their potential for
45
applications are adversely affected by the lattice mismatch to the substrate, by structural
defects such as dislocations, and by inhomogeneities in the Al concentration.
(Al,In,Ga)N alloys have been produced as thin films by MBE, MOVPE, and HVPE
techniques, mainly on sapphire or silicon carbide substrates [7-9]. Homoepitaxy is strongly
preferred and substrates for thin-film deposition would ideally be AlxGa1-xN single crystals of
high crystalline quality. However, growing AlxGa1-xN crystals poses significant challenges;
two of which have been successfully addressed in this study: full control of the growth
conditions and proper choice of the solvent. Previously, we have reported the growth of
AlxGa1-xN crystals with up to 30% Al content, using a high-pressure anvil growth technique
[10]. In the present study, we have employed a different technique: a high-pressure N2 gas
autoclave for crystal growth from solution. We can precisely control the nitrogen pressure,
temperature, temperature gradient, and therefore we can explore the crystal growth conditions
in more detail than in the anvil pressure cell. In particular, the gas autoclave provides a
thermodynamic equilibrium between the nitrogen gas and AlxGa1-xN that cannot be
established in the anvil pressure cell due to the lack of a gas atmosphere.
The proper choice of the solvent is obviously important. We have used Ga metal as the
solvent and have introduced the appropriate amount of Al in the form of previously
synthesized polycrystalline AlyGa1-yN. The Al content y has been varied over a wide range. If,
instead, Al metal is dissolved in the Ga melt, only a marginal amount of the AlxGa1-xN phase
forms. In addition, alumina crystals can grow or polycrystalline AlN is formed as a result of
combustion.
From the solution in Ga melt under high nitrogen pressure, we have been able to grow
AlxGa1-xN bulk crystals with an Al content higher than 22 at%.
4.3 Experimental details
The polycrystalline AlyGa1-yN precursor material was synthesized by a solid-phase
reaction [11] in a cubic anvil at 30 kbar and 1800 °C. The highly pure GaN and AlN (Alfa
Ceasar) powders were thoroughly mixed in a ceramic mortar in an Ar atmosphere to yield
various compositions ranging from y = 0.2 to y = 0.9. This starting mixture was placed into a
BN crucible which was surrounded by a graphite heater sleeve; the assembly was then placed
into the pyrophilite center part of the cubic-anvil high-pressure cell. After the high pressure
46
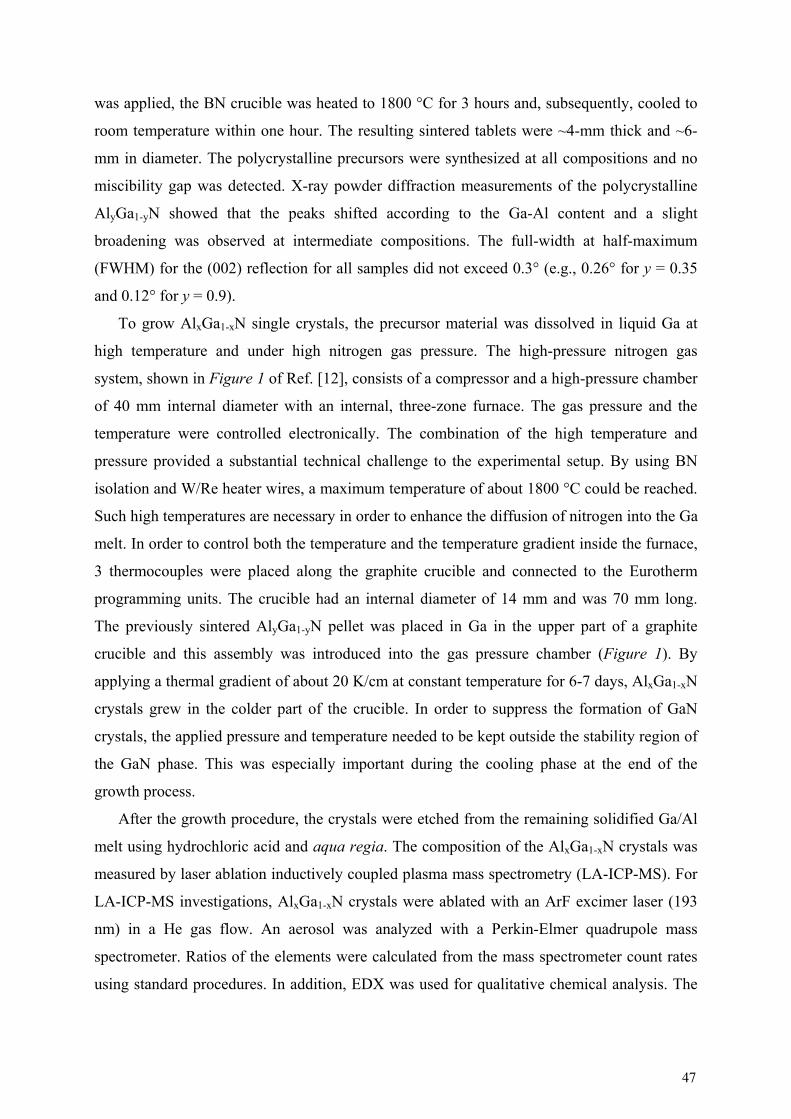
was applied, the BN crucible was heated to 1800 °C for 3 hours and, subsequently, cooled to
room temperature within one hour. The resulting sintered tablets were ~4-mm thick and ~6-
mm in diameter. The polycrystalline precursors were synthesized at all compositions and no
miscibility gap was detected. X-ray powder diffraction measurements of the polycrystalline
AlyGa1-yN showed that the peaks shifted according to the Ga-Al content and a slight
broadening was observed at intermediate compositions. The full-width at half-maximum
(FWHM) for the (002) reflection for all samples did not exceed 0.3° (e.g., 0.26° for y = 0.35
and 0.12° for y = 0.9).
To grow AlxGa1-xN single crystals, the precursor material was dissolved in liquid Ga at
high temperature and under high nitrogen gas pressure. The high-pressure nitrogen gas
system, shown in Figure 1 of Ref. [12], consists of a compressor and a high-pressure chamber
of 40 mm internal diameter with an internal, three-zone furnace. The gas pressure and the
temperature were controlled electronically. The combination of the high temperature and
pressure provided a substantial technical challenge to the experimental setup. By using BN
isolation and W/Re heater wires, a maximum temperature of about 1800 °C could be reached.
Such high temperatures are necessary in order to enhance the diffusion of nitrogen into the Ga
melt. In order to control both the temperature and the temperature gradient inside the furnace,
3 thermocouples were placed along the graphite crucible and connected to the Eurotherm
programming units. The crucible had an internal diameter of 14 mm and was 70 mm long.
The previously sintered AlyGa1-yN pellet was placed in Ga in the upper part of a graphite
crucible and this assembly was introduced into the gas pressure chamber (Figure 1). By
applying a thermal gradient of about 20 K/cm at constant temperature for 6-7 days, AlxGa1-xN
crystals grew in the colder part of the crucible. In order to suppress the formation of GaN
crystals, the applied pressure and temperature needed to be kept outside the stability region of
the GaN phase. This was especially important during the cooling phase at the end of the
growth process.
After the growth procedure, the crystals were etched from the remaining solidified Ga/Al
melt using hydrochloric acid and aqua regia. The composition of the AlxGa1-xN crystals was
measured by laser ablation inductively coupled plasma mass spectrometry (LA-ICP-MS). For
LA-ICP-MS investigations, AlxGa1-xN crystals were ablated with an ArF excimer laser (193
nm) in a He gas flow. An aerosol was analyzed with a Perkin-Elmer quadrupole mass
spectrometer. Ratios of the elements were calculated from the mass spectrometer count rates
using standard procedures. In addition, EDX was used for qualitative chemical analysis. The
47
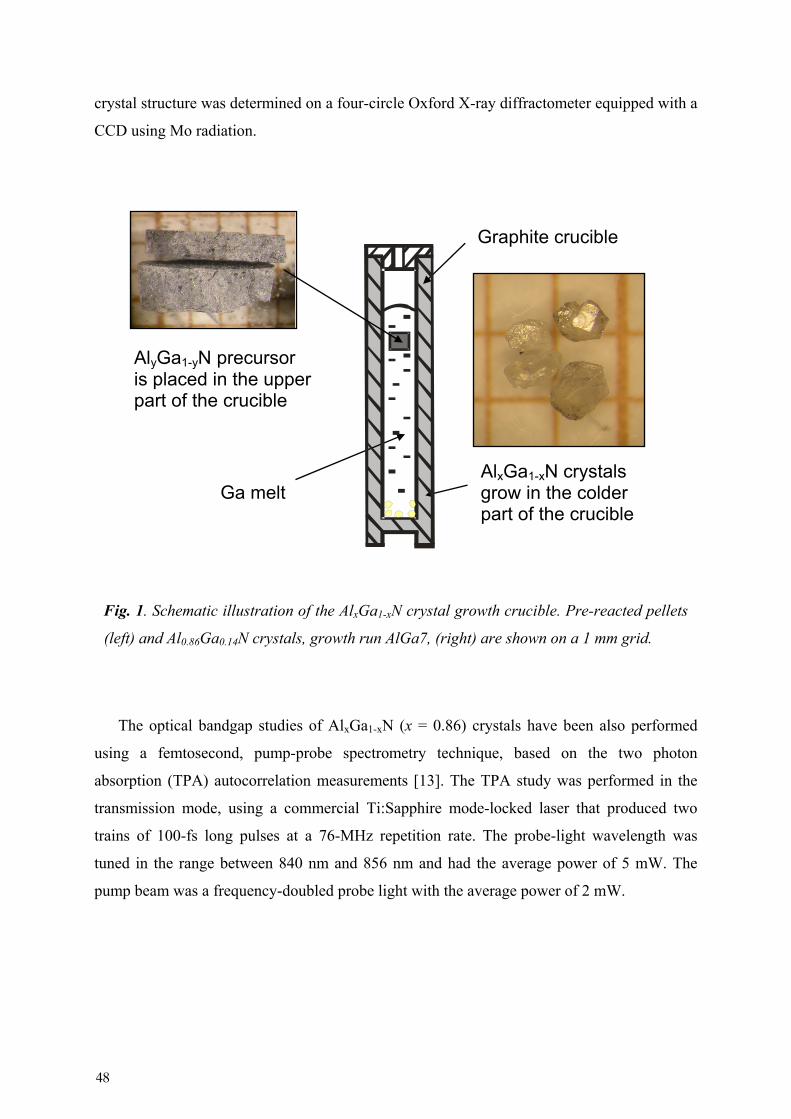
crystal structure was determined on a four-circle Oxford X-ray diffractometer equipped with a
CCD using Mo radiation.
The optical bandgap studies of AlxGa1-xN (x = 0.86) crystals have been also performed
using a femtosecond, pump-probe spectrometry technique, based on the two photon
absorption (TPA) autocorrelation measurements [13]. The TPA study was performed in the
transmission mode, using a commercial Ti:Sapphire mode-locked laser that produced two
trains of 100-fs long pulses at a 76-MHz repetition rate. The probe-light wavelength was
tuned in the range between 840 nm and 856 nm and had the average power of 5 mW. The
pump beam was a frequency-doubled probe light with the average power of 2 mW.
AlyGa1-yN precursor is placed in the upper part of the crucible
Graphite crucible
Ga melt AlxGa1-xN crystals grow in the colder part of the crucible
Fig. 1. Schematic illustration of the AlxGa1-xN crystal growth crucible. Pre-reacted pellets
(left) and Al0.86Ga0.14N crystals, growth run AlGa7, (right) are shown on a 1 mm grid.
48
4.4 Results and discussion
Single crystals of AlxGa1-xN with x = 0.22, 0.37, 0.5, 0.62, 0.74, 0.78 and 0.86 were
successfully grown using the above procedure. For some of the compositions, more then one
experiment was performed. The crystals were up to ~0.8x0.8x0.8 mm3 in size and were
colorless, of a hexagonal habit, and of wurtzite structure. The morphology of our crystals
depends on the process pressure, temperature range, temperature gradient, and nitrogen
supersaturation. Crystals grown at lower temperature and otherwise similar conditions tend to
be smaller. This trend is likely to be associated with the solubility of nitrogen in the Ga melt
at different temperatures: the higher the temperature, the higher the solubility of nitrogen. At
the growth temperature of 1500 °C, the AlxGa1-xN crystals grew slowly and were very small
(up to ~0.1x0.1x0.1mm3). Larger crystals were grown at 1800 °C.
In order to study the crystal growth and the pressure-temperature (p-T) equilibrium of the
(Al,Ga)N system, several experiments were performed at 5 to 10kbar nitrogen pressure and at
a temperature of 1490-1780 °C. The p-T equilibrium diagram is presented in Chapter 5. With
increasing Al content, growth of AlxGa1-xN crystals takes place at lower pressures than that
required for GaN [14] at the same temperature. By choosing the appropriate pressure and
temperature conditions, AlxGa1-xN crystals with a particular Al composition could be grown.
For example, to grow crystals with x = 0.62, the required conditions are ~8.4 kbar and 1540
°C. By decreasing the pressure to approx. 2.54 kbar and maintaining almost the same
temperature of 1550 °C, crystals with x = 0.85 could be synthesized.
The p-T equilibrium diagram was further supported by monitoring the chemical
composition of the polycrystalline AlyGa1-yN pellets before and after the experiments: the
pellets did not decompose during the experiments, but their Al content changed depending on
the growth condition. We observed that the pellets and the crystals ended up with a similar
composition. In a particular growth run, the starting material had y = 0.6 and after keeping the
pellet for 168 hours at 1550 °C and 2.54 kbar, its composition changed to y = 0.85, as
determined by X-ray diffraction measurements.
In Figure 2, the relationship between the lattice parameter c and the chemical composition
of AlxGa1-xN crystals is summarized. Two methods have been employed to determine the
composition: laser ablation mass spectrometry and a structure refinement based on the X-ray
diffraction data. In the latter method, we assumed that Al atoms replaced Ga and the overall
occupation of the Ga/Al site was 100 %.
49
Then, the ratio Al/Ga was refined. No twinning or intergrowth could be detected. The
lattice parameter linearly depends on x, according to Vegard’s law. The c-axis lattice constant
of AlxGa1-xN, for, e.g., x = 0.86 is 5.015(1) Å and is smaller than that of pure GaN (5.185 Å)
[15]. As the laser ablation drilled a small hole into the crystals, the depth profile of the
composition was monitored. Accordingly, the Ga/Al ratio was found to be constant (±0.5%)
inside the crystals. Overall, there was satisfactory agreement between the compositions
determined by two methods. On the surface of our crystals an about 1-μm-thick,
inhomogenously substituted AlyGa1-yN capping layer with varying Al content was formed
during the crystal cooling process, depending on the cooling profile. Finally, the EDX
measurements did not detect any oxygen or carbon impurities.
The results of TPA optical bandgap studies are given in Figure 3, where we show the
time-resolved normalized change in the transmissivity ΔT/T waveforms of the probe beam,
measured within the above-mentioned tuning range. While a strong autocorrelation-type
signal is observed (Gaussian shape with FWHM of 290 fs) for an 840 nm probe wavelength,
Fig. 2. The lattice parameter c versus the Al content of the bulk AlxGa1-xN single crystals.
The composition was determined by a full structure refinement of X-ray diffraction and by
Laser ablation mass spectroscopy. The solid line represents Vegard’s law.
50

the signal completely disappears at 856 nm. The nonlinear autocorrelation response is due to
the nonlinearity associated with the bandgap and occurs when the total energy of incident
photons [one pump photon and two probe photons (TPA effect)] is greater that the bandgap.
Thus, by plotting the autocorrelation signal amplitude, which is proportional to the TPA
absorption coefficient [16] (see inset in Figure 3), the optical bandgap of Al0.86Ga0.14N was
determined to be 5.81±0.01 eV.
The compositional dependence of the bandgap of AlxGa1-xN is a subject of many studies
with conflicting results. This dependence is usually described by following empirical
expression:
)1()1()(1 xxbExExxE GaNg
AlNg
NGaAlg
xx −⋅⋅−⋅−+⋅=−
where Eg is the bandgap of binary nitrides, 3.4 for GaN and 6.2 for AlN [2], x is the AlN
molar fraction, and b is the bowing parameter. The bandgap values for thin films in relation to
the Al composition reported by various researches were extracted from photoluminescence or
low temperature optical reflectance measurements as well as transmission and photothermal
deflection spectroscopy [17,18,19]. The bowing parameters disperse from -0.8 eV (upward
bowing) to +2.6 eV (downward bowing) T = 300 K as summarized by Lee et al. [20] and later
Fig. 3. Two-photon absorption autocorrelation, ∆T/T, signals versus the time delay for the
Al0.86Ga0.14N crystal, measured for different total energy of the incident photons. The
increased sensitivity factor is also labeled. The inset shows the TPA signal amplitude
dependence on the total photons energy with the optical bandgap absorption edge indicated.
51
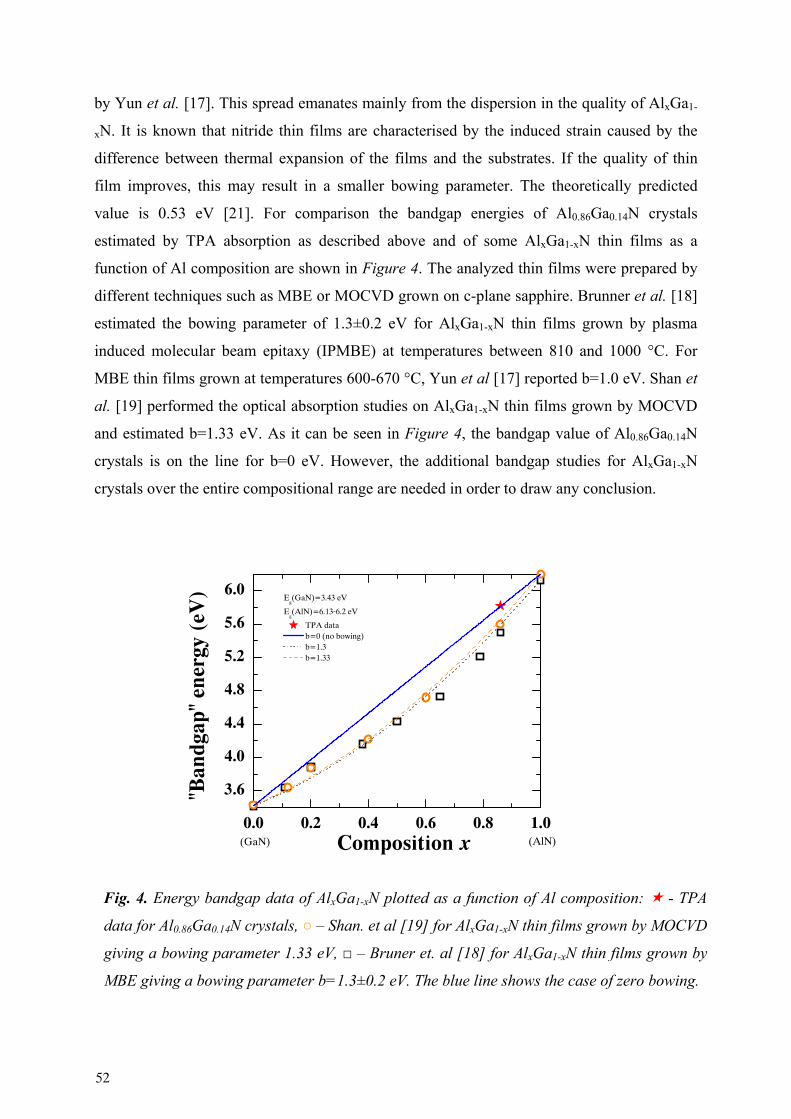
by Yun et al. [17]. This spread emanates mainly from the dispersion in the quality of AlxGa1-
xN. It is known that nitride thin films are characterised by the induced strain caused by the
difference between thermal expansion of the films and the substrates. If the quality of thin
film improves, this may result in a smaller bowing parameter. The theoretically predicted
value is 0.53 eV [21]. For comparison the bandgap energies of Al0.86Ga0.14N crystals
estimated by TPA absorption as described above and of some AlxGa1-xN thin films as a
function of Al composition are shown in Figure 4. The analyzed thin films were prepared by
different techniques such as MBE or MOCVD grown on c-plane sapphire. Brunner et al. [18]
estimated the bowing parameter of 1.3±0.2 eV for AlxGa1-xN thin films grown by plasma
induced molecular beam epitaxy (IPMBE) at temperatures between 810 and 1000 °C. For
MBE thin films grown at temperatures 600-670 °C, Yun et al [17] reported b=1.0 eV. Shan et
al. [19] performed the optical absorption studies on AlxGa1-xN thin films grown by MOCVD
and estimated b=1.33 eV. As it can be seen in Figure 4, the bandgap value of Al0.86Ga0.14N
crystals is on the line for b=0 eV. However, the additional bandgap studies for AlxGa1-xN
crystals over the entire compositional range are needed in order to draw any conclusion.
0.0 0.2 0.4 0.6 0.8 1.0
3.6
4.0
4.4
4.8
5.2
5.6
6.0
(AlN)
"Ban
dgap
" ene
rgy
(eV
)
Composition x
Eg(GaN)=3.43 eV
Eg(AlN)=6.13-6.2 eV
TPA data b=0 (no bowing) b=1.3 b=1.33
(GaN)
Fig. 4. Energy bandgap data of AlxGa1-xN plotted as a function of Al composition: - TPA
data for Al0.86Ga0.14N crystals, – Shan. et al [19] for AlxGa1-xN thin films grown by MOCVD
giving a bowing parameter 1.33 eV, – Bruner et. al [18] for AlxGa1-xN thin films grown by
MBE giving a bowing parameter b=1.3±0.2 eV. The blue line shows the case of zero bowing.
52
References:
[1] B. Maleyre, S. Ruffenach, O. Briot, B. Gil, and A. Van der Lee, Superlattices and
Microstructures 36 (2004) 517-526.
[2] M. Levinshtein, S. Rumyantsev, and S. Shur, Properties of advanced semiconductors
materials: GaN, AlN, InN, BN, SiC, SiGe; John Wiley & Sons, Inc., New York, 2001.
[3] W. Saito, Y. Takada, M. Kuraguchi, K. Tsuda, I. Omura, T. Ogura, and H. Ohashi,
IEEE Transaction on electron devices 50 (2003) 2528-2531.
[4] S. Nakamura, M. Senoh, S. Nagahama, N. Iwasa, T. Yamada, T. Matsushita, H.
Kiyoku, Y. Sugimoto, T. Kozaki, H. Umemoto, M. Sano, and K. Chocho, Appl. Phys.
Lett. 72 (1998) 211-213.
[5] H. X. Jiang and J. Y. Lin, Opto-electronics Rev. 10 (2002) 271-286.
[6] T. J. Schmidt, X. H. Yang, W. Shan, J. J. Song, A. Salvador, W. Kim, O. Aktas, A.
Botchkarev, and H. Morkoc, App. Phys. Lett. 68 (1996) 1820-1822.
[7] E. Iliopoulos, K. F. Ludwig, T. D. Moustakas, and S. N. G. Chu, Appl. Phys. Lett. 78
(2001) 463-465.
[8] B. Baranov, L. Däweritz, V. R. Gutan, G. Jungk, H. Neumann, and H. Raidt, Phys.
Status Solidi (a) 49 (1978) 629-636.
[9] Y. Koide, N. Itoh, K. Itoh, N. Sawaki, and I. Akasaki, Jpn. J. Appl. Phys. 27 (1988)
1156-1161.
[10] P. Geiser, J. Jun, S. M. Kazakov, P. Wägli, L. Klemm, J. Karpinski, and B. Batlogg,
Appl. Phys. Lett. 86 (2005) 081908.
[11] H. Saitoh, W. Utsumi, H. Kaneko, and K. Aoki, Jpn. J. Appl. Phys. 43 (2004) L981-
983.
[12] J. Karpinski, G. I. Meijer, H. Schwer, R. Molinski, E. Kopnin, K. Conder, M. Angst, J.
Jun, S. Kazakov, A. Wisniewski, R. Puzniak, J Hofer, V. Alyoshin, and A. Sin,
Supercond. Sci. Technol. 12 (1999) R153-181.
[13] C. Rauscher and R. Laenen, J. Appl. Phys. 81 (6) (1997) 2818-2821.
[14] J. Karpinski, J. Jun, and S. Porowski, J. Cryst. Growth 66 (1984) 1-10.
[15] I. Vurgaftman, J. R. Meyer, and L. R. Ram-Mohan, J. Appl. Phys. 89 (11) (2001)
5815-5875.
[16] S. Krishnamurthy, K. Nashold, and A. Sher, Appl. Phys. Lett. 77 (2000) 355-357.
53
[17] F. Yun, M. A. Reshchikov, L. He, T. King, and H. Morkoc, J. App. Phys. 92 (2002)
4837-4839.
[18] D. Brunner, H. Angerer, E. Bustarret, F. Freudenberg, R. Höpler, R. Dimitrov, O.
Ambacher, and M. Stutzmann, J. Appl. Phys. 82 (1997) 5090-5096.
[19] W. Shan, J. W. Ager, K. M. Yu, E. E. Haler, M. C. Martin, W. R. McKinney, W.
Yang, and W. Walukiewicz, J. Appl. Phys. 85 (1999) 8505-8507.
[20] S. R. Lee, A. F. Wright, M. H. Crawford, G. A. Petersen, J. Han, and R. M. Biefeld,
Appl. Phys. Lett. 74 (1999) 3344-3346.
[21] A. F. Wright and J. S. Nelson, Appl. Phys. Lett. 66 (1995) 3051-3053.
54
Chapter 5
AlxGa1-xN bulk crystal growth: influence of the growth
parameters and structural properties
5.1 Summary
In this chapter, the growth conditions of the single AlxGa1-xN crystals with 0.22<x<0.91
from solution in Ga/Al melt have been determined. The influence of the temperature and the
choice of the Al source on the crystal growth are discussed. With increasing growth
temperature the solubility of AlxGa1-xN in the liquid gallium is enhanced and therefore the
growth of crystals up to 0.8x0.8x0.8 mm3 in size was achieved.
The p-T equilibrium phase diagram of (Al,Ga)N (s) + Al/Ga (l) + N2 (g) system for the
various Al content in solid phase is presented. According to the Gibbs rule, the coexistence of
these 3 phases (liquid Ga/Al solution, N2 gas and AlxGa1-xN solid) is only possible on the
equilibrium curve for particular Al composition x. The determined equilibrium lines for
particular Al compositions supported by experimental data are shown. By choosing the
appropriate pressure and temperature the AlxGa1-xN crystals with a particular Al composition
can be grown.
5.2 Introduction
In the last years, the interest in III-nitride materials have become of technical significance
due to their optical and electrical properties. In particular, the ternary AlxGa1-xN alloy is a key
material in ultra-violet light emitting diodes, power-switching HEMTS and lasers since the
band gap energy can be changed from 3.4 to 6.2 eV, depending on the atomic composition.
The application of III-nitride materials is still expanding, since the significant progress in
55

synthesis has been achieved in recent years. Many methods have been developed for
depositing AlxGa1-xN thin films such as MBE [1], HVPE [2] or well-established MOVPE
[3,4] and recent research is mostly concentrated on the optimization of the deposition
techniques and on the improvement of the structural properties. Although the growth of bulk
AlN by sublimation or GaN using ammonothermal method or low/high nitrogen pressure
solution methods have been studied by many groups [5-7], a relatively little is known about
the growth of bulk AlxGa1-xN [8].
Recently, we reported on the growth of bulk single AlxGa1-xN crystals with 0.5<x<0.9
from solution under high nitrogen pressure (up to 10 kbar) and at high temperature (up to
1800 °C) [9]. We have used Ga metal as the solvent and we have introduced the proper
amount of Al in the form of previously synthesized polycrystalline AlyGa1-yN. The high-
pressure nitrogen gas autoclave was used which allowed precise control of p-T growth
conditions. Several experiments in a wide range of temperatures and pressures were carried
out in order to determine optimal p-T conditions for the growth of AlxGa1-xN. We found that
by varying the p-T conditions AlxGa1-xN crystals with a desired Al composition can be grown.
In this paper we report the detailed aspects of the crystal growth, in particular the
influence of the amount of aluminum introduced into the melt (up to 1.2 at%) and of p-T
conditions on the composition of the grown crystals. We also focus on the crystallographic
characterization of the crystals that provide information about their structural quality.
On the basis of the growth experiments and of the calculation of the thermodynamic
functions we have derived the equilibrium lines for the AlxGa1-xN for the whole range of Al
content and have updated the experimentally estimated p-T equilibrium phase diagram of
(Al,Ga)N compound at high N2 pressure for various compositions reported previously [9].
5.3 Experimental details
Crystals were grown in a high-pressure nitrogen gas autoclave, in which the maximum
working pressure of 12 kbar and the temperature of about 1800 °C can be reached. The high
pressure system consists of a compressor, a pressure intensifier and a 40 mm internal diameter
high-pressure chamber with an internal, three zone furnace. The nitrogen gas was first
pumped up to 3 kbar to the experimental chamber by using a commercial membrane gas
compressor (Nova Swiss), and then compressed to the desired value with a pressure
56
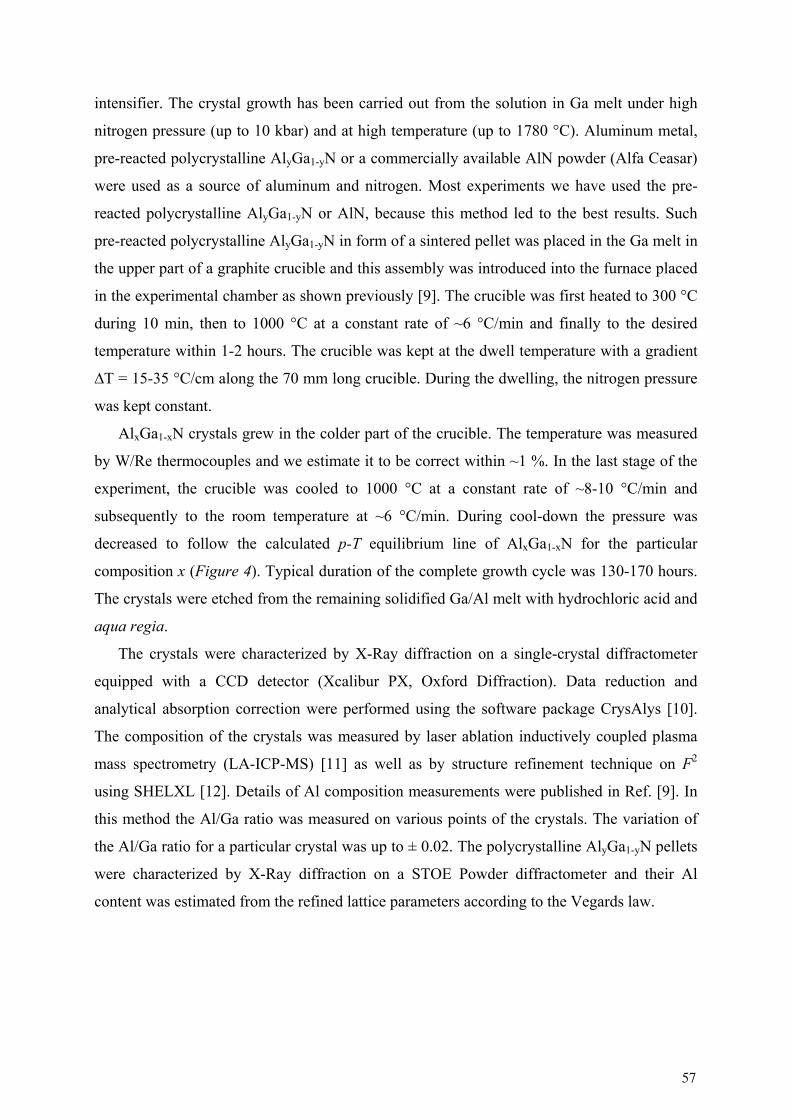
intensifier. The crystal growth has been carried out from the solution in Ga melt under high
nitrogen pressure (up to 10 kbar) and at high temperature (up to 1780 °C). Aluminum metal,
pre-reacted polycrystalline AlyGa1-yN or a commercially available AlN powder (Alfa Ceasar)
were used as a source of aluminum and nitrogen. Most experiments we have used the pre-
reacted polycrystalline AlyGa1-yN or AlN, because this method led to the best results. Such
pre-reacted polycrystalline AlyGa1-yN in form of a sintered pellet was placed in the Ga melt in
the upper part of a graphite crucible and this assembly was introduced into the furnace placed
in the experimental chamber as shown previously [9]. The crucible was first heated to 300 °C
during 10 min, then to 1000 °C at a constant rate of ~6 °C/min and finally to the desired
temperature within 1-2 hours. The crucible was kept at the dwell temperature with a gradient
∆T = 15-35 °C/cm along the 70 mm long crucible. During the dwelling, the nitrogen pressure
was kept constant.
AlxGa1-xN crystals grew in the colder part of the crucible. The temperature was measured
by W/Re thermocouples and we estimate it to be correct within ~1 %. In the last stage of the
experiment, the crucible was cooled to 1000 °C at a constant rate of ~8-10 °C/min and
subsequently to the room temperature at ~6 °C/min. During cool-down the pressure was
decreased to follow the calculated p-T equilibrium line of AlxGa1-xN for the particular
composition x (Figure 4). Typical duration of the complete growth cycle was 130-170 hours.
The crystals were etched from the remaining solidified Ga/Al melt with hydrochloric acid and
aqua regia.
The crystals were characterized by X-Ray diffraction on a single-crystal diffractometer
equipped with a CCD detector (Xcalibur PX, Oxford Diffraction). Data reduction and
analytical absorption correction were performed using the software package CrysAlys [10].
The composition of the crystals was measured by laser ablation inductively coupled plasma
mass spectrometry (LA-ICP-MS) [11] as well as by structure refinement technique on F2
using SHELXL [12]. Details of Al composition measurements were published in Ref. [9]. In
this method the Al/Ga ratio was measured on various points of the crystals. The variation of
the Al/Ga ratio for a particular crystal was up to ± 0.02. The polycrystalline AlyGa1-yN pellets
were characterized by X-Ray diffraction on a STOE Powder diffractometer and their Al
content was estimated from the refined lattice parameters according to the Vegards law.
57

5.4 Results and discussion
The single AlxGa1-xN crystals with 0.22<x<0.91 were synthesized from solution in Ga
melt. They grew spontaneously on the wall and bottom of the crucible. The crystals are
colorless, up to 0.8x0.8x0.8 mm3 in size and of a hexagonal habit (Figure 1). The shape of the
crystals varies from the platelets to the bulky form depending on the p-T conditions. For a
given pressure crystals with low Al content were grown at lower temperature and are of
smaller size and platelet-shaped. The experiments at small supercooling corresponding to
lower supersaturations resulted in slower growth in the c-direction in comparison to the
growth in perpendicular directions. High temperatures favored bulky shapes following by
relatively faster growth in the c- axis direction. The c-axis of the crystals is perpendicular to
Fig. 1. AlxGa1-xN crystals with Al composition x: a) 0.37 (AlGa29), b) 0.50 (AlGa25), c) 0.62
(AlGa18) and d) 0.86 (AlGa7). The scale of the square is to 1 mm.
a b
c d
58
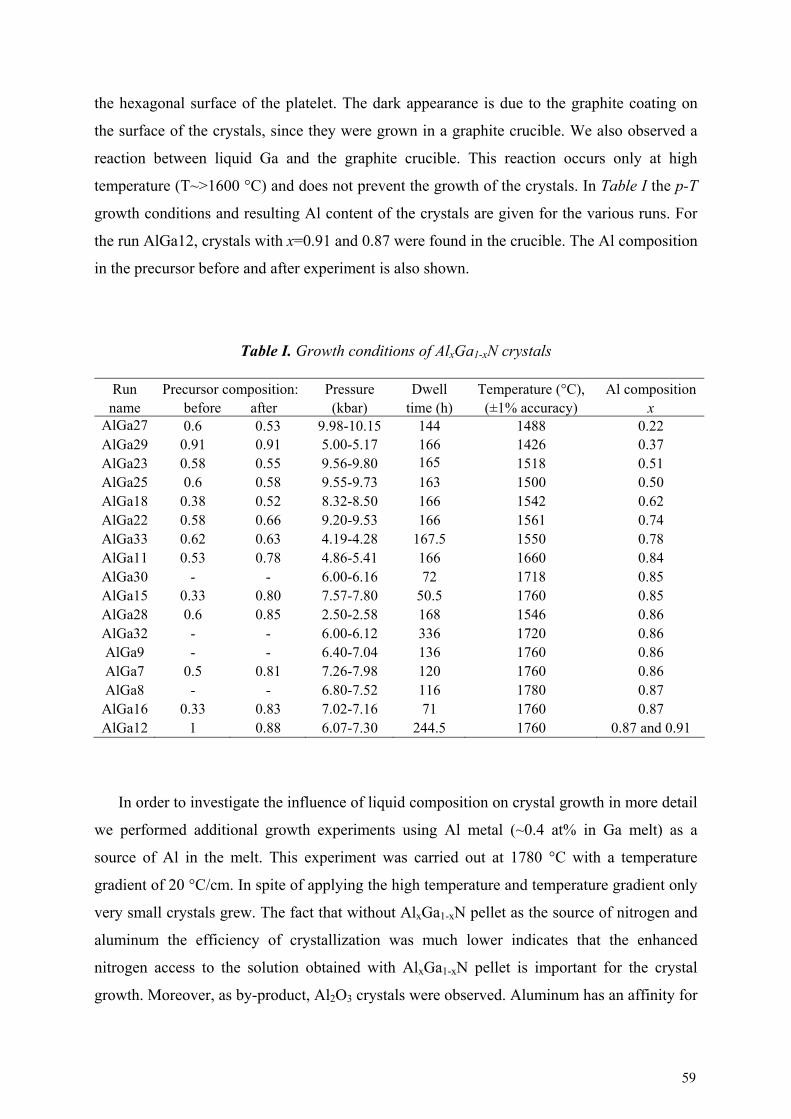
the hexagonal surface of the platelet. The dark appearance is due to the graphite coating on
the surface of the crystals, since they were grown in a graphite crucible. We also observed a
reaction between liquid Ga and the graphite crucible. This reaction occurs only at high
temperature (T~>1600 °C) and does not prevent the growth of the crystals. In Table I the p-T
growth conditions and resulting Al content of the crystals are given for the various runs. For
the run AlGa12, crystals with x=0.91 and 0.87 were found in the crucible. The Al composition
in the precursor before and after experiment is also shown.
Table I. Growth conditions of AlxGa1-xN crystals
Run name
Precursor composition: before after
Pressure (kbar)
Dwell time (h)
Temperature (°C), (±1% accuracy)
Al composition x
AlGa27 0.6 0.53 9.98-10.15 144 1488 0.22 AlGa29 0.91 0.91 5.00-5.17 166 1426 0.37 AlGa23 0.58 0.55 9.56-9.80 165 1518 0.51 AlGa25 0.6 0.58 9.55-9.73 163 1500 0.50 AlGa18 0.38 0.52 8.32-8.50 166 1542 0.62 AlGa22 0.58 0.66 9.20-9.53 166 1561 0.74 AlGa33 0.62 0.63 4.19-4.28 167.5 1550 0.78 AlGa11 0.53 0.78 4.86-5.41 166 1660 0.84 AlGa30 - - 6.00-6.16 72 1718 0.85 AlGa15 0.33 0.80 7.57-7.80 50.5 1760 0.85 AlGa28 0.6 0.85 2.50-2.58 168 1546 0.86 AlGa32 - - 6.00-6.12 336 1720 0.86 AlGa9 - - 6.40-7.04 136 1760 0.86 AlGa7 0.5 0.81 7.26-7.98 120 1760 0.86 AlGa8 - - 6.80-7.52 116 1780 0.87
AlGa16 0.33 0.83 7.02-7.16 71 1760 0.87 AlGa12 1 0.88 6.07-7.30 244.5 1760 0.87 and 0.91
In order to investigate the influence of liquid composition on crystal growth in more detail
we performed additional growth experiments using Al metal (~0.4 at% in Ga melt) as a
source of Al in the melt. This experiment was carried out at 1780 °C with a temperature
gradient of 20 °C/cm. In spite of applying the high temperature and temperature gradient only
very small crystals grew. The fact that without AlxGa1-xN pellet as the source of nitrogen and
aluminum the efficiency of crystallization was much lower indicates that the enhanced
nitrogen access to the solution obtained with AlxGa1-xN pellet is important for the crystal
growth. Moreover, as by-product, Al2O3 crystals were observed. Aluminum has an affinity for
59
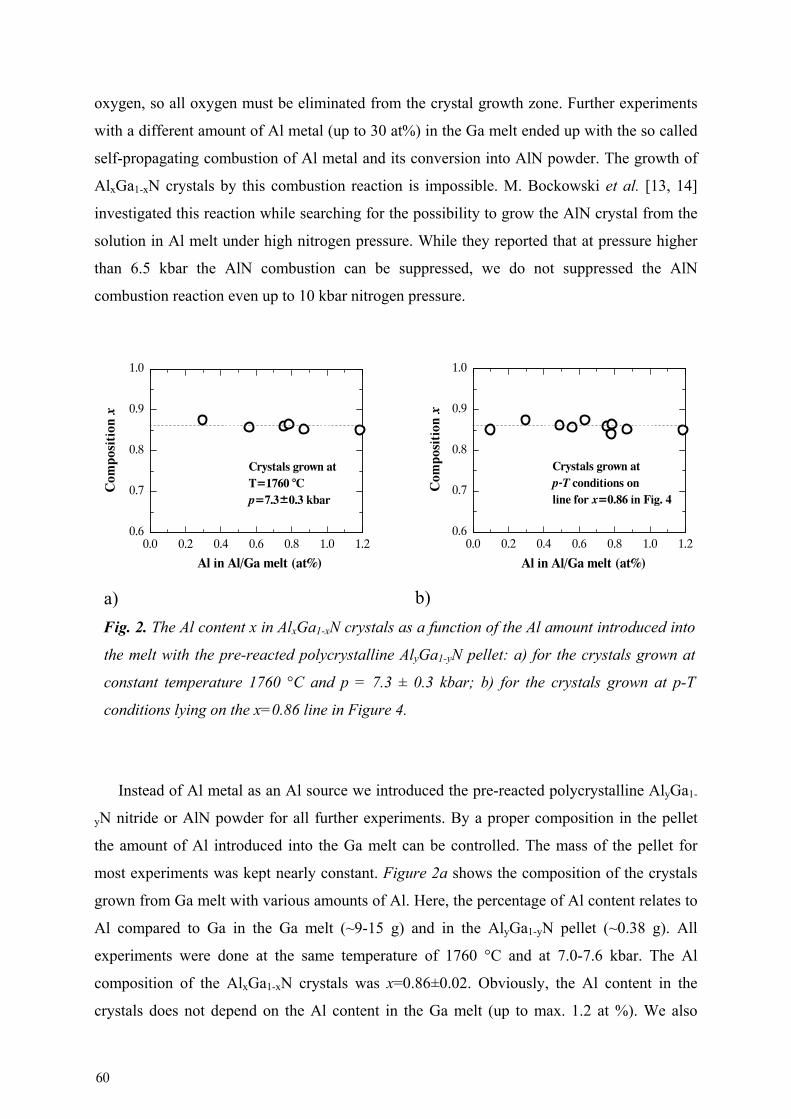
oxygen, so all oxygen must be eliminated from the crystal growth zone. Further experiments
with a different amount of Al metal (up to 30 at%) in the Ga melt ended up with the so called
self-propagating combustion of Al metal and its conversion into AlN powder. The growth of
AlxGa1-xN crystals by this combustion reaction is impossible. M. Bockowski et al. [13, 14]
investigated this reaction while searching for the possibility to grow the AlN crystal from the
solution in Al melt under high nitrogen pressure. While they reported that at pressure higher
than 6.5 kbar the AlN combustion can be suppressed, we do not suppressed the AlN
combustion reaction even up to 10 kbar nitrogen pressure.
Instead of Al metal as an Al source we introduced the pre-reacted polycrystalline AlyGa1-
yN nitride or AlN powder for all further experiments. By a proper composition in the pellet
the amount of Al introduced into the Ga melt can be controlled. The mass of the pellet for
most experiments was kept nearly constant. Figure 2a shows the composition of the crystals
grown from Ga melt with various amounts of Al. Here, the percentage of Al content relates to
Al compared to Ga in the Ga melt (~9-15 g) and in the AlyGa1-yN pellet (~0.38 g). All
experiments were done at the same temperature of 1760 °C and at 7.0-7.6 kbar. The Al
composition of the AlxGa1-xN crystals was x=0.86±0.02. Obviously, the Al content in the
crystals does not depend on the Al content in the Ga melt (up to max. 1.2 at %). We also
Fig. 2. The Al content x in AlxGa1-xN crystals as a function of the Al amount introduced into
the melt with the pre-reacted polycrystalline AlyGa1-yN pellet: a) for the crystals grown at
constant temperature 1760 °C and p = 7.3 ± 0.3 kbar; b) for the crystals grown at p-T
conditions lying on the x=0.86 line in Figure 4.
a) b)
0.0 0.2 0.4 0.6 0.8 1.0 1.20.6
0.7
0.8
0.9
1.0
Crystals grown atT=1760 °Cp=7.3±0.3 kbar
Com
posi
tion
x
Al in Al/Ga melt (at%)
0.0 0.2 0.4 0.6 0.8 1.0 1.20.6
0.7
0.8
0.9
1.0
Crystals grown atp-T conditions online for x=0.86 in Fig. 4
C
ompo
siti
on x
Al in Al/Ga melt (at%)
60

observed similar behavior (Figure 2b) for all growth experiments of AlxGa1-xN done at
various temperatures and pressures lying on the equilibrium line for x=0.86 in Figure 4. It
should be also mentioned that only the outermost part of the pellet was dissolved. Most
remarkably, the Al/Ga composition of the pellet changes during the experiment: its Al/Ga
ratio tends to equilibrate towards the value according to the p-T phase diagram which also
determines the crystals composition (Figure 3).
In Figure 3 we indicate the change of the Al content in the pellet, estimated from lattice
parameters, before and after the experiment, for runs at which the crystals with x=0.86±0.02
were grown (Table I: AlGa7, AlGa11, AlGa12 and AlGa28). The dwell time of the
experiments varied from 120 to 244.5 h. The composition y of the precursor pellets changes
Fig. 3. Growth of Al0.86Ga0.14N crystals at different temperatures and with different starting
compositions of the precursor. Initial and final composition of the polycrystalline AlyGa1-yN
precursor (open symbols connected by arrows) indicate a change of the Al content towards
equilibrium. The lines are equilibrium lines calculated for various x (see Chapter 6). The
pressure errors are smaller than the size of the symbols.
1800 1700 1600 1500
4.8 5.0 5.2 5.4 5.6 5.81
10
244.
5 h
120
h
166.
5 h
Al0.86
Ga0.14
N
crystals
1/T (x10-4
K-1)
GaN Equilibrium Line
Nit
roge
n pr
essu
re (
kbar
)
168
h
AlN
0.50.6
0.7
0.8
Temperature (°C)
x = 0.86
61

during experiments and shifts after sufficiently long time towards the composition of the
crystals. (shown in Figure 3 by arrows). This indicates equilibration of both precursor and
crystals at a given pressure and temperature. The positions of the open symbols correspond to
the equilibrium p-T conditions for Al content y in the pellet. The dynamics of the equilibration
process depends on the temperature and dwell time (see Table I). For temperatures below
~<1540 °C the equilibrating process is very slow and no significant changes of the Al content
in the pellet were observed.
In fact, the final quasi-equilibrium compositions of the pellets should be different (higher
Al content) than in the crystals according to the temperature distribution in the crucible
(temperature gradient). By the way, this phenomenon is shown in Figure 3, where for the
longest experiment (>244 h) the composition of the source material (initially AlN) becomes
more Al-rich than in the crystal.
More than two dozen experiments in a wide range of temperature and pressure were
carried out in order to determine the p-T conditions for the growth of AlxGa1-xN. The results
of the successful experiments are presented in Figure 4. The various symbols correspond to
the experimentally observed p-T conditions for which the crystals of a particular composition
were grown. Inconclusive experiments due to e.g. large p-T fluctuations or parasitic chemical
reactions with the crucible are not included. We found that AlxGa1-xN crystals with a
particular Al composition could be grown by choosing the appropriate pressure and
temperature conditions. For GaN crystal growth the nitrogen pressure during the experiment
should be kept higher than the equilibrium pressure over GaN. In case of AlxGa1-xN, the
crystals grown at a given pressure and temperature have composition x corresponding to
equilibrium lines shown in Figure 4.
On the basis of the growth experiments the updated p-T equilibrium phase diagram for the
(Al,Ga)N(s) + Al/Ga(l) + N2(g) system for various Al compositions is presented. In our
previous paper tentative lines for constant composition have been plotted, guided by the shape
of the well-established equilibrium line for GaN (Figure 2 in Ref. [9]). In this report, the lines
shown in Figure 4 are derived using thermodynamic calculations (see Chapter 6).
Considering the reaction of formation of AlxGa1-xN, one can show that the coexistence of
these 3 phases, solid AlxGa1-xN, liquid Ga/Al and gas N2 is only possible on the equilibrium
curves in p-T space for certain composition x. The solid lines in Figure 4 are calculated
equilibrium curves for various compositions x. Based on the experimentally observed p-T
growth conditions we could derive the pressure-composition dependence for various
temperatures.
62

Taking into account the non-ideal behavior of the nitrogen gas, the pressure was converted
into the fugacity of nitrogen. This is important because the fugacity of nitrogen is several
times higher than the pressure at our experimental conditions. It can be shown that the Gibbs
free energy of formation of AlxGa1-xN primarily depends on the Gibbs energy of nitrogen and
therefore on the fugacity of nitrogen. Knowing the fugacity-composition dependence for
various temperatures the Gibbs free energy as well as the heat and entropy of formation of
AlxGa1-xN for various compositions x were calculated. In this way we have calculated the p-T
equilibrium lines for the various Al compositions up to x=0.86. Details of thermodynamic
calculation will be shown in Chapter 6.
According to the p-T equilibrium phase diagram, AlxGa1-xN crystals grow at lower
pressures, at a given temperature, than GaN crystals [15]. The variation of the temperature
during the crystal growth at constant pressure will cause a change of the composition in the
1900 1800 1700 1600 1500 1400 1300 1200
5.0 5.5 6.0 6.51
10
Al content in AlxGa
1-xN
0.22 0.50 0.62 0.74 0.78 0.86
1/T (x10-4 K-1)
GaN Equilibrium Line
Nit
roge
n pr
essu
re (
kbar
)
0.5
0.6
0.7
0.8
Temperature (°C)
0.86
Fig. 4. Equilibrium pressure of N2 over AlxGa1-xN +Al/Ga(l) for various Al compositions.
Symbols correspond to experimental p-T growth condition for the particular compositions x.
Solid lines were calculated using thermodynamic data of nitrogen fugacity. The pressure
errors are smaller than the size of the symbols.
63
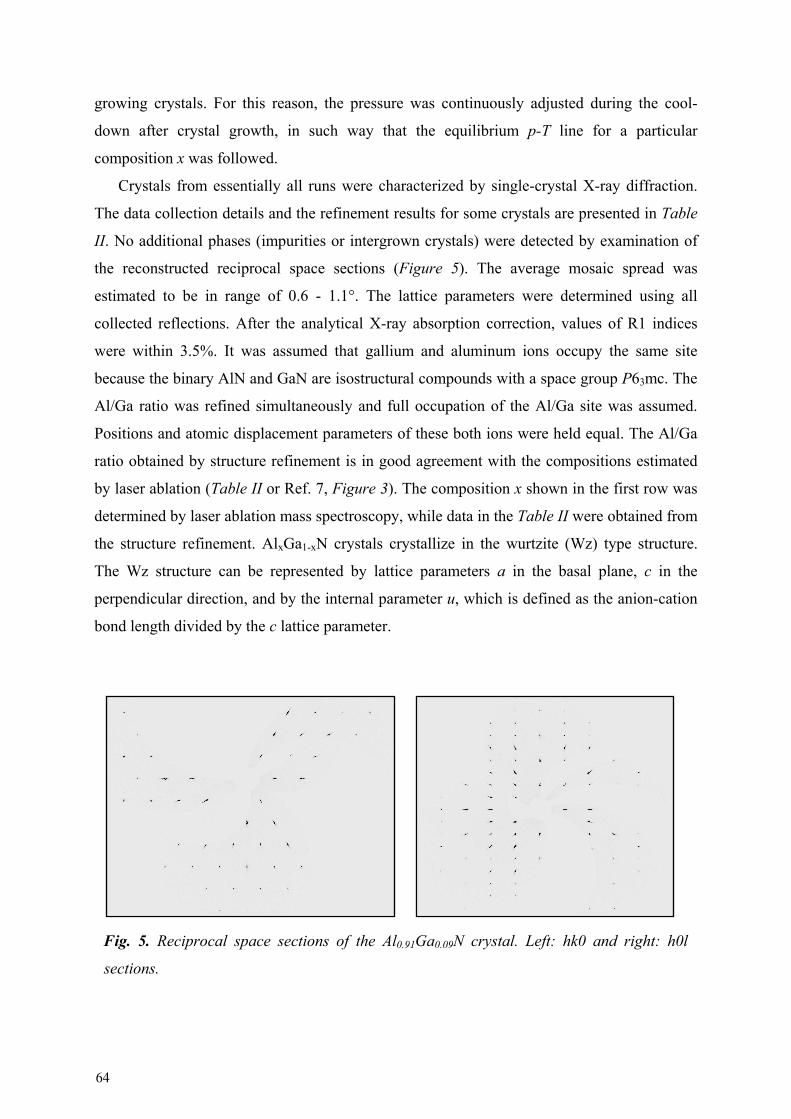
growing crystals. For this reason, the pressure was continuously adjusted during the cool-
down after crystal growth, in such way that the equilibrium p-T line for a particular
composition x was followed.
Crystals from essentially all runs were characterized by single-crystal X-ray diffraction.
The data collection details and the refinement results for some crystals are presented in Table
II. No additional phases (impurities or intergrown crystals) were detected by examination of
the reconstructed reciprocal space sections (Figure 5). The average mosaic spread was
estimated to be in range of 0.6 - 1.1°. The lattice parameters were determined using all
collected reflections. After the analytical X-ray absorption correction, values of R1 indices
were within 3.5%. It was assumed that gallium and aluminum ions occupy the same site
because the binary AlN and GaN are isostructural compounds with a space group P63mc. The
Al/Ga ratio was refined simultaneously and full occupation of the Al/Ga site was assumed.
Positions and atomic displacement parameters of these both ions were held equal. The Al/Ga
ratio obtained by structure refinement is in good agreement with the compositions estimated
by laser ablation (Table II or Ref. 7, Figure 3). The composition x shown in the first row was
determined by laser ablation mass spectroscopy, while data in the Table II were obtained from
the structure refinement. AlxGa1-xN crystals crystallize in the wurtzite (Wz) type structure.
The Wz structure can be represented by lattice parameters a in the basal plane, c in the
perpendicular direction, and by the internal parameter u, which is defined as the anion-cation
bond length divided by the c lattice parameter.
Fig. 5. Reciprocal space sections of the Al0.91Ga0.09N crystal. Left: hk0 and right: h0l
sections.
64

Tabl
e II
. Det
ails
of
the
crys
tal
stru
ctur
e re
fine
men
t of
the
Al x
Ga 1
-xN
cry
stal
s. T
he d
iffra
ctio
n st
udy
was
per
form
ed a
t 29
5 K
usi
ng M
o Kα
radi
atio
n
wit
h λ=
0.7
1073
Å.
The
lat
tice
is
hexa
gona
l, P
6 3m
c sp
ace
grou
p w
ith
Z=
2. T
he a
bsor
ptio
n co
rrec
tion
was
don
e an
alyt
ical
ly.
A f
ull-
mat
rix
leas
t-
squa
res
met
hod
was
em
ploy
ed to
opt
imiz
e F
2 .
N: x
= 1
/3; y
= 2
/3
z= u
= 0.
3816
(3)
0.38
09(4
) 0.
3807
(6)
0.38
01(6
) 0.
3790
(9)
0.37
87(1
0)
Al/
Ga
occu
pati
on
0.93
/0.0
7 0.
83/0
.17
0.72
/0.2
8 0.
68/0
.32
0.49
/0.5
1 0.
38/0
.62
Inte
rato
mic
dis
tanc
es (
Å)
A
l/G
a-N
1.
8901
(7)
1.89
31(9
) 1.
9001
(13)
1.
9110
(13)
1.
912(
6)
1.92
6(2)
1.90
2(2)
1.
906(
3)
1.92
1(4)
1.
915(
4)
1.92
0(2)
1.
927(
7)
Ang
les
(deg
)
N-A
l/G
a-N
11
0.67
(6)
110.
59(8
) 11
0.61
(11)
11
0.16
(11)
10
9.14
(18)
10
9.90
(19)
N
-Al/
Ga-
N
108.
24(6
) 10
8.33
(9)
108.
30(1
2)
108.
77(1
2)
109.
80(1
8)
109.
0(2)
A
l/G
a-N
-Al/
Ga
0.00
(8)
0.00
(12)
0.
00(1
6)
0.00
(16)
0.
0(2)
0.
0(3)
*-
Com
posi
tion
x w
as d
eter
min
ed b
y la
ser
abla
tion
mas
s sp
ectr
osco
py
Che
mic
al f
orm
ula*
A
l 0.9
1Ga 0
.09N
A
l 0.8
6Ga 0
.14N
A
l 0.7
4Ga 0
.26N
A
l 0.6
2Ga 0
.38N
A
l 0.5
2Ga 0
.48N
A
l 0.3
7Ga 0
.63N
Uni
t cel
l dim
ensi
ons
(Å)
a=3.
1093
(1),
c= 4
.987
8(2)
a=
3.11
26(2
), c
=5.
0033
(3)
a=3.
1245
(2),
c=
5.03
53(3
) a=
3.13
39(4
), c
=5.
0596
(5)
a=3.
1422
(4),
c=
5.08
42(5
) a=
3.15
39(2
), c
=5.
1112
(3)
Vol
ume
(Å3 )
41.7
60(3
) 41
.979
(5)
42.5
71(5
) 43
.035
(9)
43.4
73(9
) 44
.030
(5)
Cal
cula
ted
dens
ity (
g/cm
3 ) 3.
498
3.83
5 4.
131
4.21
9 4.
797
5.09
1 A
bsor
ptio
n co
effi
cien
t (m
m-1
) 3.
326
6.49
6 9.
549
10.6
30
16.0
92
19.0
72
The
ta r
ange
for
dat
a co
llec
tion
(d
eg)
7.58
to 4
5.46
7.
58 to
37.
47
7.55
to 4
0.44
7.
52 to
40.
21
7.50
to 3
9.98
7.
48 to
45.
72
Inde
x ra
nges
-5
=h<
=6,
-5<
=k<
=6,
-1
0<=
l<=
9 -5
=h<
=5,
-5<
=k<
=5,
-8
<=
l<=
6 -4
=h<
=4,
-5<
=k<
=4,
-2
<=
l<=
9 -3
=h<
=4,
-5<
=k<
=4,
-7
<=
l<=
9 -4
=h<
=5,
-3<
=k<
=5,
-9
<=
l<=
4 -5
=h<
=3,
-4<
=k<
=5,
-1
0<=
l<=
6 R
efle
ctio
ns c
olle
cted
/uni
que
432/
146
Rin
t.=0.
0219
60
0/92
Rin
t.=0.
0431
44
7/81
Rin
t.=0.
0441
28
0/10
3 R
int.=
0.02
62
168/
89 R
int.=
0.04
64
273/
116
Rin
t.=0.
0279
D
ata/
rest
rain
ts/p
aram
eter
s 14
6/1/
9 92
/1/9
81
/1/9
10
3/1/
9 89
/1/9
11
6/1/
9 G
oodn
ess-
of-f
it o
n F
2 1.
212
1.47
3 1.
116
1.20
6 1.
216
1.40
5 F
inal
R in
dice
s [I
>2s
igm
a(I)
]
R1
= 0
.027
7, w
R2
= 0
.070
4 R
1 =
0.0
199,
wR
2 =
0.0
514
R1
= 0
.023
4, w
R2
= 0
.057
7 R
1 =
0.0
247,
wR
2 =
0.0
600
R1
= 0
.028
7, w
R2
= 0
.072
0 R
1 =
0.0
355,
wR
2 =
0.0
976
R in
dice
s (a
ll da
ta)
R1
= 0
.029
2, w
R2
= 0
.070
9 R
1 =
0.0
207,
wR
2 =
0.0
518
R1
= 0
.026
7, w
R2
= 0
.059
4 R
1 =
0.0
276,
wR
2 =
0.0
612
R1
= 0
.031
2, w
R2
= 0
.072
4 R
1 =
0.0
380,
wR
2 =
0.0
980
Δρm
ax a
nd Δ
ρ min
(e/
A3 )
1.23
5 an
d -0
.769
0.
795
and
-0.4
55
1.50
8 an
d -0
.894
1.
090
and
-0.5
49
0.82
1 an
d -0
.919
2.
817
and
-3.3
58
Abs
olut
e st
ruct
ure
para
met
er
0.15
(14)
0.
19(1
1)
0.12
(12)
0.
21(1
2)
0.31
(14)
0.
08(1
4)
Ext
inct
ion
coef
fici
ent
2.3(
4)
4.5(
7)
2.6(
5)
0.73
(15)
-
0.28
(13)
F
ract
iona
l ato
mic
coo
rdin
ates
*
Al/
Ga:
x =
1/3
; y =
2/3
;
z=
0.
0002
(3)
0.00
02(4
) 0.
0001
(6)
0.00
17(6
) 0.
0028
(9)
0.00
16(1
0)
65
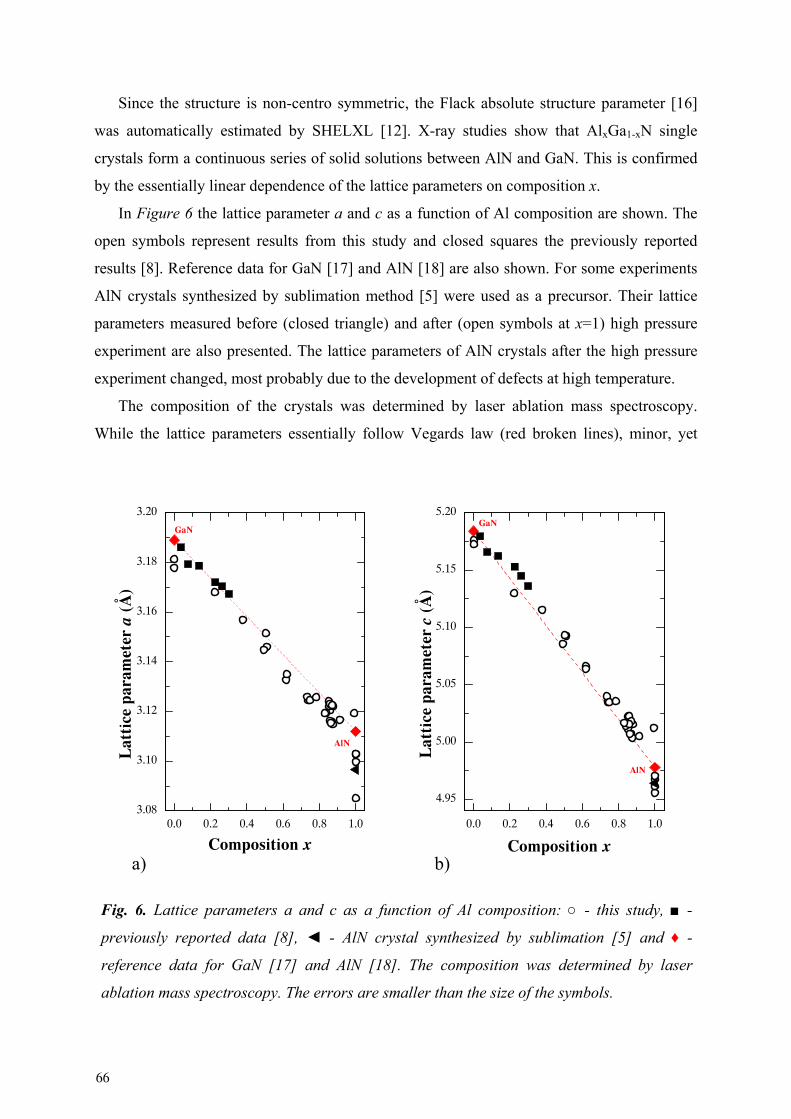
4.95
5.00
5.05
5.10
5.15
5.20
0.0 0.2 0.4 0.6 0.8 1.0
AlN
Composition x
Lat
tice
par
amet
er c
(Å
)
GaN
3.08
3.10
3.12
3.14
3.16
3.18
3.20
0.0 0.2 0.4 0.6 0.8 1.0
AlN
Composition x
Lat
tice
par
amet
er a
(Å
)
GaN
Fig. 6. Lattice parameters a and c as a function of Al composition: - this study, -
previously reported data [8], - AlN crystal synthesized by sublimation [5] and ♦ -
reference data for GaN [17] and AlN [18]. The composition was determined by laser
ablation mass spectroscopy. The errors are smaller than the size of the symbols.
a) b)
Since the structure is non-centro symmetric, the Flack absolute structure parameter [16]
was automatically estimated by SHELXL [12]. X-ray studies show that AlxGa1-xN single
crystals form a continuous series of solid solutions between AlN and GaN. This is confirmed
by the essentially linear dependence of the lattice parameters on composition x.
In Figure 6 the lattice parameter a and c as a function of Al composition are shown. The
open symbols represent results from this study and closed squares the previously reported
results [8]. Reference data for GaN [17] and AlN [18] are also shown. For some experiments
AlN crystals synthesized by sublimation method [5] were used as a precursor. Their lattice
parameters measured before (closed triangle) and after (open symbols at x=1) high pressure
experiment are also presented. The lattice parameters of AlN crystals after the high pressure
experiment changed, most probably due to the development of defects at high temperature.
The composition of the crystals was determined by laser ablation mass spectroscopy.
While the lattice parameters essentially follow Vegards law (red broken lines), minor, yet
66
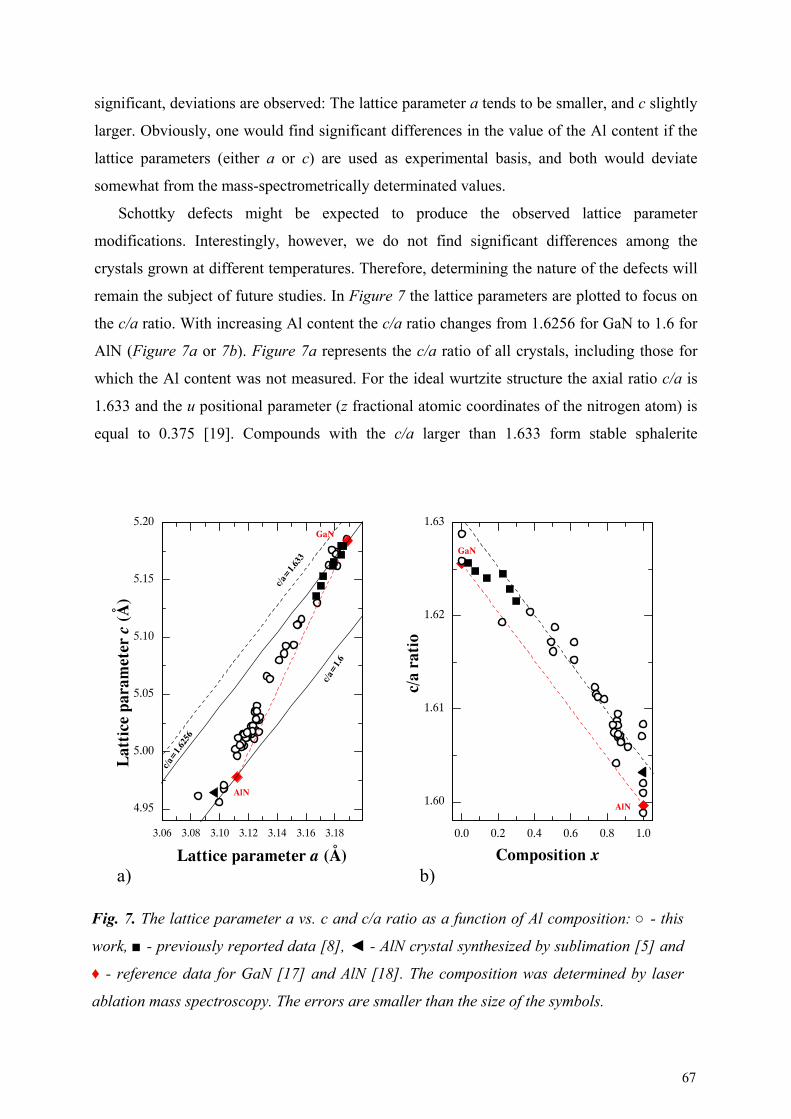
significant, deviations are observed: The lattice parameter a tends to be smaller, and c slightly
larger. Obviously, one would find significant differences in the value of the Al content if the
lattice parameters (either a or c) are used as experimental basis, and both would deviate
somewhat from the mass-spectrometrically determinated values.
Schottky defects might be expected to produce the observed lattice parameter
modifications. Interestingly, however, we do not find significant differences among the
crystals grown at different temperatures. Therefore, determining the nature of the defects will
remain the subject of future studies. In Figure 7 the lattice parameters are plotted to focus on
the c/a ratio. With increasing Al content the c/a ratio changes from 1.6256 for GaN to 1.6 for
AlN (Figure 7a or 7b). Figure 7a represents the c/a ratio of all crystals, including those for
which the Al content was not measured. For the ideal wurtzite structure the axial ratio c/a is
1.633 and the u positional parameter (z fractional atomic coordinates of the nitrogen atom) is
equal to 0.375 [19]. Compounds with the c/a larger than 1.633 form stable sphalerite
3.06 3.08 3.10 3.12 3.14 3.16 3.18
4.95
5.00
5.05
5.10
5.15
5.20
AlN
c/a=
1.625
6
c/a=
1.6
Lat
tice
par
amet
er c
(Å
)
Lattice parameter a (Å)
c/a=
1.633
GaN
1.60
1.61
1.62
1.63
0.0 0.2 0.4 0.6 0.8 1.0
AlN
Composition x
c/a
rati
o
GaN
Fig. 7. The lattice parameter a vs. c and c/a ratio as a function of Al composition: - this
work, - previously reported data [8], - AlN crystal synthesized by sublimation [5] and
♦ - reference data for GaN [17] and AlN [18]. The composition was determined by laser
ablation mass spectroscopy. The errors are smaller than the size of the symbols.
a) b)
67

modification [20]. The parameter u increases when c/a decreases [21]. Figure 7b illustrates
that the c/a ratio of our crystals (with significant Al content) tends to be systematically larger
by ~0.3% than the GaN and AlN values.
68

References:
[1] E. Iliopoulos, K. F. Ludwig, T. D. Moustakas, and S. Chu, Appl. Phys. Lett. 78 (2001)
463-465.
[2] V. Soukhoveev, O. Kovalenkov, L. Shapovalova, V. Ivantsov, A. Usikov, V.
Dmitriev, V. Davydov, A. Smirnov, Phys. Stat. Sol. (c) 6 (2006) 1483-1486.
[3] Y. Koide, N. Itoh, K. Itoh, N. Sawaki, I. Akasaki, Jpn. J. Appl. Phys. 27 (1988) 1156-
1161.
[4] N. Okada, N. Fujimoto, T. Kitano, G. Narita, M. Imura, K. Balakrishnan, M. Iwaya, S.
Kamiyama, H. Amano, I. Akasaki, K. Shimono, T. Noro, T. Takagi and A. Bandoh,
Jpn. J. Appl. Phys. 45 (2006) 2502-2504.
[5] B. M. Epelbaum, C. Seitz, A. Magerl, M. Bickermann, A. Winnacker, J. Cryst.
Growth 265 (2004) 577-581.
[6] T. Hashimoto, F.Wu, J. S. Speck, S. Nakamura, Jpn. J. Appl. Phys. 46 (2007) L889-
891.
[7] B. N. Feigelson, R. M. Frazier, M. Gowda, J. A. Freitas, M. Fatemi, M. A. Mastro and
J. G. Tischler, J. Cryst. Growth 310 (2008) 3934-3940.
[8] P. Geiser, J. Jun, J. M. Kazakov, L. Klemm, P. Wägli, J. Karpinski and B. Batlogg, J.
Appl. Phys. Lett. 86 (2005) 081908.
[9] A. Belousov, S. Katrych, J. Jun, J. Zhang, D. Günther, R. Sobolewski, J. Karpinski,
and B. Batlogg, J. Cryst. Growth, 311 (2009) 3971-3974.
[10] Oxford Diffraction Ltd., XCalibur, CrysAlis Software System, Version 1.170 (2003).
[11] B. Hattendorf, Ch. Latkoczy, D. Günther, Analytical Chemistry (A-pages), 75 (2003)
A341-347.
[12] G. Sheldrick, SHELXL-97. Program for the Refinement of Crystal Structures,
University of Göttingen, Germany (1997).
[13] M. Bockowski, A. Witek, S. Krukowski, M. Wroblewski, S. Porowski, R. M. Marin-
Ayral, and J. C. Tedenac, J. Mat. Synth. Process., 5 (1997) 449-458.
[14] M. Bockowski, B. Łucznik, I. Grzegory, S. Krukowski, M. Wroblewski and S.
Porowski, J. Phys: Condens. Matter 14 (2002) 11237-11242.
[15] J. Karpinski, J. Jun, and S. Porowski, J. Cryst. Growth 66 (1984) 1-10.
[16] H. D. Flack, Acta Cryst. 39 (1983) 876-881.
[17] I. Vurgaftman, J. R. Meyer, L. R. Ram-Mohan, J. Appl. Phys. 89 (2001) 5815-5875.
69
[18] M. Levinshtein, S. Rumyantsev, S. Shur, Properties of Advanced Semiconductors
Materials: GaN, AlN, InN, BN, SiC, SiGe, Wiley, New York, 2001.
[19] H. Ott, Zeitschrift fuer Physik 22 (1924) 201-214.
[20] M. E. Fleet, Mat. Res. Bull. 11 (1976) 1179-1184.
[21] V. A. Zhdanov, L. A. Brysneva, Izvest. Vysshih. Ucheb. Zavedenii Fiz. 3 (1961) 95.
70

Chapter 6
Thermodynamics in the Al-Ga-N2 system
6.1 Summary
In this chapter, we reported the results obtained from the studying the thermodynamics of
the stability of ternary (Al,Ga)N up to 10 kbar and 1800 °C. The calculation was carried out
on the basis of experimentally obtained p-T growth conditions presented in Chapter 5. The
main results can be summarized as follows:
(1) The equilibrium nitrogen pressure/activity aN2 as a function of composition x
shows a non-linear behavior.
(2) The standard Gibbs free energy ΔG0 as well as the standard enthalpy ΔH0 and
standard entropy ΔS0 of formation as a function of composition x are reported.
(3) The corresponding p-T and x-T phase diagrams for AlxGa1-xN are determined.
(4) Stability of AlxGa1-xN with particular composition x strongly depends on the
pressure and temperature.
6.2 Introduction
Due to the very high melting temperatures of III-V semiconductors, such as GaN with
Tm≈2220 °C [1] and AlN with Tm≈3214 °C [2] and high partial nitrogen pressure (~60 kbar)
above GaN at melting temperature [1], single crystals can not be grown from the
stoichiometric melts using typical methods, such as Czochralski or Bridgman. For the growth
from solution information on the thermal stability and solubility in liquid Ga or Al are of
primary importance. The knowledge about thermal stability is also important for the device
application, since they may thermally degrade during device processing or operation. The
equilibrium pressure of nitrogen over nitrides was previously reported for GaN at
71
temperatures up to 1700 °C and for AlN up to 3150 °C [3,4]. More recently we presented the
data for the Al-Ga-N2 system up to 1800 °C (see Chapter 5).
AlxGa1-xN solid solutions have been produced as epitaxial layers using various growth
methods [5,6], and only recently we succeeded in the growth of AlxGa1-xN single crystals
using high pressure techniques [7].
Based on the experimental data, the p-T-x diagram of the Al-Ga-N2 system has been
determinated (Chapter 5). However, there is lack of information about the basic
thermodynamic functions such as the standard Gibbs free energy, the enthalpy and entropy of
formation. The stability of AlGaN was also studied theoretically using various methods such
as a generalized quasi-chemical approximation (GQCA) or delta lattice-parameter model etc.
[8,9]. It was shown that it is possible to have the regular solid solution under normal
conditions, in agreement with our observations. Thermodynamic data of the reaction of
formation are still missing.
The growth conditions and the extended equilibrium p-T phase diagram of AlxGa1-xN
were previously published [7]. Here, we present the calculations of the standard Gibbs free
energy of formation, the enthalpy and entropy of formation of the AlGaN crystals based on
experimental p-T growth conditions. The calculations were done for temperatures of up to
1900 °C and up to 30 kbar pressure. Knowing the thermodynamic functions allows us to
determine the p-T and x-T phase diagrams for extended parameter ranges, which is the basis
for crystal growth experiments and thermal annealing, and the understanding of interface
stability issues.
6.3 The thermodynamic data of AlN and GaN
Published thermodynamic data of the standard enthalpy and entropy of formation for GaN
and AlN are summarized in Table I. The standard enthalpy of formation was theoretically
calculated, measured calorimetrically as well as derived from the experimental high pressure
equilibrium experiments. The reported thermodynamic data scatter somewhat. Karpinski and
Porowski measured the nitrogen gas pressure over GaN and estimated the standard enthalpy
for GaN as -37.7 kcal/mol and the entropy of formation as -32.43 cal/Kmol [3]. For AlN no
experimental data of nitrogen partial pressures are available. Instead, the values for AlN were
estimated by calorimetric measurements such as carbothermal nitridation of aluminum oxide
72

or high-temperature oxide melt drop solution. In comparison to the direct measurement of the
equilibrium nitrogen pressure over AlN, such methods are, however, highly sensitive to the
impurity level in the system. The standard enthalpy of formation -79.5 kcal/mol and standard
entropy of formation -28.026 cal/Kmol for AlN were derived from the p-T diagram presented
by G. Slack and T. F. McNelly [4]. Here one should notice that this diagram was not
measured, but calculated using the available thermodynamic data of the constituents of the
AlN formation reaction, N2, Al liquid and Al gas. It was estimated that the pressure of
nitrogen necessary to react with Al(l) to form AlN is 1 atm at 2563 °C. At lower temperatures
it is less. The temperature of 2493 °C is of particular significance for any experiment as it is
the boiling temperature of Al, and reactions with the crucible material leads to the failure of
the experiment. The direct measurement of the AlN stability and therefore the determination
of the thermodynamic functions are rendered very difficult by the low nitrogen pressure, the
high thermal stability of AlN and the high vapor pressure of aluminum.
Table I
Summary of experiments on thermodynamic quantities of AlN (adapted from [10])
Ref. Year
[Ref. #]
Temperature
range (K) Method
Enthalpy of
formation ∆H0298
(kcal/mol)
Entropy of
formation ∆S0298
(cal/Kmol)
1957 [11] - Direct nitridation calorimetry -76.47 -
1961 [12] - Oxygen combustion
calorimetry -75.67 -
1963 [13] 1780-1970 Torsion-effusion -76.10 -
1976 [4] 1750-3200 Derived from p-T curves -79.50 -28.026
1979 [14] - Calculation -76.10 -
1984 [15] - Calculation -76.10 -
1999 [16] - Drop solution calorimetry -74.35 -
2002 [17] 1723-1899 Carbothermal Nitridation -73.66 -
2006 [18] - Calculation -74.22 -
73
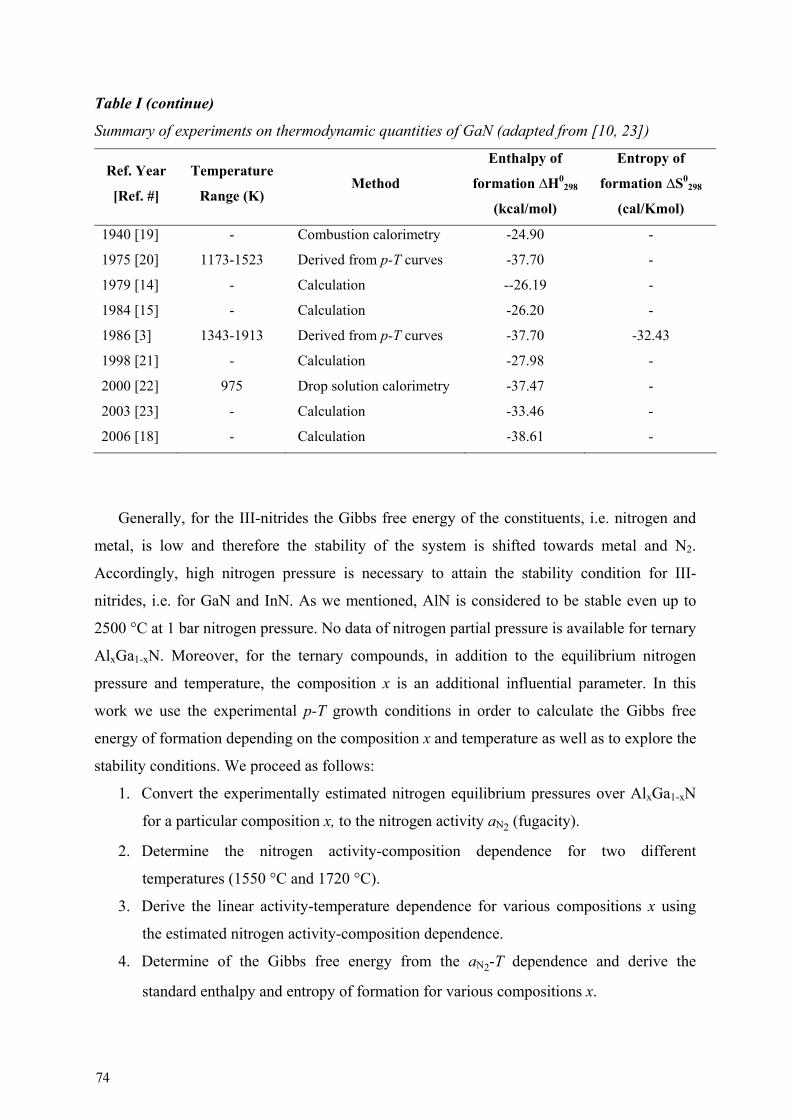
Table I (continue)
Summary of experiments on thermodynamic quantities of GaN (adapted from [10, 23])
Ref. Year
[Ref. #]
Temperature
Range (K) Method
Enthalpy of
formation ∆H0298
(kcal/mol)
Entropy of
formation ∆S0298
(cal/Kmol)
1940 [19] - Combustion calorimetry -24.90 -
1975 [20] 1173-1523 Derived from p-T curves -37.70 -
1979 [14] - Calculation --26.19 -
1984 [15] - Calculation -26.20 -
1986 [3] 1343-1913 Derived from p-T curves -37.70 -32.43
1998 [21] - Calculation -27.98 -
2000 [22] 975 Drop solution calorimetry -37.47 -
2003 [23] - Calculation -33.46 -
2006 [18] - Calculation -38.61 -
Generally, for the III-nitrides the Gibbs free energy of the constituents, i.e. nitrogen and
metal, is low and therefore the stability of the system is shifted towards metal and N2.
Accordingly, high nitrogen pressure is necessary to attain the stability condition for III-
nitrides, i.e. for GaN and InN. As we mentioned, AlN is considered to be stable even up to
2500 °C at 1 bar nitrogen pressure. No data of nitrogen partial pressure is available for ternary
AlxGa1-xN. Moreover, for the ternary compounds, in addition to the equilibrium nitrogen
pressure and temperature, the composition x is an additional influential parameter. In this
work we use the experimental p-T growth conditions in order to calculate the Gibbs free
energy of formation depending on the composition x and temperature as well as to explore the
stability conditions. We proceed as follows:
1. Convert the experimentally estimated nitrogen equilibrium pressures over AlxGa1-xN
for a particular composition x, to the nitrogen activity aN2 (fugacity).
2. Determine the nitrogen activity-composition dependence for two different
temperatures (1550 °C and 1720 °C).
3. Derive the linear activity-temperature dependence for various compositions x using
the estimated nitrogen activity-composition dependence.
4. Determine of the Gibbs free energy from the aN2-T dependence and derive the
standard enthalpy and entropy of formation for various compositions x.
74
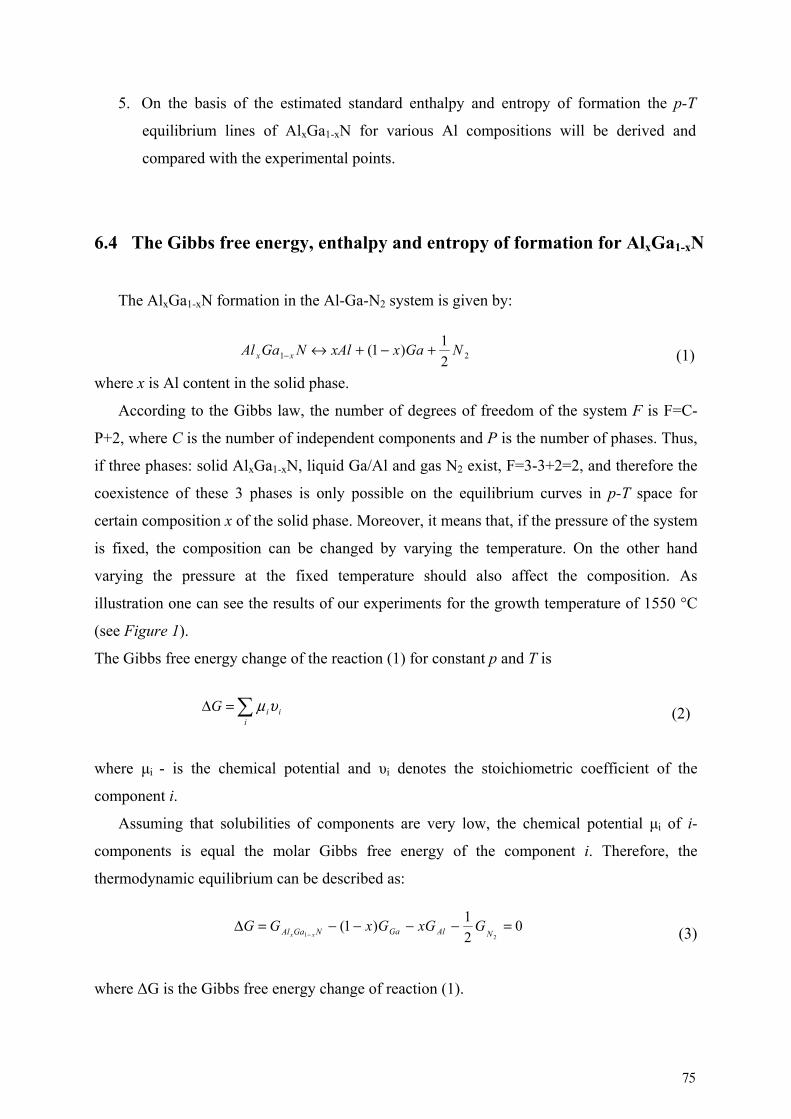
5. On the basis of the estimated standard enthalpy and entropy of formation the p-T
equilibrium lines of AlxGa1-xN for various Al compositions will be derived and
compared with the experimental points.
6.4 The Gibbs free energy, enthalpy and entropy of formation for AlxGa1-xN
The AlxGa1-xN formation in the Al-Ga-N2 system is given by:
(1)
where x is Al content in the solid phase.
According to the Gibbs law, the number of degrees of freedom of the system F is F=C-
P+2, where C is the number of independent components and P is the number of phases. Thus,
if three phases: solid AlxGa1-xN, liquid Ga/Al and gas N2 exist, F=3-3+2=2, and therefore the
coexistence of these 3 phases is only possible on the equilibrium curves in p-T space for
certain composition x of the solid phase. Moreover, it means that, if the pressure of the system
is fixed, the composition can be changed by varying the temperature. On the other hand
varying the pressure at the fixed temperature should also affect the composition. As
illustration one can see the results of our experiments for the growth temperature of 1550 °C
(see Figure 1).
The Gibbs free energy change of the reaction (1) for constant p and T is
(2)
where μi - is the chemical potential and υi denotes the stoichiometric coefficient of the
component i.
Assuming that solubilities of components are very low, the chemical potential μi of i-
components is equal the molar Gibbs free energy of the component i. Therefore, the
thermodynamic equilibrium can be described as:
(3)
where ΔG is the Gibbs free energy change of reaction (1).
21 2
1)1( NGaxxAlNGaAl xx +−+↔−
02
1)1(
21=−−−−=Δ
− NAlGaNGaAl GxGGxGGxx
=Δi
iiG υμ
75

)(0 TGi
The pressure dependence of the Gibbs free energy at a constant temperature can be found by
integrating the relationship:
where υi is the molar volume of component i.
Varying the pressure from the standard condition of 1 bar to pressure p, we find that
(4a)
(4b)
(4c)
(4d)
where is the standard Gibbs free energy of component i at 1 bar pressure.
Inserting (4) into (3) we get:
Solids and liquids are not very compressible, so to first approximation, we can regard their
molar volume υi as constant. (as long as the pressure range is not too large). Equation (4) for
the solid components simplifies to:
(5)
iTi
p
G υ=∂
∂)(
−−−+=
P
NGaAlNGaAl dpTpTGTpGxxNxGaxAlxx 1
0 ),()(),(111
υ
+=P
GaGaGa dpTpTGTpG1
0 ),()(),( υ
+=P
AlAlAl dpTpTGTpG1
0 ),()(),( υ
+=P
NNN dpTpTGTpG1
0 ),()(),(222
υ
−−++=
=−−−−=Δ
−
−
.
12
21
1
00000
),(),()1(),(),(2
12
1)1()(
eq
xx
xx
P
NGaAlGaAlN
NAlGaNGaAl
dpTpTpxTpxTp
GxGGxGTG
υυυυ
)1)(()(),( .0 −+= EqPTTGTpG υ
76

[ ] −.
1),(),(
eqp
GaNGa dpTpTp υυ
The second part is small compared to the first one (e.g. ~66.38 kcal/mol for Ga and
~79.25 kcal/mol for Al [24]), and more importantly, it is negligible compared to the
correspond p-depend part of the gas component N2. The equilibrium pressure PEq depends on
temperature and for ternary AlxGa1-xN is in order of 104 bar ~ 109 Pa (N/m2) (see Ref [7],
Figure 2). The values for GaN are similar [3]. For AlN lower pressure is required. The molar
volume of a typical metal υi is ~ 10 cm3/mol or 10-6 m3/mol. The Gibbs free energy change
will be 10-6 m3/mol x 109 N/m2 = 103 Nm/mol = 1000 J/mol ≈ 240 cal/mol. Thus, the Gibbs
energy change of the metal caused by pressure does not exceed ~ 102 cal/mol.
As Karpinski and Porowski [3] showed, the value of
is less than 170 cal/mol, calculated from the compressibility and thermal expansion data.
The value is not known, but one can estimate it to be similar to that of
GaN.
As we discuss below, the present study yields the equilibrium pressure PEq.(x, T) in the Al-
Ga-N2 system. Accordingly, the contribution (4d) to ΔG0 from the N2 component is calculated
to be in range of 21.4 kcal/mol (for x=0) to 15.1 kcal/mol (for x=0.86). Therefore, the Gibbs
free energy change is dominated by the contribution from N2.
Introducing the activity aN2 (PEq.,T), ΔG0 is given by:
(6)
where aN2 (PEq.,T) is the activity of gaseous nitrogen (dimensionless) and Peq is the
equilibrium pressure of nitrogen for the temperature T. The activity of nitrogen, defined as
nitrogen fugacity over the nitrogen fugacity at the reference state of 1 bar, describes the non-
ideal behaviour of the nitrogen gas. This is important because the fugacity of nitrogen is
several times higher than the pressure at our experimental conditions.
−
P
NGaAl dpTpxx1
),(1
υ
),(ln2
1),(
2
1)(
2
.
21
0 TpaRTdpTpTG epN
p
N
eq =≅Δ υ
77

We assumed that the solubilities of the component are very low. However, in general
solubilities can influence the Gibbs free energy. It was shown for GaN that the change of
Gibbs free energy of gallium resulting from the solubility of nitrogen in gallium at 1500 °C
and 16 kbar is 72 cal/mol [3]. This value is negligible compared to the term connected to the
nitrogen activity. As in our case the solvent is also metallic Ga with very small amounts of Al
we can assume that it is also valid for our system.
6.5 The results of the calculation
In this section the thermodynamic functions are calculated on the basis of the
experimentally obtained equilibrium temperature and pressure Peq. Figure 1 shows the
dependence of the activity of nitrogen over AlxGa1-xN versus reciprocal temperature for the
experimentally obtained growth pressure and temperature.
1900 1800 1700 1600 1500 1400 1300 1200
4.8 5.1 5.4 5.7 6.0 6.3 6.61
10
100
1000
Al content in AlxGa
1-xN
0.22 0.50 0.62 0.74 0.78 0.86
1/T (x10-4 K-1)
GaN Equilibrium Line
log
a N2 (
p,T
) (k
bar)
1720
°C
1550
°C
Temperature (°C)
Fig. 1. Activity of nitrogen aN2 over AlxGa1-xN. The symbols are calculated from the
experimental pressure for particular compositions x. The activity errors are smaller than
the size of the symbols.
78
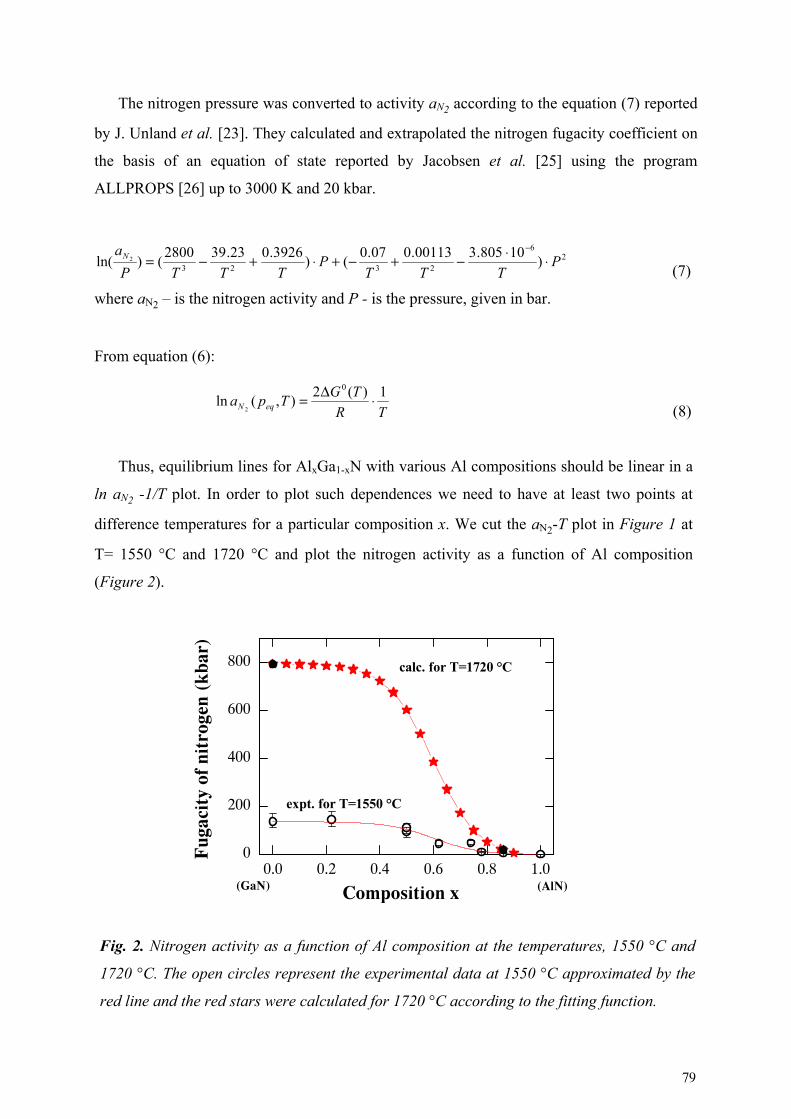
The nitrogen pressure was converted to activity aN2 according to the equation (7) reported
by J. Unland et al. [23]. They calculated and extrapolated the nitrogen fugacity coefficient on
the basis of an equation of state reported by Jacobsen et al. [25] using the program
ALLPROPS [26] up to 3000 K and 20 kbar.
(7)
where aN2 – is the nitrogen activity and P - is the pressure, given in bar.
From equation (6):
(8)
Thus, equilibrium lines for AlxGa1-xN with various Al compositions should be linear in a
ln aN2 -1/T plot. In order to plot such dependences we need to have at least two points at
difference temperatures for a particular composition x. We cut the aN2-T plot in Figure 1 at
T= 1550 °C and 1720 °C and plot the nitrogen activity as a function of Al composition
(Figure 2).
TR
TGTpa eqN
1)(2),(ln
0
2⋅Δ=
26
2323)
10805.300113.007.0()
3926.023.392800()ln( 2 P
TTTP
TTTP
aN ⋅⋅−+−+⋅+−=−
Fig. 2. Nitrogen activity as a function of Al composition at the temperatures, 1550 °C and
1720 °C. The open circles represent the experimental data at 1550 °C approximated by the
red line and the red stars were calculated for 1720 °C according to the fitting function.
0.0 0.2 0.4 0.6 0.8 1.00
200
400
600
800
(AlN)
expt. for T=1550 °C
calc. for T=1720 °C
Fug
acit
y of
nit
roge
n (k
bar)
Composition x(GaN)
79
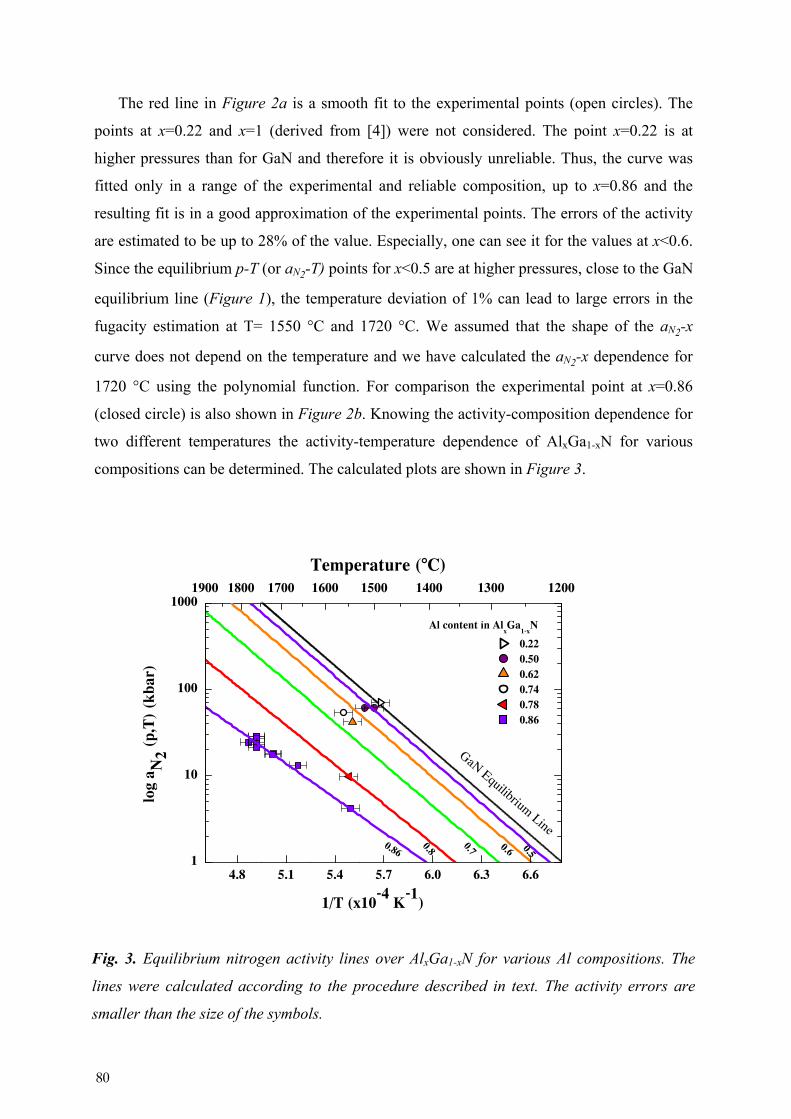
The red line in Figure 2a is a smooth fit to the experimental points (open circles). The
points at x=0.22 and x=1 (derived from [4]) were not considered. The point x=0.22 is at
higher pressures than for GaN and therefore it is obviously unreliable. Thus, the curve was
fitted only in a range of the experimental and reliable composition, up to x=0.86 and the
resulting fit is in a good approximation of the experimental points. The errors of the activity
are estimated to be up to 28% of the value. Especially, one can see it for the values at x<0.6.
Since the equilibrium p-T (or aN2-T) points for x<0.5 are at higher pressures, close to the GaN
equilibrium line (Figure 1), the temperature deviation of 1% can lead to large errors in the
fugacity estimation at T= 1550 °C and 1720 °C. We assumed that the shape of the aN2-x
curve does not depend on the temperature and we have calculated the aN2-x dependence for
1720 °C using the polynomial function. For comparison the experimental point at x=0.86
(closed circle) is also shown in Figure 2b. Knowing the activity-composition dependence for
two different temperatures the activity-temperature dependence of AlxGa1-xN for various
compositions can be determined. The calculated plots are shown in Figure 3.
Fig. 3. Equilibrium nitrogen activity lines over AlxGa1-xN for various Al compositions. The
lines were calculated according to the procedure described in text. The activity errors are
smaller than the size of the symbols.
1900 1800 1700 1600 1500 1400 1300 1200
4.8 5.1 5.4 5.7 6.0 6.3 6.61
10
100
1000
Al content in AlxGa
1-xN
0.22 0.50 0.62 0.74 0.78 0.86
1/T (x10-4 K-1)
GaN Equilibrium Line
log
a N2 (
p,T
) (k
bar)
0.5
0.6
0.70.80.86
Temperature (°C)
80

0.0 0.2 0.4 0.6 0.8 1.0-40
-20
0
20
40
1200 °C 1550 °C 1720 °C 2000 °C
Gib
bs F
ree
Ene
rgy
ΔG0 (k
cal/m
ol)
Composition x
Fig. 4. The standard Gibbs free energy
ΔG0(T) dependence on the composition x
for several temperatures.
From equation (8) the standard Gibbs free energy of formation ΔG0(T) as a function of
the composition x was calculated (Figure 4). The data are presented for several temperatures.
The solid points are ΔG0(T) values of the pure AlN, which were derived from the p-T
equilibrium curve published by Slack et al. [4]. ΔG0(T) is almost constant up to certain x
value and decreases at larger x. The slope of the ΔG0(T) decrease is steeper for higher
temperature isotherms. For x close to 1 ΔG0(T) values are negative. If the ΔG0(T)>0 for
reaction (1), then the reverse reaction will be spontaneous at p=1 bar and it will produce
Ga/Al metal und nitrogen gas. For our case at 1 bar pressure, the AlxGa1-xN phase with Al
content up to 0.9 seems to be unstable and decompose. This is in a good agreement with the
experimental data. To stabilize AlxGa1-xN with Al content at least up to 0.86 pressures in a
range of several kbar are required. E.g. for Al0.86Ga0.14N crystal growth at the 1550 °C the
nitrogen pressure will be about 5 kbar [7]. For ΔG0(T)=0 the reaction (1) is at equilibrium
and AlxGa1-xN is stable. From Figure 4 we conclude that at 1 bar pressure AlxGa1-xN with Al
content x>0.9 is stable.
The change in the standard Gibbs free energy of reaction ΔG0(T) is given by the
simplified Gibbs-Helmholtz equation:
(9)
From equations (8) and (9) the standard enthalpy ΔH0298 and standard entropy ΔS0
298 of
formation for various compositions x have been calculated (Table II). Both ΔH0 and ΔS0 were
found to be independent of the temperature up to 1800 °C. The dependence of the standard
TΔSΔH)(ΔG 000 ⋅−=T
81
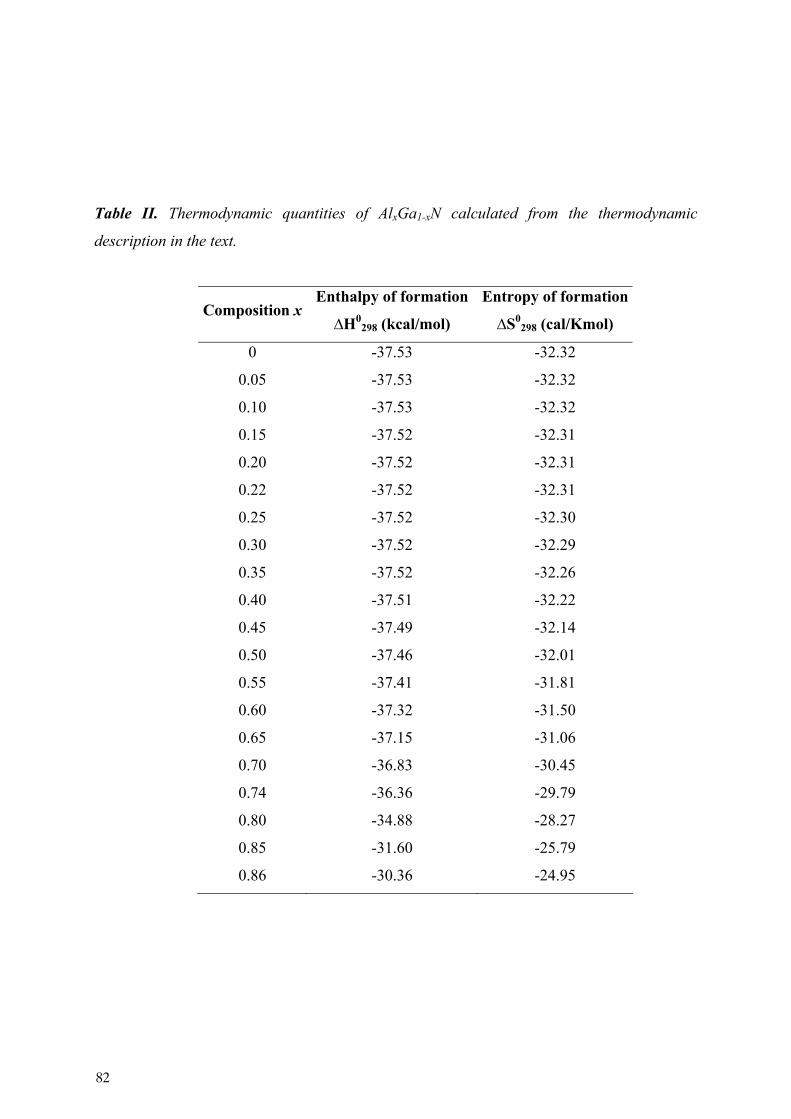
Table II. Thermodynamic quantities of AlxGa1-xN calculated from the thermodynamic
description in the text.
Composition x Enthalpy of formation
∆H0298 (kcal/mol)
Entropy of formation
∆S0298 (cal/Kmol)
0 -37.53 -32.32
0.05 -37.53 -32.32
0.10 -37.53 -32.32
0.15 -37.52 -32.31
0.20 -37.52 -32.31
0.22 -37.52 -32.31
0.25 -37.52 -32.30
0.30 -37.52 -32.29
0.35 -37.52 -32.26
0.40 -37.51 -32.22
0.45 -37.49 -32.14
0.50 -37.46 -32.01
0.55 -37.41 -31.81
0.60 -37.32 -31.50
0.65 -37.15 -31.06
0.70 -36.83 -30.45
0.74 -36.36 -29.79
0.80 -34.88 -28.27
0.85 -31.60 -25.79
0.86 -30.36 -24.95
82
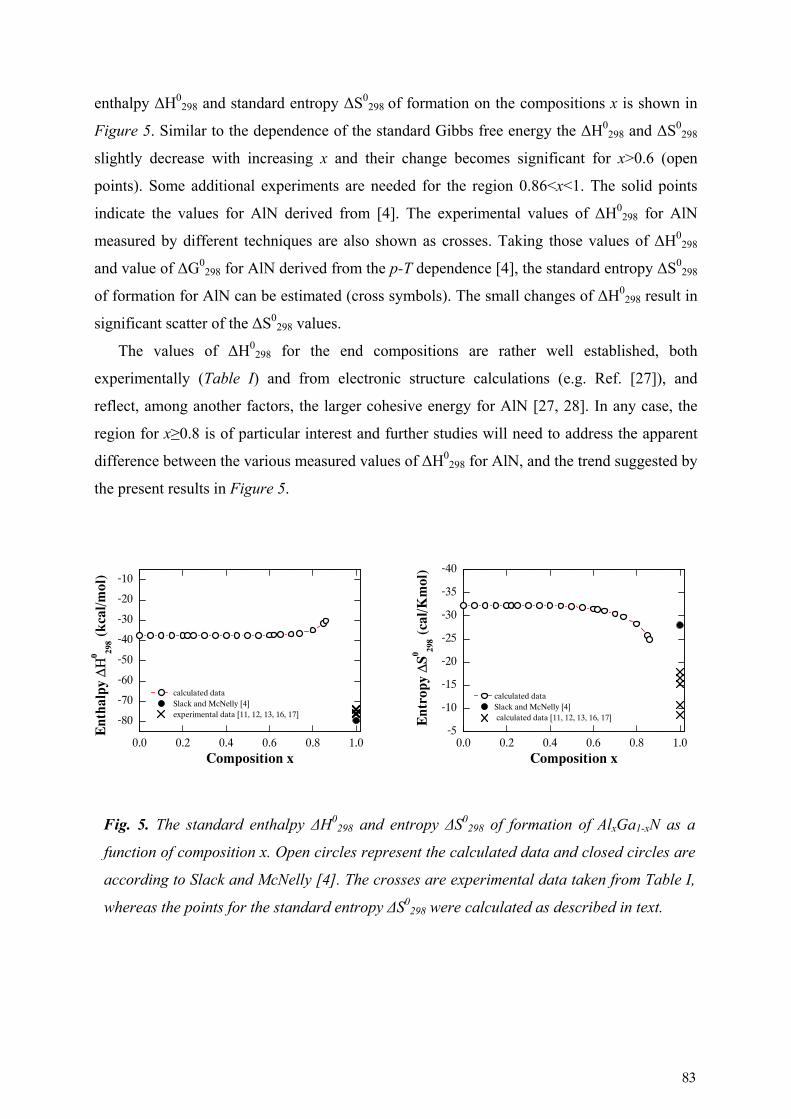
enthalpy ΔH0298 and standard entropy ΔS0
298 of formation on the compositions x is shown in
Figure 5. Similar to the dependence of the standard Gibbs free energy the ΔH0298 and ΔS0
298
slightly decrease with increasing x and their change becomes significant for x>0.6 (open
points). Some additional experiments are needed for the region 0.86<x<1. The solid points
indicate the values for AlN derived from [4]. The experimental values of ΔH0298 for AlN
measured by different techniques are also shown as crosses. Taking those values of ΔH0298
and value of ΔG0298 for AlN derived from the p-T dependence [4], the standard entropy ΔS0
298
of formation for AlN can be estimated (cross symbols). The small changes of ΔH0298 result in
significant scatter of the ΔS0298 values.
The values of ΔH0298 for the end compositions are rather well established, both
experimentally (Table I) and from electronic structure calculations (e.g. Ref. [27]), and
reflect, among another factors, the larger cohesive energy for AlN [27, 28]. In any case, the
region for x≥0.8 is of particular interest and further studies will need to address the apparent
difference between the various measured values of ΔH0298 for AlN, and the trend suggested by
the present results in Figure 5.
Fig. 5. The standard enthalpy ΔH0298 and entropy ΔS0
298 of formation of AlxGa1-xN as a
function of composition x. Open circles represent the calculated data and closed circles are
according to Slack and McNelly [4]. The crosses are experimental data taken from Table I,
whereas the points for the standard entropy ΔS0298 were calculated as described in text.
0.0 0.2 0.4 0.6 0.8 1.0
-80
-70
-60
-50
-40
-30
-20
-10
calculated data Slack and McNelly [4] experimental data [11, 12, 13, 16, 17]
Ent
halp
y ΔΗ
0 298 (
kcal
/mol
)
Composition x0.0 0.2 0.4 0.6 0.8 1.0
-5
-10
-15
-20
-25
-30
-35
-40
calculated dataSlack and McNelly [4] calculated data [11, 12, 13, 16, 17]
Ent
ropy
ΔS0 29
8 (ca
l/Km
ol)
Composition x
83

Table III. Equilibrium temperatures for AlxGa1-xN with various compositions x at 1 bar
nitrogen pressure.
*- Ref. [3].
Composition x T (K) Composition x T(K)
0 1160.9* 0.50 1170.1
0.10 1161.0 0.60 1184.6
0.20 1161.2 0.70 1209.4
0.30 1161.9 0.80 1233.5
0.40 1164.0 0.86 1216.7
0.45 1166.3
0.0 0.2 0.4 0.6 0.8 1.01000
1200
1400
1600
1800
2000
2200
2400
1 bar
1
5
AlN
Pressure (kbar)
Tem
pera
ture
(K
)
Composition x
GaN
10
Fig. 6. x-T phase diagram of AlxGa1-xN at various nitrogen pressures.
84
The stability of AlxGa1-xN with a particular composition x strongly depends on pressure
and temperature. In Table III the equilibrium temperatures for AlxGa1-xN are presented for
p=1 bar. Using the thermodynamic functions calculated in this study we determinated the
pressure-temperature and temperature-composition phase diagrams for AlxGa1-xN. The p-T
equilibrium phase diagram was discussed in our early studies (Chapter 5 or [7]).
Here we present the x-T phase diagram of AlxGa1-xN for different pressures (Figure 6).
For 1 bar the equilibrium isobar of the temperature seem to depend linearly on the
composition x. However, with increasing pressure the isobars have a tendency to bend to the
higher temperatures, particularly for the higher Al content, x>0.6. Accordingly, the nitride is
more stable at higher pressures. For e.g. AlxGa1-xN with x=0.5, the equilibrium temperature at
1 kbar is 1503 K. An increase of the pressure up to 5 or 10 kbar will lead to a higher stability
and the equilibrium temperature has been calculated to be 1665 K and 1786 K respectively.
85

References:
[1] W. Utsumi, H. Saitoh, H. Kaneko, T. Watanuki, K. Aoki and O. Shimomura, Nature
Materiale 2 (2003) 735-737.
[2] J. A. Van Vechten, Phys. Rev. B 7 (1973) 1479-1507.
[3] J. Karpinski, S. Porowski, J. Cryst. Growth 66 (1986) 11-20.
[4] G. A. Slack, T. F. McNelly, J. Cryst. Growth 34 (1976) 263-279.
[5] E. Iliopoulos, K. F. Ludwig, T. D: Moustakas, and S. Chu, Appl. Phys. Lett. 78 (2001)
463-465.
[6] Y. Koide, N. Itoh, K. Itoh, N. Sawaki, and I. Akasaki, Jpn. J. Appl. Phys. 27 (1988)
1156-1161.
[7] Andrey Belousov, S. Katrych, J. Jun, J. Zhang, D. Günther, R. Sobolewski, J.
Karpinski, and B. Batlogg, J. Cryst. Growth, 311 (2009) 3971-3974.
[8] L. K. Teles, J. Furthmüller, L. M. R. Scolfaro, J. R. Leite, and F. Bechstedt, Phys.
Rev. B 62 (2000) 2475-2485.
[9] V. G. Deibuk, A. V. Voznyi, Semiconductors 39 (2005) 623-628. (and references
inside).
[10] V. P. Vasilev and J. C. Gachon, Inorganic Materials 42 (2006) 1176-1187.
[11] C. A. Neugebauer and J. L. Margrave, Z. Anorg. Allgem. Chem. 290 (1957) 82-86.
[12] A. D. Mah, E. G. King, W. W. Weller, and A. U. Christensen, RI 5716, U. S. Bureau
of Mines, Berkeley, CA (1961) 8.
[13] D. L. Hildebrand, W. F. Hall, J. Phys. Chem. 67 (1963) 888-893.
[14] O. Kubaschewski, C. B. Alcock, Metallurgic Thermochemistry, Pergamon Press.,
London, 1979.
[15] R. D. Jones, K. Rose, R. D. Jones and K. Rose, CALPHAD 8, (1984) 343-354.
[16] J. M. McHalle, A. Navrotsky, and F. J. DiSalvo, Chem. Mater. 11 (1999) 1148-1152.
[17] W. Nakao, H. Fukuyama, K. Nagata, J. Am. Ceram. Soc. 85 (2002) 889-896.
[18] D. Sedmidubsky, J. Leitner, J. Cryst. Growth 286 (2006) 66-70.
[19] H. Hahn, R. Juza, Z. Anorg. Allgem. Chem. 244 (1940) 111-124.
[20] R. Madar, G. Jacob, J. Hallais, R. Fruchart, J. Cryst. Growth 31 (1975) 197-203.
[21] A. V. Davydov, T. J. Anderson, III-V Nitride Materials and Processes III, ECS,
Boston, PV 98-18 (1998) 38-49.
86

[22] M. R. Ranade, F. Tessier, A. Navrotsky, V. J. Leppert, S. H. Risbud, F. J. DiSalvo, C.
M. Balkas, J. Phys. Chem. B 104 (2000) 4060-4063.
[23] J. Unland, B. Onderka, A. Davydov, and. R. Schmid-Fetzer, J. Cryst. Growth 256
(2003) 33-51.
[24] L. V. Gurvich, I. V. Veyts and C. B. Alcock, Thermodynamic properties of individual
substances, 4th edition, V. 1, part 2, Hemisphere Publishing Corp., 1989.
[25] R. T. Jacobsen, R. B. Stewart and M. Jahangiri, J. Phys. Chem. Ref. Data 15 (1986)
735-908.
[26] E. W. Lemmon, R. T. Jacobsen, S. G. Penoncello, S. W. Beyerlein, Computer
programs for calculating thermodynamic properties of fluids of engineering interest,
version 6/4/1996, CATS University of Idaho, Moscow, USA (1996).
[27] A. Zoroddu, F. Bernardini, P. Ruggerone, V. Fiorentini, Phys. Rev. B 64 (2001)
045208.
[28] W. A. Harrison, Electronic Structure and Properties of Solids, San Francisco (1980).
87

88
Chapter 7
Conclusions and Outlook
The work presented in this thesis demonstrates the progress in the synthesis of ternary
(Al,Ga)N compounds by the solution growth method under high pressure. It is known that, in
comparison to other growth methods such as thin film deposition, high pressure solution
growth (HPSG) leads to the excellent quality, nearly dislocation free crystals, in particular for
GaN crystals [1]. Availability of the bulk (Al,Ga)N crystals permits to address some of
current deficiencies in understanding of the synthesis of such compound, its thermodynamic
stability and therefore to expand the potential for application.
7.1 Crystal growth
The main results demonstrated and addressed in this thesis are the growth of
polycrystalline (Al,Ga)N by solid-state reaction [2] and of (Al,Ga)N bulk single crystals from
solution in Ga melt. Using the anvil techniques (see Section 3.2) the polycrystalline (Al,Ga)N
samples covering the whole compositional range were synthesized at 30 kbar and 1800 °C. X-
ray powder diffraction measurements proved the homogenous composition of the nitride
compound and lack of a miscibility gap between AlN and GaN. Though the single (Al,Ga)N
crystals with up to 30% Al content were grown using an anvil technique as reported
previously [3,4], the main goal set in this work and finally achieved was to explore the
possibilities of crystal growth in a gas autoclave. The advantage of this technique is that
temperature, temperature gradient and nitrogen pressure can be well controlled. Moreover, it
allows the use of lager crucibles than in the anvil technique. Most of the (Al,Ga)N crystal
growth experiments were performed using our self-constructed high pressure gas autoclave
(Section 3.1).
89
AlxGa1-xN single crystals with 0.22≤x≤0.91 were synthesized from solution in Ga melt
under high nitrogen pressure (2.5-10 kbar) and at high temperature (1425-1780 °C). A growth
rate of up to 0.1 mm/day, a rate comparable to the growth of GaN from solution under high
pressure [5] or by the ammonothermal method [6], was achieved. The growth process was
optimized, yielding (Al,Ga)N crystals up to 0.8x0.8x0.8 mm3 in size. Numerous successful
experiments prove the reproducibility of the crystal growth. The (Al,Ga)N growth from
solution under high nitrogen pressure poses a significant challenge which could be
successfully overcome in this thesis. In particular, the major hurdles in growing (Al,Ga)N
bulk crystals from solution in Al/Ga melt were previously established as follows [4]: the
formation of AlN capping layer on the Al/Ga melt surface and self-propagating AlN
combustion reaction when nitrogen is present in gas form. The proper choice of the solvent is
obviously important. Adding Al metal to the melt (up to 0.4 at%) resulted in the growth of
very small (Al,Ga)N crystals accompanied by Al2O3 crystals as by-product. Further
experiments with larger amount of Al (up to 30 at%) ended up with so called self-propagating
AlN combustion. It was found that using pure Ga metal as a solvent and introducing an
appropriate amount of Al in form of the pre-reacted polycrystalline (Al,Ga)N or AlN pellet
helps to avoid the formation of AlN capping layer on the melt surface and the AlN
combustion reaction. The detailed study with different Al compositions in the (Al,Ga)N pellet
showed that the presence of the pellet enhances also the nitrogen supersaturation in the melt
and does not affect the Al content in the grown crystals (at least by up to 1.2 at% Al content
in the melt).
To extent the capacities of the high pressure experiments some modifications of the heater
construction and plug connection were made. It brought several advantages such as an
increasing of the maximum working temperature up to 1800 °C or more accurate temperature
measurements thanks to the additional Type T thermocouple placed in the plug as a reference
for the cold point of the three thermocouples placed inside the furnace.
One of the important issues in HPSG method is the unwanted oxygen contamination. If
some oxygen is present in the growth zone, Al2O3 crystal growth dominates because of the
high affinity of aluminium for oxygen. It was argued that the most probable oxygen source in
our system is the BN crucible partially containing boron oxide traces. Indeed, if the BN
crucible was used for the crystal growth, the (Al,Ga)N growth was mostly suppressed. The
(Al,Ga)N growth was carried out in a graphite crucible which acts as oxygen purifier. EDX
measurements did not detect any oxygen or carbon impurities in the crystals.
90

The key question also concerns the equilibrium conditions required to thermodynamically
stabilize the (Al,Ga)N phase. More than two dozen experiments in a wide range of
temperature and pressure were carried out in order to determine the p-T conditions for the
AlxGa1-xN growth. First, we found that AlxGa1-xN crystals could be grown by choosing the
appropriate pressure and temperature conditions selected below the GaN p-T equilibrium line
[7]. Second, the composition x in the growing AlxGa1-xN crystals can be selected by the
proper choice of the p-T conditions according to the estimated AlxGa1-xN equilibrium phase
diagram established in this study. Thus, summarizing the conclusions, proper p-T conditions
are the sine qua non conditions for successful (Al,Ga)N crystal growth.
The composition of the crystals was measured by laser ablation inductively coupled
plasma mass spectrometry (LA-ICP-MS) [8] as well as by structure refinement. The variation
of the Al/Ga ratio for one crystal measured on various points by LA-ICP-MS was up to ±
0.02. Overall, there was a satisfactory agreement between the compositions determined by
those two methods. Importantly, it was demonstrated that an about 1-μm-thick,
inhomogenously substituted (Al,Ga)N capping layer with various Al composition was formed
on the surface of the crystals. It was noted that the Al composition of this layer strongly
depends on the cooling profile.
7.2 Thermodynamics
The study of p-T-x equilibrium phase diagram is an important pillar of (Al,Ga)N research
towards applications and for basic research, particularly for exploring the thermodynamic data
of the reaction of formation. Basic studies on the thermodynamics of ternary (Al,Ga)N are
rather scarce and this work was aimed at expanding this knowledge and to motivate other
researchers.
For the first time, some attempts, described in Chapter 6 of this work, were made to
estimate the standard Gibbs free energy, the enthalpy and entropy of formation of the
(Al,Ga)N system on the basis of experimental p-T growth conditions. These calculations were
done for temperatures of up to 1800 °C and up to 30 kbar pressure. The standard enthalpy
ΔH0298 and entropy ΔS0
298 of formation, as a function of Al composition x, slightly decrease
with increasing x and their change becomes significant for the region x=0.6. However, the
91

trend of the values, particularly for the end composition AlN, raises some questions to be
discussed in the future.
In essence, knowing the thermodynamic functions allowed us to determine the p-T and x-
T phase diagrams for extended parameter ranges, which is the basis for crystal growth
experiments and thermal annealing, and the understanding of interface stability issues.
Furthermore, on the phase diagram, for instance in p-T space, the equilibrium lines between
(Al,Ga)N(s) and Al/Ga(l) + N2(g) for various Al composition in the crystals were defined.
Polycrystalline (Al,Ga)N pellets tend to equilibrate with the crystals at a given pressure and
temperature. The Al composition of the precursor pellets changes during experiments and
shifts after sufficiently long time towards the composition of the crystals.
7.3 Outlook
So far the experiments have been concentrated on the crystal growth at different p-T
conditions for the phase diagram studies. However, there is a clear need for experiments
which can provide information on – how to grow bigger size crystals. The fact that GaN can
be synthesized as plates of a size up 100 mm2 [9] without internal seeding augurs well for the
possible chance to increase the size of (Al,Ga)N crystals. However, it still remains a huge
challenge. The limited crystal size in our study seems to be a result of kinetically controlled
complicated process. The experiments done with different dwell time showed that even
sufficiently long dwell time (10 days) almost does not affect the crystal size. The reaction
between liquid Ga and the graphite crucible at higher temperature (T~>1600 °C) was
observed which may be taken as possible limiting-size reason, since the Ga melt is filled up
with a graphite. Thus, one promising way may be the search of the suitable crucible materials
which do not contaminate the crystals and do not cause the uncontrolled secondary reactions.
For instance, pyrolytic BN or TaC are promising candidates. They are compatible with
(Al,Ga)N growth temperatures (TaC is successfully used in AlN bulk crystal growth [10]) and
characterized by low oxygen impurity.
A series of experiments should be also performed in order to address the apparent
difference between the values of ΔH0298 for AlN measured by various independent methods
and the aforementioned trend suggested by our thermodynamic studies. In any case, the
region for x≥0.86 is of particular interest and further studies are desirable.
92
Alternatively, the (Al,Ga)N synthesis can be performed also in a double atmosphere
autoclave (DAA), available in our lab. Our experiments showed that the (Al,Ga)N crystals
can be also grown at lower pressure and temperature conditions, for instance at 1 kbar and
1550 °C, which are technically feasible for DAA. This system can be used up to 3 kbar and,
more importantly, allows works with much larger crucible size (up to 10-15 cm3) than ones
used in HPSG.
The (Al,Ga)N single crystals form also the basis for extended investigations of optical and
electrical properties. However, in many cases it required larger crystals. Preliminary studies
[11] on the optical bandgap of Al0.86Ga0.14N crystals (on our largest crystals) using
femtosecond pump-probe spectrometry technique based on two photon absorption
autocorrelation measurements were already performed and large crystals of various Al content
are necessary for the further instigation of the optical bandgap and its evolution with Al
content as well as time-resolved dynamics of conduction electrons in (Al,Ga)N.
As mentioned in Chapter 5, more should be learned about the defects in the crystals and
their relation to growth parameters, crystal morphology etc. Many well-known techniques can
be applied. In particular, positron annihilation measurements (PAS) will contribute to the
knowledge about the nature and charge of defects, even for small-sized defects at low
concentration, or PL spectroscopy measurements will provide information about deep
impurity transitions.
Finally, besides an obvious advantage of the measurements of the physical properties of
the compositionally homogeneous and unstrained (Al,Ga)N compound , the understanding of
the crystal growth of ternary (Al,Ga)N, in a gas autoclave, is a novel and useful knowledge
that can be also explored for the growth of other ternary compounds.
Alternatively, the HPSG technique can be used for the growth of ternary (In,Ga)N
compounds. Adding even a small amount of In to GaN leads to an enhancement of light
emission in LEDs and Laser diodes. This phenomenon relates an enhancement effect is of
particular interest of many research groups and measurements on the strain-free (In,Ga)N bulk
crystals may substantial contribute to interpretation of such mechanism.
93

References:
[1] S. Porowski, I. Grzegory, M. Bockowski, B. Lucznik and P. Perlin, „High Pressure
GaN crystals on HVPE GaN seeds as substrates for laser diodes”, 6th International
Workshop on Bulk Nitride Semiconductors”, August 23-28 (2009), Galindia, Poland.
[2] H. Saitoh, W. Utsumi, H. Kaneko, and K. Aoki, Jpn. J. Appl. Phys. 43 (2004) L981-
983.
[3] P. Geiser, J. Jun, S. M. Kazakov, P. Wägli, L. Klemm, J. Karpinski, and B. Batlogg,
Appl. Phys. Lett. 86 (2005) 081908.
[4] P. Geiser, Dissertation 16126, ETH Zurich (2005).
[5] I. Grzegory, J. Phys. Condens. Matter. 14 (2002) 11055-11067.
[6] T. Hashimoto, E. Letts, M. Ikari, and Y. Nojima, „Improvement of crystal quality in
ammonothermal growth of bulk GaN”, 6th International Workshop on Bulk Nitride
Semiconductors”, August 23-28 (2009), Galindia, Poland.
[7] J. Karpinski, J. Jun, and S. Porowski, J. Cryst. Growth 66 (1984) 1-10.
[8] B. Hattendorf, Ch. Latkoczy, D. Günther, Analytical Chemistry (A-pages), 75 (2003)
341A-347.
[9] S. Krukowski, C. Skierbiszewki, P. Perlin, M. Leszczyński, M. Bockowski, S.
Porowski, Acta Physica Polonia B 37 (2006) 1265-1311.
[10] R. Schlesser, R. Dalmau, D. Zhuang, R. Collazo, Z. Sitar, J. Cryst. Growth 281 (2005)
75-80.
[11] J. Zhang, A. Belousov, J. Karpinski, B. Batlogg, R. Sobolewski, Femtosecond optical
spectroscopy of high-pressure grown AlxGa1-xN single crystals, EDISON16
Proceedings, Monpellier (2009), to be published in Journal of Physics.
94

Acknowledgements
Many people have contributed to this thesis, both, by making this an unforgettable chapter
of my life and, of course, in many cases scientifically, for which I hereby would like to thank
all of them.
First and foremost, I would like to thank my advisors Bertram Batlogg and Janusz
Karpinski, who encouraged me to grow, personally as well as academically, and shared their
great and worthwhile experience. Thank you both, Janusz, for your continuing guidance,
support and teaching on the crystal growth at high pressure and Bertram, for advising, sharing
a subtle knowledge and understanding in writing papers and substantial support in the final
stage of the work. Cordial thank to my co-examiner Dr. hab. Isabella Grzegory for the time
and effort it takes to referee my PhD thesis and her interest in this work.
I also would like to express my deepest gratitude to Jan Jun, whom I particularly indebt
and who enormously contributed experimentally to make this thesis possible.
Furthermore, I am extremely thankful to my collaborators from the “High Pressure
Materials Synthesis Group”, namely Nikolai Zhigadlo for his continuing help, encouraging
and support during this work, Sergiy Katrych for X-ray measurements on crystals (Chapter 4
and 5), Zbigniew Bukowski for fruitful discussions and exchanging of experiences.
Moreover, I would like to express my gratitude to our guests and friends, Krzysztof Rogacki,
Roman Puzniak and Andrey Mironov, who always teach me and helped to satisfy my greed
for knowledge and experience.
A very special thanks to Jie Zhang and Roman Sobolewski (Laboratory for Laser
Energetics, University of Rochester) for their fruitful collaboration, hospitality in Rochester
and performing the optical bandgap studies using a femtosecond, pump-probe spectrometry
technique discussed in Chapter 4. Furthermore, I would like to thank Kathrin Hametner and
Prof. Detlef Günther (Laboratory of Inorganic Chemistry, ETH Zurich) for the chemical
characterisations of my crystals using laser ablation inductively coupled plasma mass
spectrometry (Chapter 4 and 5). For the EDX measurements I am tremendously grateful to
Peter Wägli (Electron Microscopy ETH Zurich). The mechanical workshop staff of D-Phys,
Andreas Stuker, Bernhard Morath, Willy Staubli, Roy Hunziker, Kurt Jacob, Andreas
Mathys, Marcel Wachter are gratefully acknowledged for their excellent work and technical
support as well as Pierrot Dekumbis, Pierre Cohn for reliable and in time gas supply.
95
Moreover, I am especially indebted to Gaby Strahm for keeping the administrative things
going, organizing of aperos and social support. Additionally, I express my gratitude to Kurt
Mattenberger for advice and help in technical challenges.
Once more, very special Merci with all my soul to all member and associates of the “High
Pressure Materials Synthesis Group”, the “Physics of New Materials Group” and “Optical
spectroscopy Group” for their advices and invaluable help. I also would in particular like to
thank Simon Hass, Kurt Pernstich and Florian Pfuner- I can only say, thank you, “es war eine
tolle Zeit mit Euch”.
Finally, I would like to thank my Violeta, Roger Kirchhofer, my brother Sasha and
especially my mother for their constant support und understanding.
96

List of publications
[1] Andrey Belousov, S. Katrych, J. Jun, J. Zhang, D. Günther, R. Sobolewski, J. Karpinski,
and B. Batlogg, J. Cryst. Growth, 311 (2009) 3971-3974.
[2] Andrey Belousov, S. Katrych, K. Hametner, D. Günther, J. Karpinski and B. Batlogg,
AlxGa1-xN bulk crystal growth: crystallographic properties and p-T phase diagram,
(2010) submitted to J. Cryst. Growth.
[3] Andrey Belousov, J. Karpinski and B. Batlogg, Thermodynamics of the Al-Ga-N2
system, (2010) submitted to J. Cryst. Growth.
[4] S. Wu, J. Zwang, A. Belousov, J. Karpinski, R. Sobolewski, Ultra-Long-lived coherent
acoustic phonons oscillations in GaN single crystals, Phonons 2007, Journal of Physics:
Conference Series 92 (2007) 012021.
[5] S. Wu, J. Zwang, A. Belousov, J. Karpinski and R. Sobolewski, Dynamics of intervalley
transitions and propagation of coherent acoustic phonons in GaN single crystals studied
by femtosecond pump-probe spectroscopy, Gallium Nitride Materials and Devices III,
ed. by H. Morkoc, C. W. Litton, J.I. Chyi, Y. Nanishi, and E. Yoon, Proc. of SPIE,
6894, San Jose (2008), 68940K.
[6] J. Zhang, A. Belousov, J. Karpinski and Roman Sobolewski, Propagation of multiple
coherent-acoustic-phonon transients in GaN single crystals, 1st International Symposium
on Laser Ultrasonics: Science, Technology and Applications, Montreal, Canada (2008).
[7] J. Zhang, A. Belousov, S. Katrych, J. Jun, J. Karpinski, B. Batlogg and R. Sobolewski,
Femtosecond pump-probe characterization of high-pressure grown AlxGa1-xN single
crystals, Gallium Nitride and Devices IV, edited by H. Morkoc, Proc. of SPIE, Vol.
7216, San Jose (2009) 721623-1.
99

[8] J. Zhang, A. Belousov, J. Karpinski, B. Batlogg, R. Sobolewski, Femtosecond optical
spectroscopy of high-pressure grown AlxGa1-xN single crystals, EDISON16
Proceedings, Monpellier (2009), to be published in Journal of Physics.
[9] J. Zhang, A. Belousov, J. Karpinski, B. Batlogg, R. Sobolewski, Femtosecond optical
spectroscopy studies of high-pressure-grown AlxGa1-xN single crystals, in progress,
(2010) will be submitted to APL.
100


![]-Xn¸v - Mappila Heritage Library...]-Xn¸v - Mappila Heritage Library ... 16](https://static.fdocuments.in/doc/165x107/60822129acc4b43102028aea/-xnv-mappila-heritage-xnv-mappila-heritage-library-16-.jpg)