Right to participate Midsona Always on the way · Midsona Always on the way 3 The year in brief 4...
116
Midsona Always on the way ANNUAL REPORT 2016
Transcript of Right to participate Midsona Always on the way · Midsona Always on the way 3 The year in brief 4...

MidsonaAlways on the way
3 The year in brief
4 This is the image of strong brands
6 A journey. A team.
8 This is Midsona
9 Financial targets
11 A word from the CEO
14 Together towards the objective of becoming the Nordic leader
16 Midsona’s business model
19 Trends and external development
24 Leading brands are the foundation
28 High innovation creates advantages
30 Systematic and proactive sales
33 Careful quality work
34 Business areas
36 Targeted sustainability
40 A healthy and sustainable culture
48 Shares and shareholders
52 Administration report
56 Financial statements
62 Notes to the financial statements
91 Board of Directors’ statement of assurance
92 Audit report
95 A word from the Chairman of the Board
96 Corporate Governance Report
102 Board of Directors
104 Group Management
106 Five-year overview
108 Definitions
111 Why Midsona’s shares are attractive
MID
SONA 2016
Information about the Annual General MeetingThe Annual General Meeting of Midsona AB (publ) will be held on 26 April 2017 at 3.00 p.m. at Malmö Börshus, Skeppsbron 2, Malmö, Sweden. Registration of voting rights will commence at 2.00 p.m. Before the meeting, the Company will offer light refreshments.
Right to participateTo be entitled to participate in the Annual General Meeting, shareholders must be included in the share register maintained by Euroclear Sweden AB no later than 20 April 2017, and shall have registered their intention to participate by 20 April 2017 at 4.00 p.m. at the latest.
Shareholders whose shares are nominee registered must temporarily re-register the shares in their own name at Euroclear Sweden AB in order to be permitted to participate in the meeting. Such registration must be completed by 20 April 2017 at the latest and should be requested of the nominee in good time before this date.
Notification of participationNotification can be submitted in writing to Midsona AB, c/o Fredersen Advokatbyrå AB, Turning Torso, 211 15 Malmö, by email to: [email protected] should include the name, address, personal or corpo-rate identity number, daytime phone number of the participant and, if applicable, the number of assistants (maximum two). Admission cards will be distributed a few days before the meet-ing and shall be presented at the entrance to the meeting.
DividendThe Board has decided to propose to the Annual General Meeting that a dividend of SEK 1.10 per share be paid for the 2016 financial year.
Midsona Sverige ABwww.midsona.se
Dockplatsen 16Postal address: Box 50577SE-202 15 Malmö Tel: +46 40 660 20 40
Midsona Norge ASwww.midsona.no
Verkstedveien 1Postal address: PB 144 SkoyenNO-0212 Oslo, Norway Tel: +47 24 11 01 00
Midsona Finland Oywww.midsona.fi
Perintötie 2 C 4 KRSFI-01510 VantaaTel: +358 20 743 47 55
Midsona Denmark A/Swww.urtekram.dk
Klostermarken 20DK-9550 Mariager, DenmarkTel: +45 9854 2288
Midsona AB (publ)www.midsona.com
Dockplatsen 16Postal address: Box 21009SE-200 21 Malmö Tel: +46 40 601 82 00 [email protected]
Contents
A N N U A L R E P O R T 2 0 1 6

The acquisition of Kung Markatta AB in 2016 – with the leading organic brand Kung Markatta – further strengthens Midsona position in the Nordic market for organic food.
Kung Markatta and the Norwegian brand Helios complements in an excellent way Midsona brands, primarily the organic brand Urtekram acquired, 2015. After the acquisition is Midsona market leader in organic groceries in all Nordic markets: Sweden, Denmark, Norway and Finland.
Internatural AB had sales of SEK 637 million in 2015, of which approximately 64 percent in Sweden and 36 percent in Norway. Internatural has a broad and well-established line of organic, dairy-free
and natural foods. The product portfolio includes over 1,200 products, of which about 450 of them comprises of the own brands Kung Markatta and Helios. Innova-tion culture is strong, in 2016 introduced over 60 new products in its own brands. The product portfolio is extensive and also includes other innovative products envi-ronmentally friendly cleaning products, hygiene products, beverages and lactose and gluten-free products.
Here comes the King!

The year in brief
▶ Through the acquisition of Internatural AB with the brands Kung Markatta and Helios, Midsona will become a Nordic leader in organic foods. Internatural had sales in 2015 of ap-proximately SEK 637 million with an EBITDA of SEK 65 mil-lion. The acquisition was completed on 5 July. The purchase consideration was SEK 810 million on a debt-free basis.
▶ As part of the financing of the acquisition of Internatural AB, a new share issue of approximately SEK 412 million was carried out, which was oversubscribed.
▶ On October 17, Midsona Norge AS acquired the Norway AS brand Biopharma from Biopharma AS. The Biopharma product line consists of a number of dietary supplements that are sold in supermarkets and grocery shops in Norway and had sales of approximately NOK 30 million in 2015.
▶ The positive trend for organic food continues and now amounts to between 9 and 10 percent of the total food market in both Denmark and Sweden. Following the acqui-sition of Internatural, organic food accounts for about half of Midsona sales.
▶ The rate of innovation in Urtekram has remained high. A major trend is coconut, with which Urtrekram been at the forefront in both in food and bodycare products.
▶ Friggs corn cakes showed great success in all markets during the year. During the year, several new flavours were added, such Superfrö, Havssalt, Pizza and BBQ.
▶ Dalblads has launched two flavours of Protein Coconut Water, a drink with a high protein content for exercise
recovery, Sport fizzy vitamin tablets in two flavours and additional flavours of the popular Swebar.
▶ Naturdiet Shakes has launched two new flavours: Shake Cookies & Cream and Shake Mint Chocolate. Naturdiet Mealbars are available in two new flavours:Salty Caramel and Raspberry Liquorice.
▶ The Group signed a financing agreement with Danske Bank for loans totalling SEK 425 million. The agreement also includes a complete solution for cash management for the entire Nordic region. Overall, this provides a Group struc-ture where capital is more effectively utilised, leading to lower costs.
▶ Group Management was strengthened with the addition of two people. In September, Anders Dahlin, CEO of the acquired company Internatural AB, entered the role of Director Nordics, with responsibility for the Group’s busi-ness areas in Sweden, Denmark, Norway and Finland. Earlier this year, Ulrika Palm took over as Head of Midsona Sweden. For a complete list of Group Management, see pages 104-105.
▶ Ola Erici was appointed Chairman of the Board and Kirsten Ægidius was elected as Board Member. For a complete list of the Board of Directors, see pages 102-103.
Significant events after the end of the year
▶ Tobias Traneborn was employed as new Supply Chain Man-ager. Tobias will begin the position in the first half of 2017 and will be included in the Midsona Group.
Total sales SEK 1,744 million (1,174)
Finland 9% (9)
Sweden 40% (33)Denmark 24% (24)
Norway 27% (34)
Net sales (SEK million) Net sales growth (%)
20120 –20 %
600
300
900
1,500
1,200
1,800 50 %
40 %
30 %
20 %
10 %
0 %
–10 %
2013 2014 2015 2016
EBITDA (SEK million) EBITDA margin (%), before non-recurring items
20120 4 %
5 %
60
30
90
120
150 10 %
9 %
8 %
7 %
6 %
2013 2014 2015 2016
Operating profit, EBIT (SEK million) Operating profit before non-recurring items
20120 4 %
5 %
40
20
60
80
120 10 %
8 %
9 %
7 %
6 %
2013 2014 2015 2016
100
Earnings per share (SEK) Pay-out ratio (%)
20120 0 %
1
2
3 120 %
100 %
60 %
80 %
40 %
20 %
2013 2014 2015 2016
0
20
60
40
100
80
2012 2013 2014 2015 2016
Cash flow (SEK million)from continuing operations
M I DSONA – ANNUAL REPORT 2016
The year in brief—3

Midsona’s success builds on developing and acquiring competitive brands.
This is the image of strong brands

UrtekramKung MarkattaFriggs HeliosDalbladsNaturdietTri TolonenMiwana
SupernatureMyggA SomaElivoNutanaDrop-itFästinGVitalasCatzyRene Hender BiopharmaSano
Alpro di Asiago AtkinsA. Vogel Biotta Clipper EfalexEfamolEsberitoxGetraw GlucosanolHari Tea LiposinolNature’s SunshineRemifemin Rice Dream Rigoni RFSUPhilips AventSalusTartex Udo’s Choice Uvicur Yogi Tea
A selection of proprietary brands
A selection of represented brands
Preferred brands

One journey .Midsona is embarking on an important and exciting journey. In a short time, the journey picked up extra speed through larger acquisitions; Danish Urtekram and Internatural with the Swedish Kung Markatta and Norwegian Helios. We have increased the number of employees and expanded operations, including with our own production. Together, we are building a Midsona team that share sustainable values, prepared to be even stronger and faster in order to achieve our goal of being the leading company in health and well-being in the Nordic region.
M I DSONA – ANNUAL REPORT 2016

One journey . One team.With Urtekram, Kung Markatta and Helios onboard, will are continuing our exciting and successful journey. We have established strong market positions in all Nordic countries, notably by continuing to build and develop a variety of strong brands, not least through continuous product innovations. Our journey will now continue as we strengthen our position in the Nordic market and will soon begin looking at how the journey can continue outside the Nordic region.
M I DSONA – ANNUAL REPORT 2016

Midsona develops, produces and markets products that make it easier for people to make their own contribution to a healthier everyday life. The Company’s vision is to be the Nordic leader in health and well-being.
A Nordic company The acquisition in 2016 of Internatural, with the strong organic brands Kung Markatta and Helios, is a natural progression building on the acquisition of Danish Urtekram dur-ing 2015. Midsona now has very strong positions in the Nordic region. The acquisition also opens up opportunities for Midsona in Europe.
Strong brands with a focus on organicMidsona focuses on developing and marketing powerful brands. Operations are based on a portfolio of proprietary brands plus international clients’ brands which we represent in all or parts of the Nordic region. The proprietary brands form the backbone of the opera-tions and, together with client brands, they form a strong and broad brand portfolio that is marketed both through various sales channels and to end-consumers.
Midsona has chosen to prioritise eight selected brands: Urtekram, Kung Markatta, Friggs, Helios, Dalblads, Naturdiet, TriTolonen and Miwana.
High growth ambitions Midsona’s growth target is to grow by more than an average 10 percent annually through a mix of organic and acquisition-driven growth, as well as through new partnerships or alliances.
Initiative in the rapidly growing organic market The acquisition of Internatural and Urtekram involve a significant presence in the rapid-ly-growing markets for organic products. According to Ekoweb, organic foods accounted for 8 percent of the total food market in Sweden following growth of 18 percent in 2016.
Organic is a big category (about EUR 25 billion in Europe) with rapid growth, especially in Midsona’s main markets in the Nordic region. The forecast for the average growth for organic food in Europe is more than 10 percent annually during the period 2016-2020.
In Denmark, organic foods accounts for 9 percent of the food market and growth in 2016 was 18 percent. In Finland and Norway too, growth was significantly greater than for the market as a whole. The total world market is growing by about 10 percent, limited by access on to raw materials. The European market for organic bodycare products is grow-ing by about 10 percent and the Nordic market for gluten-free products by approximately 30 percent (source: Ekoweb).
This is Midsona
VisionLeading the Nordic
region in health and well-being.
MissionWe contribute to
helping people achieve a healthier life.
M I DSONA – ANNUAL REPORT 2016
8—This is Midsona

Growth: More than 10 percent on average The growth target is to be achieved by focusing on the vision and strategies that have been set out. Growth will be achieved organically, through acquisitions and through new partnerships or alliances. For the long term, the target entails Midsona expecting to grow significantly faster than the underlying market’s growth of 2–4 percent annually.
Goal completion: 49 percent, mainly linked to the acquisition of Internatural.
EBIT margin: More than 10 percent The target has been set to be able to develop the operations in the long term and to provide a stable return to shareholders. As a focused-brand Company, Midsona achieves economies of scale in all functions, from purchasing to sales, which will strengthen the EBIT margin. In addition, an improved product mix is expected to affect the margin posi-tively. Synergies from implemented and future acquisitions are also expected to increase the EBIT margin.
Target achievement: 6.3 percent before non-recurring items.
Net debt/EBITDA: A multiple of less than 2 The target links borrowing to earnings capacity and has been set to define a reasonable level of risk. The target is to be achieved through active but responsible investments and a clear focus on operating cash flow.
Target achievement: 6.2. Periodically, the ratio between net debt and EBITDA on a rolling 12-month basis can be significantly higher than the target during the period following an acquisition, since the result of the acquisition have yet to reach full impact.
Dividend: At least >30 percent of profit after tax The target is a well-considered proportion that provides shareholders with a reasonable return while ensuring that the Company has the funds necessary to develop its opera-tions aggressively.
Target achievement: The Board’s proposal of SEK 1.10 corresponds to just over 100 per-cent, meaning that the dividend target has been surpassed over the past four years.
Financial targets
–20
–10
0
50
20
10
30
40
2012 2013 2014 2015 2016
Growth (%)
0
20
40
120
60
80
100
2012 2013 2014 2015 2016
Dividend (%)
0
1
2
7
3
4
5
6
2012 2013 2014 2015 2016
Net debt/EBITDA
0
2
4
8
6
2012 2013 2014 2015 2016
EBIT margin (%)
M I DSONA – ANNUAL REPORT 2016
financial TargeTs—9

M I DSONA – ANNUAL REPORT 2016

A word from the CEOOur successful journey continues
M I DSONA – ANNUAL REPORT 2016

T he year 2016 was a successful year for Midsona. We strengthened our position in our home markets and currently have a broad and strong presence in all Nordic countries and are definitely among the leading competitors within health and well-being in the Nordic region. The acquisition during 2016 of Internatural with the brands Kung Markatta and Helios provides an excellent complement to the
organic brand Urtekram, which we acquired during 2015. In the summer of 2015, Midsona had an annual revenue of over SEK 900 million. We
started a journey which entailed doubling annual sales to approximately SEK 1.8 billion during 2016, with a significant improved underlying profitability. The journey has been made possible because we have, in a focused way, implemented our strategy. In recent years, we have made two major strategic moves. Firstly, we have gradually focused opera-tions against growing segments within three primary categories: organic, health food products and OTC/supplements. In practice this means that we have shifted the product portfolio towards segments with higher growth. Organic, which shows double-digit global market growth, currently accounts for about 50 percent of our sales. Two years ago, that figure was 1 percent! In addition, we have worked to be more cost effective internally, in-cluding by carefully exploiting synergies from acquisitions, reducing capital and adjust-ing internal organisational structures.
Sales in 2016 grew by 49 percent, mainly due to acquisitions, but the Group’s eight priority brands contributed with 8 percent growth. EBITDA before non-recurring items increased to SEK 134 million (87).
The acquisition of Internatural is strategically importantWith the acquisition of Internatural in the summer of 2016, we became the market leader in organic colonial products in Sweden with Kung Markatta, and in Norway with Helios. Through Urtekram, we were already the market leader in the segment in Denmark and Finland.Thus, we have established ourselves as the Nordic market leader in a market that has shown strong growth and that, in our view, will continue to grow.
In the autumn, we have started the work to integrate Internatural into Midsona’s oper-ations. Work has progressed according to plan and we stand by our commitment to attain SEK 25 million in administrative synergies by the end of 2017. Another SEK 10 million will be achieved through joint purchasing, relocation of the production of parts of the prod-uct range of King Markatta and Helios, to its own factory, and coordinated logistics. These synergies will be realised starting from the end of 2017.
Better integration provides more efficient launchesMidsona is today a more integrated company with several product lines, brands and processes that cross borders. The launch of Friggs’ corn cakes is one of the best examples of this and an effort we are very proud of. The launch was initiated in Sweden in late autumn 2015 and was taken further in 2016 to the other Nordic countries, and it is a great success in Sweden, Norway and Finland.
Friggs is one of our eight priority brands, which together account for the bulk of Mid-sona’s revenue, all of which experienced stronger development in 2016. Overall growth for the eight brands was 8 percent during the year. During the fourth quarter, growth was 11 percent.
A continued strong health trendThe basis for Midsona’s positive development is that the interest in health has never been greater. A growing number of consumers have begun to change their diet in favour of foods that are good for themselves, their families and the environment. Being careful
M I DSONA – ANNUAL REPORT 2016
12—a word froM The ceo

about what you eat and combining it with exercise is a strong underlying trend. Organic products continue to develop very strongly, not least in Sweden, which also applies to the segment called “free-from”. Another trend is the increasing interest in herbal products.
These trends reinforce the main part of Midsona brands. The majority of our products are herbal, around half of which are organic. In the market, there is also good growth in the segment for different types of prepared meals, where we currently have products from Urtekram and Nutana. This is a part of the portfolio that we want to develop further.
Starting to look outside the Nordic regionWe have now also begun to look at markets outside the Nordic region. We already have some exports to countries in Europe, primarily through Urtekram. Export sales have de-veloped very positively in 2016, but still account for a relatively small share of total Group sales. For us to go all the way, I believe that it is necessary that we make at least one ac-quisition. It is a long and exciting journey with great potential. We do not rule out further acquisitions in the Nordic region, but today the Nordic market is more consolidated.
The acquisitions that we will possibly carry out – whether they occur in or outside the Nordic countries – will be within our three main categories: organic, which today accounts for half of our sales, health food, with about a third of our sales, or dietary supplements and OTC, which make up the rest.
Sustainability work starts from within In autumn 2016, we began sustainability efforts throughout the Group. Being a responsi-ble company and communicating this to our stakeholders is becoming increasingly important. There is a strong relationship between customer and consumer interest in organic products and sustainability. Midsona products are the foundation of our sustaina-bility efforts, as they help to help people achieve a healthier life.
At the beginning of 2017 we will set specific sustainability goals.
Together towards our goalsMidsona has in recent years undergone major structural changes in our journey to be-come the leading company in health and well-being in the Nordic region. We would never have been where we are today if it were not for all the dedicated employees. They work hard and live very much in accordance with our mission to help people achieve a healthier life. We have, therefore, chosen to highlight a number of our dedicated employees in the Annual Report. They represent all the inherent power of Midsona.
During 2017, we continued to work with our prioritised brands and develop them with new, innovative products, by quickly reacting to changing trends. We will continuously take our existing brands into new growth segments, as well as continue to acquire and create strategic alliances
I look forward with great enthusiasm to continue to lead Midsona on its successful journey.
Malmö, March 2017
Peter ÅsbergPresident and ceo
M I DSONA – ANNUAL REPORT 2016
a word froM The ceo—13

With the goal to become the Nordic leaderWith a well-defined strategy, focusing on growth, Midsona in recent years streamlined to-wards developing and marketing products that help improve health and well-being. Mid-sona has a stated goal to drive growth by further developing existing and new proprie-tary brands and continuously seeking complementary acquisitions.
The effects of acquisitions as a tool for growth have been especially evident in 2015 and in 2016. The two recent acquisitions by Internatural (2016) and Urtekram (2015) have taken Midsona a major step closer to its vision of becoming the Nordic leader in health and well-being.
Midsona continuously assesses Nordic companies with complementary product seg-ments and clear cost and growth synergies. Through careful analysis, a clear acquisition agenda and a well-developed process of integration, the Company has in recent years implemented planned synergies in all acquisitions. The acquisitions have contributed to building a stronger Midsona with the aim of leading the ongoing market consolidation.
Several positive effects from the acquisition of Internatural 1 Continued establishment in the attractive growth market of organic food 1 An enhanced product portfolio 1 Strengthened position in the Swedish and Norwegian markets1 Synergies in coming years are expected to have an annual effect of about SEK 35 mil-
lion on EBITDA, of which about SEK 25 million is expected before the end of 20171 Strong financial profile, primarily through a stronger cash flow
Acquisitions 2012–2016
Year Company Country Sales* Products
2012 Nordsveen AS Norway NOK 74 million Health and well-being
2012 Dalblads Nutrition AB Sweden SEK 51 million Sports nutrition
2013 Supernature AS Norway NOK 49 million Superfoods
2013 Elivo** Finland EUR 1.3 million Dietary supplements, skin care and intimate care
2014 Soma Nordic AS Norway NOK 51 million Organic healthfoods
2015 Urtekram Intl A/S Denmark DKK 368 million Organic foods and bodycare products
2016 Internatural AB Sweden SEK 637 million Organic food
2016 Biopharma** Norway NOK 30 million Dietary supplements
* Most recent annual earnings at time of acquisition** Trademark Acquisition
M I DSONA – ANNUAL REPORT 2016
14—wiTh The goal To becoMe The nordic leader

" Its important that we take advantage of our product development."– Kirsi Kaikko, Brand Manager, Midsona Finland
What is the best trip you’ve made?I spent six months travelling around Australia in the winter of 2013/2014. A fantastic trip.
What is the biggest challenge for the future of Midsona’s journey?It is important to find the way to success for our organic brands and also to allow each brand to find its own expression. All the brands are fantastic, but we have to work with them without losing the leverage they have right now.
What are the biggest opportunities for Midsona?Creating a powerful ecological approach to our fan-tastic organic brands. It is also important that we take advantage of our product development in our other brands and create new popular categories. Analyse trends and brands to support the development of markets, perhaps something completely new, outside of our existing products. Maybe it’s something that has to with measuring our well-being …

The core of Midsona’s operations is our mission to contribute to helping people live healthier lives. To live up to this mission, Midsona closely follows how current trends in the area are re-inforced or weakened, and how new trends arise.
The trends are analysed carefully so that the Company can develop various opportunities to meet changing consumer needs and new ones. The result is that Midsona continuously devel-ops, acquires and nurtures successful brands with strong market positions and chooses the best channel strategy for each product.
Midsona’s vision is to become the Nordic leader in health and well-being, a vision that the Company is very close to achieving.
Midsona’s business model
MissionTrend
s and needs
Intel
ligenc
e
Brand development and care Channel strategy
16—Midsona’s business Model
M I DSONA – ANNUAL REPORT 2016
Healthy and sustainable cultureMidsona has products that contribute to helping people achieve a healthier life, and we strive to promote healthy ideals, both in-ternally and externally. We want to further develop our position as the expert in health and well-being in our markets. Our brands and products obviously play a key role in this work.
Being sustainable is becoming increasingly important, and our consumers are continually placing increasing demands on us. There is a strong relationship between customer and con-sumer interest in organic products and interest in sustainability and environmental issues, and we are now getting a lot more consumer questions specifically about our sustainability efforts, compared with a few years ago. From 2017, we will report on our sustainability efforts.
During the autumn of 2016, a process was started to formu-late a value-oriented sustainability strategy, which at the begin-ning of 2017 will lead to concrete goals that we will monitor and evaluate. In 2016, among other things, Midsona has:� Initiated fundamental, structured efforts towards setting up
a sustainability strategy with concrete targets.� Made preparations to, in early 2017, submit a separate status
report that initially focuses on describing the aim and scope of our future sustainability work.
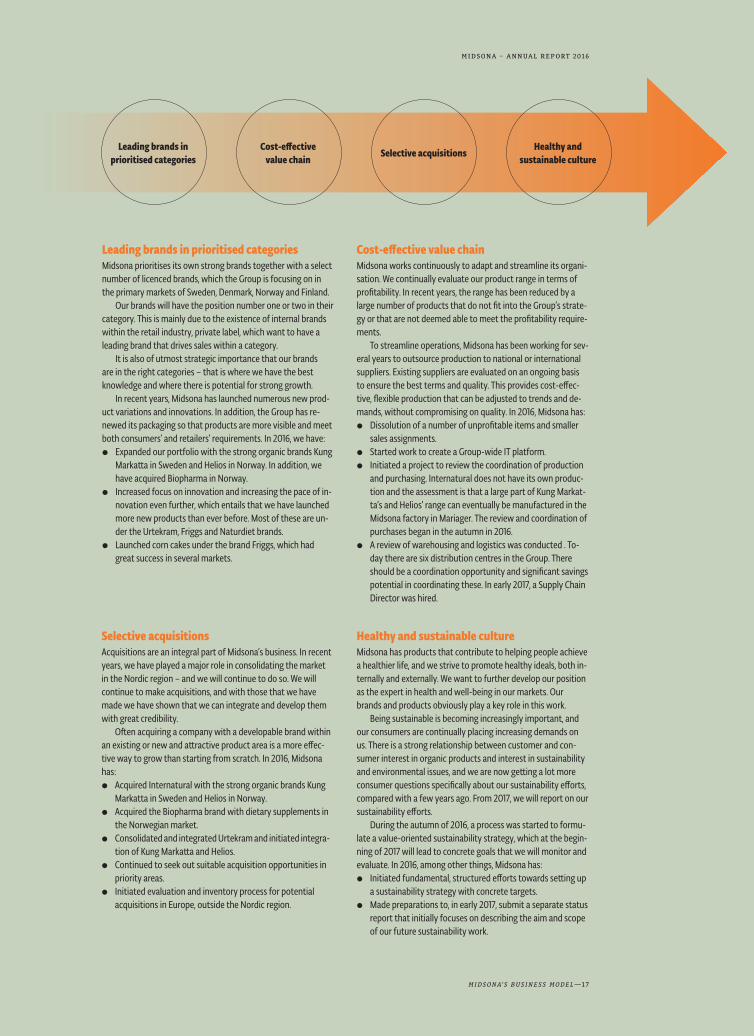
Selective acquisitionsAcquisitions are an integral part of Midsona’s business. In recent years, we have played a major role in consolidating the market in the Nordic region – and we will continue to do so. We will continue to make acquisitions, and with those that we have made we have shown that we can integrate and develop them with great credibility.
Often acquiring a company with a developable brand within an existing or new and attractive product area is a more effec-tive way to grow than starting from scratch. In 2016, Midsona has:� Acquired Internatural with the strong organic brands Kung
Markatta in Sweden and Helios in Norway. � Acquired the Biopharma brand with dietary supplements in
the Norwegian market. � Consolidated and integrated Urtekram and initiated integra-
tion of Kung Markatta and Helios.� Continued to seek out suitable acquisition opportunities in
priority areas. � Initiated evaluation and inventory process for potential
acquisitions in Europe, outside the Nordic region.
Leading brands in prioritised categoriesMidsona prioritises its own strong brands together with a select number of licenced brands, which the Group is focusing on in the primary markets of Sweden, Denmark, Norway and Finland.
Our brands will have the position number one or two in their category. This is mainly due to the existence of internal brands within the retail industry, private label, which want to have a leading brand that drives sales within a category.
It is also of utmost strategic importance that our brands are in the right categories – that is where we have the best knowledge and where there is potential for strong growth.
In recent years, Midsona has launched numerous new prod-uct variations and innovations. In addition, the Group has re-newed its packaging so that products are more visible and meet both consumers’ and retailers’ requirements. In 2016, we have: � Expanded our portfolio with the strong organic brands Kung
Markatta in Sweden and Helios in Norway. In addition, we have acquired Biopharma in Norway.
� Increased focus on innovation and increasing the pace of in-novation even further, which entails that we have launched more new products than ever before. Most of these are un-der the Urtekram, Friggs and Naturdiet brands.
� Launched corn cakes under the brand Friggs, which had great success in several markets.
Cost-effective value chainMidsona works continuously to adapt and streamline its organi-sation. We continually evaluate our product range in terms of profitability. In recent years, the range has been reduced by a large number of products that do not fit into the Group’s strate-gy or that are not deemed able to meet the profitability require-ments.
To streamline operations, Midsona has been working for sev-eral years to outsource production to national or international suppliers. Existing suppliers are evaluated on an ongoing basis to ensure the best terms and quality. This provides cost-effec-tive, flexible production that can be adjusted to trends and de-mands, without compromising on quality. In 2016, Midsona has: � Dissolution of a number of unprofitable items and smaller
sales assignments. � Started work to create a Group-wide IT platform. � Initiated a project to review the coordination of production
and purchasing. Internatural does not have its own produc-tion and the assessment is that a large part of Kung Markat-ta’s and Helios’ range can eventually be manufactured in the Midsona factory in Mariager. The review and coordination of purchases began in the autumn in 2016.
� A review of warehousing and logistics was conducted . To-day there are six distribution centres in the Group. There should be a coordination opportunity and significant savings potential in coordinating these. In early 2017, a Supply Chain Director was hired.
Leading brands in prioritised categories
Cost-effective value chain
Selective acquisitionsHealthy and
sustainable culture
Midsona’s business Model—17
M I DSONA – ANNUAL REPORT 2016

" We will continue to stay one step ahead in the healthy products arena."– Petra Månsson, Business Team Manager, Midsona Sweden
What is the best trip you’ve made?I have many wonderful memories of my trip to Florida with the family two years ago. We drove to Florida’s southern tip and visited Key West, went of an alligator safari in the Everglades and watched dol-phins swim in the ocean on Captiva Island on the west coast. We also made a stop at Disney World in Orlando, which was the highlight for the children. Florida offered our family a wonderful mix of activities and memo-ries for life – both big and small!
What is the biggest challenge for the future of Midsona’s journey?As with many other companies and industries, the digital evolution determines the road forward. An im-portant question is how we will, in the future, manage the transition from traditional sales channels of phys-ical shops, to e-commerce.
What are the biggest opportunities for Midsona?To continue to be a step ahead in offering healthy products tailored to consumer needs. Global health trends such as organic and natural raw materials will be of increasing interest for the consumer main-stream. demand will continue to increase for good products that also do good.

Trends and external developmentPicking up early on trends and changes in consumer behaviour is fundamental to how Midsona can help make it easier for people themselves to contribute to a healthier life. It requires knowledge of trends, consumer behaviour and of how different products can contribute to a healthier life. Midsona has well-developed methods and processes to actively monitor the outside world, discover new trends early and apply this knowledge to the development of products that meet consumer needs.
0
25
50
100
75
2010 2011 2012 2013 2014 2015 2016 2017 2018 2019 2020
European health and wellness market (EUR billion)2010A–2020F. Source: Midsona.
� Total market value� Share of organic products
Better health is a global challenge Overall, Midsona’s products currently benefit from continued growing interest in how food choices affect human health. Health and well-being are linked to development, prosperity and growth. In keeping with growing prosperity and rapid urbanisation, the proportion of the population able to pursue a modern lifestyle is increasing. At the same time, there is increasing recognition of the value of a balanced diet, as well as the willingness to pay for various health products. These trends have a positive effect on Midsona’s market, particu-larly the trend of increased willingness among individuals to invest in their own health.
Interest in health and well-being can be broken down into several trends that guide consumption patterns, for example, the desire to live an active life, the rise of the organic and the sustainable, for products to be natural, fresh and preferably locally produced, and free from additives.
M I DSONA – ANNUAL REPORT 2016
Trends and exTernal develoPMenT—19

We are what we eat Increased awareness of the importance of food manifests itself partly in the form of an increased distrust of processed foods, as well as an increased interest in the origins of raw ingredients, what food contains and what a balanced and healthy diet entails.
In 2016, the research company Nielsen presented a comprehensive international study, “The Nielsen Global Health and Ingredient-Sentiment Survey” in which 30,000 consumers from 63 countries responded to questions about food and health.
The survey initially concluded that there are four general social trends that contribute to an increased focus on health and well-being:
1 aging population1 increasing proportion of chronic diseases1 increase in self-care and prevention1 increasingly educated consumers
Sensitivity to certain foods affect choices. Almost two-thirds of respondents say they follow a diet that limits or prohibits the use of certain foods or ingredients.
The responses show that many consumers are cutting back on certain unhealthy foods, particularly those high in fat, sugar or sodium, and that they focus on simple in-gredients and fewer processed foods. More than half say they avoid artificial ingredients, hormones, antibiotics and genetically modified organisms (GMOs). The survey shows that there is a clear opportunity for food companies to meet consumer needs in an even better way. Among those who said they are sensitive to a food product or follow a special diet, less than half said they think their needs are fully met by the current product offerings.
The survey also says that chronic diseases are expected to account for 73 percent of deaths globally by the year 2020, an increase from about 60 percent in 2001. Medical experts agree that these diseases are largely preventable and that food choices play a key role in this process.
Consumers are taking a more active role in their care. Of the respondents in the Nielsen survey, 70 percent said they actively make food choices to prevent obesity, diabetes, high cholesterol and high blood pressure.
Choice of brands strengthen one’s personal brandFood and drink will increasingly contribute to create or strengthen one’s personal brand. Choosing organic foods creates an image that what you eat is healthy and good for the planet. The personal branding trend also encompasses what shops one chooses. Shops such as Whole Foods in the United States, Paradiset in Södermalm in Stockholm and Green Matmarknad in Malmö emphasise a certain lifestyle, which is a form of consumer identity.
Nordic consumers are generally trend-sensitive and thus pioneers who embrace new trends early. Sustainability and organic products in particular are an especially powerful trend in the Nordic region. In Sweden, the market for organic foods increased by 18 per-cent in 2016, to over SEK 25 billion. For Denmark, the equivalent rate is estimated to be 18 percent, which is significantly higher than the global growth rate of about 10 percent for organic foods.
According to Nielsen, six out of ten Swedes are willing to pay more for organic prod-ucts and natural ingredients, while five out of ten are willing to pay more to avoid artifi-cial colouring and flavouring. The organic trend is increasing. Half of Swedish consumers choose to always, or often, buy organic.
M I DSONA – ANNUAL REPORT 2016
20—Trends and exTernal develoPMenT

In Urtekram’s home market of Denmark, organic foods account for about 9 percent of the food market – the highest figure in the Nordic countries. However, Sweden is the fastest- growing market. In Norway, the organic market is growing rapidly, albeit from low levels.
Increased interest from the retail sector The increased interest in products related to health and well-being has stimulated the retail sector’s interest in this area. The key channels to consumers are supermarkets, healthfood retailers, pharmacies, and e-commerce sites.
Supermarkets, with their major consumer flows, continue to increase their sales of non-prescription drugs. In the FMCG retail sector, supermarkets and grocery shops have an increasing amount of proprietary organic products, which they are marketing exten-sively. This is also expected to increase in importance in line with the increasing share of sales from healthfoods among products for health and well-being.
Pharmacies in the Nordic region are increasing their sales of non-prescription prod-ucts that promote health and well-being. The strength of the pharmacies lies in their mix of pharmaceutical knowledge and broad expertise in health.
Healthfood retailers have undergone a process of consolidation in recent years. They see active consulting as an important part of this offering. This attracts groups that are early to adopt lifestyle trends and make informed choices.
Growth projections in other categories:
1 Public health food/functional foods: Determined to show good growth in Europe over the coming years.
1 Sports Nutrition: The category is strong and is expected to continue to grow over the next five years, driven by the continuously growing interest in fitness and exercise.
1 Weight control: Weak growth in Europe historically and weak growth forecast. Negative growth in the Nordic countries in recent years and no indications that this pattern will be broken.
1 Cosmeceuticals: Bodycare products and cosmetics with purported health benefits. This product group is expected to show good growth in Europe over the next five years.
Urtekram’s Italian Fettuccine is made of 100 percent Italian durum wheat and local spring water from the Dolomites, manufactured by Pastificio Felicetti srl, which was established in 1908 in Predazzo in the heart of the Valle di Fiemme. The Felicetti family has been producing traditional Italian pasta for four generations.
M I DSONA – ANNUAL REPORT 2016
Trends and exTernal develoPMenT—21

The Swedes are the most positive towards organic products among the Nordic countriesIn a survey by the global research firm Nielsen and published by Land Lantbruk, Swedish consumers came in at the top regarding the desire to include organic food in their diet. 57 percent say they want organic foods to be included in their diet, which is the highest percentage among the Nordic countries. Swedish consumers prefer to avoid hormones and antibiotics. GMO and synthetic substances are also high on the list of substances to be avoided.
The Swedish government is spending more money on organic productionWhen the new budget proposal was announced 20 September, it was clear that the govern-ment will inject more money into promoting the organic food sector. The government notes in the budget proposal that “Organic farming contributes to several environmental quality objectives, for example, a non-toxic environment, varied agricultural landscape and rich flora and fauna.”
The government says it will work to promote the development of organic production, consumption and exports. In concrete terms, this entails allocating SEK 25 million annu-ally between 2018–2020 for this.
– ekoweb’s semi-annual report 2016
ICA’s organic sales increased 18 percent in 2016For ICA, sales in shops in 2016 consisted of 5.3 percent organic products, compared with 4.8 percent the previous year. The total value of sales of organic food amounted in 2016 to about SEK 6.3 billion, an increase of 18 percent, compared to 2015. In addition, there will be other products such as organic bodycare products and products made from organic cotton. In 2016, there were 3,200 organic products in ICA’s main product assortment.
“We see a continued strong interest in organic products and we are constantly work-ing to meet customer demand. Partly this entails offering a wide product assortment, but also improving conditions for organic production,” says Maria Smith chief sustainability strategy at the ICA.
– excerpt from ica press release January 26, 2017
Axfood/Hemköp: Organic food hits new record Organic food continues to hit new records.Last year, Hemköp’s organic sales went up by 20 percent.
Some trends in brief
M I DSONA – ANNUAL REPORT 2016
22—soMe Trends in brief

“In January this year, we reached a level that was previously a dream. Then the aver-age share of organic was, for the first time, over 10 percent,” says Thomas Gäreskog, CEO of Hemköp
In 2016, the average organic share increased to 9.3 percent, compared with 8.2 percent the year before.And afterwards, the curve has only continued to point upward. In January 2017, the magical limit was surpassed: 10.3 percent.
“One explanation is the e-commerce that we initiated last year. There, we see that our consumers are considerably more organic-oriented than in physical shops,” says Thomas Gäreskog.
excerpt from release from axfood february 7, 2017
Coop increases eco-sales – 10 percent organic2016 was another record year for Coop’s organic sales. Currency effects amounted to 10.0 percent. An increase of 8.7 percent since 2015, when the corresponding figure was 9.2 per-cent. For Coop e-commerce, the share of organic was 21 percent. Coop’s strong offering in organic makes a difference to customers, suppliers and the environment.
“With an organic share of 10 percent, Coop is among the best in the world among the nationwide food chains,” says Coop’s Sustainability Manager Louise König.
In 2016, the Coop’s organic line grew by more than 360 new products, of which 61 came from Coop’s own brand Änglamark.
– excerpt from coop press release January 26, 2017
The Danish world champion in organicThe demand for organic products is increasing globally. In 2015, global sales of organic products reached 81.6 billion. This is according to a report from the Research Institute of Organic Agriculture FiBL and the international organic organisation IFOAM.
Global sales of organic food have more than doubled in less than ten years and more than quadrupled since 2000 – and the positive trend is expected to continue. The report shows that Denmark is still the world’s most organic-oriented and ecological nation.
“This is a global first place position we should be very proud of. It shows that we take responsibility for our food purchases to make a difference for nature and the environ-ment. It is also a clear signal to our export markets that Danish organic companies pro-duce exciting, high-quality food products,” says Per Kølster, Chairman of the Board of Økologisk Landsforening.
– excerpt from Økologisk landsforening press release february 9, 2017
M I DSONA – ANNUAL REPORT 2016
soMe Trends in brief—23

Midsona’s wide range of strong brands with leading products in health and well-being can satisfy the needs of many consumers. Our aim is to lead the development by develop-ing current brands and bring in new brands to enable us to even better meet existing and new trends.
For a few years, since Midsona has maintained a strategic choice to invest in leading, distinct brands. The share of our proprietary brands has gradually increased and in 2016 our proprietary brands accounted for a total of about 66 percent (63) of the Group’s sales of goods. Many have strong and leading positions in selected segments of each product area.
Midsona’s strategic goal is to have brands that are number one or two in the Nordic region. This creates opportunities for increased exposure in shops, making it even easier for consumers to choose these products. Midsona prioritises eight of its proprietary brands: Urtekram, Kung Markatta, Friggs, Helios, Dalblads, Naturdiet Tri Tolonen and Miwana. In addition, we work with additional profitable proprietary brands, and we repre-sent a number of clients’ brands.
Seeking “personal” brands Consumers are increasingly consciously building their own personal brands. They do this not only by what they wear or where they live, but also by what they choose to eat and drink. They are looking for their “own” individual brands and often steer away from the major, established brands.
Midsona’s acquisition of Kung Markatta and Helios in 2016 and Urtekram in 2015 has many dimensions. One of the most important is the fact that the brands are strong and clearly niched, personal and individual. Therefore, they fit very well into Midsona’s brand-ing strategy. Choosing products from Kung Markatta or Urtekram is a clear way of show-ing the world around you who you are and choose to be. It shows that you are a conscious consumer, who eats organic and takes responsibility for the future. Here, a description of how four of our prioritised brands worked in 2016 to strengthen market position and brand awareness.
Kung MarkattaFor Kung Markatta, the focus in 2016 was on introducing several new products to the market and increasing brand awareness to drive high growth. Several exciting innova-tions have been launched within the beverages category, both teas and non-alcoholic sparkling drinks. Sparkling white wine was awarded the prize as health food of the year 2016 by the health magazine MåBra. Of consumers between the ages of 15 and 65, 65 per-cent (57) know of, or have purchased, Kung Markatta products.
Leading brands are the foundation
M I DSONA – ANNUAL REPORT 2016
24—leading brands are The foundaTion
UrtekramUrtekram had strong performance in 2016 with solid growth in all major markets. The brand has successfully expanded its product portfolio both within priority categories and by reaching a wider consumer group. In the organic bodycare segment, the new Urtekram Coconut series attracted younger consumers. In the organic food segment, products were launched in the gluten-free segment as well as the brand Nutana, a sub-brand of Urtekram, with an organic profile in the growing vegetarian market was launched.
FriggsIn 2016, Friggs prioritised efforts to reverse the downward trend for rice cakes by launching corn cakes. Just eight weeks after the launch, Friggs’ cheese-flavour corn cake was the second in its category in Sweden. All the best-selling flavours are now available as corn cakes. Friggs’s solidified its market leadership in the category during the year with a share of 75.9 percent (71.4).
Friggs’ is the leader in healthy teas and launched a series of organic teas in the premi-um segment. In a short time, the new series accounted for 10 percent of sales.
Friggs dietary supplements are number one in the Swedish Fast Moving Consumer Goods (FMCG) retail sector and the brand that consumers say they choose first. In 2016, the design and content was updated to further enhance the offering. Friggs dietary sup-plements grew by 3.5 percent in the Swedish FMCG retail sector.
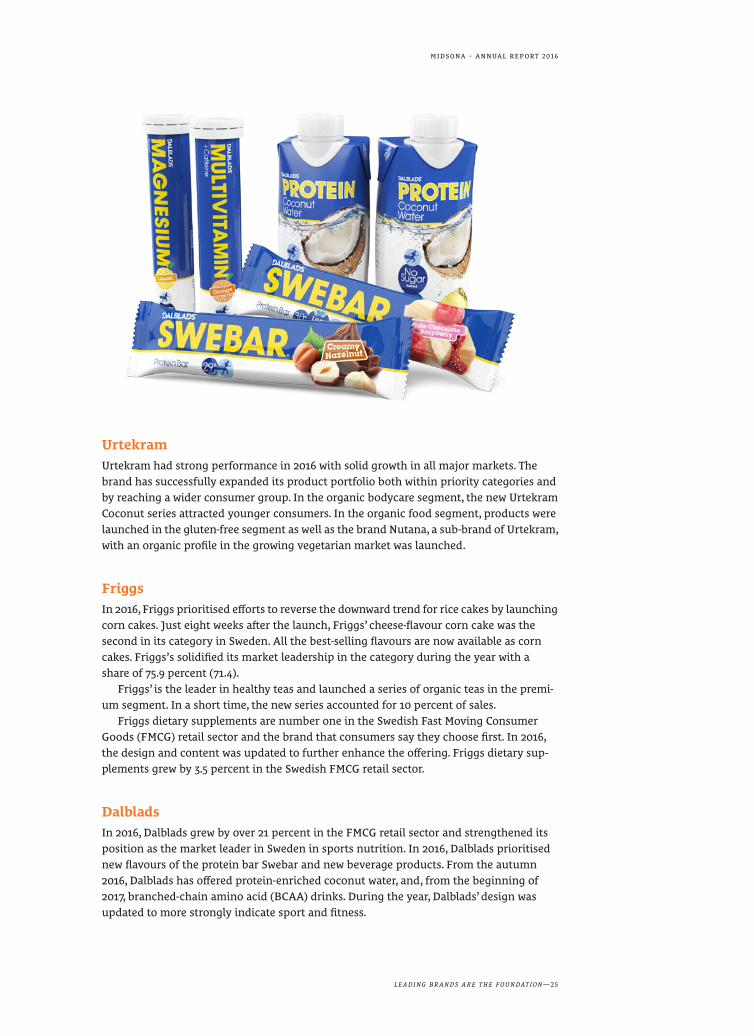
DalbladsIn 2016, Dalblads grew by over 21 percent in the FMCG retail sector and strengthened its position as the market leader in Sweden in sports nutrition. In 2016, Dalblads prioritised new flavours of the protein bar Swebar and new beverage products. From the autumn 2016, Dalblads has offered protein-enriched coconut water, and, from the beginning of 2017, branched-chain amino acid (BCAA) drinks. During the year, Dalblads’ design was updated to more strongly indicate sport and fitness.
M I DSONA – ANNUAL REPORT 2016
leading brands are The foundaTion—25

Urtekram Urtekram is a leading brand of organic food within colonial products and frozen food, certified organic care products and products intended for people with aller-gies, including lactose and gluten-free products. The product portfolio is pri-marily in supermarkets and grocery shops and is very broad. Today, the prod-uct portfolio includes nuts, snacks, fruit, dairy products, bread, frozen food, oil, vinegar, cereals, spices, grain, rice, pasta and juices. Urtekram also has a broad product portfolio in body, face and hair care and oral hygiene.
Kung MarkattaA leading brand in organic foods, with a broad product portfolio, available pri-marily through supermarkets in Sweden. The range includes a variety of select products such as dried fruits, nuts, cold-pressed oils, tofu, pasta, beans, jam, rice, seeds, cocoa, tea and mustard.
Friggs Friggs is a broad-spectrum health brand, as it always contains ingredients with documented health effects. Friggs at-taches great importance to making products attractive from several per-spectives. Accessibility, product design and custom packaging convey simplicity. Under this brand, we primarily develop and market products with a clear food profile. The range is primarily available in supermarkets and includes corn cakes, rice cakes, dietary supplements, juices, crispbreads, bars and teas.
HeliosHelios is a leading brand in organic foods, with a product portfolio, available pri-marily through supermarkets and healthfood retailers in Norway. Helios is Norway’s most extensive range of select organic and bio-dynamic products, such as beverages, breads, cakes, cold cuts, side dishes, pasta sauce, pesto, oil, sugar, syrup, nuts, seeds, flour and tea.
Our eight priority brands
26—our eighT PrioriT y brands
M I DSONA – ANNUAL REPORT 2016

Dalblads Dalblads products for sports nutrition are aimed at the everyday exerciser as well as the elite athlete, whether it’s about strength training or endurance sports. The products can be used before, during and after exercise. Dalblads’ most popular product is SWEBAR, which is a protein bar in 15 different flavours and Sweden’s best-selling protein bar. The products are marketed through e-com-merce, other retail shops and supermar-kets. Other products include protein powders, sports drinks and energy gel.
Naturdiet Naturdiet offers alternative meals for a healthy lifestyle whether these are eaten for breakfast, lunch or as a snack. The products are full of vitamins and miner-als that the body needs, but always have a low-calorie content. Several of the products are also high in protein, suita-ble for an active lifestyle. The range in-cludes nutritious and low-calorie drink mixes, bars, smoothies and shakes that are tailored to different programmes for weight control. There are also lactose- free, low-calorie, high-protein products. The products are mainly found in super-markets.
Tri Tolonen Under the brand name Tri Tolonen, Midsona provides high-quality dietary supplements, including vitamins, miner-als and antioxidants. The range also in-cludes, among other things EEPA, car-nosine, berberine, Q10, vitamins D, melatonin and magnesium. The prod-ucts, which are primarily sold through fine health food shops and pharmacies, as well as grocery shops, are designed to strengthen health and physical well-being.
Miwana Miwana/Renässans is the natural choice for the entire family for cold-related nose and throat problems. The products contain a natural salt solution and were developed in close cooperation with physicians and other medical experts. The range includes nasal drops and sprays that are sold under the name Renässans in Sweden. They alleviate nasal congestion, rinse and moisturise, treat, and prevent symptoms and the cause of the common cold. The products are non-addictive and gentle and are marketed primarily through pharmacies.
Midsona’s operations are based on strong proprietary brands. At year-end, the Group had some 20 proprietary brands. Of these brands, Urtekram, Kung Markatta, Friggs, Helios, Dalblads, Naturdiet, Tri Tolonen and Miwana are
priority brands. Urtekram, Friggs, Kung Markatta and Helios play a central role in the Group’s growth. Together, they account for a significant share of total consolidated sales.
our eighT PrioriT y brands—27
M I DSONA – ANNUAL REPORT 2016

Innovations have become increasingly important for Midsona as we have approached cat-egories of consumers with a significant interest in nutrition, high product standards and interest in testing new products. Innovation and staying abreast of trends is part of build-ing consumer trust and loyalty. This entails reacting quickly to new trends, which requires a streamlined innovation process.
Midsona’s product team has resolved to initiate a project for new product develop-ment. Once an idea is approved by the product consultants, we continue to develop it in a project group determined by the brand that the product falls under. In presenting the idea, market trends and competition conditions have been analysed to best determine why Midsona should develop the product.
Several factors decisive Several factors determine whether an idea will be developed into a new product. Impor-tant factors are production costs and choice of suppliers to meet quality requirements. The market analysis can point to a lack of space for the featured product, but adjustment, making the product gluten-free or organic, for example, can increase its market viability. It’s all about the right timing, both internally and externally.
Midsona’s newly acquired brands Kung Markatta, Helios and Urtekram are known for their high rate of innovation. Each year, they launch several hundred new products in total. The brands Friggs and Naturdiet also have a successful innovation process and launched several new products over the year.
The high rate of innovation creates benefits
In the organic bodycare segment, Urtekram’s new
Coconut series attracted younger consumers.
M I DSONA – ANNUAL REPORT 2016
28—The high raTe of innovaTion creaTes benefiTs

In 2016, Dalblads prioritised new beverage products and launched BCAA drinks at the beginning of 2017.
Friggs prioritised to reverse the nega-tive trend of rice cakes by launching corn cakes as a success. All the best- selling flavours are now available as corn cakes.
Kung Markatta’s sparkling white wine was awarded Health Food of the year 2016, by the health magazine Måbra.
M I DSONA – ANNUAL REPORT 2016
The high raTe of innovaTion creaTes benefiTs —29

The foundation of Midsona is strong brands in health and well-being. The primary func-tion of Midsona’s sales work is to generate the distribution of the brands, that is, to ensure a flow of products at customers’ outlets that continuously corresponds to the marketing department’s activities directed at consumers. The more channels Midsona has and the more aggressive its marketing communications, the higher the demands on sales and distribution.
Sales channels Midsona should be where the consumers are. We do not exclude any channels, but assign priority to certain channels based on size. The sales department is structured according to the size of each customer or channel – or the scope of the potential.
Midsona has a well-defined structure for the sales processes in all business areas. The basis entails working centrally with large customers in FMCG and healthfood retail. Oth-er significant channels are pharmacy chains and other specialist retailers. In addition to these, e-commerce is a rapidly growing channel, with sales virtually doubling every year.
Introducing products Developing customer relations and introducing new products to them is handled central-ly. The supply chain then makes sure that the products reach the shops with Midsona’s help. This means that both central processing, as well as development of customer rela-tions at shops out in the field is necessary.
To achieve optimal distribution, clear planning and structure are important. Mid sona works on the basis of seven sales cycles per year, with each cycle lasting six to eight weeks. The year commences with a sales conference, including education and training in sales calls, as well as the planning of the sales cycle.
Shelf exposure In parallel with activities to introduce new products, salespeople also work on good shelf exposure. Ultimately, this is a matter of supporting the shops in how they sell the prod-ucts. The traditional approach is to introduce the products, to sell them to shops and web-sites. However, what is of most interest to the shops – and also to Midsona of course – is selling to end consumers. We must continuously have creative ideas, displays and shelf exposure.
In Sweden, for the first time Midsona, in 2016, worked with its own sales force in all business areas, which streamlines the management of the sales process. Information paths are becoming simpler and shorter, meaning that salespeople can change or refocus their sales activities more quickly.
Systematic and proactive sales
Product sales by sales channel, Group
� Supermarkets, 72% (65)� Healthfood retailers, 12% (13)� Pharmacies, 6% (10)� E-commerce/post order, 4% (4)� Other specialist retailers, 3% (5)� Other sales channels 3% (3)
M I DSONA – ANNUAL REPORT 2016
30—sysTeMaTic and ProacTive sales

" There are so many opportunities for organic products."– Steen Resen, Marketing Manager, Midsona Denmark
What is the best trip you’ve made?People in all countries have their iconic moments of community. In football we have two of these in Den-mark – apart from every time we beat Sweden. One was when we won the European Championships in Gothenburg. The second when we beat Uruguay 6–1 at the World Cup in Mexi-co in 1986. And it is the latter which is my best memory, because I was on a business trip in the Caribbean then.
Having been present at this unforgettable match, I am reminded of that special trip around the Caribbean. As always when people discuss such a match, I receive special attention when I can offer an eyewitness account of the one. Therefore, even though I had my valuables stolen in Caracas and was also robbed in Mexico City, this was one of my absolute best trips.
What is the biggest challenge for the future of Midsona’s journey?By truly capitalising on the recent acquisitions of Urtekram, Kung Markatta and Helios, I hope we can reach our full growth potential for the organic market. There are so many opportunities for organic products if we focus on the long-term and not too much on short-term cost savings. The market for organic products is not only here to stay – it has come back to stay, after only a hundred years of conventional farming in human history.
What are the biggest opportunities for Midsona?It is important to remember that volume that only generates volume can make an activity very sensitive if the brands that make up the business are not genuinely substantiated. The biggest opportunity is to maintain the acquired brands’ DNA, especially in the organic market. It’s a challenge, but also one of the best opportunities.


Midsona’s quality policy states that Midsona shall maintain high-quality in its products and to act credibly and ethically. Midsona has a large number of suppliers, both Nordic and European, as well as a few non-European companies. In addition, we have a number of suppliers involved in ongoing development projects, where the Group is working on development with several suppliers in parallel for as long as possible, providing various options to choose between. This is a meticulous and extensive process that can extend over a longer period.
The first selection The first question for a potential supplier is whether they are even able to manufacture the new product that Midsona wants to develop and if the supplier meets the quality and cost requirements. Other key issues are whether the supplier has the legal capacity and can handle the schedule.
Midsona then selects two or three suppliers that the Company believes can cope with the ongoing detailed quality control. Midsona’s quality department will then send a ques-tionnaire regarding, for example, what quality certifications the supplier has, but also questions such as how long the Company has been in business and its financial status. The supplier must also agree to live up to Midsona’s Code of Conduct.
The specifications for suppliers usually include the demands placed on packaging, recycling and the necessary certificates of origin for raw materials. For a product to be considered organic, for example, it must have as few additives as possible. Colours may not be used and the flavourings that are permitted are based on natural aromas.
Design is important It is often the design of the product itself that determines what suppliers are to be used. This is because although Midsona may be able to find a good and reliable supplier, it may not be able to provide the right packaging format – such as jars or specially designed bags.
The suppliers that Midsona chooses to proceed with receive follow-up visits by Midso-na’s Quality and Purchasing Manager.
Systematic quality assurance During the visit, Midsona focuses on systematically reviewing various parameters, such as volume, price and logistics, to ensure that the supplier meets Midsona’s requirements. The entire production process is analysed in detail – opportunities for traceability are important. Various quality agreements are also reviewed to clarify issues regarding devia-tions for example. Midsona’s objective is to visit all existing suppliers at least every three years.
Thorough quality efforts
M I DSONA – ANNUAL REPORT 2016
Thorough qualiT y efforTs—33

Business areas
Key figures 2016 2015 ¹
Net sales, SEK million 537 284
Net sales growth,% 89.1 –
EBITDA, before non-recurring items, SEK million 35 17
Operating profit before non-recurring items, SEK million 27 13
Non-recurring items included in operating profit, SEK million – 17
Operating profit, SEK million 27 30
Operating margin,% 5.0 10.6
Sales channelsexternal product sales
Sales channelsexternal product sales
� Pharmacies, 7%� FMCG retail sector, 77%� Healthfood retailers, 6%� e-commerce/post order, 6%� Other specialist retailers, 3 %� Other sales channels, 1%
� Pharmacies, 0%� Supermarkets, 78%� Healthfood retailers, 13%� e-commerce/post order, 4%� Other specialist retailers, 1%� Other sales channels, 4%
Sweden
Denmark
Significant events in 20161 Acquisition of the organic brand Kung Markatta.1 Midsona gains market share in several categories.1 Some 50 new products in various categories were
launched. Among other things, the brand Friggs broad-ened it range with crispbread and bars. Friggs crispbread with Spinach & Black sesame was named the year’s best health food by the magazine MåBra.
1 A major structural and systems changes regarding the integration of Urtekram were conducted during the first half of the year for collaboration and efficiency of opera-tions.
1 A major focus was on the integration of the acquired Kung Markatta AB, which was ongoing at year-end.
Significant events in 2016� Sales performance increased in the Danish retail trade,
where mainly supermarkets performed well. Online retail grew strongly.
� The organic part of the Danish retail trade continued to grow and now accounts for just over 9 percent of the total market.
� Export operations showed continued strong sales growth, demonstrating that the initiatives implemented in coop-
eration with partners outside the Nordic region are stra-tegically correct.
� In the production, capacity utilisation was high. A new production line was finalised in the period to improve efficiency and meet the increased demand.
� Warehouse capacity was increased by 50 percent through the utilisation of new modern warehouse space, with efficient distribution processes.
1 Refers to 1 July 2015 – 31 December 2015
Key figures 2016 2015
Net sales, SEK million 728 421
Net sales growth,% 72.9 –4.1
EBITDA, before non-recurring items, SEK million 64 37
Operating profit before non-recurring items, SEK million 59 36
Non-recurring items included in operating profit, SEK million –8 –15
Operating profit, SEK million 51 21
Operating margin,% 7.0 5.0
M I DSONA – ANNUAL REPORT 2016
34—business areas

Key figures 2016 2015
Net sales, SEK million 475 401
Net sales growth,% 18.5 1.5
EBITDA, before non-recurring items, SEK million 42 43
Operating profit before non-recurring items, SEK million 39 41
Non-recurring items included in operating profit, SEK million –12 4
Operating profit, SEK million 27 45
Operating margin,% 5.7 11.2
Key figures 2016 2015
Net sales, SEK million 164 102
Net sales growth,% 60.8 –10.5
EBITDA, before non-recurring items, SEK million 18 9
Operating profit before non-recurring items, SEK million 17 7
Non-recurring items included in operating profit, SEK million – 0
Operating profit, SEK million 17 7
Operating margin,% 10.4 6.9
Sales channelsexternal product sales
Sales channelsexternal product sales
� Pharmacies 11%� Supermarkets, 58%� Healthfood retailers, 18%� Other specialist retailers, 6%� Other sales channels, 7%
� Pharmacies 8%� Supermarkets, 76%� Healthfood retailers, 14%� Other specialist retailers, 1%� Other sales channels, 1%
Norway
Finland
Significant events in 20161 Helios, a part of the acquisition of Internatural, is the
leading brand of organic dried food in Norway.1 Great success for Friggs establishment in grocery shops
which mix different corn cakes taken a leading position.1 Midsona was elected “Supplier of the Year” by health
food shops chain Sunkost.1 Strengthened market positions through the acquisition
of the Biopharma brand from Biopharma AS. The product line includes supplements that are sold in grocery shops.
1 Completed sales assignments in non-priority categories affected the sales development.
1 Several licenced brands strengthened position in the FMCG retail sector.
Significant events in 20161 After several weak years, the Finnish healthfood market
grew, with a clearly stronger second half of the year, par-ticularly in larger supermarkets.
1 Friggs launched corn cakes which was a huge success and created a category in which it is market leader, with both rice cakes and corn cakes.
1 Focus on building up the distribution of the prioritised brands in the consolidated FMCG retail sector.
1 The brand Urtekram exhibits a significantly faster growth rate than the total market for organic food.
1 Sales rebounded significantly for the brand Tri Tolonen in the second half of the year, after a period of weak growth.
Business operations are conducted in four business areas that are close to customers in each market, providing optimum conditions for being able to combine the Group’s econ-omies of scale with flexible and efficient business decisions.
M I DSONA – ANNUAL REPORT 2016
business areas—35

Sustainability issues have become increasingly important in recent years, especially in the food industry where we are dependent on a functioning habitat for plants and ani-mals, while simultaneously placing a strain on that habitat. Therefore, it is important to look at how our business uses current resources so that we continue to take responsibili-ty for future generations while generating benefit and value for all stakeholders.
Today’s consumers are more informed and interested in the responsibility taken by a company and how extensive and genuine sustainability efforts are, and those customers often make choices based on corporate social and environmental responsibility. This plac-es new demands on the operations and makes sustainability a competitive factor and a critical business issue, in keeping with the increasing status of sustainability on the agen-das of management teams and boards, where strategic and communicative efforts deter-mine success.
Midsona’s sustainability workMidsona embraces this development. Alongside Urtekram, the acquisitions of Kung Mar-katta and Helios, mean we now have three strong brands with leading products in the category of sustainably-produced foods. This is also a sign of the change now taking place in Midsona, by which we are gradually advancing our positions regarding corporate re-sponsibility.
Focused sustainability work throughout Midsona commenced in the autumn of 2016. The goal was to develop a global vision and a strategic approach to be implemented inter-nally in 2017. The project, initiated by the Midsona Board in 2016, has involved both Group Management and representatives from the business areas. As its starting point, the development process has used the sustainability profile of the Group’s priority brands, the aspirations of Group Management, as well as perspectives from key stakeholders. Inspiration has also been taken from the GRI (Global Reporting Initiative) guidelines, which Midsona will follow in its sustainability reporting.
What does sustainability mean to us?Midsona’s sustainability work is based on our vision to contribute to helping people live a healthier life. The sustainability vision should be comprehensive and clarify the direction and goal of the Group’s sustainability commitment, which will be solidified during 2017.
Midsona’s sustainability visionwe want to contribute to helping people live a healthier life.
Focused sustainability work
M I DSONA – ANNUAL REPORT 2016
36—fo cused susTainabiliT y work


A sustainability strategy built on strengths and expertiseTo live up to this vision, we have developed a strategy that focuses on the factors that have made us a leader in health and well-being in the Nordic region. By leveraging the accrued knowledge and core competencies that make us unique, we optimise our efforts to provide the greatest benefits to society, our stakeholders and our own operations.
Midsona’s most important strengths are our understanding of consumer needs and comprehensive health knowledge. Together, these strengths provide inspiration and a foundation for our continuous innovation work, which is important in ensuring the pop-ularity of our products and Midsona’s competitiveness. They also shape the quality of our work and our purchasing processes, which are linked to our third strength: our close rela-tionship with our suppliers. In working closely with suppliers, we can ensure that our products are of the highest possible quality and that production conditions are appropri-ate and equitable.
Midsona’s sustainability strategy based on a thorough understanding of consumer needs, and through our broad expertise in health and close supplier relationships, we help people lead a healthier life.
Areas of focusMidsona’s sustainability work will revolve around three primary areas of focus. The target is for this to steer efforts to the areas where we can do the most good and where our sus-tainability commitments can be carried out in a trustworthy fashion, both for us and our stakeholders.
areas of focus for Midsona’s sustainability work1. Promoting a healthy lifestyle2. high-quality, safe products3. sustainable utilisation of resources
We want to help people live a healthier life.
Based on a good understanding of our consumers’ needs and through our broad knowledge of health and close supplier relationships, we help people live a healthier life.
1. Promoting a healthy lifestyle2. Qualitative and safe products3. Sustainable use of resources
M I DSONA – ANNUAL REPORT 2016
38—fo cused susTainabiliT y work

1. Promoting a healthy lifestyleWhat you eat and drink is an important part of your personal brand. These choices are driven by a strong health trend, combined with a desire to take responsibility for our environment. In this way, food plays an important role in a healthy lifestyle.
Over the years, Midsona has developed a thorough understanding of the role that diet and nutrition play in health and well-being. This knowledge-base determines our strate-gic decisions regarding acquisitions or investments, while it also serves as the basis for our innovation work and product development.
Our goal is to produce and market products that will make it easier for people to live a healthier life. To ensure credibility in our efforts, we must attend to how we act, internally, as a company. We believe in promoting a healthy employee culture, and we work within a broad range of areas to ensure that we practice what we preach.
2. Safe high-quality productsProduct safety and quality are the foundation of a food company. This means that the raw materials that go into our products must be of the highest possible quality, at the same time as they are produced under sustainable conditions. Our broad spectrum of health expertise increases our ability to control purchases to ensure that our products maintain a consistent and reliable level of quality. Working closely with suppliers also en-sures that we can set clear standards for occupational health and environmental impact. In this way, we also promote a healthy lifestyle among the people we do business with.
Quality and safety are also about ensuring that our products are properly labelled so that our consumers receive the proper information regarding content and origin. A ma-jority of our consumers demand accurate product information, which we have long prior-itised. Maintaining full control and documentation of what is included in our foods is an essential part of our quality assurance work, and it is also a significant factor in maintain-ing our goals to help people live a healthy life. For those who need supplements beyond what their diet provides, we will also offer safe dietary supplements.
3. Sustainable use of resourcesMidsona’s long-term commitment to contribute to health and well-being also entails a re-sponsibility to future generations. Therefore, it is important to look at how our business uses resources today, so that we can continue to create value and benefit for all of our stakeholders.
Emissions and energy consumption affect human health and well-being. We must be selective and transparent regarding what we consume. Because we want to help people live a healthier life, we want to take responsibility for our production and ensure that our products have the least possible negative impact on the environment and people. This awareness also steers our efforts to seek new production and packaging solutions.
Business Area Denmark is about to convert to solar cell electricity production that will produce 20,000 kWh annually, resulting in approximately 14,300 kWH of usable power. Denmark has also replaced all lighting with LED bulbs in its warehouses. This provides a savings of around 450 fluorescent tubes a year, equivalent to a savings of about 60,000 kW year.
Midsona has also resolved to conduct training in eco-driving for all sales personnel, starting in the business areas Sweden and Denmark.
Midsona Denmark cooperates with the Vegetarian Society of Denmark to support growth for Nutana’s vegetarian dishes and Urtekram’s vegan products. The aim of the col-laboration is to increase awareness of our products. Furthermore, the organisation’s logo will be on Nutana’s vegetarian and Urtekram’s vegan products. Furthermore, Midsona Denmark sponsors the Vegetarian Society of Denmark in informing school classes in Denmark about the benefits of choosing vegetarian food. In this way, both parties will be able to increase awareness and interest in a vegetarian lifestyle.
Some of our certificationsRefers to Urtekram or Kung Markatta products.
Coeliac: European Crossed Grain symbol licence. License applies to glu-ten-free products. Renewed annually. Issued by Coeliac UK.
Requirement: Renewed annually. Issued by Kiwa, Uppsala, Sweden.
Used only for bodycare products, new approval each year. Issued by Ecocert Group, France.
Swan: Eco-labeling. Issued by Miljø-mærkning, Denmark.
Cruelty-free: The product or the in-gredients are not tested on animals.
Vegan: The product does not contain ingredients derived from animals.
Äkta vara: Swedish labelling that the products are free from additives.
M I DSONA – ANNUAL REPORT 2016
fo cused susTainabiliT y work—39
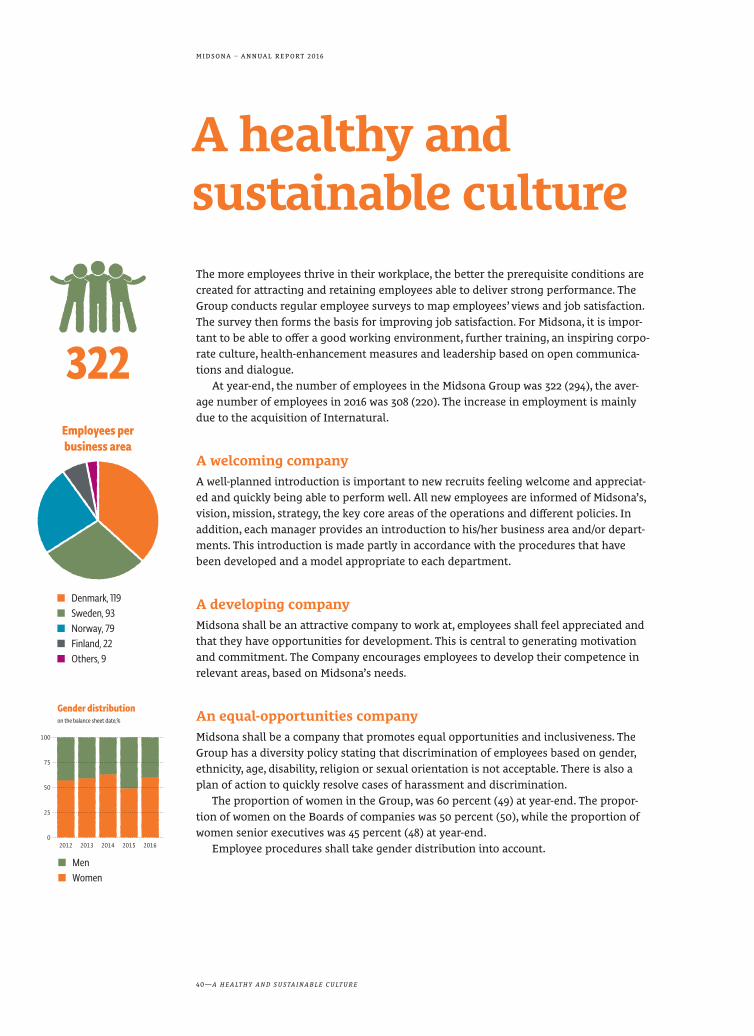
The more employees thrive in their workplace, the better the prerequisite conditions are created for attracting and retaining employees able to deliver strong performance. The Group conducts regular employee surveys to map employees’ views and job satisfaction. The survey then forms the basis for improving job satisfaction. For Midsona, it is impor-tant to be able to offer a good working environment, further training, an inspiring corpo-rate culture, health-enhancement measures and leadership based on open communica-tions and dialogue.
At year-end, the number of employees in the Midsona Group was 322 (294), the aver-age number of employees in 2016 was 308 (220). The increase in employment is mainly due to the acquisition of Internatural.
A welcoming company A well-planned introduction is important to new recruits feeling welcome and appreciat-ed and quickly being able to perform well. All new employees are informed of Midsona’s, vision, mission, strategy, the key core areas of the operations and different policies. In addition, each manager provides an introduction to his/her business area and/or depart-ments. This introduction is made partly in accordance with the procedures that have been developed and a model appropriate to each department.
A developing company Midsona shall be an attractive company to work at, employees shall feel appreciated and that they have opportunities for development. This is central to generating motivation and commitment. The Company encourages employees to develop their competence in relevant areas, based on Midsona’s needs.
An equal-opportunities company Midsona shall be a company that promotes equal opportunities and inclusiveness. The Group has a diversity policy stating that discrimination of employees based on gender, ethnicity, age, disability, religion or sexual orientation is not acceptable. There is also a plan of action to quickly resolve cases of harassment and discrimination.
The proportion of women in the Group, was 60 percent (49) at year-end. The propor-tion of women on the Boards of companies was 50 percent (50), while the proportion of women senior executives was 45 percent (48) at year-end.
Employee procedures shall take gender distribution into account.
A healthy and sustainable culture
322Employees per business area
� Denmark, 119 � Sweden, 93 � Norway, 79 � Finland, 22 � Others, 9
Gender distributionon the balance sheet date,%
0
25
50
100
75
2012 2013 2014 2015 2016
� Men � Women
M I DSONA – ANNUAL REPORT 2016
40—a healThy and susTainable culTure

A healthy and sustainable culture Midsona’s sustainability vision to contribute to helping people achieve a healthier life should also be reflected in the workplace. We strive to work for healthier ideals, both in-ternally and externally. For us, systematic working environment efforts mean creating a working environment that helps employees develop and where there is no risk of becom-ing ill or injured. This is a natural and integrated part of the continuous, ongoing opera-tions. Midsona works actively for employees to have a working environment that is as healthy, creative and developing as possible, with a favourable balance between work and leisure.
Midsona offers various health promotion activities that increase long-term health prospects for employees. Sickness absence increased in 2016 to 5.1 percent (4.3) partly as a result of several integration projects with a high workload for many employees. Measures have been taken to reduce absenteeism in 2017.
All offices promote a modern, sustainable and good working environment and we offer employees the opportunity to eat/try our products. Even in external meetings, we mostly offer our own healthy products. We always aspire to incorporate a fitness activity into our internal conferences. We often sponsor employees’ participation in exercise com-petitions of various kinds.
In 2016, a new whistleblower policy and a new health policy was developed. Our health policy states, among other things, that Midsona’s vision as a company is to be permeated by health and wellness efforts to ensure a continuous commitment to improving health in the workplace throughout the organisation.
A clear company Ultimately, the responsibility for employees rests with Group Management, which, aided by a number of policies and plans, delegates the task of attracting, developing and retain-ing employees to the relevant managers. This imposes considerable demands on the Group’s leadership, which shall be pervaded by security and clarity with regard to targets and assignments.
Management shall support employees’ inherent problem-solving skills, acceptance of responsibility and development. All employees are offered annual performance reviews that follow a structured procedure for both interviews and follow-up.
Length of employmentnumber of employees
0-3 years0
30
90
120
60
150
4-6 years 7-9 years 10 years <
Age structurenumber of employees
< 29 yrs0
40
20
80
100
60
140
120
30–39 40–49 60 yrs <50–59
Absence due to illness
� Group� Sweden� Denmark (effective from 2015)� Norway� Finland
0 %
1 %
2 %
3 %
6 %
4 %
5 %
2013 2014 20162015
M I DSONA – ANNUAL REPORT 2016
a healThy and susTainable culTure—41

Risks and risk managementAll business operations must manage uncertainty regard-ing future events that could affect the operations posi-tively, bringing opportunities to generate increased value, or negatively, incurring a risk that targets will not be reached, with reduced value being generated for share-holders and other stakeholders as a consequence. Conse-quently, risk management is an important element in the governance and control of the operations.
Midsona is affected by the general economic situation, currency exchange fluctuations and other company-spe-cific external factors. This section details the most signifi-cant risks affecting the capacity to achieve set operational and financial targets for the Group, as well as the manage-ment of each risk. Midsona actively seeks to minimise
risks through preventive efforts and, where this is not possible, to hedge or insure against the risk in as cost- effective and balanced a manner as possible, with well- considered risk taking within set limits.
Risk management is governed at an overarching level by the Board of Directors and the Audit Committee, as well as at an operational level by the CEO, management team and other employees.
The account of risk factors presented below does not claim to be exhaustive, nor is it ranked by order of impor-tance. Not all factors are described in detail, and a com-plete assessment must include other information and a general assessment of external conditions.
Operational risks
PRODUCT RESPONSIBILIT Y
P R O B A B I L I T Y E F F E C T
DescriptionHandling foods imposes rigorous demands on traceability, hygiene and handling. Poor control can lead to contamination, allergic reactions or various kinds of injuries. Deficiencies in food han-dling could lead to confidence in Midsona and its brands decreasing and defective products having to be recalled or repurchased. Recalls can be costly and damage the Group’s reputation while preventing inventories from being sold. Midsona could also be subject to product responsibility demands if its products are claimed to have caused personal injury.
Risk managementMidsona applies rigorous quality requirements in all processes to minimise the risk of all types of faults, product recalls or other damage claims. Agreements with suppliers impose requirements for documentation and traceability to safeguard the quality of products. Suppliers are scrutinised through inspections in accordance with a rolling schedule and all raw ingredients and semi-manu-factured goods undergo laboratory testing to ensure that they are the right raw ingredients of the right quality before being used in the products. In Midsona’s quality assurance system, possible complaint flows can be captured at an early stage for proactive purposes. In addition, Midsona adheres to relevant legislation, regula-tions and industry guidelines that are applicable to each of its product categories. Midsona also holds insurance against possible product respon-sibility demands.
Exposure/commentMidsona had six unplanned withdrawals of prod-ucts (two) in 2016, which were minor in nature. These withdrawals had no material impact on the Company’s results and financial position.
M I DSONA – ANNUAL REPORT 2016
42—risks and risk ManageMenT

PRODUCTION
P R O B A B I L I T Y E F F E C T
DescriptionMidsona has a production facility in Denmark for the production of organic foods and bodycare products. The production unit is certified for or-ganic production. The risk is purely in terms of the production technology. That is to say, an un-planned interruption to production could directly affect deliveries to customers, since a large part of production is conducted to order.
Risk managementFor the large volume products, production can be transferred to other machines. Machines are maintained continuously in accordance with es-tablished schedules, and larger maintenance measures are normally scheduled during the summer months. Investments in new machines or to replace older ones are made continuously as needed.
Exposure/commentThere were no disruptions during in 2016. A new production line was finalised in the period to im-prove efficiency and meet the increased demand. Capacity investments are planned for 2017.
PRICES FOR RAW MATERIALS
P R O B A B I L I T Y E F F E C T
DescriptionTrends in prices for raw materials depend largely on supply and demand, which are beyond Midso-na’s control. The prices of certain raw materials that Midsona purchases are also affected by agri-cultural policy decisions, subsidies, trade barriers and activity on commodity exchanges.
Risk managementMidsona continuously monitors price trends for all key raw materials. To safeguard both availabil-ity and price, supplier agreements are normally signed, covering the need for essential raw mate-rials over a horizon of 6-12 months. Midsona’s guiding principle is to offset increased prices for raw materials through price increases to custom-ers.
Exposure/commentIt is often difficult for Midsona to achieve price increases to customers immediately following a demonstrable rise in prices for raw materials. Price revisions normally take place once a year. In certain special cases, discussions are also held with the customer during the year if there is a drastic change in the price of a raw material.
DISTRIBUTION AGREEMENT
P R O B A B I L I T Y E F F E C T
DescriptionA considerable proportion of the Group’s sales of goods derives from distribution agreements, according to which Midsona holds an exclusive right to market, sell and distribute other compa-nies’ products in a defined market. Normally, such distribution agreements extend over a period of one to five years and can, under certain circum-stances, be cancelled prematurely if, for example agreed minimum sales volumes cannot be achieved. There is always a risk that Midsona will not manage to extend distribution agreements or enter new distribution agreements with ac-ceptable terms.
Risk managementMidsona has extensive experience of marketing, selling and distributing products on customers’ behalf in the Nordic health and personal care market. In such partnerships, relations with the customer are built up in the long term through continuous follow-up meetings and other joint activities at different levels in the organisation, generating mutual trust. With access to the Group’s market expertise, licenced products are afforded favourable opportunities for growth and favourable profitability, which normally provides a good foundation for long-term coop-eration.
Exposure/commentTwo distribution agreements were terminated in 2016 – one in Norway and one in Denmark. A new distribution agreement was signed in Norway in 2016. The Internatural AB, which was acquired in 2016, included a number of distribu-tion agreements in Sweden and Norway.
� Proprietary brands, 66 % (63) � Licensed brands, 34% (37)
risks and risk ManageMenT—43
M I DSONA – ANNUAL REPORT 2016

SUPPLIERS
P R O B A B I L I T Y E F F E C T
DescriptionMidsona conducts proprietary production of goods and also uses external suppliers, primarily within Europe. Supplier disruptions are a risk for the Group, taking its commitment to customers into account.
Risk managementThe Group works actively with sourcing issues, with close cooperation with suppliers being nec-essary for reliable deliveries. Where possible, the Group also works with alternative suppliers for critical products.
Exposure/commentThrough its relations with suppliers and meas-ures it has implemented with regard to alterna-tive suppliers, the Group has not suffered delivery disruptions affecting its relations with customers.
CUSTOMER DEPENDENCY AND CUSTOMER CREDIT RISK
P R O B A B I L I T Y E F F E C T
DescriptionMidsona has some 300 active customers, of whom the ten largest account for 63 percent (54) of net sales. If Midsona is unable to live up to the demands imposed by its largest customers, and if customers fail to meet their payment obligations, Midsona could be negatively affected.
Risk managementCustomers are primarily pharmacies, FMCG retail chains and healthfood retailers with whom cus-tomer relations are generally rather long-term. Increasingly, Midsona offers its products directly to the end consumer through e-commerce/post order, as well as other specialist retailers. By ex-tending its customer base, Midsona can reduce its dependency on a small number of customers. Customer credit risk is managed on an on-going basis by each subsidiary through credit checks and internal credit limits for each customer. Bank guarantees or other sureties are required for cus-tomers with low creditworthiness or insufficient credit history.
Exposure/commentAt year-end, trade accounts receivable amounted to SEK 209 million (131), corresponding to an average customer credit period of 47 days (48). Customer losses amounted to SEK 1 million (1) and has been at a low level over the years.
COMPETITORS – AND, AT THE SAME TIME, CUSTOMERS
P R O B A B I L I T Y E F F E C T
DescriptionCustomers are primarily pharmacy, FMCG and healthfood retail chains. To a varying extent, these players offer competing products that they sell under their proprietary brands (private label), which are growing stronger each year and that occupy an increasingly large share of the product range on shop shelves. If these players continue to broaden their product ranges under their pro-prietary brands, this could lead to further compe-tition and increased price pressure, which would affect Midsona’s sales and results negatively.
Risk managementMidsona works actively with continuous devel-opment and innovation in its brands and prod-ucts to earn its shelf place in shops and, at the same time, to convey a clear and accurate mes-sage to consumers at the point of sale. Custom-ers’ and end-consumers’ confidence in Midsona’s products are of crucial importance to the Com-pany’s long-term development. Without strong confidence in the Company’s brands, it would be difficult to capture market share and to grow. Thorough development, innovations and sustain-ability processes enhance conditions for winning and retaining the confidence of customers and end-consumers.
Exposure/commentProportion of sales of goods for each sales channel:
� Supermarkets, 72% (65)� Healthfood retailers, 12% (13) � Pharmacies, 6% (10) � e-commerce/post order, 4% (4) � Other specialist retailers, 3% (5)� Other sales channels, 3% (3)
M I DSONA – ANNUAL REPORT 2016
44—risks and risk ManageMenT

RENEWAL OF PERMITS, CERTIFICATIONS AND LICENCES
P R O B A B I L I T Y E F F E C T
DescriptionMidsona conducts activities requiring permits and holds permits that must be renewed at regu-lar intervals. In addition held one Quantity impor-tant certifications and licences that must be con-tinually renewed. Operations could be adversely affected in the event that Midsona fails to meet the set requirements in inspections by the au-thorities or other organisations, with permits, certifications and licences being revoked as a result.
Risk managementMidsona works continuously with quality assur-ance according to a management system that in-cludes quality and environmental management. The purpose of the management system includes continuously addressing quality and the develop-ment of operations while adhering to relevant legislation and guidelines to maintain official per-mits, certifications and licences. The manage-ment system is authorised by the CEO.
Exposure/commentAll permits, certifications and licences were renewed in 2016 after inspections carried out.
COMPETENCE – A CRITICAL RESOURCE
P R O B A B I L I T Y E F F E C T
DescriptionThe operations require both business and prod-uct-specific expertise. The Group’s development is affected by the availability of competent and motivated employees, as well as the knowledge, experience and commitment of management and other key individuals. Development could be negatively affected if one or more of these key individuals were to leave the Group or if the Group is unable to recruit and retain qualified employees.
Risk managementBy placing considerable emphasis on a good working environment, health-promoting meas-ures and good leadership, Midsona nurtures its brand as an employer and maintains effective procedures to mitigate such negative conse-quences. It is the Company’s view that it can attract and retain qualified employees.
Exposure/commentEmployment Number of employees:
0-3 years0
30
90
120
60
150
4-6 years 7-9 years 10 years <
Financial risks
CURRENCY RISK – TRANSACTION EXPOSURE
P R O B A B I L I T Y E F F E C T
DescriptionConsolidated sales of goods take place mainly in currencies SEK, NOK, DKK and EUR, while the goods purchased are mostly denominated in EUR and USD. The net exposure in EUR is considerable because purchases exceed sales.
Risk managementThe forecast net exposure in the currencies in-volved can, according to the financial policy, be hedged for up to 24 months. The currency-hed-ged portion normally comprises 50 percent but can be increased to 75 percent of the net expo-sure for the defined period if this is deemed ap-propriate. To reduce the impact of exchange rate fluctuations Midsona, has the ambition of using currency forwards to continuously secure future raw material purchases.
Exposure/commentIn connection with the change of the bank in 2016, hedging resumed in December and EUR 3 million was secured by year-end. The change in the market value of the outstanding currency forward contracts was SEK 0 million (1) as per 31 December 2016 and was recognised in profit for the year. An isolated shift in exchange rates against the SEK by ±5 percentage points for the four currencies with the largest estimated net flows, including the effect of derivatives, is calcu-lated to have an effect on profit after tax of ±SEK 18 million (6). Hedge accounting is not applied so that all effects are recognised in the income statement.
risks and risk ManageMenT—45
M I DSONA – ANNUAL REPORT 2016
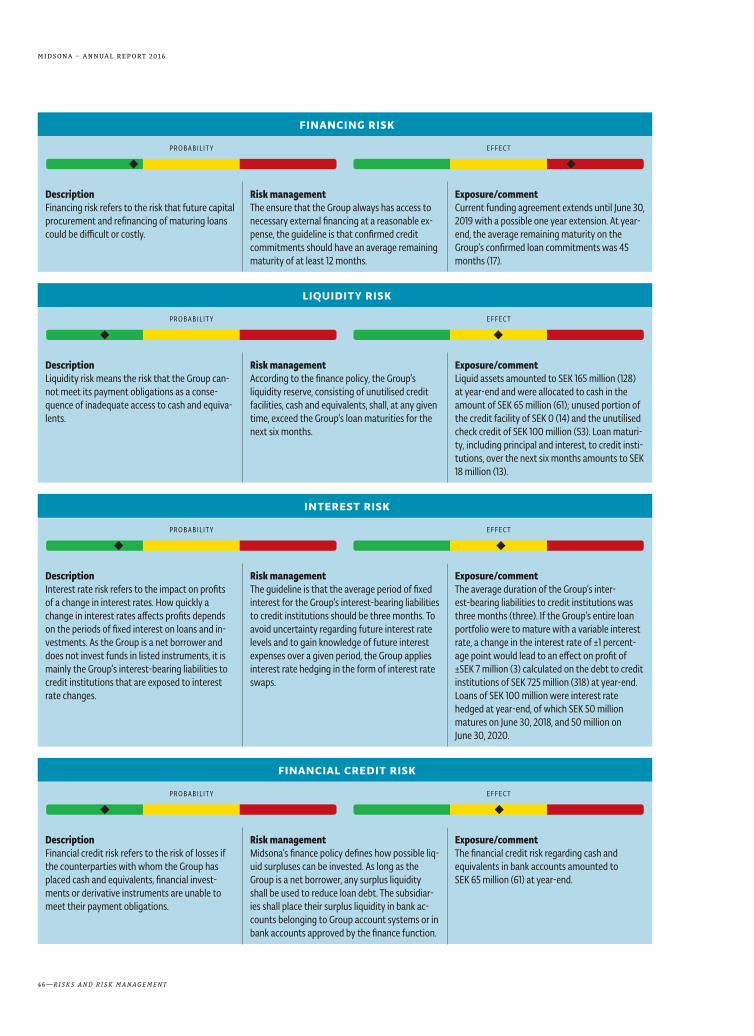
FINANCING RISK
P R O B A B I L I T Y E F F E C T
DescriptionFinancing risk refers to the risk that future capital procurement and refinancing of maturing loans could be difficult or costly.
Risk managementThe ensure that the Group always has access to necessary external financing at a reasonable ex-pense, the guideline is that confirmed credit commitments should have an average remaining maturity of at least 12 months.
Exposure/commentCurrent funding agreement extends until June 30, 2019 with a possible one year extension. At year-end, the average remaining maturity on the Group’s confirmed loan commitments was 45 months (17).
LIQUIDIT Y RISK
P R O B A B I L I T Y E F F E C T
DescriptionLiquidity risk means the risk that the Group can-not meet its payment obligations as a conse-quence of inadequate access to cash and equiva-lents.
Risk managementAccording to the finance policy, the Group’s liquidity reserve, consisting of unutilised credit facilities, cash and equivalents, shall, at any given time, exceed the Group’s loan maturities for the next six months.
Exposure/commentLiquid assets amounted to SEK 165 million (128) at year-end and were allocated to cash in the amount of SEK 65 million (61); unused portion of the credit facility of SEK 0 (14) and the unutilised check credit of SEK 100 million (53). Loan maturi-ty, including principal and interest, to credit insti-tutions, over the next six months amounts to SEK 18 million (13).
INTEREST RISK
P R O B A B I L I T Y E F F E C T
DescriptionInterest rate risk refers to the impact on profits of a change in interest rates. How quickly a change in interest rates affects profits depends on the periods of fixed interest on loans and in-vestments. As the Group is a net borrower and does not invest funds in listed instruments, it is mainly the Group’s interest-bearing liabilities to credit institutions that are exposed to interest rate changes.
Risk managementThe guideline is that the average period of fixed interest for the Group’s interest-bearing liabilities to credit institutions should be three months. To avoid uncertainty regarding future interest rate levels and to gain knowledge of future interest expenses over a given period, the Group applies interest rate hedging in the form of interest rate swaps.
Exposure/commentThe average duration of the Group’s inter-est-bearing liabilities to credit institutions was three months (three). If the Group’s entire loan portfolio were to mature with a variable interest rate, a change in the interest rate of ±1 percent-age point would lead to an effect on profit of ±SEK 7 million (3) calculated on the debt to credit institutions of SEK 725 million (318) at year-end. Loans of SEK 100 million were interest rate hedged at year-end, of which SEK 50 million matures on June 30, 2018, and 50 million on June 30, 2020.
FINANCIAL CREDIT RISK
P R O B A B I L I T Y E F F E C T
DescriptionFinancial credit risk refers to the risk of losses if the counterparties with whom the Group has placed cash and equivalents, financial invest-ments or derivative instruments are unable to meet their payment obligations.
Risk managementMidsona’s finance policy defines how possible liq-uid surpluses can be invested. As long as the Group is a net borrower, any surplus liquidity shall be used to reduce loan debt. The subsidiar-ies shall place their surplus liquidity in bank ac-counts belonging to Group account systems or in bank accounts approved by the finance function.
Exposure/commentThe financial credit risk regarding cash and equivalents in bank accounts amounted to SEK 65 million (61) at year-end.
M I DSONA – ANNUAL REPORT 2016
46—risks and risk ManageMenT


Shares and shareholdersMidsona’s shares were launched on the Stockholm Stock Exchange in 1999. Series A and series B shares are listed on the Nasdaq Stockholm/Small Cap list in the FMCG retail segment under the tickers MSON A and MSON B, respectively.
Share capitalThe total number of shares at the end of the period was 42,646,480 shares (28,430,987) dis-tributed as 539,872 series A shares (474,915) and 42,106,608 series B shares (27,956,072). The number of votes at the end of the period amounted to 47,505,328 (32,705,222), where a series A share corresponds to ten votes and a series B share to one vote. In May 2016, 115,000, series A shares were reclassified as series B shares at the request of shareholders. At the 2016 Annual General Meeting, a resolution was taken to change the Articles of As-sociation and to reduce the share capital by SEK 426 million, to SEK 142 million, through an allocation to unrestricted equity without withdrawing shares, entailing the quotient value being reduced from SEK 20.00 to SEK 5.00. The Swedish Companies Registration Of-fice approved the reduction in share capital on 11 July 2016, after the period of notice for creditors had expired. On 3 August 2016, the Board of Directors of Midsona AB (publ) re-solved to implement a new issue of series A and series B shares with preferential rights for shareholders, for the partial financing of the acquisition of Internatural AB. For each share of each series already held, the new share issue, which was approved by the Extraor-dinary General Meeting on 8 September 2016, granted existing shareholders preferential rights to subscribe for one new share at a price of SEK 29.00 per share. In October 2016, a new share issue was completed, upon which, share capital increased by SEK 71 million to SEK 213 million through the issue of 179,957 series A shares and 14,035,536 series B shares. The new share issue provided Midsona with SEK 402 million after issue costs. Issue costs amounted to SEK 10 million. The new share issue was oversubscribed by 494 percent for series A shares and 39 percent for series B shares.
A series A share entitles the holder to ten votes and a series B share entitles the holder to one vote at the Annual General Meeting. All shares convey equal rights to the Compa-ny’s net assets and profits.
Capital development is reported on www.midsona.com/Investerare/Aktien.
Share turnover and bid price In January–December 2016 were traded 9,317,012 shares (5,141,528). The highest price paid for series B shares was SEK 52.00 (30.01), and the lowest was SEK 24.40 (20.15). On 31 De-cember, the most recent price paid for the share was SEK 44.00 (28.66). The total value of trade in series B share was SEK 341 million (127). The average turnover for both series A shares and series B shares together was 37,062 shares (20,702), corresponding to SEK 1,504,063 (528,172).
¹For comparison, the year the share price adjusted for the rights issue.
M I DSONA – ANNUAL REPORT 2016
48—shares and shareholders

Over 2016, series B shares rose from SEK 28.66 to 44.00, equivalent to 53.5 percent (6.5). The stock market as a whole, as indicated by the OMX Stockholm PI (OMXSPI), rose by about 5.8 percent (6.6). The index for the FMCG retail segment rose by approximately 6.5 percent (23.4).
Stock option schemeThere were one incentive programme outstanding at the end of the period. On 8 Septem-ber 2016, the Extraordinary General Meeting resolved on, from the shareholders’ preferen-tial rights, issue and transfer of a maximum of 450,000 warrants to current and future ex-ecutives in Midsona Group, wherein the CEO was offered to acquire 100,000 warrants and other senior executives in Group Management were offered to acquire 50,000 warrants per person. The period during which the warrants may be exercised will be from 1 March 2019 to 31 August 2019. The subscription price was SEK 51. The transfer of a total of 390,000 warrants to current senior management took place on market terms in October 2016 based on a calculation in accordance with the Black & Scholes model performed by PWC AB, which is considered to be independent of the Company. The fair value per op-tion was, at the time of transaction, SEK 5.30, in which the financial statements are affect-ed by SEK 2 million after deducting employee share-option plan expenses. The subscrip-tion price for outstanding warrants exceeded the average share price of series B shares on the closing date, which is why earnings per share after dilution were not calculated.
0
250
500
750
1,000
1,250
1,500
1,750
2,000
2,250
2,500
2,750
Number of shares in 1000s traded per month
DNOSAJJMAMFJDNOSAJJMAMFJ0
5
10
15
20
25
30
35
40
45
50
5 5
OMX Stockholm Consumer Goods_PI
OMX Stockholm PI
Midsona B2015 2016
Share price Traded per month
Source: SIX Financial Information
M I DSONA – ANNUAL REPORT 2016
shares and shareholders—49

OwnershipThe largest shareholder in Midsona AB (publ) was Stena Adactum AB, which, at 30 De-cember 2016, held 385,641 series A shares and 10,387,528 series B shares, corresponding to 25.3 percent of the capital and 30 percent of votes. No other shareholder held 10 percent or more of the total number of shares as per 30 December 2016. The ten largest share-holders in Midsona AB (publ) are detailed in the current shareholder list, as of 30 Decem-ber 2016.
The ten largest shareholders, 30 December 2016 Source: Euroclear Sweden AB
Number of shares Share of capital,% Share of votes,%
Stena Adactum AB 10,773,169 25.3 30.0
Handelsbanken funds 4,221,443 9.9 8.9
Other AP funds 2,521,257 5.9 5.3
Nordea Investment Funds 1,564,879 3.7 3.3
Peter Wahlberg and companies 1,534,568 3.6 3.2
LINC AB 1,444,482 3.4 3.0
BPSS PAR/FCP ECHIQUIER 1,400,000 3.3 3.0
Valbay Asset management 1,391,416 3.3 2.9
Lannebo Funds 1,325,318 3.1 2.8
Insurance company Avanza Pension 985,852 2.3 2.3
Total 27,162,384 63.8 64.7
Other shareholders 15,484,096 36.2 35.3
Total 42,646,480 100.0 100.0
The ten largest shareholders accounted for 63.8 percent (67.0) of the capital and 64.7 per-cent (68.9) of the votes.
The members of Group Management held a total of 164,306 series B shares (87,812) at year-end. Board members held 2,447,893 series B shares (1,648,950) at year-end. Neither Midsona AB (publ) nor its subsidiaries held any treasury shares at the end of 2016.
Of the total number of shares, foreign shareholders accounted for 17.1 percent of the capital and 15.6 percent of the votes, which was an increase of 17.4 percentage points and 18.7 percentage points, respectively, since last year. Of the Swedish shareholders, legal en-tities held 65.5 percent of the capital and 66.5 percent of votes, while physical persons held 34.5 percent of the capital and 33.5 percent of the vote.
The total number of shareholders (including nominee-registered) was 5,924, which was an increase of 1,357 compared with the preceding year. The distribution of shareholdings within various intervals is shown in the current shareholder list as of 30 December 2016.
Distribution of shares in intervals, 30 December 2016 Source: Euroclear Sweden AB
Number of shares Number of shareholders Shareholder,% Number of holdings Holdings,%
1 – 500 4,446 75.0 540,627 1.3
501 – 1,000 569 9.6 433,488 1.0
1,001 – 5,000 638 10.8 1,376,953 3.2
5,001 – 10,000 93 1.6 693,692 1.6
10,001 – 15,000 40 0.7 515,358 1.2
15,001 – 20,000 24 0.4 439,158 1.0
20,001 – 114 1.9 38,647,204 90.6
Total 5,924 100.0 42,646,480 100.0
M I DSONA – ANNUAL REPORT 2016
50—shares and shareholders

Dividend policy and dividendsThe dividend policy is for dividends to exceed 30 percent of profit after tax over the long term. Dividends are adjusted to take into aspects including profit levels, financial posi-tion and future development opportunities.
The Board of Directors proposes that a dividend of SEK 1.10 per share (1.10) be paid for the 2016 financial year, equivalent to SEK 46,911,128 (31,274,085). The proposed divi-dend represents a pay-out ratio of 104.5 percent (47.2) and a yield of 2.5 percent (3.3) on the shares.
Key figures per share¹
2016 2015 2014 2013 2012
Profit attributable to Parent Company shareholders SEK 1.42 2.71 2.75 2.24 2.20
Shareholders’ equity SEK 31.63 30.85 33.02 31.22 30.16
Cash flow from current operations SEK 2.19 3.56 2.46 3.87 2.11
Share price on balance sheet date (series B shares) SEK 44.00 33.00 31.00 29.00 13.40
Dividend ² SEK 1.10 1.10 1.10 1.00 0.50
Yield % 2.5 3.3 3.5 3.4 3.7
Pay-out ratio % 104.5 47.2 40.0 44.6 22.7
P/E ratio multiple 30.9 12.2 11.3 12.9 6.1¹ Midsona presents certain financial measures in the Annual Report that are not defined under IFRS. For definitions and reconciliations to IFRS, see page 108–109.
²
Stock market dataThe publication of information is guided by the information policy adopted by the Board of Directors. Annual and interim reports, as well as press releases are published in Swed-ish. Annual Report and interim reports are published in English. Information meetings, conferences with analysts, fund managers and the media are held on an on-going basis over the year.
Annual reports, interim reports and the Corporate Governance Report are available from the website, www.midsona.com, where it is also possible to subscribe for reports and order specific information. The printed Annual Report for 2016 will be available from Mid-sona’s headquarters in Malmö by 12 April, 2017 and can be ordered via www.midsona.com.
Analysts and other monitoringRemium Nordic AB compiles and distributes information on Midsona on the website www.introduce.se, where, for example, key performance indicators, press releases, share-holder data and technical analyses can be accessed.
Erik Penser Bankaktiebolag monitors Midsona through its EP Access service at www.penser.se.
Silent periodsMidsona observes a silent period of at least 30 days before the publication of its interim During this silent period, meetings with investors and analysts are avoided and Fabege representatives will not comment on financial developments.
Financial calendar 2017Interim Report, January-March 2017 . . . . . . . . . . . . . . . . . . . . . 26 April 2017Annual General Meeting in Malmö . . . . . . . . 26 April, 2017 at 3:00 p.m. Interim Report, January–June 2017 . . . . . . . . . . . . . . . . . . . . . . . . 21 July 2017Interim Report, January-September 2017 . . . . . . . . . . . . 20 October 2017Year-end report 2017 . . . . . . . . . . . . . . . . . . . . . . . . . . . . . . . . . . . . February 2018
Dividend per share and yield
20120 2.00
0.502.50
1.00
3.00
3.50
1.50
SEK
4.00
%
2013 2014 2015 2016
� Dividend (dividend for 2016 relates to the proposal by the Board of Directors)
Yield
M I DSONA – ANNUAL REPORT 2016
shares and shareholders—51

Administration report
M I DSONA – ANNUAL REPORT 2016
52—adMinisTraTion rePorT

OperationsMidsona is one of the leading consumer goods companies in the Nordic region in health and well-being, with tried-and tested products in the areas of healthfood, hygiene and beauty care. A growing proportion of the products have an ecological profile. Products are focused on making it eas-ier for all people to make their own contribution to a healthier everyday life. The Group focuses on developing and marketing strong brands.
Operations build on a portfolio of proprietary brands and international clients’ brands that are represented. The proprietary brands form the backbone of the operations and, Together with client brands, these form a strong and broad brand portfolio that is marketed to both customers and end-consumers. Customers are primarily FMCG pharmaceutical and healthfood shop chains, and other speciality shops. In addition, there is a large number of individuals, therapists and other independent small shops that the Group sells directly to via e-commerce and mail order.
Midsona is represented in four countries through wholly-owned sub-sidiaries, with sales predominantly in the Nordic market for health and well-being. Operations are divided into four business segments, the geo-graphical areas Sweden, Norway, Finland and Denmark, which have opera-tional responsibility for marketing, sales and distribution to customers. Group-wide management, administration and IT are conducted as Group functions in the Parent Company Midsona AB. For more information on the four operating segments, see Note 3 Operating Segments, page 71.
Significant events
First quarterUlrika Palm became the head of Business Area Sweden and is a member of Group Management.
Second quarterA financing agreement with Danske Bank was signed in June regarding overdraft facilities of SEK 425 million, including a complete cash manage-ment solution for the Nordic region. For more information on the financ-ing agreement, see Note 24 Liabilities to credit institutions, page 83.
Third quarterIn July, the acquisition was completed of Internatural AB, a company with a leading position in organic foods in Sweden and Norway, whose brands include Kung Markatta and Helios. The total purchase consideration amounted to SEK 690 million and was paid in cash, corresponding to SEK 810 million on a debt-free basis together with a performance compensa-tion to the seller for the period between the date on which net debt was determined and the date of access, of approximately SEK 10 million. The acquisition was financed through existing credit facilities of SEK 20 million
and the raising of new loans of SEK 800 million, of which SEK 400 million was a bridge loan. For more information on the acquisition, see Note 4 Acquisitions of operations on page 72.
In August, the Board of Midsona AB (publ) resolved to implement a new share issue with preferential rights for the shareholders, for the partial financing of the acquisition, Inter Natural AB. For more information about the new share issue, see the section Shares and shareholders, page 48.
In September Anders Dahlin became Director Nordics and is a member of Group Management.
Fourth quarterIn October, the new share issue was completed, providing Midsona with SEK 402 million after issue costs of SEK 10 million. In conjunction with this, the bridge loan of SEK 400 million, in connection with the acquisition of Internatural AB was repaid.
In October, an acquisition was made of the brand Biopharma with a product line of nutritional supplements, which are mainly sold in Norwe-gian supermarkets. The purchase consideration amounted to SEK 30 mil-lion paid in cash. Midsona has been commissioned to sell the brand in the Norwegian market since 2012. For the financial year 2015, the brand had net sales of about SEK 30 million. The acquisition had a negligible effect n earnings per share in 2016.
Net sales and profit
financial overview¹ 2016 2015Net sales, SEK million 1,744 1,174Net sales growth, % 48.6 27.6EBITDA, before non-recurring items, SEK million 134 87EBITDA margin before non-recurring items, % 7.7 7.4Operating profit, SEK million 82 48Operating margin,% 4.7 4.1Profit for the year, SEK million 45 66Profit for the year per share, SEK 1.42 2.71
¹ Midsona presents certain financial measures in the Annual Report that are not defined under IFRS.For definitions and reconcilia-tions to IFRS, see page 108–109.
Net sales amounted to SEK 1, 744 million (1, 174)an increase of 49 percent. Structural transactions contributed to the positive sales trend while pri-marily discontinued sales assignments in the Norwegian market negatively affected sales.
Operating profit before depreciation, EBITDA, amounted to SEK 134 million (87), before non-recurring items, representing a margin of 7.7 per-cent (7.4). The improvement was mainly linked to the acquisition of busi-nesses, good sales of the prioritised brands and strong cost control of operations. Operating profit amounted to SEK 82 million (48) with an operating margin of 4.7 percent (4.1). Non-recurring items negatively affected earnings by SEK 27 million (20), consisting of SEK 20 million (18) in
The Board of Directors and President of Midsona AB (publ)*, corporate identity number 556241-5322, headquartered in Malmö, Sweden, hereby presents its annual and consolidated accounts for the 2016 financial year.
M I DSONA – ANNUAL REPORT 2016
AdministrAtion report—53
restructuring costs and 7 million (6) in acquisition-related costs. The com-parative period was also positively affected by SEK 4 million, relating to a reversal of purchase consideration for previous years’ acquisitions, recog-nised as a liability.
Profit before tax was SEK 58 million (39), with net financial items increasing to an expense of SEK 24 (9) as a result of significantly higher debt. Tax on profit for the period amounted to a negative SEK 13 million (positive 27), of which a negative SEK 7 million (negative 3) consisted of current tax and negative SEK 6 million (30) in deferred tax. In the compar-ative period, a reassessment of tax loss carryforwards attributable to the Group’s Swedish operations resulted in deferred tax revenue of SEK 31 mil-lion. Profit for the year was SEK 45 million (66), corresponding to earnings per share of SEK 1.42 (2.71).
Cash flow, liquidity and financial position Cash flow from operations was boosted to SEK 69 million (87) from higher capital in inventory and receivables. Cash flow from investing activities amounted to a negative SEK 848 million (negative 254), consisting of acquisition expenses of SEK 800 million (235) and investments in tangible and intangible fixed assets of SEK 48 million (3), of which SEK 30 million consisted of investments in brands. The comparative year included a paid additional consideration relating to the preceding year’s acquisition expenses of SEK 16 million. Cash flow from financing amounted to SEK 778 million (183) and consisted of a new share issue of SEK 402 million (118) after share costs; raised loans of SEK 1,250 million (120); amortisation of bank loans of SEK 795 million (5), a change in the use of existing overdraft facilities by a negative SEK 47 million (negative 23), amortisation of lease liabilities by SEK 1 million (2) and dividends of SEK 31 million (25). Com-pleted new share issue and loans raised financed acquisitions of opera-tions. Cash and equivalents amounted to SEK 65 million (61) and there were unutilised credit facilities of SEK 100 million (67) at year-end.
Capital Structure, summary¹ 31 December 2016 31 December 2015Average capital employed, SEK million 1,636 1,074Net debt, SEK million 662 258Shareholders’ equity, SEK million 1,349 877Net debt/equity ratio, multiple 0.5 0.3
¹ Midsona presents certain financial measures in the Annual Report that are not defined under IFRS.For definitions and reconcilia-tions to IFRS, see page 108–109.
Net debt increased to SEK 662 million (258), as a result of an acquisition of operations paid in cash on the day of taking possession. Net debt/equity ratio was a multiple of 0.5 (0.3) at year-end. The ratio between net debt and EBITDA on a rolling 12-month basis was a multiple of 6.2 (3.9).
Shareholders’ equity rose to SEK 1,349 million (877). The change in equity during the year consisted of net profit of SEK 45 million, translation differences from translation of foreign operations totalling a negative SEK 56 million, dividends of SEK 31 million and a new share issue of net SEK 402 million. The debt/equity ratio was 51.5 percent (56.4) at the year-end.
InvestmentsInvestments in intangible and tangible fixed assets amounted to SEK 48 million (3) and consisted mainly of brand and production-related invest-ments. Amortisation and depreciation for the period amounted to SEK 25 million (19), divided between SEK 16 million (13) in amortisation of intangi-ble fixed assets and depreciation of SEK 9 million (6) on tangible fixed assets.
Risks and risk managementFor risks and risk management, refer to page 42.
Guidelines for remunerations to senior executivesThe Board’s proposed guidelines for remuneration to senior executives adopted at the Annual General Meeting April 26, 2017 are consistent in all material respects with the previous guidelines, except for a clarification introduced to the effect that the guidelines are not legally apply to incen-tive programmes adopted pursuant to Chapter 16. Companies Act. For information on the guidelines for remunerations to senior executives adopted by the 2016 Annual General Meeting, see Note 9 Employees, personnel expenses and senior executives’ remunerationss on page 74.
Share and shareholdersThe total number of shares was 42,646,480 shares (28,430,987) distrib-uted at 539, 872 series A shares (474, 915) and 42,106,608 series B shares (27,956,072), at year-end. At the Annual General Meeting, each series A share conveys ten votes and each series B share conveys one vote. The number of votes at year end was 47,505,328 votes (32,705,222). In May 115,000 series A shares were reclassified as series B shares at the request of shareholders. At the Annual General Meeting 2016 it was resolved that the share capital be reduced by SEK 426 million through provisions to restricted equity without withdrawal of shares, entailing that the quotient value is reduced from SEK 20.00 to SEK 5.00. Companies Agency approved a share capital reduction in July. In October, a new issue was completed, of which capital increased by SEK 71 million to SEK 213 million through an issue of 179,957 new series A shares and 14,035,536 new series B shares.
All shares convey equal rights to the Company’s net assets and profits. Neither the Company nor its subsidiaries hold any treasury shares. The Articles of Association contain no restrictions on the transferability of shares.
The largest shareholder in the Company was Stena Adactum AB, which held 385,641 series A shares (214,419) and 10,387,528 series B shares (6,810,019), representing 25.3 percent of capital (24.7) and 30.0 percent of the voting rights (27.4) on 31 December 2016. No other shareholder held 10 percent or more of the total number of shares as per 31 December 2016. To the Company’s knowledge, there are no agreements between share-holders that could entail limitations to the right to transfer shares.
M I DSONA – ANNUAL REPORT 2016
54—AdministrAtion report

The Annual General Meeting appoints and dismisses members of the Board of Directors and amends the Articles of Association.
The Company has no commercial agreements that could be affected if control of the Company were to change as a consequence of a public take-over bid, beyond valid applicable credit facilities. However, there are agree-ments between the Company and senior executives that prescribe com-pensation if these individuals are dismissed without due cause or if their employment is terminated as a consequence of a public takeover bid for shares in the Company. Agreements between the Company and other employees regulating resignations or dismissal by the Company follow normal practices in the labour market.
For more information about the issue, see the section Shares and shareholders, page 48.
Corporate GovernanceFor the Corporate Governance Report, please see page 96.
Future prospectsConsumer demand for products in the areas of health and well-being in general, and ecological produce in particular, is expected to continue increasing. Midsona is well-positioned in attractive growth segments and the assessment is that the Group will grow over the year with improved EBITDA.
Parent CompanyNet sales amounted to SEK 28 million (23), and related primarily to invoic-ing of services provided internally within the Group.
Profit before tax amounted to SEK 243 million (17). Profit before tax included received Group contributions of SEK 166 million, impairment of shares in subsidiaries of SEK 197 (1) and dividends from subsidiaries of SEK 284 million (40), of which SEK 284 (39) comprised anticipated dividends.
Investments in tangible and intangible fixed assets amounted to SEK 0 million (0). Depreciation and amortisation on tangible and intangible fixed assets amounted to SEK 0 million (2).
Cash and equivalents, including unutilised credit facilities, amounted to SEK 125 million (72). At year-end, borrowing from credit institutions amounted to SEK 725 million (257). In June, a financing agreement with Danske Bank was signed regarding overdraft facilities of SEK 425 million. In connection with the acquisition of Internatural AB during the third quarter, new loans of SEK 800 million were taken, of which SEK 400 mil-lion consisted of a bridge financing facility that was amortised in October 2016 following completion of the new issue.
Shareholders’ equity amounted to SEK 1,300 million (718), of which restricted equity amounted to SEK 1,029 million (92). The changes in equity during the year consisted of earnings of SEK 211 million, dividends of SEK 31 million and a new share emission of SEK 402 after issue costs. In July, the share capital was reduced by SEK 426 million through provisions to restricted equity without withdrawal of shares, entailing that the quo-tient value was reduced from SEK 20 to SEK 5.
At year-end, the Parent Company had nine employees (nine).
Proposed appropriation of profit or loss The following amount in SEK is at the disposal of the Annual General Meeting:
Share premium reserve SEK 419,016,309Profit/loss brought forward SEK 398,485,578Loss for the year SEK 210,791,452
Total SEK 1,028,293,339
The Board of Directors proposes that the unrestricted shareholders’ equity in the Parent Company, amounting to SEK 1,028,293,339 be appropriated as follows:
Dividend, SEK 1.10 per share SEK 46,911,128 Carried forward in new account SEK 981,382,211Total SEK 1,028,293,339
Statement by the Board of Directors regarding the proposed dividendAt the 2017 Annual General Meeting, shareholders shall take a position regarding matters including the dividend proposed by the Board of Direc-tors.
The proposed dividend decreases the equity/assets ratio in the Parent Company to 47 percent and the consolidated equity/assets ratio to 50 percent. The proposed measure does not affect the Company’s capacity to meet current and foreseen payment obligations in a timely manner. The Company’s liquidity forecast includes contingencies for managing varia-tions in on-going payment obligations. The Company’s financial position does not give rise to any assessment other than that the Company can continue its operations and that it can be expected to meet its obligations in both the short and long term.
It is the assessment of the Board of Directors that the scope of the shareholders’ equity as reported in the latest annual report is in reasonable proportion to the scope of the Company’s operations and the risks associ-ated with the conduct of the operations taking the proposed dividend into account.
With reference to the above and to information that has otherwise come to the attention of the Board of Directors, it is the Board’s view that a comprehensive assessment of the financial position of the Company and the Group indicates that the dividend is defensible in accordance with Chapter 17, Section 3, paragraphs 2 and 3 of the Companies Act, that is, with reference to requirements imposed by the nature, scope and risks of the operations on consolidated shareholders’ equity, as well as the Group’s consolidation needs, liquidity and position in other regards.
The financial accounts were approved for publication by the Board of Directors of the Parent Company on 30 March 2017.
With regard to the Company’s profits and position in other regards, please see the ensuing financial accounts and associated notes to the financial statements.
M I DSONA – ANNUAL REPORT 2016
AdministrAtion report—55
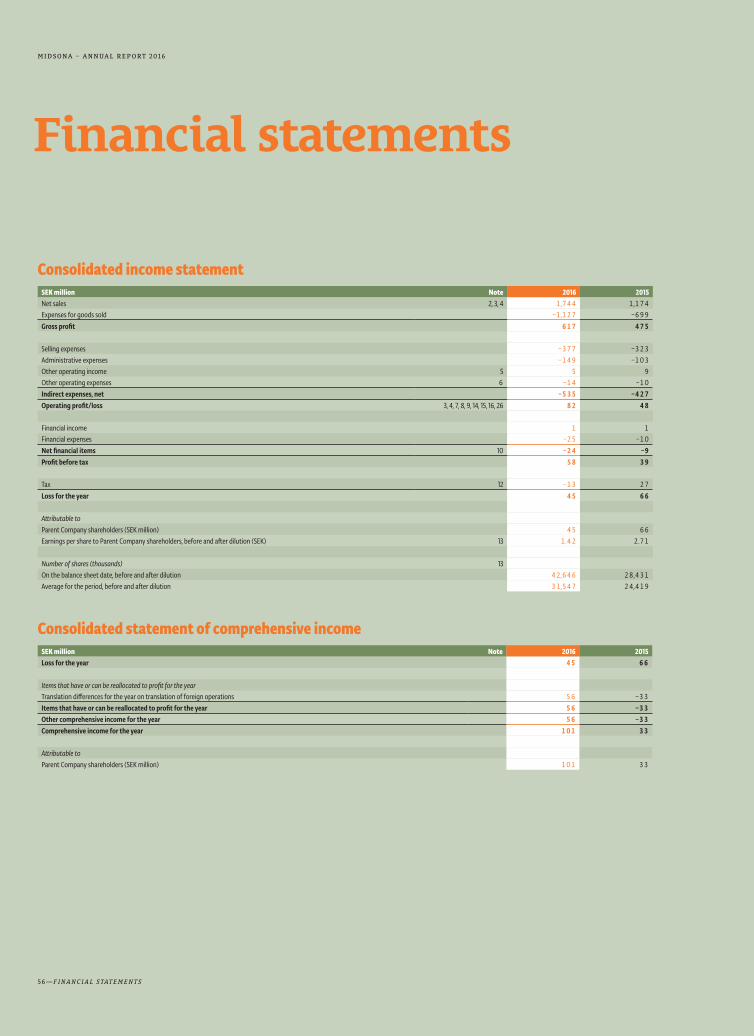
Financial statements
Consolidated income statementSEK million Note 2016 2015Net sales 2, 3, 4 1,744 1,174Expenses for goods sold –1,127 –699Gross profit 617 475
Selling expenses –377 –323Administrative expenses –149 –103Other operating income 5 5 9Other operating expenses 6 –14 –10Indirect expenses, net –535 –427Operating profit/loss 3, 4, 7, 8, 9, 14, 15, 16, 26 82 48
Financial income 1 1Financial expenses –25 –10Net financial items 10 –24 –9Profit before tax 58 39
Tax 12 –13 27Loss for the year 45 66
Attributable toParent Company shareholders (SEK million) 45 66Earnings per share to Parent Company shareholders, before and after dilution (SEK) 13 1.42 2.71
Number of shares (thousands) 13On the balance sheet date, before and after dilution 42,646 28,431Average for the period, before and after dilution 31,547 24,419
Consolidated statement of comprehensive incomeSEK million Note 2016 2015Loss for the year 45 66
Items that have or can be reallocated to profit for the yearTranslation differences for the year on translation of foreign operations 56 –33Items that have or can be reallocated to profit for the year 56 –33Other comprehensive income for the year 56 –33Comprehensive income for the year 101 33
Attributable toParent Company shareholders (SEK million) 101 33
M I DSONA – ANNUAL REPORT 2016
56—FinAnciAl stAtements

Consolidated balance sheetSEK million Note 31 December 2016 31 December 2015AssetsIntangible fixed assets 14 1,940 1,067Tangible assets 15, 16 55 47Non-current receivables 19 2 2Deferred tax receivables 12 82 79Fixed assets 2,079 1,195
Inventories 20 244 151Tax receivables 1 3Accounts receivable 21 209 131Other receivables 19 0 2Prepaid expenses and accrued income 22 22 12Cash and equivalents 29, 33 65 61Current assets 541 360
Assets 3, 4, 30, 32 2,620 1,555
Shareholders’ equityShare capital 213 568Additional paid-up capital 466 166Reserves 31 –25Profit brought forward, including profit for the year 639 168Shareholders’ equity 23 1,349 877
LiabilitiesNon-current interest-bearing liabilities 24, 29 696 250Other provisions 27 4 –Deferred tax liabilities 12 207 135Non-current liabilities 907 385
Current interest-bearing liabilities 24, 29 31 69Accounts payable 212 132Other current liabilities 25 28 28Accrued expenses and deferred income 28 83 61Other provisions 27 10 3Current liabilities 364 293
Liabilities 1,271 678
Equity and liabilities 3, 4, 30, 32 2,620 1,555
M I DSONA – ANNUAL REPORT 2016
FinAnciAl stAtements—57
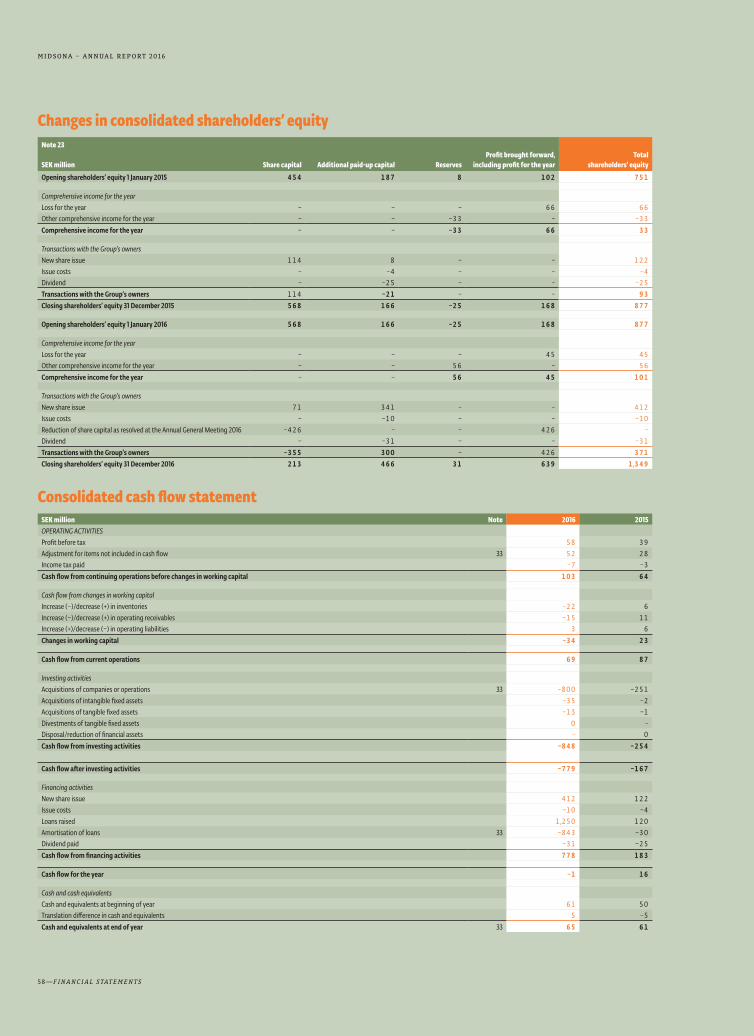
Changes in consolidated shareholders’ equityNote 23
SEK million Share capital Additional paid-up capital ReservesProfit brought forward,
including profit for the yearTotal
shareholders’ equity
Opening shareholders’ equity 1 January 2015 454 187 8 102 751
Comprehensive income for the yearLoss for the year – – – 66 66Other comprehensive income for the year – – –33 – –33Comprehensive income for the year – – –33 66 33
Transactions with the Group’s ownersNew share issue 114 8 – – 122Issue costs – –4 – – –4Dividend – –25 – – –25Transactions with the Group’s owners 114 –21 – – 93Closing shareholders’ equity 31 December 2015 568 166 –25 168 877
Opening shareholders’ equity 1 January 2016 568 166 –25 168 877
Comprehensive income for the yearLoss for the year – – – 45 45Other comprehensive income for the year – – 56 – 56Comprehensive income for the year – – 56 45 101
Transactions with the Group’s ownersNew share issue 71 341 – – 412Issue costs – –10 – – –10Reduction of share capital as resolved at the Annual General Meeting 2016 –426 – – 426 –Dividend – –31 – – –31Transactions with the Group’s owners –355 300 – 426 371Closing shareholders’ equity 31 December 2016 213 466 31 639 1,349
Consolidated cash flow statementSEK million Note 2016 2015OPERATING ACTIVITIESProfit before tax 58 39Adjustment for items not included in cash flow 33 52 28Income tax paid –7 –3Cash flow from continuing operations before changes in working capital 103 64
Cash flow from changes in working capitalIncrease (–)/decrease (+) in inventories –22 6Increase (–)/decrease (+) in operating receivables –15 11Increase (+)/decrease (–) in operating liabilities 3 6Changes in working capital –34 23
Cash flow from current operations 69 87
Investing activitiesAcquisitions of companies or operations 33 –800 –251Acquisitions of intangible fixed assets –35 –2Acquisitions of tangible fixed assets –13 –1Divestments of tangible fixed assets 0 –Disposal/reduction of financial assets – 0Cash flow from investing activities –848 –254
Cash flow after investing activities –779 –167
Financing activitiesNew share issue 412 122Issue costs –10 –4Loans raised 1,250 120Amortisation of loans 33 –843 –30Dividend paid –31 –25Cash flow from financing activities 778 183
Cash flow for the year –1 16
Cash and cash equivalentsCash and equivalents at beginning of year 61 50Translation difference in cash and equivalents 5 –5Cash and equivalents at end of year 33 65 61
M I DSONA – ANNUAL REPORT 2016
58—FinAnciAl stAtements

Income Statement, Parent CompanySEK million Note 2016 2015Net sales 2 28 23Selling expenses 0 0Administrative expenses –37 –34Other operating income 5 3 4Other operating expenses 6 –4 –4Operating profit/loss 8, 9, 14, 15, 16, 26 –10 –11
Profit from participations in subsidiaries 10 87 39Financial income 10 19 5Financial expenses 10 –19 –16Loss after financial items 77 17
Allocations 11 166 –Profit before tax 243 17
Tax 12 –32 21Loss for the year 211 38
Parent Company statement of comprehensive incomeSEK million Note 2015 2014Loss for the year 211 38
Items that have or can be reallocated to profit for the year
Other comprehensive income for the year – –
Comprehensive income for the year 211 38
M I DSONA – ANNUAL REPORT 2016
FinAnciAl stAtements—59

Balance Sheet, Parent CompanySEK million Note 31 December 2016 31 December 2015Fixed assetsIntangible fixed assets 14 1 1Tangible assets 15, 16 0 0
Participations in subsidiaries 17 1,405 790Receivables from subsidiaries 18, 31 742 185Deferred tax receivables 12 3 36Financial assets 2,150 1,011
Fixed assets 2,151 1,012
Current assetsReceivables from subsidiaries 18, 31 462 44Other receivables 19 1 1Prepaid expenses and accrued income 22 7 3Current receivables 470 48
Cash and bank balances 29, 33 25 5Current assets 495 53
Assets 30, 32 2,646 1,065
Shareholders’ equityRestricted shareholders’ equityShare capital 213 568Statutory reserve 58 58Restricted shareholders’ equity 271 626
Unrestricted shareholders’ equityShare premium reserve 419 119Fair value fund – 22Profit/loss brought forward 399 –87Loss for the year 211 38Unrestricted shareholders’ equity 1,029 92
Shareholders’ equity 23 1,300 718
Non-current liabilitiesliabilities to credit institutions 24, 29 695 190Liabilities to subsidiaries 18, 31 481 0Non-current liabilities 1,176 190
Current liabilities liabilities to credit institutions 24, 29 30 67Accounts payable 2 3Liabilities to subsidiaries 18, 31 133 84Other current liabilities 25 0 0Accrued expenses and deferred income 28 5 3Current liabilities 170 157
Equity and liabilities 30, 32 2,646 1,065
M I DSONA – ANNUAL REPORT 2016
60—FinAnciAl stAtements

Changes in equity for the Parent CompanyNote 23 Restricted shareholders’ equity Unrestricted shareholders’ equity
SEK million Share capitalStatutory
reserveShare premium
reserve Fair value fund
Profit brought forward, including profit for the year
Total shareholders’ equity
Opening shareholders’ equity 1 January 2015 454 58 140 22 –87 587Loss for the year – – – – 38 38Other comprehensive income for the year – – – – – –Comprehensive income for the year – – – – 38 38
New share issue 114 – 8 – – 122Issue costs – – –4 – – –4Dividend – – –25 – – –25Closing shareholders’ equity 31 December 2015 568 58 119 22 –49 718
Opening shareholders’ equity 1 January 2016 568 58 119 22 –49 718Loss for the year – – – – 211 211Other comprehensive income for the year – – – – – –Comprehensive income for the year – – – – 211 211
New share issue 71 – 341 – – 412Issue costs – – –10 – – –10Reduction of share capital as resolved at the Annual General Meeting 2016 –426 – – – 426 –Dividend – – –31 – – –31Conversion according to the new accounting principle – – – –22 22 –Closing shareholders’ equity 31 December 2016 213 58 419 – 610 1,300
Parent Company cash flow statementSEK million Note 2016 2015Operating activitiesLoss after financial items 77 17Adjustment for items not included in cash flow 33 –86 –38Cash flow from continuing operations before changes in working capital –9 –21
Cash flow from changes in working capitalIncrease (–)/decrease (+) in operating receivables –10 43Increase (+)/decrease (–) in operating liabilities 2 1Changes in working capital –8 44
Cash flow from current operations –17 23
Investing activitiesAcquisitions of companies or operations 33 –834 –243Acquisitions of intangible fixed assets 0 0Divestments of intangible fixed assets – –Acquisitions of tangible fixed assets – 0Change in financial assets 26 7Cash flow from investing activities –808 –236
Cash flow after investing activities –825 –213
Financing activitiesNew share issue 412 122Issue costs –10 –4Loans raised 1,361 136Amortisation of loans 33 –887 –12Dividend paid –31 –25Cash flow from financing activities 845 217
Cash flow for the year 20 4
Cash and cash equivalentsCash and equivalents at beginning of year 5 1Cash and equivalents at end of year 33 25 5
M I DSONA – ANNUAL REPORT 2016
FinAnciAl stAtements—61

Notes to the financial statements Note 1 Accounting principles
Group accounting principles
Compliance with standards and regulations The consolidated financial statements have been prepared in accordance with International Financial Reporting Standards (IFRS) issued by the International Accounting Standards Board (IASB) and interpretations issued by the IFRS Interpretations Committee (IFRIC) as approved by the European Commission for application within the EU. In addition, the Swed-ish Financial Reporting Board’s recommendation RFR 1 Supplementary Accounting Rules for Groups has been applied.
The Parent Company applies the same accounting principles as the Group except in the cases listed below under “Parent Company accounting principles”.
Basis of valuation applied in the preparation of the financial statementsAssets and liabilities are reported at historical cost except for certain financial assets and liabilities measured at fair value or amortised cost. Financial assets and liabilities measured at fair value consist of derivatives and financial assets classified as financial assets at fair value through profit for the year.
Functional and presentation currencyThe Parent Company’s functional currency is the Swedish krona (SEK), which is also the reporting currency for the Parent Company and the Group. This means that the financial statements are presented in SEK. All amounts, unless otherwise stated, are rounded off to the nearest million.
Estimates and assumptions in the financial statementsPreparation of the financial accounts in accordance with IFRS requires management making assessments, estimations and assumptions that affect the application of the accounting principles and the figures reported for assets , liabilities and expenses.
Estimates and assumptions are reviewed regularly. Changes in esti-mates are recognised in the period in which the change is made if the revi-sion only affects that period or within the period in which the revision is made and future periods if the revision affects both current and future period.
Assumptions made by management in the application of IFRS that have a significant impact on the financial statements and estimates that can result in significant adjustments in future financial statements are described in more detail in Note 35 Significant estimates and assumptions.
Accounting principles appliedWith the exceptions described in closer detail, the following accounting principles have been consistently applied in the reporting consolidation of the Parent Company and subsidiaries in the consolidated financial state-ments.
Changes in accounting principles due to new or amended IFRSThe new standards and the amendments and revisions to standards and new interpretations that came into effect on 1 January 2016 have had no impact on the Group’s Financial statements for the 2016 financial year. Changes to the Annual Accounts Act and IAS 1 have a limited impact on the design of the financial statements.
New IFRS that have yet to begin being applied The following new standards are published by the IASB, but have either not yet come into force or been adopted by the EU.
� IFRS 9 Financial instruments, issued on 24 July 2014 will replace IAS 39 Financial instruments: Classification and Measurement. IFRS 9 provides for the classification, valuation and impairment of financial instru-ments and hedge accounting. The standard applies to financial years beginning 1 January 2018 and has yet to be adopted by the EU.
� IFRS 15 Revenue from Contracts with Customers, Issued on 28 May 2014 to replace IAS 18 Income and IAS 11 Construction Contracts. IFRS 15 rep-resents a model for revenue recognition (five-step model) based on when control of a good or service is transferred to the customer. The standard applies to financial years commencing 1 January 2018 or later, with earlier application permitted. The standard has been adopted by the EU.
� IFRS 16 Leases, issued on 13 January 2016, will replace IAS 17 Leases. IFRS 16 entails for the lessee that virtually all leases should be recog-nised in the balance sheet. The classification of operating and financial leases should therefore no longer be made. In the income statement, the depreciation is recognised separately from interest expense related to the lease liability. The standard applies to financial years commencing 1 January 2019 with earlier application permitted, pro-vided that IFRS 15 is applied simultaneously. The standard has yet to be adopted by the EU.
Management has not yet completed a detailed analysis of the effects of applying IFRS 9, IFRS 15 and IFRS 16 and, accordingly, cannot quantify the impact. Since IFRS 15 contains additional disclosure requirements, how-ever, the application is likely to result in increased note disclosures con-cerning revenues.
M I DSONA – ANNUAL REPORT 2016
62—notes to the F inAnciAl stAtements

Other new and amended standards and interpretations are not deemed to have any effect on the consolidated financial statements in the initial period of application.
Classification Fixed assets and non-current liabilities essentially consist of amounts expected to be recovered or settled after more than 12 months from the balance sheet date.
Current assets and liabilities essentially consist of amounts expected to be recovered or settled within 12 months from the balance sheet date.
Consolidated accountsSubsidiaries are all companies over which Midsona AB (publ) has a con-trolling influence. A controlling influence exists if Midsona AB (publ) has influence over the object of investment, is exposed or entitled to variable returns from its commitment and can exert its influence over the invest-ment to affect yield.
In assessing whether a controlling influence exists, shares conveying potential voting rights are taken into account, as is the existence of de facto control. All subsidiaries within the Group are wholly owned subsidi-aries.
Subsidiaries are consolidated from the date on which control is trans-ferred to the Group and are excluded from the consolidated financial statements from the date on which that controlling influence ceases.
The acquisition method is applied for the accounting of business com-binations. The cost of an acquisition is measured as the fair value of the transferred assets, liabilities and shares issued by the Group. The purchase consideration includes the fair value of all assets or liabilities that are the result of an agreement on conditional purchase consideration. Transaction expenses that are directly attributable to an acquisition are expensed in consolidated profit for the year. Identifiable acquired assets and liabilities assumed in a business combination are initially measured at their fair value on the acquisition date.
In the case of acquisitions where the transferred consideration exceeds the fair value of the identifiable acquired net assets, the difference is rec-ognised as goodwill. When the difference is negative – a bargain purchase – this is recognised directly in profit for the year.
Group-internal receivables and liabilities, income and expenses, as well as unrealised gains and losses arising from Group-internal transactions between Group companies are eliminated in full when preparing the con-solidated financial statements.
Where valuations of assets and liabilities differ at the Group and Company levels, the tax effect is taken into account and recognised as a deferred tax asset or deferred tax liability. However, deferred tax is not taken into account with regard to goodwill at the Group level.
Segment reporting Operating segments are reported in a manner consistent with the internal reporting provided to the highest executive decision maker. The highest executive decision maker is the function responsible for allocating resources and assessing performance of the operating segment’s results. In the Group, this function has been identified as Group Management. The principal basis for the division is geographical areas. See Note 3 Operating Segments for further details of the division and a presentation of the operating segments.
Foreign currency Transactions in foreign currencies Foreign currency transactions are translated into the functional currency at the exchange rate prevailing on the transaction date. Functional cur-rency is the currency of the primary economic environments in which the Group companies operate. Monetary assets and liabilities denominated in foreign currencies are translated into the functional currency at the exchange rate prevailing on the balance sheet date. Exchange differences arising on translation are recognised in profit for the year. Exchange gains/losses on operating assets/liabilities are recognised in other operating income/expenses and gains/losses on financial assets and liabilities are recognised in financial income/expenses.
Foreign operations’ financial statements Assets and liabilities in foreign operations, including goodwill and other consolidated surplus and deficit values, are translated from their func-tional currency to the Group’s reporting currency, SEK, at the exchange rate prevailing on the balance sheet date. Income and expenses in foreign operations are translated to SEK at an average rate that approximates the exchange rates prevailing on the respective transaction dates. Translation differences arising on the translation of foreign operations are recognised in other comprehensive income as a translation reserve. On divestment of a foreign operation, the accumulated translation differences attributable to the operations are realised in profit for the year.
Income
Goods Income is recognised in profit for the year after the significant risks and rewards of ownership have been transferred to the buyer and no disposi-tion or possibility of effective control over the goods remains. If there is considerable uncertainty surrounding the payment, associated expenses or the risk of returns, no income is recognised. In most cases, this means that income is recognised upon delivery of goods to the customer in accordance with the agreed terms of delivery. Income is recognised at fair
M I DSONA – ANNUAL REPORT 2016
notes to the F inAnciAl stAtements—63

value after deducting VAT, chain discounts or other discounts, returns and shipping.
ServicesIncome from sales assignments and other similar services are recognised in profit for the year as the work is performed.
Operating expenses
Expenses for goods soldExpenses for goods sold encompass direct and indirect expenses for func-tions attributable to generated income (manufacturing, warehousing, inventory coordination).
Selling expenses Selling expenses encompass both expenses for activities and functions connected directly to the consumer (marketing, product manager, market-ing coordinator), and expenses for activities and functions connected with customers (sales, key account manager, order reception).
Administrative expensesAdministrative expenses encompass expenses for functions such as pur-chasing, IT, finance and administration, product and packaging develop-ment, quality systems and quality assurance, as well as Group Manage-ment.
Other operating income and expensesOther operating income and expenses include income and expenses not normally considered to belong to the actual business, for example, exchange gains/losses on operating assets/liabilities and capital gains/losses on disposal of assets. Exchange rate gains/losses are reported net.
Non-recurring itemsNon-recurring items comprise significant items that, because of their size or incidence, are reported separately to enable a better understanding of the Group’s financial development. Non-recurring items are reported in the function to which they are attributable, depending on the nature of the item and consist of restructuring charges, acquisition-related expenses and reversal of liabilities for contingent considerations from prior acquisi-tions.
Leasing
Operating leases Expenses associated with operating leases are recognised in profit for the year over the lease term. Benefits received in connection with the signing of a contract are recognised in net income as a reduction of the lease pay-ments over the lease agreement.
Financial leases Minimum lease fees are allocated between interest expense and amortisa-tion of the outstanding liability. The interest expense is distributed across the leasing period so that each accounting period is burdened by an amount equal to a fixed interest rate for the liability reported in each period. Variable expenses are expensed in the period they are incurred.
Financial income and expenses Financial income comprises interest income on funds invested, dividend income, gain on changes in the value of financial assets at fair value through profit and gains on hedging instruments that are recognised in profit for the year.
Interest income on financial instruments is recognised using the effec-tive interest method (see below). Dividend income is recognised when the right to receive payment is established. Profit from sale of financial instru-ments is recognised when the risks and rewards associated with owner-ship are transferred to the buyer and the Group no longer has control over the instrument.
Financial expenses consist of interest expenses on loans, commitment charges on borrowing limits, revaluation losses on financial assets at fair value through profit, impairment of financial assets, and losses on hedging instruments that are recognised in net income. Borrowing expenses are not recognised in profit to the extent they are directly attributable to the acquisition, construction or production of assets that take a substantial period of time to complete for their intended use or sale. In these cases, they are included in the cost of the assets. The Group currently has no assets duly qualified.
Foreign exchange gains/losses on financial assets/liabilities are recog-nised net.
The effective interest rate is the rate that exactly discounts estimated future cash payments or receipts during a financial instrument’s expected life at the reported net value of the financial asset or liability. The calcula-tion includes all fees paid or received between parties that are a part of the effective interest rate, transaction expenses and all other premiums or discounts.
TaxesIncome tax is recognised in the income statement except when the under-lying transaction is recognised in other comprehensive income or share-holders’ equity, in which case it is recognised in other comprehensive income or in shareholders’ equity.
Current tax Current tax is the tax payable or refundable for the current year using the tax rates that have been enacted or substantively enacted as per the balance sheet date. Current tax also includes adjustments of current tax attributable to previous periods.
Deferred tax Deferred tax is calculated using the balance sheet method, providing for temporary differences between the reported values and tax bases of assets and liabilities. Temporary differences are not recognised in consoli-dated goodwill, or for differences arising on the initial recognition of assets and liabilities that are not business combinations that, at the time of the transaction, affect neither accounting nor taxable profit. Nor are tempo-rary differences taken into account that relate to participations in subsidi-aries that are not expected to be reversed within the foreseeable future. The assessment of deferred tax is based on how the underlying assets or liabilities are expected to be realised or settled. Deferred tax is calculated applying the tax rates and regulations in force or substantively approved on the balance sheet date.
M I DSONA – ANNUAL REPORT 2016
64—notes to the F inAnciAl stAtements

Deferred tax is reported together with current tax in profit for the year. Deferred tax assets are recognised among fixed assets and deferred tax liabilities are recognised among non-current liabilities in the consolidated balance sheet.
Deferred tax assets pertaining to deductible temporary differences and tax loss carryforwards are recognised only to the extent that it is probable that they will be utilised. The value of deferred tax assets is reduced when it is no longer probable that they can be utilised.
Any additional income tax incurred on payment of dividends is recog-nised at the same time as the dividend is recognised as a liability.
Financial instruments Financial instruments recognised in the balance sheet include cash and equivalents, loans receivable, accounts receivable, financial investments and derivatives. Liabilities include accounts payable, borrowings and derivatives.
Recognition in and derecognition from the balance sheetA financial asset or financial liability is recognised in the balance sheet when the Company becomes party to the contractual terms. A receivable is recognised when the Company has performed and a contractual obliga-tion exists for the other party to pay, even if the invoice has not been sent. Accounts receivable are recognised in the balance sheet once an invoice has been sent. Liabilities are recognised when the counterparty has per-formed and there is a contractual obligation to pay, even if the invoice has not been received. Accounts payable are recognised when invoices are received.
A financial asset is derecognised when the rights according to the agreement are realised, expire or the Company loses control over them. This also applies for parts of a financial asset. A financial liability is derec-ognised from the balance sheet when the contractual obligation is dis-charged or otherwise extinguished. The same applies to part of a financial liability.
Financial assets and financial liabilities are offset and the net amount is recognised in the balance sheet only when there is a legally enforceable right to offset the amounts and there is an intention to settle the items by a net amount or to simultaneously realise the asset and settle the liability.
The acquisition or sale of financial assets is reported on the transaction date, which is the date on which the Company pledges to acquire or sell the asset.
Classification and measurementFinancial instruments that are not derivatives are initially recognised at cost, representing fair value plus transaction expenses for all financial instruments except those classified as financial assets at fair value through profit for the year, which are recognised excluding transaction expenses.
On initial recognition, a financial instrument is classified based on the purpose for which it was acquired. The classification determines how the financial instrument is measured after initial recognition, as described below.
Derivatives are initially recognised at fair value, meaning that transac-tion expenses are charged to profit for the period. After initial recognition, the derivative is recognised as income or expense in operating profit or in net financial items based on the intended use of the derivative instrument and whether the use is related to an operating item or a financial item.
The Group does not apply hedge accounting under IAS 39.
Financial assets at fair value through profit for the yearThis category includes the Group’s derivatives with a positive fair value.
Financial assets in this category are measured at fair value with changes in value recognised in profit for the year.
Derivatives included in the sub-category are held for trade. No assets are administered in accordance with the Fair Value Option.
Loans and receivablesLoans and accounts receivable are financial assets that are not derivatives, that have fixed or determinable payments and that are not listed in an active market.
These assets are measured at amortised cost. Amortised cost is deter-mined using the effective interest rate calculated at the time of acquisition, although accounts receivable normally have a short expected duration and are therefore recognised at their nominal amounts without discounting.
Accounts receivable are reported at the amount expected to be received after deduction of impairment losses based on individual assess-ment for each customer. Such impairment losses are recognised in operat-ing expenses in profit for the year.
Cash and cash equivalentsCash and equivalents consist of cash and immediately available balances with banks and similar institutions, as well as current, highly-liquid invest-ments with maturities of less than three months, which are subject to only an insignificant risk of fluctuations in value.
Financial liabilities at fair value through profitThis category includes the Group’s derivatives with negative fair value.
Financial liabilities in this category are measured at fair value with changes in value recognised in profit for the year.
Derivatives included in the sub-category are held for trade. No assets are administered in accordance with the Fair Value Option.
Other financial liabilitiesBorrowings, accounts payable and other liabilities are included in this category.
Borrowings are measured at amortised cost, net after transaction expenses. Amortised cost is determined using the effective interest rate calculated when the liability was incurred. This means that surplus and deficit values, as well as direct issue expenses are periodised over the maturity of the liability. Non-current borrowings have an expected dura-tion of more than one year and current borrowings have a maturity of less than one year.
Accounts payable are measured at amortised cost. However, accounts have a short expected maturity and are therefore normally measured at nominal value without discounting.
Derivatives The Group’s derivative instruments have been acquired to financially hedge its interest and exchange exposures. The Group does not apply hedge accounting under IAS 39.
Receivables and liabilities in foreign currenciesTo hedge receivables or liabilities against exchange rate risk, currency futures are used. Hedge accounting is not applied to provide protection against exchange rate risk, since a financial hedge is reflected in the
M I DSONA – ANNUAL REPORT 2016
notes to the F inAnciAl stAtements—65

accounts in that both the underlying asset or liability and the hedging instrument are recognised at the exchange rate on the balance sheet date and exchange rate fluctuations are recognised in profit for the year.
Exchange rate differences arising pertaining to operating receivables and liabilities are recognised in operating profit, while exchange rate dif-ferences pertaining to financial assets and liabilities are recognised in net financial items.
Management of exchange rate risk in forecasted sales in foreign currenciesCurrency futures are used to hedge probable forecast sales in foreign currencies. Hedge accounting is not used to provide protection against exchange rate risk in forecast sales. These forward exchange contracts are instead measured at fair value on each reporting date with changes in value being recognised in profit for the year. This means that profit for the year will be charged with changes in the value of the forward exchange contracts, despite the hedged transaction not yet having taken place.
Changes in the value of forward exchange contracts are recognised in operating profit.
Management of interest in forecasted interest paymentsFor hedges of probable forecasted interest payments on existing loans, interest rate swaps are used, by which the Company receives a variable rate and pays fixed interest. For protection against interest rate risk in forecasted interest payments are not used hedge accounting. These for-ward exchange contracts are instead measured at fair value on each reporting date with changes in value being recognised in profit for the year.
Changes in value of interest rate swaps are recognised in net interest income.
Tangible fixed assets
Owned assetsTangible fixed assets are recognised as assets in the consolidated balance sheet if it is probable that future economic benefits will flow to the Group and the cost of the asset can be measured reliably.
Tangible assets are stated at cost less accumulated depreciation and any accumulated impairment losses.
Cost includes expenses directly attributable to the acquisition of the asset to put it in place and bring it to such a condition that it can be used in accordance with the purpose of the acquisition. Such expenses include purchase consideration, shipping and handling, installation, registration of title, consulting and legal services.
Tangible fixed assets consisting of components with different useful lives are treated as separate components of tangible assets.
Leased assetsLeases are classified as either financial or operating leases. Financial leas-ing is when the risks and rewards associated with ownership are substan-tially transferred to the lessee. Where this is not the case, the lease is con-sidered to be an operational lease.
Assets leased under finance leases are recognised as fixed assets in the balance sheet and are initially measured at the leased asset’s fair value or the present value of the minimum lease payments at the start of the con-tract, whichever is lower. The obligation to pay future lease payments is recognised in the balance sheet under non-current interest-bearing liabili-ties and current interest-bearing liabilities.
Assets leased under operating leases are generally not recognised as assets in the balance sheet. Nor do operating leases give rise to a liability.
Additional expensesAdditional expenses for acquiring replacement components are added to the fixed asset’s carrying amount or recognised as a separate asset only when it is probable that future economic benefits associated with the asset will flow to the Group and the cost of the asset can be measured reli-ably. The carrying amount of the replaced component is derecognised. All other types of repairs and maintenance are expensed in profit for the year in the period in which they arise.
Amortisation principlesDepreciation is applied on a linear basis over the asset’s estimated useful life. Land is not depreciated because its useful life is considered indefinite. Leased assets are also depreciated over their estimated useful life or, if shorter, over the agreed lease period.
In calculating depreciation, tangible fixed assets are classified on the basis of their expected useful life according to the following groups:
Operating properties 10-40 yearsPlant and equipment 8-12 yearsEquipment, fixtures and fittings 3-10 yearsLeasing 3–10 yearsLand improvements 10-20 yearsExpenses for improvements to property owned by another 3-5 years
The depreciation methods, residual values and useful lives of the assets are reviewed annually and adjusted if necessary. The assets are typically depreciated without any remaining residual value.
Capital gains and losses on divestments of intangible fixed assets are determined by comparing the proceeds with the carrying amount of the asset, less direct selling expenses. Capital gains and losses are recognised in profit for the year as other operating income and other operating expenses.
Intangible fixed assets Intangible assets are classified into two groups, with assets with a deter-minable useful life being amortised over a predetermined useful life and assets with an indeterminate useful life not being depreciated.
Goodwill Goodwill is measured at cost less any accumulated impairment losses. Goodwill is allocated to cash-generating units and is tested annually for impairment (see accounting principle Impairment).
Expenses incurred for internally generated goodwill are recognised in profit for the year or when incurred.
BrandsBrands with a determinable useful life are recognised at cost less accumu-lated depreciation and any accumulated impairment losses. Brands with an indeterminate useful life are tested for impairment annually and car-ried at cost less accumulated impairment losses.
Expenses incurred for internally generated brands are not recognised in the balance sheet but in profit for the year when incurred. The reason
M I DSONA – ANNUAL REPORT 2016
66—notes to the F inAnciAl stAtements

for this is that such expenditures cannot be distinguished from expendi-tures for the development of the entire business.
Other intangible assetsOther intangible assets with a finite useful life and are carried at cost less accumulated depreciation and any accumulated impairment.
Other intangible fixed assets consist of customer relations, software and other intangible assets. Expenses incurred for internally developed customer relations are not recognised in the balance sheet but in profit for the year when incurred. Software has been capitalised based on the costs incurred when the software in question was acquired and put into opera-tion.
Additional expensesAdditional expenditures for capitalised intangible assets are recognised as an asset in the balance sheet only when they increase the future economic benefits of the specific asset to which they relate. All other expenditures are expensed as they are incurred.
Amortisation principles Amortisation is applied on a linear basis over the asset’s estimated useful life, unless the useful life is indeterminate.
Goodwill and trademarks with an indeterminate useful life are tested for impairment annually or whenever circumstances indicate that the asset concerned may be impaired. Intangible assets with determinable useful lives are amortised from the date on which they become available for use.
For the calculation of amortisation, intangible fixed assets are classi-fied on the basis of their expected useful life in accordance with the fol-lowing groups:
Trademarks 5-20 yearsCustomer relations 8 yearsSoftware 5 yearsOther intangible assets 3-5 years
The residual values and useful lives of the assets are reviewed annually and adjusted if necessary. The assets are typically amortised without any remaining residual value.
Capital gains and losses on divestments of intangible fixed assets are determined by comparing the proceeds with the carrying amount of the asset, less direct selling expenses. Capital gains and losses are recognised in profit for the year as other operating income and other operating expenses.
InventoriesInventories are valued at cost or net realisable value, whichever is lower, with cost being calculated using the first-in, first-out method (FIFO). In calculating cost, a weighted average value is normally applied to approxi-mate FIFO.
The net realisable value is the estimated normal selling price less esti-mated expenses for completion and the achievement of a sale. For raw materials, replacement expense is applied as the best measure of net real-isable value. Raw materials are depreciated below cost if the finished products in which they are included are expected to be sold at a price that exceeds the expense of production. Products in progress and inventories
of finished goods are valued at production cost or net realisable value, whichever is lower. Necessary provisions for the risk of obsolescence are made on a continuous basis.
The cost of inventories includes all expenses for purchases, manufac-turing and other expenses to bring the inventories to their present loca-tion and condition.
Impairment The Group’s recognised assets are assessed on each balance sheet date to determine whether there is any indication of impairment. IAS 36 is applied for the impairment of assets other than financial assets, which are recog-nised in accordance with IAS 39, assets held for sale, inventories and deferred tax assets. For the exempt assets in accordance with the above, the carrying amount is assessed according to the relevant standard.
Impairment of tangible and intangible assetsIf an indication of impairment exists , the asset’s recoverable amount is calculated (see below). For goodwill, other intangible assets with indeter-minate useful lives and intangible assets not yet ready for use, the recov-erable amount is calculated annually or as soon as there is an indication that impairment is necessary. If it is not possible to determine significant independent cash flows for an individual asset and its fair value less sales expenses cannot be used, assets are grouped, when testing for impair-ment, at the lowest level where it is possible to identify significant inde-pendent cash flows – a so-called cash-generating unit.
An impairment loss is recognised when the carrying amount of an asset or cash-generating unit (group of units) exceeds the recoverable amount. Impairment is recognised as an expense in profit for the year. When impairment has been identified for a cash-generating unit (group of units) the impairment need is primarily allocated to goodwill. Other assets included in the unit (group of units) are then impaired proportionally.
The recoverable amount is the higher of fair value less sales expenses and value in use. In calculating the value in use, future cash flows are dis-counted applying a discount rate that reflects a risk-free interest rate and the risk associated with the specific asset.
The Group’s cash-generating units consist of the operating segments, since their incoming payment flows are considered independent of other assets in all material regards.
Impairment of financial assetsOn each reporting date, the Group assesses whether there is any objective evidence that a financial asset or group of assets is impaired. Objective evidence consists of observable events that have occurred and that have a negative impact on the ability to recover the cost, and a significant or pro-longed decline in the fair value of an investment in a financial instrument classified as a financial asset available for sale.
The decrease in value recognised in profit for the year is the difference between cost and current value, less any previously recognised impair-ments.
The recoverable amount of assets in the category loan receivables and accounts receivable, which are recognised at amortised cost is calculated as the present value of future cash flows discounted at the effective rate applicable when the asset was initially recognised. Assets with short maturities are not discounted. Impairment is recognised as an expense in profit for the year.
M I DSONA – ANNUAL REPORT 2016
notes to the F inAnciAl stAtements—67

Reversal of impairmentImpairment of assets within the scope of application of IAS 36 are reversed if there is an indication that the need for impairment no longer exists and there has been a change in the assumptions underlying the cal-culation of the recoverable amount. However, impairment of goodwill is never reversed. A reversal is applied only to the extent that the asset’s car-rying amount does not exceed the carrying amount that would have been recognised (less depreciation where applicable) if no impairment loss been recognised.
Impairment losses on loan receivables and accounts receivable carried at amortised cost are reversed if the previous reasons for the impairment no longer exist, and full payment is expected from the customer.
Payment of capital to shareholders
DividendsDividends are recognised as a liability after the Annual General Meeting has approved the dividend.
Earnings per shareThe calculation of earnings per share is based on consolidated profit attributable to Parent Company shareholders and the weighted average number of shares outstanding during the year. There was an outstanding option programme at year end, which can cause effects of dilutive poten-tial shares. The subscription price for outstanding warrants exceeded the average share price of series B shares on the closing date, which is why earnings per share after dilution were not calculated.
Employee benefits
pensionsEmployees in Sweden and Norway are covered by both defined benefit pension plans and defined contribution pension plans, while employees in Finland and Denmark are only covered by defined benefit pension plans.
In Sweden, commitments for retirement pensions and family pensions for salaried employees are secured through an insurance plan with Alecta. Such insurance comprises a defined benefit plan covering several employ-ers. For the 2016 financial year, there has been no access to information making it possible to report this as a defined benefit plan. Consequently, this pension obligation is reported as a defined contribution plan.
In Norway, a special pension agreement is in place, the AFP scheme, which has been agreed between the social partners as a supplement to retirement pension. Such insurance comprises a defined benefit plan cov-ering several employers. For the 2016 financial year, there has been no access to information making it possible to report this as a defined benefit plan. Consequently, this pension obligation is reported as a defined contri-bution plan.
A defined contribution pension plan is one whereby the Group pays fixed contributions to a separate legal entity. The Group has no legal or informal obligations to pay further contributions if this legal entity lacks sufficient assets to pay all employee benefits relating to employee’s ser-vice in current and prior periods.
A defined benefit pension plan is one that is not a defined contribution plan. Typically, defined benefit pension plans state an amount of pension benefit that an employee will receive on retirement, usually dependent on one or more factors such as age, years of service and salary.
Termination benefitsTermination benefits are payable when employment is terminated before the normal retirement date, or whenever an employee accepts voluntary retirement from employment in exchange for these benefits. The Group reports severance pay when it is demonstrably committed either to termi-nate employees in accordance with a detailed formal plan without the possibility of revocation, or to provide termination benefits as a result of an offer made to encourage voluntary redundancy. Benefits falling due after more than 12 months from the balance sheet date are discounted to their present value.
Short-term benefitsShort-term employee benefits are calculated without discounting and are recognised as an expense when the relevant benefits are paid.
A provision is recognised for the expected expense of bonus payments when the Group has a present legal or informal obligation to make such payments as a result of services rendered by employees and the obligation can be estimated reliably.
Provisions Provisions are recognised when the Group has an obligation as a result of a past event, and it is probable that payments will be required to settle that obligation. A further requirement is that it should be possible to reliably estimate the amount to be paid.
Restructuring Provisions for restructuring measures are made when a detailed formal plan of the measures exists and well-founded expectations have been engendered among those who will be affected by the measure, and this has occurred before the balance sheet date.
Contingent liabilityA contingent liability is recognised when there is a possible obligation aris-ing from past events and the existence of which is substantiated only by one or more uncertain future events, or when there is an obligation which is not recognised as a liability or provision because it is not likely that an outflow of resources will be needed.
Cash flow statement The cash flow statement is established according to the indirect method. The reported cash flow includes only transactions that involve receipts and payments.
Parent Company accounting principles
Compliance with standards and regulations The Parent Company has prepared its financial statements in accordance with the Annual Accounts Act (1995:1554) and the Financial Reporting Board’s recommendation RFR 2 Accounting for Legal Entities. The Financial Reporting Board’s statements relating to listed companies are also applied. RFR 2 entails the Parent Company applying, in the annual accounts of the legal entity, all EU-approved IFRS and statements as far as this is possible within the framework of the Annual Accounts Act, the Pension Protection Act and taking into account the relationship between accounting and tax-
M I DSONA – ANNUAL REPORT 2016
68—notes to the F inAnciAl stAtements

ation. The recommendation specifies which exceptions and additions to IFRS apply.
Differences between the accounting principles of the Group and Parent Company The differences between the accounting principles of the Group and Parent Company are described below. The accounting principles shown below for the Parent Company have been applied consistently to all peri-ods presented in the Parent Company’s financial reports.
Changes in accounting principlesThe amendments to RFR 2 Accounting for Legal Entities which came into force 1 January 2016 had the following impact on the Parent Company’s financial statements for the financial year 2016.
1 IAS 1 Presentation of Financial Statements (Disclosure Initiative). IAS 1 shall as previously in the legal entity apply as long as it is within the framework of the Annual Accounts Act. The formats of the Annual Accounts Act for the balance sheet and income statement have been changed in some respects. For example, there should no longer be any “memorandum items” used in connection with the balance sheet.
1 IAS 21 Effects of Changes in Foreign Exchange. The previous exception that meant that exchange differences on monetary items that consti-tute a net investment in subsidiaries are recognised in the fair value has been removed. The fund for fair value of such price fluctuation on monetary items has been transferred to profit brought foward.
Others amendments to RFR 2 Accounting for legal entities that have entered into force for the 2016 financial year have had no impact on the Parent Company’s financial statements.
Changes in accounting principles not yet been appliedManagement’s assessment is that the agreed changes in RFR 2 relating to the financial year 2017 and onward will not have any material effect on the Parent Company’s financial reports when they first apply.
Classification and presentationThe Parent Company’s income statement and balance sheet are presented in accordance with the Annual Accounts Act, while the statement of com-prehensive income, changes in equity and cash flow statement are based on IAS 1 Presentation of Financial Statements and IAS 7 Statement of Cash Flows. The differences with the Group reports that apply to the Parent Company’s income statements and balance sheets are mainly reporting of financial income and expenses, assets, equity and provisions as a separate heading in the balance sheet.
SubsidiariesInvestments in subsidiaries are recognised according to the cost method. This entails that transaction fees are included in the recognised amount of investments in subsidiaries. In the consolidated accounts, transaction expenses are recognised directly in profit or loss as they are incurred.
Conditional purchase considerations are measured based on the prob-ability that the purchase consideration will be paid. Any changes to the provision/receivable are added to/deducted from the cost. In the consoli-
dated financial statements, conditional purchase considerations are meas-ured at fair value with changes in value in profit for the year.
Bargain acquisitions equivalent to expected future losses and expenses are dissolved over the anticipated periods in which the losses and expenses incurred. Bargain acquisitions for other reasons are recognised as provi-sions to the extent they do not exceed the fair value of acquired identifia-ble non-monetary assets. The part exceeding this value is immediately rec-ognised as income. The part that does not exceed the fair value of acquired identifiable non-monetary assets is systematically recognised as income over a period calculated as the remaining weighted average useful life of those acquired identifiable assets that are depreciable. In the consolidated accounts bargain acquisitions are recognised immediately in net income.
Financial instruments Because of the connection between accounting and taxation, the rules for financial instruments in IAS 39 are not applied in the Parent Company as a legal entity.
In the Parent Company, financial fixed assets are measured at cost less and impairment and financial current assets are measured at the lower of cost or market.
Financial guaranteesThe Parent Company’s financial guarantee contracts consist primarily of guarantees on behalf of subsidiaries. Financial guarantees entail the Com-pany having an obligation to compensate the holder of a debt instrument for losses that holder incurs because a specified debtor fails to make pay-ment when due in accordance with contractual terms. In the reporting of financial guarantee contracts, the Parent Company applies a relief rule permitted by the Financial Reporting Board compared with the rules in IAS 39. This rule applies to financial guarantee contracts issued on behalf of subsidiaries. The Parent Company recognises financial guarantees as provi-sions in the balance sheet when Man has an obligation for which payment will probably be required to settle the obligation.
Anticipated dividends Anticipated dividends from subsidiaries are recognised if the Parent Com-pany alone is entitled to determine the size of the dividend and the Parent Company has determined the size of the dividend before publishing its financial statements.
Segment reporting The Parent Company does not report segments according to the same division as the Group or to the same extent, and instead discloses the dis-tribution of net sales according to the Parent Company’s business lines.
Tangible fixed assets Tangible fixed assets are recognised at cost less accumulated depreciation and any impairment in the same manner as the Group, albeit with the addition of any revaluations.
Leased assets In the Parent Company, all leases are recognised in accordance with the regulations for operating leases.
M I DSONA – ANNUAL REPORT 2016
notes to the F inAnciAl stAtements—69

Borrowing expensesIn the Parent Company, borrowing expenses are charged against profit in the period to which they relate. No borrowing expenses are capitalised on assets.
Intangible fixed assets Goodwill and other intangible assets with indeterminate useful lives that, within the Group are not subject to amortisation, are amortised in the Par-ent Company in accordance with the Annual Accounts Act. This normally entails amortisation over a period of five years. In specific cases, the amor-tisation period may be longer than five years.
Employee benefits The Parent Company applies a different basis for the calculation of defined benefit plans than that specified in IAS 19. The Parent Company complies with the provisions of the Pension Protection Act and the Finansinspek-tionen’s regulations (Swedish Financial Supervisory Authority) since these is a condition for tax deductibility. The most significant differences com-pared to IAS 19 is the how the discount rate is determined, the fact that the calculation of the defined benefit obligation is based on current salary level without taking future salary increases into account, and the fact that all actuarial gains and losses are recognised in the income statement as they occur.
TaxesIn the Parent Company’s balance sheet, untaxed reserves are recognised without being divided between shareholders’ equity and deferred tax lia-bilities, in contrast to the Group. Similarly, the Parent Company’s income statement does not specify any part of appropriations as deferred tax expenses.
Shareholder contributionsShareholder contributions are recognised directly in the shareholders’ equity of the recipient and are capitalised in the shares and participations of the contributor, to the extent that no impairment is required.
Group contributionsGroup contributions are recognised as appropriations.
Note 2 Net sales by major income category
SEK millionGroup Parent Company
2016 2015 2016 2015Sale of goods 1,720 1,145 – –Service assignments 22 28 – –Other income 2 1 28 23Total 1,744 1,174 28 23
Operating segments
Sweden Norway Finland DenmarkGroup functions, Group adjustments and elimi-
nationsGroup
SEK million 2016 2015 2016 2015 2016 2015 2016 2015 2016 2015 2016 2015Net sales, external 687 390 471 400 162 101 424 283 0 0 1,744 1,174Net sales, intra-Group 41 31 4 1 2 1 113 1 –160 –34 – –Net sales 728 421 475 401 164 102 537 284 –160 –34 1,744 1,174Operating expenses, external –604 –392 –421 –338 –81 –79 –505 –251 –51 –66 –1,662 –1,126Operating expenses, intra-Group –73 –8 –27 –18 –66 –16 –5 –3 171 45 – –Operating expenses –677 –400 –448 –356 –147 –95 –510 –254 120 –21 –1,662 –1,126Operating profit, undistributed 51 21 27 45 17 7 27 30 –40 –55 82 48Financial items –24 –9Profit before tax 58 39
Significant income and expense items reported in the income statement:Acquisition costs – – – – – – – – –7 –6 –7 –6Provision, expenses for restructuring of operations –8 –15 –12 – – 0 – –3 – – –20 –18Reversal of purchase consideration for previous years’ acquisitions recognised as a liability – – – 4 – – – – 0 4Capital gains divestments of operations – – – – – – – 20 – –20 – –
Significant non-cash items:Amortisation/Depreciation –5 –1 –3 –2 –1 –2 –8 –4 –8 –10 –25 –19Impairment losses on inventories –2 –6 – – – – – – – – –2 –6Impairment of accounts receivable –1 –2 0 1 – – 0 0 0 0 –1 –1
Segment assets 1,736 693 1,175 696 103 106 431 418 –907 –437 2,538 1,476Unallocated assets 82 79Total assets 2,620 1,555Segment liabilities 833 153 370 140 43 47 93 91 –1,003 –207 336 224Unallocated liabilities 935 454Shareholders’ equity 1,349 877Total shareholders’ equity and liabilities 2,620 1,555
Investments in intangible and tangible fixed assets 5 0 33 2 0 0 10 1 0 0 48 3Average number of employees 76 47 80 83 23 20 120 62 9 8 308 220Number of employees as per the balance sheet date 93 58 79 78 22 25 119 124 9 9 322 294
�
M I DSONA – ANNUAL REPORT 2016
70—notes to the F inAnciAl stAtements

No income is included, neither in the Group nor the Parent Company, that is attributable to the exchange of goods or services.
Note 3 Operating segmentsOperating segments are reported in a manner consistent with the internal reporting provided to the highest executive decision maker. The highest executive decision maker is the function responsible for allocating resources and assessing performance of the operating segment’s results. In the Group, this function has been identified as Group Management.
The division is based on geographical areas. The acquired business Internatural AB, including its subsidiaries, is included in both operating segments Sweden and Norway from 5 July 2016. In connection with the acquisition of Urtekram International A/S on 1 July 2015, the number of identified segments was extended with the geographical area Denmark. Until the integration of the acquired Urtekram International A/S was com-pleted, the segment’s sales and the earnings from the Swedish, Norwegian and Finnish geographical markets were reported under the Denmark oper-ating segment. The integration was completed during the first quarter of 2016, with sales and earnings from the Swedish, Norwegian and Finnish geographical markets recognised in the operating segments Sweden, Nor-way and Finland. For more information regarding the acquired operations, see Note 4 Acquisitions of operations.
Four geographic segments have currently been identified:
1 Sweden: Operations are conducted directly through proprietary com-panies through marketing and sales of products in the categories of healthfoods, personal care and beauty care to and through pharma-cies, supermarkets, e-commerce/post order, specialist healthfood retailers and other specialist retailers in the Swedish market.
1 Norway: Operations are conducted directly through proprietary com-panies through marketing and sales of products in the categories of healthfoods, personal care and beauty care to and through pharma-cies, supermarkets, e-commerce, specialist healthfood retailers and other specialist retailers in the Norwegian market.
1 Finland: Operations are conducted directly through proprietary com-panies through marketing and sales of products in the categories of healthfoods, personal care and beauty care to and through pharma-cies, supermarkets, e-commerce, specialist healthfood retailers and other specialist retailers in the Finnish market.
1 Denmark: Operations are carried out directly via subsidiaries through production, marketing and sale of products with an ecological profile in the categories healthfood and personal care to the pharmacy trade, food retail, e-commerce, healthfood shops and other speciality shops both in the Danish market in markets outside the Nordic region .
Segment consolidation is based on the same principles as for the Group as a whole.
Operating segments
Sweden Norway Finland DenmarkGroup functions, Group adjustments and elimi-
nationsGroup
SEK million 2016 2015 2016 2015 2016 2015 2016 2015 2016 2015 2016 2015Net sales, external 687 390 471 400 162 101 424 283 0 0 1,744 1,174Net sales, intra-Group 41 31 4 1 2 1 113 1 –160 –34 – –Net sales 728 421 475 401 164 102 537 284 –160 –34 1,744 1,174Operating expenses, external –604 –392 –421 –338 –81 –79 –505 –251 –51 –66 –1,662 –1,126Operating expenses, intra-Group –73 –8 –27 –18 –66 –16 –5 –3 171 45 – –Operating expenses –677 –400 –448 –356 –147 –95 –510 –254 120 –21 –1,662 –1,126Operating profit, undistributed 51 21 27 45 17 7 27 30 –40 –55 82 48Financial items –24 –9Profit before tax 58 39
Significant income and expense items reported in the income statement:Acquisition costs – – – – – – – – –7 –6 –7 –6Provision, expenses for restructuring of operations –8 –15 –12 – – 0 – –3 – – –20 –18Reversal of purchase consideration for previous years’ acquisitions recognised as a liability – – – 4 – – – – 0 4Capital gains divestments of operations – – – – – – – 20 – –20 – –
Significant non-cash items:Amortisation/Depreciation –5 –1 –3 –2 –1 –2 –8 –4 –8 –10 –25 –19Impairment losses on inventories –2 –6 – – – – – – – – –2 –6Impairment of accounts receivable –1 –2 0 1 – – 0 0 0 0 –1 –1
Segment assets 1,736 693 1,175 696 103 106 431 418 –907 –437 2,538 1,476Unallocated assets 82 79Total assets 2,620 1,555Segment liabilities 833 153 370 140 43 47 93 91 –1,003 –207 336 224Unallocated liabilities 935 454Shareholders’ equity 1,349 877Total shareholders’ equity and liabilities 2,620 1,555
Investments in intangible and tangible fixed assets 5 0 33 2 0 0 10 1 0 0 48 3Average number of employees 76 47 80 83 23 20 120 62 9 8 308 220Number of employees as per the balance sheet date 93 58 79 78 22 25 119 124 9 9 322 294
M I DSONA – ANNUAL REPORT 2016
notes to the F inAnciAl stAtements—71

The operating segments’ profit, assets and liabilities include directly attributable items and items that can be allocated in a reasonable and reli-able way. The items recognised in the operating segments’ operating profit, assets and liabilities are measured in accordance with the operating profit, assets and liabilities followed up by Group Management. Assets and liabilities are not allocated to the two segments are deferred tax assets, deferred tax liabilities, financial investments and financial liabilities.
Internal pricing policyFor the pricing of goods between the Group’s sales companies, an internal pricing model is applied based on the purchasing sales company receiving a predetermined gross margin. The method, called TNMM (Transactional Net Margin Method) is an accepted model for pricing. In addition to this also receives companies, as owners of select brands, a sales-based royalty to cover investments and risks in relation to the brand’s development.
For pricing of services between Group companies, TNMM (Transac-tional Net Margin Method) is applied, based on the full coverage of costs and a profit margin. The method is applied to both manufacturing services as well as central services.
For pricing of capital, an internal rate is charged, which entails the bor-rower receiving an interest rate based on a reference rate in the local country with a risk premium.
Information about major customersIn 2016, the Group’s largest customer generated income totalling SEK 259 million (139). This income is recognised in the operating segments Sweden and Denmark.
Other informationThe Group does not monitor its activities in such a way that sales informa-tion by product or by group of related products is immediately available. The Group has concluded that the expense of producing such information cannot be considered commensurate with its usefulness. Instead, the Group reports sales by channel.
External net sales by sales channel
SEK millionGroup
2016 2015Pharmacies 111 120FMCG retail 1,241 739e-trade/post order 58 44Healthfood retailers 200 151Other specialist retailers 50 54Others 60 37Total 1,720 1,145Service assignments 22 28Other sales 2 1Total 1,744 1,174
External net sales of geographical områden¹
SEK millionGroup
2016 2015Sweden 710 437Norway 487 411Finland 169 134Denmark 334 174Iceland 0 0Rest of Europe 43 17Other countries 1 1Total 1,744 1,1741 Income from external customers are allocated to individual countries according to the country in which the customer
is domiciled.
Fixed assets by geographic area¹,
SEK million
Group2016 2015
Sweden 1,160 584Norway 579 281Finland 53 58Denmark 287 272Total 2,079 1,195
¹Fixed assets by individually significant countries.
Note 4 Acquisitions of operations
Acquisitions in 2016On 5 July 2016, all of the shares were acquired in Internatural AB, with the two wholly-owned subsidiaries, Kung Markatta AB and Alma Norge AS, together forming the Internatural AB Group. The total purchase considera-tion amounted to SEK 690 million and was paid in cash at closing, repre-senting SEK 810 million on a debt-free basis, as well as a result of compen-sation of SEK 10 million to the seller for the period between the date for establishing the debt and the completion date.
Internatural AB Group has the leading position within organic food and other lifestyle-related products in Sweden and Norway. The company has its head office in Malmö. In addition, the company has offices and inven-tory for the Swedish market in Örebro and offices and inventory for the Norwegian market in Årnes. During 2015, net income amounted to SEK 637 million and operating profit before write-downs and impairment, EBITDA, amounted to SEK 65 million. The majority of sales are to FMCG retail cus-tomers (approximately 85 percent) and to customers in the retail health segment (approximately 10 percent). The remaining sales are to customers with e-commerce operations as well as other sales channels. Through acquisitions, Midsona gains access to the organic colonial products seg-ments of the brands Kung Markatta and Helios, which significantly strengthen its position within organic FMCG retail in the Nordic region. The brands King Markatta and Helios will be two of the Group’s priority brands. In addition, the Internatural AB Group holds exclusive distribution rights for around 60 local and international brands in the Swedish and Norwegian markets, which include the market leaders Alpro, Yogi Tea and Green and Black’s. Of the total net earnings, around 40 percent comes from proprietary brands. The acquisition is expected to generate synergy effects both in the form of increased income and reduced costs. The Inter-natural AB Group, which develops, markets and sells organic food products and other lifestyle related products, had at the time of acquisition 71 employees annually, of which 43 were in Sweden and 28 in Norway.
The acquired business will be consolidated into the Midsona Group from 5 July 2016, and will be included in the Sweden and Norway operating segments in segment reporting. From the acquisition date to 31 December 2016, the operations contributed SEK 329 million to consolidated income and SEK 26 million to the Group’s operating profit. If the acquisition had occurred on 1 January 2016, estimated consolidated net sales for the period January–December 117 would have been SEK 2,082 million and consoli-dated operating income SEK 117 million.
The acquisition analysis that has been prepared is preliminary.
M I DSONA – ANNUAL REPORT 2016
72—notes to the F inAnciAl stAtements

Effects of acquisitions
The acquiring Company’s net assets on the acquisition date, SEK million Fair value
Intangible fixed assets 269Tangible assets 6Financial assets 0Deferred tax receivables 1Inventories 64Accounts receivable 67Other receivables 1Prepaid expenses and accrued income 2Cash and cash equivalents 29Deferred tax liabilities –60Non-current interest-bearing liabilities –89Current interest-bearing liabilities –50Accounts payable –60Other current liabilities –9Accrued expenses and deferred income –13Total 158Consolidated goodwill 532Total 690
Transferred consideration, SEK million Fair valueCash 690Total 690
The fair value of identified assets and liabilities, amounted net to SEK 739 million, of which SEK 267 million was attributed to trademarks, SEK 60 mil-lion to deferred tax liabilities and SEK 532 million to goodwill after the reduction of existing surplus values in Internatural of SEK 138 million and a deferred tax liability of SEK 18 million. Brands valued at SEK 27 million are estimated to have a useful life of 20 years. Brands valued at SEK 240 mil-lion are estimated to have an indefinite useful life and are not amortised but tested for impairment. The goodwill recognised for the acquisition corresponds to the acquired company’s market position in the Swedish and Norwegian markets for organic food, its employees’ skills and experi-ence in the segment, as well as anticipated future synergies. The fair value of accounts receivable amounted to SEK 67 million and was fully settled. Acquisition-related expenses amounted to SEK 5 million and are recog-nised as other operating expenses in profit for the period.
IntegrationThe acquired operations will be integrated gradually with the Midsona the Group’s’s existing businesses. The integration is expected to be completed in the first quarter of 2017 in Norway and during the second quarter of 2017 in Sweden. Integration has resulted in restructuring costs of SEK 20 million in the earnings for 2016, of which SEK 12 million regards Norway and SEK 8 million Sweden.
Acquisitions in 2015On 1 July 2015, all shares were acquired in the Danish company Urtekram International A/S, with offices in Mariager (Jutland, Denmark); Stockholm, Sweden; Helsinki, Finland; and Oslo, Norway. The total purchase considera-tion amounted to DKK 192 million (about SEK 238 million) and was paid in cash when Midsona gained control, equivalent to DKK 215 million (about SEK 266 million) on a debt-free basis.
The Group gained, through the acquisition, access to the brand Urtekram, which significantly strengthened its position in the Nordic mar-ket for products in organic health food and organic bodycare and beauty products. Urtekram is one of the Group’s priority brands. At the time of
acquisition, the company had 138 employees, most of whom were located at the head office in Mariager.
The acquired business will be consolidated into Midsona Group from 1 July, 2015. From the acquisition date until 31 December 2015, operations contributed SEK 283 million to consolidated income and SEK 12 million to consolidated operating profit. If the acquisition had occurred on 1 January 2015, consolidated net sales would have been an estimated SEK 1,426 mil-lion and consolidated operating income for 2015 would have been SEK 47 million.
The acquisition analysis that has been prepared has been approved.
Effects of acquisitions
The acquired company’s net assets on the acquisition date, SEK million Fair value
Intangible fixed assets 220Tangible assets 46Financial fixed assets 2Inventories 69Accounts receivable 43Other receivables 3Prepaid expenses and accrued income 2Cash and cash equivalents 3Deferred tax liabilities –54Non-current interest-bearing liabilities –16Current interest-bearing liabilities –19Accounts payable –47Other current liabilities –12Accrued expenses and deferred income –16Total 224Consolidated goodwill 14Total 238
Transferred consideration, SEK million Fair valueCash 238Total 238
The fair value of the accounts receivable amounted to SEK 43 million and was fully settled. Acquisition-related expenses amounted to SEK 6 million and were recognised under other operating expenses in annual profit for 2015.
IntegrationThe acquired business has been gradually integrated into the Group’s existing movements and was completed in the first quarter in 2016. The integration resulted in restructuring charges of SEK 8 million recognised in net income for 2015.
Note 5 Other operating income
SEK millionGroup Parent Company
2016 2015 2016 2015Capital gains on divestments of tangible fixed assets
0 – – –
Rent 2 3 – –Exchange rate gains relating to operations – 1 3 4Royalty 1 1 – –
Reversal of purchase consideration for previous years’ acquisitions recognised as a liability
– 4 – –
Other information 2 0 – –Total 5 9 3 4
M I DSONA – ANNUAL REPORT 2016
notes to the F inAnciAl stAtements—73

Note 6 Other operating expenses
SEK millionGroup Parent Company
2016 2015 2016 2015Capital gains on divestments of intangible fixed assets
–2 0 – –
Capital loss on divestments of tangible fixed assets –1 –1 – –
Exchange rate losses relating to operations –3 –2 –2 –3Expenses incurred in acquisitions of operations –5 –6 – –Other information –3 –1 –2 –1Total –14 –10 –4 –4
Note 7 Operating expenses by expense category Operating expenses are presented in the consolidated income statement using a classification based on the functions “Expenses for goods sold”, “Sales expenses”, “Administrative expenses” and “Other expenses”. The sum of the expenses divided by function is distributed among the follow-ing expense categories.
SEK millionGroup
2016 2015Expenses for goods and materials –1,077 –672Personnel expenses –206 –165Selling expenses –104 –107Marketing expenses –90 –59Rental and other property expenses –29 –26Purchase of services –44 –22Amortisation/Depreciation –25 –19Impairment –4 –7Other direct and indirect expenses –74 –48Other operating expenses –14 –10Total –1,667 –1,135
Note 8 Auditors’ fees and reimbursements
SEK millionGroup Parent Company
2016 2015 2016 2015DeloitteAudit assignment –1 –1 0 0Auditing tasks beyond the audit assignment –1 0 0 0Tax advice 0 0 0 0Other assignments –2 –1 –1 –1Total –4 –2 –1 –1
Other auditorsAudit assignment – 0 – –Auditing tasks beyond the audit assignment – 0 – –Tax advice – 0 – –Other assignments – – – –Total – 0 – –
Total –4 –2 –1 –1
Audit assignments involve the examination of the annual accounts and the accounting procedures, as well as the administration by the Board of Directors and the CEO, other tasks incumbent on the Company’s auditors and advice or other assistance resulting from observations made during the audit or the performance of such other tasks.
Note 9 Employees, personnel expenses and senior executives’ remunerations
Employees
Average number of employees by country
Group Parent Company2016 2015 2016 2015
Sweden 85 55 9 8 of whom women 50 37 2 3Norway 80 83 – –Finland 23 20 – –Denmark 120 62 – –Total abroad 223 165 – – of whom women 120 89 – –Total 308 220 9 8 of whom women 170 126 2 3
Number of women in Company management teams
Group Parent Company2016 2015 2016 2015
Boards of Directors , % 26 26 50 43CEO and management team,% 45 48 14 0
Personnel expenses
Personnel expenses,SEK million
Group Parent Company2016 2015 2016 2015
Salaries and other remunerationBoard of Directors, CEO and management team1 –35 –30 –7 –7 of which variable salary –3 –3 0 0 of which severance pay – 0 – –Other employees –124 –95 –4 –4 of which variable salary –3 –1 0 0 of which severance pay – 0 – –Total salaries and other remuneration –159 –125 –11 –11
Pension expenses, defined contribution plans2
Board of Directors, CEO and management team¹ –5 –4 –2 –1Other employees –11 –7 –1 –1Total pension expenses –16 –11 –3 –2
Social security expensesBoard of Directors, CEO and management team¹ –8 –6 –3 –3Other employees –20 –20 –1 –1Total social security expenses –28 –26 –4 –4
Other personnel expensesBoard of Directors, CEO and management team¹ 0 0 – 0Other employees –3 –3 0 0Total other personnel expenses –3 –3 0 0
Total personnel expenses –206 –165 –18 –17
1 With regard to the Group, “Board of Directors” refers to all boards of Group companies. Members of the Boards of subsidiaries consist of employees who do not receive Board fees for their services. With regard to the Group, “President” refers to all persons holding the position of President in any Group company. “Management team” includes all management teams in Group compa-nies. An individual can have more than one Board assignment while being included in more than one management team within the Group. Collectively, the Boards of Directors, Presidents and management teams consist of 78 (91) individuals in the Group and 13 (12) individuals in the Parent Company.
² For more information on pension costs, see Note 26 Provisions for pensions, page 84th
M I DSONA – ANNUAL REPORT 2016
74—notes to the F inAnciAl stAtements

Remuneration to senior executives
Remuneration to members of the Board of the Parent Company
DefinitionsThe Board consists since the Annual General Meeting April 27, 2016 by Ola Erici (Chairman), Cecilia Marlow, Birgitta Stymne Göransson, Peter Wahlberg, Johan Wester and Kirsten Ægidius.
Principles for remuneration of BoardThe 2016 Annual General Meeting resolved that fees for 2016/2017 should be paid to the Chairman in the amount of SEK 400 thousand (including committee work) and to the other members of the Board who are not employees of the Company, in the amount of SEK 200 thousand each. In addition, SEK 20 thousand shall be paid to each member of the Board, other than the Chairman, who is a member of a committee. Authorised fees totalled SEK 1,480 thousand. Beyond these remunerations, members of the Board are not entitled to any other compensation other than for travel and lodging. Remuneration of members of the Board is prepared by the Nominating Committee and approved by the Annual General Meeting.
Board feesThree of the Board Members invoice Board remunerations via their own companies.The following fees were paid to the Board of Directors over the year.
Board of DirectorsSEK thousand
Parent Company 2016
Directors’ fees
Fee Remun-erations
CommitteeFee Audit
Committee Total
Ola Erici (Chairman) 400 – – 400Cecilia Marlow 200 – 20 220Birgitta Stymne Göransson 200 20 – 220Peter Wahlberg 200 – 20 220Johan Wester 200 – 20 220Kirsten Ægidius 200 – – 200Total 1,400 20 60 1,480
Board of DirectorsSEK thousand
Parent Company 2015
Directors’ fees
Fee Remun-erations
CommitteeFee Audit
Committee Total
Åke Modig (Chairman of the Board)
400 – – 400
Tina Andersson 200 – 20 220Ola Erici 200 20 – 220Cecilia Marlow 200 – 20 220Peter Wahlberg 200 – – 200Johan Wester 200 – 20 220Total 1,600 20 60 1,680
Remuneration to senior executives
DefinitionsSenior executives are those who, together with the CEO Peter Åsberg, were included in Group Management during all or part of the year. The senior executives are: Lennart Svensson, Vidar Eskelund, Markku Janhunen, Lars Børresen, Ulrika Palm (from 29 March 2016) and Anders Dahlin (1 Sep-tember 2016).
Principles for remunerations to senior executivesPrinciples for remunerations to senior executives are determined by the Annual General Meeting. Senior executives are considered to be the CEO and other members of the management team.
The 2016 Annual General Meeting approved the following guidelines for remunerations to senior executives. Senior executives are to be offered competitive remunerations in line with the market. Remuneration levels for individual executives are to be based on factors including position, competence, experience and performance. Remunerations consist of fixed salary and pension, and shall additionally be able to include variable pay, severance pay and non-monetary benefits. Variable pay shall be based on quantitative and qualitative targets being achieved. It shall be possible for the President to earn variable pay of at most 50 percent of basic salary and for other members of Group Management to earn variable pay of at most 30 percent of basic salary. Severance pay shall amount to at most six months’ salary if notice is given by the Company. Salary during the period of notice and severance pay shall be limited to at most 24 months’ salary. Pension benefits shall be defined-contribution benefits and normally enti-tle the individual to pension from the age of 65. On termination of employment by the Company, 6 to 12 months’ salary normally applies. Remunerations and other terms of employment for the CEO are prepared by the Remunerations Committee and determined by Board of Directors. Remunerations and other terms of employment for other members of the management team are determined by the Remunerations Committee in consultation with the CEO. The Board of Directors is kept continuously up-to-date regarding remuneration levels for other senior executives. The Board of Directors is entitled to diverge from these guidelines if there are specific reasons in individual cases.
Remuneration and other benefitsThe following remunerations and other benefits were paid to senior exec-utives over the year.
Remuneration and other benefits to the CEO and Group Management
2016
Basi
c sal
ary
Varia
ble R
emun
e-ra
tion
Othe
r ben
efits
Pens
ion
expe
nses
Tota
l
Peter Åsberg, CEO 3,253 218 130 1,184 4,785
Group Management (6 individuals)
8,810 1,976 423 1,238 12,447
Total 12,063 2,194 553 2,422 17,232
2015Peter Åsberg, CEO 3,266 205 99 1,065 4,635
Group Management (4 individuals)
6,287 234 330 700 7,551
Total 9,553 439 429 1,765 12,186
Comments on the table1 For the 2016 financial year, variable remuneration of SEK 638 thousand
was paid to the CEO, of which SEK 420 thousand was allocated to pen-sion benefits. The variable remuneration accounted for 20 percent of base salary.
1 For the 2016 financial year, variable remuneration of SEK 1,976 thou-sand was paid to the other members of Group Management, which corresponded to 22 percent of the base salary.
1 For the 2016 financial year, variable remuneration of SEK 505 thousand was paid to the CEO, of which SEK 300 thousand was allocated to
M I DSONA – ANNUAL REPORT 2016
notes to the F inAnciAl stAtements—75

pension benefits. The variable remuneration accounted for 15 percent of base salary.
1 For the 2015 financial year, variable remuneration of SEK 234 thousand was paid to the other members of Group Management, which corre-sponded to 4 percent of base salary.
1 Pension expenses refer to the expenses that affected profit for the year, excluding income tax.
1 Other benefits primarily refer to company cars and telephones.
Share-related benefitsThere were one incentive programme outstanding at the end of the period. At the Extraordinary General Meeting of 8 September 2016, a deci-sion was made, deviating from existing shareholders’ preferential rights, to issue and transfer at most 450,000 warrants to current and future senior executives in the Midsona Group, in connection with which the CEO shall be offered to purchase 100,000 warrants and other senior executives in Group Management shall be offered to acquire 50,000 warrants each. The period during which the warrants may be exercised will be from 1 March 2019 to 31 August 2019. The subscription price was SEK 51. The transfer of a total of 390,000 warrants to the existing senior management took place on market terms in October 2016 based on a calculation in accordance with the so-called Black & Scholes model performed by PWC AB, which is considered to be independent of the Company. The fair value per option was at the time of transaction SEK 5.30, by which the financial statements were affected by SEK 2 million after deducting the option programme’s expenses.
Note 10 Net financial items
SEK millionGroup Parent Company
2016 2015 2016 2015Profit from participations in subsidiariesDividends from subsidiaries ¹ 284 40Impairment of shares in subsidiaries –197 –1Total 87 39
Financial incomeInterest income ² 1 0 0 –Interest income, subsidiaries 8 5Exchange rate gains – 0 11 –Other financial income 0 1 – –Total 1 1 19 5
Financial expensesInterest expenses ² –17 –7 –14 –4Interest expenses, subsidiaries –1 –2Exchange rate losses –3 0 0 –9Other financial expenses –5 –3 –4 –1Total –25 –10 –19 –16
Total financial items –24 –9 87 28
1 The dividends from subsidiaries of SEK 284 million (40), include SEK 284 million (39) in anticipated dividends.²All interest income and interest expense is attributable to financial instruments measured at amortised cost.
Note 11 Appropriations
SEK millionParent Company
2016 2015Group contributions received 166 –Total 166 –
Note 12 TaxesRecognised in profit for the year, SEK million
Group Parent Company2016 2015 2016 2015
Current tax Current tax –7 –3 – –
Adjustment of tax relating to previous years
0 0 – –
–7 –3 – –Deferred tax
Deferred tax relating to temporary differences
1 1 0 0
Deferred tax resulting from changes in tax rates
1 4 – –
Deferred tax income in tax loss carryforwards capitalised during the year
3 40 – 21
Deferred tax expense resulting from utilisation of previously capitalised tax loss carryforwards
–11 –15 –32 –
Adjustment of deferred tax relating to previous years
– 0 – –
–6 30 –32 21Total –13 27 –32 21
Current tax
Reconciliation of tax SEK millionGroup Parent Company
2016 2015 2016 2015Profit before tax 58 39 243 17Tax at the applicable tax rate for the Parent Company of 22.0% (22.0)
–13 –9 –53 –4
Non-taxable dividends from subsidiaries – – 62 9
Non-deductible impairment of shares in subsidiaries
– – –43 0
Other non-deductible expenses/Other non-taxable income
–1 2 2 1
Effect of other tax rates on foreign subsidi-aries
0 –2 – –
Effect of changed tax rates 1 3 – –
Capitalisation of previously uncapitalised loss carryforwards
– 31 – 15
Utilisation of previously uncapitalised tax loss carryforwards
– 0 – –
Decrease/Increase in deductible temporary differences without corresponding capitali-sation of deferred tax
0 2 – –
Tax attributable to previous years 0 0 – –Other – 0 – 0Total –13 27 –32 21Reported effective tax rate, % 22.9 –70.3 13.2 –120.2
The applicable corporate tax rate in Sweden is 22.0 percent, while subsidi-aries in Norway, Finland and Denmark apply local corporate tax rates. Reported effective tax rate was 22.9 percent (–70.3) for the Group and 13.2 percent (–120.2) for the Parent Company. In the comparative period, not previously capitalised loss carryforwards were activated.
Changed tax ratesIn Norway, a decision was made to lower the Norwegian corporate tax rate from 25.0 percent to 24.0 percent from 1 January 2017. In line with this change deferred tax assets/liabilities were revalued.
In Norway, a decision was made to lower the Norwegian corporate tax rate from 27.0 percent to 25.0 percent from 1 January 2016. In Denmark, a decision was made to lower the Danish corporate tax rate from 23.5 percent to 22.0 percent from 1 January 2016. In line with this change deferred tax assets/liabilities were revalued.
M I DSONA – ANNUAL REPORT 2016
76—notes to the F inAnciAl stAtements

Deferred tax
Changes in deferred tax in temporary diffe-rences and , SEK million
Group Parent Company
Opening balance 1 January 2015
Recognised in the income sta-
tementTranslation diffe-
rences
Change through acquisition of
operationsClosing balance
31 December 2015Opening balance
1 January 2015
Recognised in the income sta-
tementClosing balance
31 December 2015
Deferred tax liabilityIntangible fixed assets 101 –14 0 52 139 – – –Tangible assets – 3 0 2 5 – – –Inventories –1 0 0 – –1 – – –Provisions –1 1 0 – 0 – – –Tax loss carryforwards –19 11 0 – –8 – – –Total 80 1 0 54 135 – – –
Deferred tax assetsIntangible fixed assets 3 –1 0 – 2 – 0 0Tangible assets 0 0 – – – – – –Inventories 1 0 0 – 1 – – –Provisions 1 –1 – – 0 – – –Tax loss carryforwards 43 33 0 – 76 15 21 36Total 48 31 0 – 79 15 21 36Total net deferred tax liability 32 –30 0 54 56 –15 –21 –36
Changes in deferred tax in temporary diffe-rences and , SEK million Opening balance
1 January 2016
Recognised in the income sta-
tementTranslation diffe-
rences
Change through acquisition of
operations
Closing balance 31 December
2016Opening balance
1 January 2016
Recognised in the income sta-
tement
Closing balance 31 December
2016
Deferred tax liabilityIntangible fixed assets 139 3 1 60 206 – – –Tangible assets 5 –2 0 – 3 – – –Inventories –1 0 0 – –1 – – –Provisions 0 –1 0 – –1 – – –Tax allocation reserve – 3 – – 3 – – –Tax loss carryforwards –8 8 0 – – – – –Total deferred tax liability 135 11 1 60 207 – – –
Deferred tax assetsIntangible fixed assets 2 1 0 0 3 0 0 –Tangible assets – 0 0 – – – 0 0Inventories 1 –1 0 – 0 – – –Provisions 0 3 0 – 3 – – –Tax loss carryforwards 76 0 0 0 76 36 –33 3Total 79 3 0 0 82 36 –33 3Total net deferred tax liability 56 8 1 60 125 –36 33 –3
Deferred tax assets and deferred tax liabilities have been measured based on the nominal tax rate. Deferred tax assets and liabilities are offset when there is a legally enforceable right to offset and when the deferred taxes relate to the same tax authority. The amounts in the above table are reported gross.
Temporary differencesTemporary differences arise in cases where the carrying amounts and tax-able values of assets and liabilities differ. Temporary differences are attrib-utable to the balance sheet and have resulted in deferred tax assets and liabilities according to the table above.
No deferred tax is recognised regarding temporary differences attrib-utable to investments in subsidiaries. Any future effects (withholding taxes and other deferred tax on profit taking within the Group) are recog-nised when Midsona is no longer able to control the reversal of such differ-ences or it is for other reasons no longer probable that the reversal will occur in the foreseeable future.
Tax loss carryforwardsThe total losses in the Group amounted to SEK 339 million (373) at 31 December 2016. All loss carryforwards were capitalised as well on Decem-
ber 31, 2016 December 31, 2015. Management believes that, given the Group’s current and future structure, the opportunities to utilise the tax loss carryforwards are well founded.
In 2015, a reassessment of tax loss carryforwards attributable to the Group’s Swedish operations resulted in deferred tax revenue of SEK 31 million.
Note 13 Profit and earnings per shareEarnings per share are calculated by dividing the profit attributable to Parent Company shareholders by the weighted average number of shares outstanding during the period.
Earnings per share before and after dilution, SEK millionGroup
2016 2015Profit for the year, SEK million 45 66Number of shares on balance sheet date, thousands 42,646 28,431Average number of shares during the period, thousands 31,547 24,419Earnings per share, SEK 1.42 2.71
The weighted average number of shares was affected by the new share issue in 2016.
M I DSONA – ANNUAL REPORT 2016
notes to the F inAnciAl stAtements—77

Instruments that may result in future dilution and changes after the balance sheet dateThe subscription price for outstanding warrants exceeded the average share price of series B shares on the closing date, which is why earnings per share after dilution were not calculated.
DividendThe Board of Directors proposes that a share dividend of SEK 1.10 per share (1.10) be paid for the 2016 financial year, equivalent to SEK 46,911,128 (31,274,085) in total.
Note 14 Intangible fixed assets
SEK million
Group Parent Company
Goodwill Brands Other intangible assets Total Other intangible assets
Accumulated costOpening balance 1 January 2015 709 389 28 1,126 5Acquired through business combinations 18 205 16 239 –Other acquisitions/investments – – 2 2 0Sales/scrappings –2 –1 –9 –12 –Translation difference for the year –40 –7 –1 –48 –Closing balance 31 December 2015 685 586 36 1,307 5
Accumulated depreciation, amortisations and impairmentOpening balance 1 January 2015 –185 –45 –21 –251 –3Acquired through business combinations –1 –1 –2 –4 –Depreciation for the year – –9 –4 –13 –1Sales/scrappings 1 1 9 11 –Translation difference for the year 16 1 0 17 –Closing balance 31 December 2015 –169 –53 –18 –240 –4
Carrying amount, 31 December 2015 516 533 18 1,067 1
SEK million Group Parent CompanyAccumulated costOpening balance 1 January 2016 685 586 36 1,307 5Acquired through business combinations 531 270 1 802 –Other acquisitions/investments – 30 5 35 0Sales/scrappings –4 – –2 –6 –Reclassification 0 – 1 1 –Translation difference for the year 51 18 1 70 –Closing balance 31 December 2016 1,263 904 42 2,209 5
Accumulated depreciation, amortisations and impairmentOpening balance 1 January 2016 –169 –53 –18 –240 –4Acquired through business combinations – – –1 –1 –Depreciation for the year – –10 –6 –16 0Sales/scrappings 4 – 2 6 –Reclassification 0 – 0 0 –Translation difference for the year –16 –1 –1 –18 –Closing balance 31 December 2016 –181 –64 –24 –269 –4
Carrying amount, 31 December 2016 1,082 840 18 1,940 1
The carrying amount for the item other intangible assets includes SEK 10 million (11) for customer relations, SEK 7 million (5) for software and SEK 1 million (2) for other intangible assets.
There were no internally generated intangible assets at year-end.
Borrowing expensesNo borrowing expenses are included in the cost of assets, either for 2016 or for 2015.
Amortisation/DepreciationAll intangible fixed assets (other than goodwill and acquired brands that are considered to have an indeterminate useful life) are amortised. Depre-ciation is included in the following items in the income statement.
Amortisation for the year included in the income statement, SEK million
Group Parent Company2016 2015 2016 2015
Selling expenses –12 –10 – –Administrative expenses –4 –3 0 –1Total –16 –13 0 –1
For information on depreciation, see Note 1 Accounting principles.
M I DSONA – ANNUAL REPORT 2016
78—notes to the F inAnciAl stAtements
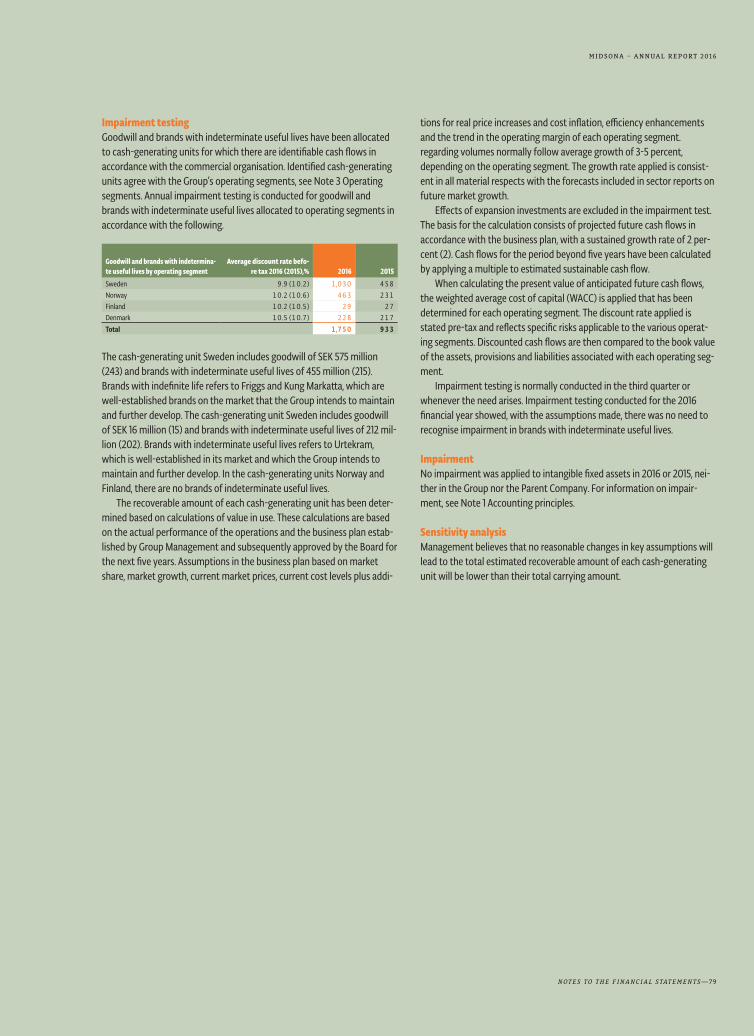
Impairment testingGoodwill and brands with indeterminate useful lives have been allocated to cash-generating units for which there are identifiable cash flows in accordance with the commercial organisation. Identified cash-generating units agree with the Group’s operating segments, see Note 3 Operating segments. Annual impairment testing is conducted for goodwill and brands with indeterminate useful lives allocated to operating segments in accordance with the following.
Goodwill and brands with indetermina-te useful lives by operating segment
Average discount rate befo-re tax 2016 (2015),% 2016 2015
Sweden 9.9 (10.2) 1,030 458Norway 10.2 (10.6) 463 231Finland 10.2 (10.5) 29 27Denmark 10.5 (10.7) 228 217Total 1,750 933
The cash-generating unit Sweden includes goodwill of SEK 575 million (243) and brands with indeterminate useful lives of 455 million (215). Brands with indefinite life refers to Friggs and Kung Markatta, which are well-established brands on the market that the Group intends to maintain and further develop. The cash-generating unit Sweden includes goodwill of SEK 16 million (15) and brands with indeterminate useful lives of 212 mil-lion (202). Brands with indeterminate useful lives refers to Urtekram, which is well-established in its market and which the Group intends to maintain and further develop. In the cash-generating units Norway and Finland, there are no brands of indeterminate useful lives.
The recoverable amount of each cash-generating unit has been deter-mined based on calculations of value in use. These calculations are based on the actual performance of the operations and the business plan estab-lished by Group Management and subsequently approved by the Board for the next five years. Assumptions in the business plan based on market share, market growth, current market prices, current cost levels plus addi-
tions for real price increases and cost inflation, efficiency enhancements and the trend in the operating margin of each operating segment. regarding volumes normally follow average growth of 3-5 percent, depending on the operating segment. The growth rate applied is consist-ent in all material respects with the forecasts included in sector reports on future market growth.
Effects of expansion investments are excluded in the impairment test. The basis for the calculation consists of projected future cash flows in accordance with the business plan, with a sustained growth rate of 2 per-cent (2). Cash flows for the period beyond five years have been calculated by applying a multiple to estimated sustainable cash flow.
When calculating the present value of anticipated future cash flows, the weighted average cost of capital (WACC) is applied that has been determined for each operating segment. The discount rate applied is stated pre-tax and reflects specific risks applicable to the various operat-ing segments. Discounted cash flows are then compared to the book value of the assets, provisions and liabilities associated with each operating seg-ment.
Impairment testing is normally conducted in the third quarter or whenever the need arises. Impairment testing conducted for the 2016 financial year showed, with the assumptions made, there was no need to recognise impairment in brands with indeterminate useful lives.
ImpairmentNo impairment was applied to intangible fixed assets in 2016 or 2015, nei-ther in the Group nor the Parent Company. For information on impair-ment, see Note 1 Accounting principles.
Sensitivity analysisManagement believes that no reasonable changes in key assumptions will lead to the total estimated recoverable amount of each cash-generating unit will be lower than their total carrying amount.
M I DSONA – ANNUAL REPORT 2016
notes to the F inAnciAl stAtements—79
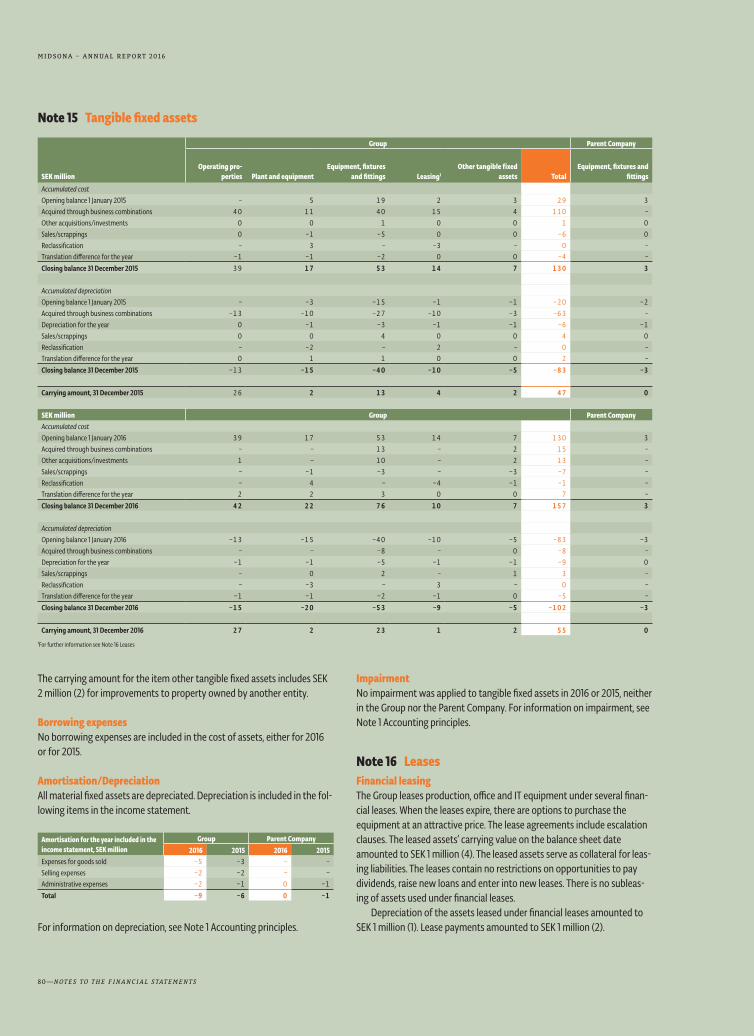
Note 15 Tangible fixed assets
SEK million
Group Parent Company
Operating pro-perties Plant and equipment
Equipment, fixtures and fittings Leasing1
Other tangible fixed assets Total
Equipment, fixtures and fittings
Accumulated costOpening balance 1 January 2015 – 5 19 2 3 29 3Acquired through business combinations 40 11 40 15 4 110 –Other acquisitions/investments 0 0 1 0 0 1 0Sales/scrappings 0 –1 –5 0 0 –6 0Reclassification – 3 – –3 – 0 –Translation difference for the year –1 –1 –2 0 0 –4 –Closing balance 31 December 2015 39 17 53 14 7 130 3
Accumulated depreciationOpening balance 1 January 2015 – –3 –15 –1 –1 –20 –2Acquired through business combinations –13 –10 –27 –10 –3 –63 –Depreciation for the year 0 –1 –3 –1 –1 –6 –1Sales/scrappings 0 0 4 0 0 4 0Reclassification – –2 – 2 – 0 –Translation difference for the year 0 1 1 0 0 2 –Closing balance 31 December 2015 –13 –15 –40 –10 –5 –83 –3
Carrying amount, 31 December 2015 26 2 13 4 2 47 0
SEK million Group Parent CompanyAccumulated costOpening balance 1 January 2016 39 17 53 14 7 130 3Acquired through business combinations – – 13 – 2 15 –Other acquisitions/investments 1 – 10 – 2 13 –Sales/scrappings – –1 –3 – –3 –7 –Reclassification – 4 – –4 –1 –1 –Translation difference for the year 2 2 3 0 0 7 –Closing balance 31 December 2016 42 22 76 10 7 157 3
Accumulated depreciationOpening balance 1 January 2016 –13 –15 –40 –10 –5 –83 –3Acquired through business combinations – – –8 – 0 –8 –Depreciation for the year –1 –1 –5 –1 –1 –9 0Sales/scrappings – 0 2 – 1 3 –Reclassification – –3 – 3 – 0 –Translation difference for the year –1 –1 –2 –1 0 –5 –Closing balance 31 December 2016 –15 –20 –53 –9 –5 –102 –3
Carrying amount, 31 December 2016 27 2 23 1 2 55 0
¹For further information see Note 16 Leases
The carrying amount for the item other tangible fixed assets includes SEK 2 million (2) for improvements to property owned by another entity.
Borrowing expensesNo borrowing expenses are included in the cost of assets, either for 2016 or for 2015.
Amortisation/DepreciationAll material fixed assets are depreciated. Depreciation is included in the fol-lowing items in the income statement.
Amortisation for the year included in the income statement, SEK million
Group Parent Company2016 2015 2016 2015
Expenses for goods sold –5 –3 – –Selling expenses –2 –2 – –Administrative expenses –2 –1 0 –1Total –9 –6 0 –1
For information on depreciation, see Note 1 Accounting principles.
ImpairmentNo impairment was applied to tangible fixed assets in 2016 or 2015, neither in the Group nor the Parent Company. For information on impairment, see Note 1 Accounting principles.
Note 16 LeasesFinancial leasingThe Group leases production, office and IT equipment under several finan-cial leases. When the leases expire, there are options to purchase the equipment at an attractive price. The lease agreements include escalation clauses. The leased assets’ carrying value on the balance sheet date amounted to SEK 1 million (4). The leased assets serve as collateral for leas-ing liabilities. The leases contain no restrictions on opportunities to pay dividends, raise new loans and enter into new leases. There is no subleas-ing of assets used under financial leases.
Depreciation of the assets leased under financial leases amounted to SEK 1 million (1). Lease payments amounted to SEK 1 million (2).
M I DSONA – ANNUAL REPORT 2016
80—notes to the F inAnciAl stAtements

Future minimum lease fees and their present values under non-cancel-lable financial leases amounted to the following.
Due dates for future minimum lease payments, SEK million
Nominal values Present values
Within one year 1 1Later than one year but within five years 1 1Later than 5 years – –Total 2 2
The present value of future minimum lease payments is recognised as liabilities to credit institutions, partly as a current liability and partly as a non-current liability.
Operating leasesThe Group leases warehouse and office space, computers and other equip-ment. Certain contracts include renewal options for varying periods of time. Part of a leased office and warehouse has been sub-let.
Expensed operating lease fees, SEK million
Group ¹ Parent Company2016 2015 2016 2015
Expenses for operating leases –30 –23 –5 –4Total –30 –23 –5 –4
Lease income for sub-let items amount to 1 1 – –
¹ Pertains to expensed operating lease fees.
Nominal value of future minimum lease payments under non-cancellable leases, SEK million
Group ¹ Parent Company
2016 2015 2016 2015Matures for payment within one year 24 21 4 5
Matures for payment after more than one year but within five years
63 39 1 5
Mature for payment after more than five years
43 2 0 0
Total 130 62 5 10
¹ Pertains to the nominal value of future minimum lease payments under non-cancellable leases.
Note 17 Participations in subsidiaries
Corporate identity number Domicile Number of sharesProportion of capital/
voting rights Book value, SEK million
Bioglan AS 970,968,660 Oslo, Norway 1,400 100% 272Alma Norway AS ¹ 947,525,239 Nes, Norway – 100% – Midsona Norge AS 979,473,559 Oslo, Norway – 100% – Soma Nordic AB 556585-7942 Laholm, Sweden – 100% –Dalblads Nutrition AB 556542-8264 Lerum, Sweden 1,000 100% –Internatural AB 556925-0961 Malmö, Sweden 358,712 100% –Kung Markatta AB 556316-4424 Malmö, Sweden 1,000 100% 520Midsona Finland Oy 1732881-1 Salo, Finland 16,000 100% 31Midsona Sverige AB 559037-5951 Malmö, Sweden 15,937,684 100% 339Trettiosjucorp AB 556480-0224 Malmö, Sweden 165,797 100% –Urtekram International A/S² 31493994 Mariager, Denmark 6,000,000 100% 243Urtekram Sverige AB 556420-6646 Malmö, Sweden 2,000 100% – Bioglan Pharma AB 556594-2025 Lund, Sweden – 100% – Vitalas AB 556572-5040 Malmö, Sweden – 100% –Total book value in the Parent Company 1,405
¹As of 1 January, 2017, the company Alma Norge AS was merged into Midsona Norge AS.²As of January 1, 2017, the company changed its name to Midsona Danmark A/S.
SEK millionParent Company
2016 2015Accumulated costOpening balance 1,892 1,583Acquisitions of subsidiaries 807 259Shareholder contributions in subsidiaries 5 50Closing balance 2,704 1,892
Accumulated depreciationOpening balance –1,102 –1,101Impairment for the year on shares in subsidiaries –197 –1Closing balance –1,299 –1,102
Book value 1,405 790
Impairment for the year on shares in subsidiaries is recognised in the income statement under “Profit from participations in subsidiaries”.
Note 18 Receivables from, and liabilities to, subsidiaries
SEK millionParent Company
2016 2015Fixed assetsInterest-bearing receivables 742 185Total 742 185Current assetsInterest-bearing receivables ¹ 4 2Other receivables 458 42Total 462 44
Total 1,204 229
Non-current liabilitiesInterest-bearing liabilities 481 0Total 481 0Current liabilitiesInterest-bearing liabilities1 132 84Other liabilities 1 0Total 133 84
Total 614 84
¹Interest-bearing receivables and liabilities refer to the consolidated accounts with internal interest.
M I DSONA – ANNUAL REPORT 2016
notes to the F inAnciAl stAtements—81

Note 19 Other non-current receivables and other receivables
SEK millionGroup Parent Company
2016 2015 2016 2015Other non-current receivables that are fixed assetsDeposits 2 2 – –Other financial assets 0 0 – –Total 2 2 – –
Other receivables that are current assetsCurrency futures – 1 – –Other receivables 0 1 1 1Total 0 2 1 1
Note 20 Inventories
SEK millionGroup
2016 2015Raw materials and consumables 38 43Products in process 0 0Completed products and goods for resale 206 108Total 244 151
The consolidated income statement includes impairment of inventory items of SEK 2 million (4) in the post sales expenses. The comparative period included the write-down of inventory items of SEK 2 million for the cost of goods sold.
Note 21 Accounts receivableMidsona has some 300 active customers, of whom the ten largest accounted for 63 percent (54) of net sales. Customers are primarily phar-macy chains, FMCG and healthfood retailers and other specialist retailers. In addition to these customers, the Group also makes direct sales to, among others, a large number of private individuals, therapists and smaller, independent shops via on-line sales and post-order. Most net sales derive from the Nordic market.
A large part of sales is based on a framework agreement that specifies general terms and discounts for a year at a time. Normally, assortment evaluations are performed a couple of times a year, in connection with which price levels can also be adjusted if there is evidence of this through, for example, higher commodity prices.
Accounts receivable,SEK million
Group2016 2015
Accounts receivable, gross 210 132Allocation for doubtful accounts receivable –1 –1Total 209 131
Provision for doubtful accounts receivable,SEK million
Group2016 2015
Provision at beginning of year –1 0Allocation for feared bad debt losses –1 –1Confirmed bad debt losses 1 0Total –1 –1
Age analysis, accounts receivable,SEK million
Group2016 2015
Accounts receivable not past due 186 120Past due 1-30 days 22 10Past due 31-90 days 1 1Past due > 90 days 0 0Total 209 131
The fair value of accounts receivable is consistent with the reported value.
Note 22 Prepaid expense and accrued Income
SEK millionGroup Parent Company
2016 2015 2016 2015Prepaid rent 5 2 1 1Prepaid insurance 1 1 1 1Deferred leasing expenses 0 1 0 0Prepaid marketing expenses 2 1 – –Prepaid commission 1 1 – –Prepaid purchases of goods and services 7 3 4 1Other prepaid expenses 6 3 1 0Total 22 12 7 3
Note 23 Shareholders’ equity
Group
Share capital Share capital consists of the Parent Company’s share capital. See the Parent Company of this note.
Additional paid-up capital Other capital consists of equity contributed by the owners.Includes share premium reserves transferred to the statutory reserve at 31 December 2005. Provision to the share premium reserve from 1 January 2006 and forward, are also recognised as paid-up capital.
Reserves The item consists of a translation reserve, which comprises all exchange rate differences arising on the translation of the financial statements of foreign operations that have prepared their financial statements in a currency other than that in which the consolidated financial statements are presented. This includes exchange differences on monetary items receivable from or payable to the foreign operations, for which settlement is neither planned nor likely in the foreseeable future.
Profit brought forward, including profit for the yearProfit brought forward/accumulated losses, including profit for the year consists of earned profits/accumulated losses in the Parent Company and its subsidiaries. Provisions to the statutory reserve, excluding transferred share premium reserves, were previously included in this item. Also included is the amount of reduction of share capital.
Parent Company
Restricted shareholders’ equity
Share capital The number of shares on 31 December 2016 amounted to 42,646,480 shares, divided into 539,872 series A shares and 42, 106 608 series B shares. The holder of shares is entitled to dividends as decided by the AGM. A shareholding entitles voting rights at the Annual General Meeting of 10 votes for each series A share and one vote for each series B share. All shares convey equal rights to the Company’s net assets and profits. The
M I DSONA – ANNUAL REPORT 2016
82—notes to the F inAnciAl stAtements

Articles of Association contain no restrictions on the transferability of shares. Upon written request from a holder of series A shares in the Com-pany, conversion of specified series A shares to series B shares will be granted.
Change in number of shares,number
Series A sha-res Class B shares Total
Number of shares 1 January 2015 379,932 22,364,858 22,744,790New share issue 94,983 5,591,214 5,686,197Number of shares 12 January 2015 474,915 27,956,072 28,430,987Number of shares 1 January 2016 474,915 27,956,072 28,430,987Reclassification –115,000 115,000 0New share issue 179,957 14,035,536 14,215,493Number of shares 12 January 2016 539,872 42,106,608 42,646,480Quota value per share, SEK 5.00Share capital on the balance sheet date, SEK 213,232,400
At the Annual General Meeting 2016 resolved to reduce the share capital by SEK 426,464,824 through allocation to restricted equity without with-drawal of shares, meaning that the quotient value was reduced from SEK 20.00 to SEK 5.00. The Swedish Companies Registration Office approved a share capital reduction 11 July 2016.
No own shares held or have been held for years by Midsona AB (publ) or its subsidiaries.
Statutory reserve The item consists of amounts that, prior to 1 January 2006, had been transferred to the share premium reserve when shares were issued at a premium, that is, at an amount exceeding the quota value of the shares.
Unrestricted shareholders’ equity
Share premium reserve: The item consists of amounts transferred to the share premium reserve as of 1 January 2006 when shares were issued at a premium, that is, at an amount beyond the quota value of the shares.
Fair value fundUntil 2015, the fair value fund consisted of a change in value due caused by a price fluctuation arising on a monetary item forming part of the net investment in a foreign unit.
The previous exception, entailing that exchange differences on mone-tary items that constitute a net investment in subsidiaries are recognised in the fair value has been removed. This item has been transferred to retained earnings in 2016 in accordance with IAS 21.
Profit brought forward/accumulated lossesProfit brought forward/accumulated losses consists of earned profits/accumulated losses in the Parent Company Also included is the amount of reduction of share capital. Retained earnings, together with the share pre-mium reserve and the profit total unrestricted equity available for distri-bution to shareholders.
WarrantsThere was one of the Company’s outstanding stock option programmes at year-end; see Note 9 Employees, personnel expenses and senior execu-tives’ remunerations.
Proposed appropriation of profit or lossThe following amount in SEK is at the disposal of the Annual General Meeting:
Share premium reserve SEK 419,016,309Accrued loss SEK 398,485,578Loss for the year SEK 210,791,452Total SEK 1,028,293,339
The Board of Directors proposes that the unrestricted shareholders’ equity in the Parent Company, amounting to SEK 1,028,293,339 be appropriated as follows:
Dividend, SEK 1.10 per share SEK 46,911,128Carried forward SEK 981,382,211Total SEK 1,028,293,339
Note 24 Liabilities to credit institutions
Interest-bearing liabilities, SEK millionGroup Parent Company
2016 2015 2016 2015Non-current interest-bearing liabilitiesBank loans 695 248 695 190Financial lease liabilities 1 2 – –Total 696 250 695 190
Current interest-bearing liabilitiesOverdrafts – 47 – 47Bank loans 30 20 30 20Financial lease liabilities 1 2 – –Total 31 69 30 67
Total 727 319 725 257
In June 2016, Midsona AB (publ) signed a financing agreement with Danske Bank regarding credit facilities totalling SEK 425 million, including a com-plete cash management solution for the entire Nordic region.
The financing consists of a revolving credit facility of SEK 325 million, which is for three years with a possible one-year extension and an over-draft facility of SEK 100 million to be reviewed on an annual basis with a possible one-year extension. The new financing arrangement and cash management solution provide a complete Group-wide structure whereby capital is used more efficiently, leading to lower costs. In connection with the acquisition of Internatural AB, new loans of SEK 800 million were taken, of which SEK 400 million constituted a bridge financing facility that was repaid in October 2016 with proceeds from the completed share issue. The acquisition loan has a ten-year amortisation schedule with an amorti-sation commitment of SEK 10 million per quarter starting 30 June 2017.
Two financial covenants are linked to the financing agreement, which must be met during the maturity of the contract. These terms require that the key figures “net debt/EBITDA” and “interest coverage” shall not, on a rolling 12-month basis, deviate from agreed levels.
Interest on facilities is calculated at the applicable base interest rate plus a margin based on the key figure “net debt/EBITDA” on a rolling 12-month basis.
Financial lease liabilities mature with contracted interest over the lease term.
M I DSONA – ANNUAL REPORT 2016
notes to the F inAnciAl stAtements—83

Credit terms interest-bearing liabilities, SEK million Nominal amount Utilised amount Unutilised amount Interest terms ¹ Maturity
Bank loansAcquisition loan 400 400 0 STIBOR + 2.25 percent June 2016 – June 2027Facility 325 325 0 STIBOR + 2.25 percent June 2016 – June 2019Total 725 725 0
OverdraftsOverdrafts 100 0 100 STIBOR + 1.75 percent 2017-01 – 2017-12Total 100 0 100
Total 825 725 100
¹The margin represents an average percentage over the 2016 financial year for credit facilities and overdraft facility.
Note 25 Other current liabilities
SEK millionGroup Parent Company
2016 2015 2016 2015VAT liabilities 15 20 0 0Settlement personnel taxes and fees 9 8 0 0Other liabilities 4 0 0 0Total 28 28 0 0
Note 26 Provisions for pensions
Defined benefit pension plansIn Norway, a special pension agreement is in place, the AFP scheme, which has been agreed between the social partners as a supplement to retire-ment pension. Such insurance comprises a defined benefit plan covering several employers. For the 2016 financial year, the Group does not have access to information making it possible to report this as a defined benefit plan. Consequently, this pension obligation is reported as a defined contri-bution plan.
In Sweden, commitments for retirement pensions and family pensions for salaried employees are secured through an insurance plan with Alecta. According to statement UFR 10, from the Financial Reporting Board, this is a defined benefit plan that covers several employers. For the 2016 financial year, the Group does not have access to information making it possible to report this as a defined benefit plan. Pension in accordance with the ITP plan and secured through insurance with Alecta is consequently recog-nised as a defined contribution plan.
The year’s fees for pension insurance secured through Alecta amounted to SEK 2 thousand (1) in the Group, and SEK 0 thousand (0) in the Parent Company. For the next reporting period, the charges expected for ITP-2 insurance with Alecta amount to SEK 2 million for the Group and SEK 0 million for the Parent Company.
Alecta’s surplus may be distributed to policyholders and/or the benefi-ciaries. At year-end 2016, Alecta’s surplus expressed as the collective fund-ing ratio was 149 percent (153). The collective consolidation level consists of the market value of Alecta’s assets as a percentage of the insurance commitments calculated in accordance with Alecta’s actuarial assump-tions, which do not comply with IAS 19.
Defined contribution pension plansFor employees in Sweden, the Group has defined contribution pension plans paid entirely by the Group companies. In other countries, there are defined contribution plans that are paid partly by the subsidiaries and that are partly covered by fees paid by the employees. Payments to these plans are on-going, in accordance with the regulations for each of the plans.
SEK millionGroup Parent Company
2016 2015 2016 2015Expenses for defined contribution plans ¹ –16 –11 –3 –2
¹ The ITP plan funded in Alecta is included as an expense of SEK 2 million (1) for the Group and SEK 0 million (0) for the Parent Company.
Note 27 Other provisions SEK million
Group Parent Company2016 2015 2016 2015
Provisions that are non-currentExpenses for restructuring measures 4 – – –Total 4 – – –
Provisions that are currentExpenses for restructuring measures 10 3 – –Total 10 3 – –
Total 14 3 – –
Expenses for restructuring measuresCarrying amount at beginning of period 3 – – –Provisions made during the year 20 18 – –Amounts utilised during the year –9 –15 – –Total 14 3 – –
Warranty expensesCarrying amount at beginning of period – 0 – –Provisions made during the year – 1 – 1Amounts utilised during the year – –1 – –1Total – – – –
Total provisionsCarrying amount at beginning of period 3 0 – –Provisions made during the year 20 19 – 1Amounts utilised during the year –9 –16 – –1Total 14 3 – –
Amount by which the provision is expected to be paid after more than twelve months
4 – – –
WarrantiesThe agreement on volume commitments in connection with the sale of the Supply business segment in 2012 was discontinued in 2015.
Restructuring measuresA provision of SEK 13 million was made during the third quarter of 2016 for the integration of acquired operations in Norway. After a re-evaluation of redundant leases the fourth quarter returned SEK 1 million. At year-end, SEK 4 million of the provision had been utilised.
A provision of SEK 8 million was made during the fourth quarter of 2016 for the integration of businesses acquired in Sweden. At year-end, SEK 2 million of the provision had been utilised.
M I DSONA – ANNUAL REPORT 2016
84—notes to the F inAnciAl stAtements

Note 28 Accrued expenses and deferred Income SEK million
Group Parent Company2016 2015 2016 2015
Accrued expenses for goods 11 8 – –Accrued personnel expenses 30 25 4 2Accrued marketing expenses 9 5 – –Accrued customer bonus expenses 16 12 – –Other accrued expenses 17 11 1 1Total 83 61 5 3
Note 29 Financial risk managementThe Group’s activities expose it to a variety of financial risks. Financial risk refers to fluctuations in the income statement, balance sheet and cash flow due to changes in exchange rates, interest rates, credit and refinanc-ing risks.
The management of the Group’s financial risks is centralised in the Parent Company finance function. Operations are conducted based on a financial policy adopted by the Board of Directors of Midsona AB.
Financing riskFinancing risk refers to the risk that future capital procurement and refinancing of maturing loans could be difficult or costly.
The ensure that the Group always has access to necessary external financing at a reasonable expense, the guideline is that confirmed credit commitments should have an average remaining maturity of at least 12 months.
A new financing agreement was signed in June 2016 with Danske Bank regarding overdraft facilities of SEK 425 million. The financing consists of a revolving credit facility of SEK 325 million, maturing 30 June 2019 with the possibility of a one-year extension and an overdraft facility of SEK 100 mil-lion. Additionally, an acquisition loan was raised in July 2016 for SEK 400 million, which extends up to 30 June 2027. At year-end, the average remaining term of committed facilities was 45 months (17).
The maturity structure for all of the Group’s financial liabilities, includ-ing principal and interest, is shown in the table below.
Liquidity riskLiquidity risk means the risk that the Group cannot meet its payment obli-gations as a consequence of inadequate access to cash and equivalents.
In order to control and plan the Group’s cash requirements, the finance function uses liquidity forecasts that the Group’s subsidiaries report in on a monthly basis for the ensuing six months.
According to the finance policy, the Group’s liquidity reserve, that is, the sum of unutilised credit facilities, cash and equivalents, shall, at any given time, exceed the Group’s total loan maturities for the ensuing six months.
Liquid assets SEK 165 million (128) at the end of year and were allo-cated to cash SEK 65 million (61), unused part of the credit SEK 0 (14) and unutilised bank credit SEK 100 million (53). Loan maturity, including princi-pal and interest, to credit institutions, over the next six months amounts to SEK 18 million (13).
Currency riskCurrency risk refers to the risk that changes in exchange rates affect the Group’s income statement, balance sheet and/or cash flows negatively.
Currency risks arise in part from the operational and financial transac-tions that are conducted in currencies other than the functional currency (transaction exposure) and in part by the currency exposure that occurs in the translation of foreign subsidiaries’ net assets to the Parent Company’s functional currency (translation exposure).
Transaction exposureThe Group’s sales of goods are conducted primarily in the currencies SEK, NOK and EUR, while procurement of goods is made primarily in SEK, NOK, EUR, GBP and USD. The net exposure in EUR is considerable because pur-chases exceed sales.
The finance function in the Parent Company makes monthly assess-ments of future currency exposure based on cash flow forecasts reported in. Estimated net flows for 2017 in the four currencies with the greatest net exposure are shown in the table.
Amounts are in millions in each currency³Group
2016 1 2015 ²EUR –80 –40DKK 84 84NOK 246 187USD –6 –1
¹ Transaction exposure is based on estimated net flows for the ensuing 12 months, i.e. for 2017.
² Transaction exposure is based on estimated net flows for the ensuing 12 months, i.e. for 2016.
³ A positive net flow means that the flow in each currency exceeds outflow and a negative net flow means that the outflow in each currency exceeds inflow.
The forecast net exposure in the currencies involved can, according to the financial policy, be hedged for up to 24 months. The currency hedged por-tion normally comprises 50 percent but can be increased to 75 percent of the net exposure for the defined period if this is deemed appropriate.
In order to reduce the performance impact of changes in exchange rates, Midsona’s ambition is to hedge future commodity purchases with forward foreign-exchange contracts. Hedge accounting under IAS 39 is not applied – instead changes in the value of derivative instruments are recognised in profit for the year. In connection with the change of the bank, hedging was resumed in December and at the end of 2016 was EUR 3 million was hedged. The change in the market value of the outstanding
Maturity profile of financial liabilities – undiscounted cash flows
Nominal amounts, SEK million 0-3 months 4-6 months 7-12 months 1-5 years 5 years <2016 2015 2016 2015 2016 2015 2016 2015 2016 2015
Overdrafts 1 – 0 – 0 – 1 – 47 – –Bank loans 4 6 14 6 28 12 522 248 222 –Financial lease liabilities 0 0 0 1 1 1 1 2 – –Accounts payable 212 132 – – – – – – – –Other current liabilities 0 0 0 0 2 – – – – –Total 216 138 14 7 29 14 523 297 222 –
¹ Does not include unused portion of the overdraft.
M I DSONA – ANNUAL REPORT 2016
notes to the F inAnciAl stAtements—85

currency forward agreements was SEK 0 million (1) as per 31 December 2016 and was recognised in profit for the year.
An isolated shift in exchange rates against the SEK by± 5 percentage points for the four currencies with the largest estimated net flows is calcu-lated to have an effect on profit before tax of ± SEK 18 million (4).
Translation exposureThe Parent Company has holdings in foreign subsidiaries, whose net assets are exposed to currency translation risk. Currency exposure of net assets in the Group’s subsidiaries can, for example, be managed by borrowing in the foreign currencies that are exposed.
Interest rate riskInterest rate risk refers to the impact on profits of a change in interest rates. How quickly a change in interest rates affects profits depends on the periods of fixed interest on loans and investments. Since the Group is a net borrower and does not invest funds in listed instruments, it is primarily the Group’s loans that are affected by changes in interest rates.
The guideline is that the average period of fixed interest for the Group’s interest-bearing liabilities to credit institutions should be three months. The average period of fixed interest for the Group’s interest-bear-ing liabilities to credit institutions was three months (three) at year-end. A change in interest rates of ± 1 percentage point causes an impact of ± 7 million (3) calculated in debt to credit instiutions of SEK 725 million (318) at year-end if the entire loan portfolio were to mature with a variable interest rate. Financial lease liabilities mature with contracted interest over the lease term.
To avoid uncertainty regarding future interest rate levels and to gain knowledge of future interest expenses over a given period, the Group applies interest rate hedging in the form of interest rate swaps. Loans of 100 million were interest rate hedged at year-end, of which SEK 50 million with a maturity of June 30, 2018, and 50 million with a maturity of June 30, 2020.
The average interest on the Group’s bank loans and overdrafts amounted to 2.2 percent (2.0) for 2016.
Financial credit riskFinancial credit risk refers to the risk of losses if the counterparties with whom the Group has placed cash and equivalents, financial investments or derivative instruments are unable to meet their payment obligations.
The finance function has no mandate to enter into financial invest-ments. Since the Group is a net borrower, any surplus liquidity shall be used to reduce loan debt. The subsidiaries shall place their surplus liquidity in bank accounts belonging to Group account systems or in bank accounts approved by the finance function.
The financial credit risk regarding cash and equivalents in bank accounts amounted to SEK 65 million (61) at year-end.
Capital managementThe Group’s objective with its capital management is to safeguard the Group’s capacity to continue its operations to generate reasonable returns for shareholders and benefit for other stakeholders. The target is to pay a dividend of >30 percent of profit for the year over time. For 2016, the Board of Directors proposes a dividend equivalent to 104.5 (47.2)percent of profit for the year.
The Group reviews its capital structure based on a ratio of net debt/EBITDA corresponding to a multiple of less than 2. The target, which has been set to define a reasonable risk level in the Group, links borrowing to the capacity for earnings. At the end of the financial year, the ratio between net debt and EBITDA on a rolling 12-month basis was a multiple of 6.2 (3.9). The ratio increased due to higher debt following an acquisition of opera-tions and the acquired operations being included in EBITDA for only six months.
Note 30 Pledged assets and contingent liabilities SEK million
Group Parent Company2016 2015 2016 2015
Pledged assetsProperty mortgages – 26 – –Chattel mortgages – 38 – –Blocked bank balances 4 1 – –Shares in subsidiaries – – 1,374 468Net assets in subsidiaries 1,394 625 – –Others 3 106 – –Total 1,401 796 1,374 468
Contingent liabilitiesGuarantees, external 15 – 2 0General guarantee for subsidiaries – – 11 48Parent Company guarantees – – 4 2Total 15 – 17 50
Shares in subsidiaries have been pledged as collateral for overdrafts and bank loans. Liabilities to credit institutions are shown in Note 24 Liabilities to credit institutions. Net assets in subsidiaries pertain to shares in sub-sidiaries that are stated at amounts equivalent to the consolidated net assets.
Note 31 Closely-related parties
Related party relationsThe Parent Company has a close relationship with its subsidiaries; see Note 17 Participations in subsidiaries.
Related party transactionsFor the Parent Company, SEK 28 million (23), equivalent to 100 percent (100) of sales for the year and SEK 2 million (0), corresponding to 10 per-cent (1) of purchases for the year pertained to subsidiaries within the Group. Sales to subsidiaries pertained mainly to administrative services, while purchases from subsidiaries primarily pertained to consultancy services and other reimbursements for expenses. All pricing is conducted on market terms.
The Parent Company has receivables from, and liabilities to, subsidiar-ies, see Note 18 Receivables from, and liabilities, to subsidiaries.
Related persons or companiesSalaries and remuneration to the Board and other senior executives are detailed in Note 9 Employees, personnel expenses and senior executives’ remunerations.
Midsona’s largest shareholder, Stena Adactum AB, has undertaken to subscribe for its pro rata share of the share issue and has issued an under-writing guarantee for the remainder of the issue.
M I DSONA – ANNUAL REPORT 2016
86—notes to the F inAnciAl stAtements

Group 2016
SEK million Measured at amortised cost At fair value through profit¹ Total carrying value Fair value
Non-current receivables 2 – 2 2Accounts receivable 209 – 209 209Other receivables² 0 – 0 0Cash and cash equivalents 65 – 65 65Total 276 – 276 276
Non-current interest-bearing liabilities 696 – 696 696Other non-current liabilities 4 – 4 4Current interest-bearing liabilities 31 – 31 31Accounts payable 212 – 212 212Other current liabilities² 26 2 28 28Total 969 2 971 971
¹ Held for trade
Financial instruments
SEK millionNot recognised at fair
valueRecognised at fair
value Total carrying value
Derivative instruments – – –Other receivables 0 – 0Total receivables 0 – 0Derivative instruments – 2 2Other current liabilities 26 – 26Total liabilities and provisions 26 2 28
Group 2015
SEK million Measured at amortised cost At fair value through profit¹ Total carrying value Fair value
Non-current receivables 2 – 2 2Accounts receivable 131 – 131 131Other fordringar² 1 1 2 2Cash and cash equivalents 61 – 61 61Total 195 1 196 196
Non-current interest-bearing liabilities 250 – 250 250Other non-current liabilities – – 0 0Current interest-bearing liabilities 69 – 69 69Accounts payable 132 – 132 132Other current skulder² 28 0 28 28Total 479 0 479 479
¹ Held for trade
Financial instruments
SEK millionNot recognised at fair
valueRecognised at fair
value Total carrying value
Derivative instruments – 1 1Other receivables 1 – 1Total receivables 1 1 2Derivative instruments – 0 0Other current liabilities 28 – 28Total liabilities and provisions 28 0 28
Parent Company 2016
SEK million Measured at amortised cost At fair value through profit Total carrying value Fair value
Other receivables 1 – 1 1Total 1 – 1 1
liabilities to credit institutions 725 – 725 725Accounts payable 2 – 2 2Other current liabilities 0 – 0 0Total 727 – 727 727
Parent Company 2015
SEK million Measured at amortised cost At fair value through profit Total carrying value Fair value
Other receivables 1 – 1 1Total 1 – 1 1
liabilities to credit institutions 257 – 257 257Accounts payable 3 – 3 3Other current liabilities 0 – 0 0Total 260 – 260 260
M I DSONA – ANNUAL REPORT 2016
notes to the F inAnciAl stAtements—87

There have been no loans, Purchases or Sales involving members of the Board or senior executives.
Note 32 Assessment of financial assets and liabilities at fair value and categorisation
Fair valueFair value is consistent in all material respects with the carrying amount in the balance sheet in respect of financial assets and liabilities. The aggre-gate carrying amounts and fair values for each category are shown .
Certain disclosures regarding financial instruments assessed at fair value through profit for the yearThe Group holds financial instruments such as forward currency contracts that are recorded at fair value in the balance sheet. For all contracts, fair value has been determined based directly or indirectly on observable mar-ket data, that is, level 2 in accordance with IFRS 13.
Netting agreements and similar agreementsThe Group has no net reported balance sheet items. For derivative coun-terparties, there are ISDA agreements, which mean that derivative items can be reported net under certain conditions. The Group holds financial instruments covered by a legally enforceable framework regarding netting or similar agreements. Presented financial liabilities attributable to deriva-tive instruments amounted to SEK 2 million and is the same counterparty.
Calculation of fair valueThe following summarises the methods and assumptions mainly used to determine the fair value of the financial instruments held.
Interest-bearing liabilitiesFair value of financial liabilities is calculated based on future cash flows of principal and interest discounted at the current market rate on the bal-ance sheet date. There are no significant differences between fair value and the carrying amounts. For a maturity analysis, see Note 29 Financial risk management.
Financial lease liabilitiesFair value is based on the present value of future cash flows, discounted at the market rate for similar leases.
Trade and other receivablesFor trade and other receivables with a remaining life of less than 12 months, the carrying amount is considered to reflect fair value. Trade and other receivables with a term of more than 12 months are discounted when fair value is determined. There are no significant differences between fair value and the carrying amounts.
Accounts payable and other liabilities For accounts payable and other liabilities with a remaining maturity of less than 12 months, the carrying amount is considered to reflect fair value. Accounts payable and other liabilities with a maturity of more than 12 months are discounted when fair value is determined. There are no signifi-cant differences between fair value and the carrying amounts.
M I DSONA – ANNUAL REPORT 2016
88—notes to the F inAnciAl stAtements

Note 33 Supplementary disclosures to cash flow analyses SEK million
Group Parent Company2016 2015 2016 2015
Interest paid Interest received 1 0 8 5Interest paid –17 –7 –15 –6
Adjustment for items not included in cash flowDividend – – –284 –40Amortisation/Depreciation 25 19 0 2Impairment 4 7 198 1Unrealised exchange rate differences 4 –1 0 –1Capital gain on sale of fixed assets 2 2 – –Pension provisions 0 – – –Other provisions and items not included in cash flow 17 1 – –Total 52 28 –86 –38
Transactions not involving paymentsAcquisition of assets through financial lease – 0 – –Vendor mortgage issued in connection with an acquisition of operations – – 112 16
Acquisitions of companies or operationsIntangible fixed assets 269 220 – –Tangible assets 6 46 – –Financial assets 0 2 807 259Deferred tax receivables 1 – – –Inventories 64 69 – –Trade and other receivables 70 48 – –Cash and cash equivalents 29 3 – –Deferred tax liabilities –60 –54 – –Non-current interest-bearing liabilities –89 –16 – –Current interest-bearing liabilities –50 –19 – –Accounts payable and other liabilities –82 –75 – –Net assets and liabilities 158 224 807 259Consolidated goodwill 532 14 – –Purchase consideration –690 –238 –807 –259Less: Purchase consideration recognised as liability – – 112 16Purchase consideration paid –690 –238 –695 –243Less: Cash and equivalents in acquired operations 29 3 – –In addition: Repayment of loans in the acquired operations –139 – –139 –Effect on cash and equivalents from acquisitions during the year –800 –235 –834 –243Payment of additional purchase consideration related to prior years’ acquisitions – –16 – –Effect on cash and equivalents of acquisitions –800 –251 –834 –243
Amortisation of loansBank loans –795 –5 –824 –5Overdrafts –47 –23 –47 –5Internal loans – – –16 –2Lease liabilities –1 –2 – –Total –843 –30 –887 –12
Cash and cash equivalentsCash and equivalents in both the Group and the Parent Company consist solely of cash and bank balances. Consequently, there are no current investments equivalent to cash and equivalents.
Note 34 Events after the balance sheet dateTobias Traneborn has been appointed Supply Chain Director for Midsona Group. He will start work in this position by 1 June 2017 and will, from that date, be a member of Group Management.
Note 35 Significant estimates and assumptions In preparing the financial statements, management makes estimates and judgements that affect the amounts of assets, liabilities, income and expenses. The estimates and assumptions that involve a risk of significant adjustments to the carrying values of assets and liabilities within the next financial year and critical judgements in applying the Group’s accounting policies discussed below. Reported estimates regarded as reasonable under the circumstances.
M I DSONA – ANNUAL REPORT 2016
notes to the F inAnciAl stAtements—89

Valuation of brandsThe carrying value of brands is contingent upon the future profitability of the products connected to the brands, and the value is tested annually. If it has not been possible to impairment testing for an individual mark has recoverable amount calculated on the cash-generating unit to which the trademarks are allocated. Several assumptions about future conditions and parameter estimates are made in the calculation of cash-generating units’ recoverable amounts for the assessment of possible needs for impairment of goodwill and brands with indeterminate useful lives. Management believes that no reasonable changes in key assumptions will lead to the total estimated recoverable amount of each cash-generating unit will be lower than their total carrying amount.
In establishing the purchase consideration allocation for Internatural AB Group assessed acquired brands reach SEK 267 million, of which SEK 240 million with an indefinite useful life. The brand Kung Markatta was judged to have an indefinite useful life as it is a well-established brand in the market that the Group intends to maintain and further develop.
The carrying value of brands at the end of the period amounted to SEK 840 million (533), of which SEK 668 (417) was with an indeterminate useful life. For further information, please see Note 14 Intangible fixed assets.
Valuation of goodwillThe carrying value of goodwill is contingent upon the future profitability of the cash-generating unit to which the goodwill is allocated to goodwill annually. Several assumptions about future conditions and parameter estimates are made in the calculation of cash-generating units’ recovera-ble amounts for the assessment of possible needs for impairment of goodwill and brands with indeterminate useful lives. Management believes that no reasonable changes in key assumptions will lead to the total estimated recoverable amount of each cash-generating unit will be lower than their total carrying amount.
In establishing the purchase consideration allocation for Internatural AB Group, goodwill was SEK 532 million.
The carrying amount of goodwill at the end of the period amounted to SEK 1,082 million (516). For further information, please see Note 14 Intangi-ble fixed assets.
TtaxesTo determine the current tax liabilities and current tax assets, as well as provisions for deferred tax liabilities and deferred tax assets, management is required to make assumptions, particularly in the valuation of deferred tax assets. This process includes the tax outcome being assessed in each country in which the Group operates. The process includes assessing the actual current tax exposure and assessing the temporary differences that arise as a consequence of certain assets and liabilities being valued differ-ently in the accounts as compared to income tax returns. Management must also assess the likelihood that deferred tax assets will be recovered from future taxable income.
In establishing the purchase consideration allocation for Internatural AB Group, it was determined that deferred tax liabilities amount to SEK 60 million and deferred tax assets to SEK 1 million.
In 2015, a reassessment of tax loss carryforwards attributable to the Group’s Swedish operations resulted in deferred tax revenue of SEK 31 mil-lion. All loss carryforwards in the Group was well capitalised at December 31, 2015 December 31, 2016.
Management believes that, given the Group’s current and future structure, the opportunities to utilise capitalised tax loss carryforwards is well founded. The carrying amount of deferred tax assets at the end of the period amounted to SEK 82 million (79). The carrying amount of deferred tax liabilities at the end of the period amounted to SEK 207 million (135).For further information, please see Note 12 Tax.
Note 36 Information about the Parent CompanyMidsona AB (publ), corporate identity number 556241-5322, is a Swedish limited company domiciled in Malmö. The visiting address for the head office is Dockplatsen 16 in Malmö and the postal address is PO Box 210 09, SE-200 21 Malmö, Sweden. The Company’s shares are listed on the Nasdaq Stockholm, Small Cap list.
The consolidated financial accounts for 2016 comprise the Parent Company and its subsidiaries; jointly referred to as “the Group”.
M I DSONA – ANNUAL REPORT 2016
90—notes to the F inAnciAl stAtements

Board of Directors’ statement of assurance
Our audit report was submitted on 30 March 2017.
Deloitte AB
Per-Arne Pettersson Authorised Public Accountant
The Board of Directors and the CEO certify that the consolidated and annual accounts have been prepared in accordance with the international accounting standards referred to in the European Parliament and Council Regulation (EC) No 1606/2002 of 19 July 2002 on the application of inter-national accounting standards and generally accepted accounting princi-ples and give a true and fair view of the financial position and results of
the Group and the Parent Company. The Directors’ Report for the Group and Parent Company gives a true and fair view of the Group and Parent Company’s financial position and results and describes material risks and uncertainties facing the Parent Company and the companies included in the Group.
Birgitta Stymne GöranssonBoard Member
Kirsten ÆgidiusBoard Member
Peter WahlbergBoard Member
Ola EriciBoard Member
Johan WesterBoard Member
Cecilia MarlowBoard Member
Peter ÅsbergPresident and CEO
The annual and consolidated accounts were, as stated above, approved for issue by the Board of Directors on 30 March 2017. The consolidated income statement, statement of comprehensive income and balance sheet, and the Parent Company’s income statement, statement of comprehensive income and balance sheet will be submitted for approval at the Annual General Meeting on 26 April 2017.
Malmö, 30 March 2017
M I DSONA – ANNUAL REPORT 2016
BoArd oF directors’ stAtement oF AssurAnce—91

Audit Report
Report on the annual accounts and consolidated accounts
Statements We have conducted an audit of the annual and consolidated financial accounts for Midsona AB (publ) for 1 January–31 December 2016. The Com-pany’s annual accounts are included on pages 52-91 of this document.
In our opinion, the annual accounts have been prepared in accordance with the Annual Accounts Act and present fairly, in all material respects, the financial position of the Parent Company as of 31 December 2016 and of its financial performance and its cash flows for the year then ended in accordance with the Annual Accounts Act. The consolidated accounts have been prepared in accordance with the Annual Accounts Act and present fairly, in all material respects, the financial position of the group as of 31 December 2016 and of their financial performance and cash flows for the year then ended in accordance with International Financial Reporting Standards, as adopted by the EU, and the Annual Accounts Act. The statu-tory administration report is consistent with the other parts of the annual accounts and consolidated accounts.
We therefore recommend that the Annual General Meeting adopt the income statement and balance sheet for the Parent Company and the Group.
Basic statements We conducted our audit in accordance with International Standards on Auditing and generally accepted auditing standards in Sweden. Our liabil-ity under these standards are described in the section Responsibility of the auditor. We are independent of the Company and the Group in accordance with ethics in Sweden and has otherwise fulfilled our ethical responsibili-ties under these requirements.
We believe that the audit evidence we have gathered is sufficient and appropriate as a basis for our statements.
Particularly important areasParticularly important areas of the audit are the areas that, in our profes-sional judgement was the most significant for the audit of the financial statements for the current period. These areas were treated as part of the audit of Midsona AB (publ), and in our standpoint regarding the financial statements as a whole, but we do not make separate statements on these areas.
Identification and valuation of brands
Description of risk� Midsona reported in the balance sheet as of 31 December 2016, brands
valued at SEK 840 million (533). � In connection with the year’s acquisition of Internatural, brands were
identified with fair value of SEK267 million. � The value of the reported assets is dependent on future profitability
and viability of the product brands relate to and tested at least annu-ally. The impairment test is based on a number of assumptions such as estimated future cash flow, gross margins, discount rates and growth.
� Inaccurate estimates and assumptions in the impairment test can impact the Group’s earnings and financial position.
For further information please refer to the Group’s accounting policies in Note 1 on pages 62-71, Note 35 on significant estimates and judgements on pages 89-90, Note 14 on intangible assets on pages 78-79 and in Note 4 of the acquisition on pages 72-73 in Annual Report.
Our audit procedures� We have examined the assumptions and fair value assessment when
preparing the acquisition analysis of Internatural to ensure that the assumptions and the fair value assessment are reasonable.
� We have audited the Company’s key controls of internal controls to identify indications of impairment.
� We have examined the assumptions and methodology on interest rate and future cash flow in impairment testing to ensure that the assump-tions are reasonable and that the procedures are consistently applied and to ensure the integrity of the calculations
Valuation of goodwill
Description of risk� Midsona reported in the balance sheet as of December 31, 2016, good-
will of SEK 1,082 million (516). This has been raised in connection with acquisitions.
� The value of the reported goodwill is dependent on future profitability and viability of the cash-generating unit, goodwill relates to and tested at least annually. Impairment trial based on several assump-tions including future cash flows, gross margins, discount rate and growth.
� Inaccurate estimates and assumptions may have a significant impact on the Group’s earnings and financial position.
To the Shareholders of Midsona AB (publ), corporate identity number 556241-5322.
M I DSONA – ANNUAL REPORT 2016
92—Audit report

For further information, please refer to the Group’s accounting policies in Note 1 on pages 62-71, Note 35 on significant estimates and judgements on pages 89-90 and Note 14 on intangible assets on pages 78-79 in the Annual Report.
Our audit procedures� We have examined Midsona’s routines for goodwill impairment testing
to ensure that the assumptions are reasonable and that the proce-dures are consistently applied and to ensure the integrity of the calcu-lations. We have also tested the arithmetic accuracy of the model used.
� We have examined the accuracy and completeness of the relevant notes to the financial statements.
� Our valuation experts participated in the implementation of audit procedures.
Information other than financial statements and accountingThis document also contains information other than the financial state-ments and is presented on pages 3-51 and 102-112.The Board and the CEO are responsible for that information.
Our statement regarding the financial statements does not include this information, and we make no statement of assurance regarding this information.
In connection with our audit of the financial statements, it is our responsibility to read the information identified above and determine whether there are any significant inconsistencies with the financial state-ments. In this review, we also take into account the knowledge that we otherwise have obtained during the audit as well as assess whether the information in general seems to contain significant errors.
If, based on the work we have done regarding this information, con-cludes that the information is material misstatement, we are obliged to report it. We have nothing to report in this regard.
Responsibility of the Board of Directors and the CEO The Board and the CEO are responsible for the financial statements are prepared and give a true and fair view in accordance with the Annual Accounts Act and with regard to the consolidated financial statements in accordance with IFRS as adopted by the EU. The Board and the CEO are also responsible for such internal control as they deem necessary for the preparation of annual accounts and consolidated accounts that are free from material misstatement, whether due to fraud or error.
In preparing the financial statements, the Board and CEO are responsi-ble for the assessment of the Company’s ability to continue operations. They state, as applicable, regarding circumstances that may affect the ability to continue operations and to use the assumption of continued operation. The assumption of continued operation is not applied if the Board and the CEO intend to liquidate the Company, to cease trading, or have no realistic alternative but to do so.
Auditors’ responsibilityOur responsibility is to achieve a reasonable level of assurance about whether the financial statements as a whole are free from material mis-
statement, whether due to fraud or error, and to submit an audit report containing our statements. Reasonable assurance is a high degree of assurance, but is no guarantee that an audit performed in accordance with ISA and generally accepted auditing standards in Sweden will always detect a material misstatement if available. Errors can occur due to fraud or error, and is considered to be material if they, individually or together reasonably be expected to influence the economic decisions of users taken with basis in the financial statements.
As part of one audit according to ISA, we use professional judgement and maintain professional scepticism throughout the audit. Also: � identifying and assessing the risks of material misstatement of the
financial statements, whether due to fraud or error, designing and performing audit procedures including on the basis of these risks and obtaining audit evidence that is sufficient and appropriate to provide a basis for our statements. The risk of not detecting a material mis-statement resulting from fraud is higher than that of a material mis-statement due to error because fraud may involve acting in collusion, forgery, deliberate omissions, misinformation or failure of internal controls.
� we obtain an understanding of the part of the Company’s internal controls that are important for our audit in order to design audit pro-cedures that are appropriate in the circumstances, but not to express an opinion on the effectiveness of internal controls.
� we evaluate the appropriateness of accounting policies used and the reasonableness of the Board and Managing Director of accounting estimates and related disclosures.
� We draw a conclusion on the appropriateness of the Board and the CEO preparing the financial statements based on the assumption of continued operation. We also draw a conclusion, based on the acquired audit evidence, as to whether there is a material uncertainty related to such events or conditions that may lead to significant doubt about the Company’s ability to continue operations. If we conclude that there is a substantial element of uncertainty, we must in the auditor’s report draw attention to the information in the Annual Report regarding such element of uncertainty, or, if such information is insufficient, modifying the statement on the annual and consolidated financial statements. Our conclusions are based on the audit evidence obtained through the date of audit report dating. However, future events or circumstances can result in a company being forced to cease operations.
� we evaluate the overall presentation, structure and content of the financial statements, including disclosures, and the financial state-ments reflect the underlying transactions and events in a way that gives a true and fair view.
� we collect sufficient and appropriate audit evidence regarding the financial information of entities or business activities within the Group to make a statement regarding the consolidated financial statements. We are responsible for the management, supervision and execution of the audit of the Group. We are solely responsible for our statements.
We must inform the Board of the planned audit scope and direction as well as its timing. We also have to inform about significant findings during the audit, including the significant deficiencies in internal control that we identified.
We must also provide the Board with a statement that we have com-plied with relevant ethical requirements regarding independence and
M I DSONA – ANNUAL REPORT 2016
Audit report—93

declare all relationships and circumstances that may reasonably affect our independence, and where applicable, corresponding countermeasures.
Of the areas that are communicated with the Board, we establish which of these areas have been the most significance for the audit of the financial statements, including the most important assessed risks of mate-rial misstatement, and therefore constitute the audit, particularly for important areas. We describe these areas in the audit report unless laws and regulations prevent disclosure of the issue, or when, in extremely rare cases, we consider that a matter is not to be communicated in the audit report due to the negative consequences of doing so reasonably being expected to be greater than the public interest of this communication.
Report on other legal and regulatory requirements
StatementsIn addition to our audit of the annual accounts and consolidated accounts, we have also audited the proposed appropriations of the Company’s profit or loss and the administration of the Board of Directors and the CEO of Midsona AB (publ) for the financial year 1 January – 31 December 2016.
We recommend to the Annual General Meeting that the Company’s profit appropriate in accordance with the proposal presented in the statu-tory administration report (Board of Directors’ Report) and that the mem-bers of the Board of Directors and the CEO be discharged from liability for the financial year.
Basic statementsWe have conducted our audit in accordance with generally accepted auditing standards in Sweden. Our responsibility according to this is described in the section Responsibility of the auditor. We are independent of the Company and the Group in accordance with ethics in Sweden and has otherwise fulfilled our ethical responsibilities under these require-ments.
We believe that the audit evidence we have gathered is sufficient and appropriate as a basis for our statements.
Responsibility of the Board of Directors and the CEOThe Board of Directors has the responsibility for the proposal to allocations regarding the Company’s profit or loss. At the proposal of a dividend, this includes an assessment of whether the dividend is justifiable considering the requirements of the Company and the type of Group activity, scope and risks placed on the size of the Parent Company and the Group’s equity and the Company’s consolidation requirements, liquidity and position in general.
The Board is responsible for the organisation and management of its affairs. This includes regular assessment of the Company’s and Group’s financial position, to ensure that the Company’s organisation is designed so that accounting, cash management and financial affairs are controlled in a satisfactory manner. The CEO is responsible for the ongoing manage-ment of the Board’s guidelines and instructions, including taking the
measures necessary for the Company’s accounting to be performed in accordance with law and for asset management to be conducted in a prudent manner.
Auditors’ responsibilityOur responsibility regarding the audit of the administration, and therefore our opinion, is to obtain audit evidence to a reasonable degree of certainty to determine whether any Board member or the CEO
� before taking any action or been guilty of any omission, which could give rise to significant liability to the Company
� in any significant way, acted in contravention of the Companies Act or the Articles of Association.
Our goal regarding the audit of the proposed appropriation of the profit or loss, and therefore our statement on this, is to determine with a reasona-ble degree of assurance whether a proposal is in accordance with the Companies Act.
Reasonable assurance is a high degree of assurance, but no guarantee that an audit is performed in accordance with generally accepted auditing standards in Sweden will always detect actions or omissions that may cause significant liability to the Company, or that the proposed appropria-tion of the profit or loss is not is consistent with the Companies Act.
As part of an audit in accordance with generally accepted auditing standards in Sweden we use professional judgement and maintain profes-sional scepticism throughout the audit. The audit of the management and the proposed appropriation of the profit or loss is primarily based on the audit of the accounts. In addition, we focus the review on such measures, areas and conditions that are essential for operations where deviations and infringements would have particular significance for the Company’s current situation and future development. We review and test decisions, bases for decisions, actions taken and circumstances relevant to the Company’s management. If we note a real or suspected damage to the Company, we evaluate if intent or negligence, in which case the responsi-bility for action or omission. The choice of procedures performed is based on our professional judgement. Regarding the proposed appropriation of the profit or loss, we especially take a position on the Board’s explanatory statement and a selection of the evidence in order to assess whether the proposal is in accordance with the Companies Act.
Malmö, March 30, 2017
Deloitte AB
Per-Arne PetterssonAuthorised Public Accountant
M I DSONA – ANNUAL REPORT 2016
94—Audit report

Chairman’s ReportDear Shareholders and other readers,
Midsona is developing and growing in a very good way. In recent years, we have completed a number of acquisitions, including two major and strategic ones, which gave us the brands Urte kram, the Kung Markatta and Helios, with the goal of becoming the Nordic leader in healthy food. I want to thank all shareholders for that you supported Midsona of this acquisition strategy. Your commitment and your contributions through new equity capital are an important prerequisite for the Company’s expansion.
The Board and management are well-coordi-nated in this work and we intend to continue to expand in healthy foods, not only in Scandinavia, but we will also look at opportunities in the rest of Europe.
Some of the business developmentThe Board’s primary role is to be a part of the long-term business development, that is, to take respon-sibility for the Company’s goals and strategies. Then it becomes the responsibility of Management to execute. It is also essential for the Board to ensure that it is managed efficiently and complies with the relevant laws governing the operations. The pur-pose of corporate governance is to create system-atic control and the corporate governance report describes the work.
As Chairman, I believe that the Board should be close to the business. Accordingly, we receive the relevant knowledge to be able to prioritise our work. It allows us to provide stronger support to the Management and to also challenge regarding Com-pany, industry and market issues.
Six regular meetings per yearMidsona’s Board normally holds six regular meet-ings per year, five of which are full-day meetings and the strategy meeting that lasts for one day. The Chairman prepares the meetings together with the CEO, will lead the discussion and process the decisions taken. During a half-day each month, I also meet the CEO, in part to follow up on Board resolutions, but especially in a smaller format to discuss the Company’s development.
Acquisitions are therefore an important compo-nent of our business plan and the work of the Board
has in recent years been characterised by large acquisitions, which has resulted in a more signifi-cant involvement of the Board in a timely manner, analysis and decision than normal. Midsona has in both cases also carried out share issues.
The brand on the Board’s table The Board has in recent years also focused on the development of the Group’s brands. It is important to ensure that Midsona’s prioritised brands over time show steady growth. Brands are important and are constantly on the Board table.
Another issue that the Board has worked with the developing the organisation. As the Group has grown, the workload has increased for manage-ment. Periodically have sometimes had a dual role, which in the long term is unsustainable. It has also resulted in a strengthening of the Management team during the last twelve months with three functions: Heads of the Nordic countries, Sweden and the Supply Chain.
Self-assessment every yearThe Board conducts an annual self-evaluation, where each member analyses the work of the Board, its shareholders, the Chairman and CEO. Based on the responses, we can see how the differ-ent measuring areas – board work, skill level, the climate debate and more – are changing. It is grati-fying that the outcome of the evaluation in 2016 improved compared to the previous year. As Chair-man, it is of course interesting to find out where the Board was performing well, but above all I want to know what parts we need to improve.
Midsona’s responsibility is to, through our oper-ations, take responsibility for a clear trend towards healthy, organic, healthy, sustainable and tasty products. Helping people attain a healthier life motivates us and permeates our business. That’s what we believe in and that is what all employees and we on the Board are working towards.
Ola EriciChairman of the Board
M I DSONA – ANNUAL REPORT 2016
chAirmAn’s report—95

Framework for corporate governanceCorporate governance is based on law, the Articles of Association, the NASDAQ OMX Rules for Issuers, the Swedish Code of Corporate Governance and internal policies and guidelines. Midsona has no deviations to report from the Swedish Code of Corporate Governance.
Share and shareholdersFor further information on the share and shareholders, please see pages 48-51 and www.midsona.com.
Annual General MeetingThe Annual General Meeting and the Extraordinary General Meeting are, under the Companies Act, the Company’s highest decision-making body in which shareholders exercise their voting rights. Shareholders who are reg-istered in the share register on the record date and notified the Company of their participation in time are entitled to attend the meeting and vote for their shareholding. At the meeting, shareholders are also able to ask questions about the Group’s operations. Information on shareholders’ right to request that matters be considered by the Annual General Meeting is published at www.midsona.com.
Corporate Governance
Board of DirectorsAudit Committee
Remunerations Committee
Shareholders constitute the Annual General Meeting
CEO and Group Management
Auditors Nominations Committee
Economy and finance
Business area Norway Business area Finland Business area DenmarkBusiness area Sweden
INFORMATION
INFORMATION
PROPOSALS
ELECTIONS
TARGET STRATEGIESCONTROL INSTRUMENTS
TARGET POLICIES ACTIVITIES
REPORTS
REPORTS FORECASTSBUSINESS OVERVIEW
ELECTIONS
Midsona AB (publ) (below “Midsona”) is a Swedish public company listed on the Nasdaq Stockholm, Small Cap list. Midsona applies the Swedish Code of Corporate Governance and hereby presents its Corporate Governance Report for 2016. The report has been prepared by the Company’s Board of Directors and the Company’s has issued an opinion.
M I DSONA – ANNUAL REPORT 2016
96—corporAte GovernAnce

The procedure for the announcement of Annual General Meetings is set out in the Articles of Association. The announcement shall be issued by means of an advertisement in Post-och Inrikes Tidningar (Swedish official gazette) and on www.midsona.com. At the same time as the announce-ment is issued, information concerning the announcement shall be pub-lished in Dagens Industri. The Annual General Meeting shall be held in Malmö within six months of the end of the financial year. Normally, the Annual General Meeting takes place in April or May.
The Annual General Meeting appoints and dismisses members of the Board of Directors and amends the Articles of Association.
At the Annual General Meeting, shareholders make decisions on mat-ters including the approval of the income statement and balance sheet, the consolidated income statement and balance sheet, the disposition of earnings, the discharge of the Board and CEO from liability, the election of Board members, the Chairman of the Board and audit firm, the approval of fees to the Board and audit firm, principles for the appointment and work of the Nominating Committee, and guidelines for remuneration to the CEO and other senior executives.
Following the meeting, decisions made at the Annual General Meeting are published in a press release. The minutes of the Meeting are published at www.midsona.com.
Annual General Meeting 2016The 2016 Annual General Meeting was held on 27 April 2016 in Malmö. At the Meeting, 56 shareholders were present in person or by proxy, repre-senting 56.5 percent of the total number of votes. The minutes of the 2016 Annual General Meeting are available at www.midsona.com.
Extraordinary General Meeting 2016An Extraordinary General Meeting was held on 8 September 2016 in Malmö. At the Meeting, 31 shareholders were present in person or by proxy, repre-senting 66.3 percent of the total number of votes. The minutes of the 2016 Extraordinary General Meeting are available at www.midsona.com.
Annual General Meeting 2017The 2017 Annual General Meeting will be held on 26 April 2017 in Malmö, as was announced in the interim report for January-September on 21 October 2016 and in a press release on 21 October 2016. The complete announce-ment of the 2017 Annual General Meeting, including information about registration for participation at the Meeting was published in a press release on 27 March 2017 and is available at www.midsona.com.
Nominations CommitteeThe Nominating Committee represents the Company’s shareholders and its assignment includes proposing a Chairman for the Annual General Meeting, Board members, Chairman of the Board, audit firm, Board fees, fees to the audit firm and how the Nominating Committee should be appointed. The representative for the largest proportion of ownership shall be appointed Chairman of the Committee.
Nomination Committee for the 2017 Annual General MeetingThe 2016 Annual General Meeting resolved to task the Chairman of the Board with contacting representatives of the Company’s three largest shareholders at the end of August 2016 to ask them to appoint one mem-ber each to the Committee.
Name/Representing %
Percentage of votes 31 August 2016
Percentage of votes 31 August 2016
Martin Svalstedt/Stena Adactum AB 30.0 30.0Elisabeth Jamal Bergström/Handelsbanken Fonder 9.1 8.9Ulrika Danielson, Second AP fund 5.3 5.3Total 44.4 44.2
Among other things, the Nomination Committee evaluated the Board’s work,skills and composition, as well as the independence of the members in accordance with the Swedish Code of Corporate Governance. The Nomi-nating Committee has also considered other criteria, such as members’ different backgrounds, experiences and requirements for diversity. The Chairman of the Board presented the results of the Board’s own evalua-tion to the Nominating Committee.
The Nomination Committee for the Annual General Meeting 2017 held two meetings before the publication of the notice of the General Meeting 2017. The convener of the Nominating Committee has been the Chairman of the Board, Ola Erici, who has also attended all of the meetings. The composition of the Committee was published in a press release 21 October 2016 and at www.midsona.com. Shareholders have been offered the opportunity to submit proposals to the Nomination Committee. Informa-tion on how shareholders can submit proposals to the Committee is pro-vided at www.midsona.com.
The Nominating Committee’s proposal, and reasoned opinion, is pub-lished in connection with the announcement of the 2017 Annual General Meeting at the latest.
Members do not receive any fees or remuneration for their work on the Committee.
Proposal to the 2017 Annual General MeetingThe Nominating Committee has resolved to propose the following to the 2017 Annual General Meeting:1 Re-election of Board Members Ola Erici Cecilia Marlow, Birgitta Stymne
Göransson, Peter Wahlberg, Johan Wester and Kirsten Ægidius and the election of Henrik Stenqvist.
1 New election of Ola Erici as Chairman of the Board.1 Re-election of Deloitte AB as audit firm.1 An increase in the Chairman’s fee of SEK 100,000 to 500,000.
Unchanged fees to the Board members.
The Nominating Committee’s complete proposals are included in the announcement of the Annual General Meeting.
The Nominating Committee considers that the proposed composition of the Board to be adequate to meet the Company’s long-term needs.
Board of DirectorsAccording to the Articles of Association, the Board of Directors shall con-sist of at least three members and not more than nine and that no depu-ties shall be appointed. Members of the Board are elected annually at the Annual General Meeting for the period until the end of the next Annual General Meeting. There are no rules about how long a member may serve on the Board.
Composition of the Board in 2016At the Annual General Meeting 2016, the following 6 directors were selected: Ola Erici (Chairman), Cecilia Marlow, Birgitta Stymne Göransson, Peter Wahlberg, Johan Wester and Kirsten Ægidius. Board composition
M I DSONA – ANNUAL REPORT 2016
corporAte GovernAnce—97

complies with the Swedish Code of Corporate Governance with regard to its independence in relation to both the Company and its management and major shareholders. For information on the independence of Board members, other assignments and holdings of shares in the Company, please see pages 102-103.
The CEO and the CFO, who is also the Board’s secretary, both partici-pate in Board meetings. When necessary, other officials participate in Board meetings to report on particular matters.
Chairman of the BoardThe Chairman organises and directs the work of the Board, represents the Company on ownership issues and is responsible for evaluating the Board’s work. The Chairman is also responsible for the on-going dialogue with the CEO regarding operations and for the Board’s fulfilment of its duties.
Work and responsibilities of the BoardThe Board of Directors is the highest management body beneath the Annual General Meeting and is responsible for the organisation and man-agement of the Company’s affairs. It shall primarily engage in more over-arching and long-term issues that are of substantial significance for the Group’s future focus.
The work of the Board follows written rules governing its practices and responsibilities, the division of work between the Board and its commit-tees, as well as the role of the Chairman. Also regulated is the framework for the Board meetings, including their convening, agenda and minutes, as well as how the Board is to be supplied with comprehensive information for its work. The Board has also decided on the introduction of general policies for the operations and other central governance documents for the regulation of responsibilities, guidelines, procedures, values and targets.
The work of the Board is normally cyclical in nature. At the beginning of the year, the year-end and annual reports are addressed, as are the mat-ters to be presented at the Annual General Meeting. Before the summer, the Group’s long-term strategic plan and focus are addressed. At the end of the year, the budget for the coming year is addressed. Each quarter,
financial reporting is reviewed and the interim reports are approved for publication. In connection with the Annual General Meeting, an inaugural Board meeting is held, at which Committee members and signatories are determined, among other things.
Work of the Board in 2016In 2016, the Board held 14 meetings (10). For information on members’ attendance, please see pages 102-103.
The Board regularly reviews the strategic issues affecting the Group’s operations and general direction. The year’s work focused largely on struc-tural and growth issues, follow-up of prior years’ acquisitions and strategic planning.
Board meetings follow a pre-approved agenda, to which specific issues will be added as necessary. The agenda, together with documentation for each of its items, is distributed to all Board Members approximately one week before the meeting. Each Board meeting commences with the min-utes of the previous meeting and a review of any open matters. The CEO then provides an account of the Group’s sales, earnings and business situa-tion, including important external factors. Normally, the CFO then accounts for the Group’s financial position in greater detail, together with any necessary analyses. Members of Group Management then report on outstanding matters from previous meetings or present plans or propos-als. In addition to the information provided in connection with Board meetings, the CEO distributes a monthly report to Board Members. Min-utes are kept for all Board meetings and sent to members for approval.
Evaluation of the Board’s workThe Chairman of the Board is responsible for evaluating the Board’s work, including the assessment of individual Board members’ performance in accordance with an established process. The evaluation is reported to the Nominating Committee and forms the basis for the Committee’s proposals regarding the composition of the Board and its fees.
Q4
Q3
Q1
Q2
Financial review
STR AT EG I ES
Analysis of the Company’s brandsReport of the Audit Committee
Board assessment reportApproval of budget for 2017
Report of the Remunerations CommitteeReport of the Audit CommitteeMatters for consideration by the 2016 Annual General Meeting
Decision on new share issueApproval of prospectus
Approval of acquisitions of operations
Work of the Board in 2016
M I DSONA – ANNUAL REPORT 2016
98—corporAte GovernAnce

Board CommitteesThe Board has appointed an Audit Committee and a Remunerations Committee. The members of the committees and their chairpersons are appointed at the inaugural Board meeting for one year at a time. The work of the committees is mainly of a preparatory and advisory nature, although the Board may, in individual cases, delegate the right to determine specific issues to the committees. The matters addressed at committee meetings are minuted and reported to the Board at the next Board meeting.
Audit CommitteeThe Audit Committee’s main task is to oversee the financial reporting and ensure that the adopted principles for financial reporting, internal controls, internal audit and risk assessment are adhered to and applied. Its mission is to support the Nominating Committee with proposals for the election of audit firm and audit fees.
The audit Committee consisted 2016 of Cecilia Marlow (Chairman), Peter Wahlberg and Johan Wester. The Committee met 2 times (2) during , 2016. For information regarded the Members’s attendance, see page 103. The Chairman, the CEO and the CFO, as well as the Secretary of the Audit Committee, and chief auditor attended Committee meetings.
Remunerations CommitteeThe Remunerations Committee’s main task is to prepare business for decision by the Board relating to terms of remuneration and employment for the CEO and other senior executives on the basis of principles estab-lished by the Annual General Meeting. It is also tasked with proposing guidelines for remuneration to the CEO and other senior executives, and with monitoring and evaluating the objectives and principles for variable compensation.
The Remuneration Committee consisted in 2016 of Ola Erici (Chairman) and Birgitta Stymne Göransson. The Committee met four times (one) below, 2016. For details of members’ attendance, please see page 103.
CEO and Group ManagementThe President of the Company, who is also the CEO of the Group, is appointed by the Board of Directors. Peter Åsberg is the CEO and is responsible for on-going management in accordance with the Board’s guidelines and instructions. In consultation with the Chairman of the Board, the CEO prepares the information the Board needs to conduct its work, presents matters and proposals for decisions and keeps the Board informed of the Company’s development. The CEO leads the work of Group Management and makes decisions in consultation with other mem-bers of Group Management. In addition to the CEO, Group Management includes the CEO, the CFO and the heads of the business areas.
In 2016, the Group Management met eight times (seven). The focus of the meetings have mainly been on the Group’s strategic and operational development and performance monitoring. Operations are organised in four business areas.
For further information about Group Management, please see page 104-105 and www.midsona.com.
Instructions for the CEOThe Board adopts written instructions for the work of the CEO that, among other things, clarify responsibilities for day-to-day management, the division of duties between the Board and the CEO, as well cooperation with, and the information to, the Board.
Evaluation of the CEOThe Board continuously evaluates the CEO’s work and expertise. The evaluation is made once a year without his presence.
Guidelines for remunerations to senior executivesFor information on the guidelines for remuneration to senior executives adopted by the 2016 Annual General Meeting and the Board’s proposed guidelines for remuneration to senior executives ahead of the 2017 Annual General Meeting, please see pages 104-105 and www.midsona.com.
President and CEO
Peter Åsberg
Business area Norway
Vidar EskelundBusiness area Finland
Markku JanhunenBusiness Area Denmark
Lars BørresenBusiness Area Sweden
Ulrika Palm
Economy & Finance, IT and IR
Lennart SvenssonDirector Nordics
Anders Dahlin
Group structure
M I DSONA – ANNUAL REPORT 2016
corporAte GovernAnce—99

Regulations regarding share tradingBoard members, the CEO and other senior executives registered as insiders may trade in Midsona shares in accordance with applicable legislation and regulations. Beyond these, there are no specific internal regulations.
External auditorDeloitte AB, with authorised public accountant Per-Arne Pettersson as the principal auditor responsible, was elected by the 2016 Annual General Meeting for a period of one year. For information on fees and remunera-tions to audit firms, please see Note 8 Fees and remuneration to auditors on page 74.
Audit assignmentThe audit assignment includes an audit of the annual and consolidated financial statements. An audit is also performed of the proposal for appro-priation of the Company’s profit or loss and the administration by the Board of Directors and the CEO. The audit culminates in an audit report and an opinion on the corporate governance report being issued prior to the Annual General Meeting. In addition, a statutory review is conducted of the interim reports for the periods 1 January to 30 September and for the period 1 January to 31 December within the framework of the audit assignment.
The principal auditor responsible participates in Audit Committee meetings and reports in an on-going manner to the Chairman of the Audit Committee as necessary. The Board meets with the principal auditor in connection with the Interim Report being dealt with by the Board. The principal auditor takes part at Annual General Meeting, describing the audit and presenting the audit report.
Additional informationAt www.midsona.com, information including the following is available – an overview of the Company’s application of the Swedish Code of Corpo-rate Governance, the Articles of Association, the Company’s Code of Con-duct, information from previous Annual General Meetings and previous Corporate Governance Reports.
Information on the laws and practices of Swedish corporate govern-ance can be found at the Swedish Corporate Governance Board (www.bolagsstyrning.se), Nasdaq Stockholm (www.nasdaqnordic.com) and Finansinspektionen (www.fi.se).
Internal control of financial reportingThe report on internal control of financial reporting has been prepared by the Board of Directors in accordance with the Swedish Code of Corporate Governance and the guidelines issued by the Confederation of Swedish Enterprise and FAR. It describes how internal control is organised to man-age and minimise the risk of errors in financial reporting.
Internal controlWithin the Company, the following targets have been set with regard to internal control.
1 It shall ensure compliance with the framework of applicable laws, regulations, rules and standards to which we are subject.
1 It shall ensure that financial reporting is reliable and provides share-holders, the Board of Directors, management and other stakeholders adequate information on which to assess performance and develop-ment.
1 It shall ensure that business operations are appropriately organised and conducted in such a manner that risks are continuously assessed, managed and minimised to meet financial and operational targets. On-going efforts to meet these targets involves a process building on a framework for internal control in which there is a particularly crucial interplay between control activities and the development of an effec-tive control environment whereby responsibilities are assumed within the organisation.
The description of how internal controls are organised is limited to the internal control of financial reporting and follows a framework developed by “The Committee of Sponsoring Organisations of the Treadway Commis-sion” (COSO). The framework consists of five components: control envi-ronment, risk assessment, control activities, information and communica-tion, and review.
Control environmentThe control environment forms the basis for the internal control of finan-cial reporting. An important part of the control environment is that deci-sion-making paths, authorisations and responsibilities are clearly defined and communicated between different parts of the organisation and that control documents in the form of policies, manuals, guidelines and instruc-tions are in place. Consequently, an important part of the Board’s work is to develop and approve a number of basic policies, guidelines and frame-works. These include the Board’s formal work plan, the instructions to the CEO, regulations regarding investments, a financial policy and an insider policy. The purpose of these documents is to establish a basis for good internal control. The Board also works to ensure that the organisational structure provides clear roles, responsibilities and processes, facilitating effective management of operational risks and enabling the achievement of targets.
As part of the responsibility structure, each month, the Board evalu-ates business performance and results through an appropriate package of reports containing income statements and balance sheets, analyses of key performance indicators, comments regarding the business situation of each operation and, on a quarterly basis, also forecasts for future periods. As part of efforts to strengthen the internal control, policies, regulations and procedures are in place that provide a clear picture of the economic situation. These are living documents that are updated regularly and adapted to changes in the operations. In addition to this there are instruc-tions that provide guidance in the day-to-day work of the organisation.
Risk assessmentAn on-going process is underway to map the Group’s risks. In this process, a number of income statement and balance sheet items are identified where the risk of errors in financial reports is elevated. The Company makes continuous efforts to strengthen controls around these risks. Fur-thermore, risks are addressed in specific forums, for example issues related
M I DSONA – ANNUAL REPORT 2016
100—corporAte GovernAnce

to acquisitions. For information about items that are subject to significant estimates and judgements, see Note 35 Important estimates and assess-ments page 89 and the section Risks and risk management, page 42.
Control activitiesThe Group’s control structure is designed to manage risks that the Board deems relevant in the internal control of financial reporting. The purpose of the control activities is to detect, prevent and correct errors and incon-sistencies in reporting. Control activities include, for example, processes and procedures for the making of important decisions, earnings analyses and other analytical follow-ups, reconciliations, stock-taking procedures and controls in IT systems.
Information and communicationThe Company’s governing documents, including policies, guidelines and manuals are continuously updated and communicated through the appro-priate channels, such as e-mail, internal meetings and the intranet.
Follow-upThe Board continuously evaluates the information provided by the Audit Committee, Group Management and the external auditor. The CEO and CFO hold frequent briefings with each of the business area managers regarding the business situation, performance, financial position and fore-casts. In addition, the central controller function maintains close coopera-tion with finance managers and controllers at the business area and com-pany level with regard to reporting and closing the accounts. Follow-up and feedback on any problems arising in the internal controls form a cen-tral component in the internal control processes.
Financial reportingFinancial data are reported monthly from all reporting units, in accordance with standardised reporting procedures as documented in the Group’s accounting manual. This reporting forms the basis of the Group’s consoli-dated financial reporting. The consolidation, which is performed centrally, culminates in complete income statements and balance sheets for each company and for the Group as a whole. Reported financial data are stored in a central database from which it is retrieved for analysis and review at the Group, business area and company levels.
Assessment of the need for a special review functionThe Group currently has no separate review function (internal audit). In light of the existing process for self-assessment and objective testing by an independent party, the view is taken that there is currently no need for a special review function to perform effective monitoring of internal control.
System improvements in 2016The level at which review and evaluation should be performed is assessed continuously. This assessment also takes into account what systems should be implemented or updated and when.
A board portal, Admin Control, for increased security of supply and access to documents and the ability to communicate was put into opera-tion in early in 2016.
In autumn 2016, Midsona started a project that involves the various business systems of the Group, shall be replaced by a common business system. The new system is expected to continuously be commissioned between the turn of the year 2017/2018 and the turn of the year 2018/2019.
Auditor’s statement regarding the Corporate Governance Report
To the Annual General Meeting of Midsona AB (publ), corporate identity number 556241-5322
Assignment and responsibilitiesThe Board of Directors is responsible for the Corporate Governance Report for 2016, included on pages 96-101 of the printed version of this document, and for it being prepared in accordance with the Annual Accounts Act.
The focus and scope of the auditOur review has been conducted in accordance with FAR’s statement RevU 16 Auditor’s review of the corporate governance report. This means that our statutory examination of the corporate governance statement is dif-ferent and substantially less in scope than an audit conducted in accord-ance with International Standards on Auditing and generally accepted auditing standards in Sweden. We believe that the audit evidence we have obtained is sufficient and appropriate to provide a basis for our state-ments.
StatementA corporate governance report has been prepared. Information in chapter 6. § 6 in Paragraph 2-6 Annual Act and Chapter 7. § 31, second paragraph of the same Act is consistent with the financial statements and are in accord-ance with the Annual Accounts Act.
Malmö, 30 March 2017
Deloitte AB
Per-Arne Pettersson Authorised Public Accountant
M I DSONA – ANNUAL REPORT 2016
corporAte GovernAnce—101

Board of Directors
Ola Erici Cecilia Marlow Birgitta Stymne Göransson
Born 1960 1960 1957
Position on the Board/attendance Chairman – 14/14 Member – 14/14 Member – 14/14
Elected, year 2012 2015 2015
Position Industrial advisor Professional board member Industrial advisor
Previous experienceCEO of Ferrosan and Skånemejerier and
several executive positions in the Tetra Laval Group and Gambro
President Kronans Droghandel, President JC and President Polarn & Pyret
President Memira, President Semantix, Executive Vice President Telefos, CFO Åhléns and CFO McKinsey
Education MBA, Stockholm School of Economics MBA, Stockholm School of EconomicsGraduate Engineer, Royal Institute of
Technology, Stockholm and MBA Harvard Business School
Other assignmentsChairman of the Boards of Ecobränsle AB and
Geveko AB. Board member of Haarslev A/S among others.
Chairman of the Board of Kivra AB. Director of Clas Ohlson AB, Karl Fazer Oy, Nordea Funds Ltd., Platzer Fastigheter AB, IES AB MatHem
in Sweden AB.
Chairman of HL Display AB and Stiftelsen Fryshuset. Board of Elekta AB, Capio, Sports
Amore AB and Pandora A / S.
Dependent on the Company and its shareholders
No No No
Own shareholdings and those of closely-related parties, 20162
100,000 call options⁵, 56,245 series B-shares (personal holdings and closely-related parties)
4,500 series B shares (through company) 3,500 series B shares
Own shareholdings and those of closely-related parties, 2015
38,884 series B shares – –
Remuneration, 20163 Board fees 400,000 ⁴Total 400,000
Directors’ fees 200,000 Committee fees 20,000
Total 220,000
Directors’ fees 200,000 Committee fees 20,000
Total 220,000
1 Johan Wester conducts assignments on behalf of Stena Adactum AB.
2 Shareholding as of 28 February 2017. For updated shareholding, please see www.midsona.com/Bolagsstyrning.
3 Remuneration to the Board of Directors for the period May–April 2016. Remuneration to Board members elected by the 2016 Annual General Meeting following a proposal from the Nomination Committee. For more information, see Note 9 Employees, personnel expenses and senior executives’ remunera-tions, page 74.
⁴ The Board fees include fees for work on the Remuneration Committee.
⁵ The main owner Stena Adactum issued, in November 2016, 100,000 call options with their own holding in Midsona shares as guarantee. Midsona is not a party to the transaction and the future redemption of the warrants will not affect Midsona’s financial position and earnings.
M I DSONA – ANNUAL REPORT 2016
102—BoArd oF directors

Peter Wahlberg
Audit Committee/attendanceCecilia Marlow – Chairman– 2/2Peter Wahlberg – Member – 1/1Johan Wester – Board member – 2/2
Remunerations Committee/attendanceOla Erici – Chairman – 4/4Birgitta Stymne Göransson – Member – 2/2
Johan Wester Kirsten Ægidius
1962 1966 1963
Member – 14/14 Member – 14/14 Member – 12/12
2015 2009 2016
Self-employed Investment Director, Stena Adactum AB Group Marketing Director, Hilding Anders
Stockbroker Penser Fondkommission and Matteus Fondkommission
CEO Mediatec Group, Partner at Arthur D. Little and member of the Boards of Ballingslöv
International AB and Personec Oy
CEO Weber-Stephan Nordics, Marketing Director Carlsberg Denmark and various
positions at Coca-Cola and Unilever
Economics studies at Lund UniversityGraduate engineer, Chalmers Institute of
TechnologyMasters Degree, Copenhagen Business
School
Chairman of the Board of Wallhouse AB. Director of Walldoc AB Hestermus, AB Nolefo,
Wahlbergs Drycker AB, AB Data Documentation Staffanstorp AB and
Pudelqvist.
Chairman of Sinvest. Board member of Stena Renewable and Beijer Electronics.
Chairman of Captum Group AB and Torslanda Tidningen AB.
Director of Andersen & Martini A/S.
No Yes¹ No
2,312,773 series B shares (family’s and through the company), of which 753,406 is via endow-
ment insurance.
66,375 series B shares (personal holding and family’s)
4,500 series B shares
1,525,316 series B shares 44,250 series B shares –
Directors’ fees 200,000 Committee fees 20,000
Total 220,000
Directors’ fees 200,000 Committee fees 20,000
Total 220,000
Directors’ fees 200,000 Committee fees –
Total 200,000
AuditorPer-Arne Pettersson. Authorised Public Accoun-tant with Deloitte AB and member of FAR.
M I DSONA – ANNUAL REPORT 2016
BoArd oF directors—103
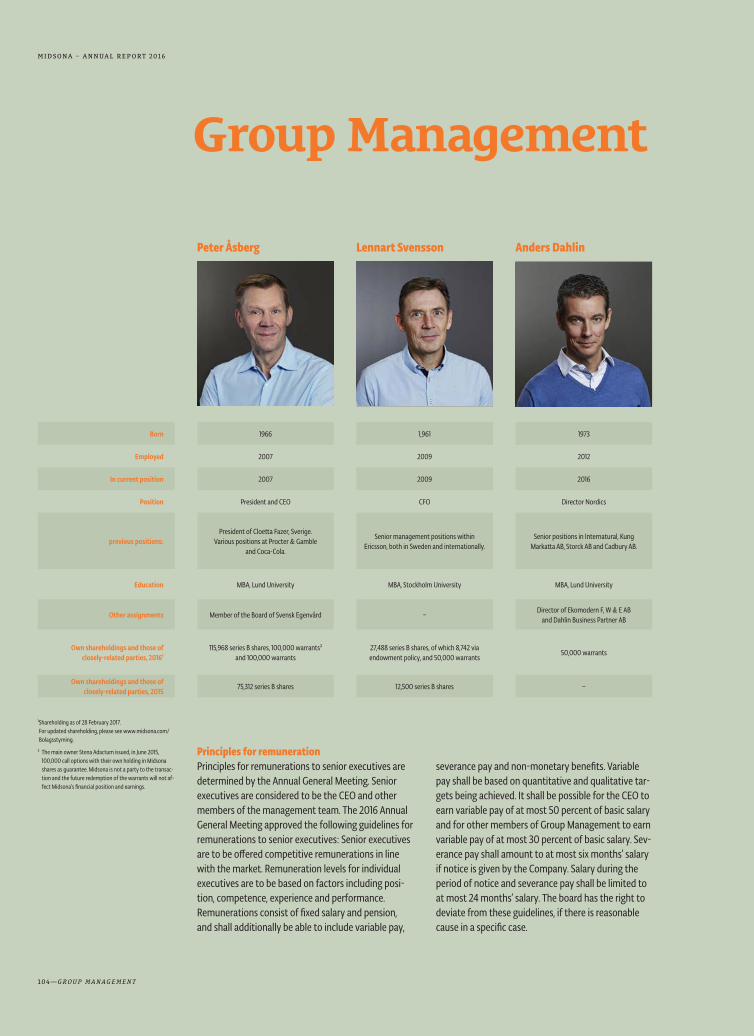
Group Management
Born 1966 1,961 1973
Employed 2007 2009 2012
In current position 2007 2009 2016
Position President and CEO CFO Director Nordics
previous positions:President of Cloetta Fazer, Sverige.
Various positions at Procter & Gamble and Coca-Cola.
Senior management positions within Ericsson, both in Sweden and internationally.
Senior positions in Internatural, Kung Markatta AB, Storck AB and Cadbury AB.
Education MBA, Lund University MBA, Stockholm University MBA, Lund University
Other assignments Member of the Board of Svensk Egenvård –Director of Ekomodern F, W & E AB
and Dahlin Business Partner AB
Own shareholdings and those of closely-related parties, 2016¹
115,968 series B shares, 100,000 warrants² and 100,000 warrants
27,488 series B shares, of which 8,742 via endowment policy, and 50,000 warrants
50,000 warrants
Own shareholdings and those of closely-related parties, 2015
75,312 series B shares 12,500 series B shares –
Peter Åsberg Lennart Svensson Anders Dahlin
¹ Shareholding as of 28 February 2017. For updated shareholding, please see www.midsona.com/Bolagsstyrning.
² The main owner Stena Adactum issued, in June 2015, 100,000 call options with their own holding in Midsona shares as guarantee. Midsona is not a party to the transac-tion and the future redemption of the warrants will not af-fect Midsona’s financial position and earnings.
Principles for remunerationPrinciples for remunerations to senior executives are determined by the Annual General Meeting. Senior executives are considered to be the CEO and other members of the management team. The 2016 Annual General Meeting approved the following guidelines for remunerations to senior executives: Senior executives are to be offered competitive remunerations in line with the market. Remuneration levels for individual executives are to be based on factors including posi-tion, competence, experience and performance. Remunerations consist of fixed salary and pension, and shall additionally be able to include variable pay,
severance pay and non-monetary benefits. Variable pay shall be based on quantitative and qualitative tar-gets being achieved. It shall be possible for the CEO to earn variable pay of at most 50 percent of basic salary and for other members of Group Management to earn variable pay of at most 30 percent of basic salary. Sev-erance pay shall amount to at most six months’ salary if notice is given by the Company. Salary during the period of notice and severance pay shall be limited to at most 24 months’ salary. The board has the right to deviate from these guidelines, if there is reasonable cause in a specific case.
M I DSONA – ANNUAL REPORT 2016
104—Group mAnAGement

1966 1971 1953 1973
2008 2011 2002 2016
2008 2015 2015 2016
Business Area Manager Norway Business Area Manager Finland Business Area Manager Denmark Business Area Manager Sweden
Executive Vice President of Kompett ASA and Boehringer Ingelheim KS.
Senior positions in the Transmeri Group.Senior positions in Dandy A/S in Danmark
and internationally.
CEO Lager 157, Director of Marketing and Innovation for Lantmännen Cerealia and various positions at Procter & Gamble,
Wella and Unilever.
Bachelor of Science, London South Bank University
Master of Business Administration, Haaga-Helia University of Applied Sciences
Master of Business Administration, School of Business Aarhus
MBA, Gothenburg School of Economics
– – Owner of L Børresen Holding ApS –
50,000 warrants 2,100 series B shares and 40,000 warrants 18,750 series B shares and 50,000 warrants 50,000 warrants
– – 12,500 series B shares –
Vidar Eskelund Markku Janhunen Lars Børresen Ulrika Palm
For the 2016 financial year, variable remuneration of SEK 638 thousand was paid to the CEO, of which SEK 420 thousand was allocated to pension benefits. Variable salary accounted for 20 percent of base salary for the CEO. For the other members of Group Management, variable salary accounted for 22 percent of base salary.
The Board’s proposed guidelines for remuneration to senior executives for the Annual General Meeting 2017 are consistent in all material respects with the previous guide-lines adopted by the Annual General Meeting in 2016, except for a clarification introduced to the effect that the guidelines are not legally applicable to incentive pro-grammes adopted pursuant to Chapter 16. Companies Act.
Remuneration and other benefits to Group Management, 2016
Group Management (seven individuals) 1 SEK thousandBasic salary 12,063Variable Remuneration 2,194Other benefits 553Pension expenses 2,422Total 17,232
¹ Group Management comprises those who, together with the CEO Peter Åsberg, were included in Group Management during all or part of the year. These people consist of Lennart Svensson, Lars Børresen, Vidar Eskelund, Markku Janhunen, Ulrika Palm (from March 29) and Anders Dah-lin (September 1). For more information on remunerations and other benefits to Group Mana-gement, see Note 9 Employees, personnel expenses and senior executives’ remunerations, page 74.
M I DSONA – ANNUAL REPORT 2016
Group mAnAGement—105

Five-year summary
Excerpts from income statementsSEK million 2016 2015 2014 2013 2012Net sales 1,744 1,174 920 916 869Expenses for goods sold –1,127 –699 –499 –495 –474Gross profit 617 475 421 421 395Selling expenses –377 –323 –271 –278 –272Administrative expenses –149 –103 –87 –79 –78Other operating income 5 9 6 4 10Other operating expenses –14 –10 –2 –4 –8Operating profit/loss 82 48 67 64 47Financial income 1 1 1 1 0Financial expenses –25 –10 –9 –12 –16Profit before tax 58 39 59 53 31Tax –13 27 4 –2 19Loss for the year 45 66 63 51 50
Depreciation and amortisationDepreciation/amortisation and impairment included in operating income 25 19 14 14 12EBITDA 107 67 81 78 59
Non-recurring itemsNon-recurring items included in operating income 27 20 –3 0 –7Operating profit before non-recurring items 109 68 64 64 40
Non-recurring items and amortisation, depreciation and impairment
Non-recurring items and amortisation, depreciation and impairment included in operating income
52 39 11 14 5
EBITDA, before non-recurring items 134 87 78 78 52
Excerpts from balance sheetsSEK million 31 December 2016 31 December 2015 31 December 2014 31 December 2013 31 December 2012Intangible fixed assets 1,940 1,067 875 846 855Other fixed assets 139 128 57 52 57Inventories 244 151 100 95 97Other current assets 232 148 117 117 132Cash and cash equivalents 65 61 50 62 43Total assets 2,620 1,555 1,199 1,172 1,184Shareholders’ equity 1,349 877 751 710 686Non-current interest-bearing liabilities 696 250 148 149 212Other non-current liabilities 211 135 84 94 90Current interest-bearing liabilities 31 69 53 43 9Other current liabilities 333 224 163 176 187Total shareholders’ equity and liabilities 2,620 1,555 1,199 1,172 1,184
Excerpts from cash flow statementsSEK million 2016 2015 2014 2013 2012Cash flow from operating activities before changes in working capital 103 64 73 67 50Changes in working capital –34 23 –17 21 –2Cash flow from current operations 69 87 56 88 48Cash flow from investing activities –848 –254 –54 –29 –4Cash flow after investing activities –779 –167 2 59 44Cash flow from financing activities 778 183 –14 –35 –43Cash flow for the year –1 16 –12 24 1Cash and equivalents at beginning of year 61 50 62 43 42Exchange-rate difference in cash and cash equivalents 5 –5 0 –5 0Cash and equivalents at end of year 65 61 50 62 43
M I DSONA – ANNUAL REPORT 2016
106—Five -yeAr summAry

Key figures ¹2016 2015 2014 2013 2012
Income and expenseNet sales growth % 48.6 27.6 0.4 5.4 -15.6Selling expenses/net sales % 21.6 27.5 29.5 30.3 31.3Administrative expenses/net sales % 8.5 8.8 9.5 8.6 9.0
MarginGross margin % 35.4 40.5 45.8 46.0 45.5EBITDA margin % 6.1 5.7 8.8 8.5 6.8Operating margin % 4.7 4.1 7.3 7.0 5.4Profit margin % 3.3 3.3 6.4 5.8 3.6
CapitalAverage capital employed SEK million 1,636 1,074 927 905 913Return on capital employed % 5.1 4.6 7.3 7.2 5.2Return on shareholders’ equity % 4.0 8.1 8.6 7.3 7.5Equity ratio % 51.5 56.4 62.6 60.6 57.9
LiquidityNet debt SEK million 662 258 151 130 178Net debt/EBITDA multiple 6.2 3.9 1.9 1.7 3.0Net debt/equity ratio multiple 0.5 0.3 0.2 0.2 0.3Interest coverage ratio multiple 3.3 4.9 7.6 5.4 2.9
employeesAverage number of employees number 308 220 154 156 135Number of employees at end of year number 322 294 167 157 143
Shares and market capitalisationAverage number of shares during the year thousand 31,547 24,419 22,745 22,745 22,745Number of shares at end of year thousand 42,646 28,431 22,745 22,745 22,745Market capitalisation SEK million 1,876 938 705 660 305
Per share dataProfit attributable to Parent Company shareholders SEK 1.42 2.71 2.75 2.24 2.20Shareholders’ equity SEK 31.63 30.85 33.02 31.22 30.16Cash flow from current operations SEK 2.19 3.56 2.46 3.87 2.11Share price on balance sheet date (series B shares) SEK 44.00 33.00 31.00 29.00 13.40Dividend ² SEK 1.10 1.10 1.10 1.00 0.50Yield % 2.5 3.3 3.5 3.4 3.7Pay-out ratio % 104.5 47.2 40.0 44.6 22.7P/E ratio multiple 30.9 12.2 11.3 12.9 6.1
¹ Midsona presents certain financial measures in the Annual Report that are not defined under IFRS. For definitions and reconciliations to IFRS, see page 108–109.2 Dividend for 2016 relates to the proposal by the Board of Directors.
M I DSONA – ANNUAL REPORT 2016
Five -yeAr summAry—107

Midsona presents certain financial measures in the Year-end report that are not defined under IFRS. Midsona considers these measures to provide useful supplemental information to investors and the Company’s manage-ment as they facilitate the evaluation of the Company’s performance. Because not all companies calculate financial measures in the same way, these are not always comparable to the measures used by other compa-nies. Accordingly, these financial measures should not be considered a substitute for measurements as defined under IFRS. The table below presents measures not defined under IFRS, unless otherwise stated. The purpose of each measure is presented in italics.
Return on Equity Profit for the year in relation to average shareholders’ equity. For assessing the Company’s ability to reach an industry-rate rea-sonable level of return on the total capital of the owners made available.Return on capital employed Profit before tax plus financial expenses in relation to average capital employed. For assessing the Company’s ability to reach an industry-rate reasonable level of return on the total capital of the owners and lenders made available.Gross margin Gross profit in relation to net sales. Relevant for assessing the company’s ability to reach an industry-rate level of profitability.Market capitalisation Number of shares at year-end multiplied by the price quoted for class B share on the balance sheet date. To assess The Company’s market value. Dividend yield Distribution relative to the series B share at the balance sheet date. Yield is one central financial measure for determining the share of earnings for the year that the Company distributes to its shareholders. EBITDA Operating income before depreciation and depreciation of tangi-ble assets and amortisation of intangible assets. EBITDA is a key perfor-mance measure for assessing the earnings trend of the Company over time.EBITDA margin EBITDA in relation to net sales. The EBITDA margin is a key performance indicator for assessing the Company’s ability to reach an industry-based level of profitability.Shareholders’ Equity per share Shareholders’ equity divided by the num-ber of shares outstanding at the end of the year. Is a measurement that measures the Company’s net asset value per share and allows assessment if the Company increases shareholder wealth over time.Average number of shares Average number of shares outstanding during the year. Financial measure defined under IFRS.Customer credit period Accounts receivable adjusted for VAT in relation to net sales. Is a relevant measure to assess how quickly the Company gets paid by its customers.Net sales growth Net sales for the year less the preceding year’s net sales in relation to the preceding year’s net sales. Net sales growth is a key to determine whether the Company’s growth strategy and the fulfilment of one of the Company’s financial target of an average growth of at least 10 percent of the time met.
Net liabilities Interest-bearing provisions and liabilities at the end of the year less cash and equivalents. Net debt is a measure that the Company regards as relevant to creditors and credit rating agencies.Net debt/EBITDA Net debt in relation to operating profit before amorti-sation/depreciation and impairment of tangible and intangible fixed assets. Net debt/EBITDA is a figure that Midsona regards as relevant to investors who want to assess the Company’s opportunities to implement strategic investments, to meet its financial obligations, and to meet one of its financial targets of net debt/EBITDA being maintained at a multiple of less than 2.Net liabilities/equity ratio Net debt in relation to shareholders’ equity. Net debt/equity ratio is a key figure for assessing a company’s capital structure.Organic change Year-on-year comparison figures, adjusted for translation effects on consolidation and changes in structure. Organic change is a key to determine whether the Company’s growth strategy is met, adjusted for currency effects on consolidation as well as acquisitions and divestitures.P/E ratio Share price on the balance sheet date in relation to earnings per share. Is a key figure that is considered relevant to assess whether the com-pany’s stock is worth buying or not. Non-recurring items Such as restructuring and impact of acquisitions. This is a measure of operating items not normally included in the Compa-ny’s operating activities. Relevant for assessing the company’s operating profit growth eliminated for those non-recurring operating items.Earnings per share Profit for the year in relation to the average number of shares. Financial measure defined under IFRS.Interest coverage ratio Profit before tax plus interest expenses in relation to interest expenses. Interest coverage is relevant for assessing the Compa-ny’s ability to execute strategic investments and assess the Company’s ability to meet its financial commitments.Working capital Non-interest-bearing current assets less non-current non-interest-bearing liabilities. Working capital is a key performance indi-cator for assessing the company’s ability to meet short-term capital.Operating margin Operating profit in relation to net sales. Operating margin is relevant for assessing the company’s ability to reach a level of profitability by segment as well as one of the company’s financial goal of an operating margin in excess of 10 percent is met.Equity/assets ratio Shareholders’ equity at the end of the year in relation to total assets. The equity/assets ratio shows the proportion of the balance sheet total represented by shareholders’ equity and has been included to gain a view of the company’s capital structure. Capital employed Total assets less non-interest-bearing liabilities and deferred tax liabilities. Capital employed is a measure of the total capital that the company borrows from its shareholders, who usually receive com-pensation in the form of dividends, or that it borrows from credit institu-tions, who receive compensation in the form of interest.
Definitions
M I DSONA – ANNUAL REPORT 2016
108—deFinit ions

Pay-out ratio Proposed/approved dividend in relation to net income. Pay-out ratio is relevant for assessing whether the Company meets one of its financial objectives of having a long-term pay-out ratio exceeding 30 percent.
Profit margin Profit before tax in relation to net sales. Profit margin is relevant for assessing the Company’s ability to reach an industry-based level of profitability.
Reconciliation to IFRSEBITDAOperating profit before amortisation/depreciation and impairment of tangible and intangible fixed assets. ¹
SEK million 2016 2015Operating loss 82 48Amortisation of intangible assets 16 13Depreciation of tangible fixed assets 9 6EBITDA 107 67Non-recurring items² 27 20EBITDA, before non-recurring items 134 87
¹ There were no impairments on tangible fixed assets and intangible fixed assets included in operating income for each period.
² Specification of non-recurring items
SEK million 2016 2015Restructuring costs 20 18Reversal of purchase consideration for previous years’ acquisitions recognised as a liability – –4Acquisition-related costs 7 6
Total 27 20
Net liabilitiesInterest-bearing provisions and interest-bearing liabilities less cash and cash equivalents, including short-term investments.
SEK million 31 December 2016 31 December 2015Non-current interest-bearing liabilities 696 250Current interest-bearing liabilities 31 69Cash and equivalents¹ –65 –61Net liabilities 662 258
¹ There were no short-term investments equivalent to cash and cash equivalents at the end of the respective period.
Capital employedTotal shareholders’ equity and liabilities less non-interest-bearing liabilities and deferred tax liabilities.
SEK million 31 December 2016 31 December 2015Equity and liabilities 2,620 1,555Other non-current liabilities –4 –Deferred tax liabilities –207 –135Accounts payable –212 –132Other current liabilities –38 –31Accrued expenses and deferred income –83 –61Capital employed 2,076 1,196
M I DSONA – ANNUAL REPORT 2016
deFinit ions—109

Glossary
Antioxidants Molecules that prevent oxidation. Antioxidants are believed to neutralise the action of free radicals in cells. Adequate absorption of antioxidants through food is considered to counteract cardiovascular dis-eases, premature aging and possibly even cancer. Antioxidants are found in fruits, berries and vegetables.Bars Foods where the most common variant consists of protein bars and weight control bars. They can be eaten as, for example, a snack or meal replacement.Ecological products Products grown without pesticides or chemical fertil-isers. Those seeking to sell products as ecological within the EU must com-ply with the EU regulations for ecological production.Gluten-free Products with a reduced gluten content, containing a maxi-mum of 20 mg of gluten per kg of product. GMP Good Manufacturing Practice. International standard for the produc-tion of pharmaceuticals. Nutritional supplements These are classified as foods and serve as sup-plements to normal foodstuffs. They may contain vitamins and minerals or other nutrients such as omega-3.Lactose-free Dairy products where the lactose has been removed.Licensed brands Other companys’ products that are marketed by Midsona.Food A substance or a product intended for use as a food or beverage. Food should preferably provide the body with essential energy and nutri-ents while also tasting good.Pharmaceutical According to the law, pharmaceuticals are all substances allegedly able to detect, prevent, treat or cure disease or disease symp-toms.
Medical technology products A medical technology product can be either a purely technical aid, such as a dosage device, or take the form of a capsule or tablet. They may not have a pharmacological, immunological or metabolic action in the body.Minerals The body comprises some 20 different minerals. They make up about 4 percent of bodyweight. Minerals are needed in small amounts but are vital because our bodies cannot produce them.Omega-3 A number of polyunsaturated and beneficial fatty acids are referred to as omega-3. They are essential fatty acids, meaning the body cannot produce them itself and must instead obtain them through diet. The longer polyunsaturated fatty acids EPA and DHA from fish and fish oil in particular have been found to have additional health-beneficial effects Shakes Ready-made drinks. These may be calorie-reduced and used for weight control or contain a higher protein content and designed to drink after exercise.Smoothie A smoothie is a cold and usually sweet beverage, ready to drink, which consists of frozen or fresh fruit or vegetables. It is also common to add superfoods. A smoothie might also have a reduced calorie content and be used for weight control for example.Sports nutrition Nutritional and dietary supplements that cater to ath-letes. Superfoods Foods containing a high concentration of essential and health-benefiting substances. Vitamins Vitamins are organic substances. Their effect and appearance varies. Common to all of them is that they must be supplied from outside the body. Vitamins are needed in very small amounts but are vital because our bodies cannot produce them. Deficiencies may lead cause disease.
Sales channels
Pharmaceutical retail Parties conducting retail trade of medicines and other special pharmaceutical preparations through shops and those con-ducting wholesale operations specialised in sales to parties conducting retail trade of medicines and other special pharmaceutical preparations.FMCG retail sector Parties conducting retail trade of a wide range of household products through shops. The term refers to hypermarkets, supermarkets, discount shops, after-hours supermarkets and convenience stores.Online retail Parties that primarily sell to consumers via the Internet, through webshops or portals from which end consumers can have the ordered items delivered to their homes or other designated locations. Par-ties that primarily sell to consumers via the Internet, through webshops or portals from which end consumers can have the ordered items delivered to their homes or other designated locations. This channel also includes
Midsona’s own online shops/websites where sales are made directly to consumers, and post-order sales, which are also made directly to consum-ers.Healthfood retailers Retailers specialised in health and personal care, mainly through shops and those conducting wholesale operations special-ised in sales to retailers specialised in health and personal care.Other specialist retailers Other retailers, conducting sales mainly through shops. This channel includes sports and leisure shops, health clubs, per-fume shops, baby shops, clothing shops and bakeries.Other sales channels Those who trade in ways other than those that can be classified under the other sales channels. This channel includes catering (hotels, restaurants, workplace canteens), therapists and contract manu-facturing.
M I DSONA – ANNUAL REPORT 2016
110—deFinit ions

A growing marketMidsona operates in a growing market where growth is driven by consumers’ increasing interest in their own health and well-being. Midsona holds a very strong position in organic health products, an area that is growing more than the overall market.
A leading positionMidsona holds a leading position in most of its sales channels, making Midsona a preferred supplier and generating economies of scale. In 2016, Midsona strengthened its position in several channels, simultaneously establishing strong new positions in the Nordic market.
Strong brandsMidsona’s strategy builds on strong brands that are continuously developed and supplemented through acquisi-tions and alliances. Eight brands are particularly in focus. The acquisitions of Urtekram and Internatural comple-ment the Midsona range with strong brands, niched towards to organic health products and food.
Clear and aggressive targetsMidsona has a clear mission and vision, aggressive growth targets, clear strategies and the financial and organisa-tional capacity to implement its plans.
Active in the consolidation of the marketMidsona is participating actively to consolidate the market for products in health and well-being, primarily in the Nordic countries. Over the past five years, Midsona has acquired a number of companies, with the acquisition of Urtekram of Denmark in 2016 being the largest, with sales of approximately SEK 640 million prior to the acquisition.
Why Midsona’s shares are attractive
M I DSONA – ANNUAL REPORT 2016
Why midsonA’s shAres Are At trActive—111


Denna rapport finns även på svenska at www.midsona.com från cirka April 21, 2017.
The English version is a translation from Swedish. In case of discrepancy, the Swedish version shall prevail.
The Annual Report is available in English and Swedish ver-sions. In case of any discrepancies between the Swedish and English versions, the Swedish version is considered the official version. This Annual Report was published on the Company’s website (www.midsona.com) on 5 April 2017. Printed copies are sent to shareholders and other stakehol-ders on request. The Directors’ Report is given on pages 52-55. The financial accounts are given on pages 56-91 and have been prepared in accordance with IFRS. All figures are expressed in millions of Swedish kronor (SEK million) unless otherwise stated. Figures in parentheses refer to the prece-ding financial year, unless otherwise stated. Market infor-mation is based on Midsona’s own assessment if no other source is given. Assessments are based on the best available evidence.
This report contains forward-looking statements. Although Midsona’s management believes this information is reaso-nable, no assurance can be given that these expectations will prove correct. Actual future outcomes may vary from those indicated in the forward-looking information due, among other things, to changes in economic, market and competitive conditions, changes in the regulatory environ-ment and other political measures, fluctuations in exchange rates and other factors.
Midsona AB in partnership with Aspekta and Giv Akt.
Printing: Exakta, Malmo 2017.
Photo: Åsa Siller, Shutterstock, Caroline Tengen, Moment Photography, Midsona.
Midsona AB is a Swedish public company. The Company is incorporated and registered under Swedish law with the company name Midsona AB (publ), corporate identity num-ber 556241-5322. The Company is based in Malmö, Sweden. In all instances, the terms “Midsona”, “Group” and “the Com-pany” refer to the Parent Company, Midsona AB (publ) and its subsidiaries.

MidsonaAlways on the way
3 The year in brief
4 This is the image of strong brands
6 A journey. A team.
8 This is Midsona
9 Financial targets
11 A word from the CEO
14 Together towards the objective of becoming the Nordic leader
16 Midsona’s business model
19 Trends and external development
24 Leading brands are the foundation
28 High innovation creates advantages
30 Systematic and proactive sales
33 Careful quality work
34 Business areas
36 Targeted sustainability
40 A healthy and sustainable culture
48 Shares and shareholders
52 Administration report
56 Financial statements
62 Notes to the financial statements
91 Board of Directors’ statement of assurance
92 Audit report
95 A word from the Chairman of the Board
96 Corporate Governance Report
102 Board of Directors
104 Group Management
106 Five-year overview
108 Definitions
111 Why Midsona’s shares are attractive
MID
SONA 2016
Information about the Annual General MeetingThe Annual General Meeting of Midsona AB (publ) will be held on 26 April 2017 at 3.00 p.m. at Malmö Börshus, Skeppsbron 2, Malmö, Sweden. Registration of voting rights will commence at 2.00 p.m. Before the meeting, the Company will offer light refreshments.
Right to participateTo be entitled to participate in the Annual General Meeting, shareholders must be included in the share register maintained by Euroclear Sweden AB no later than 20 April 2017, and shall have registered their intention to participate by 20 April 2017 at 4.00 p.m. at the latest.
Shareholders whose shares are nominee registered must temporarily re-register the shares in their own name at Euroclear Sweden AB in order to be permitted to participate in the meeting. Such registration must be completed by 20 April 2017 at the latest and should be requested of the nominee in good time before this date.
Notification of participationNotification can be submitted in writing to Midsona AB, c/o Fredersen Advokatbyrå AB, Turning Torso, 211 15 Malmö, by email to: [email protected] should include the name, address, personal or corpo-rate identity number, daytime phone number of the participant and, if applicable, the number of assistants (maximum two). Admission cards will be distributed a few days before the meet-ing and shall be presented at the entrance to the meeting.
DividendThe Board has decided to propose to the Annual General Meeting that a dividend of SEK 1.10 per share be paid for the 2016 financial year.
Midsona Sverige ABwww.midsona.se
Dockplatsen 16Postal address: Box 50577SE-202 15 Malmö Tel: +46 40 660 20 40
Midsona Norge ASwww.midsona.no
Verkstedveien 1Postal address: PB 144 SkoyenNO-0212 Oslo, Norway Tel: +47 24 11 01 00
Midsona Finland Oywww.midsona.fi
Perintötie 2 C 4 KRSFI-01510 VantaaTel: +358 20 743 47 55
Midsona Denmark A/Swww.urtekram.dk
Klostermarken 20DK-9550 Mariager, DenmarkTel: +45 9854 2288
Midsona AB (publ)www.midsona.com
Dockplatsen 16Postal address: Box 21009SE-200 21 Malmö Tel: +46 40 601 82 00 [email protected]
Contents
A N N U A L R E P O R T 2 0 1 6